Article

Enhancing the Resilience of the Environment—Economy—Society Composite System in the Upper Yellow River from the Perspective of Configuration Analysis

1
School of Water Conservancy and Transportation, Zhengzhou University, Zhengzhou 450001, China
2
Yellow River Institute of Hydraulic Research, YRCC, Zhengzhou 450003, China
3
Key Laboratory of Lower Yellow River Channel and Estuary Regulation, MWR, Zhengzhou 450003, China
4
College of Management and Economics, Tianjin University, Tianjin 300072, China
*
Authors to whom correspondence should be addressed.
Sustainability 2025, 17(19), 8719; https://doi.org/10.3390/su17198719 (registering DOI)
Submission received: 8 September 2025 / Revised: 25 September 2025 / Accepted: 26 September 2025 / Published: 28 September 2025
(This article belongs to the Special Issue Advances in Management of Hydrology, Water Resources and Ecosystem)

Abstract

Evaluating and enhancing system resilience is essential to strengthen the regional ability to external shocks and promote the synergistic development of environment, economy and society. Taking the Upper Yellow River (UYR) as an example, this paper constructed a resilience evaluation index system for the environment—economy—society (EES) composite system. A three-dimensional space vector model was built to calculate the resilience development index (RDI) of three subsystems and the composite system from 2009 to 2022. Pathways supporting high resilience levels of the composite system were examined using the fuzzy-set qualitative comparative analysis (fsQCA) method from a configuration perspective. The results revealed that (1) the RDI of three subsystems and the composite system in the UYR showed an increasing trend; relatively, the environment and economy subsystems were lower, and their RDI fluctuated between 0.01 and 0.06 for most cities. (2) The emergence of high resilience is not absolutely dominated by a single factor, but rather the interaction of multiple factors. To achieve high resilience levels, all the cities must prioritize both environmental protection and economic structure as core strategic pillars. The difference is that eastern cities need to further consider social development and life quality, while western cities need to consider social development, life quality, and social security. Other cities including Lanzhou, Baiyin, Tianshui, and Ordos should focus on social construction and social security. Exploring the interactive relationship between various influencing factors of the resilience of the composite system from a configuration perspective has to some extent promoted the transformation from a single contingency perspective to a holistic and multi-dimensional perspective. These findings provide policy recommendations for achieving sustainable development in the UYR and other ecologically fragile areas around the world.

1. Introduction

The rapid development of the global economy and society has brought tremendous economic growth and improved living standards, but it has also put enormous pressure on the environment. Overgrazing, fossil fuel use, deforestation, and other activities have caused several environmental issues like water pollution, ecological degradation, and loss of forest biodiversity [1]. The intensification of global climate change in recent years has resulted in rising temperatures and frequent extreme weather events, further exacerbating environmental problems [2,3]. Due to differences in resilience, different regions have varying adaptability to these impacts. Regions with strong resilience have a strong ability to adapt and adjust to damage, while ecological and environmental issues are not particularly prominent. Regions with weak resilience have weak adaptability and adjustment capabilities, resulting in more severe ecological and environmental problems [4]. The Upper Yellow River (UYR) serves as a critical water resource reserve within the Yellow River Basin, yet its location in semi-arid and arid climate regions classifies it as an ecologically fragile area. Multiple ecological and environmental issues such as land desertification, water pollution, ecological sensitivity and fragility, and water scarcity are intertwined, posing great challenges for the local area to achieve sustainable development [5]. In 2023, the soil erosion area in the five provinces (regions) of the UYR was 518,900 square kilometers, accounting for 65.3% of the total soil erosion area in the basin. This has had a negative impact on the effective functioning of the regional ecological barrier. Moreover, due to the fragile ecological foundation, the ecological quality index of Gansu, Ningxia, and Qinghai is still lower than the national average level (59.95). In 2019, the strategic integration of ecological protection and high-quality development in the Yellow River Basin was formalized as a national priority. This was required to implement ecological environment protection and restoration projects to achieve more resilient and sustainable development. Thus, it is imperative to thoroughly investigate the system resilience and underlying drivers of the environment–economy–society (EES) composite system, and enhance the resilience level of the UYR.
The concept of resilience originated from physics; it refers to actively adjusting elements, optimizing structure, and shaping environment to enable the system to possess characteristics of resilience, such as resistance, restoration, and adaptability, when facing extreme risk shocks [6]. With the integration of multiple disciplines, the concept of resilience has gradually expanded to fields like ecology, education, psychology, sociology, etc. It has recently attracted considerable attention and seen widespread implementation in research domains spanning sustainable urban development and urban planning strategies [7,8]. Relative research involves economic development system resilience, water resources system resilience, urban system resilience, ecosystem resilience, and social ecosystem resilience [9,10]. Qualitative methods have been widely used to evaluate the resilience level of a composite system. They yield a comprehensive resilience index according to expert opinions on a set of questions or indicators. To ensure an objective and transparent assessment of system resilience, quantitative evaluation methods have been developed. The resilience triangle model, time-varying resilience model, simulation method, coupling degree model, coupling coordination degree model, comprehensive index method, entropy weight method, entropy weight-TOPSIS method have been widely applied [11,12,13,14]. The three-dimensional space vector model, an extension of the two-dimensional point, line, and surface vector models in three-dimensional space, is able to present complex three-dimensional spatial data in an intuitive and understandable way. Numerous applications in environmental management, civil engineering, urban landscape design, geological hazards, virtual reality, and system resilience have proven that this method can comprehensively and accurately reflect the multidimensional characteristics and dynamic changes of a composite system when assessing the resilience of a composite system, and the RDI is obtained by finding the optimal development paths [15,16].
Determining the key drivers that influence system resilience is essential for enhancing the resilience level of a composite system. As the most widely used methods, correlation analysis, multivariate linear regression, geographically weighted regression model, spatial Durbin model, and other regression-based methods have been employed to determine the relationship among variables by building a linear or nonlinear model to describe the relationship between them to determine the key factors [17,18]. These methods have the advantage of simplicity and efficiency. In order to further explore potential influencing factors and their interrelationships, complex modeling methods such as the geographic detector model, the obstacle degree model, system dynamics, structural equation model, logarithmic mean divisia index (LMDI model), projection pursuit model, etc. have been applied [19,20,21,22,23]. These models construct relationship models containing multiple potential influencing factors to reveal the existence and mode of action of factors. In addition, some specific analytical frameworks or models, such as the DEMATEL model, ISM model, hierarchical analysis, factor analysis, and fuzzy comprehensive evaluation, have also been applied [24,25]. Recently, with the accelerated evolution of artificial intelligence technology, neural networks, random forests, support vector machines, cluster analysis as well as other machine learning-like methods have been introduced [26,27]. Such methods systematically analyze historical and real-time data by means of intelligent algorithms to mine key features or patterns related to system resilience and identify the main factors affecting system resilience.
The environment–economy–society (EES) composite system is comprised of three subsystems, namely, the environment, the economy, and society, and its development is influenced by factors of the three subsystems. The factors interact with each other in the course of improving the system resilience. However, most existing research is limited in analyzing the factor dependence issues, and it is difficult to elucidate complex causal relationships such as multiple concurrent and equivalent dependencies among independent variables. Explaining the phenomenon of factor dependence requires to be understood and analyzed holistically from a configuration perspective [28]. The fundamental advantage of the configuration perspective compared with the general perspective and the contingency perspective lies in its multidimensional and holistic characteristics, emphasizing the organizational structure of the research object and interactive relationship between the organization and the environment. The fuzzy-set qualitative comparative analysis (fsQCA) method based on the configuration perspective can help answer questions with complex causal relationships [29].
This paper constructed a resilience assessment framework for the EES in the UYR. The three-dimensional space vector model was applied to assess the system resilience, and the configuration analysis method was employed to identify paths that generate high resilience levels of the composite system. There are two main innovations in this paper: (1) The three-dimensional space vector model was used to measure the multi-dimensional characteristics and dynamic changes of the system resilience, and (2) the combined factorial effects on the system resilience were explored using the fsQCA method, and the potential paths for improving the system resilience from a configuration perspective. This makes up the unforeseen interaction and combined effects of multiple factors, which provide scientific support for the resilience enhancement of the EES composite system.

2. Materials and Methods

2.1. Study Area

The Upper Yellow River (UYR) serves as a critical water resource reserve in China. It boasts a drainage area spanning approximately 4.28 × 10⁶ km2, constituting roughly 54% of the Yellow River’s entire catchment territory (7.95 × 10⁶ km2) [30]. Drawing on existing research findings, this paper defined Qinghai Province, Gansu Province, the Ningxia Hui Autonomous Region, and the west of the Hohhot metropolitan area in Inner Mongolia (two provinces and two regions) as the study area. There are 21 prefecture-level cities including Xining (XN) and Haidong (HD) in Qinghai Province; Yinchuan (YC), Shizuishan (SZ), Wuzhong (WZ), Zhongwei (ZW), and Guyuan (GY) in the Ningxia Hui Autonomous Region; Lanzhou (LZ), Baiyin (BY), Tianshui (TS), Wuwei (WW), Pingliang (PL), Qingyang (QY), Dingxi (DX), and Longnan (LN) in Gansu Province; and Hohhot (HH), Baotou (BT), Ordos (OD), Wuhai (WH), Bayannur (BN), and Ulanqab (UQ) in the Inner Mongolia Autonomous Region. The location of the UYR is shown in Figure 1.

2.2. Research Methods

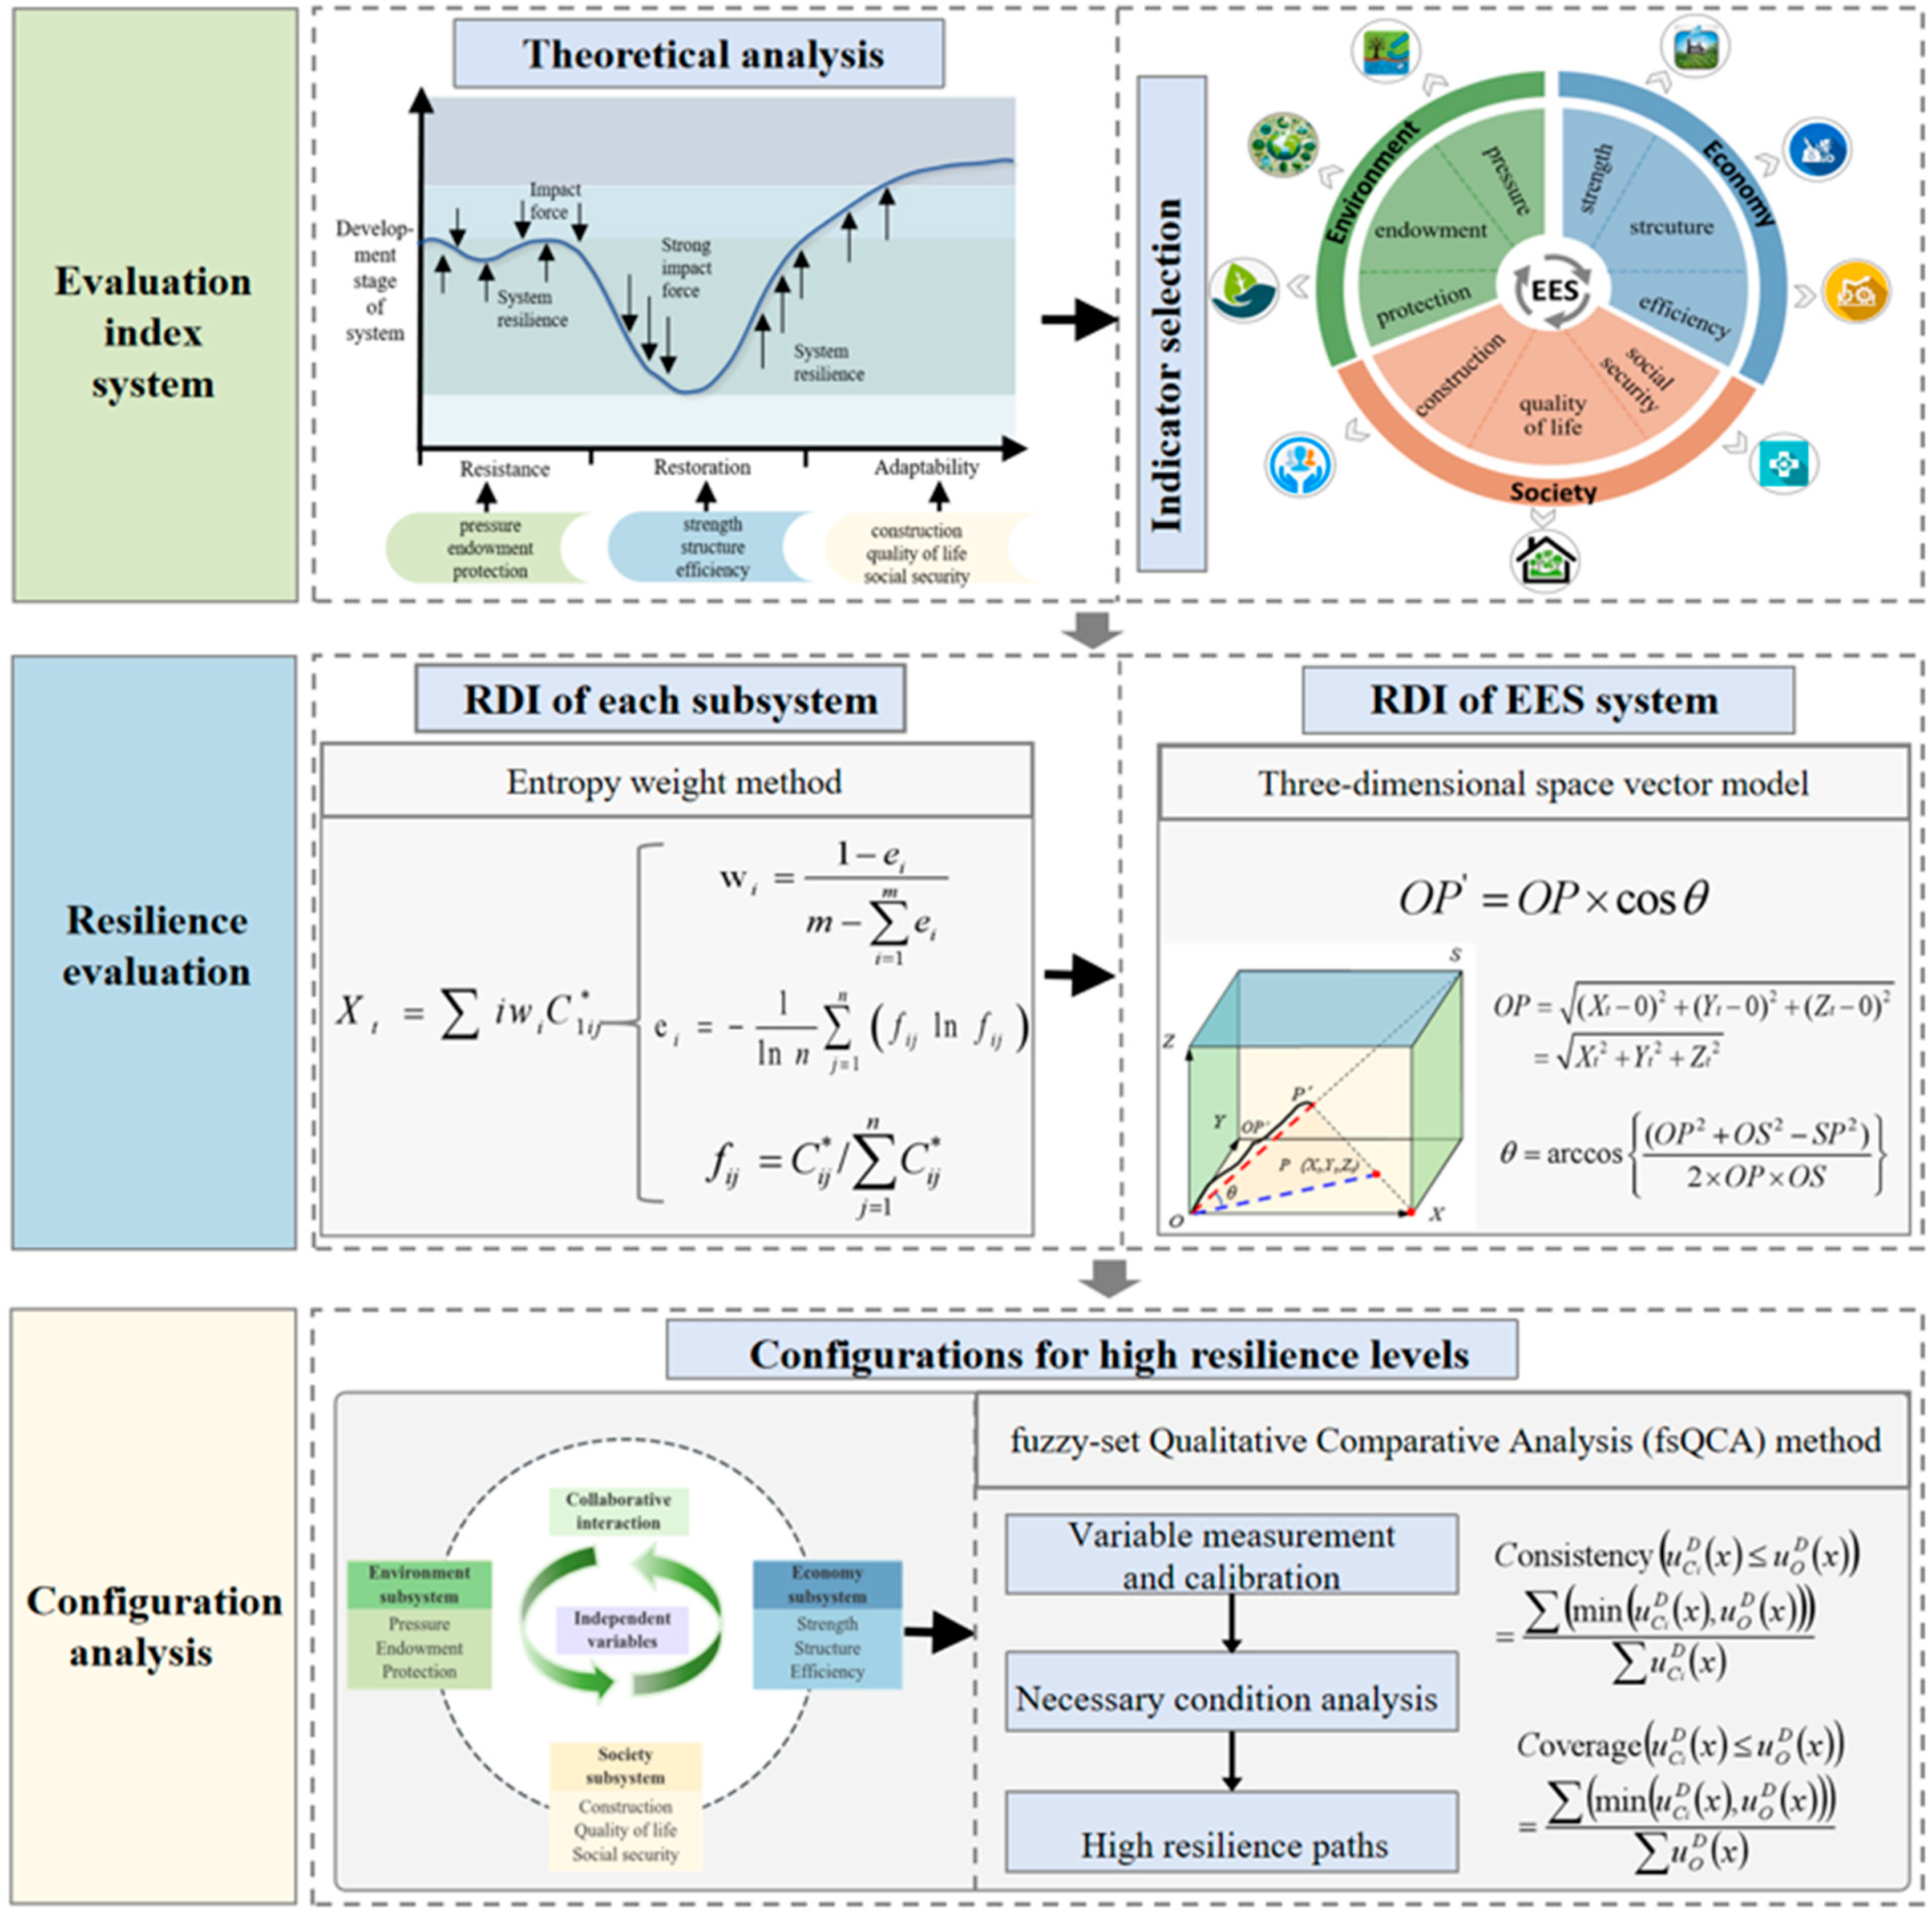
The methodological framework is shown in Figure 2. There are three key parts: (1) on the basis of resilience theory, an evaluation index system was established considering the inherent features of resilience, encompassing resistance, restoration, and adaptability; (2) the entropy weight approach was used to quantify the weights of evaluation indicators, and the three-dimensional space vector model was constructed to measure the RDI of each subsystem and composite system; (3) drawing upon the concepts of configuration theory, the fuzzy-set qualitative comparative analysis (fsQCA) method was applied to identify the paths that generate high resilience levels.

2.2.1. Evaluation Index System

The resilience of the EES composite system refers to the resistance exhibited after being disturbed by multiple internal and external factors; the capability to restore to its original state and get used to changes. Drawing on previous investigations into the resilience of the composite system, ecological system, water resources system, and urban areas within the Yellow River Basin [31,32], we selected 32 indicators to formulate a three-layer evaluation index system, as presented in Table 1. Environment subsystem resilience mainly refers to the resistance it exhibits when the ecological environment is affected by external interference. Its influencing factors include environmental pressure, environmental endowment, environmental protection, etc. Economy subsystem resilience mainly refers to the economic conditions that should be possessed in the process of governing and restoring the environment after interference, which is a form of restoration. The influencing factors mainly include economic strength, economic structure, economic efficiency, etc. Society subsystem resilience mainly refers to the transformation of the environment by human activities, the degree of resource utilization, protection awareness, etc. It is more about the ability to adapt to changes, and the influencing factors include social construction, quality of life, social security, etc.
The data mostly came from the Water Resources Bulletin of two provinces and two regions in the UYR, the China Environmental Statistics Yearbook, and the Statistical Yearbook of each city. Some indirect indicators, such as industrial wastewater discharge, SO2 emissions and smoke (dust) emissions per unit of GDP, social insurance coverage, etc., were calculated from the raw data. To address the issue of missing data, linear interpolation was applied to augment the incomplete dataset.

2.2.2. Resilience Evaluation

(1) Estimate the indicator weights. By applying the entropy weight approach for determining the weights of indicators, an indicator with a larger weight value plays a more prominent role within the evaluation framework, whereas an indicator with a smaller weight value has a relatively less significant impact [33]. The full details of the steps are given below.
The normalization procedure for positive and negative indicators was implemented as follows:
C i j * = C i j C i min C i max C i min
C i j * = C i max C i j C i max C i min
where Cimax denotes the maximum value for indicator i, Cimin denotes the minimum value for indicator i, Cij serves as an evaluation index of the EES, and Cij* stands for the normalized value for Cij.
After that, the standardized data were utilized to construct the ensuing data relationship matrix, which was designated as C:
C = C i j * m × n = C 11 * C 12 * C 1 n * C 21 * C 22 * C 2 n * C m 1 * C m 2 * C m n *
where matrix C contains standardized indicator data. Specifically, m represents the total amount of evaluation indicators, and n denotes the quantity of years being examined.
Based on the indicator data relationship matrix C, the entropy value ei corresponding to the ith indicator was determined through the following calculation:
e i = 1 ln n j = 1 n f i j ln f i j
f i j = C i j * / j = 1 n C i j *
If fij = 0, then fijlnfij = 0. Subsequently, the weight wi corresponding to each evaluation indicator was determined through calculation:
w i = 1 e i m i = 1 m e i
(2) Measure resilience development index. Considering the three subsystems of the composite system, a three-dimensional space vector model of the EES in the UYR was constructed, as shown in Figure 3. The vector OS represents the optimal development trajectory of the system resilience. The resilience development trajectory vector OP of the environment, economy, and society subsystems cannot completely overlap with OS. Therefore, this paper defined the concepts of the development degree, coordination degree, and development index of composite system resilience. The sequential procedures for the calculation are delineated below.
Step 1: Resilience development index (RDI) of each subsystem
X t = i w i C 1 i j * Y t = i w i C 2 i j * Z t = i w i C 3 i j *
where Xt, Yt, Zt are resilience development indices for the environment, economy, and society subsystems, respectively. C1ij*, C2ij*, C3ij* are standardized indicator values for the resilience of the environment, economy, and society subsystems, respectively.
Step 2: Resilience development degree
O P = ( X t 0 ) 2 + ( Y t 0 ) 2 + ( Z t 0 ) 2 = X t 2 + Y t 2 + Z t 2
where OP represents the resilience development degree of the composite system.
Step 3: Resilience coordination degree
The resilience coordination degree refers to the fitting degree between the actual development trajectory OP and the optimal development trajectory OS of the composite system in the UYR, which is denoted by the deviation degree. The θ value is negatively correlated with the resilience coordination degree, that is, the greater the θ value, the worse the coordination of the development of the three subsystems.
θ = arccos ( O P 2 + O S 2 S P 2 ) 2 × O P × O S
Step 4: Resilience development index (RDI)
The RDI truly reflects the level of system resilience in the UYR. The actual length along the optimal development trajectory is identified as the system resilience’s development capability; it is the length of the vector OP′ in the diagram of the three-dimensional space vector model. The vector OP′ is positively correlated with the resilience level. A higher OP′ value signifies an improved resilience development level.
O P = O P × cos θ
Mathematically, the value of OP′ is essentially a weighted sum of the RDI of three subsystems. It has been proven to be highly correlated with the results of the coupling coordination degree model [34].

2.2.3. Configuration Analysis

The qualitative comparative analysis (QCA) method was first proposed by Ragin [35]. Considering the continuity of the actual data, the fuzzy-set qualitative comparative analysis (fsQCA) approach was formed by incorporating fuzzy-set theory into the QCA method. It can deal with the fuzziness and uncertainty between the factors of system resilience, effectively integrate multi-source information through the flexible setting of set affiliation, and reveal the nonlinear relationship and multiple concurrent paths between factors [36]. Furthermore, it can provide a set of systematic and explanatory resilience improvement path sets for decision-makers, and enhance the scientificity and operability of decision-making [37]. Under the configuration perspective, the impact of internal components of the EES on its resilience level is not independent. In this study, the fsQCA approach was employed to investigate the synergistic interplay among the internal components of the EES composite system in 21 prefecture-level cities in the UYR, and to find the configuration paths that generate high resilience levels.
(1)
Variable measurement
The RDI OP’ calculated by the three-dimensional space vector model of resilience was used as the outcome variable. From the perspective of the internal system, nine criterion layers of the evaluation index system were selected as independent variables. These were environmental pressure (EP), environmental endowment (EE), and environmental protection (EPR) in the environment subsystem; economic strength (ES), economic structure (EST), and economic efficiency (EEF) in the economy subsystem; and social construction (SC), quality of life (QL), and social security (SS) in the society subsystem.
(2)
Variable calibration
To conduct configuration analysis, it is necessary to convert continuous raw data and calibrate the antecedent conditions and outcome variables to fuzzy sets [38]. The most common settings for the anchor points are 0.05, 0.50, and 0.95 quantiles, with a 90% confidence interval [39]. For this study, it was found that there was a high clustering of the data. The difference would be very small using a small interval (such as the 0.25, 0.50, 0.75 quantiles), leading to the unavailability of the calibrated results. Therefore, we selected the 0.05, 0.50, and 0.95 quantiles, respectively, representing “completely not affiliated”, “intersection”, and “fully affiliated”. A higher degree of affiliation was correlated with the increased extent to which the sample cases aligned with the target set. When the degree of affiliation is low, it is non-high. The outcomes are presented in Table 2.

3. Results

3.1. Resilience Assessment of the EES Composite System

3.1.1. RDI of the Environment, Economy, and Society Subsystems

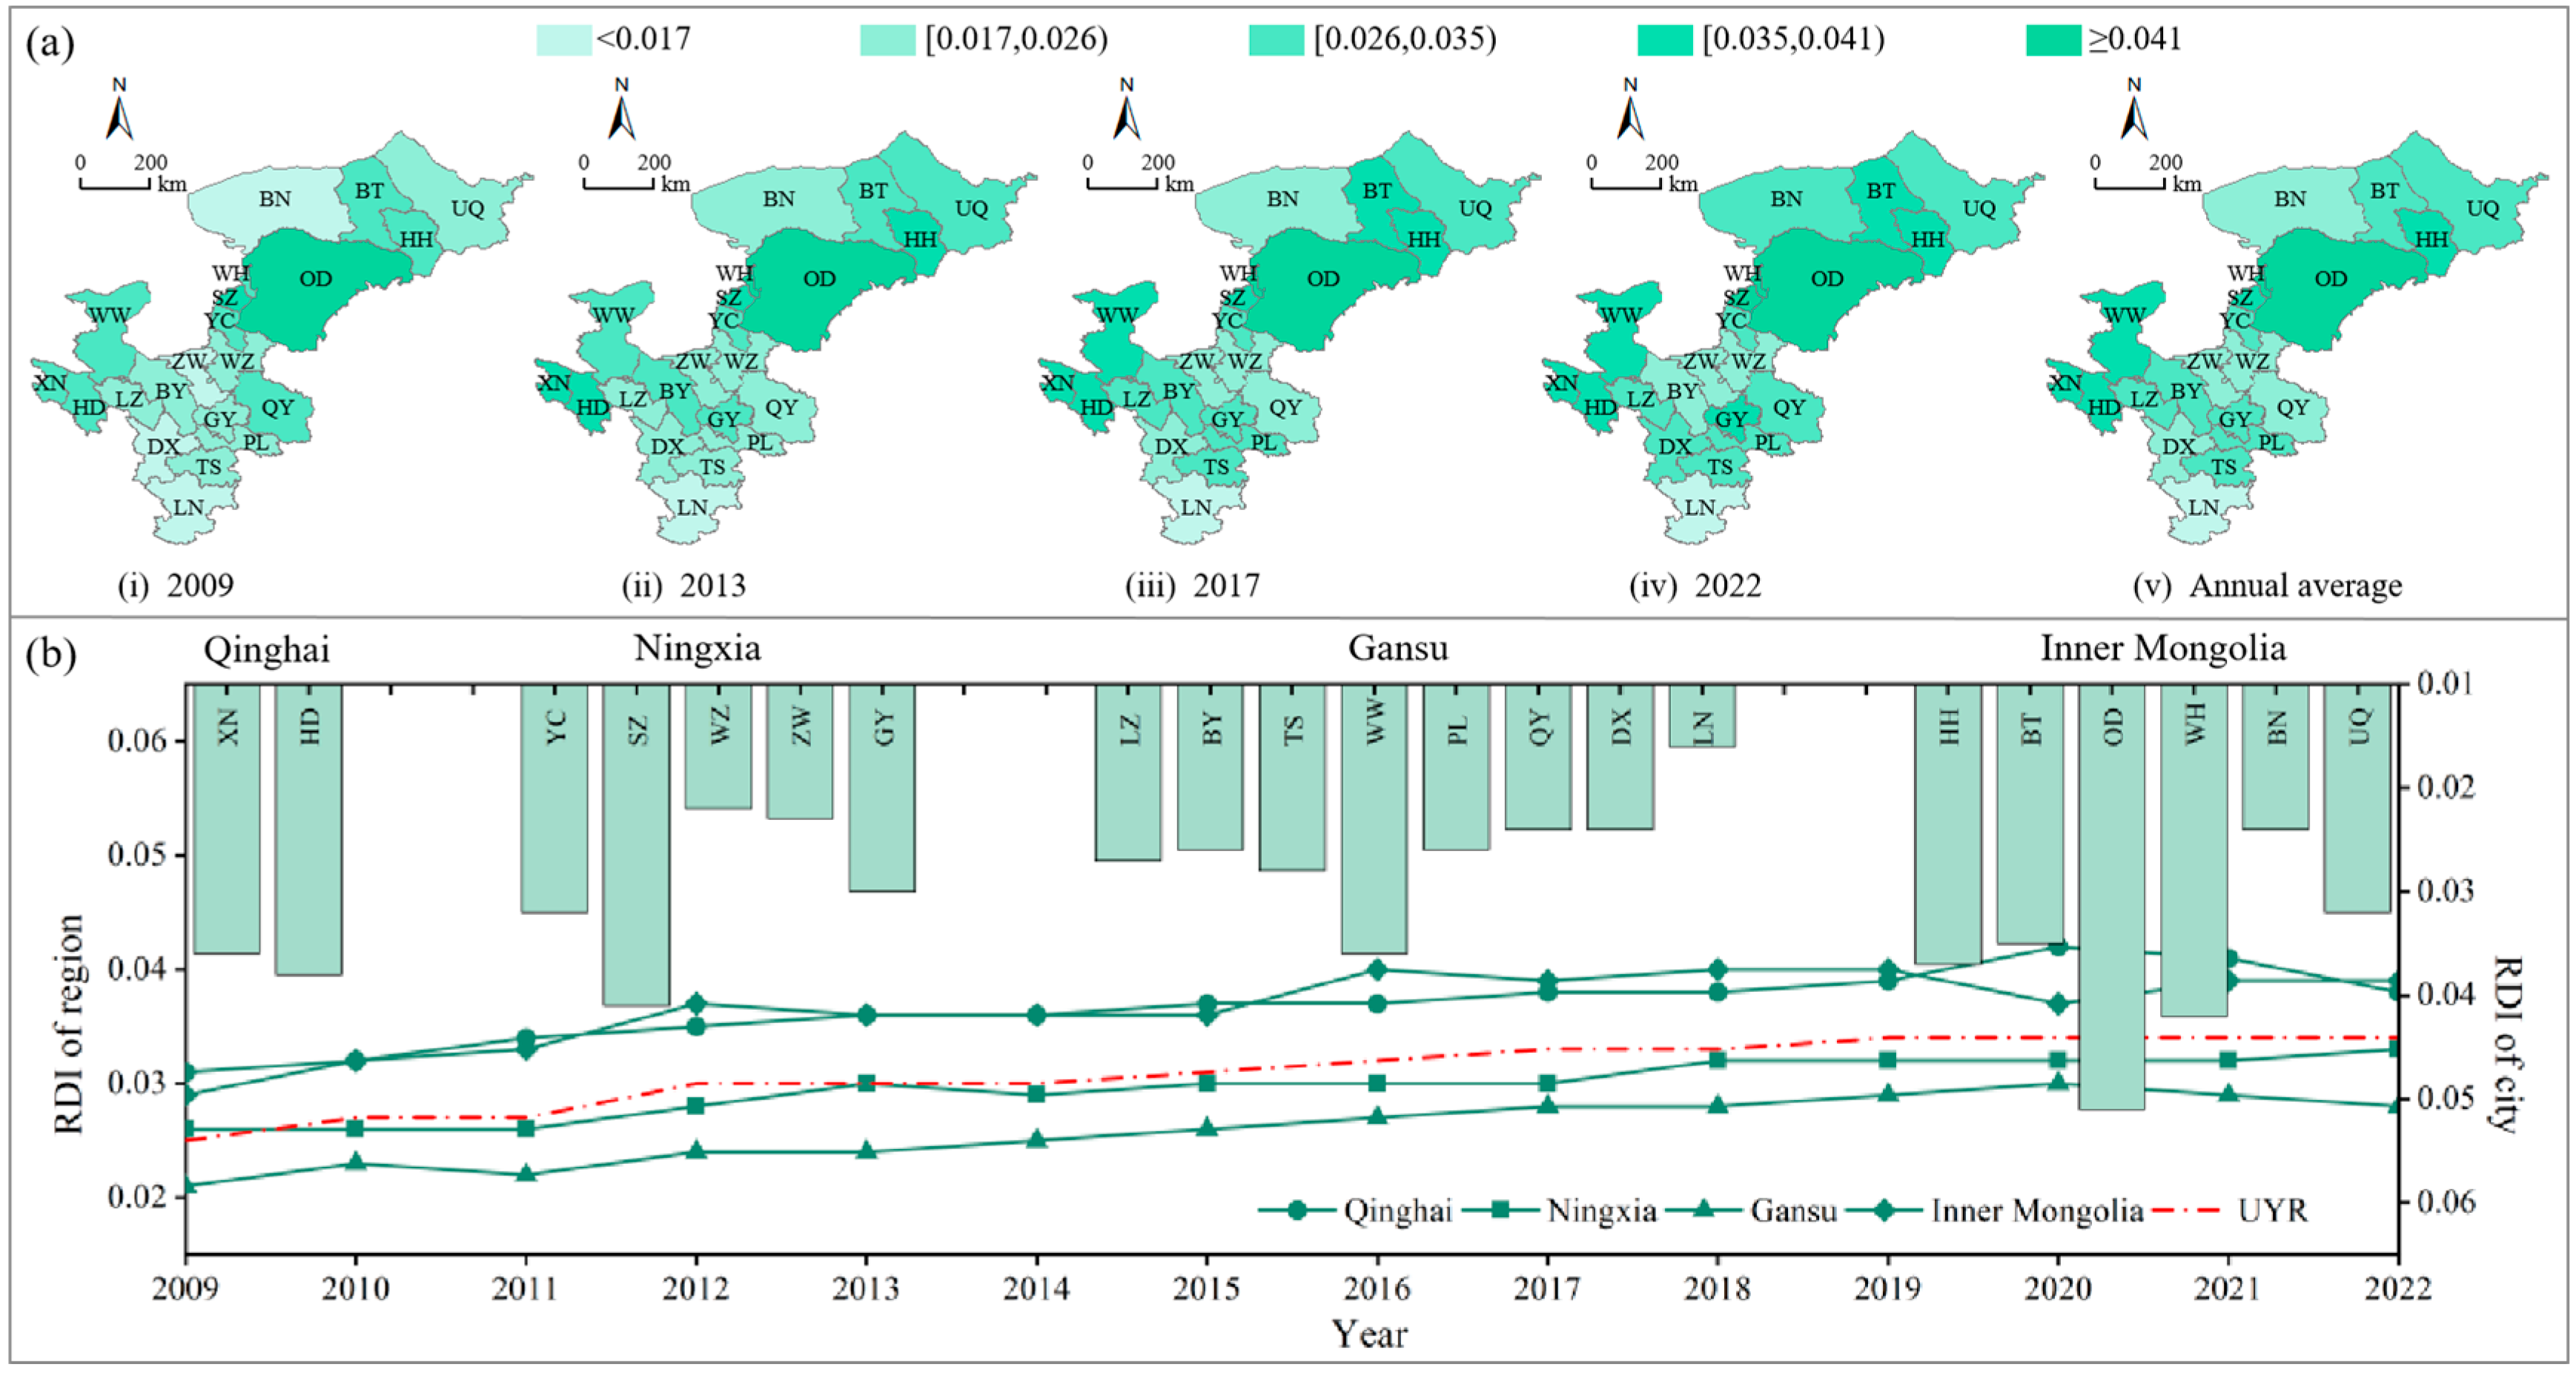
As shown in Figure 4 from 2009 to 2022, the RDI of the environment subsystem within the UYR exhibited a fluctuating yet upward trend. Ordos persistently showed a higher development level compared with other cities, while Longnan emerged as the lowest. This was due to the low and decreasing trend of industrial pollutant emissions in Ordos, and the gradual decrease in the water utilization rate, which makes its environmental pressure relatively small. In addition, both environmental endowment and environmental protection related indicators of Ordos showed fluctuating and increasing trends. Comparatively speaking, Longnan’s environmental pressure was higher as its industrial wastewater discharge per unit of GDP was higher, and showed an increasing trend. Thus, water quality deterioration, resource shortage, and ecological environment destruction in Longnan are more serious.
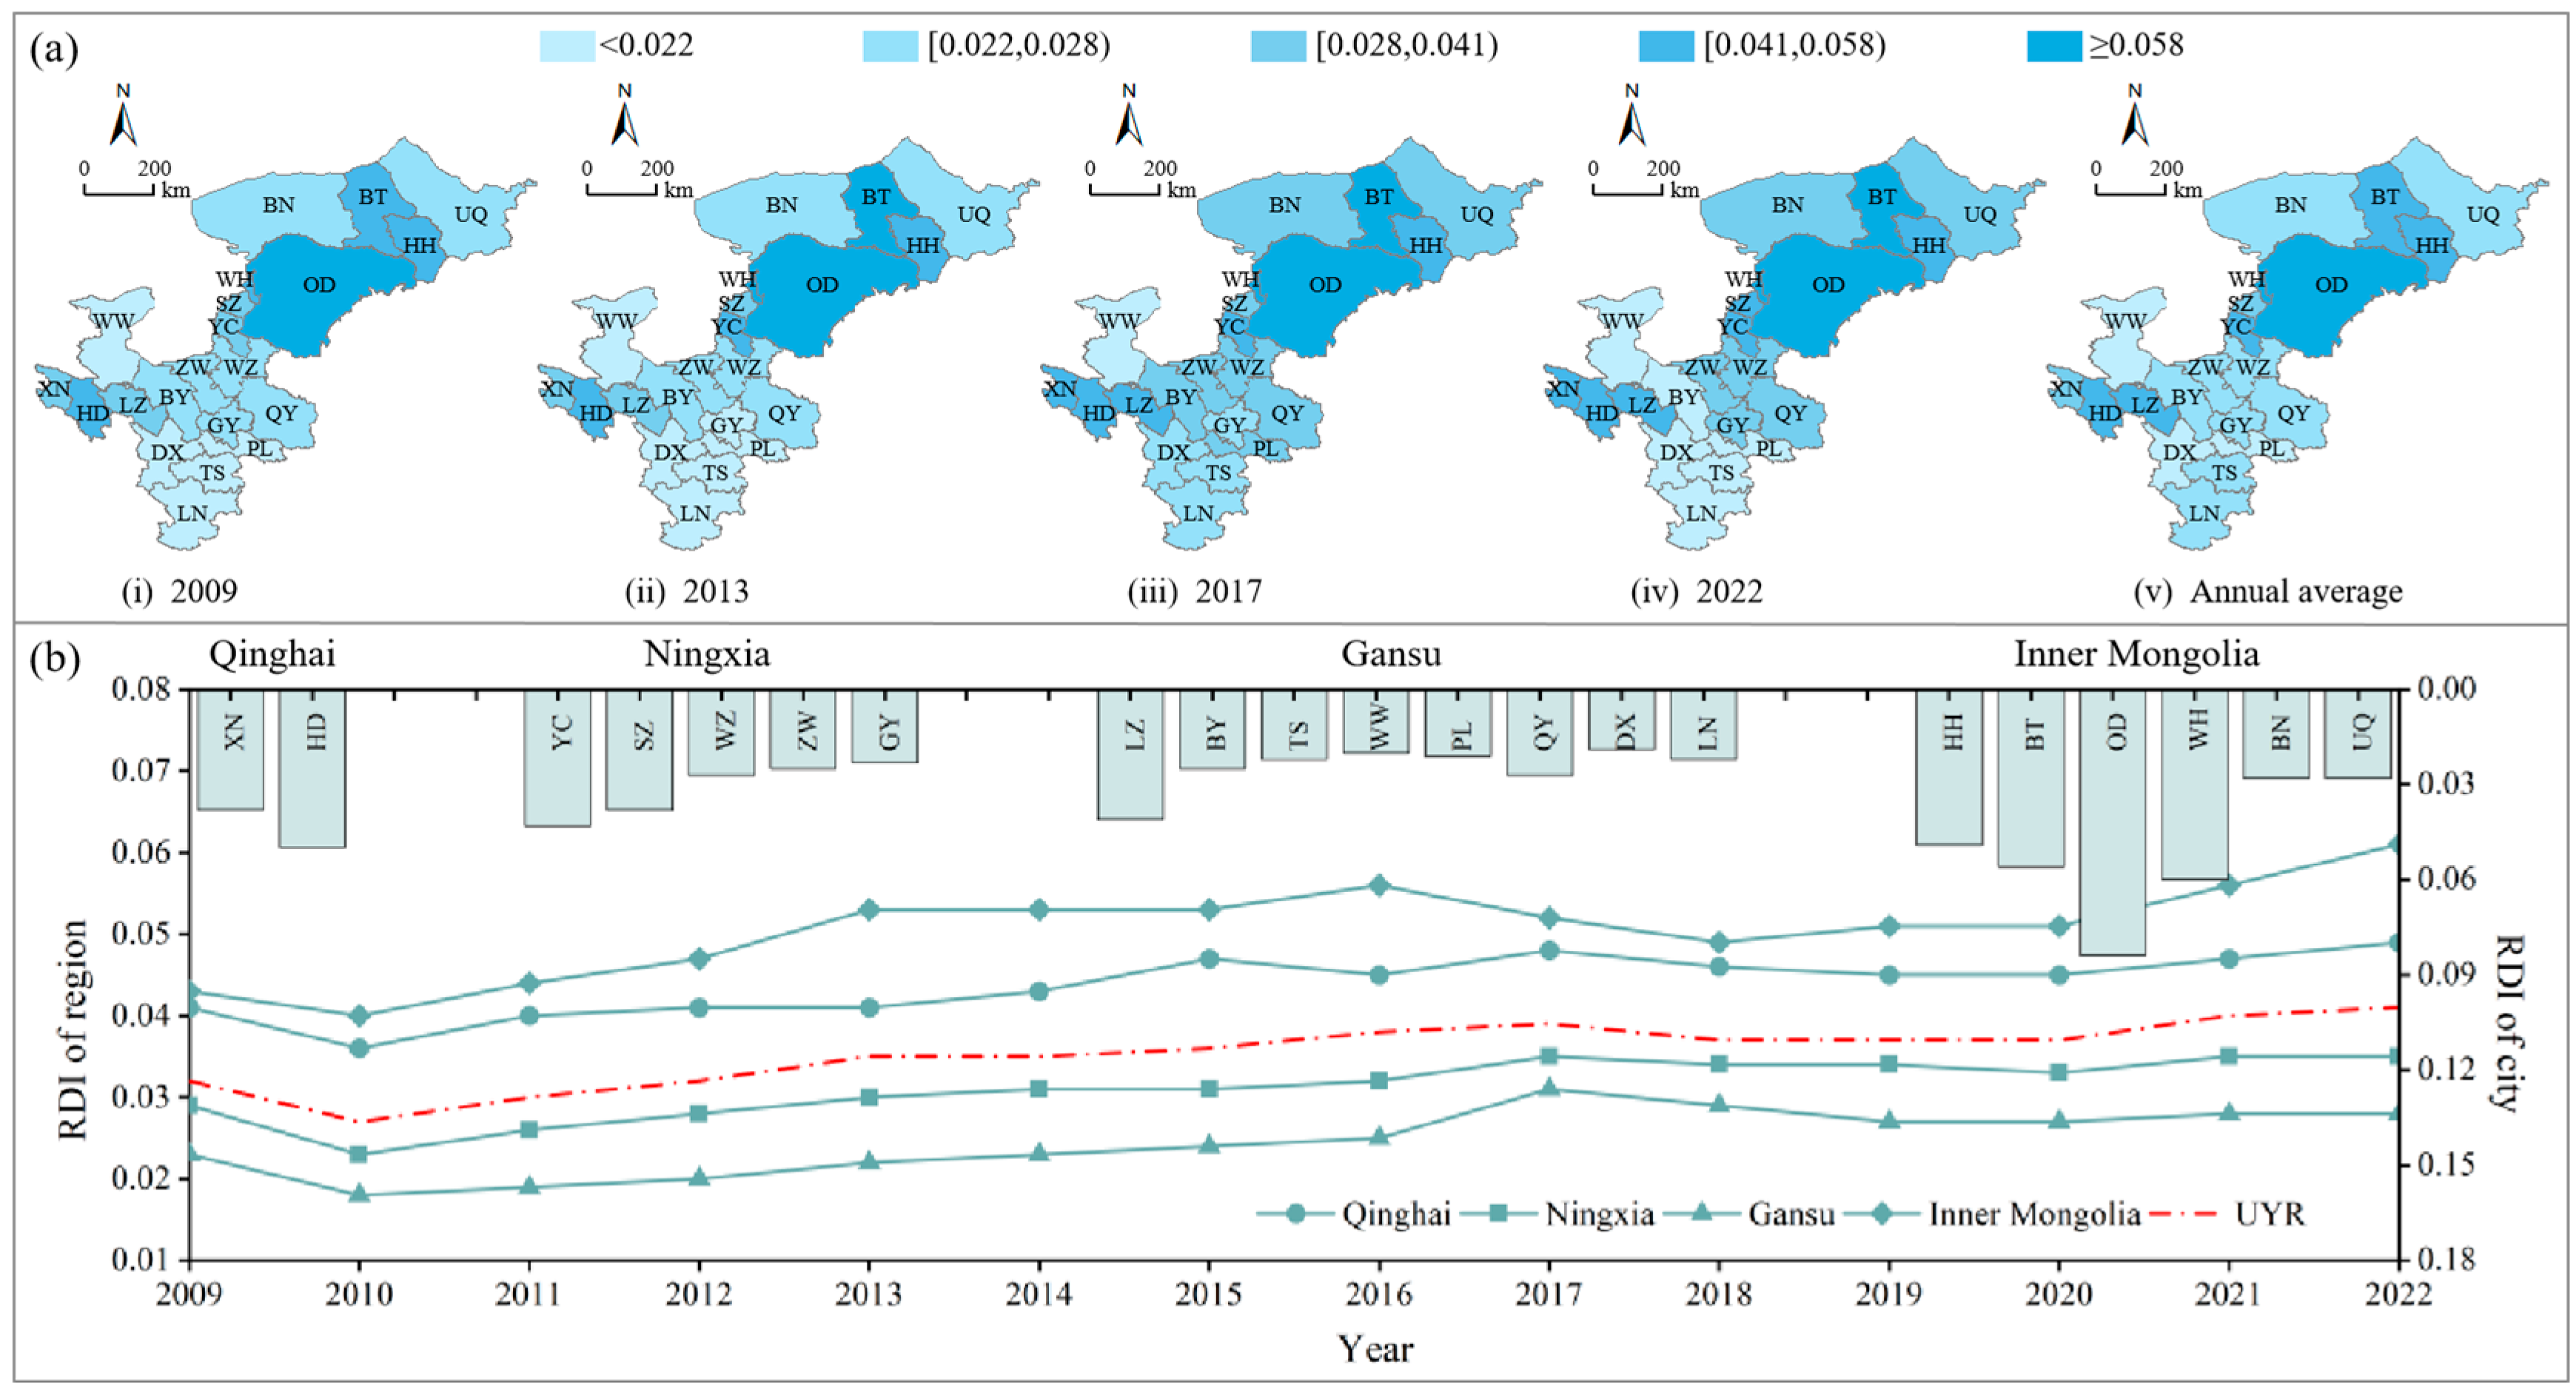
As indicated in Figure 5, during the period spanning from 2009 to 2022, the RDI of the economy subsystem within the UYR exhibited a fluctuating increasing trend. The development level of Ordos emerged as the highest, whereas Wuwei was lower. This is because the per capita GDP and per capita fixed asset investment of Ordos always ranked in first place, leading to strong economic strength. On the contrary, the proportion of primary industry in Wuwei always ranked first place, and the index of advanced industrial structure and the input–output ratio were low and decreasing.
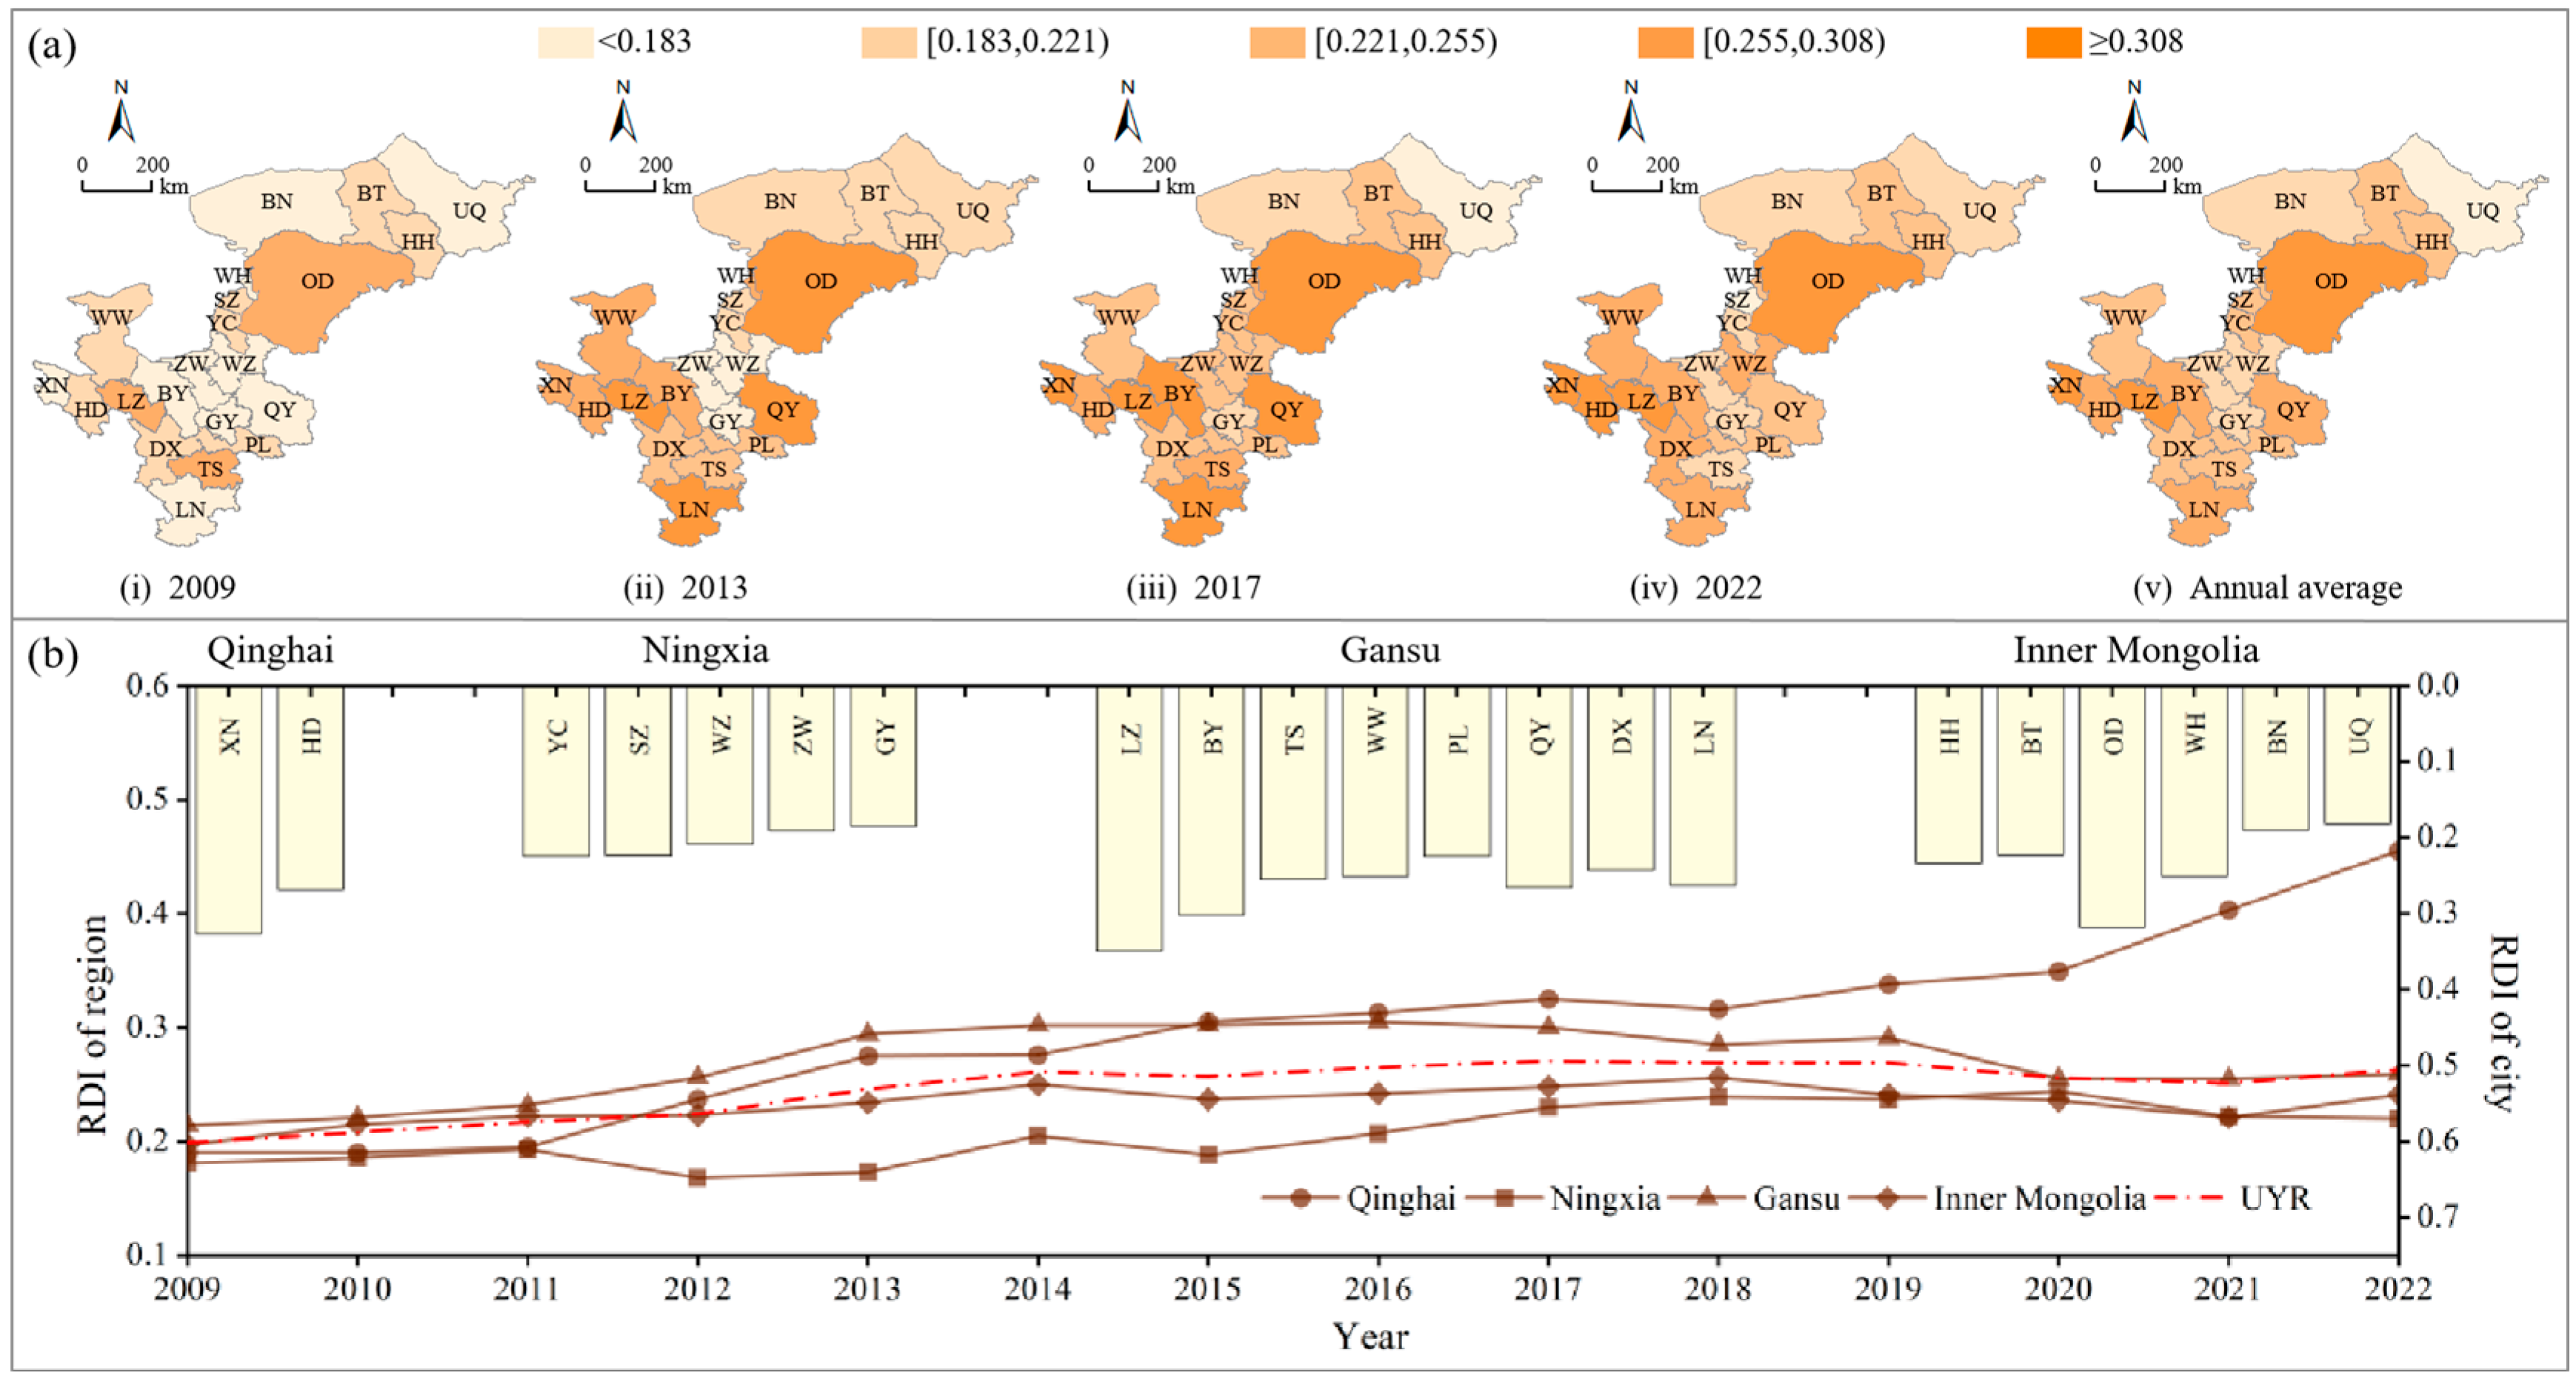
As shown in Figure 6, the RDI of the society subsystem in the UYR showed a fluctuating increasing trend from 2009 to 2022, while individual areas such as Lanzhou, Baiyin, and Tianshui appeared to decline. This was due to fluctuating increases in the urban registered unemployment rate and decreases in population density in Lanzhou, Baiyin, and Tianshui. Social insurance coverage in these cities remain at too low a level to reverse the downward trend of the society subsystem RDI, although it had a fluctuated increase.
Overall, the RDI of the three subsystems showed an increasing trend. The RDI of the society subsystem was relatively high, fluctuating between 0.13 and 0.52. The environment and economy subsystems were low, fluctuating between 0.01 and 0.06 in most cities.

3.1.2. RDI of the EES Composite System

(1)
Temporal variation
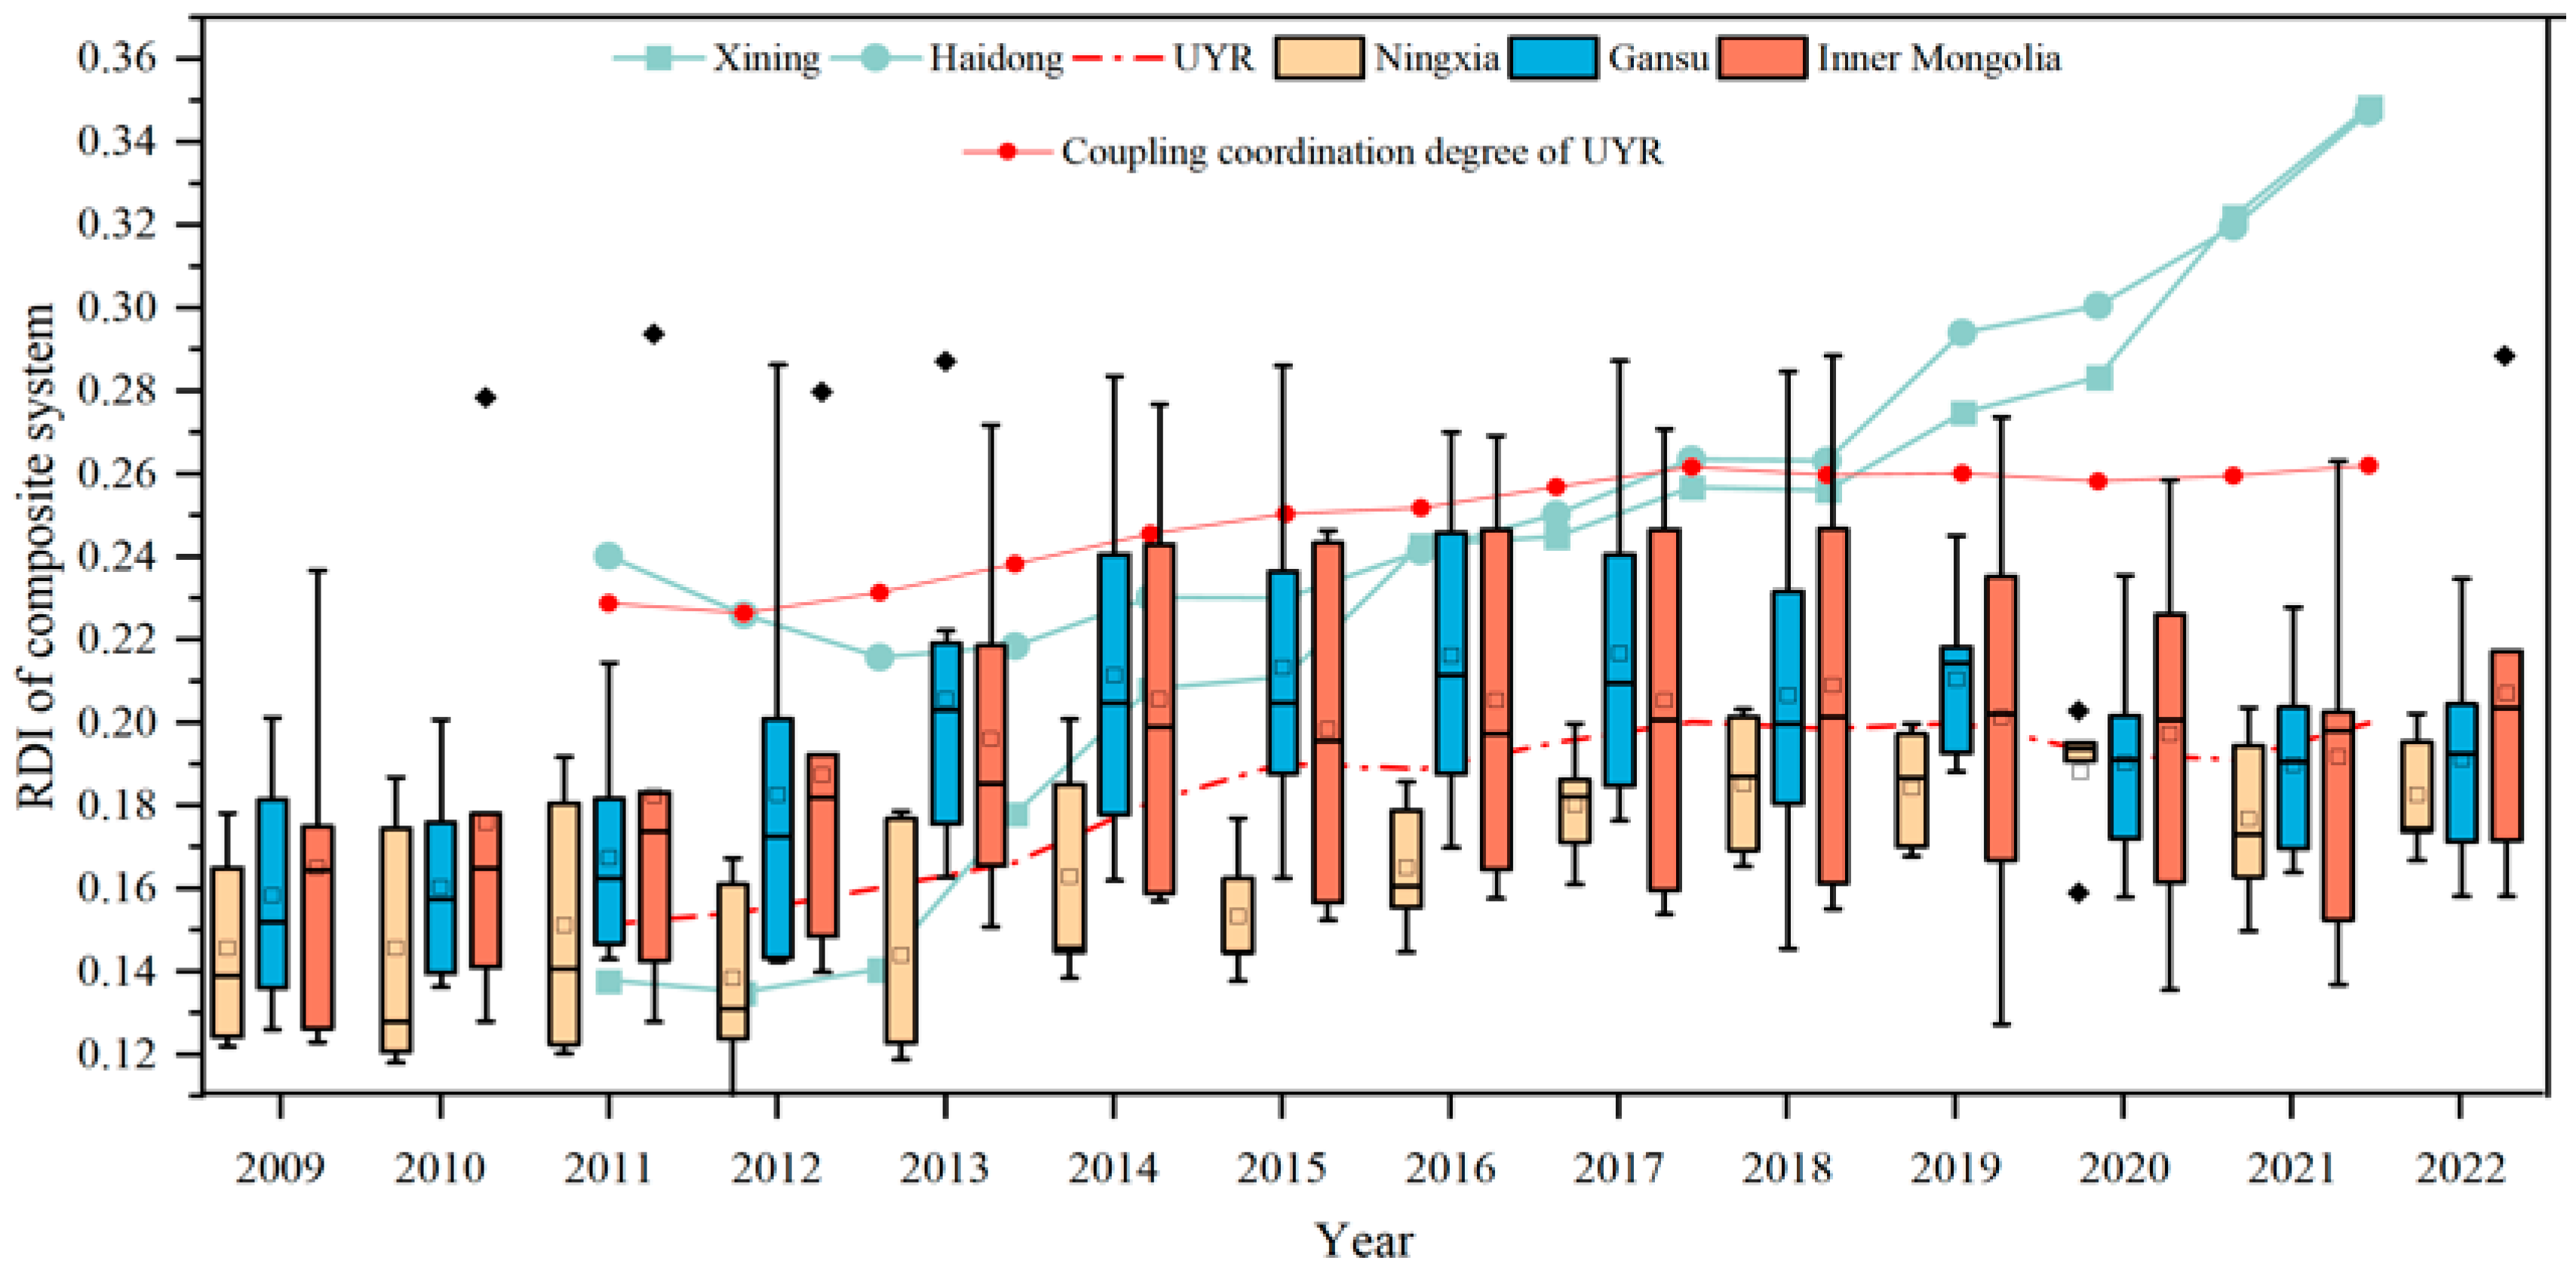
As shown in Figure 7, the RDI of the composite system in the UYR exhibited an overall trend of fluctuating increase from 2009 to 2018. However, after this, Qinghai showed an increasing trend year by year, and the development level was much higher than that of the UYR and the other three regions. Ningxia was relatively stable as a whole, and Gansu and Inner Mongolia increased first and then decreased. In terms of spatial agglomeration, the length of the box in the boxplot reflects the degree of data dispersion. The longer the box length, the more dispersed the data, and the greater the gap between regions. From 2009 to 2022, the gap in the RDI of composite system between Xining and Haidong gradually narrowed, while the gap between cities in Ningxia was small and stable. The gap between the RDI of the composite system of cities in Gansu and Inner Mongolia showed a tendency of increasing and then decreasing since 2018. Since 2018, with the narrowing of the gap in the RDI of the society subsystem, the gap in the RDI of the composite system between cities has been significantly reduced.
(2)
Spatial distribution
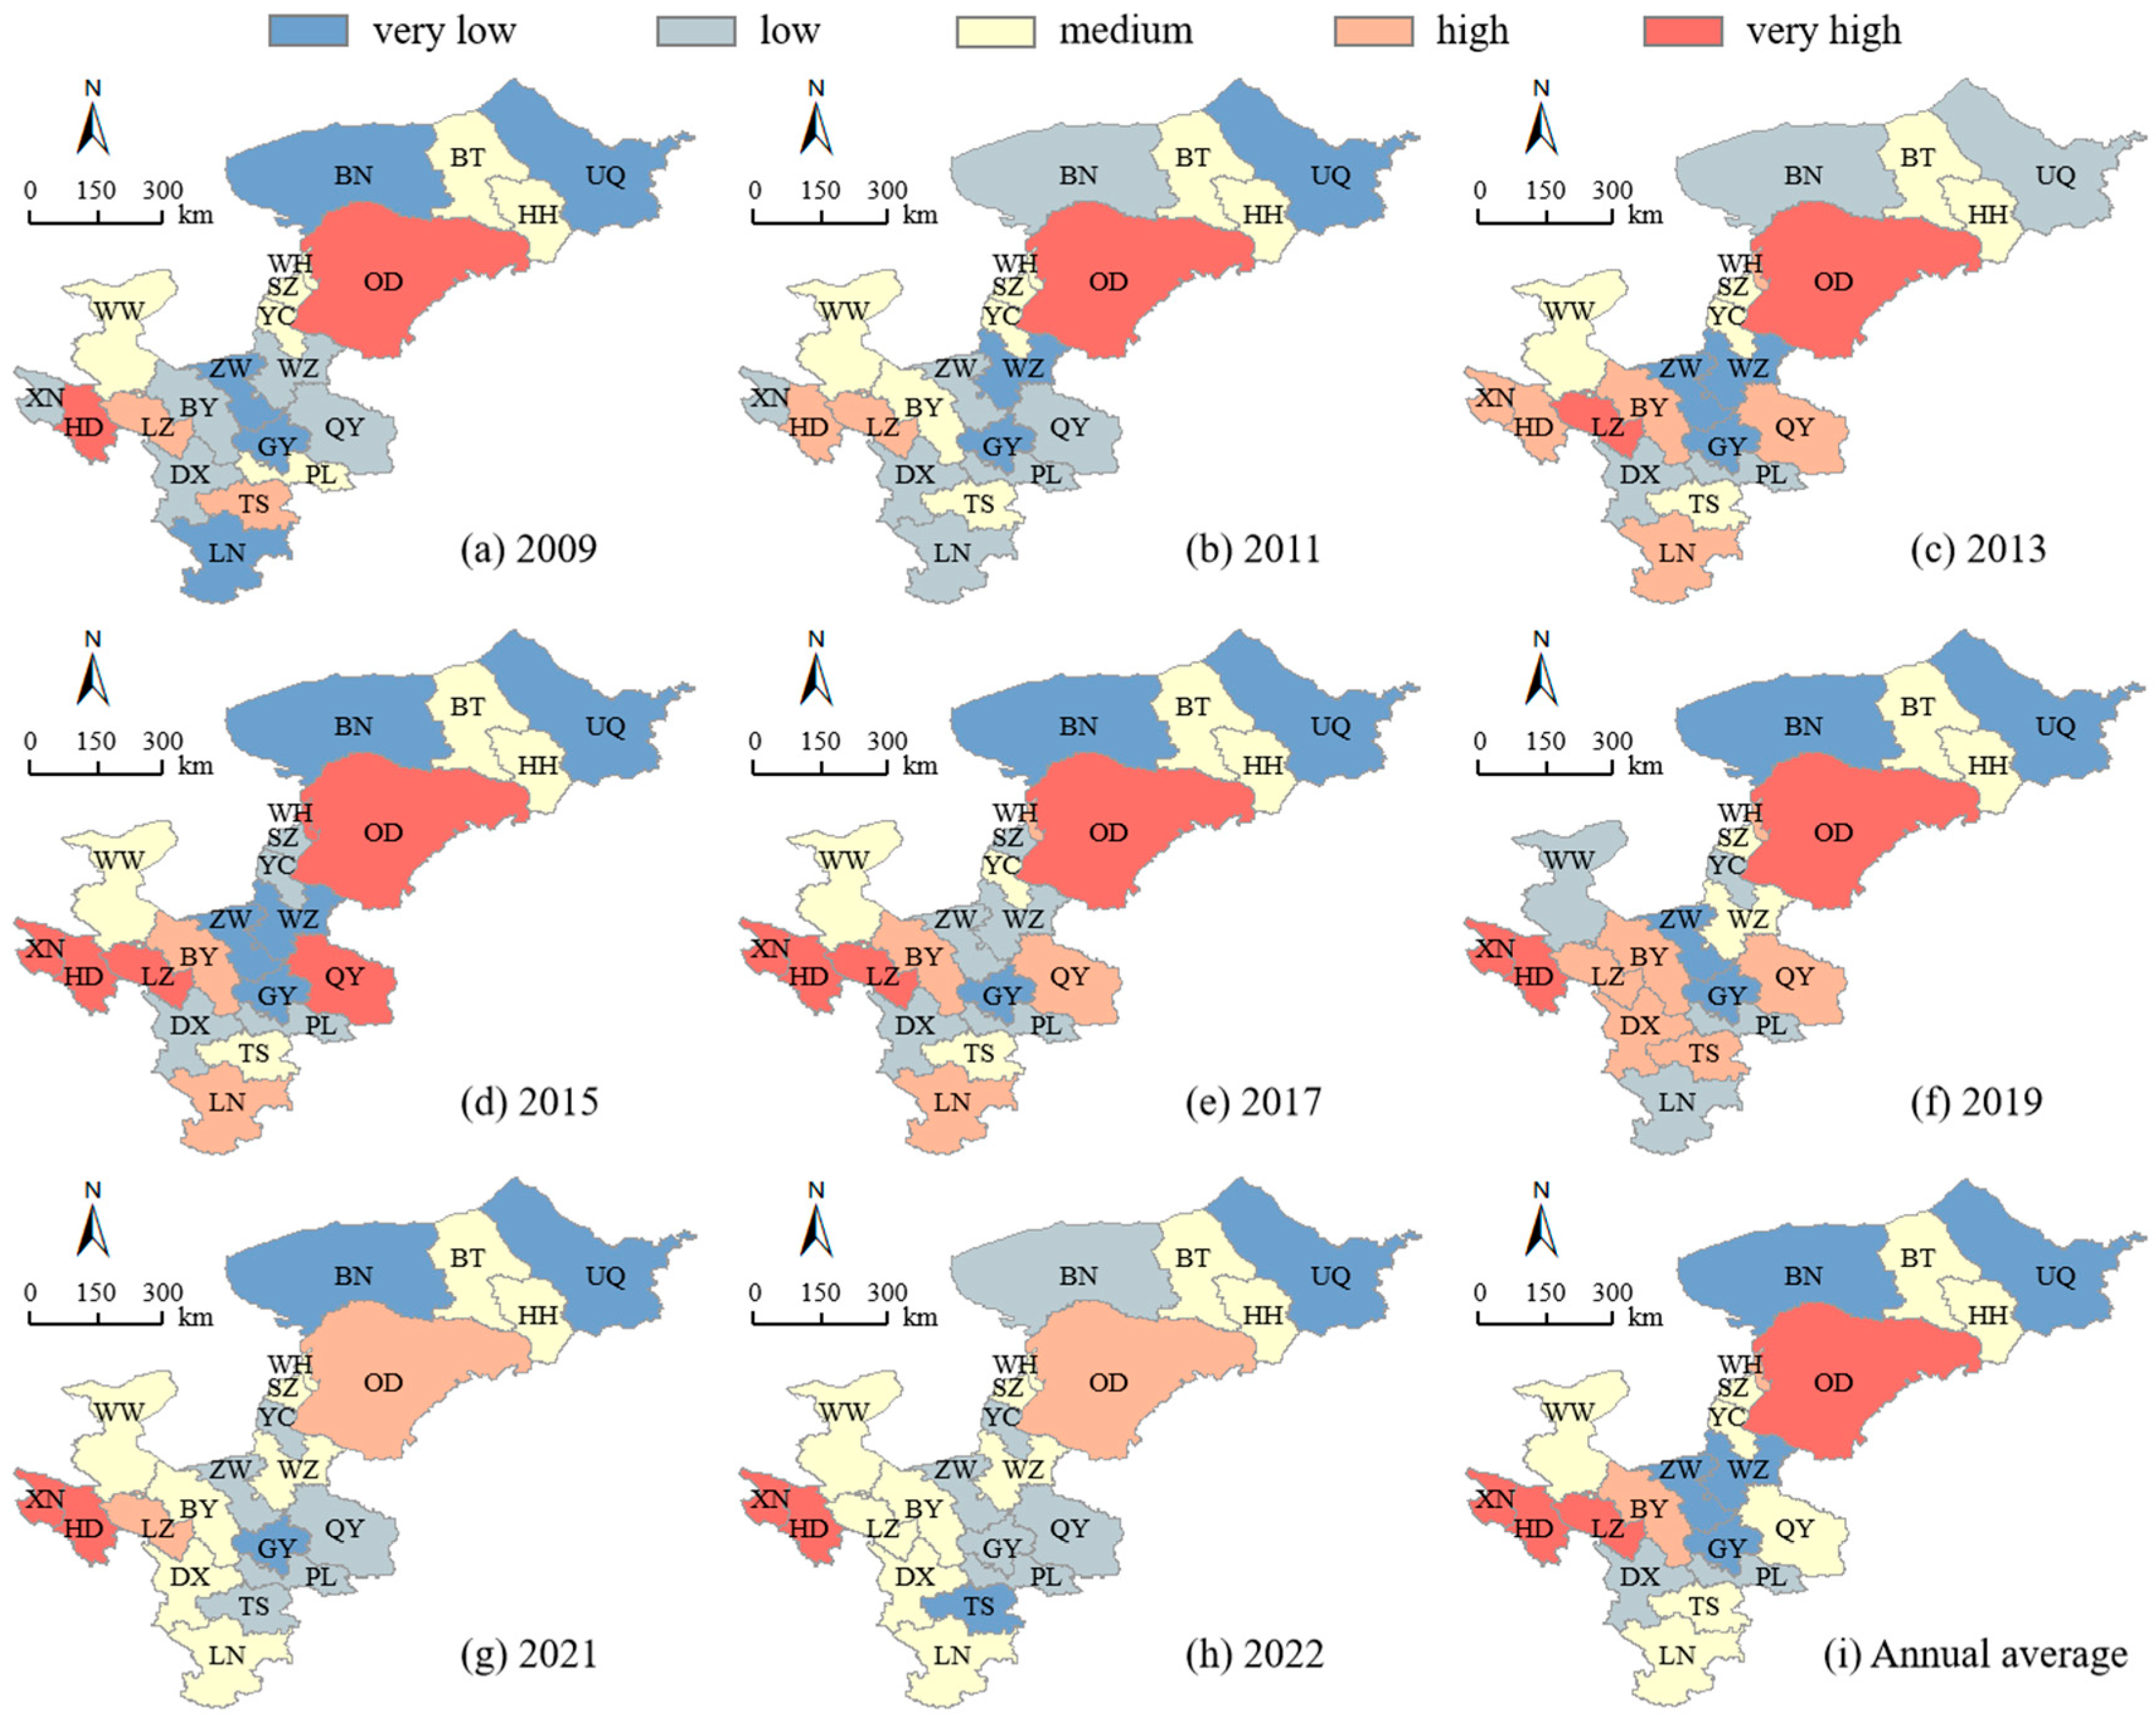
The resilience level of the composite system was classified into five distinct categories (lower, low, medium, high, and higher resilience) through the application of the ArcGIS natural breakpoint approach. The distribution of resilience levels is presented in Figure 8, where the resilience level of the composite system in the UYR showed a general increasing trend, but the regional distribution was uneven.
Xining and Haidong in Qinghai Province had the higher resilience levels throughout the year. The two regions have a solid economic foundation, rich natural resources, perfect transportation network, good industrial base, etc. While maintaining the advantages of traditional industries, they are actively cultivating emerging industries and characteristic industries to diversify their economies. Xining is dominated by the service industry, while Haidong is gradually transforming from secondary to tertiary industry. The continuous enhancement of the industrial structure has contributed to the reduction in environmental pollution and ecological damage. The population of the two regions is relatively concentrated, and the urbanization rate is relatively high. This agglomeration effect of population and urbanization helps to improve the development level of the society subsystem.
Lanzhou in Gansu Province fluctuates between high and higher development levels. Dingxi and Pingliang are perennially at low resilience levels. Located in the UYR, Lanzhou has abundant water, mineral, and diverse biological resources, providing a solid foundation for its economic development. Dingxi and Pingliang have an uneven spatial and temporal distribution of precipitation, relatively low vegetation coverage, and fragile ecological environment. The total economic output of the two regions is relatively small, and the industrial structure is dominated by traditional agriculture, which to a particular degree limits the economic development potential and results in a deficiency of competitiveness. The holistic level of system resilience in the cities of Ningxia demonstrated a relatively low degree. Wuzhong, Guyuan, and Zhongwei are perennially at a lower resilience level, and have been moving toward a medium resilience level since 2019. Shizuishan and Yinchuan are perennially at a moderate resilient level. Most of these cities are located in ecologically fragile and underdeveloped areas, and they are faced with problems such as the prominent contradiction between the supply and demand of water resources and the inefficient utilization of water resources. The pressure of ecological and environmental protection is great, and the regional GDP and per capita GDP are at a relatively low level.
In the Inner Mongolia Autonomous Region, Ordos has perennially exhibited a high degree of resilience. Wuhai, Baotou, and Hohhot have consistently maintained a medium degree of resilience. Ulanqab and Bayannur consistently fluctuate between low and lower resilience levels. Ordos has rich natural resources, effective ecological environmental protection measures, and continuous ecological restoration projects, which provide a solid ecological foundation for the composite system. Furthermore, in recent years, Ordos has actively promoted industrial transformation and upgrading, and has developed high-tech industries and emerging industries to enhance its economic strength and competitiveness. Relatively speaking, Ulanqab and Bayannur are facing multiple challenges including fragile environment, lagging economic development, and inadequate social construction.

3.2. Configuration Analysis of the EES Composite System Resilience

3.2.1. Necessity Analysis of Single Condition for High Resilience

Necessary conditions are conditions that must exist when an outcome occurs, and they face the risk of being simplified away in the parsimonious solution. Therefore, prior to conducting configuration analysis, it is imperative to analyze the significance of a single condition. In fsQCA, the consistency level is usually used to measure the extent to which the outcome variable is subordinate to a subset of a condition. In the event that the degree of consistency exceeds 0.9, the given condition may be deemed to serve as an indispensable prerequisite for the outcome [40]. As is evident in Table 3, the consistency level across all independent variables was below 0.9 on average. This suggests that none of the independent variables can be deemed an indispensable prerequisite for achieving high resilience levels within the composite system. This means that it is difficult to play a decisive role with a single element. In other words, multiple elements and their interaction must be taken into consideration to enhance the resilience level of a composite system.

3.2.2. Configurations for High Resilience Levels

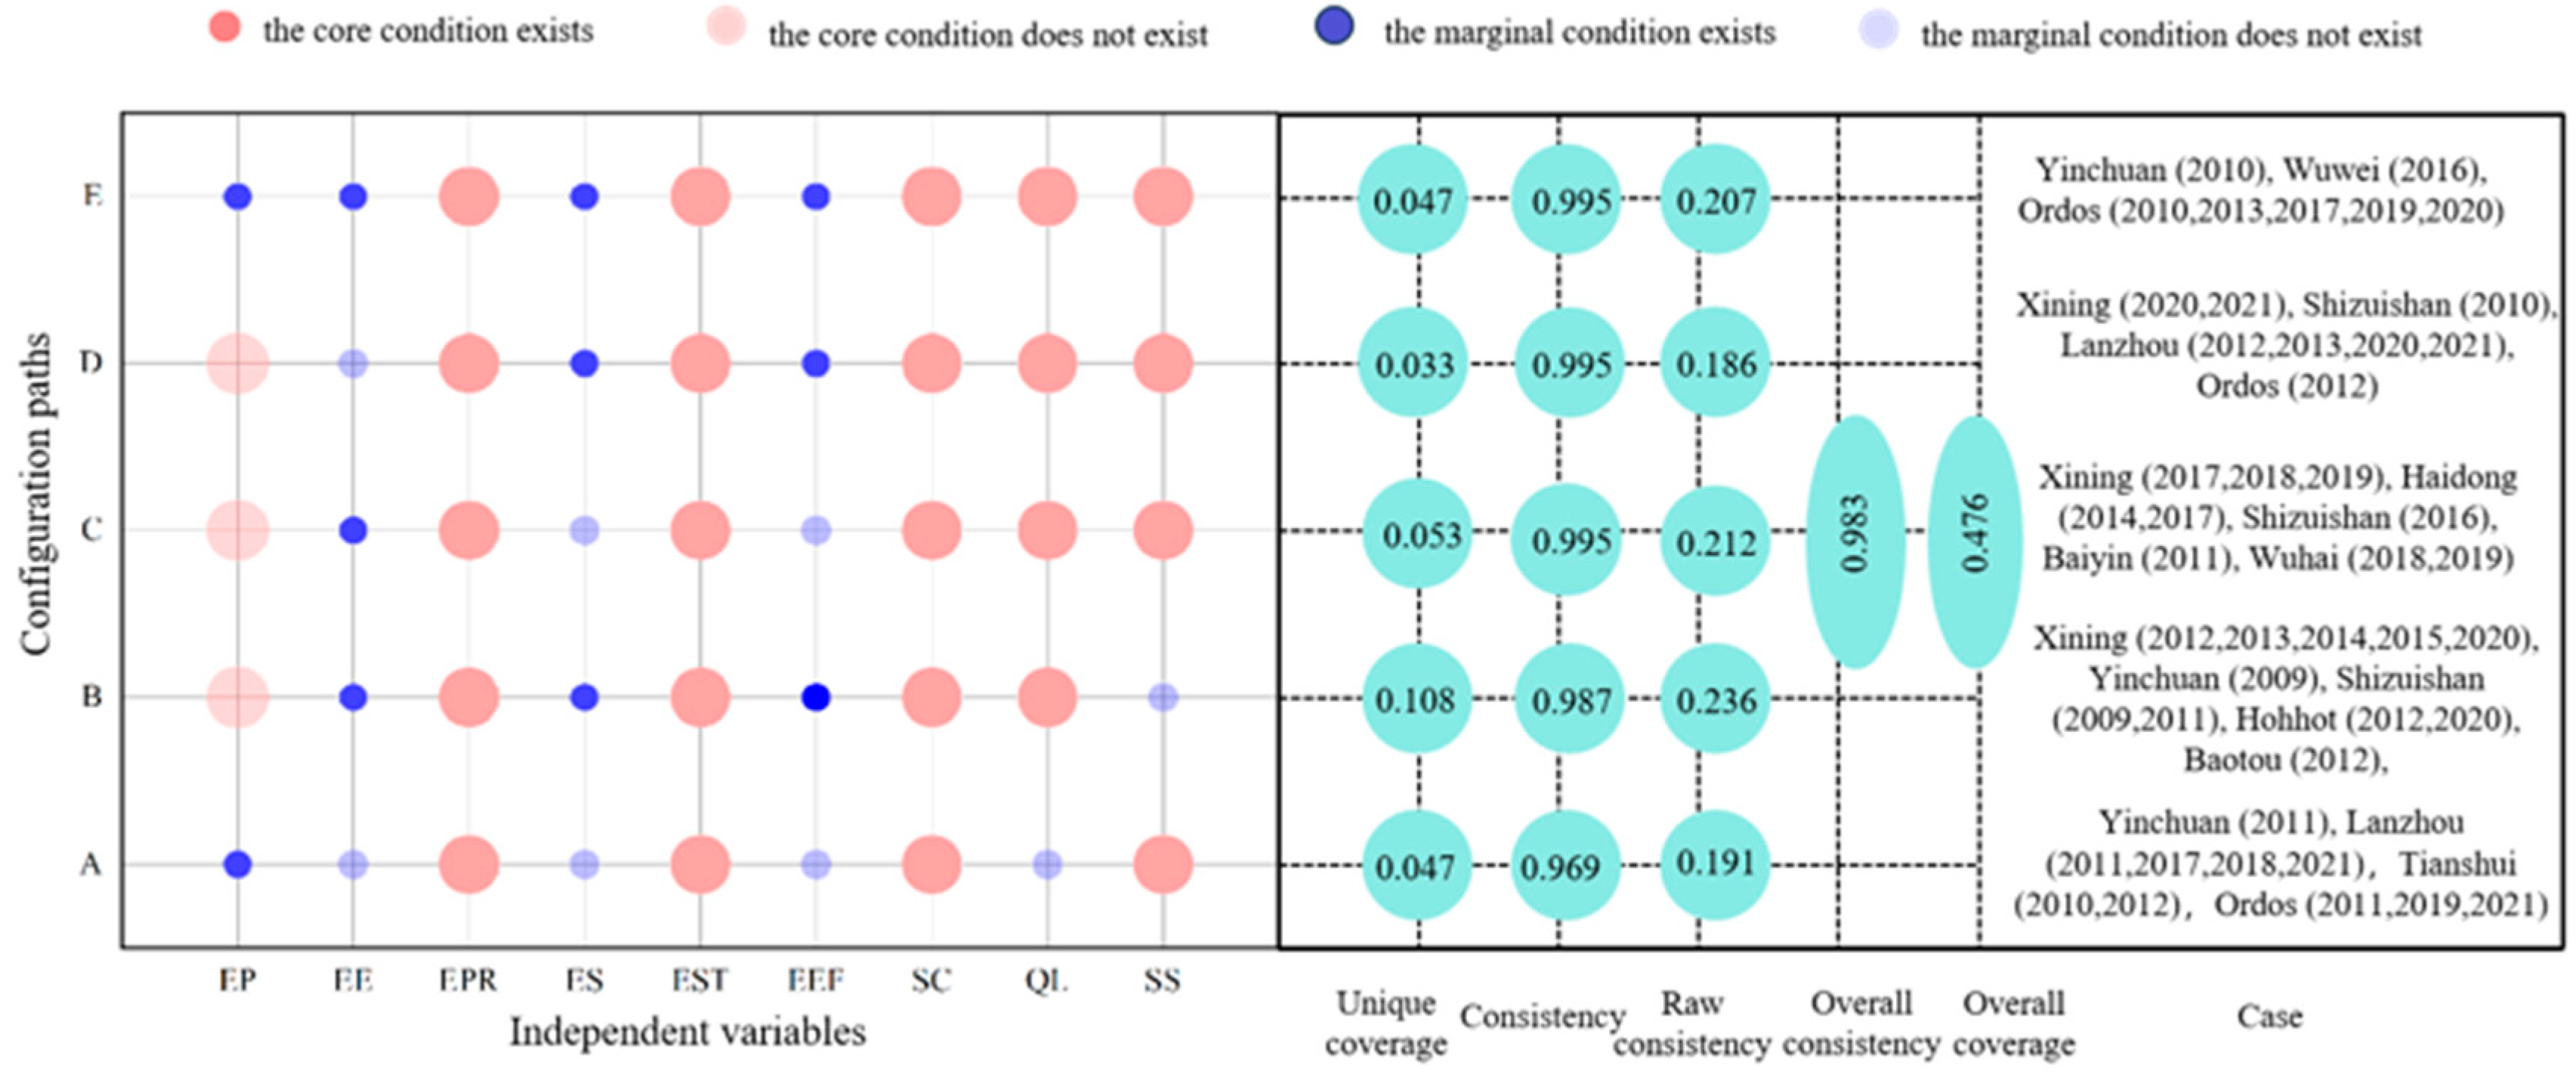
According to Kumar et al. [41], the threshold for raw consistency was set to 0.8, the designated value for PRI consistency was fixed at 0.7, and the case frequency threshold was determined to be 1. As shown in Figure 9, there are five equivalent configuration paths that can generate high resilience levels. The holistic consistency of the configuration solution was 0.983, which implies that 98.3% of all cases included in the five paths showed a high resilience level. The comprehensive coverage was 0.476, which suggests that the five pathways can elucidate 47.6% of high resilience cases. Moreover, the consistency of a single solution was above the threshold value of 0.8, which suggest that the five paths are fully effective. With the aim of the variation in results due to the random nature of individual cases, this report examined the stability of the prior configuration relevant to benefit generation by modifying the consistency criterion and the case incidence threshold. We adjusted the PRI consistency from 0.70 to 0.75, and the threshold of case frequency from 1 to 2. It was demonstrated that the results had high robustness with a very small change from the unadjusted state.
Configuration A shows that a high resilience level can be achieved with environmental protection, economic structure, social construction, and social security as the core conditions. The degree of consistency for Configuration A was 0.969, while its raw coverage amounted to 0.191. This implies that 19.1% of the cases can be explained. This configuration involves Yinchuan, Lanzhou, Tianshui, and Ordos.
Configuration B shows that a high resilience level can be achieved with environmental protection, economic structure, social construction, and quality of life as core conditions, and with complementary environmental endowments, economic strength, and economic efficiency as marginal conditions. The consistency of Configuration B was 0.987 and the raw coverage was 0.236, which indicates that 23.6% of the cases can be explained. This configuration involves Xining, Yinchuan, Shizuishan, Hohhot, Baotou, and Ordos.
Configurations C, D, and E showed that high resilience levels can be achieved with environmental protection, economic structure, social construction, quality of life, and social security as core conditions. All of their consistencies were 0.995, and the raw coverage was 0.212, 0.186, and 0.207, indicating that 21.2%, 18.6%, and 20.7% of the cases could be explained, respectively. Configurations C, D, and E had the same core conditions, but their marginal conditions were different, which led to a second-order equivalent configuration Regions that have these configurations include Xining, Haidong, Yinchuan, Shizuishan, Lanzhou, Baiyin, Wuwei, Ordos, and Wuhai.

4. Discussion

4.1. Resilience Assessment of the EES Composite System

Evaluating a composite system from a resilience perspective complements and extends previous research. The EES composite system faces many uncertainties in the current changing environment. In this paper, we found that the resilience of the EES composite system in the UYR showed a fluctuating and increasing trend, which aligns with the outcomes of the research investigations carried out by Liu and Liu [42], Wang and Niu [43]. These findings also prove the validity of the three-dimensional space vector model to a certain extent. Furthermore, Wu et al. [44] found that due to the in-depth promotion of the Western Development Strategy, the resilience level of the society subsystem in the UYR has been significantly enhanced, while that of the remaining subsystems is still at a low level. Liu et al. [45] found that the resilience level of the environment and society subsystems in prefecture-level cities of the UYR was consistently low from 2010 to 2019, and the growth rate was slow. These results align with the conclusion of this study, that is, although the RDI of the environment and economy subsystem exhibits a tendency of undulating growth, its development level is far lower than that of the society subsystem. In addition, it can be seen from Figure 7 that the system resilience evaluated by the coupling coordination degree model was similar to the three-dimensional space vector model. Therefore, it was demonstrated that this method is reliable. However, the development trend presented by the three-dimensional space vector model is clearer, especially for the change-points (such as 2014).
Spatially, the resilience of the composite system in the UYR showed a trend of high in the west and low in the east, which is consistent with the study of Zhao et al. [46]. A high resilience value was distributed in cities with a good ecological background (with high greening coverage in built-up areas, high green space per capita in parks, and high per capita water resources) and low demand for ecological resources such as Xining, Baiyin, and Ordos. Economically undeveloped areas and resource-oriented cities tended to have lower resilience such as Yinchuan and Wuzhong. Furthermore, the RDI of the composite system of several cities in Ningxia as relatively low, and the gap between them was small. This finding aligns with the outcomes derived from the investigations conducted by Yang et al. [47]. However, most of these cities are underdeveloped regions with low levels of GDP and per capita GDP. Wuzhong, Guyuan, Zhongwei, Shizuishan, and Yinchuan are facing environmental problems such as an outstanding conflict between the supply and demand of water resources and the low utilization efficiency of water resources, which constrain economic development and social progress. Therefore, it is imperative to prioritize the development of these regions and elevate the resilience level.

4.2. Configuration Analysis of the EES Composite System Resilience

Identifying the influencing factors of resilience levels in a composite system is important for optimizing system design, formulating coping strategies, enhancing system stability and reliability, and promoting sustainable development and scientific decision-making. Based on the configuration analysis method, this paper identified that environmental protection, economic structure, social construction, quality of life, and social security are the core elements to achieve high resilience levels. Huang et al. [48] found that environmental protection stood out as the major factor influencing ecological resilience within the UYR. Zhang et al. [49] found that financial investment in environmental protection, the transformation and upgrading of the industrial structure, and efficient resource allocation were the key factors affecting the ecological resilience within the UYR. Yang et al. [50] found that urbanization rate, education level, and industrial structure upgrading were the key elements affecting the ecological resilience of cities in the UYR. According to Zhang et al. [51], the primary determinants of ecological resilience in UYR cities are the intensity of land development and the degree of environmental pollution. Li et al. [52] found that environmental pressure indicators, such as water resources utilization rate and water consumption per 10,000 yuan GDP, were primary factors influencing the resilience of the water resources–social economy–ecological environment composite system in the UYR. All of these factors were identified in this study, which proves the validity and accuracy of the influencing factor identification to a certain extent. At the same time, this again illustrates the multiple concurrency of the multi-dimensional influencing factors of system resilience. It has been found that the fsQCA method can be used to identify influencing factors and find the optimal development path through the arrangement and combination of factors. Yuan et al. [53] empirically investigated the driving mechanisms toward a high ecological resilience index (ERI) for 280 cities in China with the fsQCA method based on the technology–organization–environment (TOE) framework. Choi [54] employed the fsQCA method to explore the casual complexities of risk mitigants for the supply chain country risk (SCCR). Cowell and Cousins [55] analyzed the relationship between the influencing factors of resilience for 22 United States cities using the fsQCA method.
High resilience levels are fundamentally influenced by the confluence of multiple factors, rather than by a single factor. There are five paths that can generate high resilience levels of a composite system. Configuration A shows that with environmental protection, economic structure, social construction, and social security as core conditions, high resilience levels can be attained. This configuration involves cities such as Yinchuan, Lanzhou, Tianshui, Ordos, etc. Configuration B shows that under high environmental pressure, Shizuishan, Hohhot, and Baotou should pay more attention to environmental protection, economic structure, social construction and quality of life to reach a high resilience level. Configurations C, D, and E show that under high environmental pressure and poor environmental endowment, a high resilience level is expected to be reached in Xining, Haidong, Lanzhou, and Wuwei through economic development and social construction. Notably, Xining, Yinchuan, Lanzhou, Shizuishan, and Ordos have multiple paths that can generate high resilience levels. These cities have more flexibility in formulating strategies and can choose the appropriate path according to their actual situation.

4.3. Limitations and Prospects

The constructed indicator system composed of 32 indicators was able to reflect the development status of environment, economy, and society in the UYR. However, due to the limitations of existing data, quantitative indicators were mainly selected to measure the resilience level. In the future, qualitative indicators, such as the completeness of laws and regulations and the effectiveness of government administration, need to be considered to further improve accuracy. In addition, a short time period of 2009–2022 was considered limited by data, which did not cover some important events like COVID-19. It is necessary to further analyze the impact of these events on system resilience in the future.
The States of Fragility 2022 points out that the world is facing multiple challenges including climate change, geopolitical tensions, economic uncertainty, etc. These factors collectively affect the economy, society, environment, and politics of different regions [56]. Ecologically fragile areas are sensitive to global climate change, have weak resistance to disturbance, are prone to degradation and difficult to recover, and face more severe environmental, economic, and social problems. These problems specifically include the continuous degradation of ecosystems, frequent natural disasters, the obstruction of economic development, and threats to social stability. In response to these problems, international organizations, such as the United Nations Development Program (UNDP), the United Nations Environment Program (UNEP), etc., are committed to improving the resilience of the EES composite system and achieving resilient and sustainable development [57]. At present, relevant studies have been carried out in the Qinling-Daba Mountains in southern Shaanxi [58], the Sanjiangyuan region [59], the Tarim Basin [60], the Loess Plateau region [61], the Hinh River Basin [62], the Indian Himalayan region [63], the Aravalli range [64], etc., which provide support for the formulation of sustainable development strategies for the basin or region. However, the results are often limited due to the lack of consideration for the multiple combinatorial effects of the influencing factors. This paper adopted the three-dimensional space vector model and configuration analysis to study the resilience of the EES composite system in an ecologically fragile area. The results have been proven to be accurate and reliable, displaying a great potential for the resilience research of other ecologically fragile areas worldwide.

5. Conclusions

This paper used the three-dimensional space vector model and fsQCA method to explore the resilience level and its configuration path of the EES composite system in the UYR from 2009 to 2022. The following conclusions were obtained. From 2009 to 2022, the RDI of the composite system within the UYR demonstrated a volatile but rising trend, fluctuating between 0.12 and 0.42. However, the spatial development was uneven, and Dingxi, Pingliang, Wuzhong, Bayannur exhibited low resilience levels. As for subsystems, the RDI of all three subsystems showed an increasing trend, while the RDI of the environment and economy subsystems were relatively low, with values fluctuating between 0.01 and 0.06 in most cities. The configuration analysis showed that the emergence of high resilience levels arises from the interaction of multiple factors. Environmental protection, economic structure, social construction, quality of life, and social security are the pivotal factors that influence the improvement of resilience levels. Spatially, paths to achieve high resilience levels vary among different cities. Resource-dependent cities in the eastern region, such as Ordos, Hohhot, and Baotou, should prioritize environmental protection, economic structure, social construction, and quality of life as the core conditions. Service-oriented cities in the western region, such as Xining, Haidong, and Wuwei, should prioritize environmental protection, economic structure, social development, quality of life, and social security as core conditions. Agricultural cities in Ningxia and Gansu, such as Yinchuan, Shizuishan, and Lanzhou, have multiple paths that can generate high resilience levels. These regions have more flexibility in formulating strategies and can choose the appropriate path according to their actual situation. In the future, each city needs to formulate targeted measures to improve system resilience with consideration of the actual development situation and high resilience paths.

Author Contributions

Conceptualization and methodology: J.L. and B.Q.; Analysis and investigation: J.L., B.Q., E.J., L.H. and C.L.; Writing–original draft preparation: B.Q., J.L., E.J. and Y.L.; Writing—reviewing and editing: J.L., B.Q., L.H. and Y.L. All authors have read and agreed to the published version of the manuscript.

Funding

This research was funded by the National Natural Science Foundation of China (U2243601), the Henan Province Science and Technology Research Project (242102520050), and the Hydraulic Cadre Education and Training Project (102126222015800019041).

Institutional Review Board Statement

Not applicable.

Informed Consent Statement

Not applicable.

Data Availability Statement

The original contribution presented in the study are included in the article; further inquiries can be directed to the corresponding author.

Conflicts of Interest

The authors declare no conflicts of interest.

References

  1. Rather, M.A.; Bhuyan, S.; Chowdhury, R.; Sarma, R.; Roy, S.; Neog, P.R. Nanoremediation strategies to address environmental problems. Sci. Total Environ. 2023, 886, 163998. [Google Scholar] [CrossRef] [PubMed]
  2. Bastien-Olvera, B.A.; Conte, M.N.; Dong, X.; Briceno, T.; Batker, D.; Emmerling, J.; Tavoni, M.; Granella, F.; Moore, F.C. Unequal climate impacts on global values of natural capital. Nature 2024, 625, 722–727. [Google Scholar] [CrossRef]
  3. Moore, F.C.; Lacasse, K.; Mach, K.J.; Shin, Y.A.; Gross, L.J.; Beckage, B. Determinants of emissions pathways in the coupled climate-social system. Nature 2022, 603, 103–111. [Google Scholar] [CrossRef] [PubMed]
  4. Ma, J.; Zheng, R.; Duan, S.; Wang, W.; Li, X. Exploring the path of rural ecological landscape construction from the perspective of a composite ecosystem. J. Agric. Resour. Environ. 2023, 40, 1180–1189. [Google Scholar]
  5. Pang, C.; Wen, Q.; Ding, J.; Wu, X.; Shi, L. Ecosystem services and their trade-offs and synergies in the upper reaches of the Yellow River Basin. Ecol. Sin. 2024, 44, 5003–5013. [Google Scholar]
  6. Zhan, C.; Xu, P. Overall Safety and Emergency Response Framework Based on System Resilience: Conceptual Logic and Construction Path. Chin. Public Adm. 2023, 39, 137–144. [Google Scholar]
  7. Büyüközkan, G.; Ilicak, Ö.; Feyzioglu, O. A review of urban resilience literature. Sustain. Cities Soc. 2022, 77, 103579. [Google Scholar] [CrossRef]
  8. Datola, G. Implementing urban resilience in urban planning: A comprehensive framework for urban resilience evaluation. Sustain. Cities Soc. 2023, 98, 104821. [Google Scholar] [CrossRef]
  9. Hu, L.; Guo, J.; Ou, M.; Qian, H. The “Rigidity-Elasticity-Resilience” of systematic farmland protection: Theoretical framework and implementation path. Planners 2023, 39, 7–13. [Google Scholar]
  10. Zhang, Z.J.; Wu, Y. Spatiotemporal Evolution and Influencing Factors of Urban Ecological Resilience: Evidence from the Yellow River Basin, China. Sustainability 2025, 17, 7114. [Google Scholar] [CrossRef]
  11. Qi, L.; Wang, D.; Chen, Y. An evaluation method for resilience of airport pavement based on topology and toughness triangle theory. J. Air Force Eng. Univ. 2024, 25, 29–36+127. [Google Scholar]
  12. Bi, J.; Lin, S.; Zhu, P. Coupling and coordinated development of urban resilience and urban land use efficiency and the influencing factors: A Case study of Yangtze River Economic Belt. Resour. Environ. Yangtze Basin 2024, 33, 2315–2328. [Google Scholar]
  13. Song, H.; Zou, Z.; Yang, Z.; Qin, Y. Spatial-temporal evolution, regional differences and obstacle factors identification of urban resilience in Shaanxi Province. J. Catastrophology 2025, 40, 1–10. [Google Scholar]
  14. Peng, W.; Kuang, C.E.; Li, W.; Di, Y. Spatial correlation network and impacts of urban renewal and ecological resilience in urban agglomerations in the middle reaches of the Yangtze River. Scientia Geogr. Sin. 2024, 44, 1936–1945. [Google Scholar]
  15. Yue, H.J.; Jia, X.C. Application analysis of green building materials in urban three-dimensional landscape design. Int. J. Nanotechnol. 2022, 19, 1117–1129. [Google Scholar] [CrossRef]
  16. Tian, A.H.; Wu, Y.M.; Gao, X. A 3D Two-Phase Landslide Dynamical Model on GIS Platform. Appl. Sci. 2024, 14, 564. [Google Scholar] [CrossRef]
  17. Zhao, J.; Zhang, X.; Wang, Y.; Miao, C. Spatio-temporal characteristics and influencing factors of regional economic resilience in China. Econ. Geogr. 2023, 43, 1–11. [Google Scholar]
  18. Lu, F.; Liu, Q.; Wang, P.C. Spatiotemporal characteristics of ecological resilience and its influencing factors in the Yellow River Basin of China. Sci. Rep. 2024, 14, 16988. [Google Scholar] [CrossRef]
  19. Ye, W. Spatio-temporal evolution characteristics and influencing factors of economic resilience in the Yellow River Basin. Stat. Decis. 2024, 40, 132–137. [Google Scholar]
  20. Li, X.; Zhang, X.; Yao, L.; Li, Y.; Lei, Y. Spatial-temporal evolution characteristics of social-ecological system resilience in Hexi region. J. Arid Land Resour. Environ. 2023, 37, 38–47. [Google Scholar]
  21. Miu, H.; Zhong, Z.; Hou, B.; Han, J.; Du, X. Dynamic seismic resilience assessment method for water distribution networks based on system dynamics. Eng. Mech. 2023, 40, 99–112. [Google Scholar]
  22. Li, Z.; Zhang, Y.; Peng, L.; Wu, F. Assessment of socioeconomic-ecological composite system resilience and its influencing factors analysis in Nepal. Acta Ecol. Sin. 2023, 43, 625–638. [Google Scholar] [CrossRef]
  23. Tian, G.; Sun, Z.; Jing, X.; Yang, Y. Research on strategies for enhancing the resilience of the”Water Energy Grain Carbon”system in the Yellow River Basin under the Background of High Quality Development. China Rural. Water Hydropower 2024, 11, 1–11+20. [Google Scholar]
  24. Gan, R.; Kong, L.; Guo, L.; Gao, Y.; Wang, Y.; Tang, H. Resilience evaluation of water resources system in Xinyang City based on multiple methods. J. Water Resour. Water Eng. 2024, 35, 12–19. [Google Scholar]
  25. Shi, W.; Zhou, Y.; Wang, W.; Ouyang, Q.; Luo, H. Basis vectors-guided support vector machines for seismic resilience assessment of RC frames. J. Build. Struct. 2024, 45, 81–91. [Google Scholar]
  26. Wen, H.; Qian, L.; Li, Z.; Huang, J. Study on resilience assessment of flood and landslide disasters in mountainous urban areas. J. Disaster Prev. Mitig. Eng. 2024, 44, 751–761. [Google Scholar]
  27. Chi, M.; Du, Y.; Wang, W. Configurational perspective and qualitative comparative analysis: The new way of empirical research in Library and Information Science. J. China Soc. Sci. Tech. Inf. 2021, 40, 424–434. [Google Scholar]
  28. Liu, X.; Ma, C.; Wei, L.; Cheng, J.; Wei, J.; Zeng, D. Poverty reduction turn and high-quality development in the upper reaches of the Yellow River. Resour. Sci. 2020, 42, 197–205. [Google Scholar] [CrossRef]
  29. Tan, S.Z.; Li, W.; Liu, X.G.; Li, P.F.; Yan, L.; Liang, C. Synergistic Systems of Digitalization and Urbanization in Driving Urban Green Development: A Configurational Analysis of China’s Yellow River Basin. Systems 2025, 13, 426. [Google Scholar] [CrossRef]
  30. Yang, Q.; Chen, H.; Wen, Q. Coupling coordination degree between Digital Economy and Green Development and its promotion path in the upper reaches of the Yellow River at the prefecture level. Econ. Geogr. 2024, 44, 22–32. [Google Scholar]
  31. Lu, C.P.; Ji, W.; Hou, M.C.; Ma, T.Y.; Mao, J.H. Evaluation of efficiency and resilience of agricultural water resources system in the Yellow River Basin, China. Agric. Water Manag. 2022, 266, 107605. [Google Scholar] [CrossRef]
  32. Zhou, W.; Chao, X. Coupling coordinated development of digital infrastructure, economic resilience and enbironmental protection in the Yellow River Basin. J. Arid Land Resour. Environ. 2023, 37, 1–9. [Google Scholar]
  33. Yin, D.; Liang, S.; Lin, X. Spatial and temporal evolution characteristics and influencing factors of National Aquatic Germplasm Reserves in the Yangtze River Basin. Resour. Environ. Yangtze Basin 2024, 33, 1663–1678. [Google Scholar]
  34. Qu, B.; Jiang, E.H.; Li, J.Q.; Liu, Y.; Liu, C. Coupling coordination relationship of water resources, eco-environment and socio-economy in the water-receiving area of the Lower Yellow River. Ecol. Indic. 2024, 160, 111766. [Google Scholar] [CrossRef]
  35. Ragin, C.C. The Comparative Method; University of California Press: Oakland, CA, USA, 1987. [Google Scholar]
  36. Du, Y.; Li, J.; Liu, Q.; Zhao, S.; Chen, K. Configuration Theory and QCA Method from a Complex Dynamic Perspective: Research Progress and Future Directions. J. Manag. World 2021, 37, 180–197. [Google Scholar]
  37. Ragin, C.C. Fuzzy-Set Social Science; University of Chicago Press: Chicago, IL, USA, 2000. [Google Scholar]
  38. Ragin, C.C. Redesigning Social Inquiry: Fuzzy Sets and Beyond; University of Chicago Press: Chicago, IL, USA, 2008. [Google Scholar]
  39. Fiss, P.C. Building Better Causal Theories: A Fuzzy Set Approach to Typologies in Organization Research. Acad. Manag. J. 2011, 54, 393–420. [Google Scholar] [CrossRef]
  40. Schneider, C.Q.; Wagemann, C. Set-Theoretic Methods for the Social Sciences: A Guide to Qualitative Comparative Analysis; Cambridge University Press: Cambridge, UK, 2012. [Google Scholar]
  41. Kumar, S.; Sahoo, S.; Lim, W.M.; Kraus, S.; Bamel, U. Fuzzy-set qualitative comparative analysis (fsQCA) in business and management research: A contemporary overview. Technol. Forecast. Soc. Change 2022, 178, 121599. [Google Scholar] [CrossRef]
  42. Liu, H.; Liu, S. Spatio-temporal evolution and obstacles identification of complex ecosystem resilience in Qilian Mountain area. Arid Land Geogr. 2024, 47, 237–247. [Google Scholar]
  43. Wang, S.; Niu, J. Spatio-temporal evolution and influencing factors of urban ecological resilience in the Yellow River Basin. Acta Ecol. Sin. 2023, 43, 8309–8320. [Google Scholar]
  44. Wu, K.; Kong, D.; An, C. Spatial-temporal evolution pattern and coordinated development of human-environment system resilience in the Yellow River Basin. J. Desert Res. 2023, 43, 246–257. [Google Scholar]
  45. Liu, H.; Sun, M.; Termer, G.; Alatan, A. Study on urban resilience assessment and optimization path in the Yellow River Basin. J. Inn. Mong. Minzu Univ. (Philos. Soc. Sci. Ed.) 2023, 49, 74–84. [Google Scholar]
  46. Zhao, Z.; Ru, S.; Xue, F. Spatio⁃temporal pattern and dynamic evolution of ecological resilience in the Yellow River Basin: Based on the analysis of emergy ecological footprint model. China Popul. Resour. Environ. 2024, 34, 136–147. [Google Scholar]
  47. Yang, H.; Hou, J.; Ma, C.; Yang, C.; Wang, Y. Spatio-temporal differentiation of the composite ecosystem resilience in the ecologically fragile area in the upper reaches of the Yellow River: A case study in Ningxia. Arid Zone Res. 2023, 40, 303–312. [Google Scholar]
  48. Huang, J.; Zhong, P.S.; Zhang, J.Z.; Zhang, L. Spatial-temporal differentiation and driving factors of ecological resilience in the Yellow River Basin, China. Ecol. Indic. 2023, 154, 110763. [Google Scholar] [CrossRef]
  49. Zhang, A.; Miao, C.; Chen, Z. Urban ecological resilience, social networks and its influencing factors in the Yellow River Basin. Arid. Land Geogr. 2024, 16, 3410. [Google Scholar]
  50. Yang, Z.; Cui, X.; Dong, Y.; Guan, J.; Wang, J.; Xi, Z.; Li, C. Spatio-temporal heterogeneity and influencing factors in the synergistic enhancement of urban ecological resilience: Evidence from the Yellow River Basin of China. Appl. Geogr. 2024, 173, 103459. [Google Scholar] [CrossRef]
  51. Zhang, M.; Ren, Y.; Zhou, L. Spatio-temporal evolution characteristics and influencing factors of urban ecological resilience in the Yellow River Basin. Arid Land Geogr. 2024, 47, 445–454. [Google Scholar]
  52. Li, J.Q.; He, W.J.; Jiang, E.H.; Qu, B.; Yuan, L.; Degefu, D.M.; Ramsey, T.S. Spatio-Temporal Evaluation of Water Resources System Resilience and Identification of Its Driving Factors in the Yellow River Basin. Water 2024, 16, 414. [Google Scholar] [CrossRef]
  53. Yuan, X.L.; Liu, R.; Huang, T. Analyzing Spatial-Temporal Patterns and Driving Mechanisms of Ecological Resilience Using the Driving Force-Pressure-State-Influence-Response and Environment-Economy-Society Model: A Case Study of 280 Cities in China. Systems 2024, 12, 24. [Google Scholar] [CrossRef]
  54. Choi, K. A complexity configurations of risk mitigants for supply chain country risk. Ann. Oper. Res. 2024, 25. [Google Scholar] [CrossRef]
  55. Cowell, M.; Cousins, T. Equity and the Chief Resilience Officer in the era of 100 Resilient Cities: A qualitative comparative analysis of US resilience strategies. Cities 2022, 131, 103946. [Google Scholar] [CrossRef]
  56. Tan, H.; Cai, R.; Du, J.; Hu, W. Climate change and marine ecosystems: Impacts, adaptation, and vulnerability. Trans. Atmos. Sci. 2022, 45, 489–501. [Google Scholar]
  57. Schlör, H.; Venghaus, S.; Märker, C.; Hake, J.F. Managing the resilience space of the German energy system—A vector analysis. J. Environ. Manag. 2018, 218, 527–539. [Google Scholar] [CrossRef]
  58. Li, R.; Chen, J.; Yang, X. Assessment and prediction of social-ecological system’s vulnerability based on optimized SVM model: A case study of the Qinling-Daba Mountains in southern Shaanxi. Acta Ecol. Sin. 2024, 476, 143682. [Google Scholar]
  59. Gao, W.; Song, Q.; Zhang, H.; Wang, S. Analysis of spatial and temporal changes and driving factors of ecological vulnerability in Sanjiangyuan Region. Ecol. Environ. Sci. 2024, 33, 1648–1660. [Google Scholar]
  60. Xi, L.; Feng, Y.; Qi, Z.; Cao, X.; Ding, J.; Cui, M. Risk assessment of desertification in Tarim Basim based on comprehensive evaluation index. Acta Ecol. Sin. 2025, 1–11. [Google Scholar]
  61. Zhang, L.; Zhou, D.; Fan, J.; Zhang, H.; Yue, X. Consistency analysis of the spatial distribution patterns and their drivers of the ecological vulnerability on the Loess Plateau. Acta Ecol. Sin. 2024, 1–10. [Google Scholar]
  62. Nguyen, Q.K.; Tong, H.T.; Nguyen, L.D.; Nguyen, T.N.T.; Ngo, T.D.; Hong Quang, N.; Dinh, A.T.; Pham, M.P. Landscape Dynamics and Environmental Fragility Zoning in Hinh River Basin: Insights for protecting natural ecosystems. One Ecosyst. 2024, 9, e134088. [Google Scholar] [CrossRef]
  63. Gupta, A.K.; Nandy, S.; Nath, A.J.; Mehta, D.; Pandey, R. Spatially Explicit climate change vulnerability assessment of ecological systems along altitudinal gradients in the Indian Himalayan region. Environ. Sustain. Indic. 2024, 22, 100377. [Google Scholar] [CrossRef]
  64. Raj, A.; Sharma, L.K. Spatial E-PSR modelling for ecological sensitivity assessment for arid rangeland resilience and management. Ecol. Model. 2023, 478, 110283. [Google Scholar] [CrossRef]
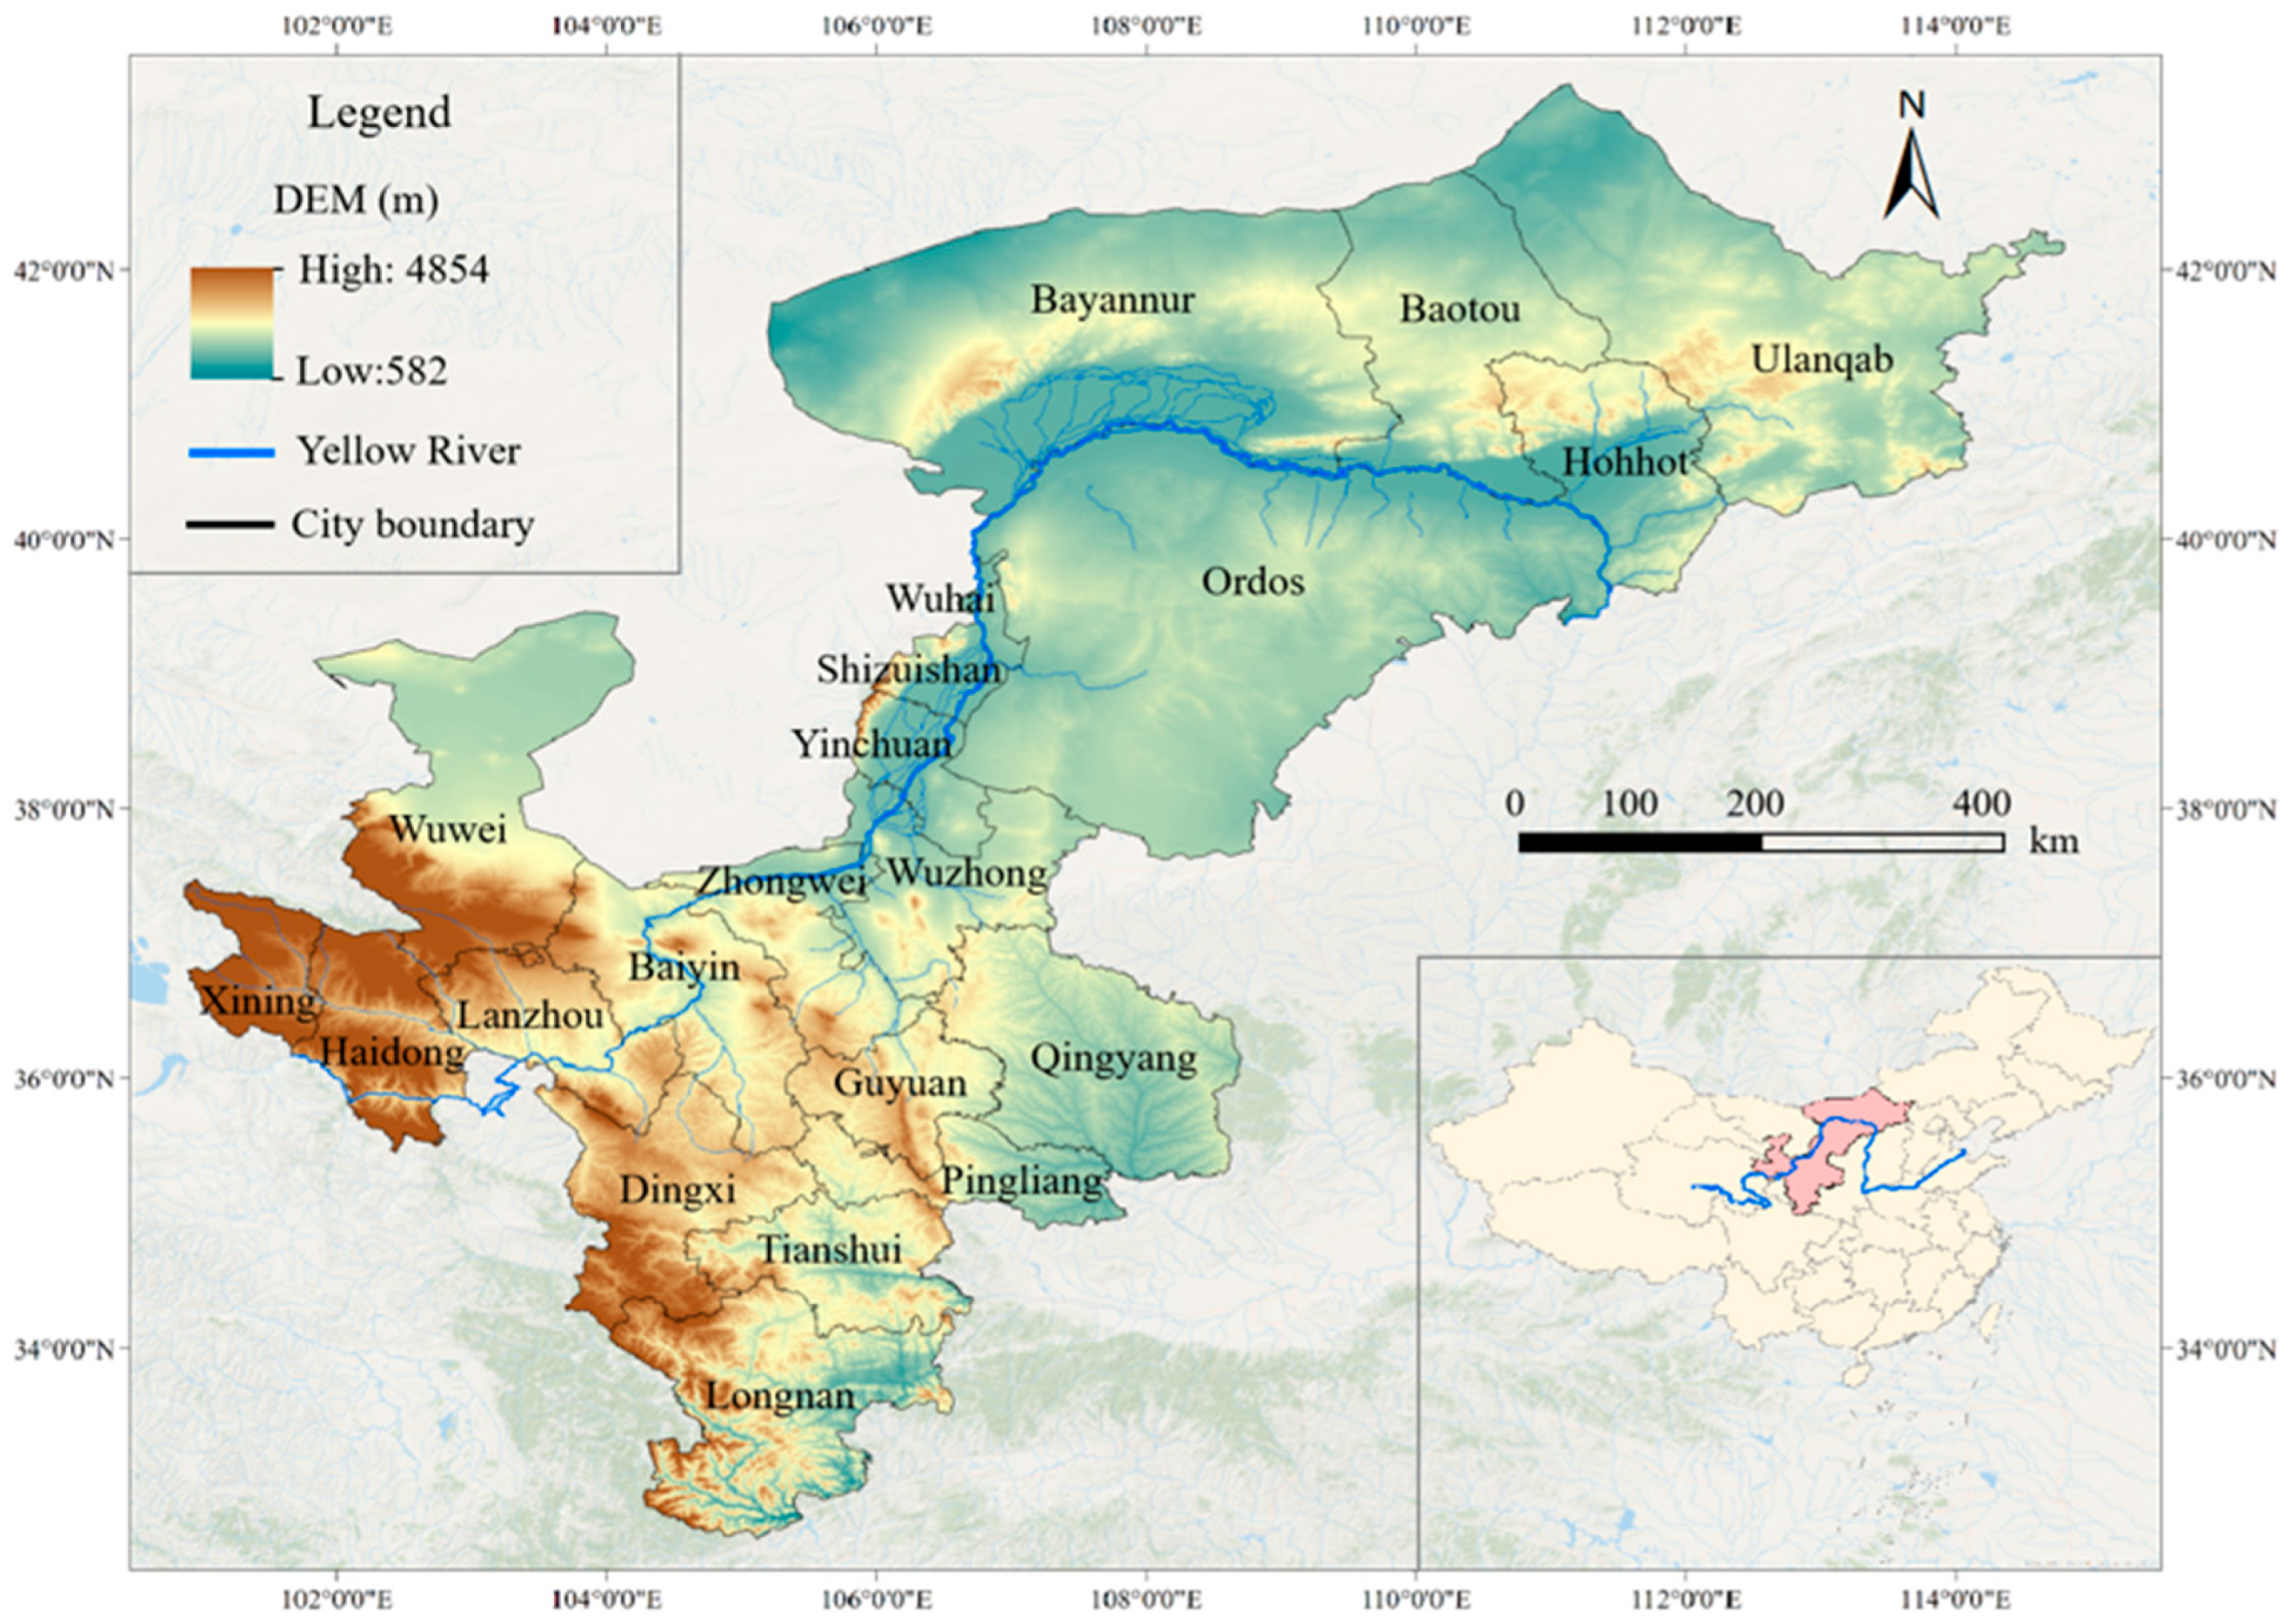
Figure 1. Study area. This map was based on the standard map with approval number GS (2022) 4309 by the Ministry of Natural Resources, China.
Sustainability 17 08719 g001
Figure 2. Methodological framework.
Sustainability 17 08719 g002
Figure 3. Three-dimensional space vector model.
Sustainability 17 08719 g003
Figure 4. RDI of the environment subsystem in the UYR from 2009 to 2022. (a) Temporal distribution of RDI. (b) Spatial distribution of RDI in different regions and cities.
Sustainability 17 08719 g004
Figure 5. RDI of the economy subsystem in the UYR from 2009 to 2022. (a) Temporal distribution of RDI. (b) Spatial distribution of RDI in different regions and cities.
Sustainability 17 08719 g005
Figure 6. RDI of the society subsystem in the UYR from 2009 to 2022. (a) Temporal distribution of RDI. (b) Spatial distribution of RDI in different regions and cities.
Sustainability 17 08719 g006
Figure 7. RDI of the composite system in the UYR.
Sustainability 17 08719 g007
Figure 8. Distribution of the composite system resilience level in the UYR from 2009 to 2022.
Sustainability 17 08719 g008
Figure 9. Configuration paths of inter-provincial high composite system resilience, 2009–2022.
Sustainability 17 08719 g009
Table 1. Resilience evaluation index system for composite system in the UYR.
Target LayerCriteria layerIndicator LayerIndicator Acquisition MethodUnitAttribute
Environment subsystem [A]Pressure [A1]Industrial wastewater discharge per unit of GDP [A11]Total industrial wastewater discharge/total GDPt/10,000 yuan
Industrial SO2 emissions per unit of GDP [A12]Total industrial SO2 emissions/total GDPt/10,000 yuan
Industrial smoke (dust) emissions per unit of GDP [A13]Total industrial smoke (dust) emissions/total GDPt/10,000 yuan
Water resources development and utilization [A14]Statistic data%
Water consumption per 10,000 GDP [A15]Total water use/total GDPm3/10,000 yuan
Endowment [A2]Greening coverage in built-up areas [A21]Statistic data%+
Green space per capita in parks [A22]Statistic datam2+
Per capita water resources [A23]Total water resources/year-end resident populationm3/person+
Protection [A3]Urban sewage treatment rate [A31]Statistic data%+
Harmless treatment rate of municipal household garbage [A32]Statistic data%+
Comprehensive utilization rate of general industrial solid waste [A33]Statistic data%+
Economy
subsystem [B]
Strength [B1]Per capita GDP [B11]Total GDP/year-end resident populationYuan/person+
Fixed asset investment per person [B12]Fixed asset investment/year-end resident populationYuan/person+
General budget per capita local fiscal budget revenue [B13]General budget local fiscal budget revenue/year-end resident populationYuan/person+
Structure [B2]Proportion of primary industry [B21]Statistic data%
Proportion of secondary industry [B22]Statistic data%+
Proportion of tertiary Industry [B23]Statistic data%+
Index of advanced industrial structure [B24]Value added of tertiary industry/value added of secondary industry-+
Efficiency [B3]Input–output ratio [B31]General budget local fiscal budget revenue/fixed asset investment%+
GDP rate of rise [B32]GDP growth/total GDP for the year%+
Society
subsystem [C]
Construction [C1]Drainage density in built-up areas [C11]Statistic datakm/km2+
Urban road space per capita [C12]Statistic datam2/person+
Density of population [C13]Statistic dataperson/km2+
Internet penetration rate [C14]Statistic data%+
Urbanization rate [C15]Statistic data%+
Quality [C2]Engel’s coefficient for urban households [C21]Statistic data%
Per capita living consumption expenditure of urban residents [C22]Statistic dataYuan/person+
Per capita disposable income of urban residents [C23]Statistic dataYuan/person+
Security [C3]Share of health care expenditure in fiscal expenditures [C31]Expenditure on healthcare/total fiscal expenditure%+
Share of social security and employment expenditures in fiscal expenditures [C32]Social security and employment expenditure/total fiscal expenditure%+
Social insurance coverage [C33](Health insurance for urban workers + pension insurance)/year-end resident population%+
Urban registered unemployment rate [C34]Statistic data%
Note: “+” represents a positive index, it indicates that the larger is the index value, the better is the composite system resilience. “−” represents a negative index, it indicates that the smaller is the index value, the better is the composite system resilience.
Table 2. Calibration and descriptive statistics.
Conditions and ResultsFuzzy Set CalibrationDescriptive Statistics
Completely Not AffiliatedIntersectionFully AffiliatedMean ValueStandard DeviationMaximum ValueMinimum Value
Resilience of EES composite system0.0050.0060.0060.0050.0010.0060.004
EP0.0080.0140.0280.0160.0080.0350.005
EE0.0080.0100.0100.0090.0010.0100.006
EPR0.0030.0090.0330.0140.0120.0560.003
ES0.0110.0140.0210.0210.0260.1350.010
EST0.0020.0040.0090.0050.0030.0150.002
EEF0.0150.0270.0450.0270.0130.0600.013
SC0.0080.0100.0200.0120.0040.0210.008
QL0.1560.1890.2730.2070.0440.2920.156
SS0.1380.1770.2600.1830.0380.2610.137
Table 3. Results of the single condition necessity analysis.
VariableConsistencyCoverageVariableConsistencyCoverage
EP0.6220.548~EP0.5820.590
EE0.7250.711~EE0.5150.466
EPR0.7590.662~EPR0.5210.533
ES0.6900.676~ESS0.5790.525
EST0.5820.733~EST0.4110.467
EEF0.6970.707~EEF0.6100.536
SC0.7020.741~SC0.5080.431
QL0.7690.717~QL0.5350.509
SSS0.7970.742~SS0.4680.446
Note: “~” denotes the logical operation “not”; it indicates that the independent variable does not exist or has a low degree of influence.
Disclaimer/Publisher’s Note: The statements, opinions and data contained in all publications are solely those of the individual author(s) and contributor(s) and not of MDPI and/or the editor(s). MDPI and/or the editor(s) disclaim responsibility for any injury to people or property resulting from any ideas, methods, instructions or products referred to in the content.