Article

Erosion-Based Classification of Mountainous Watersheds in Greece: A Geospatial Approach

by
Stefanos P. Stefanidis
1,*,
Nikolaos D. Proutsos
2,
Dimitris Tigkas
3 and
Chrysoula Chatzichristaki
4
1
Forest Research Institute, Hellenic Agricultural Organization “DIMITRA”, 57006 Thessaloniki, Greece
2
Institute of Mediterranean Forest Ecosystems, Hellenic Agricultural Organization “DIMITRA”, 11528 Athens, Greece
3
Centre for the Assessment of Natural Hazards and Proactive Planning & Laboratory of Reclamation Works and Water Resources Management, National Technical University of Athens, 15780 Athens, Greece
4
Independent Researcher, 56728 Thessaloniki, Greece
*
Author to whom correspondence should be addressed.
Sustainability 2025, 17(19), 8710; https://doi.org/10.3390/su17198710
Submission received: 1 September 2025 / Revised: 19 September 2025 / Accepted: 24 September 2025 / Published: 28 September 2025

Abstract

Soil erosion is a key factor in land degradation across Mediterranean mountain regions, yet comprehensive assessments at the national scale are still uncommon. In this study, the Erosion Potential Method (EPM, Gavrilović method) was applied to 1127 mountainous watersheds of Greece in order to classify their erosion severity through the erosion coefficient (Z). Information on relief, geology and vegetation was combined so that each watershed could be assigned to one of five erosion severity classes. The classification revealed that 53.2% of the watersheds fall into the slight category, while 26.0% are moderate and 16.3% are very slight. Severe cases account for 3.9%, and only 0.5% are classified as excessive, though these few basins are locally very important. The distribution is far from uniform: severe watersheds occur more often in North Peloponnese (EL02), Thessaly (EL08), and the Western Sterea Ellada (EL04). By contrast, Crete (EL13) and the Aegean Islands (EL14) include a relatively greater proportion of watersheds in the moderate category. This variation indicates that erosion risk should not be considered a uniform condition across the country. Even watersheds with low overall Z may contain steep or degraded slopes that act as local hotspots. Consequently, effective management should move beyond country-wide averages and instead focus on the sub-areas that are most exposed and susceptible to erosion.

1. Introduction

Mountainous watersheds are pivotal ecological and hydrological systems that affect both nature and human well-being. They play a key role in regulating the hydrological cycle by generating runoff and driving sediment transport [1]. As sources of sediment and water, mountainous watersheds provide a wide range of ecosystem services, including provisioning, regulating, and supporting cultural services [2,3,4]. Besides this, they affect the downstream regions substantially: the excess transport and deposition of sediments can lead to siltation of riverbeds, reservoirs, and agricultural lands, while uncontrolled runoff enhances flooding and threatens critical infrastructures [5,6,7]. Soil erosion also undermines biodiversity by removing fertile topsoil, degrading habitats for soil organisms, reducing vegetation regeneration, and fragmenting ecological corridors, which together weaken ecosystem resilience. This interplay highlights the necessity for comprehensive mountainous watershed management to increase the resilience of the local societies against natural disasters. Assessing erosion rates and prioritizing the most vulnerable regions is essential to selecting the appropriate mountainous watershed management strategy and scheduling the implementation of torrent control works [8,9].
Fieldwork to measure erosion rates is often resource-intensive and costly, particularly in remote and rugged terrains, making it impractical for large-scale assessments [10]. Numerous erosion prediction models have been developed and extensively reviewed in the literature [11,12,13]. Among the most widely applied models are the Universal Soil Loss Equation (USLE) [14] and its revised version (RUSLE) [15], the Water Erosion Prediction Project (WEPP) [16], the Morgan–Morgan–Finney (MMF) [17], the Erosion Productivity Impact Calculator (EPIC) [18], the Pan-European Erosion Risk Assessment (PESERA) [19] and the Erosion Potential Model (EPM), also known as Gavrilović method [20]. These models differ considerably concerning complexity, input data requirements, processes represented, their intended spatial and temporal scales, and the nature of the output information they provide [21,22]. All of them have advantages and limitations and the selection of one against the others depends on the data availability and the characteristics of the target area.
In the case of mountainous watersheds, the EPM model is acknowledged as a superior choice. This model was built using fieldwork conducted across mountainous watersheds throughout Serbia, supplemented by laboratory experiments to ensure robust parameterization under diverse conditions [20,23]. Additionally, the EPM model considers erosion processes, including soil slumps and gully erosion, alongside the sheet and rill erosion that the most widely used models address. This makes it especially useful to estimate erosion in mountainous regions where such processes are common. Therefore, several approaches based on the EPM model have been developed to prioritize mountainous watersheds for the implementation of combined technical and bioengineering works [9,24,25]. and similar methodologies have been successfully adapted in other Mediterranean and European contexts Furthermore, the model’s simple structure and low data requirements make it feasible to apply in large-scale assessments, and it has recently been used globally [26]. Also remarkable is the consistent performance of the EPM, as shown in several studies carried out in mountainous watersheds across Greece, compared to actual measurements of soil erosion [27,28,29].
Despite the significant advances in erosion modeling and watershed management techniques, there is still an acute need for approaches that can take into account peculiar characteristics typical of mountainous regions [22,30,31,32,33]. Greece is such a representative example, with steep topography and diverse climatic conditions. These mountainous watersheds are of prime importance for local biodiversity but also for providing the resources to support human activities through water supply, agriculture, and flood protection [34]—all of which are highly sensitive to intensification in agriculture, deforestation, and climate change impacts [35,36,37].
A comprehensive classification of those watersheds, informed by erosion severity, may be a basic ingredient in formulating targeted management strategies. These are also the areas where knowledge on the most erosion-prone areas should be applied so that due attention can be paid to measures for the enhancement of ecological integrity and strengthening social resilience. Application of state-of-the-art tools like Geographic Information Systems (GISs) and Earth Observation (EO) data to such assessments assure modernity, scaling up in tune with global moves in environmental management [38,39,40,41].
This study classifies Greece’s mountainous watersheds by erosion severity using the erosion coefficient (Z) from the Erosion Potential Model (EPM). We estimate Z from open-access Earth-observation datasets and implement the workflow with open-source GIS and cloud-computing tools. The approach is reproducible, cost-efficient, and scalable. At the national scale, the resulting maps reveal spatial heterogeneity in erosion severity and delineate priority catchments for intervention. These outputs support evidence-based planning and targeted management, enabling resources to be directed to watersheds with the highest erosion potential and thereby strengthening resilience to hydro-geomorphic hazards.
From a sustainability perspective, the categorization of mountainous watersheds serves as a crucial instrument for reconciling ecological integrity, water resource security, and socio-economic advancement. By pinpointing priority basins, strategies for erosion management can be more effectively synchronized with the United Nations Sustainable Development Goals (SDGs), specifically SDG 6 (Clean Water and Sanitation), SDG 13 (Climate Action), and SDG 15 (Life on Land). In this manner, the current study enhances not only scientific understanding but also aids in the establishment of sustainable governance of watersheds.

2. Materials and Methods

2.1. Study Area

In Southern Europe, on the Balkan Peninsula, Greece is one of the 27 European Union (EU) member states. It is characterized by complex relief, a mosaic of landscapes and Mediterranean-type climate with uneven distribution of precipitation, which favors the occurrence of floods and torrential phenomena [42]. Particularly, numerous torrential streams in Greece detach, transport and deposit approximately 86,000,000 m3 of sediments annually from mountainous to lowland areas. The continuous sediments removal leads to land degradation and the loss of fertility in the valuable forest soil, while deposition in lowlands causes siltation of the lowland riverbeds and flood control infrastructures, intensifying flooding [43].
This study was conducted in the mountainous watersheds across Greece included in the vector dataset provided by the Hellenic Ministry of Environment & Energy (MEEN), accessible at https://geodata.gov.gr/en/dataset/oreines-lekanes-aporroes-2es-taxes (accessed on 25 August 2025). This dataset was developed based on the torrent registry system of the forest service, which local authorities use as a foundation for managing mountainous watersheds. It includes 1127 mountainous watersheds, as illustrated in Figure 1.

2.2. Datasets and Data Acquisition

To accomplish the goals of the current research several, open-access geospatial datasets were acquired and processed. These datasets included satellite imagery, geological, geomorphological and land cover data. In terms of satellite data, the time-series of Sentinel 2 (S2) optical Level 2A (L2A) data from the European Space Agency (ESA) were used. The S2 images have 13 spectral bands with spatial resolutions ranging between 10 and 60 m and a revisit time of every five days. For the present analysis, only the 10 m (B2, B3, B4, B8) and 20 m (B11, B12) bands were used, as they are directly relevant for the vegetation and bare soil indices applied. The 60 m bands (B1, B9, B10), designed for atmospheric correction, were not employed. The 20 m bands were resampled to 10 m using bilinear interpolation, a standard Sentinel-2 preprocessing step that preserves radiometric integrity, with potential pixel-level effects minimized by aggregation at the watershed scale. Additionally, the L2A products are bottom-of-atmosphere (BOA) reflectance ortho-images that have undergone atmospheric correction. Time series of S2-L2A images, with cloud cover less than 10%, for the year 2023 (from 1 January 2023 to 31 December 2023) were retrieved via Google Earth Engine (GEE) cloud platform and a unified mosaic image was created from all individual images by calculating the average values. Also, all bands were resampled to 10 m spatial resolution. GEE provides access to EO datasets through its web-based JavaScript Code Editor (IDE), with a Python API also available for external environments such as Jupyter and Google Colab. [44]. The large volume of available data, and the high processing power, make GEE a fast and robust tool for spatiotemporal environmental monitoring [45,46].
The geological composition of the study, particularly the parent material, was determined using the national scale soil map of Greece [47], provided by MEEN, which is accessible in vector format at http://mapsportal.ypen.gr/maps/289 (accessed on 25 August 2025). The newly developed Forest and Buildings Removed DEM (FABDEM), with a 30 m spatial resolution, was utilized to represent the geomorphological attributes of the watersheds. FABDEM is accessible, in raster format, at https://data.bris.ac.uk/data/dataset/s5hqmjcdj8yo2ibzi9b4ew3sn (accessed on 25 August 2025). It is a global elevation model that employs machine learning techniques to minimize biases caused by building and tree heights in the Copernicus GLO-30 DEM [48]. This makes FABDEM the preferable choice, particularly in densely vegetated areas, with evident advantages over other open-access DEM products with similar resolution [49]. As a result, researchers suggest the application of FABDEM in forested mountain watersheds to increase its utility as an up-to-date data source for reliable and accurate topographic analysis [50]. Land cover data were finally extracted from the CORINE dataset (CLC18), provided by the Copernicus Land Monitoring Service, available at https://land.copernicus.eu/pan-european/corine-land-cover (accessed on 25 August 2025).
Overall, we used authoritative national datasets and widely validated global products (e.g., Copernicus, FABDEM), whose accuracy is documented in provider metadata. To ensure consistency, all layers were harmonized in a common projection and visually inspected for geometric alignment.

2.3. EPM Erosion Coefficient

The erosion severity was assessed using the erosion coefficient (Z), a key component of the EPM [20,23,24], given by the equation below:
Z = x × y φ + J
where x reflects the protective influence of land cover, y represents the resistance of soils to erosion, J is the average slope of the watershed (m/m) and φ coefficient quantifies the type and the extent of the erosion process. Detailed descriptions of the value ranges for each of the aforementioned coefficients (x, y and φ) established in the original study by Gavrilović [20] and can be found elsewhere in the literature [26,51,52]. The x coefficient ranges from 0.05 to 1.0, with higher values indicating low vegetation cover and poor soil protection. The y coefficient varies from 0.25 to 2.0, where lower values correspond to more resistance soils, less prone to erosion. Regarding the φ coefficient, its value ranges from 0.1 to 1.0, with higher values indicating more intense erosion processes and sediment sources existence in the watersheds.
According to the literature, Z coefficient values were grouped into erosion severity classes, as shown in Table 1, following established applications of the EPM in Mediterranean and European contexts [24,26].

2.4. Methodology Workflow

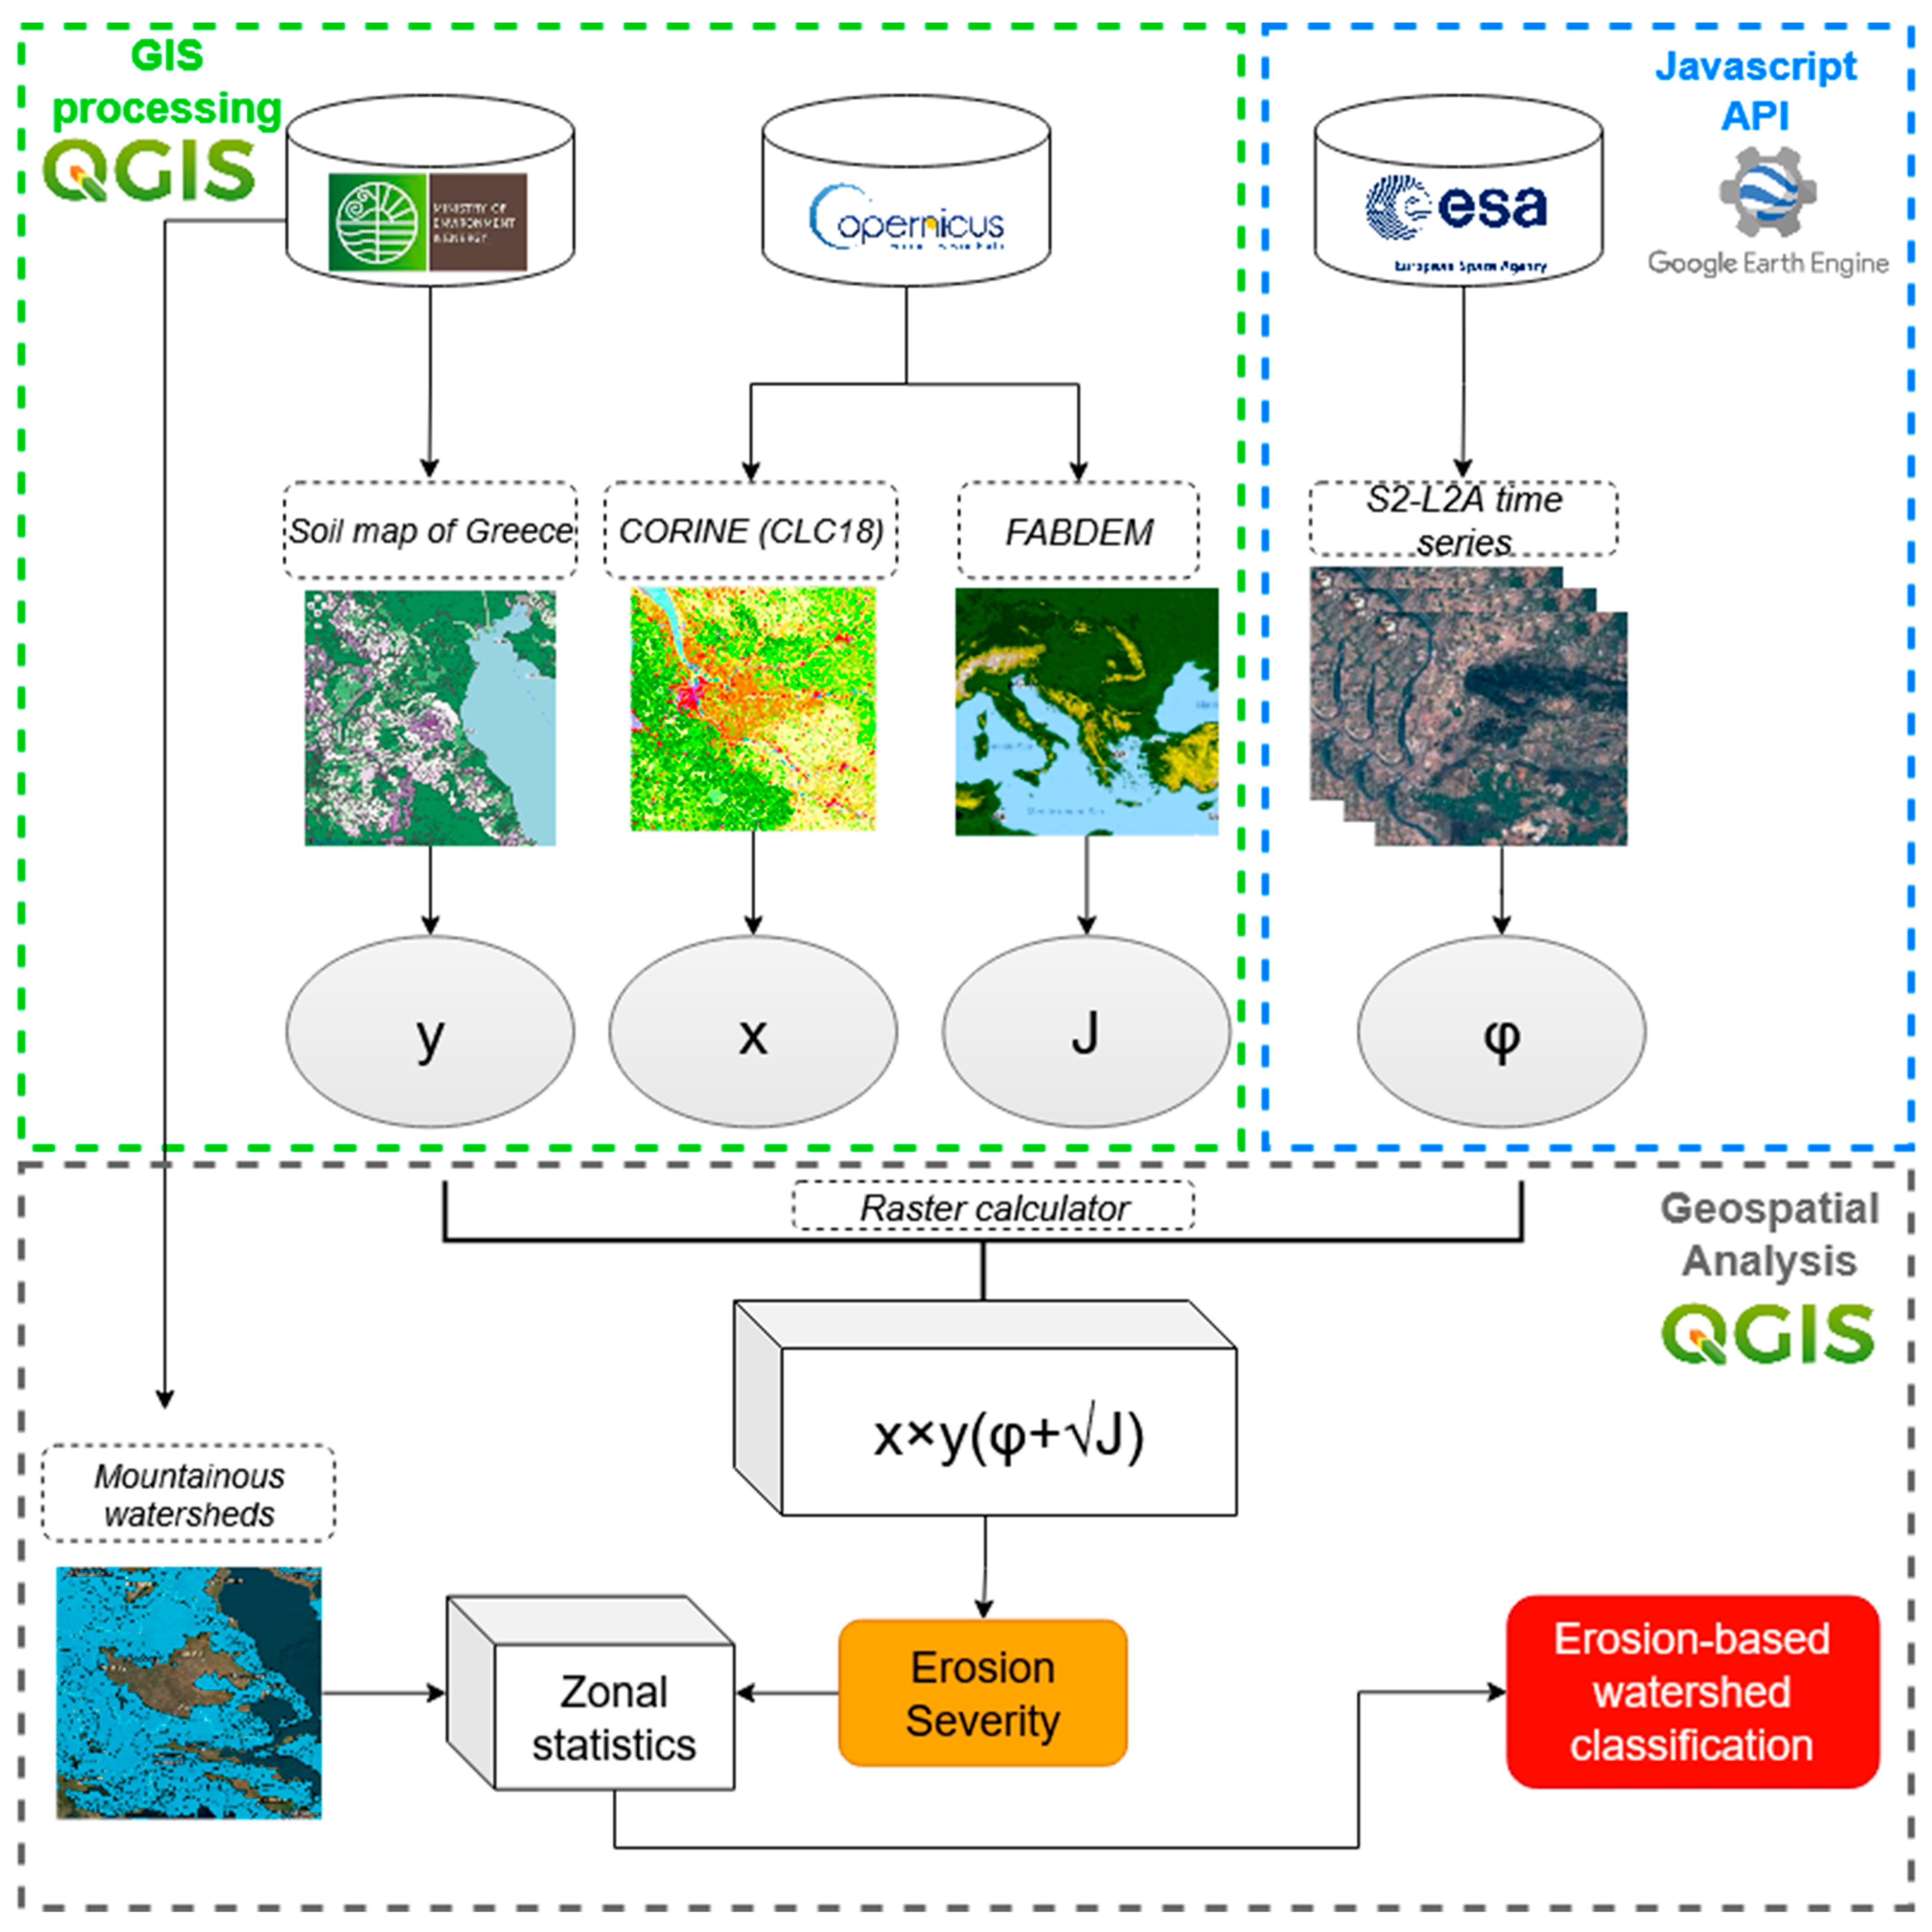
The methodology integrates GIS processing, cloud computing, and geospatial analysis into a comprehensive framework for classifying watersheds based on erosion severity. The approach follows a structured sequence consisting of (i) data preprocessing and integration, (ii) erosion coefficient computation, and (iii) classification with spatial analysis, ensuring reproducibility and computational efficiency. All geospatial data were processed using QGIS 3.22, while Sentinel-2 Level 2A (S2-L2A) time-series imagery was retrieved and analyzed using JavaScript code executed in Google Earth Engine (GEE).
The datasets were organized into GIS thematic layers. To maintain consistency and ensure compatibility across analyses, all layers were reprojected into the Lambert Azimuthal Equal Area (LAEA) projection (EPSG: 3035), based on the European Terrestrial Reference System 1989 (ETRS89).
Following data preparation, the erosion coefficient (Z) is computed as described in the EPM model, integrating multiple geospatial parameters. In order to determine the x coefficient, a specific value was assigned to each CLC-level 3 class based on the proposed values found in relative studies [53,54,55], following published EPM look-up schemes for Mediterranean conditions. The y factor was determined based on research on the erodibility of rock formations and the type and intensity of torrential phenomena they exhibit [56], combined with proposed values for each petrographic formation in the context of the model’s application to Greek conditions [54,57], and consistent with prior Greek and Balkan EPM applications. As for the J, it is directly calculated from the DEM.
The φ coefficient has traditionally been estimated through field observations and was the only empirically derived factor in the EPM model, which is why De Vente and Poesen [21] characterized it as semi-quantitative erosion prediction model. However, recent studies suggested the use of remote sensing techniques to estimate the φ coefficient [57,58]. In this study, φ was estimated from BSI values after min–max normalization, consistent with recent remote-sensing-based EPM studies [59,60]. More specifically, spectral indices derived from satellite imagery, such as the Bare Soil Index (BSI), which was found to have a strong correlation with φ values obtained from field observations. The mathematical expression of the index is presented below [60].
B S I = S W I R + R E D N I R + B L U E S W I R + R E D + N I R + B L U E
This index utilizes blue (BLUE), red (RED), near-infrared (NIR), and shortwave infrared (SWIR) spectral bands. The RED and SWIR bands reflect soil composition, while the BLUE and NIR bands represent vegetation presence. The BSI value ranges from −1 to +1, with positive values indicating a higher presence of bare soil and impervious surfaces. Conversely, negative values signify the presence of vegetation and porous surfaces. In this study the BSI was computed from S2-L2A images. Since BSI values range from −1 to 1, normalization is required to align with the original φ coefficient values range. Therefore, the following equation was used, as proposed by Polovina et al. [59]:
φ = B S I B S I m i n B S I max   B S I min
where BSI is the index value in each pixel, BSImin is a value representing vegetation in the BSI layer, and BSImax is a value representing bare soil.
Within the GIS environment, the aforementioned coefficients were multiplied using the Raster Calculator tool in QGIS, which enables raster-based arithmetic operations. Once erosion severity values were obtained, watersheds were classified into five erosion severity categories using zonal statistics to aggregate raster-based erosion values within each watershed boundary. A visual representation of the methodology workflow is provided in Figure 2.

3. Results

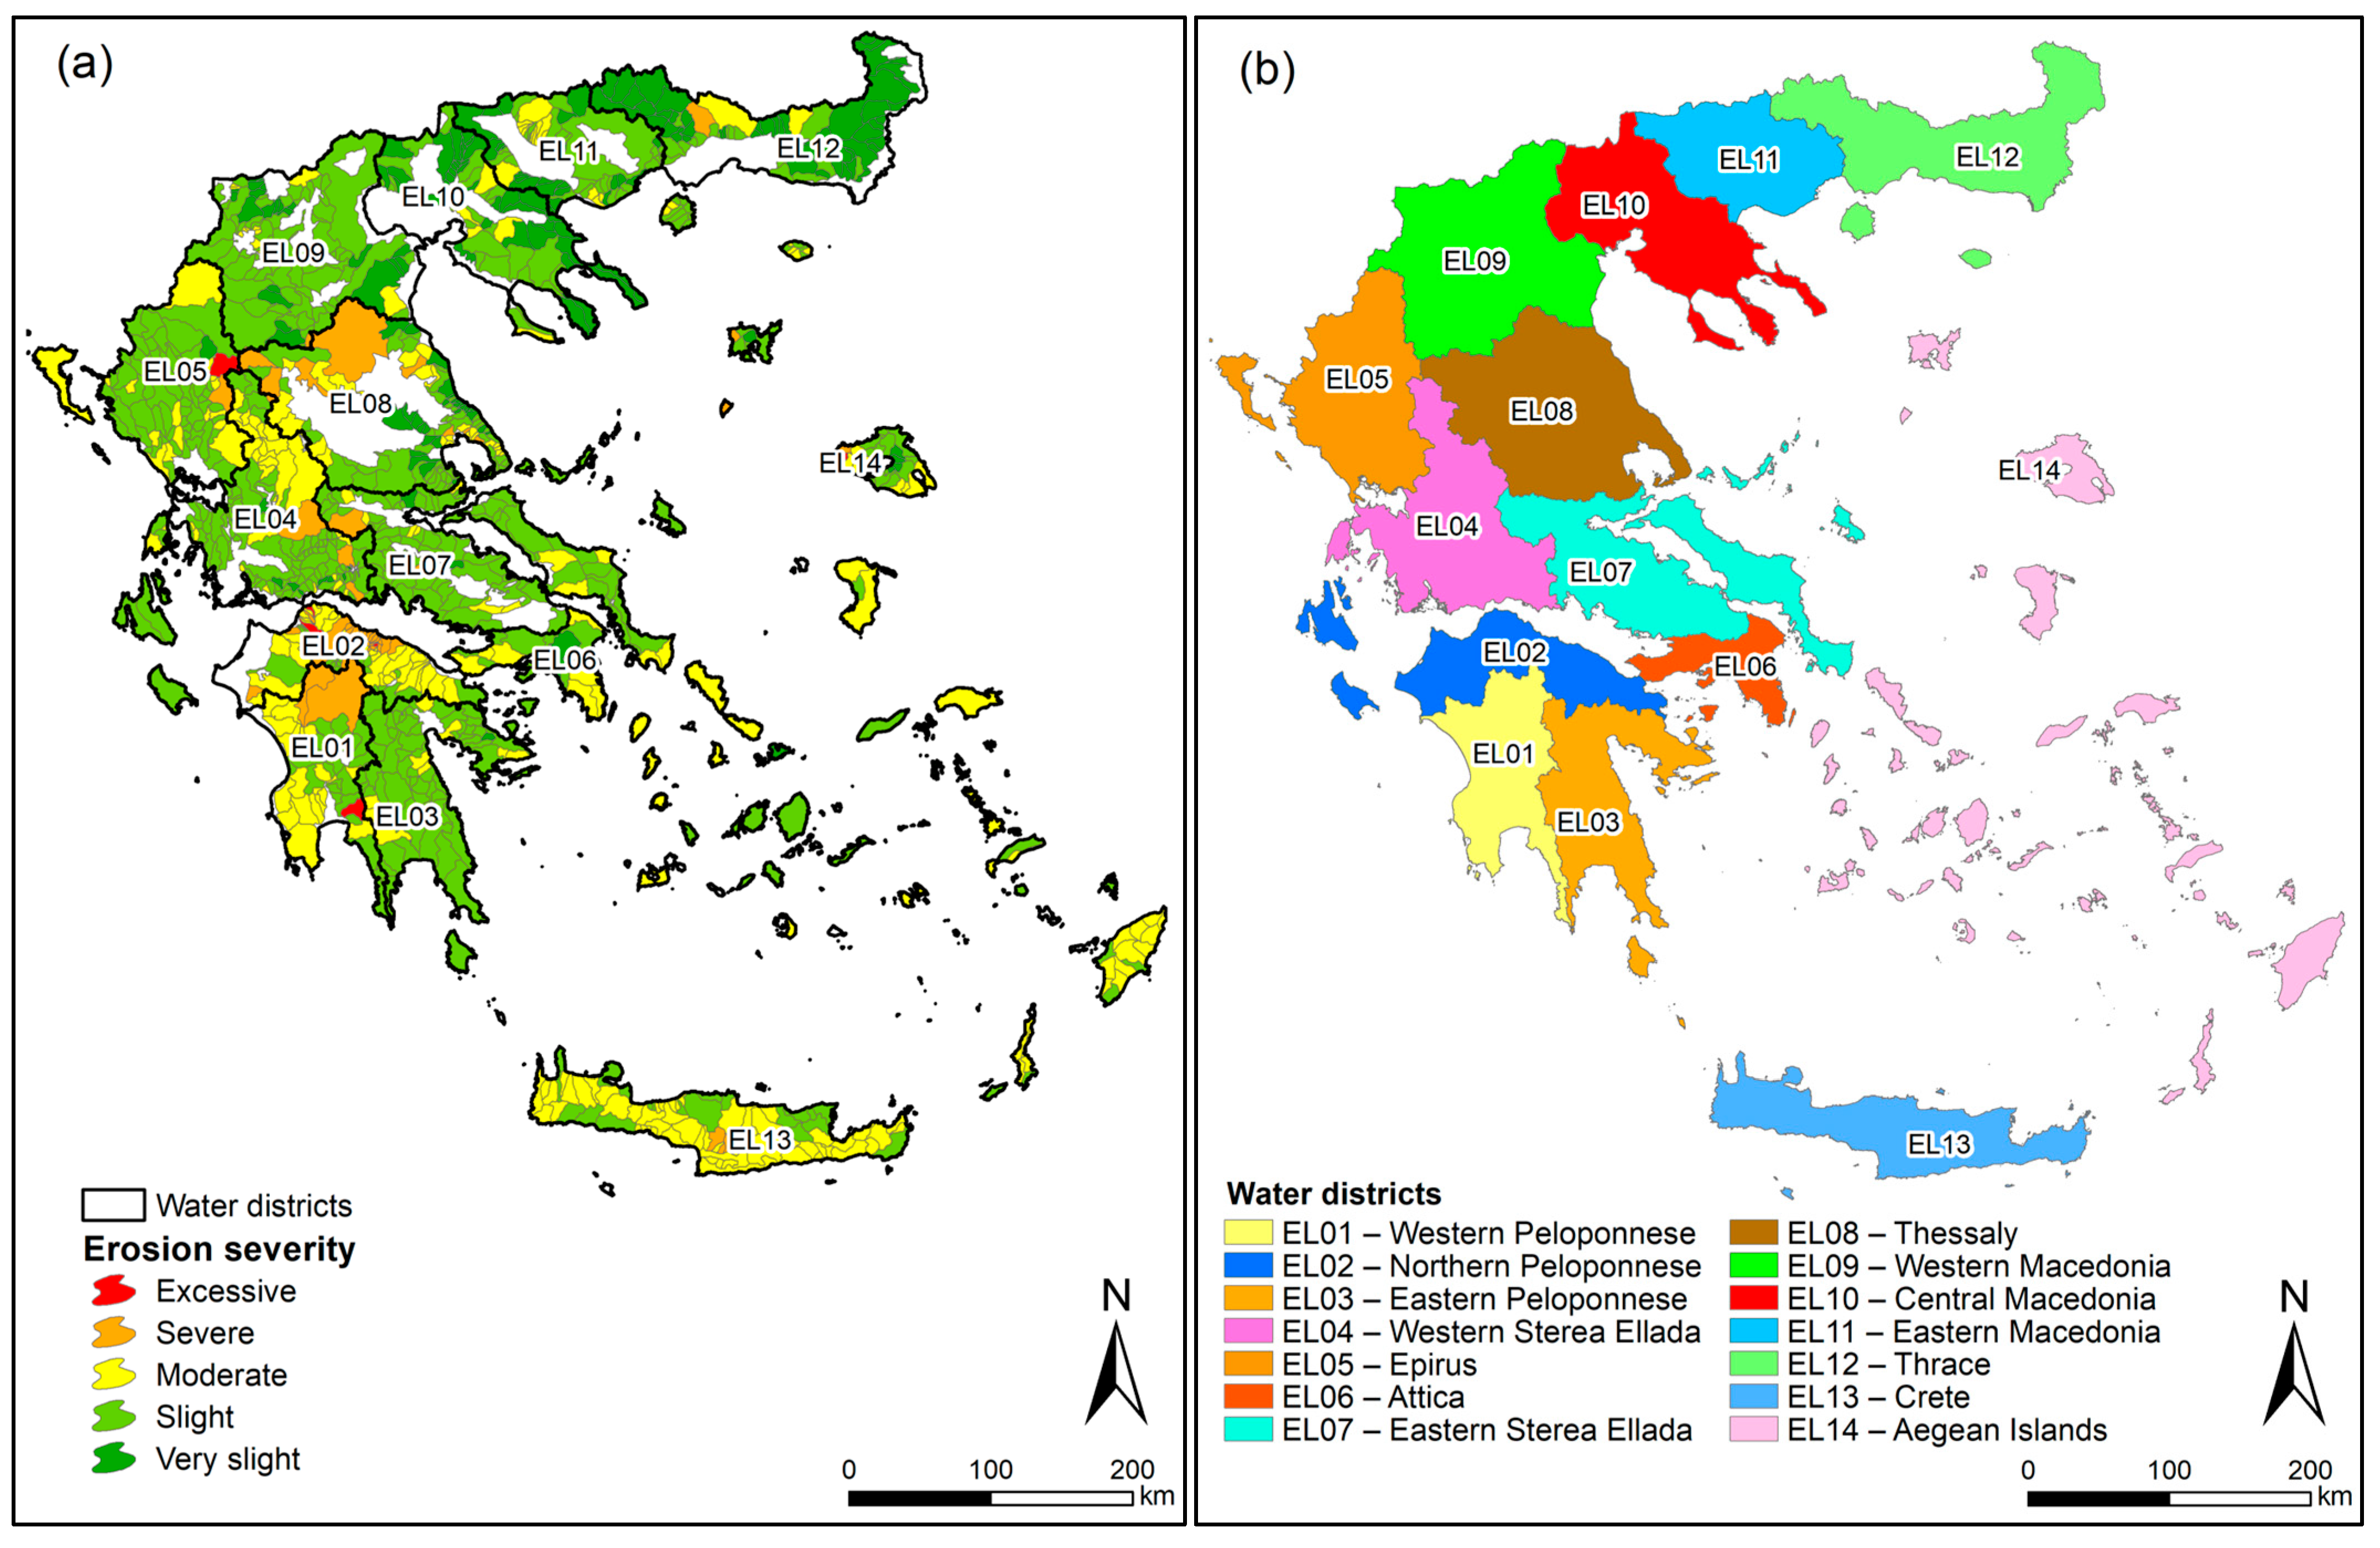
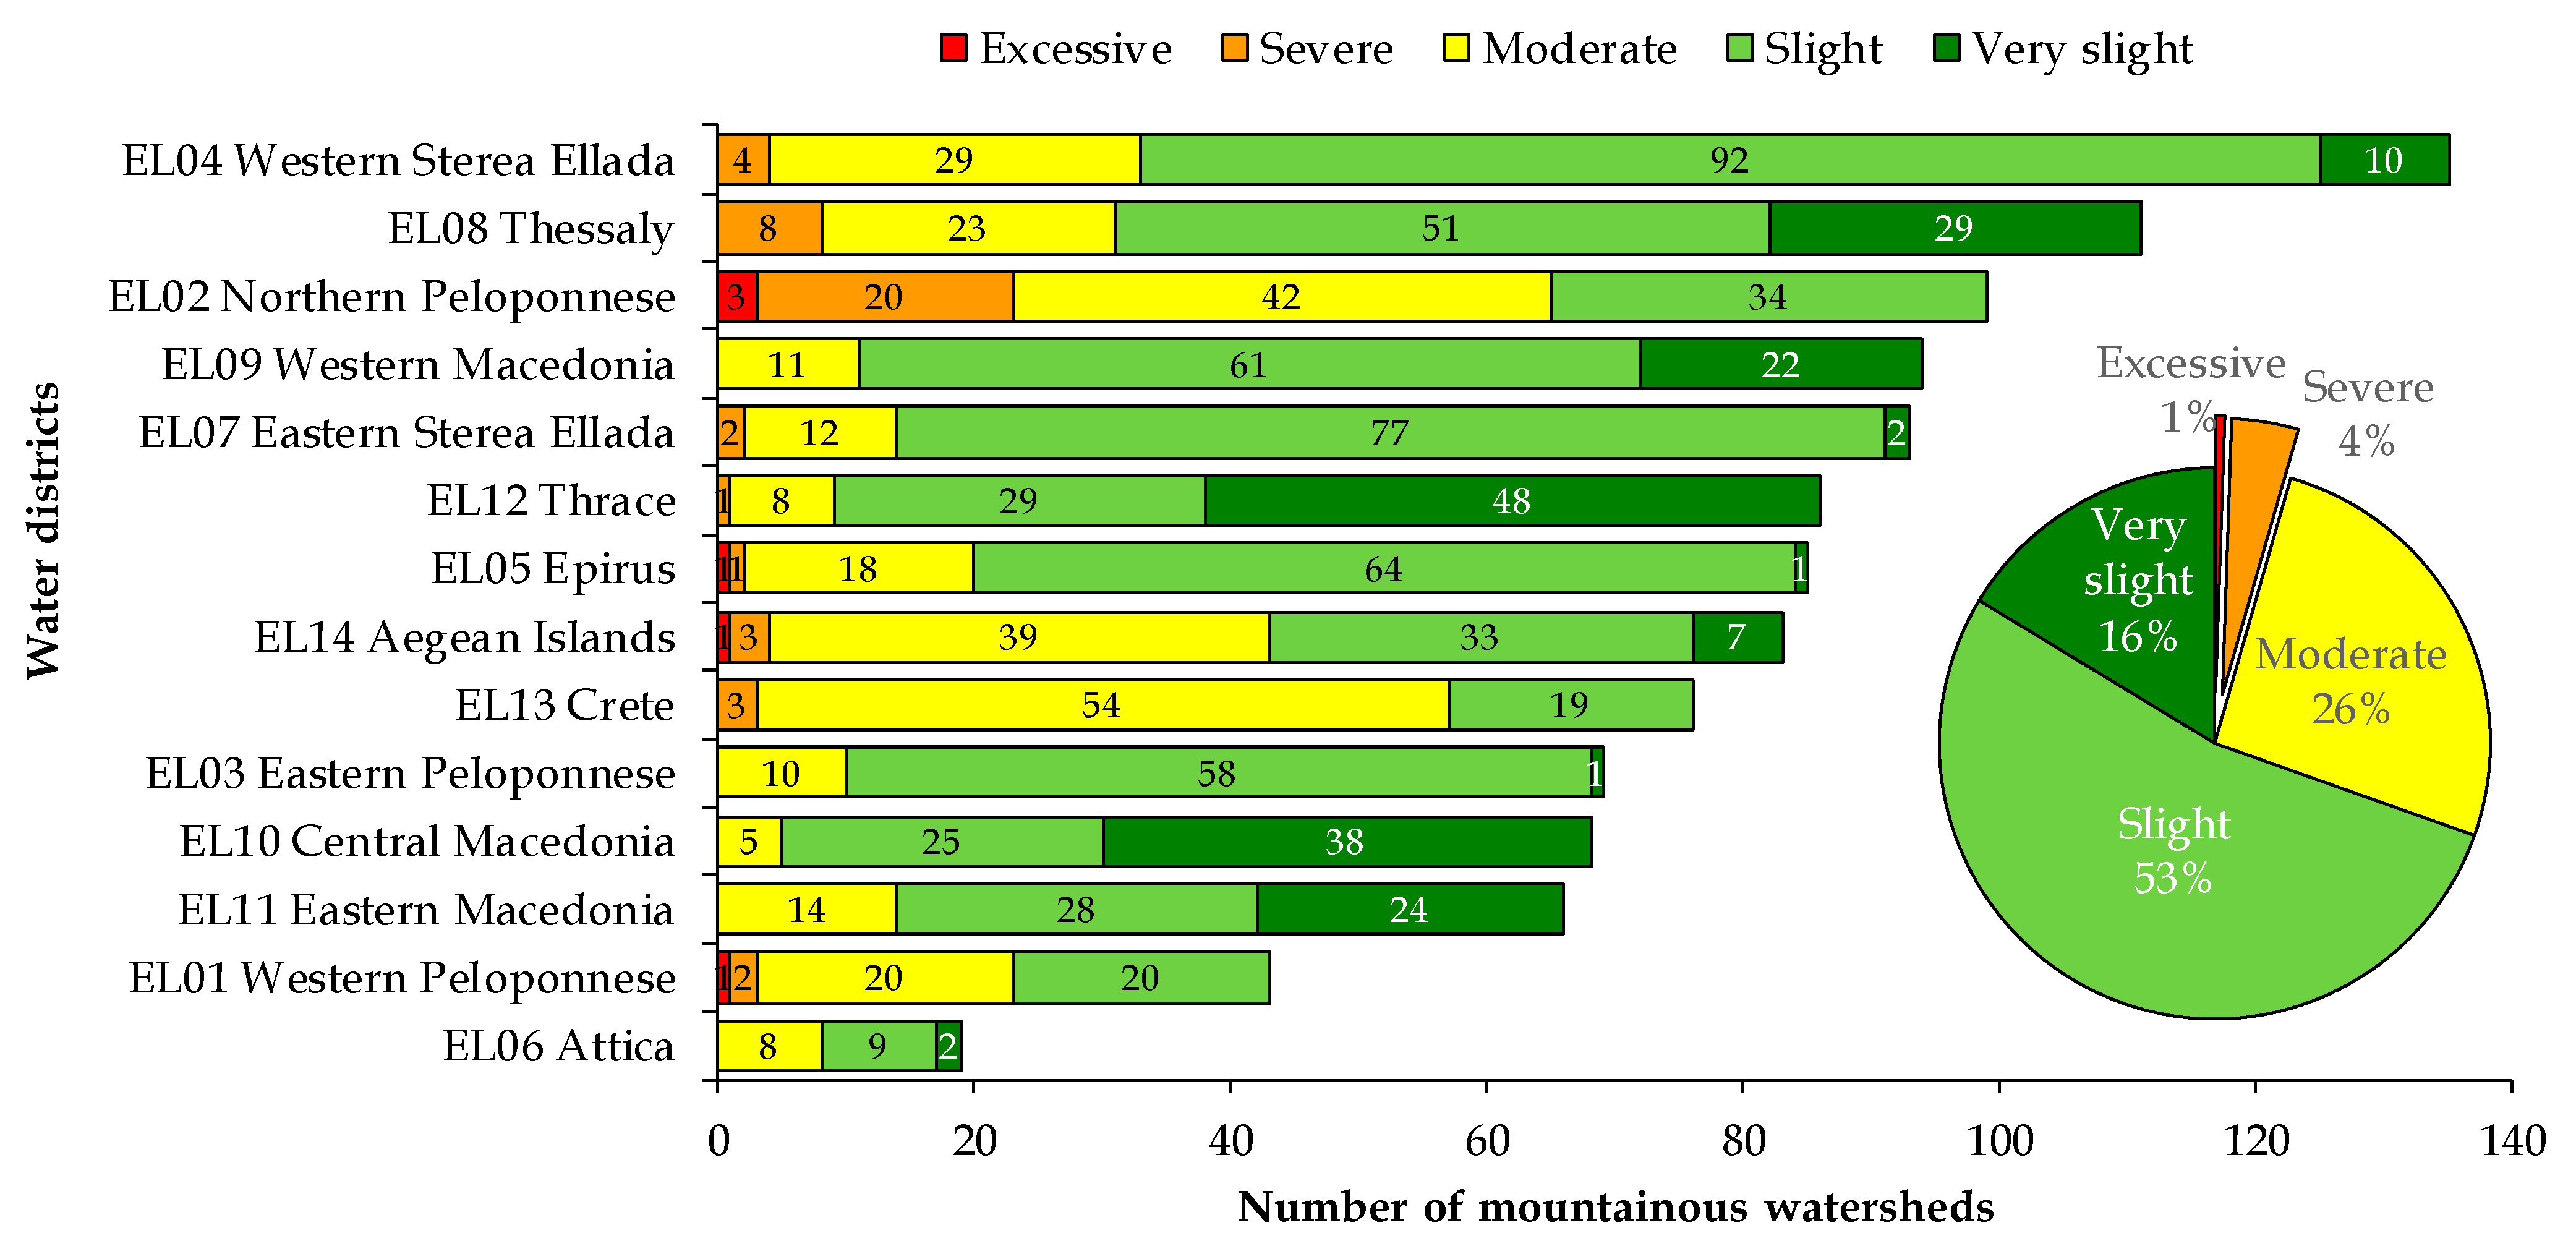
The erosion coefficient (Z) was calculated for 1127 mountainous watersheds across Greece, each of which was assigned to one of five severity categories. At the national scale, more than half of the watersheds (53.2%) were classified as slight. Approximately one quarter (26.0%) fell into the moderate category, while 16.3% were grouped as very slight. Only a small fraction appeared at the higher end of the spectrum: 3.9% were severe and just 0.5% were excessive. The water districts with the highest numbers of watersheds in the severe and excessive categories are North Peloponnese (EL02; 20 severe), Thessaly (EL08; 8 severe), and Western Sterea Ellada (EL04; 4 severe). Excessive cases are rare, confined to the Aegean Islands (EL14), Epirus (EL05), North Peloponnese (EL02), and Western Peloponnese (EL01). This distribution shows that although low erosion risk is dominant at the national scale, specific regions contain watersheds where soil degradation is a critical concern (Figure 3).
The spatial distribution of erosion classes varied markedly among Greece’s official water districts (EL01–EL14). These districts represent the national hydrological division used for river basin management, as established under the EU Water Framework Directive (2000/60/EC) and the Floods Directive (2007/60/EC). This framework provides a consistent spatial reference for environmental assessment and ensures comparability across European countries. Overall, in Greece, most of the mountainous watershed (approximately 69%) are characterized by slight or very slight risk for erosion. However, a high percentage of about 26% is categorized in the moderate erosion risk class and 5% in the excessive and severe classes. This general pattern presents high variability among the country’s water districts, highlighting the need for locally tailored water resources management planning and actions. In Western Peloponnese (EL01), watersheds were relatively evenly distributed between the slight and moderate categories, whereas in North Peloponnese (EL02), several severe and even excessive cases were identified. Eastern Peloponnese (EL03) was dominated by slight erosion risk, while Western Sterea Ellada (EL04) showed a strong prevalence of slight watersheds (68.1%). Epirus (EL05) was also mainly slight, although isolated excessive cases were recorded. In Attica (EL06), moderate erosion was relatively common, while Eastern Sterea Ellada (EL07) exhibited one of the highest concentrations of slight watersheds. Thessaly (EL08) displayed a more balanced distribution, with substantial proportions of both moderate and very slight categories. Western Macedonia (EL09) was dominated by slight and very slight watersheds, in contrast to Eastern Macedonia (EL11), where severe cases were more frequent. Central Macedonia (EL10) showed stable conditions with most watersheds being slight or moderate. Thrace (EL12) was overwhelmingly slight or very slight, while Crete (EL13) stood out, with more than 70% of its watersheds in the moderate category. Finally, the Aegean Islands (EL14) displayed nearly half of their watersheds in the moderate class, together with a few severe and excessive cases. Although most districts were dominated by slight to moderate erosion risk, North Peloponnese (EL02), Thessaly (EL08), and the Western Sterea Ellada (EL04) stand out with a concentration of watersheds in the severe category. The few excessive cases are confined to only four districts, underlining their localized but high-priority nature. These regional contrasts illustrate how geomorphology and land cover strongly condition the water districts in the Greek territory. These inter-district contrasts are consistent with first-order biophysical controls: steeper terrain and erodible substrates with patchy vegetation and intense rainfall events tend to shift Z upward, whereas forested or gently sloping districts remain in lower classes. This indicates that erosion severity reflects inherent environmental differences and should be addressed at the water-district scale. The distribution of all mountainous watersheds in Greece per water district and class of erosion severity is presented in Figure 4.
Further insights are gained by examining watershed attributes (Figure 5). Steepness is strongly associated with higher erosion risk: watersheds with pronounced slopes frequently fall into the moderate and severe categories, while low-relief catchments rarely exceed slight erosion. Elevation shows a related trend, with high-mountain watersheds in Crete (EL13) and the Pindus range (primarily in EL05, EL08, EL09) often reaching moderate severity due to their steep relief and intense precipitation regimes. Forest cover exerts the opposite influence, acting as a mitigating factor. Densely forested watersheds are overwhelmingly slight or very slight, while sparsely vegetated catchments are much more likely to appear in the moderate or severe classes. These associations confirm that the Z classification reflects real biophysical control rather than random variation.
A key observation is that the mean Z value at the watershed scale often conceals significant internal variability. Watersheds classified as moderate may include sub-areas where steep and degraded slopes reach erosion levels equivalent to the severe class, while neighbouring valleys or forested zones remain slight. Even in watersheds classified as severe, small patches of stability are present, often corresponding to reforested sectors or flatter terraces.
To better illustrate the internal variability of erosion severity within individual watersheds, three representative cases were selected, each belonging to a different severity class. This approach allows us to move beyond national or regional averages and to show how the spatial distribution of erosion risk unfolds in contrasting geomorphological and socio-environmental contexts.
The Anthemountas watershed in Central Macedonia (EL10) belongs to the slight class. It lies to the east of Thessaloniki, an area that has seen both farming and rapid suburban growth in recent decades. Despite these pressures, the watershed is still largely stable. Forest cover and the character of the terrain help to limit erosion, and only small pockets appear more vulnerable. The second example is the Sarantapotamos watershed in Attica (EL06), which is classified as moderate. This watershed is found in western Attica, not far from Athens. Here, cultivated fields sit next to patches of natural vegetation. The mixture produces a more uneven pattern: some areas remain stable, while others are prone to erosion. The moderate status reflects both this fragmented land cover and the accumulated impact of long-term human use. The third case is the Titarisios watershed in Thessaly (EL08), placed in the severe category. This watershed became widely known after Storm Daniel in September 2023, one of the most damaging flood events in Greece. Heavy rain during the storm mobilized large amounts of sediment, which added to downstream destruction. The example of Titarisios shows how fragile geology and sparse vegetation combine to create large zones of high erosion risk, and how these zones can turn into real hazards under extreme weather. Figure 6 presents the spatial distribution of erosion severity for the three watersheds, highlighting the contrasts that are concealed when only an average Z value is considered.
These case studies illustrate why it is important to examine the erosion hotspots inside each watershed rather than relying only on a single average value. Watersheds assigned to the same severity class can differ substantially in their internal composition, with some sectors remaining stable while others are highly erodible. Showing the spatial distribution of erosion severity makes this variability visible and stresses that erosion risk should not be treated as uniform. From a management perspective, such evidence points to the need for interventions directed at the specific sub-areas where erosion is most acute, instead of applying the same measures across an entire watershed.

4. Discussion

The erosion potential method (EPM, Gavrilović method) remains a validated semi-quantitative tool for assessing soil erosion risk in mountainous watersheds. Its capacity to integrate relief, substrate, vegetation, and process components into a single index (Z) has led to extensive use throughout the Mediterranean and beyond, demonstrating both scientific value and practical management relevance [20,23,26]. At the same time, international applications have shown important sensitivity, particularly with respect to land-cover and erodibility parameters, which call for careful calibration [26] and highlight the risk of under- or over-estimation in cold or arid environments [46]. Operationally, this enables targeted nature-based and engineering interventions where they yield the highest marginal sustainability benefits (e.g., sediment retention, water quality protection, and risk reduction), while avoiding uniform measures that provide limited returns.
Recent developments in remote sensing and cloud-based platforms have broadened the applicability of the method. For example, the φ coefficient—traditionally estimated through expert judgment—can now be derived from indices such as the Bare Soil Index on Landsat imagery within Google Earth Engine, reaching good accuracy (OA ~86%, κ ~0.82) and demonstrating practical scalability [59]. More generally, remote sensing tools now allow multi-temporal and large-area mapping of erosion patterns, drawing on optical, radar, and UAV data to generate consistent model inputs [61].
At the national scale, the classification of erosion severity across Greece’s 1127 mountainous watersheds provides an essential baseline for ecological analysis and for planning purposes. The results are fully compatible with the structure of the EU Water Framework Directive and the Floods Directive (2000/60/EC, 2007/60/EC), as they are organized according to official water districts (EL01–EL14). This compatibility makes it possible to embed erosion maps directly into strategic responses to erosion-driven flood risk. The observed discrepancies among water districts can be attributed to contrasts in the relief, lithology, vegetation cover, and rainfall regime. Such findings highlight the importance of tailoring erosion management strategies to the specific characteristics of each water district rather than applying uniform measures.
Equally important is the link with Greece’s Flood Risk Management Plans (FRMPs), which already include torrent-control maintenance, land-use regulation in erosion-prone basins, and the promotion of natural water retention measures (NWRM). Measures such as EL_08_35_03 (maintenance of torrent-control works), EL_08_35_04 (land-use management in torrent watersheds), and EL_08_31_08 (promotion of NWRM) can be prioritized and funded more effectively when supported by spatially explicit Z maps [62,63,64]. In this way, the research moves beyond academic mapping and provides a practical instrument for policy alignment and EU co-funding eligibility.
Translating severity classes into indicative interventions provides practical guidance for implementation. Very slight and slight erosion areas may be managed with routine maintenance, grazing management, and vegetative cover preservation. Moderate areas can benefit from nature-based measures such as contour hedgerows, riparian buffers, and check-dam maintenance. Severe and excessive areas require combined bioengineering and torrent-control works, including grade-control dams, gully head stabilization, bank protection, and targeted reforestation of unstable slopes. In Greece, such measures have traditionally included bioengineering practices such as live fascines and brush layering, applied in line with the French Forest-Technical Torrent Control System which has been successfully implemented in mountainous watersheds [65]. Comparable strategies are widely implemented across Mediterranean countries, notably in Spain and Italy, where watershed programmes combine reforestation and land-use regulation with terracing, agroforestry, riparian buffers and small check-dams. This alignment indicates that the measures we recommend are already established as good practice under Mediterranean conditions and are here adapted to Greece’s geomorphology and planning framework.
Nevertheless, some limitations remain. The semi-empirical character of the EPM means that certain processes—such as sediment storage, connectivity, and temporal dynamics—are not fully captured. Validation against measured sediment yields is rare in Greece, which means that the national-scale classification should be interpreted with caution. Future studies should therefore compare EPM results with other models, such as USLE-based frameworks or connectivity indices, while also incorporating observed data [26,46,59], as has been demonstrated in recent applications of RUSLE validated against sediment yield [66]. In addition, vegetation changes after fire, shifts in land use, or other rapid transformations should be integrated more regularly through updated remote sensing products [55,57]. In addition, the EPM does not account for sediment routing and deposition, and its outputs are sensitive to the categorical representation of land cover and lithology. While the use of authoritative datasets reduces uncertainty, the lack of long-term monitoring data at national scale limits direct validation. Future studies should therefore aim at coupling EPM with process-based soil erosion models and validating predictions against field measurements in representative Greek watersheds.
Looking ahead, combining repeatable vegetation and φ monitoring with the FRMP portfolio of measures could turn Z-based assessments into a dynamic decision-support tool. This is especially relevant in Mediterranean regions, where short but intense storms can mobilize large volumes of sediment from steep terrain and trigger downstream flooding. By combining these techniques with existing machine learning technologies, including multi-sensor data fusion, it is possible to delineate finer scales of soil processes and to enhance the erosive predictive potential of erosion mapping. Climate change in this sense could exacerbate erosion through severe rainfall and wildfire disturbances, extending sediment-source areas and decreasing protection by vegetation. These cascading effects highlight the need for remeasurement of the φ parameter, along with vegetation data, after severe disturbances so that the structure can be adjusted to changeable climatic pressures.
Overall, the erosion atlas prepared in this study should be viewed not only as a research outcome but also as a working tool. It may prove useful for policymakers making funding decisions, for establishing stronger relationships between local management activities and Europe’s plans, and for preparing simpler and easier-to-implement monitoring systems. Seen from this angle, erosion control becomes part of a wider policy framework, reinforcing actions against land degradation while giving Greece a stronger basis to respond to future climatic challenges. In parallel, community engagement can reinforce erosion management efforts. Awareness campaigns, participatory workshops, and the inclusion of local knowledge are valuable strategies to raise awareness and foster acceptance of preventive measures at the watershed scale. Effectiveness of these measures can be determined by repeated observation of Earth Observation indicators, such as vegetation indices and changes in land cover, combined with national hydrological and soil monitoring networks. Monitoring allows for the determination of watershed conditions over the long term and provides a reliable basis for comparing the success of employed erosion-control measures. Beside the environmental benefits, successful erosion control can generate economic gains through reduced damage costs and protection of productive areas, while potential research could be transposed to cost–benefit analyses in order to quantify these impacts at the community level.

5. Conclusions

This work delivered the first national classification of Greece’s 1127 mountainous watersheds, based on erosion severity, using the Erosion Potential Method (EPM). The classification of the erosion coefficient (Z) showed that most watersheds fall into the slight and moderate classes. Severe and excessive cases are uncommon, but where they occur, they are highly concentrated and of real concern. Even watersheds with a low overall Z can still hide steep or degraded slopes that behave as erosion hotspots. This makes clear that erosion management cannot rely on average values alone but needs attention to the parts of a watershed that are most fragile.
Looking at the whole country, the map of erosion severity is consistent with the official water districts defined under the Water Framework Directive and the Floods Directive. This means the results can be used directly in planning. They are particularly relevant for the Flood Risk Management Plans, where measures such as torrent-control maintenance, improved land-use rules, and nature-based solutions are already included. With the Z map, these actions can be better prioritized and linked to EU funding schemes.
The EPM, although practical and widely applied, has its limits. It does not account for sediment storage, connectivity, or seasonal shifts. Further work should compare EPM with other approaches and validate results against actual sediment yield data. Remote sensing and cloud tools can also be used to refresh inputs such as vegetation cover or the φ coefficient, while the integration of climate change scenarios and extreme rainfall analysis would make the tool more predictive and useful for risk planning.
The atlas of erosion has dual applications, with advantages both for scientific research and practical use, by informing investment, prioritization, and long-term strategy formulation aimed at avoiding land degradation while fostering climate change adaptation.

Author Contributions

Conceptualization, S.P.S. and N.D.P.; methodology, S.P.S.; software, S.P.S. and D.T.; validation, S.P.S., N.D.P. and D.T.; formal analysis, S.P.S.; investigation, S.P.S.; resources, S.P.S.; data curation, S.P.S.; writing—original draft preparation, S.P.S. and N.D.P.; writing—review and editing, S.P.S., N.D.P., D.T. and C.C.; visualization, C.C.; supervision, S.P.S.; project administration, S.P.S.; funding acquisition, S.P.S. All authors have read and agreed to the published version of the manuscript.

Funding

This research was financially supported by the Hellenic Green Fund, grant number EP/3/2025/04-06-2025, under the Priority Axis “Forest Protection and Enhancement–Applied Research and Scientific Committees (Green Fund Technical Assistance)” of the Funding Program “Forest Protection and Enhancement 2024”. The beneficiary is the Directorate General for Forests and Forest Environment of the Hellenic Ministry of Environment and Energy, and the project is implemented by the Hellenic Agricultural Organization (ELGO–DIMITRA). Research Project: TorRes “Development of a methodology for the inventory and evaluation of the condition of torrent control works in mountainous watersheds: A pilot study in the Portaikos torrent watershed, Thessaly”.

Institutional Review Board Statement

Not applicable.

Informed Consent Statement

Not applicable.

Data Availability Statement

The data presented in this study are available on request from the corresponding author due to privacy.

Conflicts of Interest

The authors declare no conflicts of interest.

References

  1. de Jong, C. Challenges for mountain hydrology in the third millennium. Front. Environ. Sci. 2015, 3, 38. [Google Scholar] [CrossRef]
  2. Kokkoris, I.P.; Drakou, E.G.; Maes, J.; Dimopoulos, P. Ecosystem services supply in protected mountains of Greece: Setting the baseline for conservation management. Int. J. Biodivers. Sci. Ecosyst. Serv. Manag. 2018, 14, 45–59. [Google Scholar] [CrossRef]
  3. Food and Agriculture Organization of the United Nations. Forests and Water: International Momentum and Action; FAO: Rome, Italy, 2013. [Google Scholar]
  4. Stefanidis, S.; Proutsos, N.; Alexandridis, V.; Mallinis, G. Ecosystem Services Supply from Peri-Urban Watersheds in Greece: Soil Conservation and Water Retention. Land 2024, 13, 765. [Google Scholar] [CrossRef]
  5. Yazdi, J.; Sabbaghian Moghaddam, M.; Saghafian, B. Optimal design of check dams in mountainous watersheds for flood mitigation. Water Resour. Manag. 2018, 32, 4793–4811. [Google Scholar] [CrossRef]
  6. Nones, M. Dealing with sediment transport in flood risk management. Acta Geophys. 2019, 67, 677–685. [Google Scholar] [CrossRef]
  7. Baggio, T.; Martini, M.; Bettella, F.; D’Agostino, V. Debris flow and debris flood hazard assessment in mountain catchments. Catena 2024, 245, 108338. [Google Scholar] [CrossRef]
  8. Myronidis, D.; Ioannou, K.; Sapountzis, M.; Fotakis, D. Development of a sustainable plan to combat erosion for an island of the Mediterranean region. Fresenius Environ. Bull. 2010, 19, 1694–1702. [Google Scholar]
  9. Myronidis, D.; Arabatzis, G. Evaluation of Greek post-fire erosion mitigation policy through spatial analysis. Pol. J. Environ. Stud. 2009, 18, 865–872. [Google Scholar]
  10. de Vente, J.; Poesen, J.; Verstraeten, G.; Govers, G.; Vanmaercke, M.; Van Rompaey, A.; Arabkhedri, M.; Boix-Fayos, C. Predicting soil erosion and sediment yield at regional scales: Where do we stand? Earth-Sci. Rev. 2013, 127, 16–29. [Google Scholar] [CrossRef]
  11. Igwe, P.U.; Onuigbo, A.A.; Chinedu, O.C.; Ezeaku, I.I.; Muoneke, M.M. Soil erosion: A review of models and applications. Int. J. Adv. Eng. Res. Sci. 2017, 4, 138–150. [Google Scholar] [CrossRef]
  12. Borrelli, P.; Alewell, C.; Alvarez, P.; Anache, J.A.A.; Baartman, J.; Ballabio, C.; Bezak, N.; Biddoccu, M.; Cerdà, A.; Chalise, D.; et al. Soil Erosion Modelling: A Global Review and Statistical Analysis. Sci. Total Environ. 2021, 780, 146494. [Google Scholar] [CrossRef] [PubMed]
  13. Andualem, T.G.; Hewa, G.A.; Myers, B.R.; Peters, S.; Boland, J. Erosion and sediment transport modeling: A systematic review. Land 2023, 12, 1396. [Google Scholar] [CrossRef]
  14. Wischmeier, W.H.; Smith, D.D. Predicting Rainfall Erosion Losses, a Guide to Conservation Planning; U.S. Department of Agriculture: Washington, DC, USA, 1978; Volume 537, p. 62. [Google Scholar]
  15. Renard, K.G.; Foster, G.R.; Weesies, G.A.; Porter, J.P. RUSLE: Revised universal soil loss equation. J. Soil Water Conserv. 1991, 46, 30–33. [Google Scholar] [CrossRef]
  16. Nearing, M.A.; Foster, G.R.; Lane, L.J.; Finkner, S.C. A process-based soil erosion model for USDA-Water Erosion Prediction Project technology. Trans. ASAE 1989, 32, 1587–1593. [Google Scholar] [CrossRef]
  17. Morgan, R.P.C.; Morgan, D.D.V.; Finney, H.J. A predictive model for the assessment of soil erosion risk. J. Agric. Eng. Res. 1984, 30, 245–253. [Google Scholar] [CrossRef]
  18. Williams, J.R.; Jones, C.A.; Dyke, P.T. A modeling approach to determining the relationship between erosion and soil productivity. Trans. ASAE 1984, 27, 129–144. [Google Scholar] [CrossRef]
  19. Kirkby, M.J.; Le Bissonais, Y.; Coulthard, T.J.; Daroussin, J.; McMahon, M.D. The development of land quality indicators for soil degradation by water erosion. Agric. Ecosyst. Environ. 2000, 81, 125–135. [Google Scholar] [CrossRef]
  20. Gavrilovič, S. Engineering of Debris Flow and Erosion; Izgradnja: Beograd, Serbia, 1972; p. 292. (In Serbian) [Google Scholar]
  21. De Vente, J.; Poesen, J. Predicting soil erosion and sediment yield at the basin scale: Scale issues and semi-quantitative models. Earth-Sci. Rev. 2005, 71, 95–125. [Google Scholar] [CrossRef]
  22. Karydas, C.G.; Panagos, P.; Gitas, I.Z. A classification of water erosion models according to their geospatial characteristics. Int. J. Digit. Earth 2014, 7, 229–250. [Google Scholar] [CrossRef]
  23. Gavrilovič, Z. Use of an Empirical Method Erosion Potential Method for Calculating Sediment Production and Transportation in Unstudied or Torrential Streams. In Proceedings of the International Conference on River Regime, Hydraulics Research Limited. Wallingford, Oxon, UK, 18–20 May 1988; pp. 411–422. [Google Scholar]
  24. Gavrilovič, Z.; Stefanovic, M.; Milovanovic, I.; Cotric, J.; Milojevic, M. Torrent classification-base of rational management of erosive regions. IOP Conf. Ser. Earth Environ. Sci. 2008, 4, 012039. [Google Scholar] [CrossRef]
  25. Bayat, R.; Gerami, Z.; Arabkhedri, M.; Peyrowan, H.R.; Kazemi, R. Investigating the Status of Some Indicators of Assessment of Watersheds and Prioritizing Sub-Catchments in Terms of Erosion Reduction (Case Study of Karkheh Watershed). J. Watershed Manag. Res. 2021, 12, 108–118. [Google Scholar] [CrossRef]
  26. Bezak, N.; Borrelli, P.; Mikoš, M.; Auflič, M.J.; Panagos, P. Towards multi-model soil erosion modelling: An evaluation of the erosion potential method (EPM) for global soil erosion assessments. Catena 2024, 234, 107596. [Google Scholar] [CrossRef]
  27. Sapountzis, M.; Myronidis, D.; Stathis, D.; Stefanidis, P. Comparison of the predicted erosion rates by USLE and Gavrilovič methods with field measurements. In Proceedings of the 1st Joint Conference EYE-EEDYP, Volos, Greece, 27–30 May 2009; pp. 155–165. (In Greek). [Google Scholar]
  28. Xanthakis, M. Soil Erosion Study in Mountainous Basins with Modern Technological Tools. Ph.D. Thesis, Harokopio University of Athens, Athens, Greece, 2011. (In Greek). [Google Scholar]
  29. Anastasiou, S. Determination of Degradation and Sediment Sources in Torrents’ Watersheds of Serres, Using GIS. Master’s Thesis, Aristotle University of Thessaloniki, Thessaloniki, Greece, 2013. (In Greek). [Google Scholar]
  30. Panagos, P.; Borrelli, P.; Poesen, J.; Ballabio, C.; Lugato, E.; Meusburger, K.; Montanarella, L.; Alewell, C. The new assessment of soil loss by water erosion in Europe. Environ. Sci. Policy 2015, 54, 438–447. [Google Scholar] [CrossRef]
  31. Nearing, M.A.; Xie, Y.; Liu, B.; Ye, Y. Natural and anthropogenic rates of soil erosion. Int. Soil Water Conserv. Res. 2017, 5, 77–84. [Google Scholar] [CrossRef]
  32. Hag Husein, H.; Al-Ahmad, M.; Ziadat, F.; Al Hafi, A.; Awawdeh, M.; Alkhaled, S.; Shakhatreh, Y. Soil erosion assessment in the rainy mountainous areas of the eastern Mediterranean: A case study of the El-Sarout watershed. Environ. Dev. Sustain. 2024. [Google Scholar] [CrossRef]
  33. Leite, J.; Ferreira, C.S.S.; Marques, J.; Castro, J.; Santos, J.L.; Nunes, J.P. The Application of Soil Erosion Models of an Agroforestry Basin under Mediterranean Conditions. Land 2024, 13, 1613. [Google Scholar] [CrossRef]
  34. Pimentel, D.; Harvey, C.; Resosudarmo, P.; Sinclair, K.; Kurz, D.; McNair, M.; Crist, S.; Shpritz, L.; Fitton, L.; Saffouri, R.; et al. Environmental and economic costs of soil erosion and conservation benefits. Science 1995, 267, 1117–1123. [Google Scholar] [CrossRef]
  35. Kosmas, C.; Danalites, N.G.; Cammeraat, L.H.; Chabart, M.; Diamantopoulos, J.; Farand, R.; Gutiérrez, L.; Jacob, A.; Marques, H.; Martínez-Fernández, J.; et al. The effect of land use on runoff and soil erosion rates under Mediterranean conditions. Catena 1997, 29, 45–59. [Google Scholar] [CrossRef]
  36. Borrelli, P.; Robinson, D.A.; Fleischer, L.R.; Lugato, E.; Ballabio, C.; Alewell, C.; Meusburger, K.; Modugno, S.; Schütt, B.; Ferro, V.; et al. An assessment of the global impact of 21st-century land use change on soil erosion. Nat. Commun. 2017, 8, 2013. [Google Scholar] [CrossRef] [PubMed]
  37. Li, Z.; Fang, H. Impacts of climate change on water erosion: A review. Earth-Sci. Rev. 2016, 163, 94–117. [Google Scholar] [CrossRef]
  38. Stefanidis, S.P.; Proutsos, N.D.; Solomou, A.D.; Michopoulos, P.; Bourletsikas, A.; Tigkas, D.; Spalevic, V.; Kader, S. Spatiotemporal Monitoring of Post-Fire Soil Erosion Rates Using Earth Observation (EO) Data and Cloud Computing. Nat. Hazards 2025, 121, 2873–2894. [Google Scholar] [CrossRef]
  39. El Jazouli, A.; Barakat, A.; Khellouk, R.; Rais, J.; Baghdadi, N.; Tribak, A. Integration of Remote Sensing and GIS Techniques for Soil Erosion Modeling in the Ourika Watershed, Morocco. Remote Sens. 2022, 14, 432. [Google Scholar]
  40. Pérez-Luque, A.J.; Zamora, R.; Castro, H.; Beltrán, G.; Herrera, J.P.; Benito, B.; Bonet, F.J. Soil Erosion in Mountainous Mediterranean Landscapes: Integrating Remote Sensing and GIS Techniques to Assess Soil Loss. Sustainability 2021, 13, 4821. [Google Scholar]
  41. Taghizadeh-Mehrjardi, R.; Minasny, B.; Sarmadian, F.; Malone, B.P.; Vafakhah, M.; Triantafilis, J. Digital Mapping of Soil Erosion Risk Using Machine Learning Algorithms in GIS and Remote Sensing. Land 2020, 9, 237. [Google Scholar]
  42. Stefanidis, P. Torrent Problem in Mediterranean Areas (Example from Greece). In Proceedings of the XX IUFRO World Congress—Technical Session on Natural Disasters in Mountainous Areas, Tampere, Finland, 6–12 August 1995; pp. 51–60. [Google Scholar]
  43. Kotoulas, D. Denudation and Sedimentation in Greece as an Example—From the Mountains and the Plain of Salonica. In Proceedings of the International Symposium of INTERPRAEVENT, Villach, Austria, 6–9 June 1984; pp. 343–353. [Google Scholar]
  44. Gorelick, N.; Hancher, M.; Dixon, M.; Ilyushchenko, S.; Thau, D.; Moore, R. Google Earth Engine: Planetary-Scale Geospatial Analysis for Everyone. Remote Sens. Environ. 2017, 202, 18–27. [Google Scholar] [CrossRef]
  45. Tamiminia, H.; Salehi, B.; Mahdianpari, M.; Quackenbush, L.; Adeli, S.; Brisco, B. Google Earth Engine for Geo-Big Data Applications: A Meta-Analysis and Systematic Review. ISPRS J. Photogramm. Remote Sens. 2020, 164, 152–170. [Google Scholar] [CrossRef]
  46. Ghosh, S.; Kumar, D.; Kumari, R. Cloud-Based Large-Scale Data Retrieval, Mapping, and Analysis for Land Monitoring Applications with Google Earth Engine (GEE). Environ. Chall. 2022, 9, 100605. [Google Scholar] [CrossRef]
  47. Nakos, G. Classification, Mapping and Assessment of Lands: Technical Instructions; Institute of Mediterranean Forest Ecosystems: Athens, Greece, 1991. (In Greek) [Google Scholar]
  48. Hawker, L.; Uhe, P.; Paulo, L.; Sosa, J.; Savage, J.; Sampson, C.; Neal, J. A 30 m global map of elevation with forests and buildings removed. Environ. Res. Lett. 2022, 17, 024016. [Google Scholar] [CrossRef]
  49. Meadows, M.; Jones, S.; Reinke, K. Vertical accuracy assessment of freely available global DEMs (FABDEM, Copernicus DEM, NASADEM, AW3D30 and SRTM) in flood-prone environments. Int. J. Digit. Earth 2024, 17, 2308734. [Google Scholar] [CrossRef]
  50. Marsh, C.B.; Harder, P.; Pomeroy, J.W. Validation of FABDEM, a Global Bare-Earth Elevation Model, Against UAV-Lidar Derived Elevation in a Complex Forested Mountain Catchment. Environ. Res. Commun. 2023, 5, 031009. [Google Scholar] [CrossRef]
  51. Stefanidis, S.; Stathis, D. Effect of Climate Change on Soil Erosion in a Mountainous Mediterranean Catchment (Central Pindus, Greece). Water 2018, 10, 1469. [Google Scholar] [CrossRef]
  52. Kostadinov, S.; Braunović, S.; Dragićević, S.; Zlatić, M.; Dragović, N.; Rakonjac, N. Effects of Erosion Control Works: Case Study—Grdelica Gorge, the South Morava River (Serbia). Water 2018, 10, 1094. [Google Scholar] [CrossRef]
  53. Globevnik, L.; Holjevic, D.; Petkovsek, G.; Rubinic, J. Applicability of the Gavrilović Method in Erosion Calculation Using Spatial Data Manipulation Techniques. Int. Assoc. Hydrol. Sci. Publ. 2003, 279, 224–233. [Google Scholar]
  54. Efthimiou, N.; Lykoudi, E.; Panagoulia, D.; Karavitis, C. Assessment of Soil Susceptibility to Erosion Using the EPM and RUSLE Models: The Case of Venetikos River Catchment. Glob. NEST J. 2016, 18, 164–179. [Google Scholar]
  55. Manojlović, S.; Sibinović, M.; Srejić, T.; Novković, I.; Milošević, M.V.; Gatarić, D.; Carević, I.; Batoćanin, N. Factors Controlling the Change of Soil Erosion Intensity in Mountain Watersheds in Serbia. Front. Environ. Sci. 2022, 10, 888901. [Google Scholar] [CrossRef]
  56. Stefanidis, P. Morphematischer und Hydrographischer Aufbau der Wildbachtypen im Nordgriechischen Raum. Wildbach-Und Lawinenverbau 1992, 121, 247–261. [Google Scholar]
  57. Xanthakis, M.; Pavlopoulos, K.; Kapsimalis, V.; Apostolopoulos, G.; Xanthopoulos, G.; Stefanidis, P.; Evelpidou, N. Prediction of Soil Loss in a Reservoir Watershed Using an Erosion Model and Modern Technological Tools: A Case Study of Marathon Lake, Attica in Greece. Environ. Sci. Proc. 2020, 2, 63. [Google Scholar]
  58. Petrović, A.M.; Manojlović, S.; Srejić, T.; Zlatanović, N. Insights into Land-Use and Demographical Changes: Runoff and Erosion Modifications in the Highlands of Serbia. Land 2024, 13, 1342. [Google Scholar] [CrossRef]
  59. Polovina, S.; Radić, B.; Ristić, R.; Milčanović, V. Application of Remote Sensing for Identifying Soil Erosion Processes on a Regional Scale: An Innovative Approach to Enhance the Erosion Potential Model. Remote Sens. 2024, 16, 2390. [Google Scholar] [CrossRef]
  60. Rikimaru, A.; Roy, P.S.; Miyatake, S. Tropical Forest Cover Density Mapping. Trop. Ecol. 2002, 43, 39–47. [Google Scholar]
  61. Karydas, C.G.; Panagos, P.; Gitas, I.Z. A classification framework for mapping soil erosion severity using Earth observation data. Geoderma 2022, 409, 115658. [Google Scholar]
  62. Ronchi, S.; Salata, S.; Arcidiacono, A.; Piroli, E.; Montanarella, L. Policy instruments for soil protection among the EU member states: A comparative analysis. Land Use Policy 2019, 82, 763–780. [Google Scholar] [CrossRef]
  63. Panagos, P.; Katsoyiannis, A. Soil erosion modelling: The new challenges as the result of policy developments in Europe. Environ. Res. 2019, 172, 470–474. [Google Scholar] [CrossRef] [PubMed]
  64. Panagos, P.; Lugato, E.; Ballabio, C.; Biavetti, I.; Montanarella, L.; Borrelli, P. Soil Erosion in Europe: From Policy Developments to Models, Indicators and New Research Challenges. In Global Degradation of Soil and Water Resources: Regional Assessment and Strategies; Lal, R., Stewart, B.A., Eds.; Springer Nature: Singapore, 2022; pp. 319–333. [Google Scholar]
  65. Carladous, S.; Piton, G.; Recking, A.; Tacnet, J.-M.; Liébault, F.; Kuss, D.; Quefféléan, Y.; Marco, O. Towards a better understanding of the today French torrents management policy through a historical perspective. E3S Web Conf. 2016, 7, 12011. [Google Scholar] [CrossRef]
  66. Lense, G.H.E.; Carvalho, D.F.; Cantalice, J.R.B.; da Silva, D.D.; Pruski, F.F.; Menezes, S.J.M.C. Soil Erosion Modeling with RUSLE in a Tropical Watershed: Evaluation, Limitations, and Application Perspectives. Water 2023, 15, 1490. [Google Scholar]
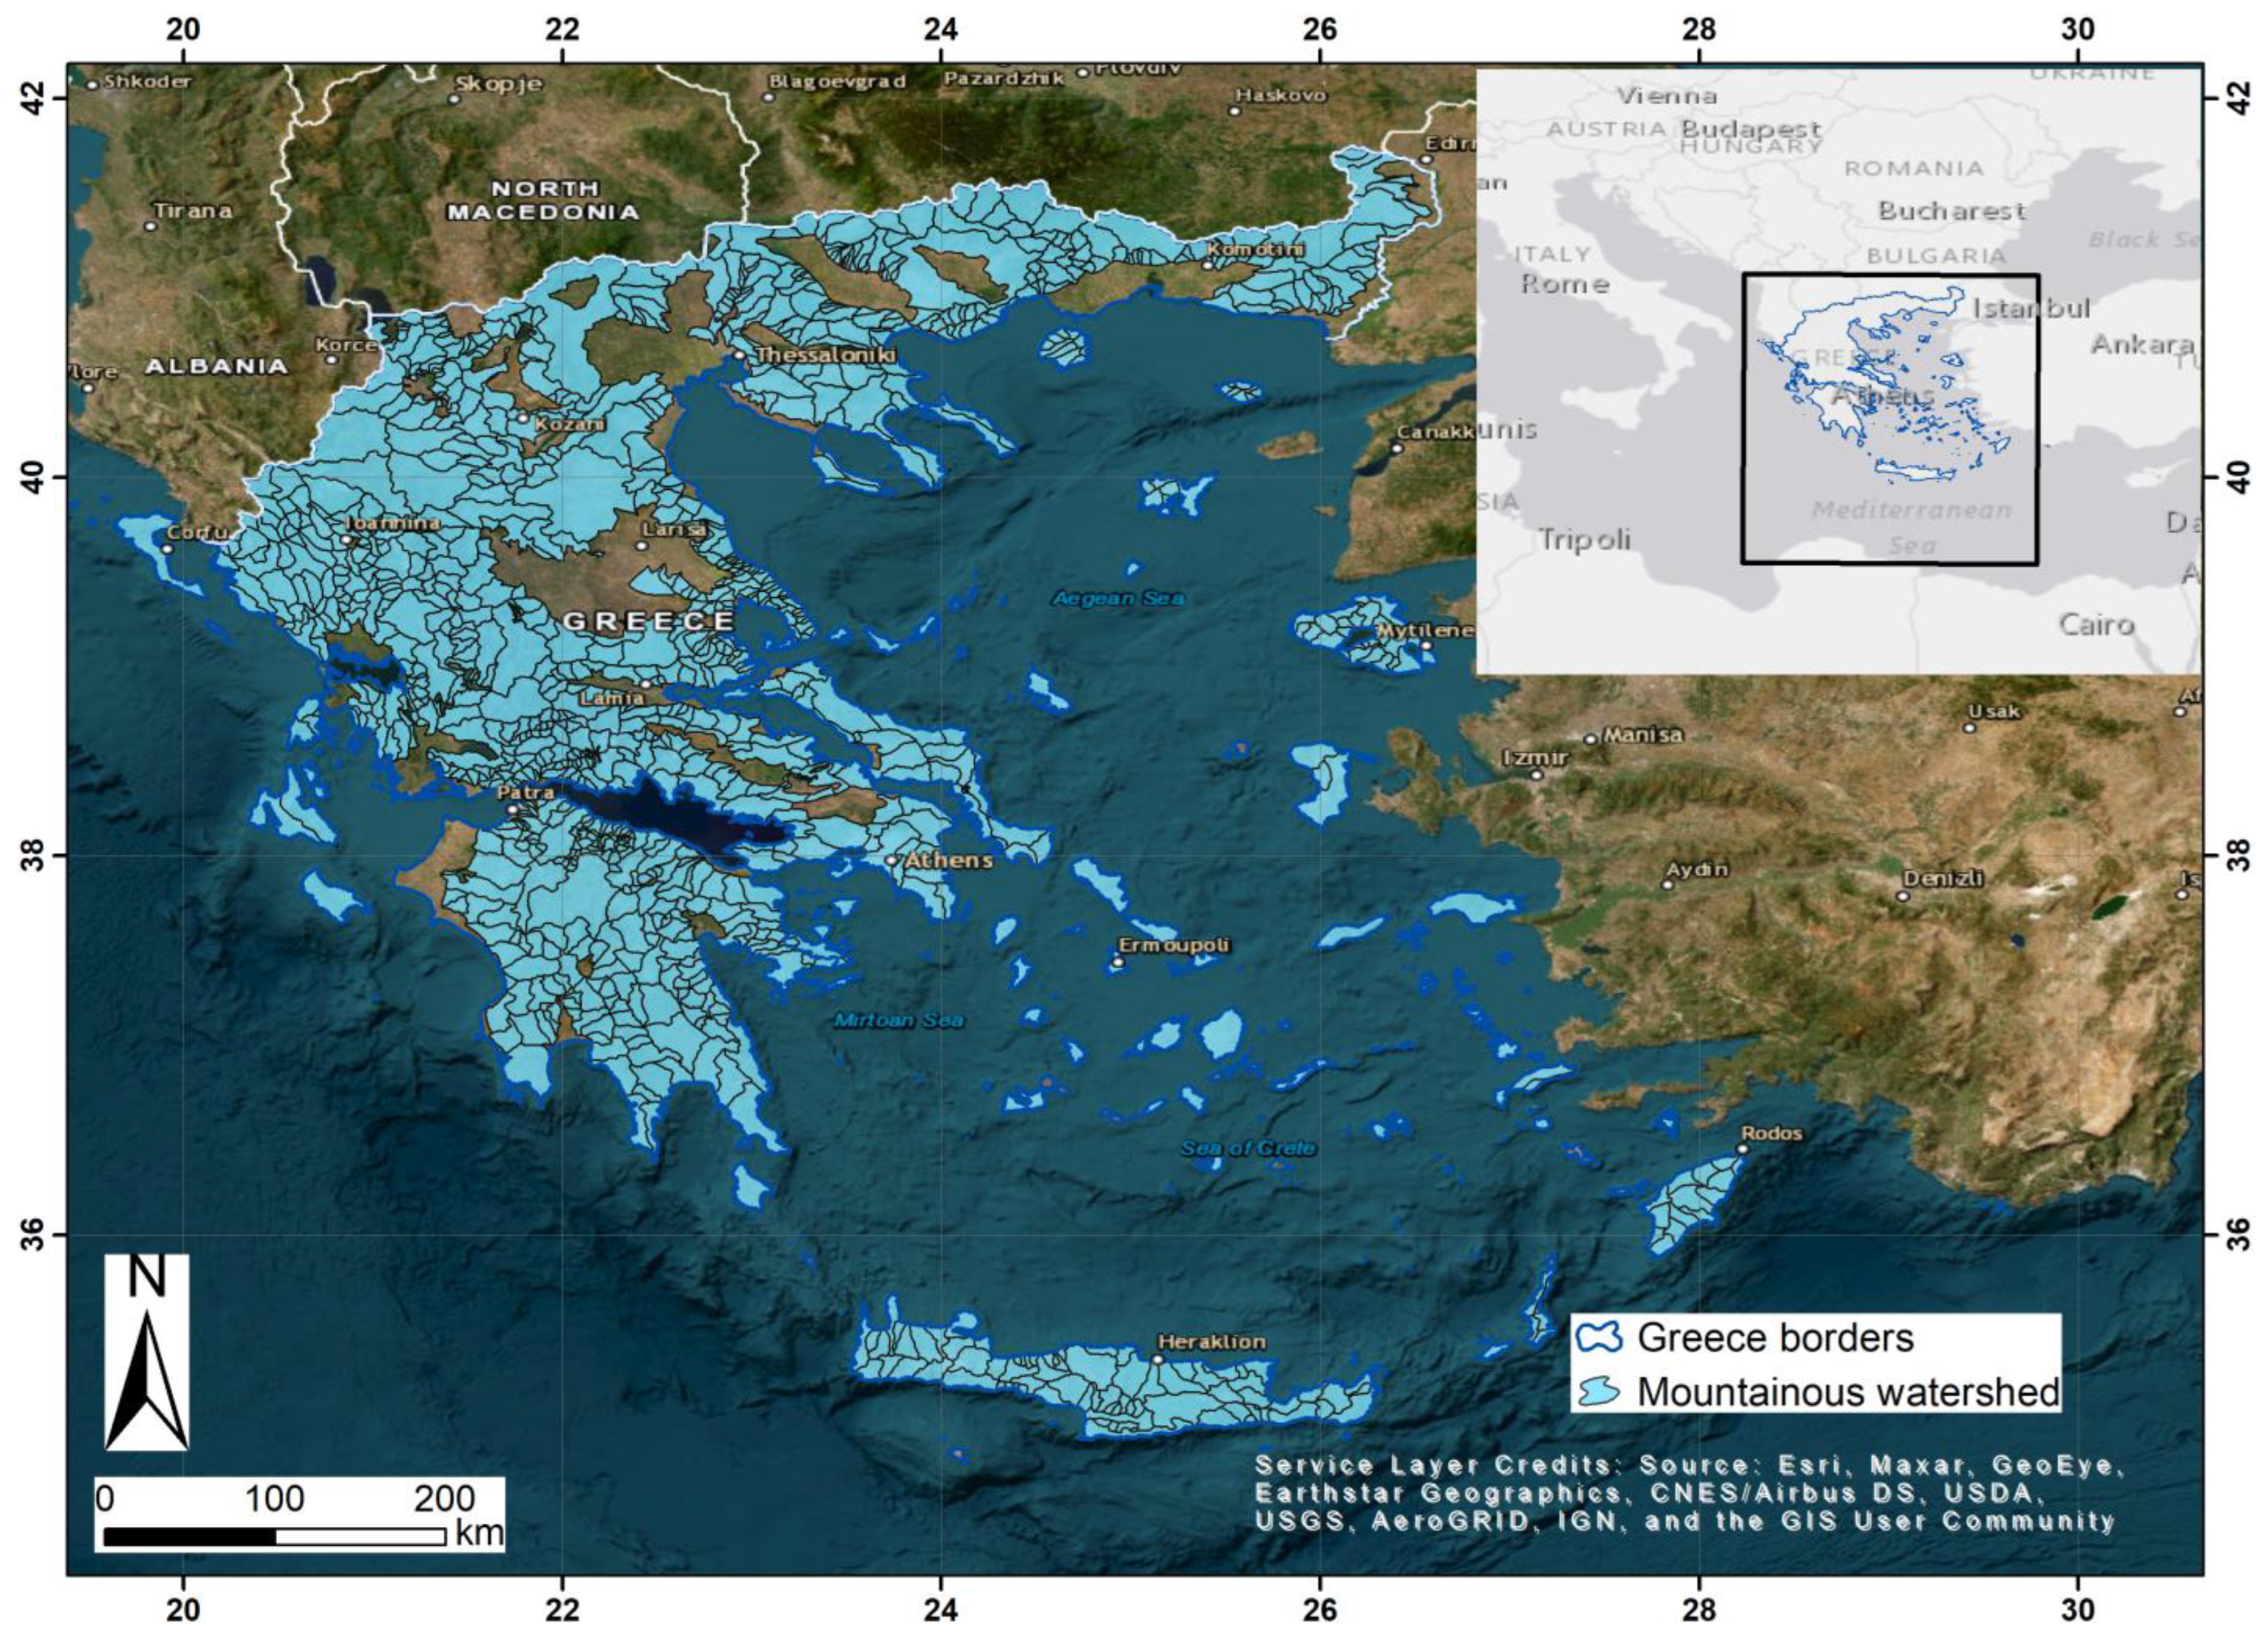
Figure 1. Location map of the mountainous watersheds in Greece.
Sustainability 17 08710 g001
Figure 2. Overall workflow of the methodology.
Sustainability 17 08710 g002
Figure 3. Spatial distribution of (a) mountainous watersheds erosion severity classes and (b) water districts in Greece.
Sustainability 17 08710 g003
Figure 4. Distribution of mountainous watersheds by erosion severity class and water district, with overall proportions illustrated in the pie chart.
Sustainability 17 08710 g004
Figure 5. Average values of the erosion coefficient (Z) for groups of different (a) slope, (b) elevation and (c) forest cover of the mountainous watershed. The values of the groups refer to the average slope, elevation and forest cover of each watershed.
Sustainability 17 08710 g005
Figure 6. Spatial distribution of erosion severity in three representative Greek watersheds: (a) Anthemountas, Central Macedonia (slight); (b) Sarantapotamos, Attica (moderate); (c) Titarisios, Thessaly (severe).
Sustainability 17 08710 g006
Table 1. Classification of the erosion severity classes according to the Z coefficient.
Category Erosion Severity Erosion Coefficient Values
IExcessive Z > 1
IISevere0.71 < Z < 1
IIIModerate0.41 < Z < 0.7
IVSlight0.2 < Z < 0.4
VVery slightZ < 0.19
Disclaimer/Publisher’s Note: The statements, opinions and data contained in all publications are solely those of the individual author(s) and contributor(s) and not of MDPI and/or the editor(s). MDPI and/or the editor(s) disclaim responsibility for any injury to people or property resulting from any ideas, methods, instructions or products referred to in the content.