Abstract
Climate-relevant technological innovation in renewable energy sources, such as solar energy, is essential for mitigating climate change and achieving sustainable development. The recent literature highlights substantial patent activity in China’s solar energy industry, which may contribute to the sector’s success in international markets. This study examines the relationship between patent activity and corporate financial performance in China’s solar energy industry from 2012 to 2022 using panel data analysis. The results indicate that patent applications positively impact firms’ corporate performance, showing a time-lag of approximately 6–7 years. Notably, this positive impact is particularly pronounced for firms located in the eastern region and state-owned enterprises. Additionally, we investigate whether CEO duality affects the relationship between patent applications and firms’ corporate performance, seeking to reveal unique development pathways within the industry. These findings are important for understanding how China’s solar energy sector can advance along sustainable development pathways amid the challenges of climate change.
1. Introduction
Recent studies indicate that innovations in the solar sector—spanning solar desalination [1,2], solar pumps [3], solar power generation [4], and solar-powered hydrogen production [5]—are continuously advancing and modernizing. As the world’s largest CO2 emitter, China has committed to a low-carbon energy future, particularly through solar energy industries to support its climate change mitigation efforts. By 2013, China had surpassed Germany to become the largest solar energy market globally, with installed capacity surpassing 43 GW by 2016 and reaching over 500 GW by 2023—a tenfold increase [6,7].
Despite securing significant market shares in solar energy industries, Chinese firms have not yet emerged as prominent contributors to global technology innovation in this field [8,9,10]. Traditionally, China’s leading firms have gained competitive advantages and international market leadership through economies of scale, manufacturing capabilities, and cost advantages driven by absorbed technologies and government subsidies, rather than by competing on innovation [11]. Although recent studies have noted increased patent activity in China’s solar industry [12,13,14], few have specifically analyzed its impact on economic performance growth at the micro or enterprise levels. Furthermore, most existing studies are qualitative rather than quantitative. This study addresses this gap by examining the role of patents in enhancing competitive performance among firms in China’s solar industry, aiming to deepen our understanding of knowledge competitiveness.
Following the foundational work of Schmookler in the 1950s and 1960s, patents have drawn considerable attention in empirical research, especially within the study of innovation processes. Patents are exclusive legal rights granted to inventors for a limited time, allowing them to commercially benefit from their inventions [15]. The primary advantage of using patent data lies in their objectivity, as patents undergo rigorous scrutiny and validation by patent examiners. Additionally, patent data are publicly available, easily accessible, and avoids issues like inconsistent R&D definitions and limited comparability across firms. Patent data can also be categorized for specific analytical purposes, providing distinct research advantages. In the scientific literature, patent data often serve as a proxy for innovation, enabling researchers to explore the link between innovation and corporate financial performance. Additionally, in public policy, governments frequently use patent counts held or filed by domestic companies and individual inventors as an indicator of national technological strength [16,17,18,19,20,21].
According to Pavitt (1988), empirical studies employing patents can focus on national, industrial, technological, or corporate levels [22]. Recent research has specifically demonstrated a positive link between a firm’s patent holdings and its competitive positioning in several established industries. However, the relationship between patents and financial performance remains unclear in China’s solar sector. This study explores how patents contribute to the competitive positioning and economic performance of Chinese solar firms [20,23,24,25].
In summary, given research demonstrating the positive impact of patents on specific industries, we extend the perspective to examine the drivers of performance in China’s solar industry from an intra-firm viewpoint. Drawing on a sample of firms in this sector, our study contributes to the understanding of patent-driven technological innovation in this context. Moreover, the role of innovation in advancing China’s solar industry remains ambiguous to external stakeholders. This study systematically addresses this gap, aiming to enhance the empirical literature and offer insights to guide effective innovation strategies within China’s solar industry in alignment with sustainable development goals.
The structure of this paper is as follows: Section 2 examines the role of patents in the innovation process, reviews empirical studies on the relationship between patents and corporate financial performance, and presents the research hypotheses. Section 3 outlines the sample selection, data processing, variable definitions, and research model. Section 4 analyzes the empirical results, and Section 5 concludes with final remarks, contributions to the literature, implications for practice, limitations, and future research directions.
2. Theoretical Background and Previous Research
2.1. Patents in the Innovation Process
The innovation process, in a narrowly defined sense, describes activities and their results which lie between the conception of an idea and its introduction to the market. When the technical requirements of an idea are successfully achieved through research and development (R&D), the outcome is typically classified as an invention. This technical achievement is often demonstrated by obtaining patents. However, bringing an invention to market requires resources from additional areas of the organization, such as production and marketing. Successfully launching an invention into the market or integrating it within a production system is what is referred to as product or process innovation.
Patents, therefore, are logically viewed as the outcomes of technically successful R&D activities. However, there has been significant debate in the literature about whether patents genuinely reflect R&D activities or if they are an accurate measure of inventive output. The former viewpoint argues that patents merely reflect the degree of investment in R&D and should be considered an input into the innovation process [26]. The latter view holds that patents represent the outcome of R&D and are directly related to the economic output of successful innovation [20], thereby reflecting both the productivity and quality of innovation.
Griliches (1990) summarizes the above as follows. Ideally, we might hope that patent statistics would provide a measure of the output of such invention activities, a direct reading on the rate at which the potential production possibilities frontier is shifted outward. The reality, however, is very far from it. The dream of getting hold of an output indicator of inventive activity is one of the strong motivating forces for economic research in this area [20].
Using patents as an indicator of both R&D input and output poses several challenges, including the following:
- Not all inventions are eligible for patents.
- The likelihood of patenting inventions varies across firms and industries.
- The quality of patented inventions, and thus the related outputs, can differ greatly.
Figure 1 provides a conceptual framework explaining the relationship between patents, inventions, and innovation. Not all inventions are patented; indeed, only a portion of inventions result in patents, while a subset of these patents leads to actual innovations. Importantly, not every invention arising from R&D qualifies for patent protection. Several factors influence whether a patentable invention is pursued, such as uncertainty, profitability, expected lifespan, and the potential use of alternative protection mechanisms, such as trade secrets.
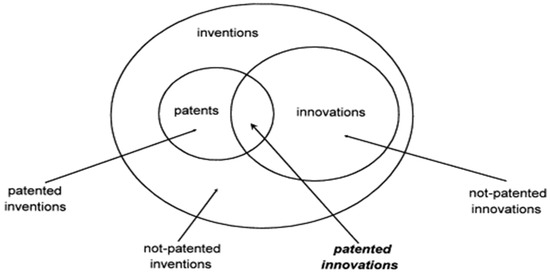
Figure 1.
Relationship between patents, inventions and innovation.
Since patents vary widely in their technical and economic quality, whether used or not, patented innovations are clearly of greater economic importance, and these patents qualify as measures of R&D performance as described earlier, but they are only a small fraction of the total amount of innovation. In summary, when examining the relationship between patents and firm’s corporate performance, it is essential to consider patent quality.
One effective approach to addressing the quality issue of patents is to collect samples that are as homogeneous as possible (e.g., from the same firm, industry, country, etc.) and where the parameters affecting the propensity to patent are roughly constant [27,28]. The concept of patent propensity has been used in different ways in the literature. Scherer (1984) emphasized the number of patents relative to R&D expenditure (analogous to R&D intensity), while Mansfield (1986) defined patent propensity as the probability that a patentable invention will be patented [29,30]. Arundel and Kabla (1998) extended this to include the likelihood of patenting patentable innovations [31]. Despite these different definitions, all focus on the fundamental managerial decision of whether to apply for patent protection for an invention.
The transformation of patents into innovations necessitates the utilization of diverse combinatorial processes. The development and implementation of new ideas frequently encounter obstacles. New ideas are often viewed as hopeful monsters [32], facing the pains of illegitimacy as they undergo increasingly rigorous evaluations over time [33,34,35,36]. As a result, only a small fraction of these new ideas achieve success. The initial idea must evolve into a collection of assets, resources, and capabilities that cumulatively lead to the creation, service, and maintenance of innovation. It is asserted that mechanical innovation requires all new ideas to undergo “strict modifications” before implementation, ultimately leading to a transformation of the ideas themselves throughout the innovation process [37,38].
Narin et al. (1987) found that patent statistics are more indicative of the overall scale of research efforts rather than the pace of research [39], highlighting the necessity for further investigation into the relationship between patents and firm’s corporate performance.
2.2. Existing Empirical Research Results
The existing empirical research on the relationship between patents and firm’s corporate performance is detailed in Table 1. The literature is diverse, employing various metrics to evaluate the economic impact of patents on firms. Some studies have found no relationship between patents and metrics such as return on assets (ROA), sales growth, and market value [40,41], while others have identified a negative relationship between patents and ROA [42]. Conversely, numerous other studies have reported a positive and significant relationship between patents and sales, market value, and stock returns. This section focuses on the methodological considerations relevant to this research.

Table 1.
Empirical study on the relationship between patents and corporate performance at the corporate level.
First, it is essential to select a sufficiently large sample of firms. Systematic biases arising from various factors affecting patent propensity must be controlled. Therefore, the statistical patent analysis was conducted exclusively on firms within a single country and homogeneous industries to eliminate relevant national and industry-specific factors. An additional advantage of this approach is that it controls the industry-specific systems that may affect the timeframe between invention and economic utilization.
Second, the choice of dependent and independent variables is critical. The dependent variable, representing a firm’s financial performance, is multidimensional and often measured using indicators such as market value, return on investment (ROI), return on assets (ROA), and total asset turnover. ROA reflects a firm’s ability to generate profits based on its assets or investment base. Enhanced innovation, whether product or process, can create temporary monopolies that boost corporate profits. To validate the robustness of the results based on ROA, this study also includes the return on equity (ROE) metric. Merely examining patent activity indicators as independent variables is insufficient. Previous research suggests that patent quality or quality metrics should also be considered when analyzing the impact of patent activity on firms’ corporate performance. This study incorporates patent authority data to ensure robustness [42,45].
Third, it is crucial to examine whether a relationship exists using panel data analysis, as this approach can capture the temporal complexity inherent in the innovation process. This complexity refers to the notion that innovation unfolds through multiple temporal rhythms and experiences, rather than following a single linear timeline. These multiple temporal rhythms create asynchrony in the emergence of different elements within the innovation, as well as the infrastructure required for its development and implementation. This asynchrony within the evolving ecosystem surrounding patent applications underscores the importance of aligning elements that operate on different timelines and trajectories. Moreover, distinct temporal experiences can lead to diachronicity, where something deemed valuable at one point in time may later be considered obsolete or even have negative consequences [38]. By incorporating time-lag effects, panel data analysis provides deeper insights into the temporal dynamics of innovation processes.
2.3. Hypothesis Development
Schumpeter’s Mark I model suggests that most innovations are driven by individual, ‘heroic’ entrepreneurs who initiate and lead innovative activities. By contrast, the Schumpeter Mark II model proposes that large firms serve as the primary drivers of the innovation process, especially in producing substantial economic outcomes. Garud, Tuertscher, and Van de Ven (2013) explored innovation by examining the roles of firms, multi-party networks, and communities [38]. They conceptualized innovation as an interactive process involving multiple actors over time, focusing on individuals utilizing various technologies and organizations with diverse capabilities.
However, the innovation process is considerably more complex than illustrated in Table 2. The path dependency involved in invention, development, and implementation reflects a growing complexity, encompassing various intertwined social and material elements at different levels and adding relational complexity. Additionally, the accumulation of experience over time introduces temporal complexity, while the organization of actors from diverse cultural and contextual backgrounds to address these evolving, relational, and temporal factors brings in cultural complexity. Together, these factors contribute significantly to the overall complexity of the innovation process [38,46].
Table 2.
Innovation process.
The above definition of the innovation process suggests that converting patented inventions into marketable innovations necessitates a combination of processes influenced by external factors, including time, environment, and culture. These factors are crucial for analyzing the impact of patents on corporate performance.
2.3.1. The Relationship Between Patents and Firm’s Corporate Performance
Patents, as a form of intellectual property rights, represent a tangible outcome of enterprise technological innovation and can significantly enhance a firm’s competitiveness and market standing. From the Resource-Based View (RBV), patents are considered unique and irreplaceable resources, playing a foundational role in achieving competitive advantage [47]. Some research has found a positive association between patents and firm’s corporate performance, particularly citing a correlation between the number of citations per patent and financial performance [39]. Additionally, both current and historical patent applications account for approximately 5% of the variance in market value [40], and factors such as patent back citations and patent family size have a positive impact on a firm’s market value [48]. However, other studies suggest that patents may have minimal or even negative impact on firm’s corporate performance [41,42]. In cases where imitation is relatively easy, markets may fail to function efficiently, resulting in profits from innovation primarily benefiting owners of complementary assets rather than the intellectual property developers themselves [49].
As intellectual property rights become increasingly crucial for high-tech companies, the processes of patent application and maintenance demand substantial resources, along with considerable technological and financial capabilities from firms [50]. Patents serve to limit innovation leakage, reduce the risks of imitation and copying, and enhance market value and profitability by establishing entry barriers, securing market positions, and supporting industry profitability [49]. Consequently, this study proposes that firms with more patents are more likely to achieve superior performance.
Hypothesis 1.
Patent applications have a positive impact on firms’ corporate performance.
2.3.2. The Time-Lag of the Relationship Between Patents and Firm’s Corporate Performance
Rogers’ (1962) earliest theory on the diffusion of innovation suggests that early-stage patents may face challenges in generating substantial benefits initially [51]. However, as cumulative technological growth accelerates through spillover effects [52], products transition into growth and maturity phases [53], supported by market education and promotion [54]. In these later stages, patents increasingly contribute to firms’ corporate performance as their diffusion expands. Furthermore, there is often a time-lag between a firm’s R&D investment and the economic returns that follow. Hall et al. (1986) highlight that the path from R&D initiation to patent applications and eventually to improvements in firm’s corporate performance is protracted, with delays at each stage. As a result, patents do not immediately impact firm performance [55].
Recent studies further highlight that patents are typically filed during the R&D phase but transforming them into viable products and market applications takes time [56]. The cyclical nature of technological evolution means that patents may not immediately enhance firms’ corporate performance in their early stages; instead, their value gradually becomes apparent as time passes and the technology matures [57]. Hall et al. (2005) observe that the economic benefits of patents accumulate over time, reflected in the reduced impact of R&D expenditures and patent applications on short-term performance during a firm’s initial years [58]. By contrast, cumulative returns and performance gains become more pronounced over the medium to long term. Research by Griliches et al. (1991) [40] also suggests that current patent applications alone explain only 0.1% of the variance in market value, while a combination of current and previous patent applications accounts for 5%, underscoring a potential time-lag in patents’ influence.
Hypothesis 2.
Patent applications have a time-lag on firm’s corporate performance.
2.3.3. The Firm, Multi-Party Network, and Communities Have Impact on the Relationship Between Patents and Firm’s Corporate Performance
The external economic environment significantly influences the value and impact of patents on firms’ corporate performance. During economic expansion, the marketability of innovations and patents increases [59], allowing patents to contribute more substantially to firm’s corporate performance. Firm survival and success depend on access to external resources [60,61], as well as the structure of interdependence within the ecosystem, which determines how firms can collaborate and leverage these resources [62]. By effectively utilizing their networks and industry ecosystems for knowledge and resource sharing, firms can enhance their capabilities and secure crucial resources necessary for competitive advantage [63,64]. For firms with patents as core competencies, access to external resources—such as financing, partnerships, and talent—is crucial. In environments with a robust industry chain and ecosystem support, firms are better positioned to leverage patents for performance, as they can more easily access external resources. Conversely, limited external resources make it difficult to translate patents into financial gains. By collaborating and sharing knowledge with external partners, firms can enhance the market adoption and performance impact of patents [63]. In an open, cooperative environment, firms expand patent applications and increase market acceptance through collaborative development and technology licensing, thereby amplifying the positive effect on performance.
The internal environment of a company significantly influences the value of patents and their contribution to performance. This environment encompasses the structure of interdependence within the ecosystem, which determines how firms can collaborate and leverage these resources [62]. Additionally, cultural complexity—characterized by unique practices, values, and discourses—drives innovation within different cultural contexts [65], which suggests that diverse cultural frameworks employ various innovation processes and yield distinct outcomes. Even concepts such as novelty and utility, which are fundamental to intellectual property, can be shaped by cultural factors.
The practice of CEO duality—where one individual serves as both the CEO and the chair of the board—raises a key question in corporate governance: does it strengthen or weaken the relationship between patents and a firm’s corporate performance? This question remains one of the most critical and debated issues in corporate governance research and practice, with no definitive conclusion reached to date [66].
In this context, agency and stewardship theories present conflicting views. Agency theory argues that separating the roles of board chair and CEO enables more effective monitoring and control of the CEO, suggesting that companies without this separation may experience reduced performance [67]. In contrast, stewardship theory posits that combining these roles creates strong, unified leadership, allowing for faster, more decisive actions. As a result, firms with duality in leadership are often seen as achieving superior performance compared to those that maintain a division between the two roles [68].
In the United States, the roles of the CEO and the board of directors are typically separated. Empirical research on American firms practicing CEO duality suggests that these companies tend to exhibit weaker corporate governance [69,70]. In Asia, findings are mixed. For instance, a study on 145 non-financial listed firms in India observed that CEO duality negatively affects firm’s corporate performance [71]. Conversely, research on 146 listed manufacturing firms in Pakistan found that higher board independence strengthens the positive association between CEO duality and financial performance [72]. In Egypt, a study of listed companies revealed that the impact of CEO duality on corporate performance varies across industries and institutional contexts, showing a positive impact in sectors such as textiles, packaging, natural gas, oil, food, and real estate, but a negative impact in the cement industry [70].
Although the debate remains unresolved, a notable commonality among most studies is their reliance on samples from corporations in advanced economies, particularly the United States [73]. Recently, however, an increasing number of studies have focused on developing countries, offering valuable insights into corporate behavior and performance within economic and social contexts that differ from those of developed nations. Within this framework, China’s unique institutional environment provides a significant area of interest for exploring the role of the CEO. Thus, we propose that both internal factors, such as CEO duality, and external environmental influences impact the relationship between patents and corporate performance in firms.
Hypothesis 3.
The role of firms, multi-party networks, and communities in contributing to firms’ corporate performance should be considered.
3. Material and Methods
3.1. Material
In selecting the sample, it is crucial to focus on companies with relatively constant factors influencing patent propensity to minimize systematic biases in the empirical results. Our study is confined to Chinese firms, specifically a homogeneous group of publicly listed companies in the solar energy sector, to control for national- and industry-level factors affecting patent propensity. This approach offers several advantages. First, there is a substantial amount of available data on these companies, providing a solid foundation for meaningful analysis. Second, by concentrating on publicly listed companies within the solar energy industry, we can reasonably assume that time lags exist when economic impacts materialize [12,13,14].
We searched the A-stock market using the keywords ‘solar power’ and ‘solar energy’, referencing works by Luan (2022) and Liu (2021) [74,75]. To refine the search, we incorporated key product terms such as ‘monocrystalline silicon’, ‘polycrystalline silicon’, ‘silicon wafers’, ‘solar cells’, and ‘solar modules’. The selected sample consists of companies listed before 2023, with data spanning from 2012 to 2022. Firms classified as special treatment (ST) and those missing key variables were excluded, resulting in 457 publicly listed companies identified as potential subjects for empirical analysis. The final dataset includes 3465 balanced panel samples. This database facilitates mandatory information disclosure, allowing us to extract relevant performance and control variables from annual reports. To verify the selected companies’ relevance to the solar energy industry, we conducted a thorough review of each firm’s annual reports, supplementing any missing data through manual inspection. The chosen firms represent various stages of the solar energy value chain and reflect a range of profitability and scale.
3.2. Variables and Data
This study analyzes the relationship between innovation in China’s solar energy industry and corporate performance. We have established patent applications as the independent variable and return on assets (ROA) as the dependent variable. To ensure the robustness of the results, we also include patent rights and return on equity (ROE) as supplementary indicators. To control for the effect of firm heterogeneity on our research questions, we select various indicators in terms of firm size, financial leverage, and ownership concentration as control variables.
The literature extensively examines the relationship between corporate innovation and performance, with most studies incorporating firm size as a control variable to empirically assess the impact of intellectual property rights on economic and financial outcomes. In our case, this control variable is critical because the dependent variable is ex-pressed in levels. We measure firm size based on total assets to determine the research sample.
Moreover, previous research frequently used firm age to control for lifecycle effects when analyzing the relationship between economic and financial performance and intellectual property rights. Our analysis includes firm age, based on years since establishment, aiming to provide as much detail as possible.
Market power refers to the competitive position a firm occupies within an industry, which reflects its ability to set prices and control resources in the market. Firms with strong market power typically hold a favorable position within the supply chain, providing greater flexibility in pricing and cost control. This advantage allows these firms to sustain high-profit margins and respond more effectively to external shocks. There is a risk that excessive reliance could weaken innovation dynamics. Thus, we include this factor as a research criterion to gain deeper insights into the development stage of companies within China’s solar industry [48,76,77].
Financial leverage is measured by the debt-to-asset ratio. Higher financial leverage increases debt repayment burdens, often leading firms to prioritize rapid debt reduction. Excessive repayment pressures may disrupt regular operations, potentially impacting corporate performance. Cash flow levels indicate a firm’s liquidity and short-term payment capacity, reflecting its ability to maintain capital turnover and manage unexpected payment demands in daily operations. Additionally, operating profit growth demonstrates trends in core business profitability, serving as an indicator of operational efficiency and market demand. Therefore, these two indicators are included as control variables [43,78,79].
Some scholars have found that higher ownership concentration can enhance a firm’s long-term profitability and overall performance. In this study, we controlled for ownership concentration using widely recognized indicators, including the shareholding ratio of the largest shareholder, management shareholding, and whether executives hold dual roles (CEO duality) [70,80].
To reduce potential distortions in the original data, we applied logarithmic transformations to all variables, including patent applications, firm size, market power, and firm age. Detailed definitions and calculations for all relevant data are presented in Table 3 below.
Table 3.
Definitions and descriptions of key variables.
3.3. Research Model
The panel data model incorporates both cross-sectional and time dimensions. Let i (where i = 1, …, N) represent the cross-sectional units (entities), and t (where t = 1, …, T) denote the time periods. A linear model can thus be formulated as follows:
In this model, represents K × 1 dependent variable while xkit denotes K × n matrix of explanatory variables.
represents individual effects, which are constant over time, reflecting characteristics unique to each entity.
denotes time effects that control for influences that vary across different time periods.
refers to the disturbance term in the model. For example, economic cycle and macroeconomic factors, policy and regulatory changes, market competition and industry environment, etc.
The fixed effects model serves as a suitable framework for investigating specific group contexts, with the two-way fixed effects model emerging as a fundamental method for estimating causal effects within panel data [79,81].
4. Empirical Research and Results
4.1. Descriptive Statistics, Multicollinearity, and Correlation Analysis
In this study, we conducted descriptive statistics to validate the fundamental characteristics of the selected data.
Table 4 shows that the average value of the dependent variable ROA(y) is 0.0280, with a median of 0.0310, a standard deviation of 0.0590, a minimum value of −0.269, and a maximum value of 0.170. This indicates that while the average ROA among the sampled firms is relatively low, there is a degree of variability present. The independent variable, patent applications (x), has an average of 1.710, a median of 1.609, a standard deviation of 1.578, a minimum of 0, and a maximum of 5.680. This suggests that the number of patent applications in our sample shows some variability, while the average level is relatively high. The mean of patent rights (x1) is 1.657, the median is 1.609, the standard deviation is 1.502, the minimum is 0, and the maximum is 7.954. To a certain extent, this verifies the quality of the patent application data of Chinese solar energy listed companies.
Table 4.
Descriptive statistics.
As for the control variables, the data of firm size (c1), asset–liability ratio (c2), cash flow level (c3), market power (c5), firm age (c6), and board size (c10) show that the sample firms have a concentrated trend and are relatively stable. The data of the growth rate of operating income (c4), first shareholder ownership ratio (c7), and management ownership ratio (c8) show that the sample companies are variable or large. Factors such as firm size, development stage, and market positioning influence the growth rate of operating inputs. Some companies are controlled by founders or families (like Tongwei Co., Ltd.), resulting in a difference in the shareholding ratio of the largest shareholder and management shareholding. In addition, the data on CEO duality (c9) show that 33.7% of the sample companies adopt it.
Table 5 presents the results of the multicollinearity test for the explanatory variables listed in Table 3. The Variance Inflation Factor (VIF) is a key metric used to assess the severity of multicollinearity in multiple linear regression models. Specifically, the VIF indicates the ratio of the variance of estimated regression coefficients, taking into account nonlinear relationships among the independent variables, compared to the variance assuming no multicollinearity.
Table 5.
Variance Inflation Factor (VIF) multicollinearity test.
Multicollinearity implies a linear relationship among independent variables, meaning that one independent variable may be a linear combination of one or more others. A VIF value of 10 is commonly used as a threshold. Generally, if the VIF is less than 10, multicollinearity is considered absent; if it falls between 10 and 100, strong multicollinearity is present; and if it is 100 or greater, severe multicollinearity is indicated.
In this study, the VIF values for all variables mentioned are below 10, and the results for 1/VIF are all greater than 0.1. The average VIF is 1.23, significantly below the threshold of 10, indicating no substantial multicollinearity among the variables. This suggests that the independent variables are sufficiently independent, thus reinforcing the validity of the regression analysis conducted in this research.
After obtaining the relevant data, it is essential to analyze data and investigate the relationships between the variables. Correlation analysis is a widely utilized method for this purpose. It is a statistical technique that focuses solely on examining and analyzing the correlation between variables without considering causal relationships.
As shown in Table 6, the correlation coefficients for all variables in this study are generally not close to −1 or 1, typically falling between −0.5 and 0.5. This range indicates that the independence of each variable is somewhat assured, suggesting a low likelihood of negatively affecting the regression analysis. This outcome reflects the overall reliability of the selected data and alleviates the potential multicollinearity issues within the regression equation, thereby facilitating subsequent regression analyses.
Table 6.
Correlation analysis of each variable.
4.2. Empirical Research Results and Analysis
After completing the above steps, we conducted an empirical analysis, and the results are shown in Table 7. In the regression process, we used patent applications as the primary variable and included additional control variables to enhance the stability of the results.
Table 7.
Baseline regression results.
In the estimation results table, the first column presents the regression using patent applications (x) as the explanatory variable. The regression outcome shows that patent applications are statistically significant at the 1% level, with a coefficient of 0.00471. This suggests that for each unit increase in patent applications, ROA increases by 0.00471 units, indicating a positive relationship between the number of patent applications and ROA. In the second column, after adding control variables, the coefficient for patent applications (x) is reported as 0.00341. This indicates that with each unit increase in patent applications, ROA is expected to rise by an average of 0.00341 units. These findings support the idea that patent applications positively impact corporate asset profitability. Furthermore, even after including control variables, the regression coefficient value shows only minor fluctuations and remains significant, further validating our hypothesis 1.
The results of the lagged panel regression analysis on the impact of patent applications on ROA are presented in Table 8. Notably, several findings warrant emphasis. The patent application variable accounts for a significant portion of the variance in ROA. The R2 values of 35.4%, 33.9%, 33.4%, 35.9%, 36.5%, 38.1%, and 39.7% indicate substantial robustness of the estimated models concerning the issues investigated.
Table 8.
Results of time difference panel regression analysis.
In conclusion, concerning our initial hypothesis 2, it is essential to highlight the following findings, the impact of patent applications in China’s solar energy industry on firm ROA persists throughout 6 to 7 years. While the overall effect of this lag diminishes over time, it remains statistically significant for up to 7 years, indicating that patent applications exert a long-term influence on the dependent variable.
In the study, China is categorized into eastern, central, and western regions according to the economic zone divisions outlined in the 7th Five-Year Plan. By analyzing how patent applications from solar energy companies in these different regions impact financial performance, we explore the intricate processes involved in innovation. China faces significant regional disparities in economic development due to its vast geographical differences. This imbalance poses a critical challenge to the country’s economic advancement. Such disparities provide a practical foundation and data support for the in-depth analysis presented in this study [82,83].
As illustrated in Figure 2, the eastern region of China comprises twelve provincial-level districts, including Liaoning, Beijing, Tianjin, Hebei, Shandong, Jiangsu, Shanghai, Zhejiang, Fujian, Guangdong, Guangxi, and Hainan. The central region includes nine provincial-level areas, specifically Heilongjiang, Jilin, Inner Mongolia, Shanxi, Henan, Anhui, Hubei, Hunan, and Jiangxi. The western region, meanwhile, consists of ten provincial-level districts: Xinjiang, Gansu, Ningxia, Shaanxi, Tibet, Qinghai, Sichuan, Chongqing, Yunnan, and Guizhou.
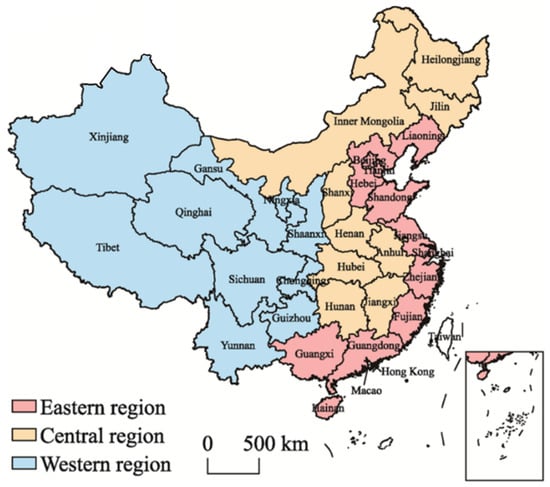
Figure 2.
Regional divisions of eastern, central, and western of China.
China’s eastern region benefits from a unique geographic position and strong economic growth, prompting numerous studies that compare it with the central and western regions. In this study, data from solar energy companies in the eastern region (2510 companies) and the central and western regions (955 companies) were separated to investigate the impact of patent applications on firm’s corporate performance in each region [84,85].
As shown in Table 9, in the eastern region, patent applications have a significant positive impact on firm’s corporate performance, with a regression coefficient of 0.00452. It indicates that for each unit increase in patent applications, corporate ROA increases by 0.000452. In contrast, in the central and western regions, the regression coefficient for the impact of patent applications on firm’s corporate performance is 0.00081, which is not statistically significant.
Table 9.
Regional heterogeneity test.
The empirical results of the control variables indicate that variables such as firm size (c1), cash flow level (c3), market power (c5), and executive shareholding (c8) have a significantly more positive impact on firm’s corporate performance in the central and western regions than in the eastern region. These control variables play a more crucial role in enhancing corporate performance in the central and western areas.
Subsequently, data on Chinese solar industry firms were categorized based on state ownership status, dividing the firms into state-owned enterprises (SOEs) (2464 firms) and non-state-owned enterprises (NSOEs) (1001 firms). This analysis examines the mechanisms through which patent applications influence the performance of these two groups. SOEs are economic entities in which the government holds a majority or total equity stake and exercises control through administrative, legal, and market channels. In contrast, NSOEs are owned by individuals or other non-governmental entities and primarily aim to maximize profits through market mechanisms. Compared to NSOEs, SOEs receive both economic and political support from the government [86,87,88,89]. The empirical findings are summarized in Table 10.
Table 10.
Analysis of heterogeneity by nature of listed companies.
As shown in Table 10, patent applications by SOEs have a significant positive impact on corporate performance, with a regression coefficient of 0.00412. In contrast, the regression coefficient for patent applications by NSOEs is 0.00180, which is also statistically significant but indicates a weaker effect. The empirical results for the control variables reveal that only firm age (c6) and CEO duality (c9) have a more pronounced positive impact on NSOEs than on SOEs. These variables play a more critical role in enhancing corporate performance for NSOEs, suggesting that CEO duality may positively moderate the performance of NSOEs, particularly under conditions such as resource constraints and environmental volatility [90,91].
This underscores the path dependency inherent in the processes of invention, development, and implementation, illustrating the complexity of evolutionary dynamics in innovation processes [38]. Unlike NSOEs, SOEs benefit from both economic and political support from the government [88,89]. These features of the innovation process create relational complexity through the interaction and entanglement of social and material elements [92,93]. The innovation process is constituted through recursive interactions among various actors and artifacts, where changes in one component can lead to shifts in others in an intertwined and co-evolving manner [38].
The sample firms were classified based on whether they exhibited CEO duality and a heterogeneity analysis was conducted. The results are presented in Table 11.
Table 11.
Analysis of heterogeneity in two-job integration of listed companies.
Based on the results of the basic regression in Table 7, it was found that CEO duality as a control variable has a positive impact on the firm’s corporate performance, with a regression coefficient of 0.00355, which is statistically significant at the 5% level. The heterogeneity analysis results, as presented in Table 11, indicate that regardless of CEO duality, patent applications have a significant positive impact on a firm’s corporate performance, with regression coefficients of 0.00362 and 0.00337, respectively. There is a slight advantage in the coefficient for firms with CEO duality. While CEO duality positively affects corporate performance, it is not the sole determinant, as other variables (such as firm size, and market power) also have a significant influence. Therefore, the positive consequences remain consistent regardless of CEO duality. Further research is needed to distinguish the independent contribution of CEO duality to a firm’s corporate performance from other variables.
In our initial hypothesis 3, it is critical to consider the roles of firms, multi-lateral networks, and communities in determining how patent applications contribute to a firm’s corporate performance; for firms in Eastern China, state-owned enterprises, and firms where the CEO also serves as the chairperson (dual roles), patent applications have a significantly more positive impact on a firm’s corporate performance, and this has been confirmed.
5. Conclusions and Limitations
5.1. Conclusions
The results of our panel analysis demonstrate robust findings, with high statistical reliability across the estimation models. Our findings show that patent applications have a positive effect on firms’ ROA, and the inclusion of additional control variables further underscores the stability of these results. Additionally, our analysis reveals that patent applications positively impact financial performance, even with a 6–7-year lag. To examine the differential effects, we segmented the sample firms into groups based on their location in Eastern China, their status as state-owned enterprises, and their practice of CEO duality. Heterogeneity tests were then conducted, and the results indicate that firms located in Eastern China, state-owned enterprises, and those practicing CEO duality benefit more substantially from the positive effects of patent applications. The roles of firms, multilateral networks, and communities are instrumental in ensuring that patent applications effectively contribute to corporate performance. Overall, our study provides empirical evidence confirming that patents positively impact firms’ financial performance.
5.2. Contributions to the Literature
The theoretical significance of this paper is grounded in three main contributions. First, this study extends research on the relationship between patents and corporate performance, thereby enriching the existing literature. Unlike prior studies, which have not specifically focused on China’s solar energy industry, this research empirically examines how patents influence corporate performance within this sector. By examining the mechanisms and asymmetric effects of firm and regional heterogeneity, it provides a nuanced perspective on this relationship, offering valuable insights and references for future studies.
Second, this study provides new micro-level evidence on the protection of patent development within the framework of sustainable development. The empirical analysis shows that patent applications positively influence firm ROA not only in the short term but also in the medium to long term (6–7 years). Patents thus serve as a vital mechanism for safeguarding technological advantages in this industry. Protecting intellectual property in sectors like solar energy boosts corporate economic performance while contributing to sustainable development across economic and energy domains.
Third, this study emphasizes the complexity inherent in the transition toward innovation activities. Innovations originating in emerging markets are increasingly shaping the innovation landscape of developed markets. However, innovations successful in one environment are not necessarily easy to adopt in another [94]. More broadly, cultural complexity implies that innovation cannot simply be transferred across social contexts without modification; instead, it often requires reinvention [95] and redesign [96]. When firms in developing countries “flock together” to build and expand capabilities tailored to their unique contexts, they may achieve greater success in expanding to other developing nations with similar national, political, and institutional conditions than to developed countries. Firms from developed nations may lack the tacit knowledge necessary to adapt innovations to local practices in these emerging markets. Further research into this field will enhance our understanding of innovation flows within an increasingly interconnected global landscape [94].
5.3. Implications for Practice
First, this study emphasizes the protective and informational roles of patents. Solar companies should strategically leverage patents to safeguard proprietary technologies and enhance economic performance through continuous technological research, innovation, and development.
Second, patent data offer essential support for aligning internal R&D strategies, monitoring competitor technologies, and forecasting technological trends. Since patent activities often precede significant market shifts, timely analysis of competitors’ patent activities is crucial. This information not only helps companies assess their technological competitiveness but also serves as a predictive tool for anticipating shifts in the competitive landscape.
Third, companies in eastern regions, state-owned enterprises, and those with CEO duality, should intensify efforts in technological innovation. Actively leveraging intellectual property protections allows these firms to more effectively convert innovation into economic gains. Additionally, their strong resource integration and coordination capabilities offer a distinct advantage.
Fourth, the government should continue to foster regional marketization and cultivate a social environment supportive of technological innovation. It includes providing resource support, like training and exchange forums, particularly for the solar energy firms facing competitive disadvantages, to bolster their innovation capabilities to balance industry growth and promote sustainable development.
5.4. Limitations and Prospects
As with most studies, our research has certain limitations. First, our focus on a specific area within the solar energy industry highlights the need for broader empirical validation across other sectors to generalize the findings. Second, this study examines only firms within China, the world’s largest developing country; future research could extend this analysis to firms in developed countries to further test the robustness of our core findings. Third, our study primarily employs a qualitative approach to assess patent application quality, which limits the potential for developing a quantitative evaluation framework. Additionally, empirical research that relies on patent data encounters substantial data collection challenges, given the specific structural demands of patent records.
Funding
This research received no external funding.
Institutional Review Board Statement
Not applicable.
Informed Consent Statement
Not applicable.
Data Availability Statement
The data that support the findings of this study are available from the corresponding author upon reasonable request.
Conflicts of Interest
The author declares that they have no known competing financial interests or personal relationships that could have appeared to influence the work reported in this paper.
Abbreviations
| R&D | Research and Development |
| ROI | Return on Investment |
| ROE | Return on Equity |
| ROA | Return on Assets |
| RBV | Resource-Based View |
| CEO | Chief Executive Officer |
| SOEs | State-Owned Enterprises |
| NSOEs | Non-State-Owned Enterprises |
References
- Kaviti, A.K.; Akkala, S.R.; Sikarwar, V.S.; Sai Snehith, P.; Mahesh, M. Camphor-Soothed Banana Stem Bio-Waste in the Productivity and Sustainability of Solar-Powered Desalination. Appl. Sci. 2023, 13, 1652. [Google Scholar] [CrossRef]
- Kaviti, A.K.; Akkala, S.R.; Ali, M.A.; Anusha, P.; Sikarwar, V.S. Performance Improvement of Solar Desalination System Based on CeO2-MWCNT Hybrid Nanofluid. Sustainability 2023, 15, 4268. [Google Scholar] [CrossRef]
- Vahidhosseini, S.M.; Rashidi, S.; Hsu, S.H.; Yan, W.M.; Rashidi, A. Integration of Solar Thermal Collectors and Heat Pumps with Thermal Energy Storage Systems for Building Energy Demand Reduction: A Comprehensive Review. J. Energy Storage 2024, 95, 112568. [Google Scholar] [CrossRef]
- Jayathunga, D.S.; Karunathilake, H.P.; Narayana, M.; Witharana, S. Phase Change Material (PCM) Candidates for Latent Heat Thermal Energy Storage (LHTES) in Concentrated Solar Power (CSP) Based Thermal Applications—A Review. Renew. Sustain. Energy Rev. 2024, 189, 113904. [Google Scholar] [CrossRef]
- Fang, J.; Yang, M.; Sui, J.; Luo, T.; Yu, Y.; Ao, Y.; Dou, R.; Zhou, W.; Li, W.; Liu, X.; et al. Enhancing Solar-Powered Hydrogen Production Efficiency by Spectral Beam Splitting and Integrated Chemical Energy Storage. Appl. Energy 2024, 372, 123833. [Google Scholar] [CrossRef]
- World Energy Council (WEC). World Energy Resources: Waste to Energy; World Energy Council: London, UK, 2018. [Google Scholar]
- Yu, S.; Han, R.; Zhang, J. Reassessment of the Potential for Centralized and Distributed Photovoltaic Power Generation in China: On a Prefecture-Level City Scale. Energy 2023, 262, 125436. [Google Scholar] [CrossRef]
- Braun, F.G.; Schmidt-Ehmcke, J.; Zloczysti, P. Innovative Activity in Wind and Solar Technology: Empirical Evidence on Knowledge Spillovers Using Patent Data. In Discussion Paper 993; German Institute for Economic Research: Berlin, Germany, 2010. [Google Scholar]
- Liu, Q.; Lei, Q.; Xu, H.; Yuan, J. China’s Energy Revolution Strategy into 2030. Resour. Conserv. Recycl. 2018, 128, 78–89. [Google Scholar] [CrossRef]
- Quitzow, R.; Huenteler, J.; Asmussen, H. Development Trajectories in China’s Wind and Solar Energy Industries: How Technology-Related Differences Shape the Dynamics of Industry Localization and Catching Up. J. Clean. Prod. 2017, 158, 122–133. [Google Scholar] [CrossRef]
- Van Eynde, S.; Chang, P.F. Explaining the Development of China’s Renewable Energy Policies: Comparing Wind and Solar Power. In Governance of Climate Relations Between Europe and Asia: Evidence from China and Vietnam as Key Emerging Economies; Edward Elgar: Cheltenham, UK, 2013; pp. 76–106. [Google Scholar]
- Lacasa, I.D.; Shubbak, M.H. Drifting Towards Innovation: The Co-Evolution of Patent Networks, Policy, and Institutions in China’s Solar Photovoltaics Industry. Energy Res. Soc. Sci. 2018, 38, 87–101. [Google Scholar] [CrossRef]
- Shubbak, M.H. Advances in Solar Photovoltaics: Technology Review and Patent Trends. Renew. Sustain. Energy Rev. 2019, 115, 109383. [Google Scholar] [CrossRef]
- Hu, F.; Qiu, L.; Wei, S.; Zhou, H.; Bathuure, I.A.; Hu, H. The Spatiotemporal Evolution of Global Innovation Networks and the Changing Position of China: A Social Network Analysis Based on Cooperative Patents. R&D Manag. 2024, 54, 574–589. [Google Scholar]
- Kretschmer, M.; Soetendorp, R. The Strategic Use of Business Method Patents: A Pilot Study of Out of Court Settlements. J. e-Bus. 2001, 2, 9–38. [Google Scholar]
- Ernst, H. Patenting Strategies in the German Mechanical Engineering Industry and Their Relationship to Company Performance. Technovation 1995, 15, 225–240. [Google Scholar] [CrossRef]
- Belderbos, R.; Faems, D.; Leten, B.; Looy, B.V. Technological Activities and Their Impact on the Financial Performance of the Firm: Exploitation and Exploration Within and Between Firms. J. Prod. Innov. Manag. 2010, 27, 869–882. [Google Scholar] [CrossRef]
- Basberg, B.L. Patents and the Measurement of Technological Change: A Survey of the Literature. Res. Policy 1987, 16, 131–141. [Google Scholar] [CrossRef]
- Pavitt, K. Patent Statistics as Indicators of Innovative Activities: Possibilities and Problems. Scientometrics 1985, 7, 77–99. [Google Scholar] [CrossRef]
- Griliches, Z. Patent Statistics as Economic Indicators: A Survey. J. Econ. Lit. 1990, 28, 1661–1707. [Google Scholar]
- Ernst, H. Patent Portfolios for Strategic R&D Planning. J. Eng. Technol. Manag. 1998, 15, 279–308. [Google Scholar]
- P Pavitt, K. Uses and Abuses of Patent Statistics. In Handbook of Quantitative Studies of Science and Technology; Elsevier: Amsterdam, The Netherlands, 1988; pp. 509–536. [Google Scholar]
- Harhoff, D.; Scherer, F.M.; Vopel, K. Citations, Family Size, Opposition and the Value of Patent Rights. Res. Policy 2003, 32, 1343–1363. [Google Scholar] [CrossRef]
- Lanjouw, J.O.; Schankerman, M. Patent Quality and Research Productivity: Measuring Innovation with Multiple Indicators. Econ. J. 2004, 114, 441–465. [Google Scholar] [CrossRef]
- Taglialatela, J.; Barontini, R. SMEs and Patents: Is It Worth It? A Longitudinal Analysis of the Patent-Performance Relationship. J. Econ. Bus. 2024, 128, 106147. [Google Scholar] [CrossRef]
- Schmookler, J. Invention and Economic Growth; Harvard University Press: Cambridge, MA, USA, 1966. [Google Scholar]
- Schankerman, M.; Pakes, A. Estimates of the Value of Patent Rights in European Countries During the Post-1950 Period. Econ. J. 1986, 96, 1052–1076. [Google Scholar] [CrossRef]
- Schmoch, U.; Grupp, H.; Mannsbart, W.; Schwitalla, B. Technikprognosen mit Patentindikatoren; Verlag TUV-Rheinland: Koln, Germany, 1988. [Google Scholar]
- Mansfield, E. Patents and Innovation: An Empirical Study. Manag. Sci. 1986, 32, 173–181. [Google Scholar] [CrossRef]
- Scherer, F. Using Linked Patent and R&D Data to Measure Interindustry Technology Flows. In R&D, Patents, and Productivity; University of Chicago Press: Chicago, IL, USA, 1984; pp. 417–464. [Google Scholar]
- Arundel, A.; Kabla, I. What Percentage of Innovations Are Patented? Empirical Estimates for European Firms. Res. Policy 1998, 27, 127–141. [Google Scholar] [CrossRef]
- Basalla, G. The Evolution of Technology; Cambridge University Press: Cambridge, MA, USA, 1988. [Google Scholar]
- Aldrich, H.E.; Fiol, C.M. Fools Rush In? The Institutional Context of Industry Creation. Acad. Manag. Rev. 1994, 19, 645–670. [Google Scholar] [CrossRef]
- Dougherty, D.; Heller, T. The Illegitimacy of Successful Product Innovation in Established Firms. Organ. Sci. 1994, 5, 200–218. [Google Scholar] [CrossRef]
- Lounsbury, M.; Glynn, M.A. Cultural Entrepreneurship: Stories, Legitimacy, and the Acquisition of Resources. Strateg. Manag. J. 2001, 22, 545–564. [Google Scholar] [CrossRef]
- Cooper, R.G. Stage-Gate Systems: A New Tool for Managing New Products. Bus. Horiz. 1990, 33, 44–54. [Google Scholar] [CrossRef]
- Cooper, R.G. Winning at New Products, 3rd ed.; Basic Books: New York, NY, USA, 2001. [Google Scholar]
- Garud, R.; Tuertscher, P.; Van de Ven, A.H. Perspectives on Innovation Processes. Acad. Manag. Annals 2013, 7, 775–819. [Google Scholar] [CrossRef]
- Narin, F.; Noma, E.; Perry, R. Patents as Indicators of Corporate Technological Strength. Res. Policy 1987, 16, 143–155. [Google Scholar] [CrossRef]
- Griliches, Z.; Hall, B.H.; Pakes, A. R&D, Patents, and Market Value Revisited: Is There a Second Technological Opportunity Factor? Econ. Innov. New Technol. 1991, 1, 183–201. [Google Scholar]
- Agostini, L.; Caviggioli, F.; Filippini, R.; Nosella, A. Does Patenting Influence SME Sales Performance? A Quantity and Quality Analysis of Patents in Northern Italy. Eur. J. Innov. Manag. 2015, 18, 238–257. [Google Scholar] [CrossRef]
- Artz, K.W.; Norman, P.M.; Hatfield, D.E.; Cardinal, L.B. A Longitudinal Study of the Impact of R&D, Patents, and Product Innovation on Firm Performance. J. Prod. Innov. Manag. 2010, 27, 725–740. [Google Scholar]
- Scherer, F.M. Firm Size, Market Structure, Opportunity, and the Output of Patented Inventions. Am. Econ. Rev. 1965, 55, 1097–1125. [Google Scholar]
- Kim, D.; Kim, N.; Kim, W. The effect of patent protection on firms’ market value: The case of the renewable energy sector. Renew. Sustain. Energy Rev. 2018, 82, 4309–4319. [Google Scholar] [CrossRef]
- Phillips, A. Patents, Potential Competition, and Technical Progress. Am. Econ. Rev. 1966, 56, 301–310. [Google Scholar]
- Garud, R.; Gehman, J.; Kumaraswamy, A. Complexity Arrangements for Sustained Innovation: Lessons from 3M Corporation. Organ. Stud. 2011, 32, 737–767. [Google Scholar] [CrossRef]
- Wernerfelt, B. A Resource-Based View of the Firm. Strateg. Manag. J. 1984, 5, 171–180. [Google Scholar] [CrossRef]
- Kim, Y.K.; Lee, K.; Park, W.G.; Choo, K. Appropriate Intellectual Property Protection and Economic Growth in Countries at Different Levels of Development. Res. Policy 2012, 41, 358–375. [Google Scholar] [CrossRef]
- Teece, D.J. Profiting from Technological Innovation: Implications for Integration, Collaboration, Licensing and Public Policy. Res. Policy 1986, 15, 285–305. [Google Scholar] [CrossRef]
- Graham, S.J.; Merges, R.P.; Samuelson, P.; Sichelman, T. High Technology Entrepreneurs and the Patent System: Results of the 2008 Berkeley Patent Survey. Berkeley Tech. Law J. 2009, 24, 1255–1327. [Google Scholar] [CrossRef]
- Rogers, E.M. Bibliography on the Diffusion of Innovations; Department of Agricultural Economics and Rural Sociology Ohio Agricultural Experiment Station: Columbus, OH, USA, 1961. [Google Scholar]
- Romer, P.M. Endogenous Technological Change. J. Polit. Econ. 1990, 98, S71–S102. [Google Scholar] [CrossRef]
- Utterback, J.M.; Abernathy, W.J. A Dynamic Model of Process and Product Innovation. Omega 1975, 3, 639–656. [Google Scholar] [CrossRef]
- Howitt, P.; Aghion, P. Capital Accumulation and Innovation as Complementary Factors in Long-Run Growth. J. Econ. Growth 1998, 3, 111–130. [Google Scholar] [CrossRef]
- Hall, B.H.; Griliches, Z.; Hausman, J.A. Patents and R&D: Is There a Lag? Int. Econ. Rev. 1986, 27, 265–283. [Google Scholar]
- Sichelman, T. Commercializing Patents. Stan. L. Rev. 2009, 62, 341. [Google Scholar]
- Cohen, W.M.; Nelson, R.R.; Walsh, J.P. Links and Impacts: The Influence of Public Research on Industrial R&D. Manag. Sci. 2002, 48, 1–23. [Google Scholar]
- Hall, R.E. Employment Fluctuations with Equilibrium Wage Stickiness. Am. Econ. Rev. 2005, 95, 50–65. [Google Scholar] [CrossRef]
- Schumpeter, J. Innovation: The Theory of Economic Development; Entrepreneurship; Edward Elgar: Cheltenham, UK, 1934. [Google Scholar]
- Salancik, G.R.; Pfeffer, J. A Social Information Processing Approach to Job Attitudes and Task Design. Adm. Sci. Q. 1978, 23, 224–253. [Google Scholar] [CrossRef]
- Pfeffer, J.; Salancik, G. External Control of Organizations—Resource Dependence Perspective. In Organizational Behavior 2; Routledge: London, UK, 2015; pp. 355–370. [Google Scholar]
- Adner, R.; Kapoor, R. Value Creation in Innovation Ecosystems: How the Structure of Technological Interdependence Affects Firm Performance in New Technology Generations. Strateg. Manag. J. 2010, 31, 306–333. [Google Scholar] [CrossRef]
- Chesbrough, H.W. Open Innovation: The New Imperative for Creating and Profiting from Technology; Harvard Business School Press: Cambridge, MA, USA, 2003. [Google Scholar]
- Nahapiet, J.; Ghoshal, S. Social Capital, Intellectual Capital, and the Organizational Advantage. Acad. Manag. Rev. 1998, 23, 242–266. [Google Scholar] [CrossRef]
- Brown, J.S.; Duguid, P. Organizational Learning and Communities-of-Practice: Toward a Unified View of Working, Learning, and Innovation. Organ. Sci. 1991, 2, 40–57. [Google Scholar] [CrossRef]
- Finkelstein, S.; D’aveni, R.A. CEO Duality as a Double-Edged Sword: How Boards of Directors Balance Entrenchment Avoidance and Unity of Command. Acad. Manag. J. 1994, 37, 1079–1108. [Google Scholar] [CrossRef]
- Rechner, P.L.; Dalton, D.R. CEO Duality and Organizational Performance: A Longitudinal Analysis. Strateg. Manag. J. 1991, 12, 155–160. [Google Scholar] [CrossRef]
- Donaldson, L.; Davis, J.H. Stewardship Theory or Agency Theory: CEO Governance and Shareholder Returns. Aust. J. Manag. 1991, 16, 49–64. [Google Scholar] [CrossRef]
- Chien, I.; Chen, Y.J.; Hsieh, T.J. CEO Compensation and Earnings Sensitivity: A Perspective from CEO Duality. Global J. Bus. Res. 2018, 12, 1–13. [Google Scholar]
- Elsayed, K. Does CEO Duality Really Affect Corporate Performance? Corp. Gov. Int. Rev. 2007, 15, 1203–1214. [Google Scholar] [CrossRef]
- Shrivastav, S.M.; Kalsie, A. The Relationship Between CEO Duality and Firm Performance: An Analysis Using Panel Data Approach. IUP J. Corp. Gov. 2016, 15, 37–58. [Google Scholar]
- Din, S.U.; Khan, W.; Saleem, F.; Khan, M.Y. CEO Duality, Board Independence and Firm Financial Performance: Evidence from an Asian Emerging Market. Sarhad J. Manag. Sci. 2024, 10, 59–78. [Google Scholar]
- Dalton, D.R.; Daily, C.M.; Ellstrand, A.E.; Johnson, J.L. Meta-Analytic Reviews of Board Composition, Leadership Structure, and Financial Performance. Strateg. Manag. J. 1998, 19, 269–290. [Google Scholar] [CrossRef]
- Luan, R.; Lin, B. Positive or negative? Study on the impact of government subsidy on the business performance of China’s solar photovoltaic industry. Renew. Energy 2022, 189, 1145–1153. [Google Scholar] [CrossRef]
- Liu, C.; Liu, L.; Zhang, D.; Fu, J. How does the capital market respond to policy shocks? Evidence from listed solar photovoltaic companies in China. Energy Policy 2021, 151, 112054. [Google Scholar] [CrossRef]
- Lin, B.W.; Chen, J.S. Corporate Technology Portfolios and R&D Performance Measures: A Study of Technology Intensive Firms. R&D Manag. 2005, 35, 153–166. [Google Scholar]
- Demirel, P.; Mazzucato, M. Innovation and Firm Growth: Is R&D Worth It? Ind. Innov. 2012, 19, 45–62. [Google Scholar]
- Yan, C.; Ji, Y.; Chen, R. Research on the Mechanism of Selective Industrial Policies on Enterprises’ Innovation Performance—Evidence from China’s Photovoltaic Industry. Renew. Energy. 2023, 215, 118868. [Google Scholar] [CrossRef]
- Imai, K.; Kim, I.S. On the Use of Two-Way Fixed Effects Regression Models for Causal Inference with Panel Data. Political Anal. 2021, 29, 405–415. [Google Scholar] [CrossRef]
- Warther, V.A. Board Effectiveness and Board Dissent: A Model of the Board’s Relationship to Management and Shareholders. J. Corp. Finance 1998, 4, 53–70. [Google Scholar] [CrossRef]
- Baltagi, B.H. Econometric Analysis of Panel Data, 5th ed.; John Wiley & Sons Ltd.: Hoboken, NJ, USA, 2013. [Google Scholar]
- Shen, H.; Teng, F.; Song, J. Evaluation of Spatial Balance of China’s Regional Development. Sustainability 2018, 10, 3314. [Google Scholar] [CrossRef]
- Deng, X.; Liang, L.; Wu, F.; Wang, Z.; He, S. A Review of the Balance of Regional Development in China from the Perspective of Development Geography. J. Geogr. Sci. 2022, 32, 3–22. [Google Scholar] [CrossRef]
- Li, Y.; Yang, X.; Ran, Q.; Wu, H.; Irfan, M.; Ahmad, M. Energy Structure, Digital Economy, and Carbon Emissions: Evidence from China. Environ. Sci. Pollut. Res. 2021, 28, 64606–64629. [Google Scholar] [CrossRef]
- Pan, W.; Xie, T.; Wang, Z.; Ma, L. Digital Economy: An Innovation Driver for Total Factor Productivity. J. Bus. Res. 2022, 139, 303–311. [Google Scholar] [CrossRef]
- Chang, H.J. Understanding the Relationship Between Institutions and Economic Development—Some Key Theoretical Issues. In Institutional Change and Economic Development; Anthem Press: London, UK, 2007; pp. 17–34. [Google Scholar]
- Shleifer, A. State Versus Private Ownership. J. Econ. Perspect. 1998, 12, 133–150. [Google Scholar] [CrossRef]
- Bonardi, J.P.; Hillman, A.J.; Keim, G.D. The Attractiveness of Political Markets: Implications for Firm Strategy. Acad. Manag. Rev. 2005, 30, 397–413. [Google Scholar] [CrossRef]
- Brandt, L.; Li, H. Bank Discrimination in Transition Economies: Ideology, Information, or Incentives? J. Comp. Econ. 2003, 31, 387–413. [Google Scholar] [CrossRef]
- Peng, M.W.; Li, Y.; Xie, E.; Su, Z. CEO Duality, Organizational Slack, and Firm Performance in China. Asia Pac. J. Manag. 2010, 27, 611–624. [Google Scholar] [CrossRef]
- Peng, M.W.; Zhang, S.; Li, X. CEO Duality and Firm Performance During China’s Institutional Transitions. Manag. Organ. Rev. 2007, 3, 205–225. [Google Scholar] [CrossRef]
- Callon, M. The Sociology of an Actor-Network: The Case of the Electric Vehicle. In Mapping the Dynamics of Science and Technology: Sociology of Science in the Real World; Palgrave Macmillan: London, UK, 1986; pp. 19–34. [Google Scholar]
- Latour, B. Reassembling the Social; Oxford University Press: New York, NY, USA, 2005. [Google Scholar]
- Van de Ven, A.H. The Context-Specific Nature of Competence and Corporate Development. Asia Pac. J. Manag. 2004, 21, 123–147. [Google Scholar] [CrossRef]
- Rogers, E.M.; Williams, D. Diffusion of Innovations; The Free Press: Glencoe, IL, USA, 1962. [Google Scholar]
- Sanderson, S.; Uzumeri, M. Managing Product Families: The Case of the Sony Walkman. Res. Policy 1995, 24, 761–782. [Google Scholar] [CrossRef]
Disclaimer/Publisher’s Note: The statements, opinions and data contained in all publications are solely those of the individual author(s) and contributor(s) and not of MDPI and/or the editor(s). MDPI and/or the editor(s) disclaim responsibility for any injury to people or property resulting from any ideas, methods, instructions or products referred to in the content. |
© 2025 by the author. Licensee MDPI, Basel, Switzerland. This article is an open access article distributed under the terms and conditions of the Creative Commons Attribution (CC BY) license (https://creativecommons.org/licenses/by/4.0/).