Article

A Multi-Stage Resilience Enhancement Method for Distribution Networks Employing Transportation and Hydrogen Energy Systems

by
Xi Chen
1,
Jiancun Liu
1,*,
Pengfei Li
1,
Junzhi Ren
2,
Delong Zhang
1 and
Xuesong Zhou
1
1
Tianjin Key Laboratory of New Energy Power Conversion, Transmission and Intelligent Control, Tianjin University of Technology, Tianjin 300384, China
2
State Key Laboratory of Intelligent Power Distribution Equipment and System, Tianjin University, Tianjin 300072, China
*
Author to whom correspondence should be addressed.
Sustainability 2025, 17(19), 8691; https://doi.org/10.3390/su17198691
Submission received: 3 August 2025 / Revised: 9 September 2025 / Accepted: 25 September 2025 / Published: 26 September 2025

Abstract

The resilience and sustainable development of modern power distribution systems faces escalating challenges due to increasing renewable integration and extreme events. Traditional single-system approaches often overlook the spatiotemporal coordination of cross-domain restoration resources. In this paper, we propose a multi-stage resilience enhancement method that employs transportation and hydrogen energy systems. This approach coordinates the pre-event preventive allocation and multi-stage collaborative scheduling of diverse restoration resources, including remote-controlled switches (RCSs), mobile hydrogen emergency resources (MHERs), and hydrogen production and refueling stations (HPRSs). The proposed framework supports cross-stage dynamic optimization scheduling, enabling the development of adaptive resource dispatch strategies tailored to the characteristics of different stages, including prevention, fault isolation, and service restoration. The model is applicable to complex scenarios involving dynamically changing network topologies and is formulated as a mixed-integer linear programming (MILP) problem. Case studies based on the IEEE 33-bus system show that the proposed method can restore a distribution system’s resilience to approximately 87% of its normal level following extreme events.

1. Introduction

With the continuous increase in the renewable energy penetration rates and frequency of extreme events, modern power systems are facing unprecedented operational security challenges [1,2]. As the end components of power systems, the resilience of distribution networks directly impacts socio-economic development [3]. For instance, during the 2021 Texas cold snap, approximately 40,000 MW of generating units were forced offline, leaving nearly 5 million customers without power [4]. In 2022, extreme heat in Sichuan Province triggered a six-day power outage across the entire province except Panzhihua and Liangshan, resulting in economic losses exceeding CNY 20 billion [5].
With the diversified development of energy systems, hydrogen energy is recognized as a crucial means to address environmental issues while serving as an alternative or backup to electricity [6]. A power–hydrogen combination offers high flexibility, capable of enhancing the resilience level of distribution systems under extreme events [7]. Furthermore, the coupling relationship between distribution and transportation networks has become increasingly significant. Following extreme events, mobile emergency resources need to be rapidly dispatched and allocated through transportation systems to ensure power is supplied to critical users [8]. Therefore, coordinated consideration of the recovery resources in distribution, transportation, and hydrogen energy systems holds substantial importance for improving the resilience of distribution systems.
In power distribution systems, coordinating remote-controlled switch (RCS)-based network reconfiguration with the operational control of controllable distributed generation (CDG) and energy storage systems (ESSs) can establish self-sufficient power supply islands to effectively isolate the impacts of line faults caused by extreme events. Reference [9] considered processes with multiple stages, including pre-event, fault isolation, and service restoration stages, and proposed a multi-stage resilience enhancement method. Reference [10] developed observable and defensible constraints for a distribution network reconfiguration method to address cyber–physical security threats such as false data injection attacks. Reference [11] proposed a distribution network resilience enhancement strategy based on scenario-dependent decision-making fuzzy sets and distributionally robust optimization. While these studies significantly contributed to improving power distribution systems’ resilience, they did not thoroughly explore the coupling and synergy between distribution and other systems.
Previous research has extensively investigated the coupling of power distribution and transportation systems. Reference [12] introduced a coordinated routing and charging scheduling method for electric vehicles (EVs), which optimizes EV charging station allocation, navigation routes, and power dispatch through real-time integration of transportation and power distribution network data. Reference [13] proposed a multi-resource collaborative scheduling framework for emergency response optimization in coupled transportation–power distribution networks under extreme events. Reference [14] developed a robust optimization method to enhance distribution systems’ resilience during ice disasters by coordinating path planning for mobile deicing devices, distribution network reconfiguration, and transportation system scheduling to address ice disaster prediction uncertainties. Reference [15] presented a synergistic topology reconfiguration method for power and drainage networks to be used during rainstorm disasters, aiming to improve multi-system recovery capabilities through optimized scheduling of Mobile Emergency Generators and Drainage Rescue Vehicles. Finally, Reference [16] proposed a two-stage stochastic optimization framework to coordinate the scheduling of Mobile Energy Storage Systems in coupled power distribution–transportation networks. Although the aforementioned studies coupled the power distribution and transportation systems, they did not incorporate a hydrogen energy system.
To further expand the applications of multi-energy coupling, studies have explored the coupling of power distribution, transportation, and hydrogen energy systems, combining three types of restoration resources. Reference [17] proposed a microgrid formation strategy based on time–distance modeling and robust optimization using information gap decision theory, significantly enhancing the system resilience under extreme disasters by coordinating flexible interactions between hydrogen refueling stations and renewable energy, along with a transportation-independent hydrogen transmission mechanism. However, this work neglected the dynamic changes in the network topology during extreme events. Reference [18] developed a resilience-constrained, tri-level mixed-integer programming framework, constructing a collaborative optimization model that integrates the traffic capacity, transportation delays, and network reconfiguration coupling constraints. It employed an improved nested column and constraint generation algorithm to achieve proactive deployment of and dynamic path planning for mobile emergency resources. However, this study only considered the pre-positioning of MHERs in the prevention stage and did not incorporate hydrogen production equipment such as HPRSs or sectionalizing switches. Reference [19] proposed a hierarchical self-healing restoration strategy for hydrogen-penetrated distribution systems, aiming to enhance post-extreme-event recovery through the synergy of mobile emergency resources and hydrogen infrastructure. However, this study primarily focused on improving systems’ resilience in the post-event stage and did not address the pre-positioning of restoration resources before disasters occur. While these studies investigated the collaborative roles of power distribution, transportation, and hydrogen energy systems from various perspectives, a multi-stage coordinated scheduling model has not yet been established that incorporates multiple restoration resources.
To address the aforementioned issues, this study proposes a multi-stage resilience enhancement method for distribution networks employing transportation and hydrogen energy systems. The main contributions of this study are as follows:
(1)
Based on a multi-stage coordinated framework considering prevention–degradation–fault isolation–power restoration, restoration resources for multiple systems are modeled, achieving coordinated scheduling of diverse restoration resources throughout various stages. During the prevention stage, the system’s capability to defend against extreme events is improved through pre-planned deployment of RCSs and mobile hydrogen emergency resources (MHERs) and by optimizing the distribution network to form preventive islands; after extreme events occur, the response process is divided into detailed stages to achieve precise fault section isolation and rapid power restoration in non-fault zones through coordinated utilization of multi-type resources, such as hydrogen production and refueling stations (HPRSs).
(2)
A coordinated dispatching model for three types of recovery resources (power distribution, transportation, and hydrogen energy systems) is established. The transportation systems enable dynamic dispatching of emergency resources, the hydrogen energy systems provide clean energy storage and allocation, and the power distribution system implements global optimal control.

2. Problem Statement

With the diversification of energy systems, traditional research methods focusing solely on single power distribution systems have increasingly shown limitations. In this context, hydrogen energy, due to its high energy density and long-term energy storage capabilities, provides a new breakthrough for enhancing distribution systems’ resilience. Furthermore, MHERs achieve spatiotemporal allocation of hydrogen using transportation networks, where the travel routes directly influence the efficiency of power distribution systems’ emergency functions during extreme events. Consequently, coordinated consideration of power–transportation–hydrogen systems holds significant importance for improving distribution systems’ resilience. Figure 1 illustrates the coupling relationships among these three networks.
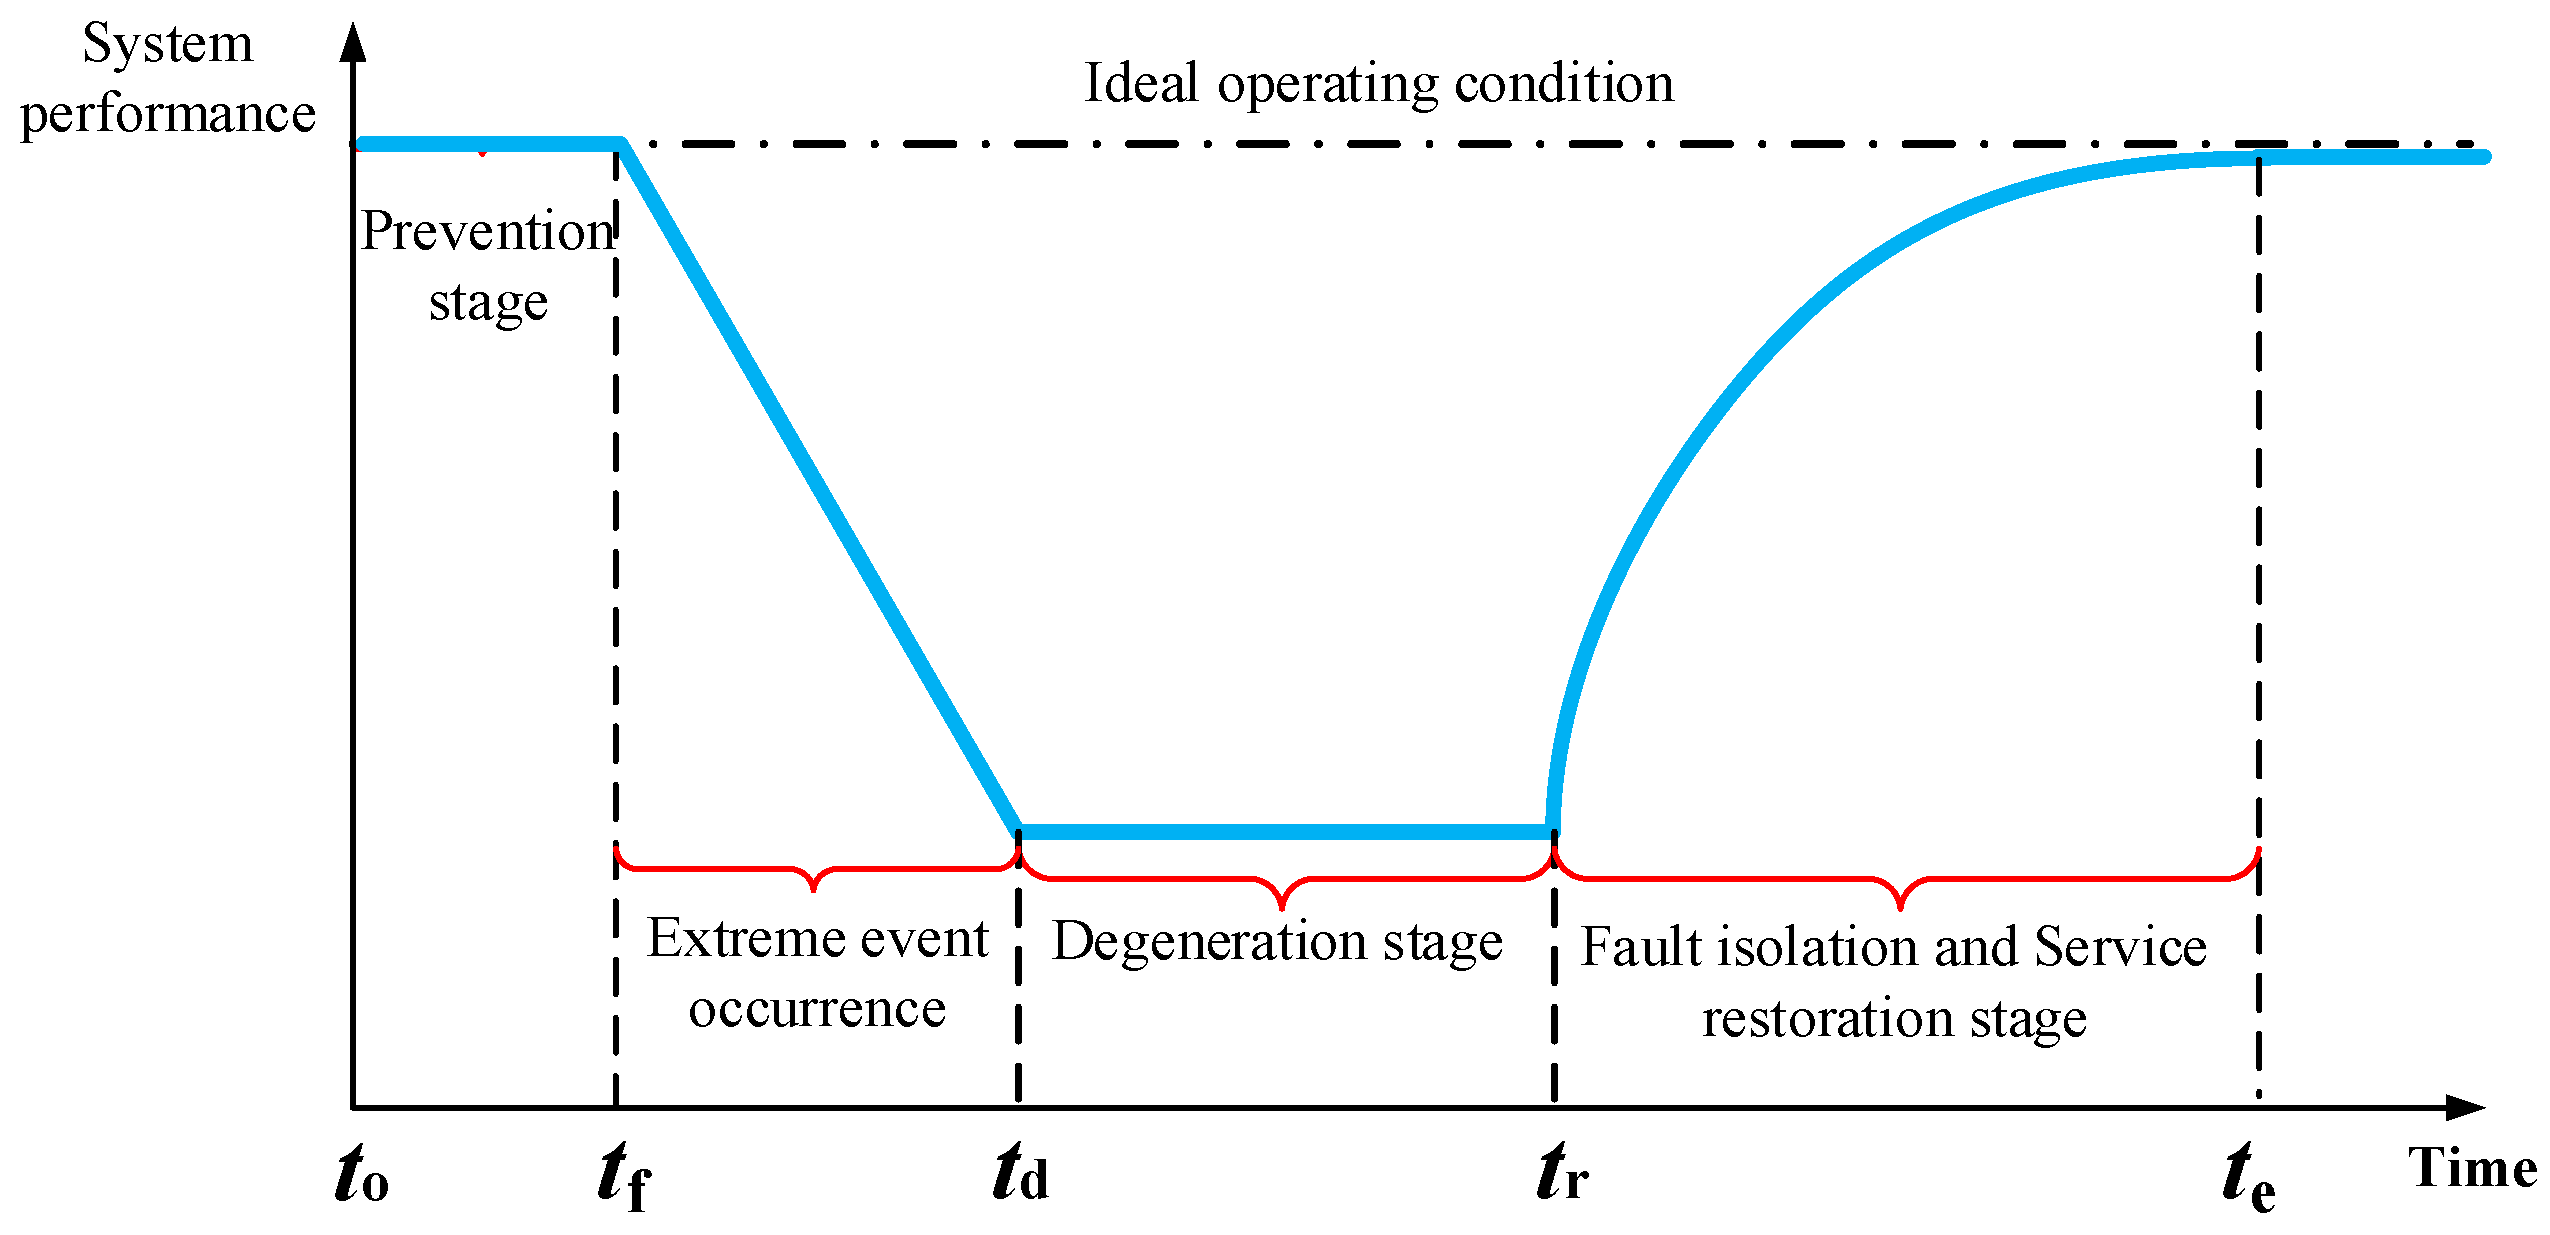
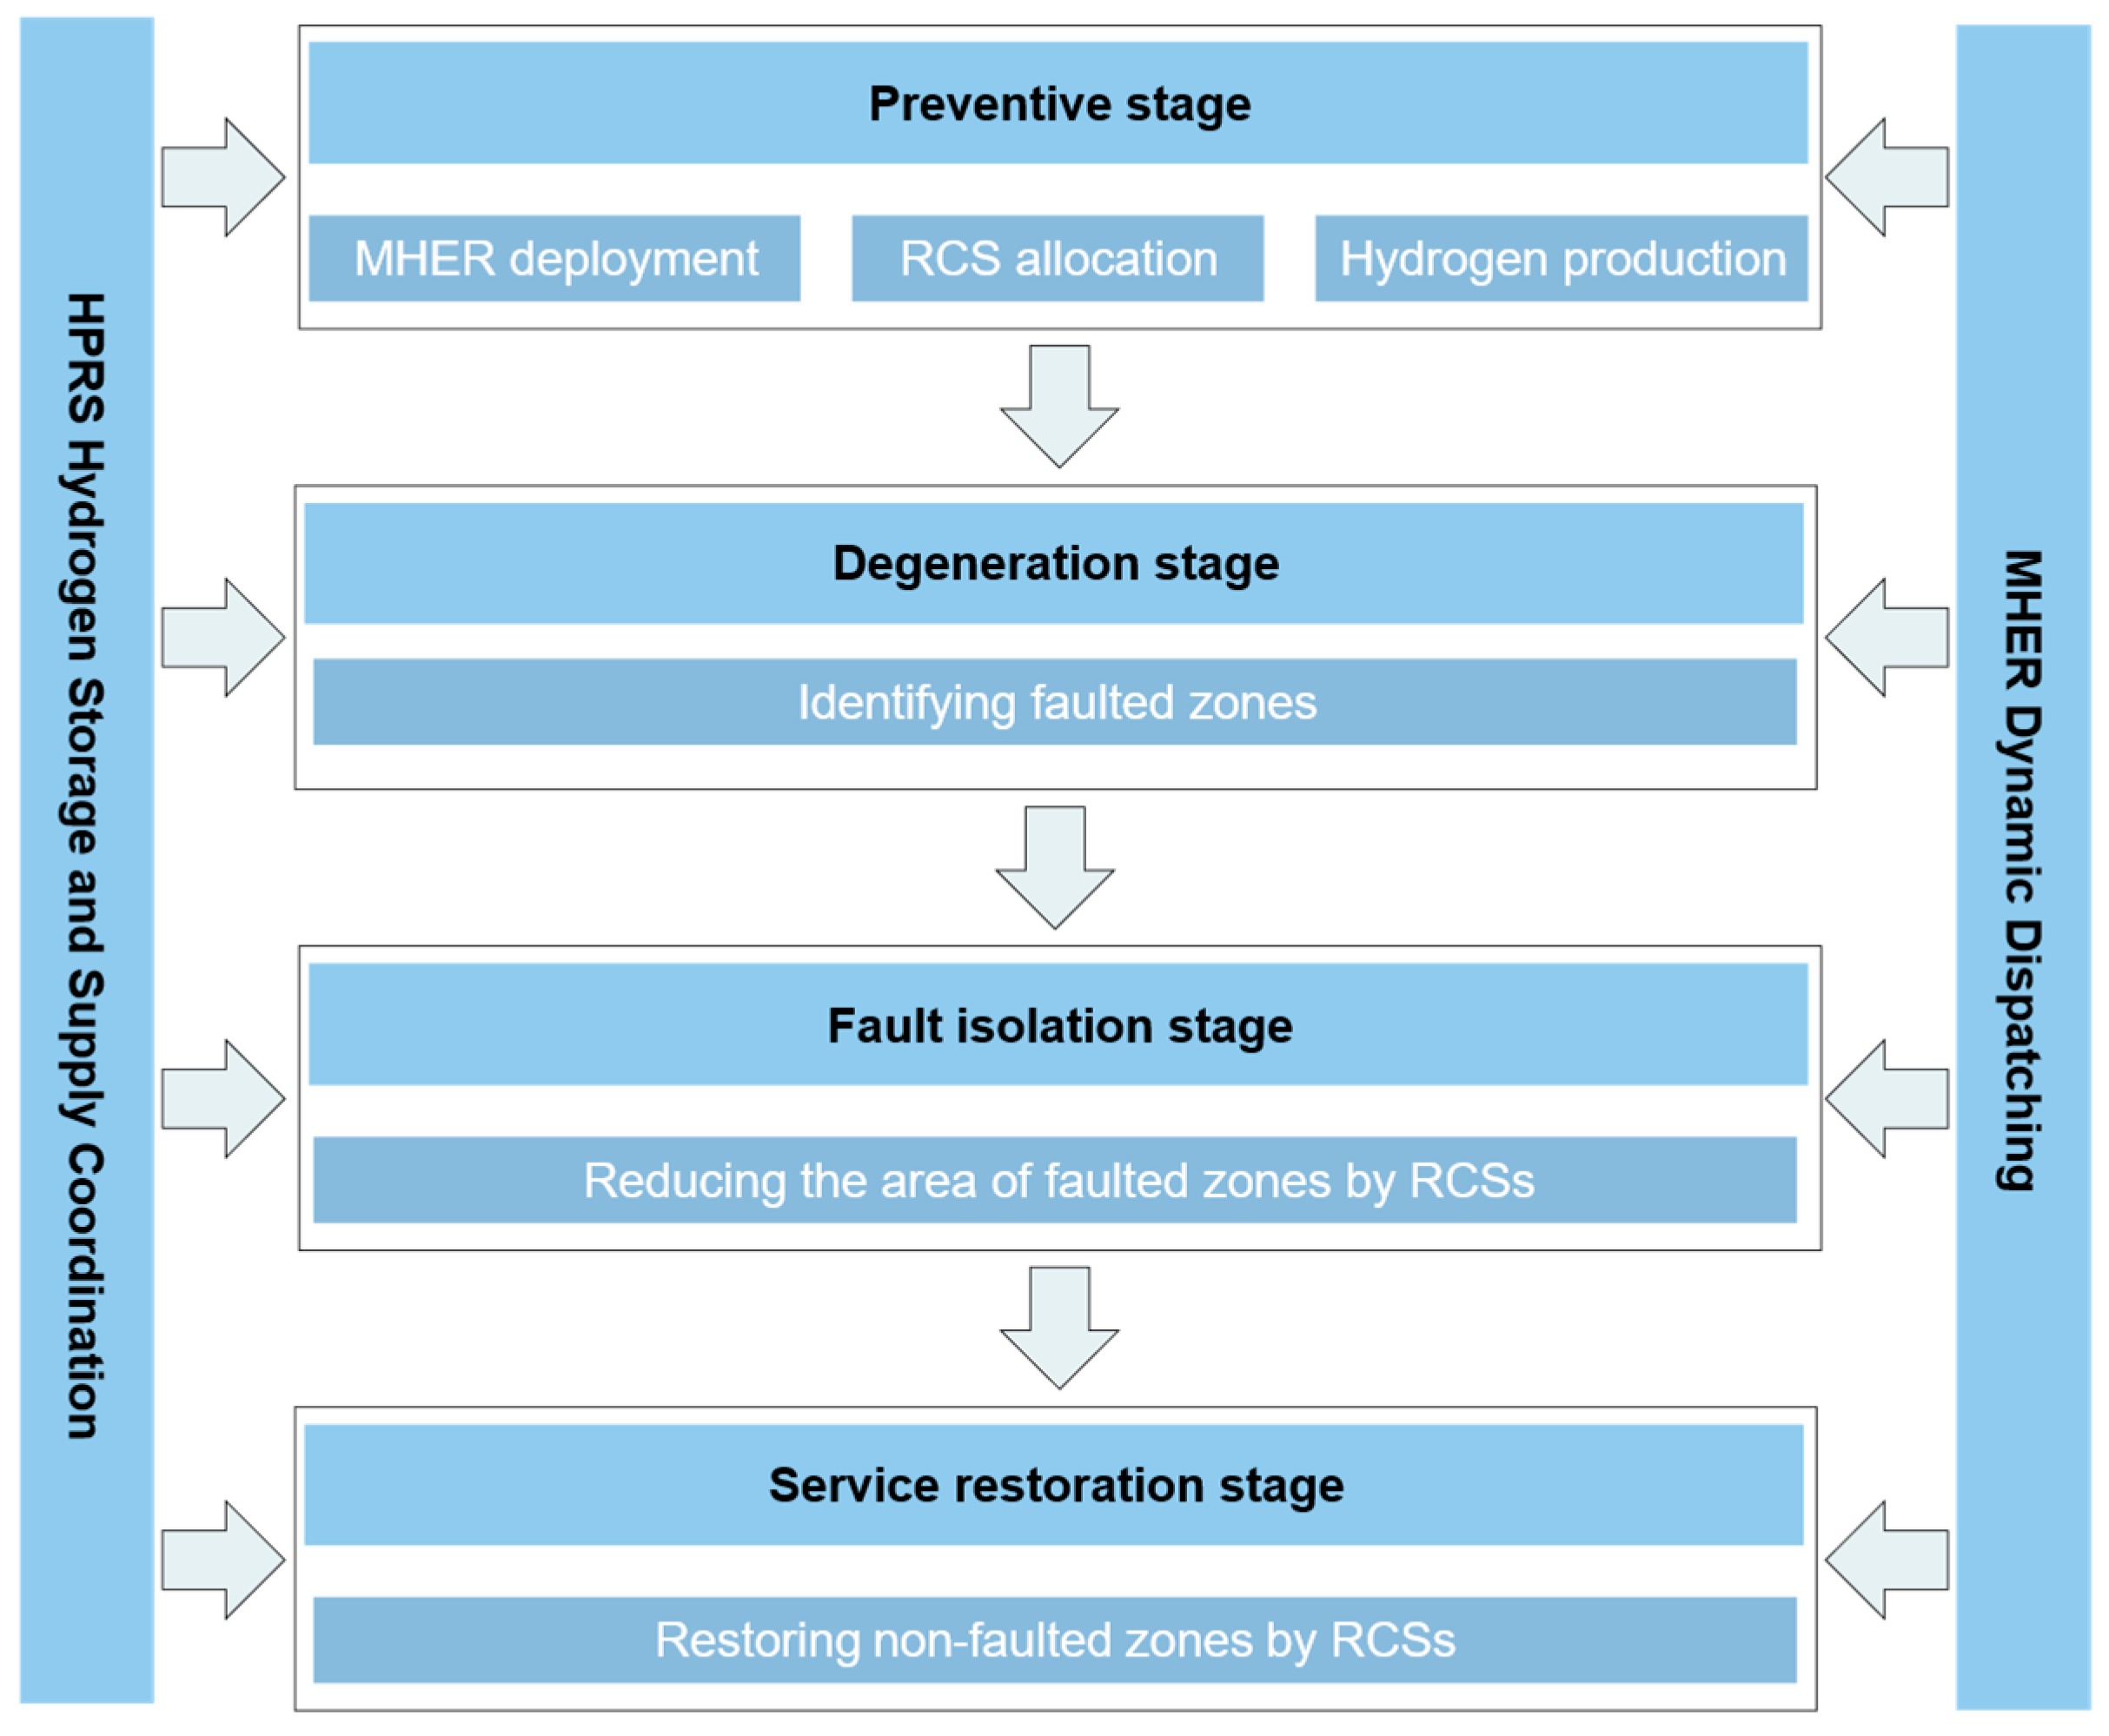
To enhance systems’ resilience, both preventive measures employed before extreme events and effective recovery efforts implemented post-event are required. Figure 2 illustrates the multi-stage process of extreme events and a curve of the system’s resilience level. During the prevention stage, different types of restoration resources are rationally preconfigured. HPRSs provide hydrogen production and storage to address the substantial hydrogen consumption after extreme events; MHER depots in transportation networks are pre-deployed to ensure rapid hydrogen resource relocation post-event; in power distribution networks, pre-positioned RCSs and network reconfiguration measures improve their post-event resistance capabilities. Following an extreme event, the distribution system first enters the degradation stage, during which its resilience level declines to its lowest point. In the fault isolation stage, network reconfiguration divides the system into faulted and non-faulted zones to isolate the fault’s impacts. During the power restoration stage, network reconfiguration continues to reduce the number of non-faulted zones without a power supply, further enhancing the system’s resilience. Non-faulted zones without a power supply formed during the fault isolation and restoration stages are powered by dispatching MHERs. Figure 3 shows a flowchart of the multi-stage restoration model. Throughout the event, collaborative optimization of restoration resources is achieved by considering fault propagation across different stages.
To more closely align with sustainable development goals, the proposed method promotes the application of green hydrogen as an emergency resource in extreme conditions, thereby effectively reducing reliance on traditional fossil fuels. Through the efficient dispatch of various recovery resources, this method further optimizes resource utilization and minimizes energy waste.

3. Model Formulation

3.1. Preventive Stage Model

Shown as (1)–(10), the model optimizes the allocation of RCSs and MHERs and performs preventive network reconfiguration during the prevention stage. It should be noted that preventive reconfiguration is only temporarily activated a few hours before extreme events (e.g., hurricanes) and does not permanently alter the grid’s topology. The objective of this measure is to minimize load shedding during the degradation stage. During non-extreme events, the system operates under its standard configuration. Constraint (1) indicates the maximum allowable quantity of RCSs that can be deployed. Constraint (2) indicates that a line will only be closed if both its ends are closed at the same time, and this constraint can be linearized by (3). Constraints (4)–(6) represent the pre-deployment constraints for the MHERs. Constraint (4) ensures that each MHER can only be pre-deployed at one candidate location. Constraint (5) prohibits the MHERs from being deployed at locations other than the candidate ones. Constraint (6) states that the number of MHERs deployed at a specific candidate location must not exceed the upper limit of its capacity. To ensure a radial topology structure, the single commodity flow method is adopted for the formulation of constraints (7) to (9) [11]. Specifically, constraints (7) and (8) establish the unit commodity demand at each non-source bus and the commodity supply at the source buses, ensuring demand satisfaction at non-source buses using the commodity flow mechanism while maintaining subgraph connectivity; constraint (9) enforces the mathematical relationship between the number of lines, buses, and subgraphs. Constraints (10)–(12) indicate the DistFlow power flow constraints.
l Ω line s i , l rcs N rcs ,   i Ω l bus
z l , t pre = z i , l , t pre z j , l , t pre ,   i , j Ω l bus ,   l Ω line ,   t Ω time
z l , t tmp 1 z i , l , t pre z l , t tmp 1 z j , l , t pre z l , t tmp 1 z i , l , t pre + z j , l , t pre 1 z l , t pre = z l , t tmp 1 ,   i , j Ω l bus ,   l Ω line ,   t Ω time
m Ω DE α k , m pre = 1 ,   k Ω B
α k , m pre = 0 ,   m Ω DE ,   k Ω B
k Ω B α k , m pre = N max pre ,   m Ω DE
1 M γ i pre l Ω i line F l , t pre 1 + M γ i pre ,   i Ω bus ,   t Ω time
M z l pre F l , t pre M z l pre ,   l Ω line ,   t Ω time
l Ω line z l , t pre = N bus i Ω bus γ i pre ,   t Ω time
P i load P i , t dg + P i , t pro P i , t HPRS P k , m , t MHER = l Ω i line P l , t pre _ flow ,   i Ω bus ,   t Ω time ,   k Ω B
Q i load Q i , t dg Q i , t HPRS Q k , m , t MHER = l Ω i line Q l , t pre _ flow ,   i Ω bus ,   t Ω time ,   k Ω B
M ( 1 z l , t pre ) U i , t pre U j , t pre ( a l P l , t pre _ flow + b l Q l , t pre _ flow ) / U ref M ( 1 z l , t pre ) , i , j Ω l bus ,   l Ω line ,   t Ω time

3.2. Degradation Stage Model

During the degradation stage, without the implementation of fault isolation measures, the majority of the buses are in the faulted zone. The operational constraints characterizing this stage are delineated below. Constraint (13) indicates that the closed terminal bus of a faulted line must belong to the faulted zone. Constraint (14) indicates that the buses at both ends of a closed line are either inside or outside the same fault zone at the same time. All the active and reactive loads in the faulted zones are shed according to (15) and (16).
μ i , t , c drt f l , t , c z l , t pre ,   i Ω l bus ,   l Ω line ,   t Ω time ,   c Ω snr
μ i , t , c drt + z l , t pre 1 μ j , t , c drt μ j , t , c drt + z l , t pre 1 μ i , t , c drt ,   i , j Ω l bus ,   l Ω line ,   t Ω time ,   c Ω snr
μ i , t , c drt P i load P i , t , c drt _ shed P i load ,   i Ω bus ,   t Ω time ,   c Ω snr
μ i , t , c drt Q i load Q i , t , c drt _ shed Q i load ,   i Ω bus ,   t Ω time ,   c Ω snr

3.3. Fault Isolation Stage Model

Remote switching of RCSs is executed during the fault isolation stage to achieve fault isolation, thereby minimizing the extent of the faulted zones. The constraints are formulated as (17)–(25), where constraint (17) indicates that only RCS-equipped lines can be opened. Constraint (18) is linearized similarly to (3) and shows that a line is closed only if two of its ends are closed and it is not faulted. Constraints (19) and (20) indicate the fault zone propagation constraints. Constraint (21) indicates the active load shedding constraints, while constraint (22) indicates the reactive load shedding constraints. Constraints (23)–(25) indicate the DistFlow power flow constraints.
z i , l , t pre s i , l , t rcs z i , l , t , c isl z i , l , t pre ,   i Ω l bus ,   l Ω line ,   t Ω time ,   c Ω snr
z l , t , c isl = z i , l , t , c isl z j , l , t , c isl 1 f l , c ,   i , j Ω l bus ,   l Ω line ,   t Ω time ,   c Ω snr
μ i , t , c isl f l , t , c 1 s i , l , t rcs + z i , l , t , c isl 1 ,   i , j Ω l bus ,   l Ω line ,   t Ω time ,   c Ω snr
μ i , t , c isl + z l , t , c isl 1 μ j , t , c isl μ j , t , c isl + z l , t , c isl 1 μ i , t , c isl ,   i , j Ω l bus ,   l Ω line , t Ω time ,   c Ω snr
μ i , t , c isl P i load P i , t , c isl _ shed P i load ,   i Ω bus ,   t Ω time ,   c Ω snr
μ i , t , c isl Q i load Q i , t , c isl _ shed Q i load ,   i Ω bus ,   t Ω time ,   c Ω snr
P i load P i , t , c dg P i , t , c isl _ shed + P i , t pro P i , t HPRS P k , m , t MHER = l Ω i line P l , t , c isl _ flow , i Ω bus ,   t Ω time ,   c Ω snr ,   k Ω B
Q i load Q i , t , c dg Q i , t , c isl _ shed Q i , t HPRS Q k , m , t MHER = l Ω i line Q l , t , c isl _ flow , i Ω bus ,   t Ω time ,   c Ω snr ,   k Ω B
M ( 1 z l , t , c isl ) U i , t , c isl U j , t , c isl ( a l P l , t , c isl _ flow + b l Q l , t , c isl _ flow ) / U ref M ( 1 z l , t , c isl ) , i , j Ω l bus ,   l Ω line ,   t Ω time ,   c Ω snr

3.4. Service Restoration Stage Model

During the service restoration stage, non-faulted zones without a power supply will be restored. The constraints are formulated as (26)–(36), where constraint (26) indicates that only RCS-equipped lines can be switched. Constraint (27) is linearized similarly to (3) and indicates that a line is closed only if two of its ends are closed and it is not faulted. Constraint (28) indicates the fault zone propagation constraints to prevent reconnection between faulted and non-faulted zones. Constraint (29) indicates the active load shedding constraints, while constraint (30) indicates the reactive load shedding constraints. Constraints (31)–(33) indicate the radial topology constraints required to maintain the grid’s structural integrity. Finally, constraints (34)–(36) formulate the linearized DistFlow power flow constraints.
z i , l , t isl s i , l rcs z i , l , t , c rst z i , l , t isl + s i , l , t rcs ,   i , j Ω l bus ,   l Ω line ,   t Ω time ,   c Ω snr
z l , t , c rst = z i , l , t , c rst z j , l , t , c rst 1 f l , c ,   i , j Ω l bus ,   l Ω line ,   t Ω time ,   c Ω snr
μ i , t , c isl + z l , t , c rst 1 μ j , t , c isl μ j , t , c isl + z l , t , c rst 1 μ i , t , c isl ,   i , j Ω l bus ,   l Ω line ,   t Ω time ,   c Ω snr
μ i , t , c isl P i load P i , t , c rst _ shed P i load ,   i Ω bus ,   t Ω time ,   c Ω snr
μ i , t , c isl Q i load Q i , t , c rst _ shed Q i load ,   i Ω bus ,   t Ω time ,   c Ω snr
1 M γ i , c rst l Ω i line F l , t , c rst 1 + M γ i , c rst ,   i Ω bus ,   t Ω time ,   c Ω snr
M z l , t , c rst F l , t , c rst M z l , t , c rst , l Ω line ,   t Ω time ,   c Ω snr
l Ω line z l , t , c rst = N bus i Ω bus γ i , c rst ,   t Ω time ,   c Ω snr
P i load P i , t , c dg P i , t , c rst _ shed + P i , t pro P i , t HPRS P k , m , t MHER = l Ω i line P l , t , c rst _ flow , i Ω bus ,   t Ω time ,   c Ω snr ,   k Ω B
Q i load Q i , t , c dg Q i , t , c rst _ shed Q i , t HPRS Q k , m , t MHER = l Ω i line Q l , t , c rst _ flow , i Ω bus ,   t Ω time ,   c Ω snr ,   k Ω B
M ( 1 z l , t , c rst ) U i , t , c rst U j , t , c rst ( a l P l , t , c rst _ flow + b l Q l , t , c rst _ flow ) / U ref M ( 1 z l , t , c rst ) , i , j Ω l bus ,   l Ω line ,   t Ω time ,   c Ω snr

3.5. HPRS and DG Model

HPRSs consume power from the distribution network using electrolyzers to produce hydrogen and utilize hydrogen storage tanks to store excess hydrogen as a backup. Constraint (37) represents a model of hydrogen production using an electrolyzer; the electrolyzer’s actual operational model can be approximated as a linear relationship, as shown in (38). The hydrogen storage tank model is given in (39). Constraints (40)–(43) describe the active and reactive power outputs of the HPRS and DGs, respectively, where the output becomes zero if the bus where the HPRS or DG is located is affected by faults.
P i , t , c pro = H h H i , t , c pro μ i ,   i Ω bus ,   t Ω time ,   c Ω snr
H i , t , c pro = P i , t , c pro k p 2 h ,   i Ω bus ,   t Ω time ,   c Ω snr
H i , 0 , c HPRS = H i , T , c HPRS + H i , T , c pro k Ω B H k , i , T , c in P i , T , c HPRS μ EH Δ t H i , t , c HPRS = H i , t 1 , c HPRS + H i , t 1 , c pro k Ω B H k , i , t 1 , c in P i , t 1 , c HPRS μ EH Δ t H i HPRS _ min H i , t , c HPRS H i HPRS _ max ,   i Ω bus ,   t Ω time ,   c Ω snr
0 P i , t , c HPRS ( 1 μ i , t , c drt / isl ) P i HPRS _ max ,   i Ω bus ,   t Ω time ,   c Ω snr
0 Q i , t , c HPRS ( 1 μ i , t , c drt / isl ) Q i HPRS _ max ,   i Ω bus ,   t Ω time ,   c Ω snr
( 1 μ i , t , c drt / isl ) P i dmin P i , t , c dg ( 1 μ i , t , c drt / isl ) P i dmax ,   i Ω bus ,   t Ω time ,   c Ω snr
( 1 μ i , t , c drt / isl ) Q i dmin Q i , t , c dg ( 1 μ i , t , c drt / isl ) Q i dmax , i Ω bus ,   t Ω time ,   c Ω snr

3.6. MHER Model

Transportation networks are highly sensitive to the real-time traffic conditions and unexpected incidents. Therefore, during disasters or traffic disruptions, the actual travel time of MHERs may differ from that in normal conditions on the same road. To ensure that the passage of emergency mobile devices is reliable in disaster scenarios, this study uses a traffic integration coefficient to reflect the relationship between the actual speed of MHERs and the equivalent travel distance [20]. When the f value of a certain road is set to a large positive number, the V k of the road will approach zero, thereby simulating scenarios where the road is blocked or impassable due to extreme events, as shown in (44)–(46). Constraint (47) states that MHERs’ initial positions at the start of multi-stage processes must match their preconfigured positions. Constraint (48) states that one MHER can only be located in one position at the same time. Constraint (49) specifies that when the time interval is less than the travel time, the MHER will not connect to the destination bus. Constraints (50) and (51) represent the MHERs’ active and reactive power output constraints, constraint (52) describes their hydrogen refueling constraints, constraint (53) defines their hydrogen storage capacity, and constraint (54) specifies the upper and lower limits of their hydrogen storage capacity.
T k , m , n MHER = D m , n V k ,   k Ω B ,   m , n Ω bus
D m , n = D m , n initial 1 + 1 V k ,   k Ω B ,   m , n Ω bus
V k = V 0 e 1.7 f ,   k Ω B
α k , m , 1 , c MHER = α k , m pre ,   k Ω B ,   m Ω DE ,   c Ω snr
m Ω bus α k , m , t , c MHER 1 ,   k Ω B ,   t Ω time ,   c Ω snr
τ = t t + T k , m , n MHER 1 α k , n , τ , c MHER M ( 1 α k , m , t , c MHER ) , k Ω B ,   m , n Ω bus ,   t Ω time ,   c Ω snr
0 P k , i , t , c MHER α k , i , t , c MHER P k MHER _ max , k Ω B ,   i Ω bus ,   t Ω time ,   c Ω snr
0 Q k , i , t , c MHER α k , i , t , c MHER Q k MHER _ max , k Ω B ,   i Ω bus ,   t Ω time ,   c Ω snr
0 H k , i , t , c in α k , i , t , c MHER H k MHER _ max , k Ω B ,   i Ω bus ,   t Ω time ,   c Ω snr
H k , t + 1 , c MHER = H k , i , t MHER + i Ω bus H k , i , t in Δ t i Ω bus P k , i , t MHER η k Δ t , k Ω B ,   t Ω time ,   c Ω snr
H k MHER _ min H k , t , c MHER H k MHER _ max , k Ω B ,   t Ω time ,   c Ω snr

3.7. System Operational Model

Constraints (55) and (56) represent the upper and lower limits of the line capacity constraints for the prevention, isolation, and power restoration stages, respectively. Constraint (57) represents the upper and lower limits of the bus voltage constraints.
z l , t , c pre / isl / rst P l fmax P l , t , c pre / isl / rst _ flow z l , t , c pre / isl / rst P l fmax , l Ω line ,   t Ω time ,   c Ω snr
z l , t , c pre / isl / rst Q l fmax Q l , t , c pre / isl / rst _ flow z l , t , c pre / isl / rst Q l fmax , l Ω line ,   t Ω time ,   c Ω snr
U i min U i , t pre / isl / rst U i max ,   i Ω bus ,   t Ω time

3.8. Objective

To reduce the impact on the power distribution system, the objective function shown in (58) is adopted to minimize the expected load shedding of the system under extreme events. P c shed can be obtained from (59). To facilitate the analysis of the distribution system’s resilience level, this study uses R x , c to denote the ratio of the remaining load to the load under normal conditions during each stage, and t x is used to represent the duration of each stage. These metrics are employed to evaluate the system’s resilience level at different stages., as shown in (60).
min P = c Ω snr p c P c shed
P c shed = i Ω bus t Ω time ω i P i , t , c drt _ shed + i Ω bus t Ω time ω i P i , t , c isl _ shed + i Ω bus t Ω time ω i P i , t , c rst _ shed ,   c Ω snr
R x , c = 1 i Ω bus t Ω time ω i P i , t , c x _ shed / t x i Ω bus ω i P i load ,   t Ω time ,   c Ω snr

4. Case Study

In this section, we describe how we employed an IEEE 33-bus system and 12-node transportation system to verify the effectiveness of the proposed method. The computational tasks were performed on a personal computer with an Intel Core i5 Quad-Core Processor (3.00 GHz) and 8 GB of RAM. The model developed in this study was a mixed-integer linear programming (MILP) model, which was solved using the Gurobi 10.0.3 solver in the Yalmip toolbox.

4.1. Parameter Settings

The transportation network and the topology of the IEEE 33-bus system are shown in Figure 4 and Figure 5, respectively [21,22]. Bus 1 represents the substation. The system consisted of 37 distribution lines, with lines L33, L34, L35, L36, and L37 being tie lines, each with a capacity of 5 MVA. The voltage range for the buses was [0.95, 1.05] p.u., and the total system load was 3.715 MW + j2.300 Mvar. At buses 18, 21, and 24, three controllable DGs were installed, each with a capacity of 0.5 MVA. Two HPRSs were installed at buses 8 and 32, each with a hydrogen storage capacity of 500 kg and a power capacity of 0.5 MVA. Furthermore, three MHERs were deployed in the transportation network, with a hydrogen storage capacity of 50 kg each and a power capacity of 0.5 MVA. A total of 15 RCSs were installed in the system, and it was assumed that a Manual Switch was installed on each line. Buses 3, 11, 16, 19, 22, 26, and 32 were critical load buses with a weight of 3, while all the other load buses had a weight of 1. The power-to-hydrogen conversion coefficient was 50 (kW·h)/kg, and the efficiency of both the hydrogen fuel cell and MHERs was 20 (kW·h)/kg. The maximum hourly rate of hydrogen injections from the HPRSs to the MHERs was limited to 50 kg/h. In the coordinate system of the power distribution network, the Manhattan distance was used to measure the distance between any two points [23]. The fault scenario set consisted of three scenarios, each with an occurrence probability of 1/3, as listed in Table 1. It was assumed that the faults occurred at 4:00. The prevention stage comprised the 4 h before the event and the degradation stage lasted for 2 h after the event occurred, followed by a 5 h fault isolation stage and finally a 13 h service restoration stage. The time period was divided into 24 time slots, each lasting 1 h.

4.2. Restoration Strategies for Different Scenarios

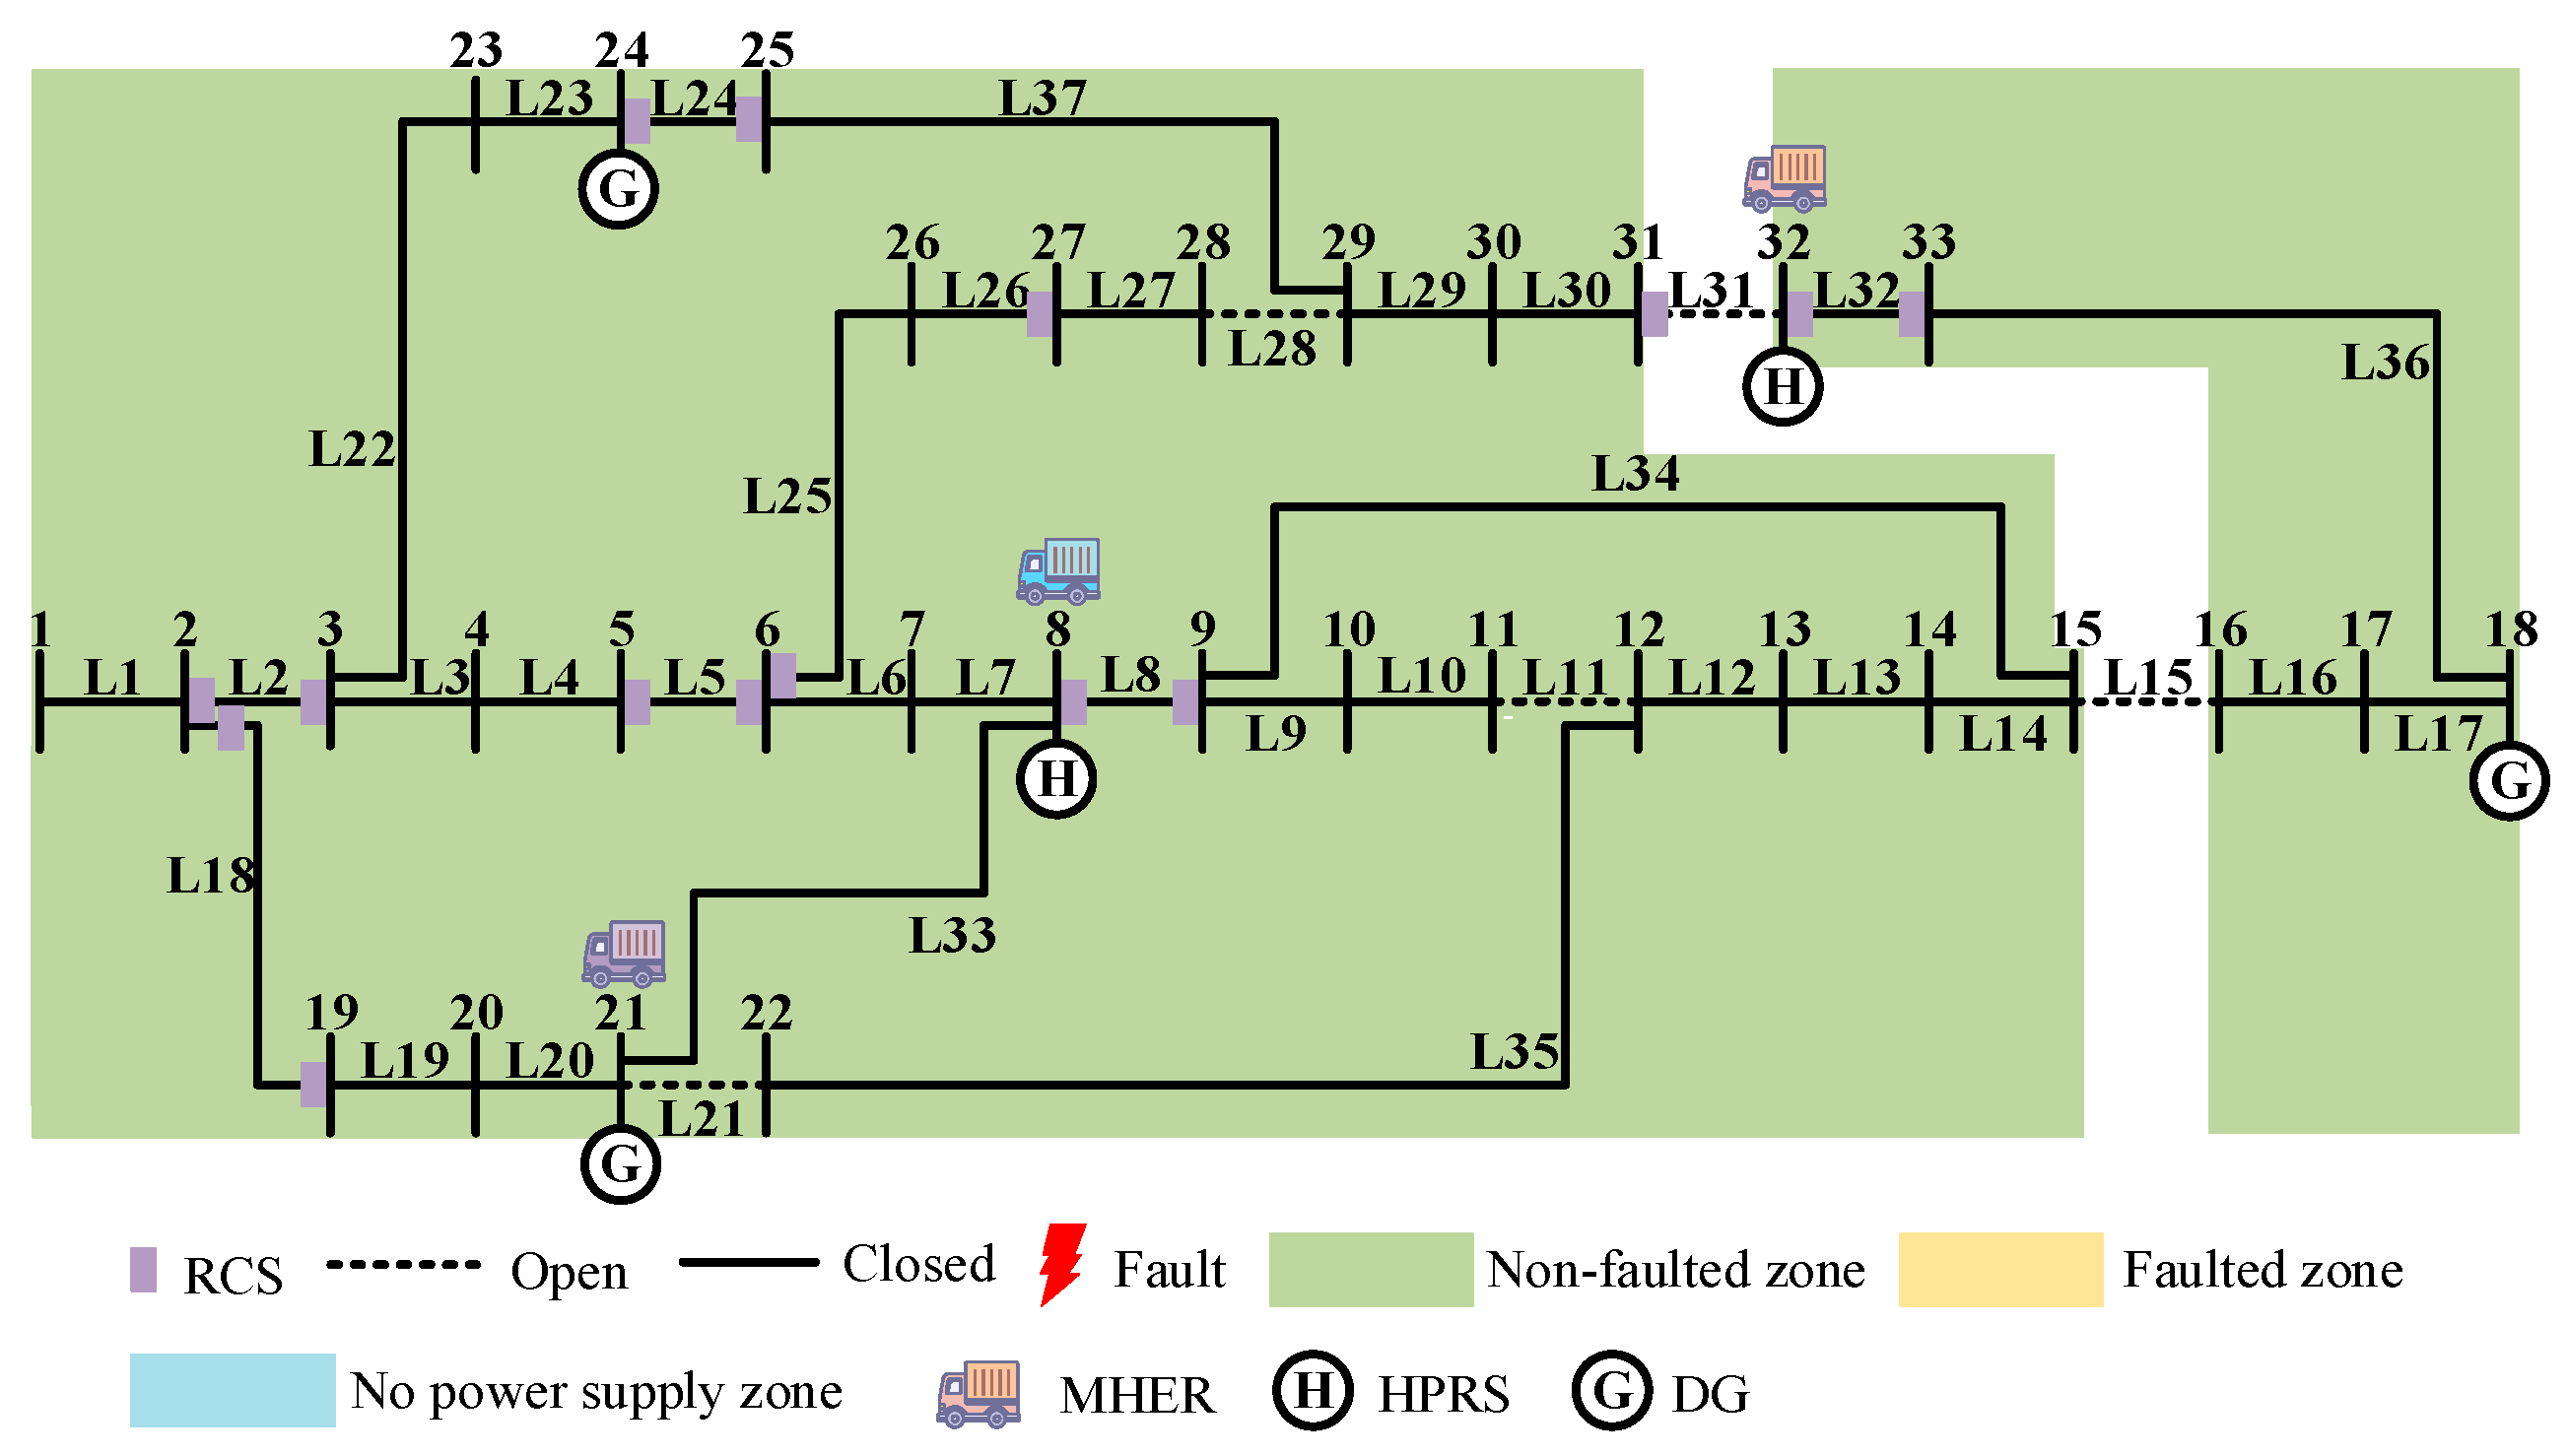
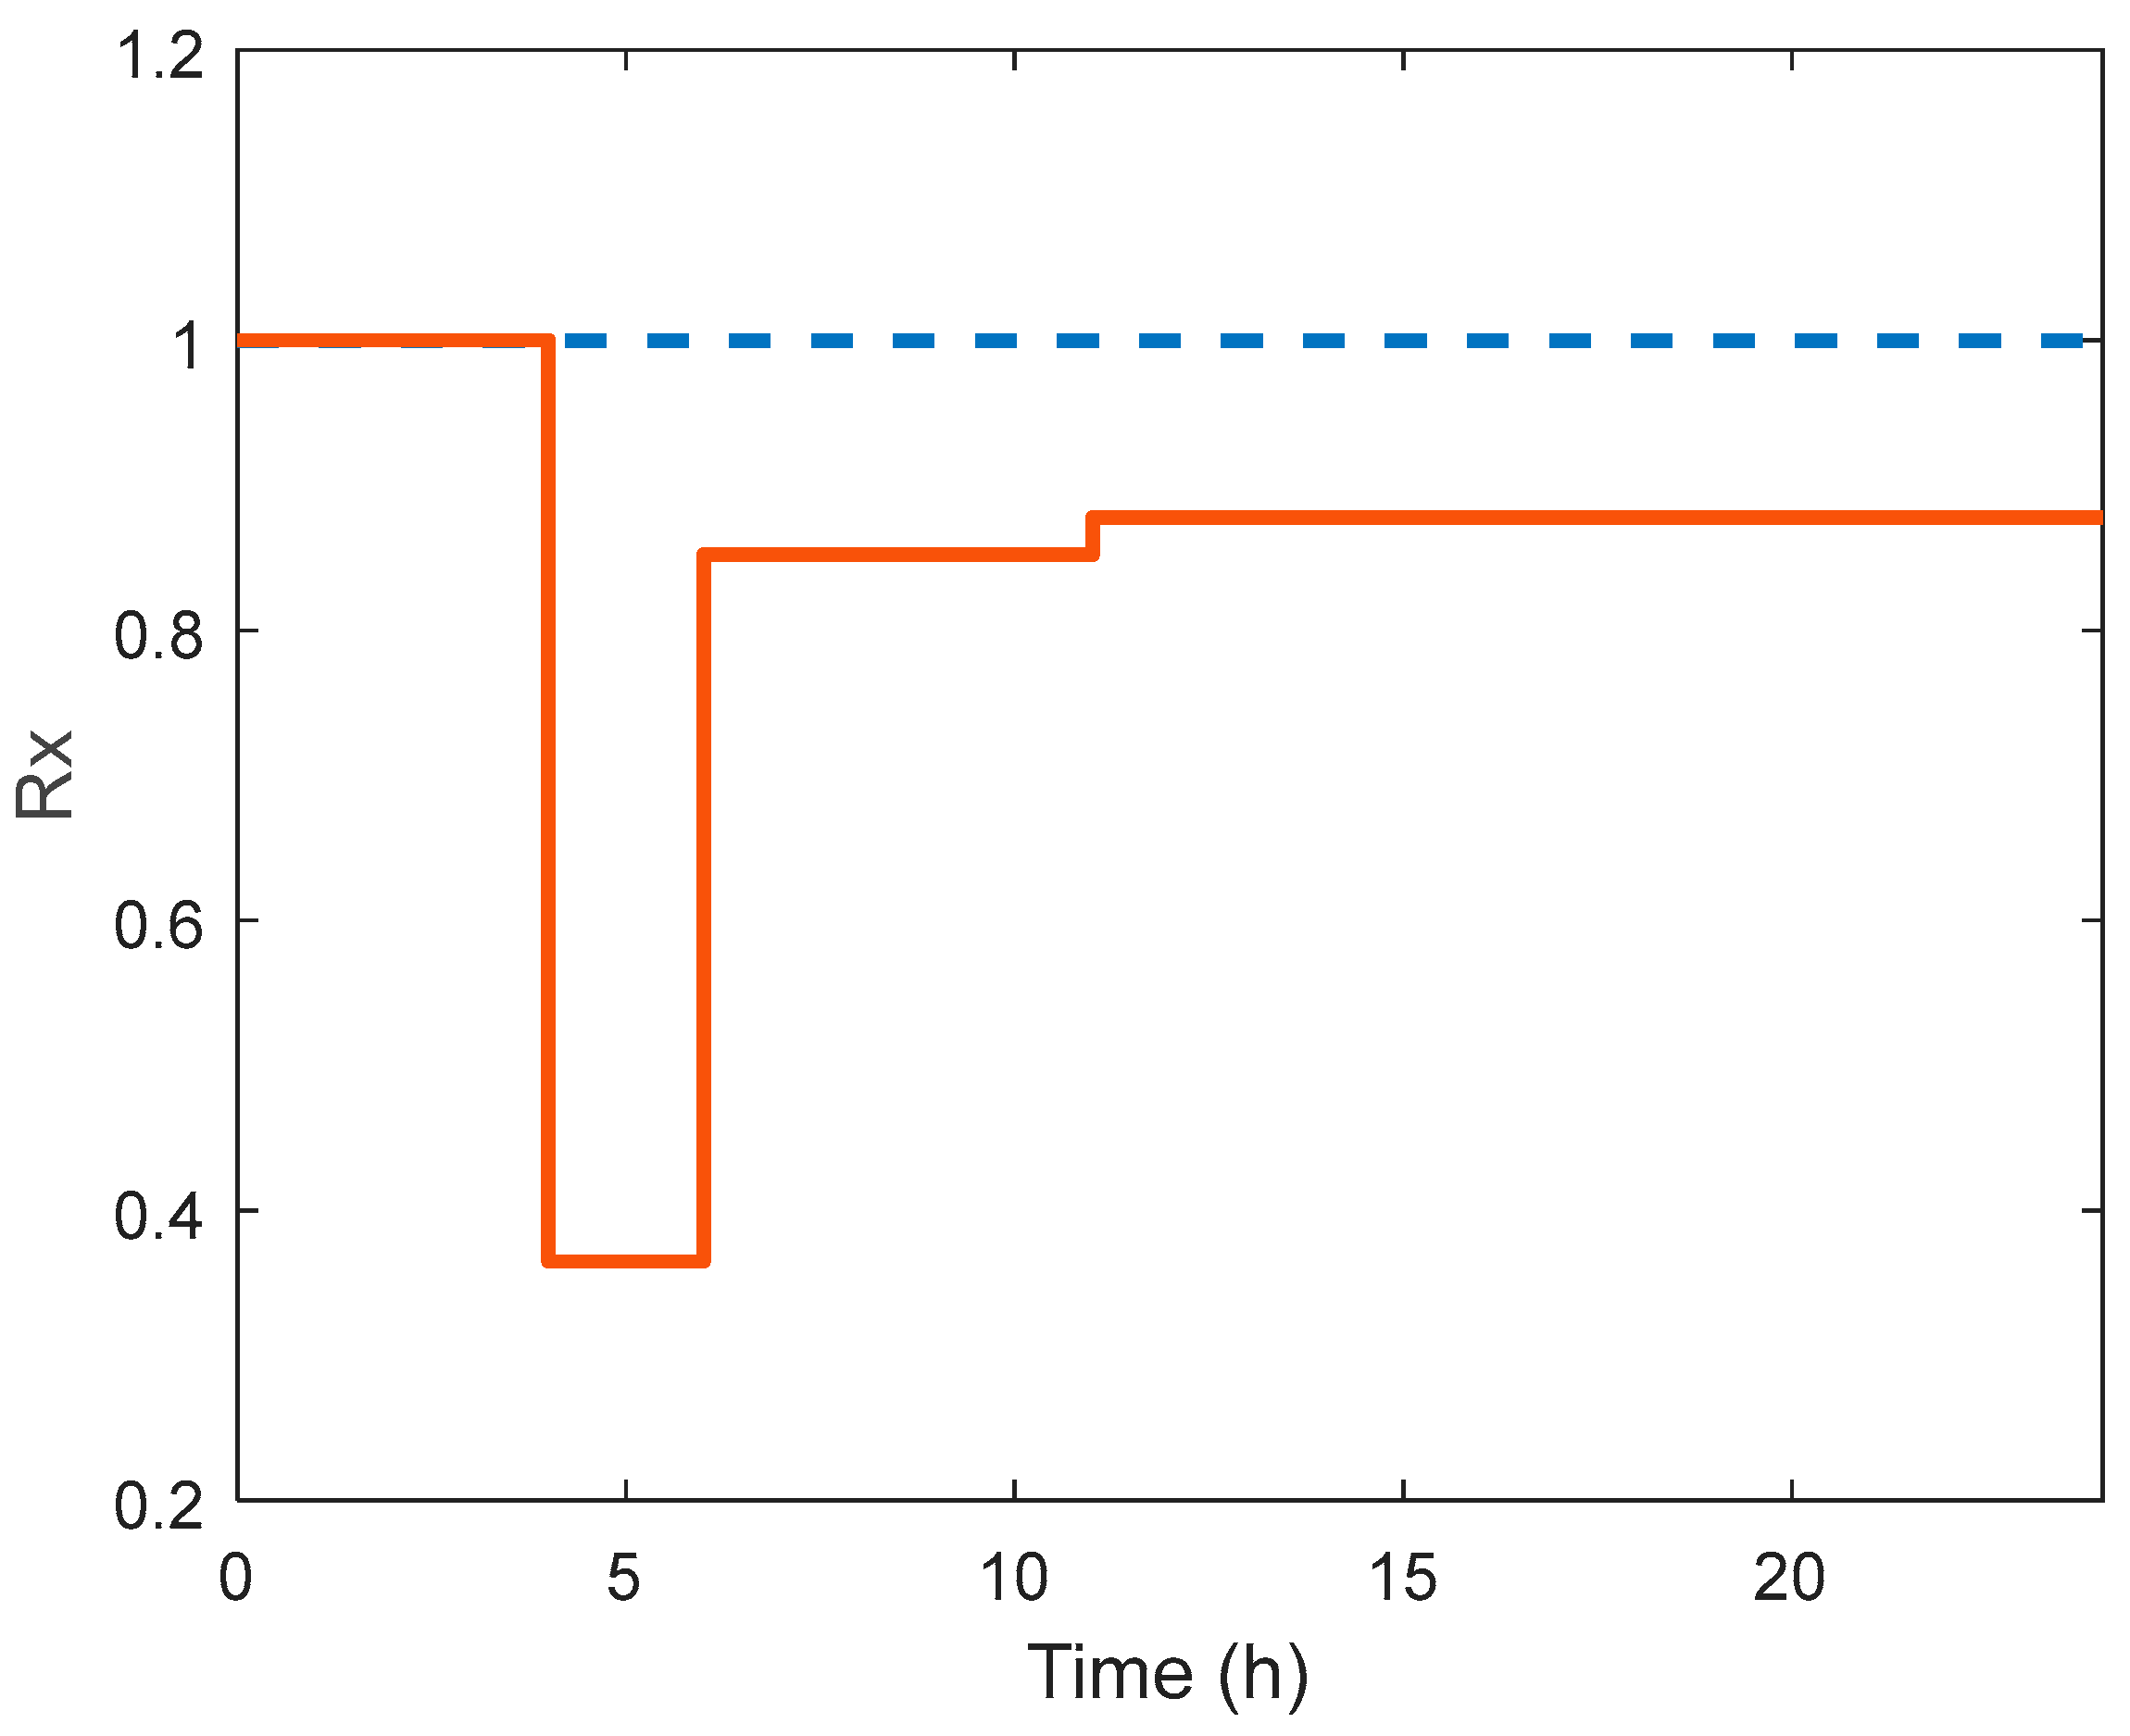
Figure 6 illustrates the results of restoration resource configuration during the prevention stage. Specifically, three MHERs were deployed at buses 8, 21, and 32, 15 RCSs were installed across the distribution network, and network reconfiguration formed a main power supply zone and an island incorporating a DG. Figure 7 displays the expected resilience curves for three scenarios. By pre-configuring the restoration resources and network during the prevention stage, the resilience level during the degradation stage was effectively improved. During the fault isolation and service restoration stages, the distribution system’s resilience was restored to approximately 87% of its normal level through coordinated dispatch of recovery resources, demonstrating a significant enhancement in the system’s resilience.
Using scenario 3 as an example, Figure 8, Figure 9 and Figure 10 illustrate the network reconfiguration during the degradation, fault isolation, and power restoration stages, respectively. During the prevention stage, lines L15 and L31 were disconnected to form an island encompassing buses 16, 17, 18, 32, and 33, which prevented this island from being affected by faults during the degradation stage. This demonstrates that pre-reconfiguration enhances a distribution system’s resistance to extreme events.
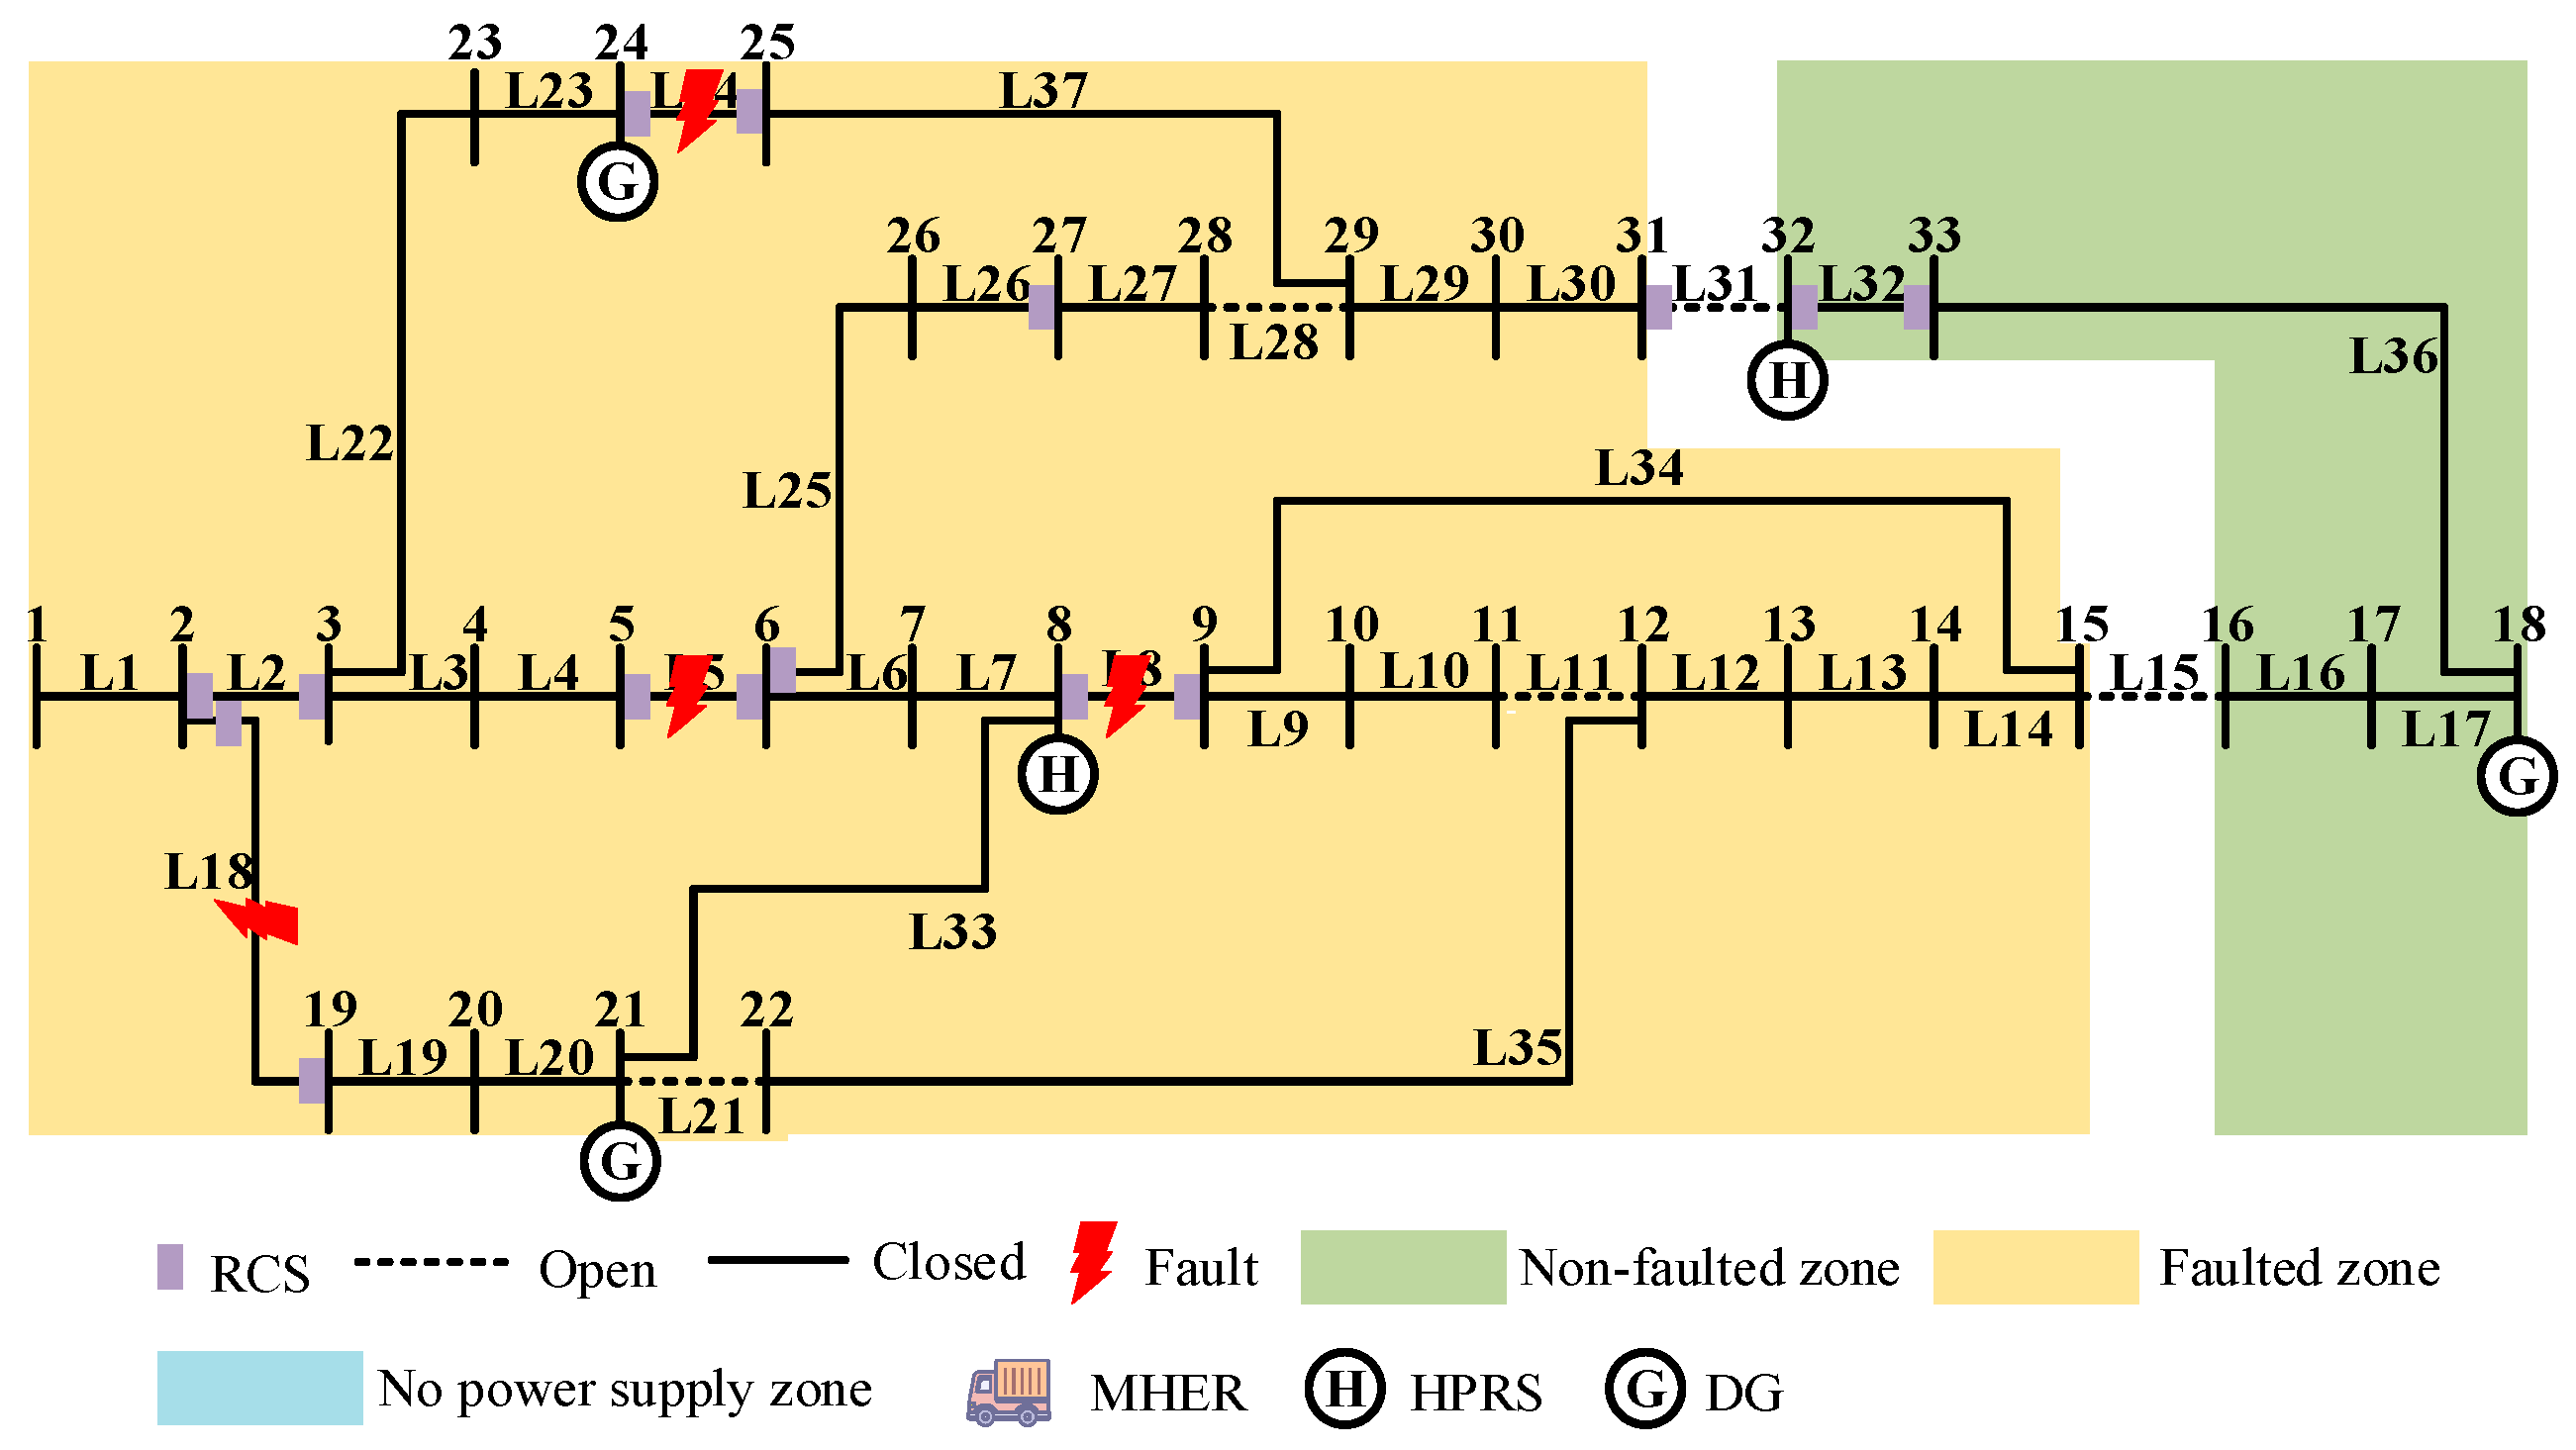
In the fault isolation stage, the non-faulted zones were expanded through RCS-based network reconfiguration. For instance, RCSs at both ends of lines L5, L8, L18, and L24 were opened to isolate faults, forming three zones containing substations and DGs. Notably, although the zones encompassing buses 25, 29, 30, and 31 and buses 9–15 and 22 were unaffected by faults, they became zones with no power supply due to the absence of power sources. During the power restoration stage, the RCS on line L31 was closed, restoring the power supply to the zone containing buses 25, 29, 30, and 31.
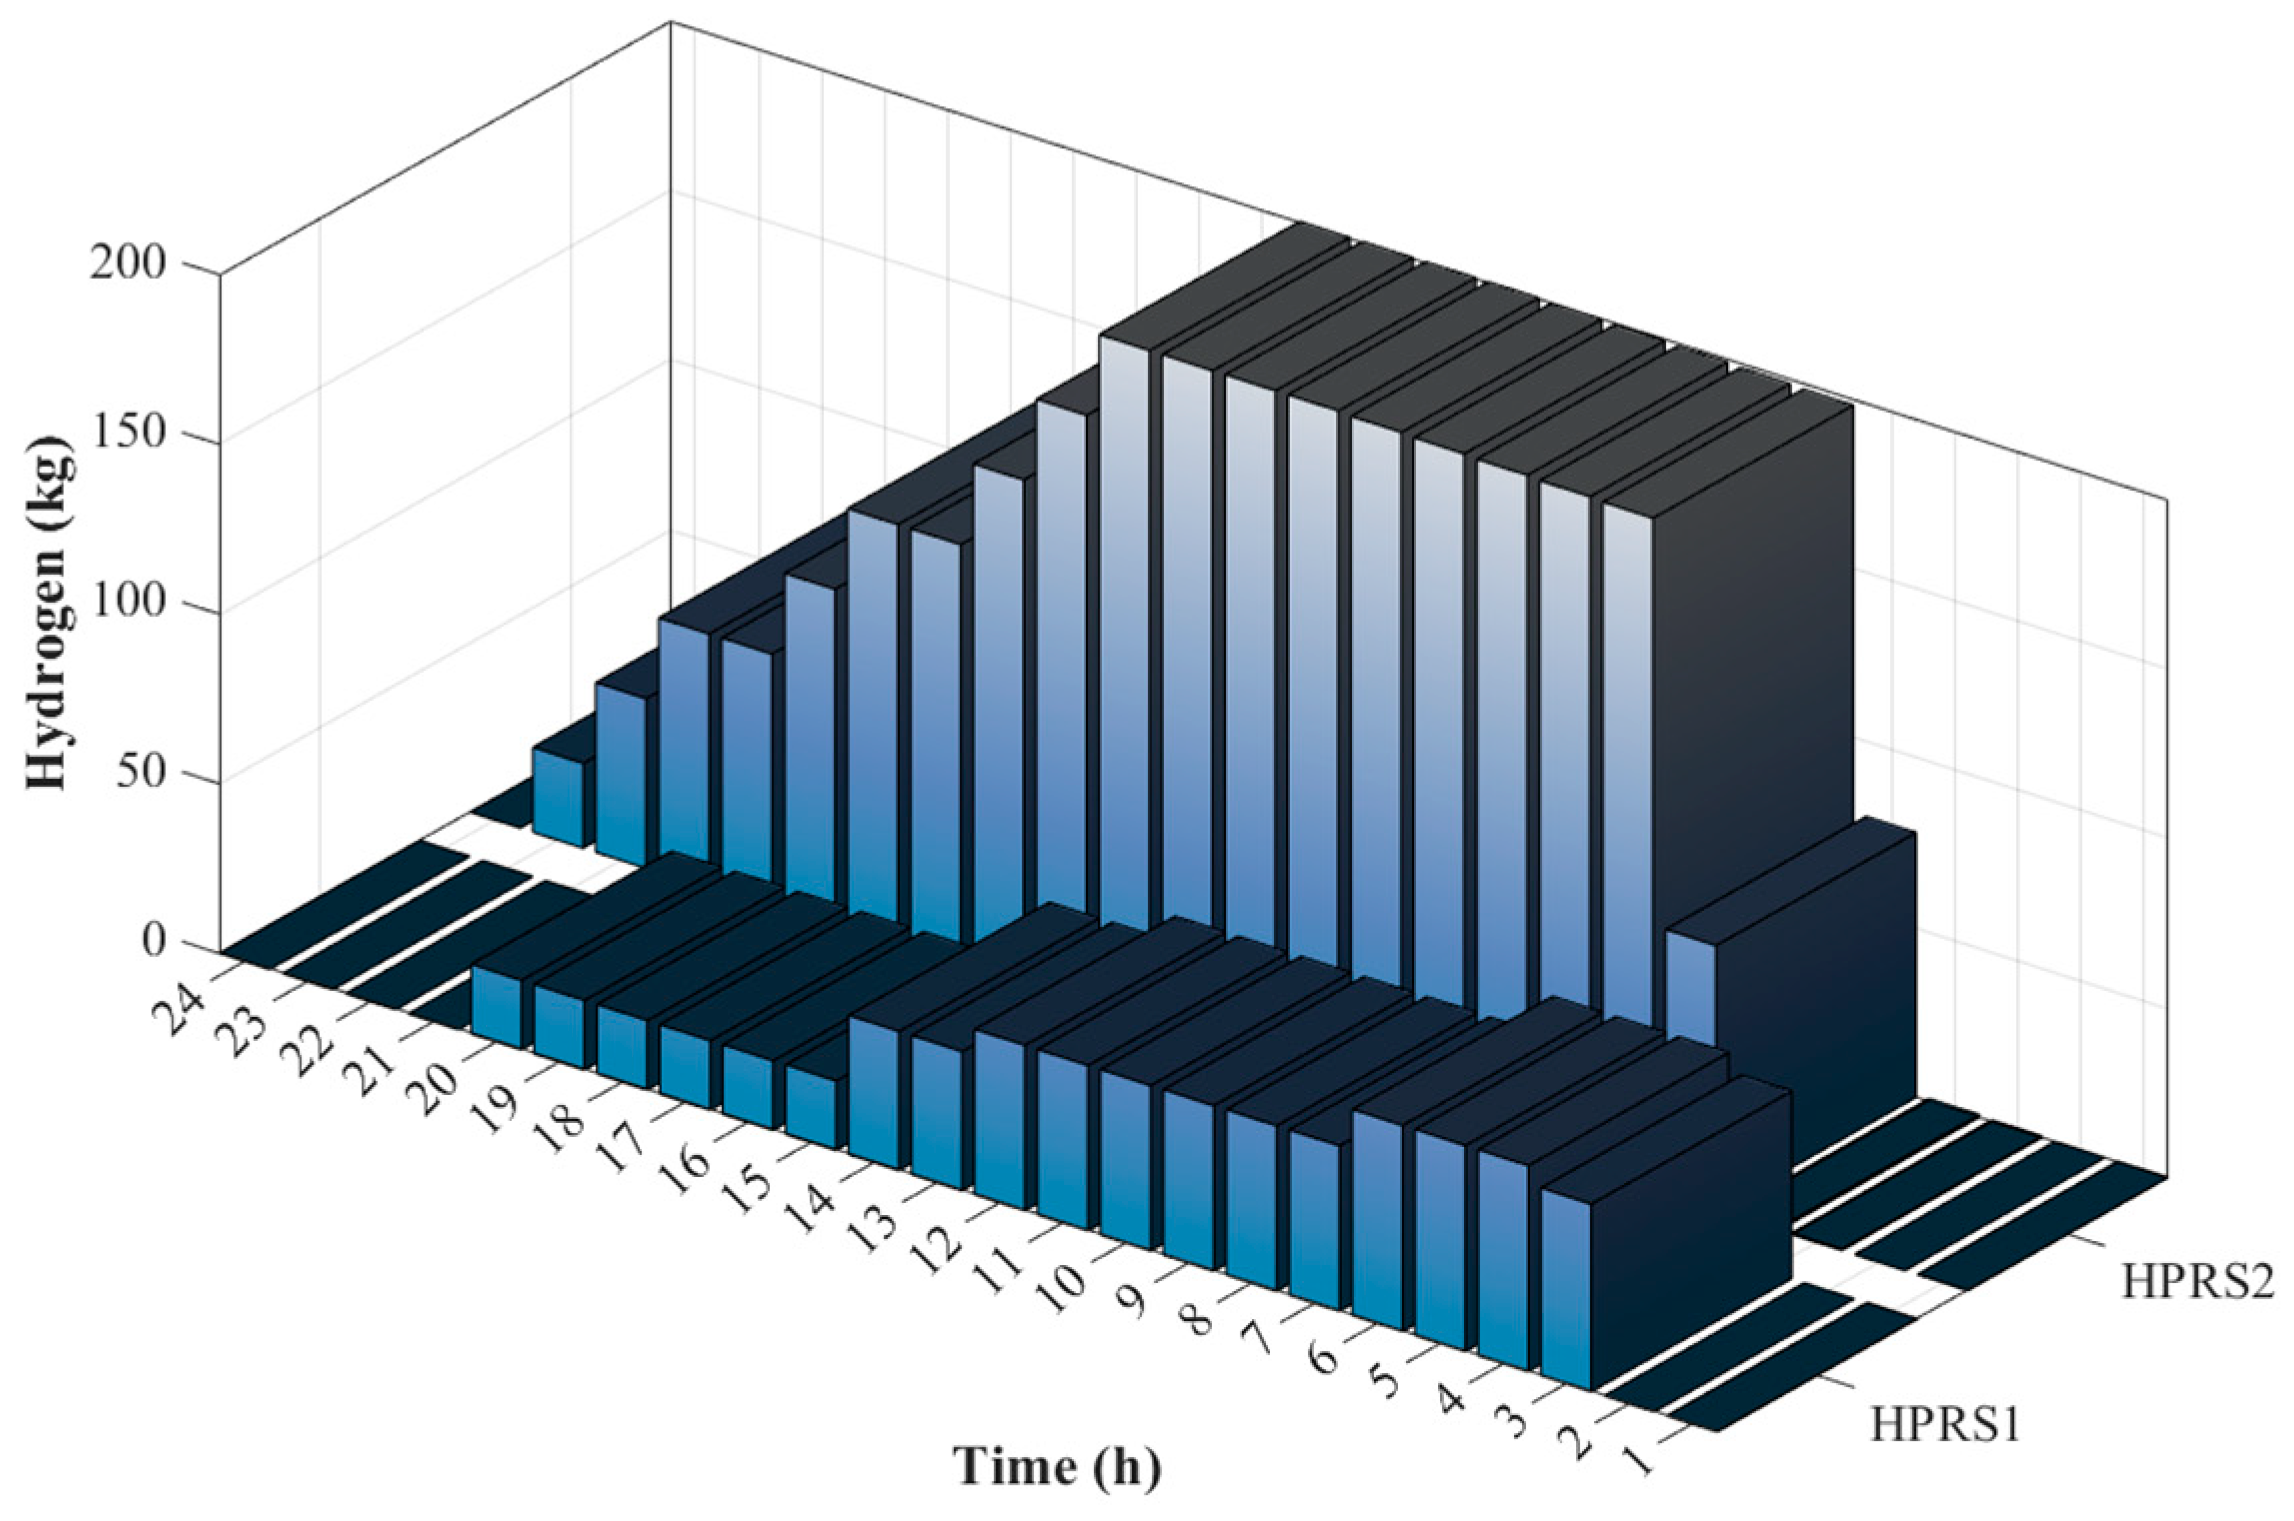
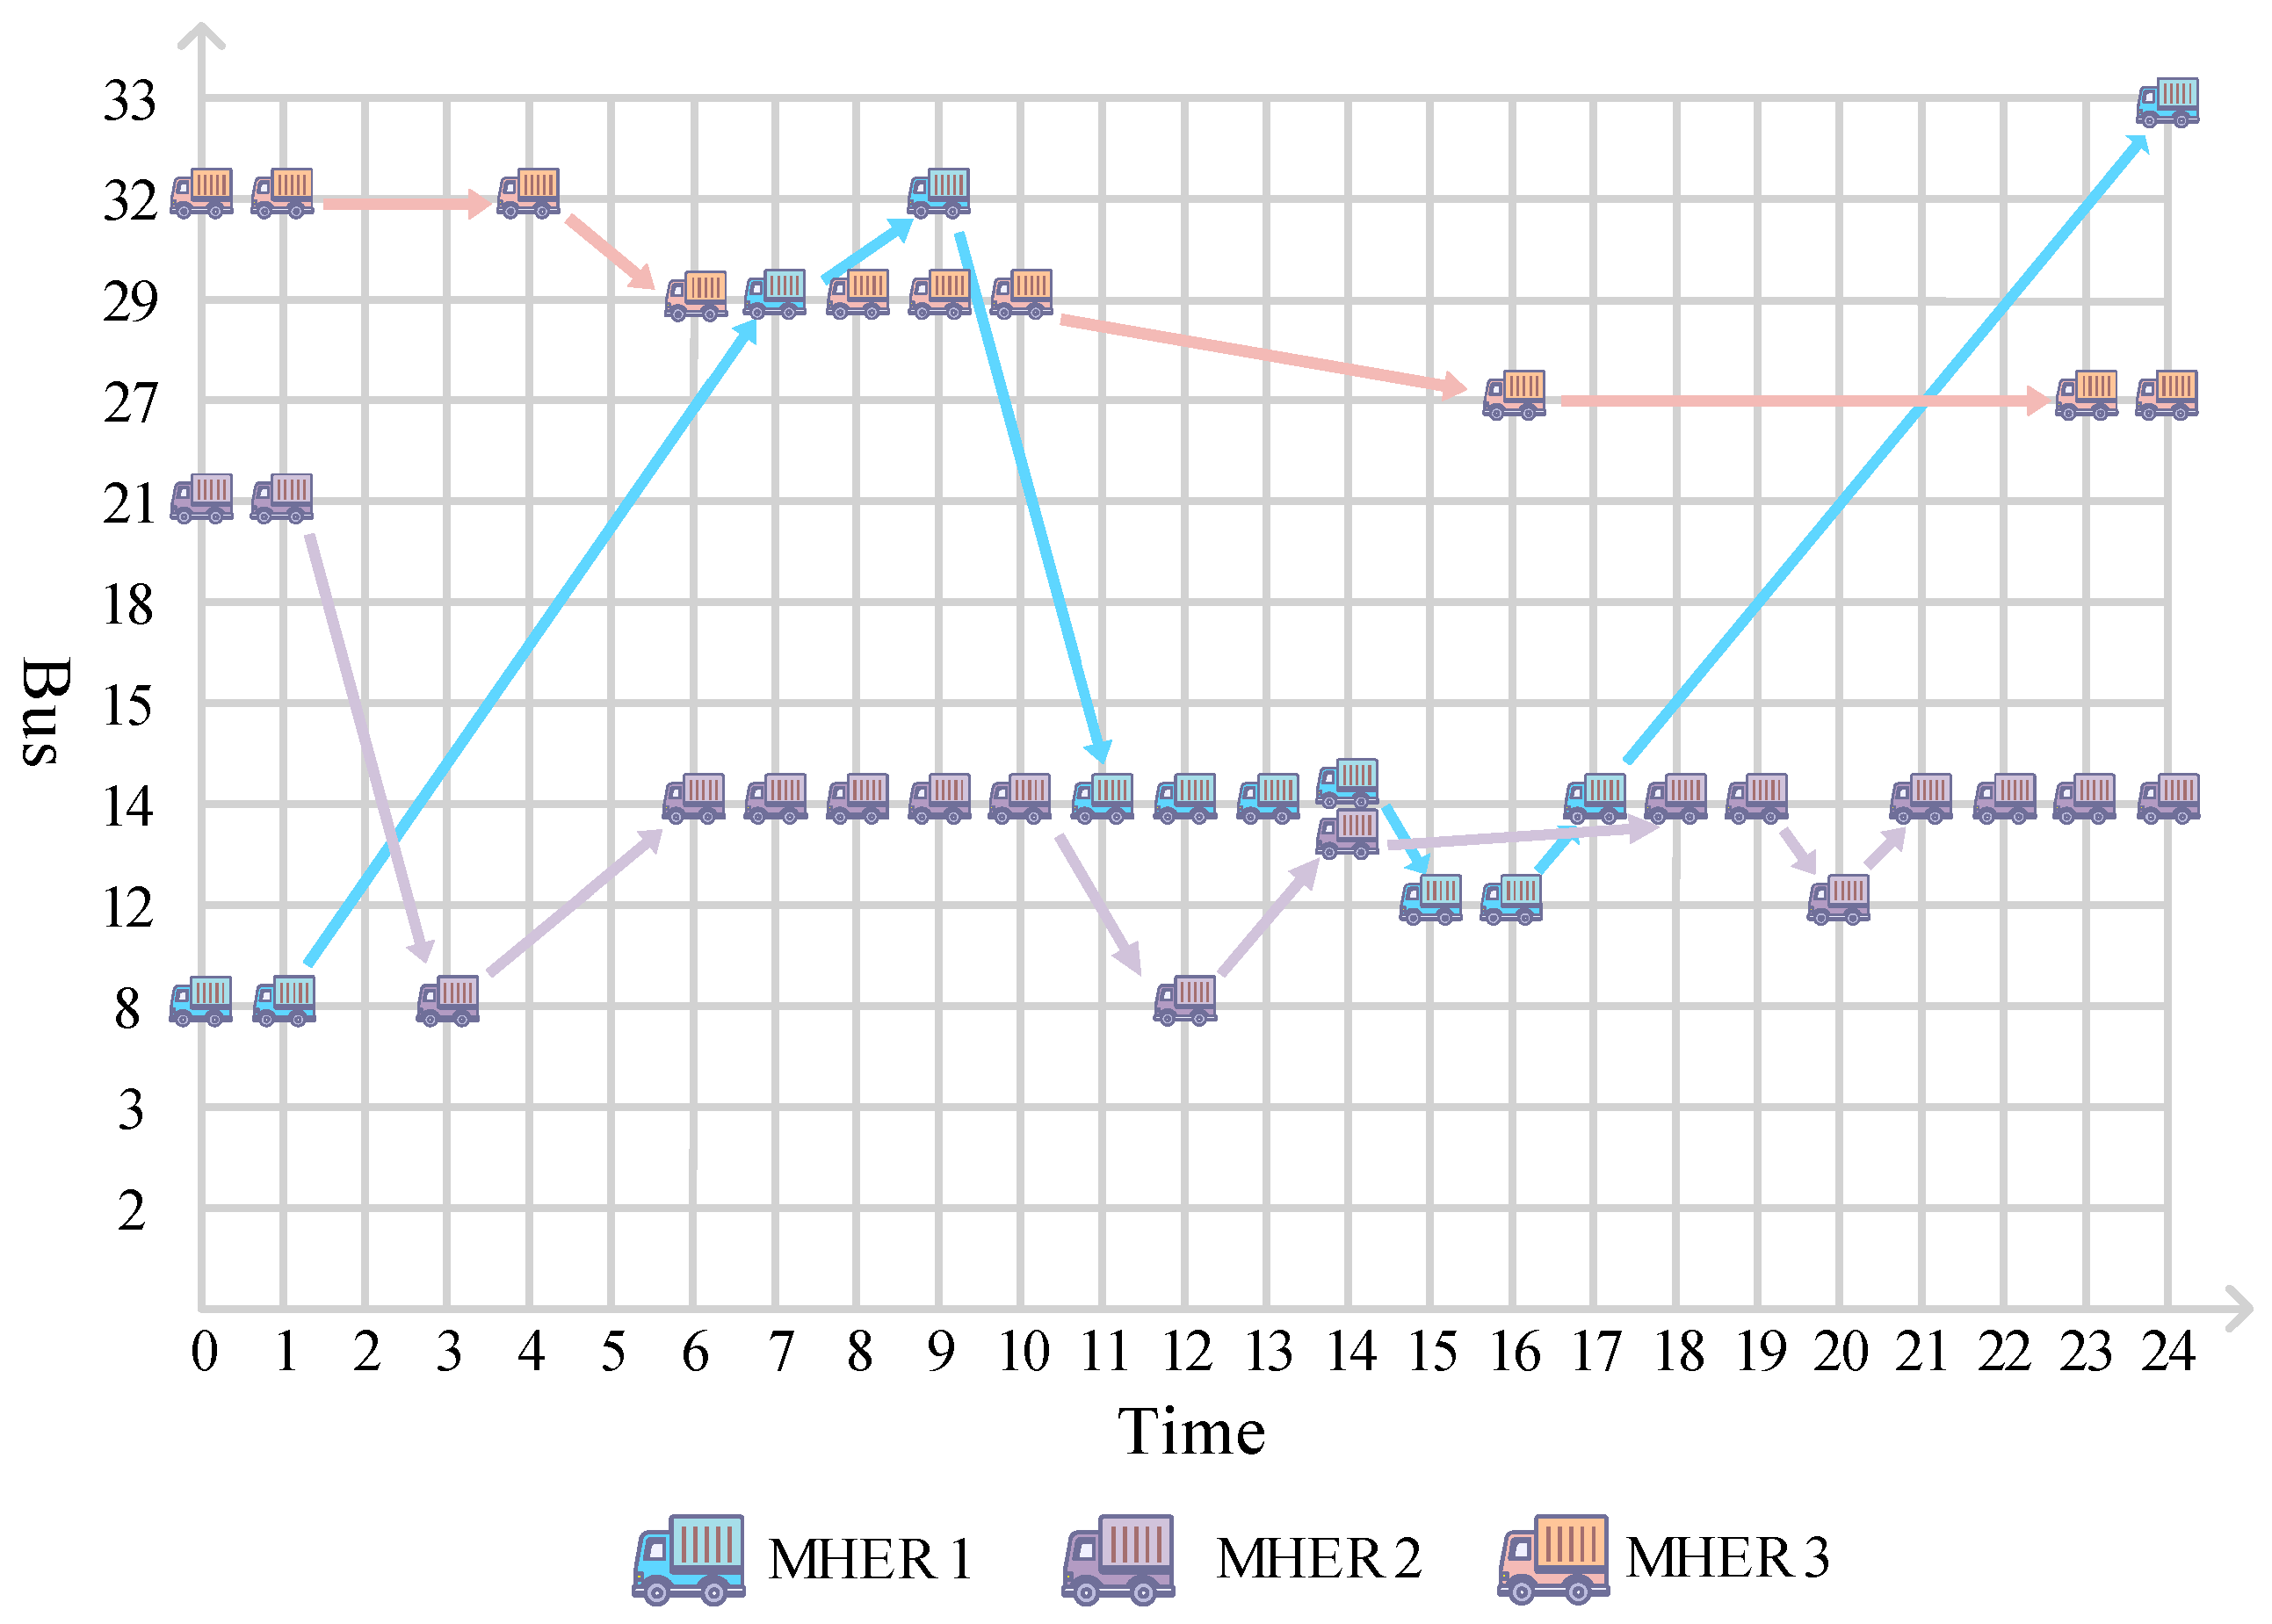
To address the issue of zones with no power supply but unaffected by faults, the flexible dispatching of MHERs provides an effective solution. Figure 11 and Figure 12 show the hydrogen storage capacity of the HPRS and the MHER dispatching scheme, respectively. For example, during the prevention stage, MHER1, MHER2, and MHER3 were pre-deployed at buses 8, 21, and 32, respectively, and underwent hydrogen refueling. During the fault isolation stage, MHER2 and MHER3 were dispatched to buses 14 and 29 to ensure a power supply for the two zones encompassing buses 25, 29, 30, and 31 and buses 9–15 and 22, while MHER1 was first dispatched to bus 32 and then relocated to bus 14 to prevent an insufficient power output from MHER2 and MHER3, which could have led to power loss in critical buses. During the power restoration stage, as the island containing buses 25, 29, 30, and 31 was connected to DGs, the MHER dispatching plan prioritized the zone encompassing buses 9–15 and 22, and at least one MHER was actively supplying power in this zone. Additionally, the two HPRSs increased their hydrogen storage capacity to a high level using electrolyzers before the fault isolation stage. For instance, the HPRS at bus 32 increased its hydrogen storage from 0 to 200 kg within 6 h and subsequently supported power supply in later stages.

4.3. Comparison of Various Approaches

This section introduces two additional comparative cases to validate the effectiveness of the proposed methodology:
Case 1: the method proposed in this paper.
Case 2: considers only the power distribution system and HPRSs, without coordinated consideration of the MHERs.
Case 3: considers only the power distribution system, without coordinated consideration of either the HPRSs or MHERs.
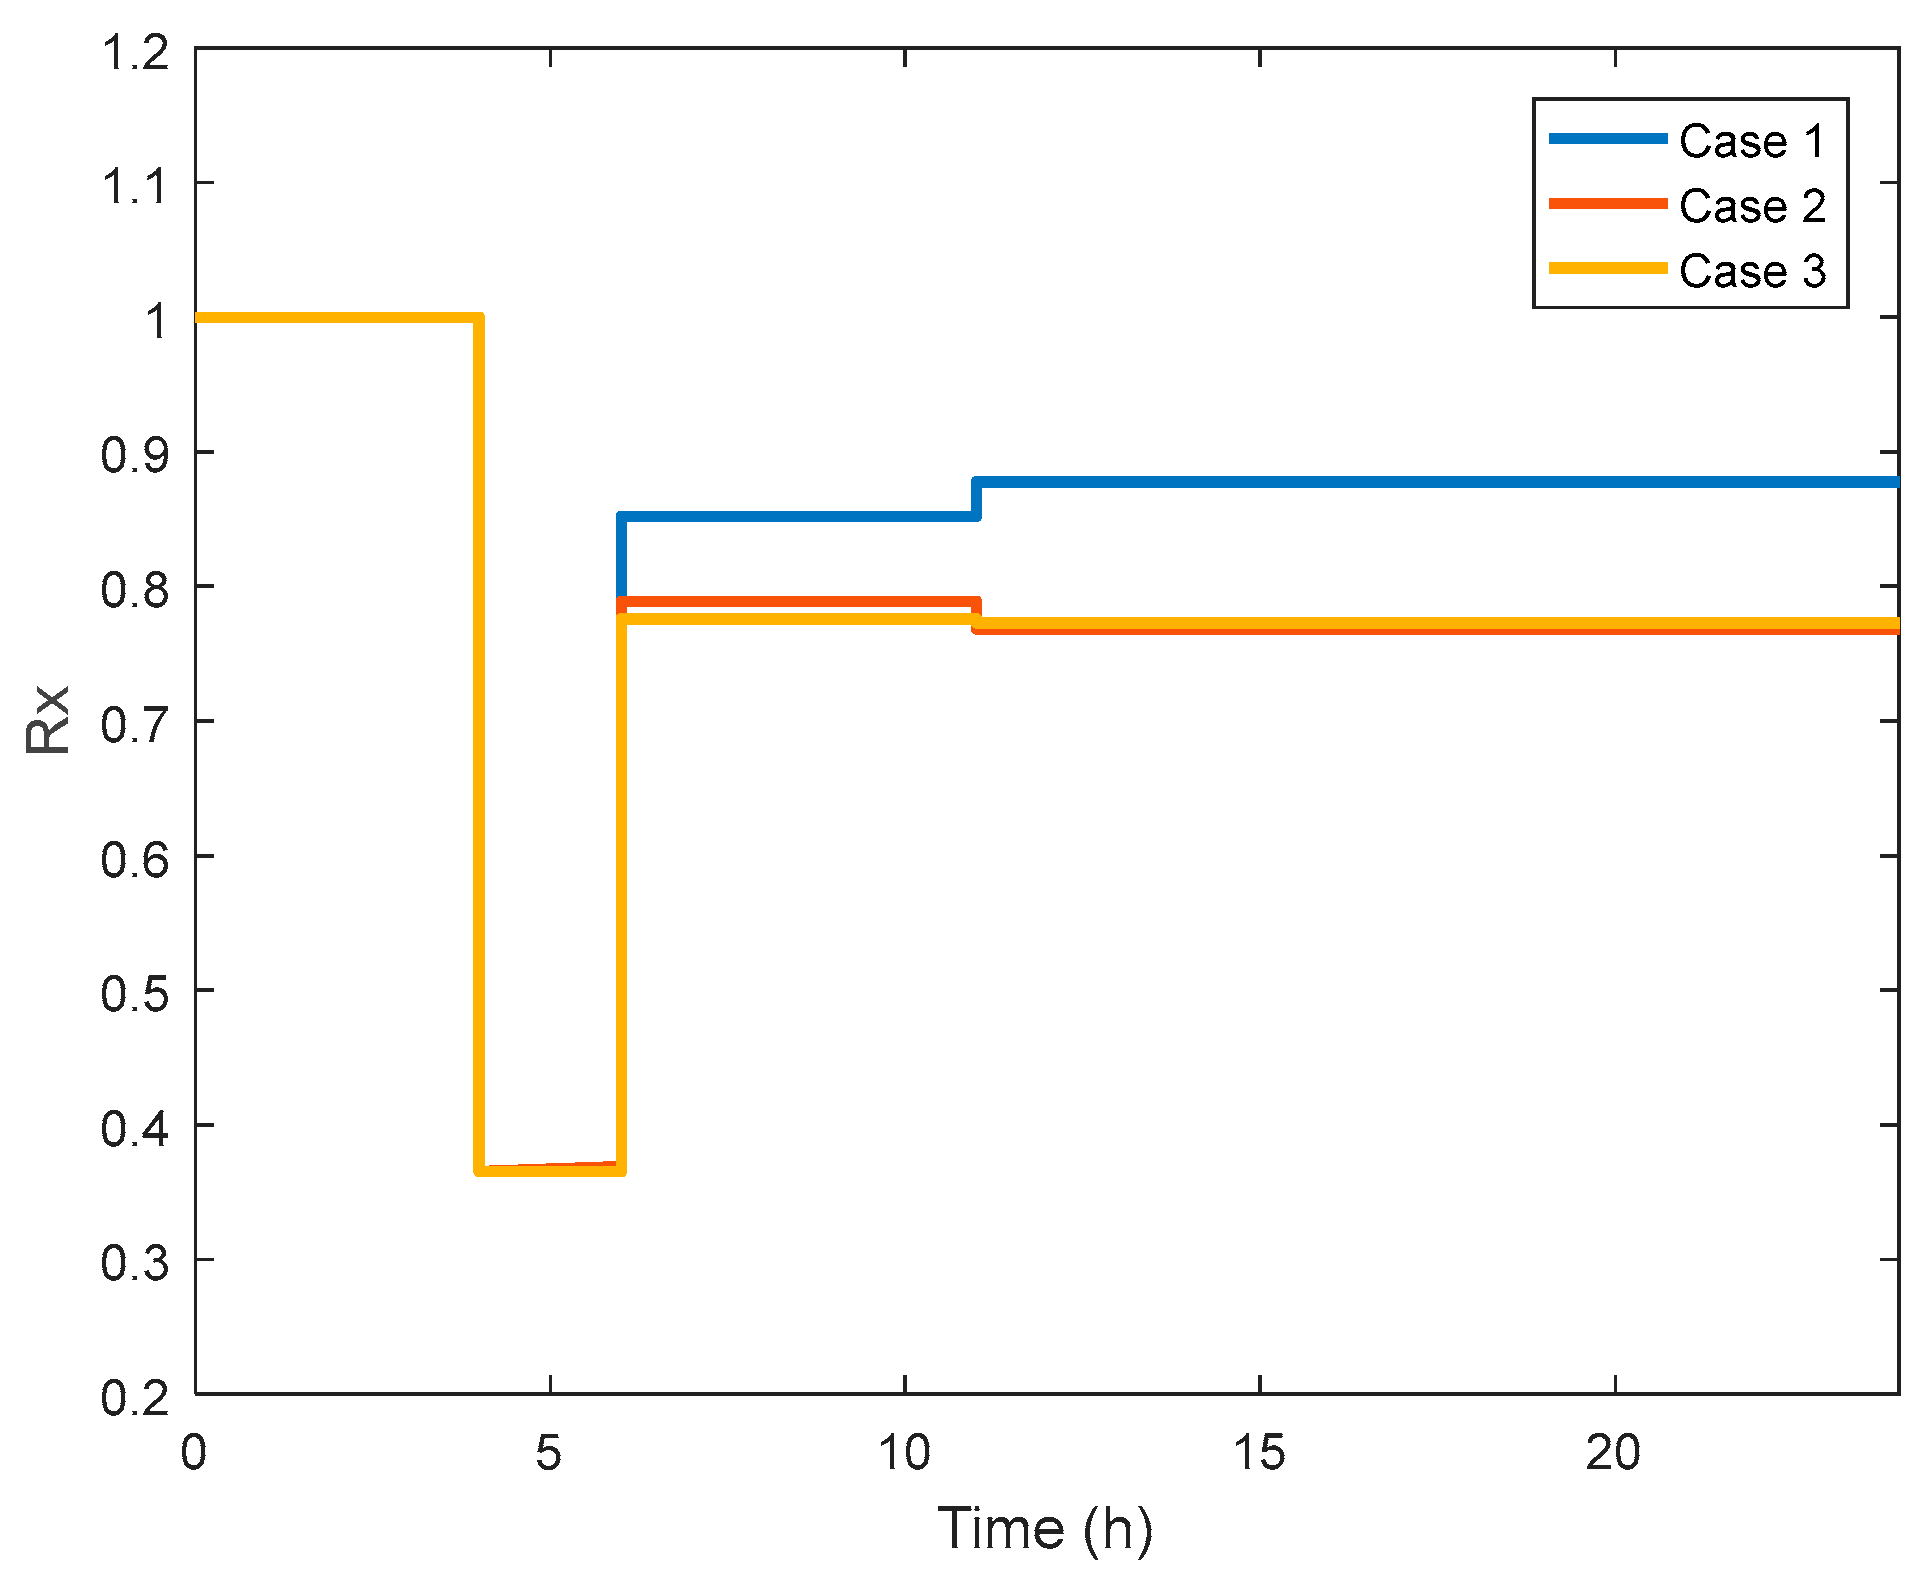
Figure 13 shows a comparison of the power distribution system’s expected resilience curves in the three cases. The results show that Case 1 maximized the power distribution system’s overall resilience level through the coordinated dispatching of three types of recovery resources. During the service restoration stage, Case 1 successfully maintained the system’s resilience level at approximately 87% using effective dispatch measures. In contrast, Case 2 and Case 3 showed significant load shedding during the service restoration stage, with their resilience levels dropping below 80%. This was due to their failure to adequately coordinate the coupling relationships among different restoration resources. In Case 2, insufficient consideration of the coupling relationship between the HPRSs and MHERs resulted in insufficient hydrogen reserves in the HPRSs during the prevention stage, which further constrained the energy supply capacity in the service restoration stage. In Case 3, due to the complete neglect of coordination between the distribution and other systems, the outcome was the least favorable among all cases. Although Case 2 and Case 3 achieved fault isolation through conventional network reconfiguration, their limited power supply resources caused a failure to effectively resolve outage issues in some load buses.

4.4. Sensitivity Analysis

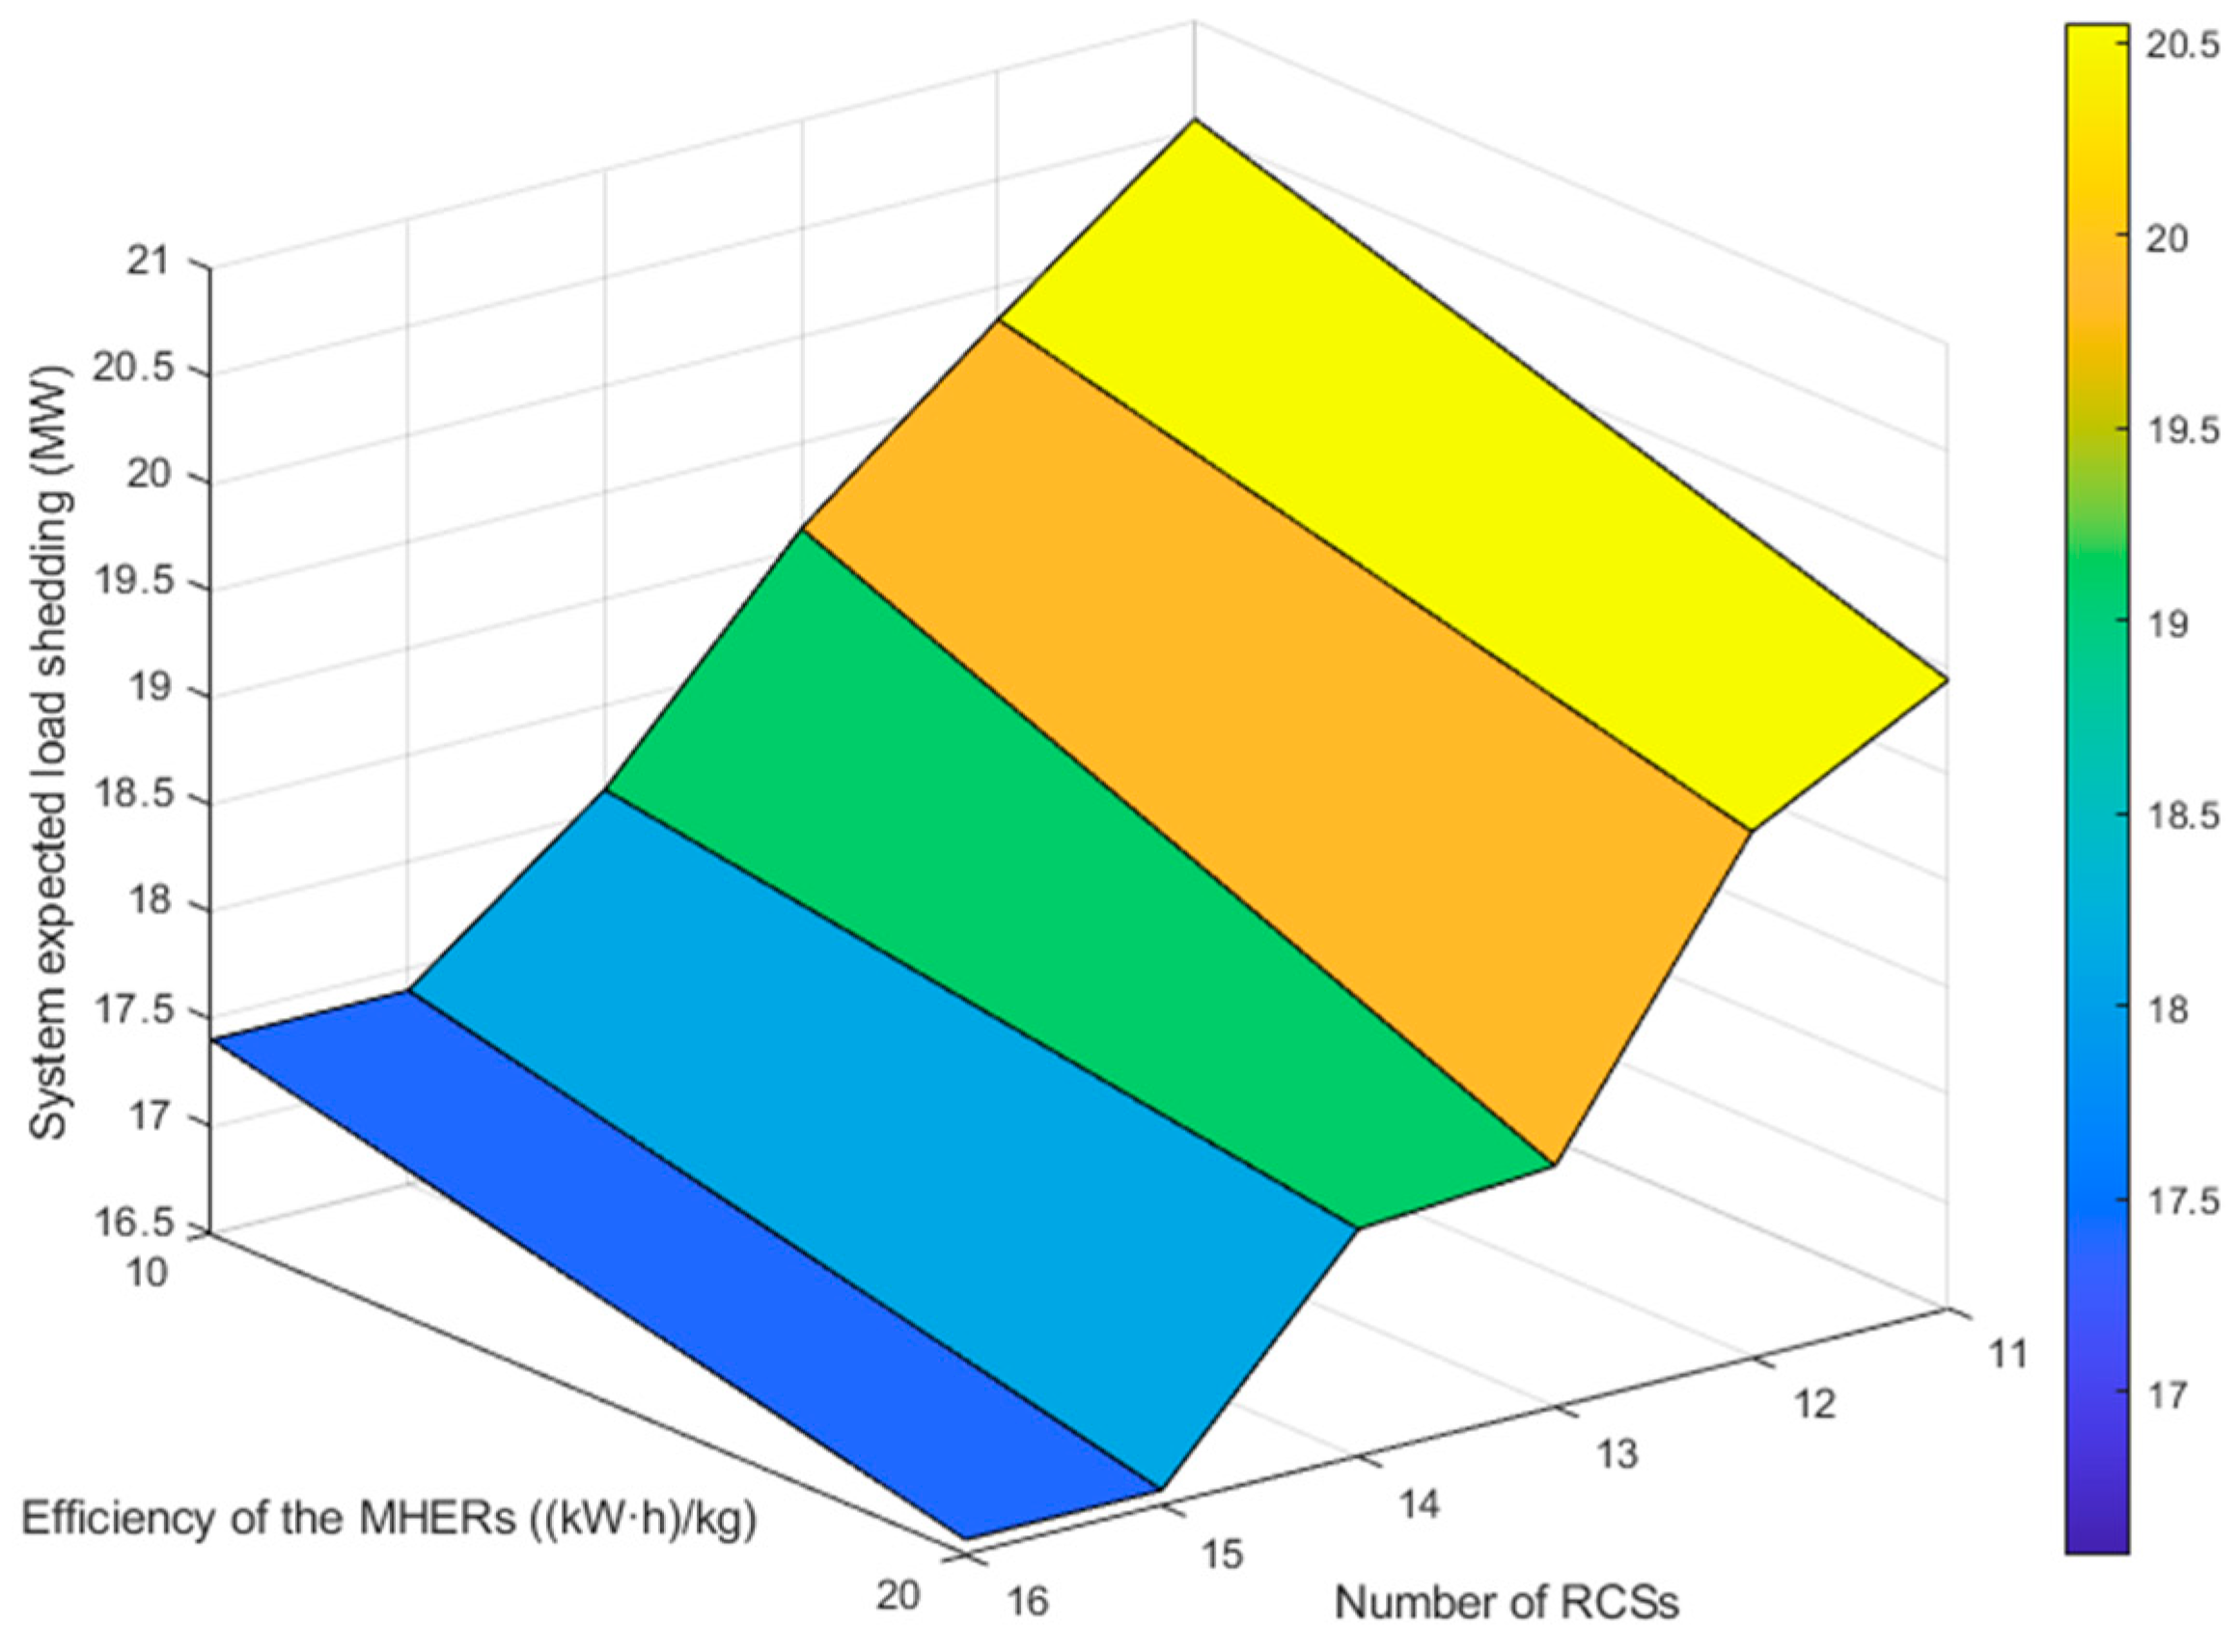
To further investigate the impact of the number of RCSs and the efficiency of the MHERs on system performance, Figure 14 shows the trend of system expected load shedding with respect to these two parameters. The curves in this figure were obtained using parameter settings consistent with those in Section 4.1, with the only variables being the number of RCS and the efficiency of the MHERs. Three different fault scenarios were simulated, and the results represent the mathematical expectation of the system expected load shedding across all three scenarios.
As the number of RCSs increases, the system expected load shedding decreases significantly, indicating that adding RCSs can effectively enhance system resilience. However, when the number of RCSs exceeds 15, the rate of decrease in the system expected load shedding begins to slow, suggesting that the cost–benefit of each additional RCSs gradually diminishes. This phenomenon indicates that although initially increasing the number of RCSs can significantly improve system resilience, beyond a certain threshold, the additional benefits gained from further increasing the number of RCSs become relatively small. Therefore, in practical systems, rationally configuring the number of RCSs is key to balancing system cost and resilience. Meanwhile, the decrease in expected load shedding with improved efficiency of the MHERs confirms that enhancing the efficiency of the MHERs is an effective strategy for strengthening the resilience of the distribution system.

5. Conclusions

This study proposes a resilience enhancement method for power distribution systems involving the coordination of the power distribution, transportation, and hydrogen energy systems within a multi-stage restoration framework. By comprehensively optimizing the configuration and coordinated scheduling of resources such as RCSs, MHERs, and HPRSs across different stages, the resilience level of the power distribution system was significantly improved. Case studies validated the effectiveness of the proposed method, leading us to draw the following key conclusions: (1) Compared to isolated consideration of the power distribution system, the coordinated integration of the transportation and hydrogen energy systems into the multi-stage process demonstrated superior effectiveness in enhancing the system’s resilience. (2) For zones with no power supply formed due to network reconfiguration, the dynamic dispatching of MHERs effectively ensured a power supply to critical buses. (3) The HPRS, through its multi-stage hydrogen management plan, ensured its ability to supply hydrogen to MHERs.
It should be noted that this study did not incorporate communication systems into the coordinated restoration framework. Enhancing the communication efficiency and developing scalable algorithms for large-scale systems will be critical directions for future research.

Author Contributions

Software, X.C.; writing—original draft, X.C.; writing—review and editing, J.L.; supervision, P.L., J.R., D.Z. and X.Z. All authors have read and agreed to the published version of the manuscript.

Funding

This research received no external funding.

Data Availability Statement

The data presented in this study are available on request from the corresponding author.

Conflicts of Interest

The authors declare no conflicts of interest.

Nomenclature

Sets:
Ω bus / Ω l bus Set of buses/set of buses at both ends of line l
Ω time Set of time periods
Ω line / Ω i line Set of lines/set of lines connected to bus i
Ω snr Set of fault scenarios
Ω B Set of MHERs
Ω DE Set of candidate locations
Parameters:
N rcs Number of RCSs
N max pre Maximum capacity for MHER deployment
N bus Number of buses
M Large number
U ref Reference voltage magnitude
f l , t , c Binary: 1 if line l fails at time t in scenario c
P i load / Q i load Active and reactive loads at bus i
a l / b l Resistance and reactance of line l
U i max / U i min Maximum and minimum voltage magnitudes of bus i
P l fmax / Q l fmax Active and reactive loads at line l
H h Calorific value of hydrogen
μ i Efficiency of the electrolyzer at bus i
k p 2 h Power-to-hydrogen conversion coefficient
μ EH Efficiency of the hydrogen fuel cell
P i HPRS _ max / Q i HPRS _ max Maximum active and reactive power outputs of the HPRS at bus i
H i HPRS _ max / H i HPRS _ min Maximum and minimum allowable hydrogen storage capacities at bus i
P i dmax / P i dmin Maximum and minimum active power outputs of the DG at bus i
Q i dmax / Q i dmin Maximum and minimum reactive power outputs of the DG at bus i
D m , n / D m , n initial Equivalent distance and real distance between buses m and n
V 0 / V k Zero-flow speed and actual speed
f Congestion level
T k , m , n MHER Equivalent time from bus m to bus n
P k MHER _ max / Q k MHER _ max Maximum active and reactive power outputs of the kth MHER
H k MHER _ max Maximum allowable hydrogen storage capacity at the kth MHER
η k Efficiency of the kth MHER
H k MHER _ max / H k MHER _ min Maximum and minimum allowable hydrogen storage capacities of the kth MHER
ω i Weight coefficient of bus i
Δ t Time period
Variables
z l , t pre , z l , t , c isl , z l , t , c rst Binary: 1 if line l is closed, 0 otherwise
z i , l , t pre , z i , l , t , c isl , z i , l , t , c rst Binary: 1 if the i-end of line l is closed, 0 otherwise
s i , l rcs Binary: 1 if end i of the line is equipped with an RCS
γ i pre , γ i , c rst Binary: 1 if bus i is a source bus, 0 otherwise
F l , t pre , F l , t , c rst Commodity flow through line l
P l , t pre _ flow , P l , t , c isl _ flow , P l , t , c rst _ flow Active power flow through line l
Q l , t pre _ flow , Q l , t , c isl _ flow , Q l , t , c rst _ flow Reactive power flow through line l
P i , t , c drt _ shed , P i , t , c isl _ shed , P i , t , c rst _ shed Active load shedding at bus i
Q i , t , c drt _ shed , Q i , t , c isl _ shed , Q i , t , c rst _ shed Reactive load shedding at bus i
U i , t pre , U i , t , c isl , U i , t , c rst Voltage at bus i
μ i , t , c drt , μ i , t , c isl Binary: 1 if bus i is in the fault zone
z l , t tmp 1 Binary: used for linearization
H i , t , c pro Hydrogen production of the HPRS at bus i
P i , t , c pro Active power demand of the HPRS at bus i
H i , t , c HPRS Hydrogen storage level of the HPRS at bus i
H k , i , t , c in Refueling capacity of the kth MHER at bus i
P i , t , c HPRS / Q i , t , c HPRS Active and reactive power outputs of the HPRS at bus i
P i , t , c dg / Q i , t , c dg Active and reactive power outputs of the DG at bus i
α k , m pre Binary: 1 if the kth MHER is pre-deployed at bus m
α k , m , t , c MHER Binary: 1 if the kth MHER arrives at bus m at time t
P k , i , t , c MHER / Q k , i , t , c MHER Active and reactive power outputs of the kth MHER at bus i
H k , i , t MHER Hydrogen storage level of the kth MHER
R x , t , c Resilience level
P c shed Total load shedding in scenario c
p c Probability of fault scenario c

References

  1. Hu, J.; Liu, X.; Shahidehpour, M.; Xia, S. Optimal operation of energy hubs with large-scale distributed energy resources for distribution network congestion management. IEEE Trans. Sustain. Energy 2021, 12, 1755–1765. [Google Scholar] [CrossRef]
  2. Poudyal, A.; Poudel, S.; Dubey, A. Risk-based active distribution system planning for resilience against extreme weather events. IEEE Trans. Sustain. Energy 2023, 14, 1178–1192. [Google Scholar] [CrossRef]
  3. Ma, S.; Chen, B.; Wang, Z. Resilience enhancement strategy for distribution systems under extreme weather events. IEEE Trans. Smart Grid 2018, 9, 1442–1451. [Google Scholar] [CrossRef]
  4. Wu, D.; Zheng, X.; Xu, Y.; Olsen, D.; Xia, B.; Singh, C.; Xie, L. An open-source extendable model and corrective measure assessment of the 2021 texas power outage. Adv. Appl. Energy 2021, 4, 100056. [Google Scholar] [CrossRef]
  5. World Meteorological Organization (WMO). State of the Global Climate 2022; WMO: Geneva, Switzerland, 2022. [Google Scholar]
  6. Deng, H.; Yang, B.; Chow, M.Y.; Zhu, D.; Yao, G.; Chen, C.; Guan, X.; Srinivasan, D. A decision-dependent hydrogen supply infrastructure planning approach considering causality between vehicles and stations. IEEE Trans. Sustain. Energy 2024, 15, 1914–1932. [Google Scholar] [CrossRef]
  7. He, X.; Zhang, B.L.; Jia, H.Y.; Xin, K.; Wang, Y.; Yu, C.; Zhang, B. Regret-aware optimization of hydrogen-assisted congestion control in a renewable-dominated reconfigurable distribution network. Renew. Energy 2025, 250, 123084. [Google Scholar] [CrossRef]
  8. Lian, X.; Qiu, L.; Song, C.; Liu, L.; Xu, Z. Enhancing resilience of power-transportation coupled networks to typhoons: A tri-stage integration strategy of multi-resources. IEEE Trans. Sustain. Energy Grids Netw. 2025, 43, 101747. [Google Scholar] [CrossRef]
  9. Liu, J.; Qin, C.; Yu, Y. Enhancing distribution system resilience with proactive islanding and RCS-based fast fault isolation and service restoration. IEEE Trans. Smart Grid 2020, 11, 2381–2395. [Google Scholar] [CrossRef]
  10. Lei, C.; Bu, S.; Wang, Q.; Liang, L. Observability defense-constrained distribution network reconfiguration for cyber-physical security enhancement. IEEE Trans. Smart Grid 2024, 15, 2379–2382. [Google Scholar] [CrossRef]
  11. Li, Y.; Lei, S.; Sun, W.; Hu, C.; Hou, Y. A distributionally robust resilience enhancement strategy for distribution networks considering decision-dependent contingencies. IEEE Trans. Smart Grid 2024, 15, 1450–1465. [Google Scholar] [CrossRef]
  12. Liu, J.; Lin, G.; Huang, S.; Zhou, Y.; Rehtanz, C.; Li, Y. Collaborative EV routing and charging scheduling with power distribution and traffic networks interaction. IEEE Trans. Power Syst. 2022, 37, 3923–3936. [Google Scholar] [CrossRef]
  13. Li, J.; Xu, X.; Yan, Z.; Wang, H.; Shahidehpour, M.; Chen, Y. Coordinated optimization of emergency response resources in transportation-power distribution networks under extreme events. IEEE Trans. Smart Grid 2023, 14, 4607–4620. [Google Scholar] [CrossRef]
  14. Yan, M.; Shahidehpour, M.; Paaso, A.; Zhang, L.; Alabdulwahab, A.; Abusorrah, A. Distribution system resilience in ice storms by optimal routing of mobile devices on congested roads. IEEE Trans. Smart Grid 2021, 12, 1314–1328. [Google Scholar] [CrossRef]
  15. Cao, Y.; Zhou, B.; Chung, C.Y.; Zhou, K.; Zhu, L.; Shuai, Z. Resilience-oriented coordinated topology reconfiguration of electricity and drainage networks with distributed mobile emergency resources. IEEE Trans. Smart Grid 2025, 16, 786–800. [Google Scholar] [CrossRef]
  16. Liu, X.; Soh, C.B.; Zhao, T.; Wang, P. Stochastic scheduling of mobile energy storage in coupled distribution and transportation networks for conversion capacity enhancement. IEEE Trans. Smart Grid 2021, 12, 117–130. [Google Scholar] [CrossRef]
  17. Zhao, Y.; Lin, J.; Song, Y.; Xu, Y. A robust microgrid formation strategy for resilience enhancement of hydrogen penetrated active distribution networks. IEEE Trans. Power Syst. 2024, 39, 2735–2748. [Google Scholar] [CrossRef]
  18. Cao, X.; Cao, T.; Xu, Z.; Zeng, B.; Gao, F.; Guan, X. Resilience constrained scheduling of mobile emergency resources in electricity-hydrogen distribution network. IEEE Trans. Sustain. Energy 2023, 14, 1269–1284. [Google Scholar] [CrossRef]
  19. Zhao, Y.; Lin, J.; Song, Y.; Xu, Y. A hierarchical strategy for restorative self-healing of hydrogen-penetrated distribution systems considering energy sharing via mobile resources. IEEE Trans. Power Syst. 2023, 38, 1388–1404. [Google Scholar] [CrossRef]
  20. Lei, S.; Chen, C.; Zhou, H.; Hou, Y. Routing and scheduling of mobile power sources for distribution system resilience enhancement. IEEE Trans. Smart Grid 2019, 10, 5650–5662. [Google Scholar] [CrossRef]
  21. Lin, Y.; Bie, Z. Tri-level optimal hardening plan for a resilient distribution system considering reconfiguration and DG islanding. Appl. Energy 2018, 210, 1266–1279. [Google Scholar] [CrossRef]
  22. Xu, Y.; Wang, Y.; He, J.; Su, M.; Ni, P. Resilience-oriented distribution system restoration considering mobile emergency resource dispatch in transportation system. IEEE Access 2019, 7, 73899–73912. [Google Scholar] [CrossRef]
  23. Zhang, J.; Zhang, W.; Wang, J.; Feng, J.; Gao, Z.; Zheng, S. Rechargeable battery cabinet deployment for public bike system. IEEE Trans. Intell. Transp. Syst. 2022, 23, 20309–20322. [Google Scholar] [CrossRef]
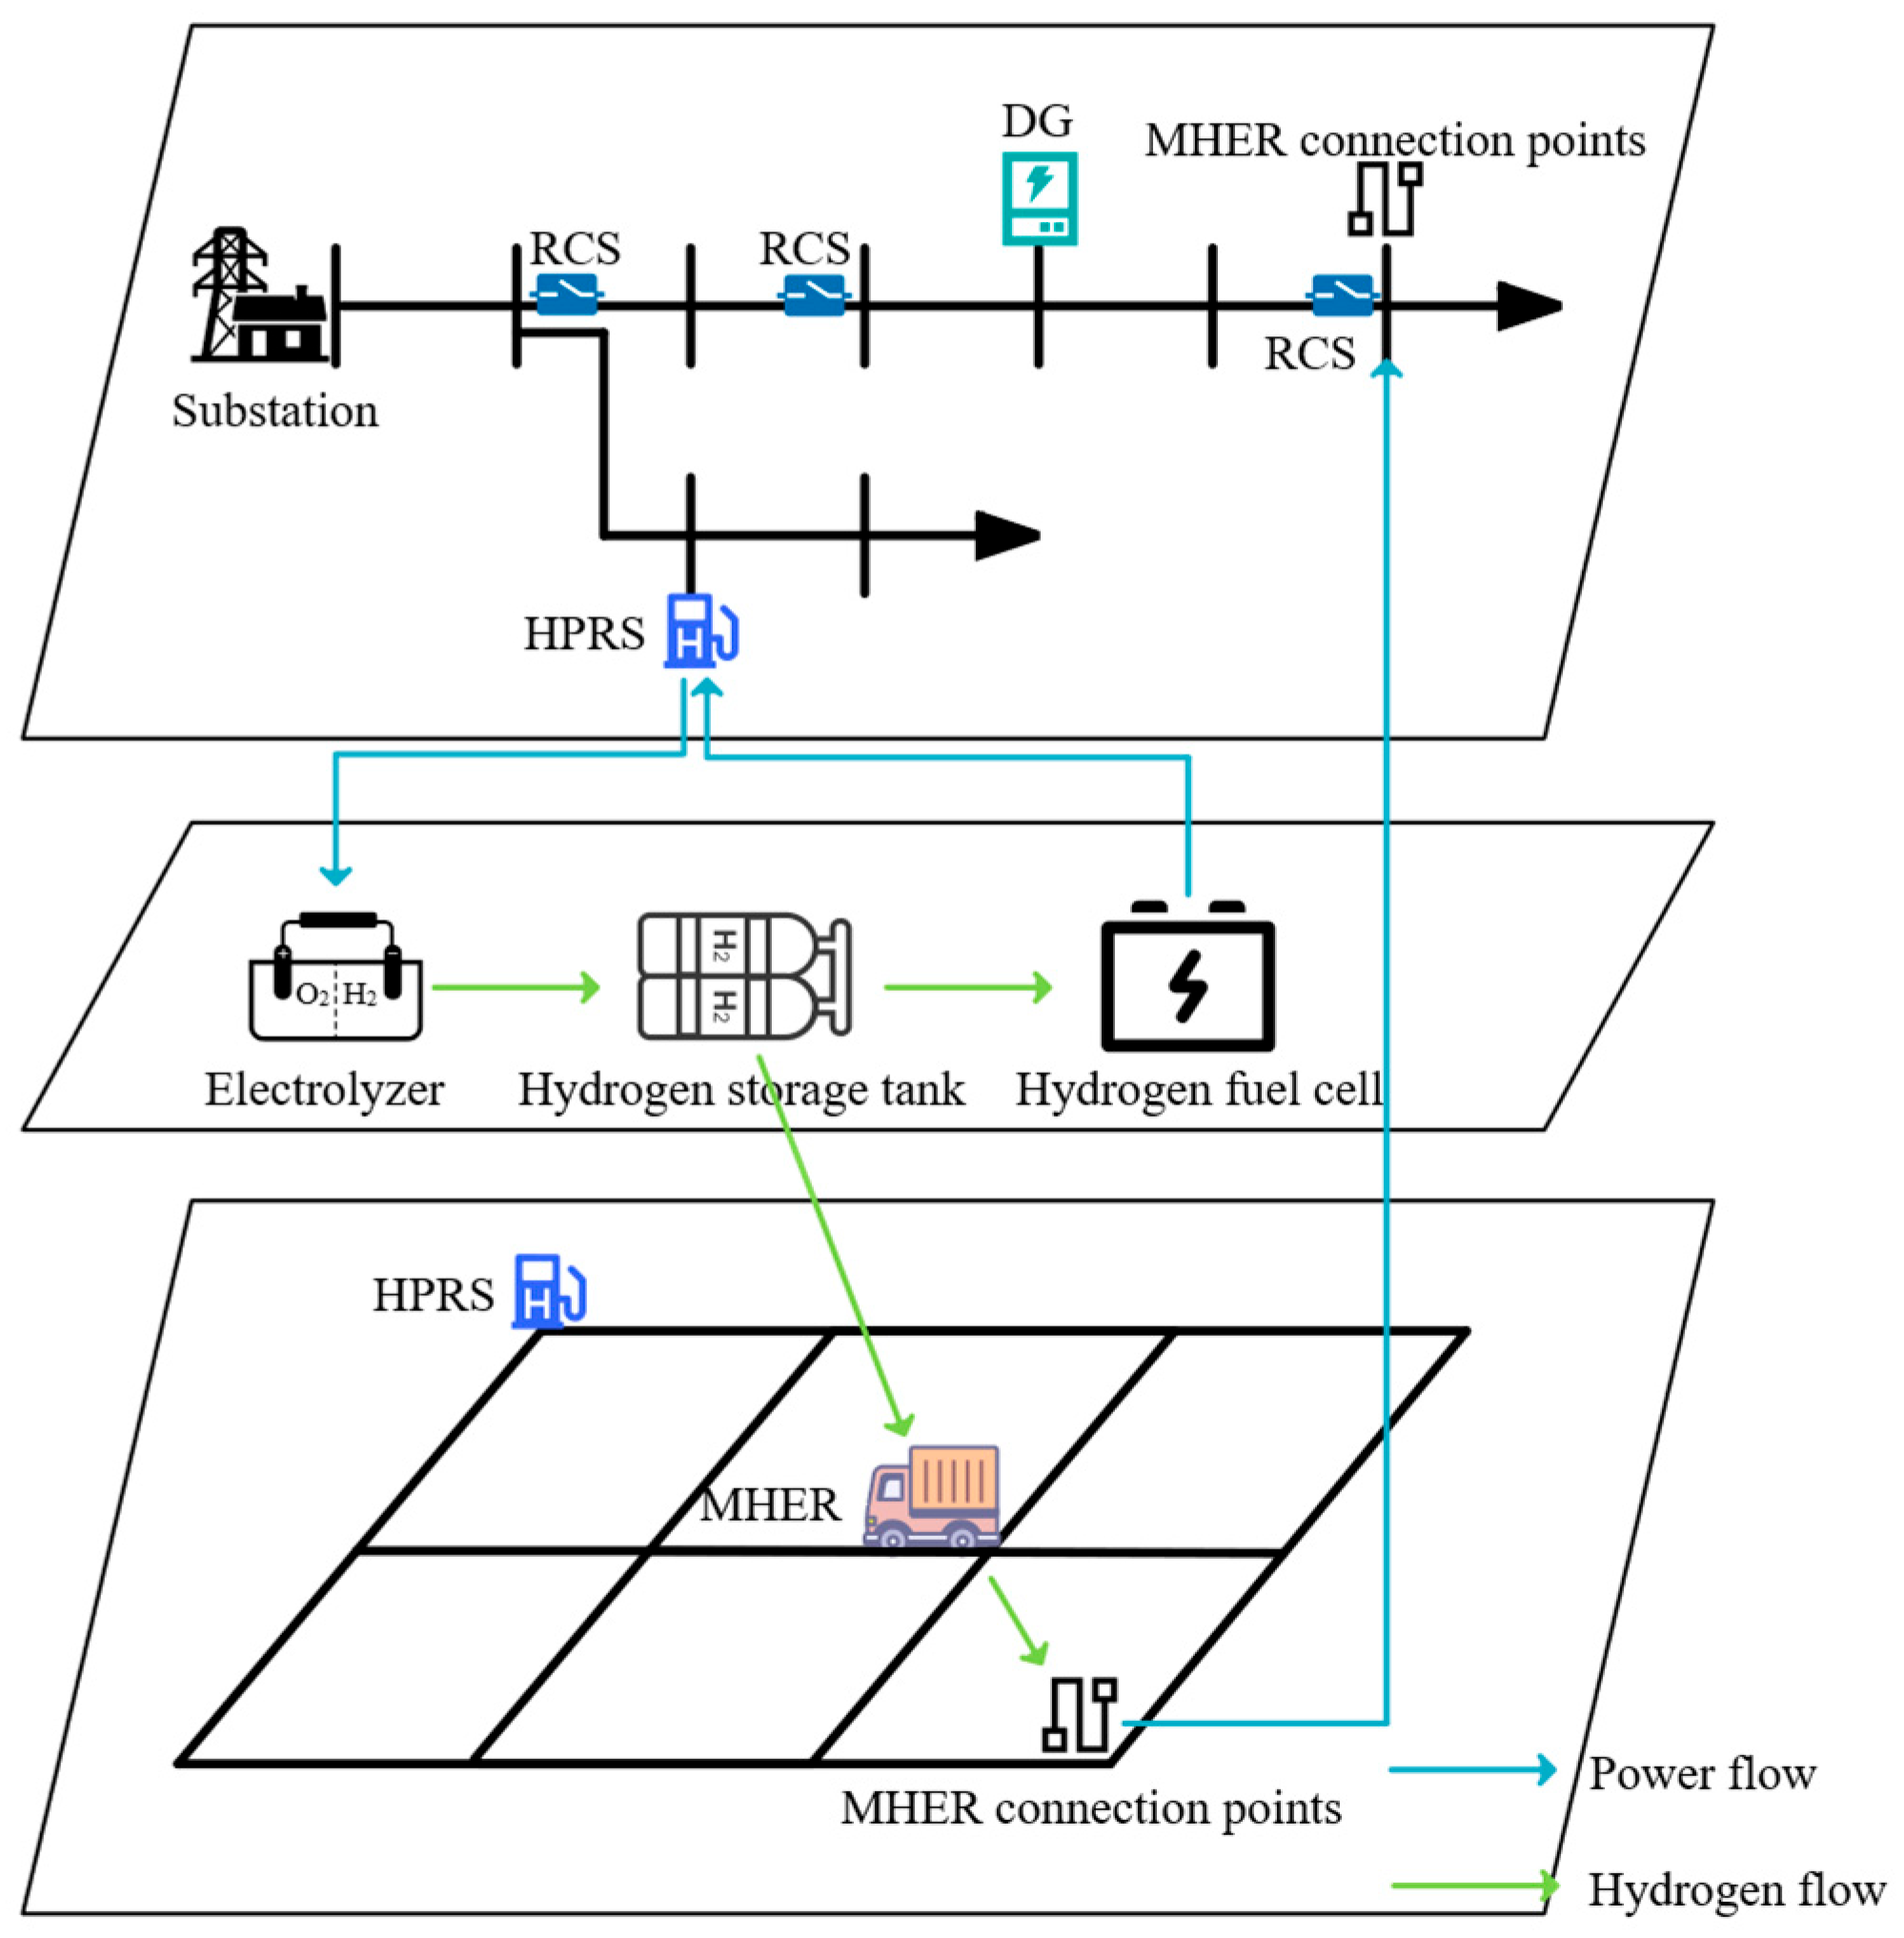
Figure 1. Schematic of coupled power–transportation–hydrogen system.
Sustainability 17 08691 g001
Figure 2. Resilience curve of the distribution system under extreme events.
Sustainability 17 08691 g002
Figure 3. Flowchart of the proposed method.
Sustainability 17 08691 g003
Figure 4. Transportation system’s topology.
Sustainability 17 08691 g004
Figure 5. IEEE 33-bus system’s initial topology.
Sustainability 17 08691 g005
Figure 6. Network topology at pre-event stage.
Sustainability 17 08691 g006
Figure 7. Expected resilience curves of the power distribution system.
Sustainability 17 08691 g007
Figure 8. Network topology at degradation stage.
Sustainability 17 08691 g008
Figure 9. Network topology at fault isolation stage.
Sustainability 17 08691 g009
Figure 10. Network topology at service restoration stage.
Sustainability 17 08691 g010
Figure 11. Hydrogen storage level of HPRSs.
Sustainability 17 08691 g011
Figure 12. Results of MHER dispatching.
Sustainability 17 08691 g012
Figure 13. Resilience curves of the power distribution system in three cases.
Sustainability 17 08691 g013
Figure 14. Variation curves of system expected load shedding.
Sustainability 17 08691 g014
Table 1. Fault scenarios for the IEEE 33-bus system.
Scenario NumberFaulty Lines
1L2, L11, L25, L26
2L15, L21, L28, L32
3L5, L8, L18, L24
Disclaimer/Publisher’s Note: The statements, opinions and data contained in all publications are solely those of the individual author(s) and contributor(s) and not of MDPI and/or the editor(s). MDPI and/or the editor(s) disclaim responsibility for any injury to people or property resulting from any ideas, methods, instructions or products referred to in the content.