1. Introduction
In the field of water resources engineering, real-time water quality data can offer detailed insights into water quality parameters’ temporal variability, enabling the exploration of seasonal patterns and the influence of external factors such as hydrologic variables (e.g., stream flow and water level) [
1,
2,
3]. This information can help water quality managers in decision-making processes. However, the high-resolution nature of real-time water quality datasets, characterized by significant variation, presents challenges in interpreting large datasets spanning months to years. Making sense of such extensive data over extended time periods can prove to be quite challenging [
1,
2,
4,
5,
6].
Previous investigators have applied multivariate statistical analysis (e.g., principal component analysis and factor analysis, positive matrix factorization, self-organizing maps, and weighted regression approach), non-parametric time series statistical analysis, artificial neural network modeling, and variable consistency dominance-based rough set methods to analyze water quality and hydrologic datasets. Most surface water quality research has focused on temporal and spatial variations in different catchments using multivariate statistics and trend analysis to investigate major contributing factors to water quality changes (e.g., mixed land use, land cover, and climate change). Studies of spatial and seasonal variability of water quality have shown that water quality degradation is predominantly linked to agricultural activities and urban sprawl [
7,
8,
9,
10]. However, these methods do not always offer insight into the temporal variation of a time series or multiple series’ intercorrelations on a temporal scale. The most common and effective statistical methods for analysis of real-time water quality data in a traditional statistical framework are non-parametric methods for detecting monotonic trends (e.g., Mann–Kendall and seasonal Mann–Kendall methods). Significant correlations between water quality parameters can also be determined via the non-parametric Kendall rank correction test and Spearman partial rank correlation test [
9,
10].
Time series analysis requires both exploratory data analysis and hypothesis testing. Exploratory data analysis consists of understanding the data’s basic characteristics (e.g., mean, variance, and skewness) and completing transformations to understand whether a parametric or non-parametric method should be selected. In statistical analysis, the characteristics of the data determine which method is best suited. Parametric methods can only be used if the data or data transformations follow a normal distribution and meet normality assumptions; otherwise, the method is invalid, and its use would result in errors. Water quality data is typically positively skewed, with unequal variance, and is unlikely to follow a normal distribution (even with transformations). Quantile-quantile plots are generally used to check for normality [
11]. In addition, non-point source water quality is highly correlated with time and influenced by various climatic, mixed-land-use, hydrologic, and human factors [
12]. Usually, such data does not follow a normal distribution and is inherently correlated with time. Accordingly, non-parametric methods are used; however, such methods have their own limitations, being more applicable to assessing monotonous shifts in data over time, returning a yes or no answer and not offering much resolution [
13].
Wavelet analysis has emerged as a popular method for interpreting real-time data parameters, offering a comprehensive yet straightforward snapshot of their behavior. In this approach, data is viewed as a non-stationary signal across both time and scale [
4,
5,
6,
14,
15]. For instance, the fast continuous wavelet transformation (FCWT) offers an improved balance between speed and accuracy, enabling real-time, wide-band, high-quality, time–frequency analysis of non-stationary noisy signals [
16]. This technique facilitates a multiresolution decomposition of a time series into various scales through a wavelet transform and wavelet filters [
17]. In general, wavelet analysis is a method that changes the representation of a signal to another form in order to highlight some of its characteristics [
17,
18]. There are two main categories of wavelet analysis: continuous and discrete. Continuous wavelets transform plots into the power of a feature in the time series as a function of time, relative to the power of the original time series, whereas discrete wavelet analysis decomposes a time series into approximations and details [
17,
19,
20]. Wavelet analysis has been used to study electrical signals and climatic and geophysical datasets [
19,
21]. Emerging studies have illustrated the application of wavelet analysis in examining and assessing daily and hourly water quality and stream flow time series [
2,
4,
14,
22]. The analysis is localized in both space and time and hence offers an advantage over Fourier transform, which assumes a signal that is stationary and invariant of time [
17,
20,
23].
Making the interpretation of real-time data easier to understand, without substantial loss of resolution, wavelet analysis has been applied to hydrological variables and water quality time series, with the goal of detecting temporal patterns [
1,
24]. Using MATLAB, and filling data gaps via linear cubic interpolation, Rajwa-Kuligiewicz et al. [
2] performed wavelet analysis on a three-year hydrologic and water quality time series by implementing continuous wavelet transform, wavelet coherence, and cross-spectrum. This afforded them insight into the variability of dissolved oxygen (DO) in relation to water temperature (
), and water level of the Narew River in Poland. Their study identified time series characteristics on various temporal scales ranging from sub-daily to annual. Cross wavelets and wavelet coherences of dissolved oxygen, water temperature, and water level were computed to help understand the types of factors having an impact on dissolved oxygen. Moreover, they describe the significance and relative length of these impacts over time [
2]. Several similar studies have been conducted on wavelet theory [
3,
4,
19,
25,
26,
27].
In addition to the background literature review, guidance on employing statistical methods in the analysis of water quality monitoring data exhibiting non-normal distributions in specific applications within surface water resources was also examined. The United States Geological Survey (USGS) publication on statistical methods in water resources (Helsel and Hirsch, [
11]), as well as the time series modeling of water resources and environmental systems (Hipel and McLeod, [
28]) and statistical tools for analyzing water quality data (Fu and Wang, [
29]) were incorporated in the assessment.
With the advancement in monitoring technology, conservation authorities and regulatory agencies can measure surface water quality in real time at various stream locations within a given urbanizing mixed-land-use watershed. The Credit Valley Conservation (CVC) Authority began the implementation of a long-term real-time water quality monitoring program in the winter of 2010. Real-time data is plotted over time, and alerts are automatically issued if water quality readings exceed permissible ranges. This allows water resource managers to investigate the issue in real time and, if necessary, inform the Ontario Ministry of the Environment, Conservation, and Parks (MECP). This process ensures that spills and abnormal discharges are detected in real time and helps ensure public confidence in the quality of the surface water (CVC, 2017, and reported in Ontario Nature 2023 media release) [
30,
31]. There are currently 11 active stations at various locations throughout the Credit River watershed. The high-resolution nature of real-time water quality datasets offers valuable insights into the temporal variations of the measured parameters and their intercorrelations. However, a key challenge lies in simplifying the data without losing critical information while still extracting meaningful patterns. This study initially tests the hypothesis that real-time water quality and streamflow data do not conform well to normal or lognormal statistical distributions. Consequently, the primary objective is to assess and model the temporal variations and correlations of real-time water quality parameters and streamflow across multiple temporal scales (ranging from hours to one year) over the monitoring period. This is achieved using an innovative approach known as continuous wavelet transformation, which enables the identification of dominant temporal patterns and relationships within the dataset.
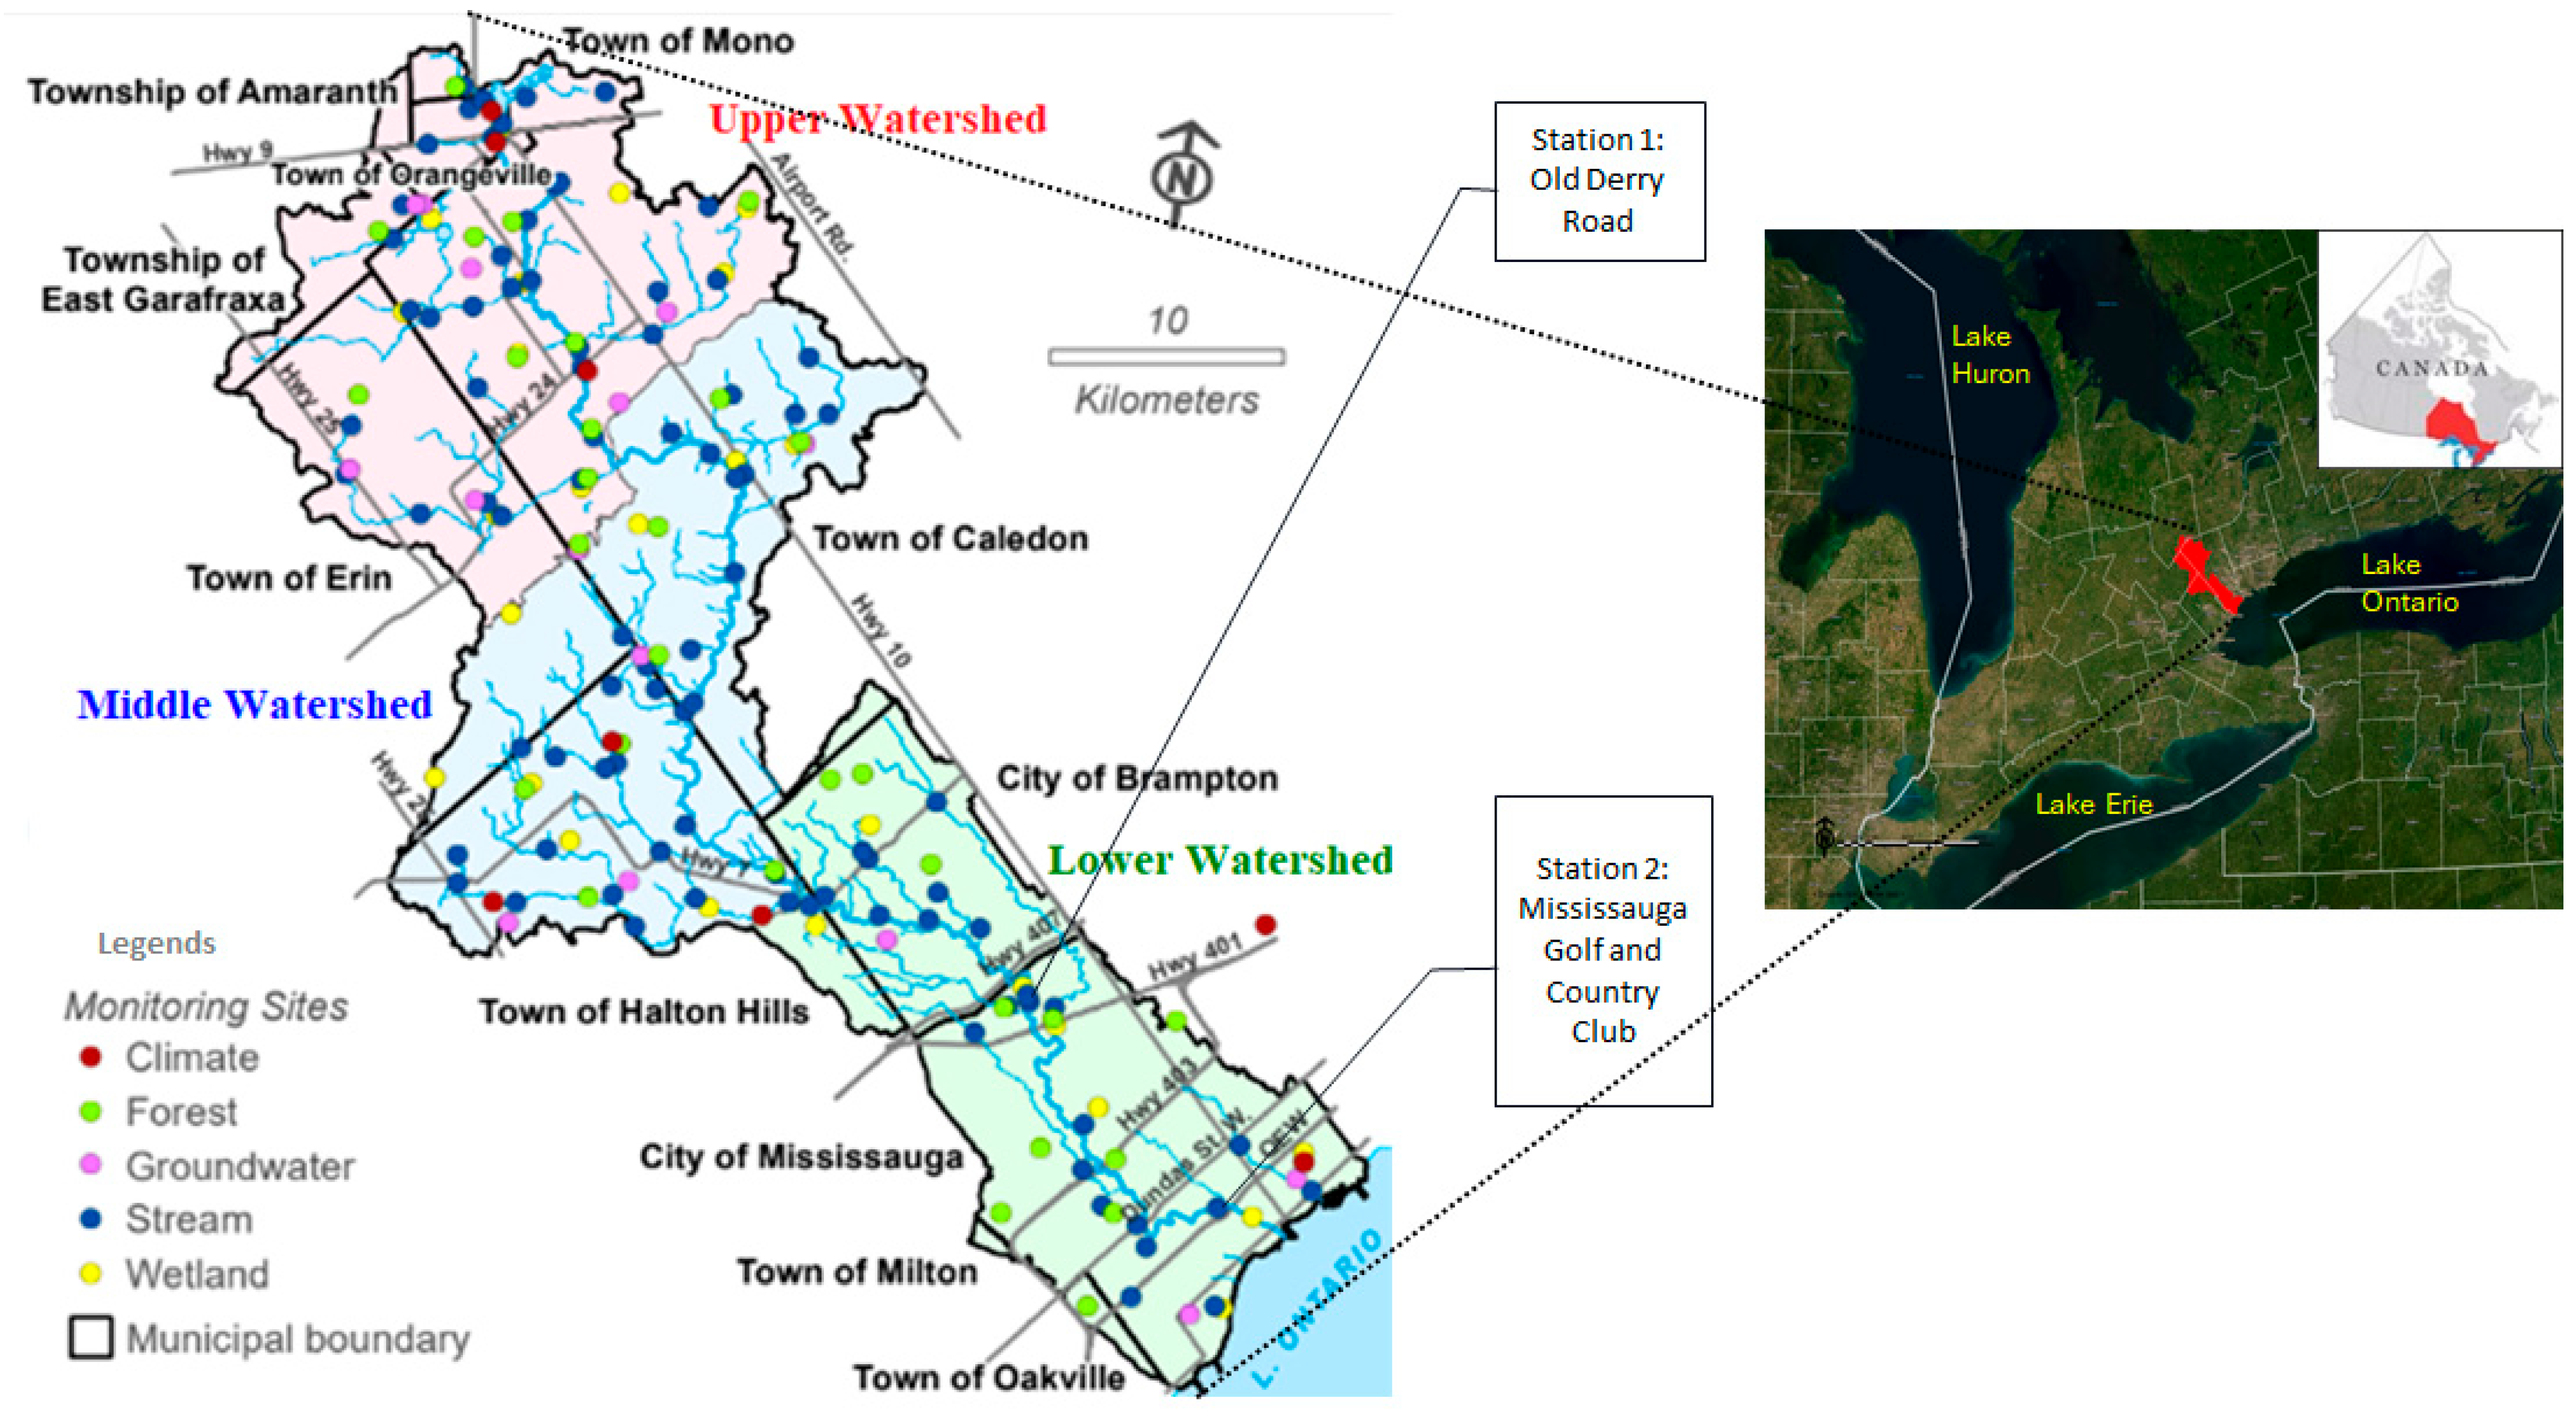
2. Study Area and Datasets
This section provides a brief overview of the study area and the real-time datasets. The study area is located in the Credit River watershed, which is approximately 1000 km
2 in size [
30] and drains into Lake Ontario, one of the five Great Lakes of North America. The Credit River watershed is governed by the Credit Valley Conservation (CVC) Authority. The watershed is divided into the Upper, Middle, and Lower watersheds, as shown in
Figure 1.
The Lower watershed is mainly urbanized, while the Upper and Middle watersheds are rural; hence, it is representative of most watersheds across Southern Ontario that drain to Lake Ontario. The watershed is predominantly shaped by agriculture (31,158 ha) and urban development (31,151 ha), which together dominate about 66% of the area. Forests and wetlands (5896 ha), though significant, make up only 23% of the watershed and have been increasingly fragmented by the expansion of agricultural and urban lands. Another notable feature is the presence of meadows, spanning 9917 hectares, or roughly 10% of the watershed. These meadows represent areas of natural regeneration, often recovering from past human activities like abandoned farm fields. This mixed land use highlights the ongoing tension between human development and natural ecosystems in the watershed [
32]. However, the Credit Valley River watershed’s protected lands officially contribute to Canada’s goal of protecting 30% of our lands and waters by 2030 as part of the Global Biodiversity Framework. This encompasses an area greater than the Toronto Islands combined [
31].
Real-time water quality plays an integral part in the health of the watershed and safeguards our natural resources and these protected areas. With good to fair surface water quality, the Upper and Middle portions of the watershed are predominantly rural and include large portions of the towns of Orangeville, Erin, Halton Hills, and Caledon, as described in CVC’s 2017 report [
30,
32]. In contrast, tributaries in the Lower watershed have poor to very poor surface water quality, attributable to the region being mainly urbanized. It includes a small portion of the town of Halton Hills, and most of the cities of Brampton, Oakville, and Mississauga [
30,
33]. Surface water quality is graded on phosphorus levels, coliforms, and benthic macroinvertebrates. The Credit River watershed also features an Integrated Watershed Monitoring Program (IWMP), which includes monitoring terrestrial and aquatic systems. It consists of 47 real-time monitoring stations for precipitation, streamflow, and water quality.
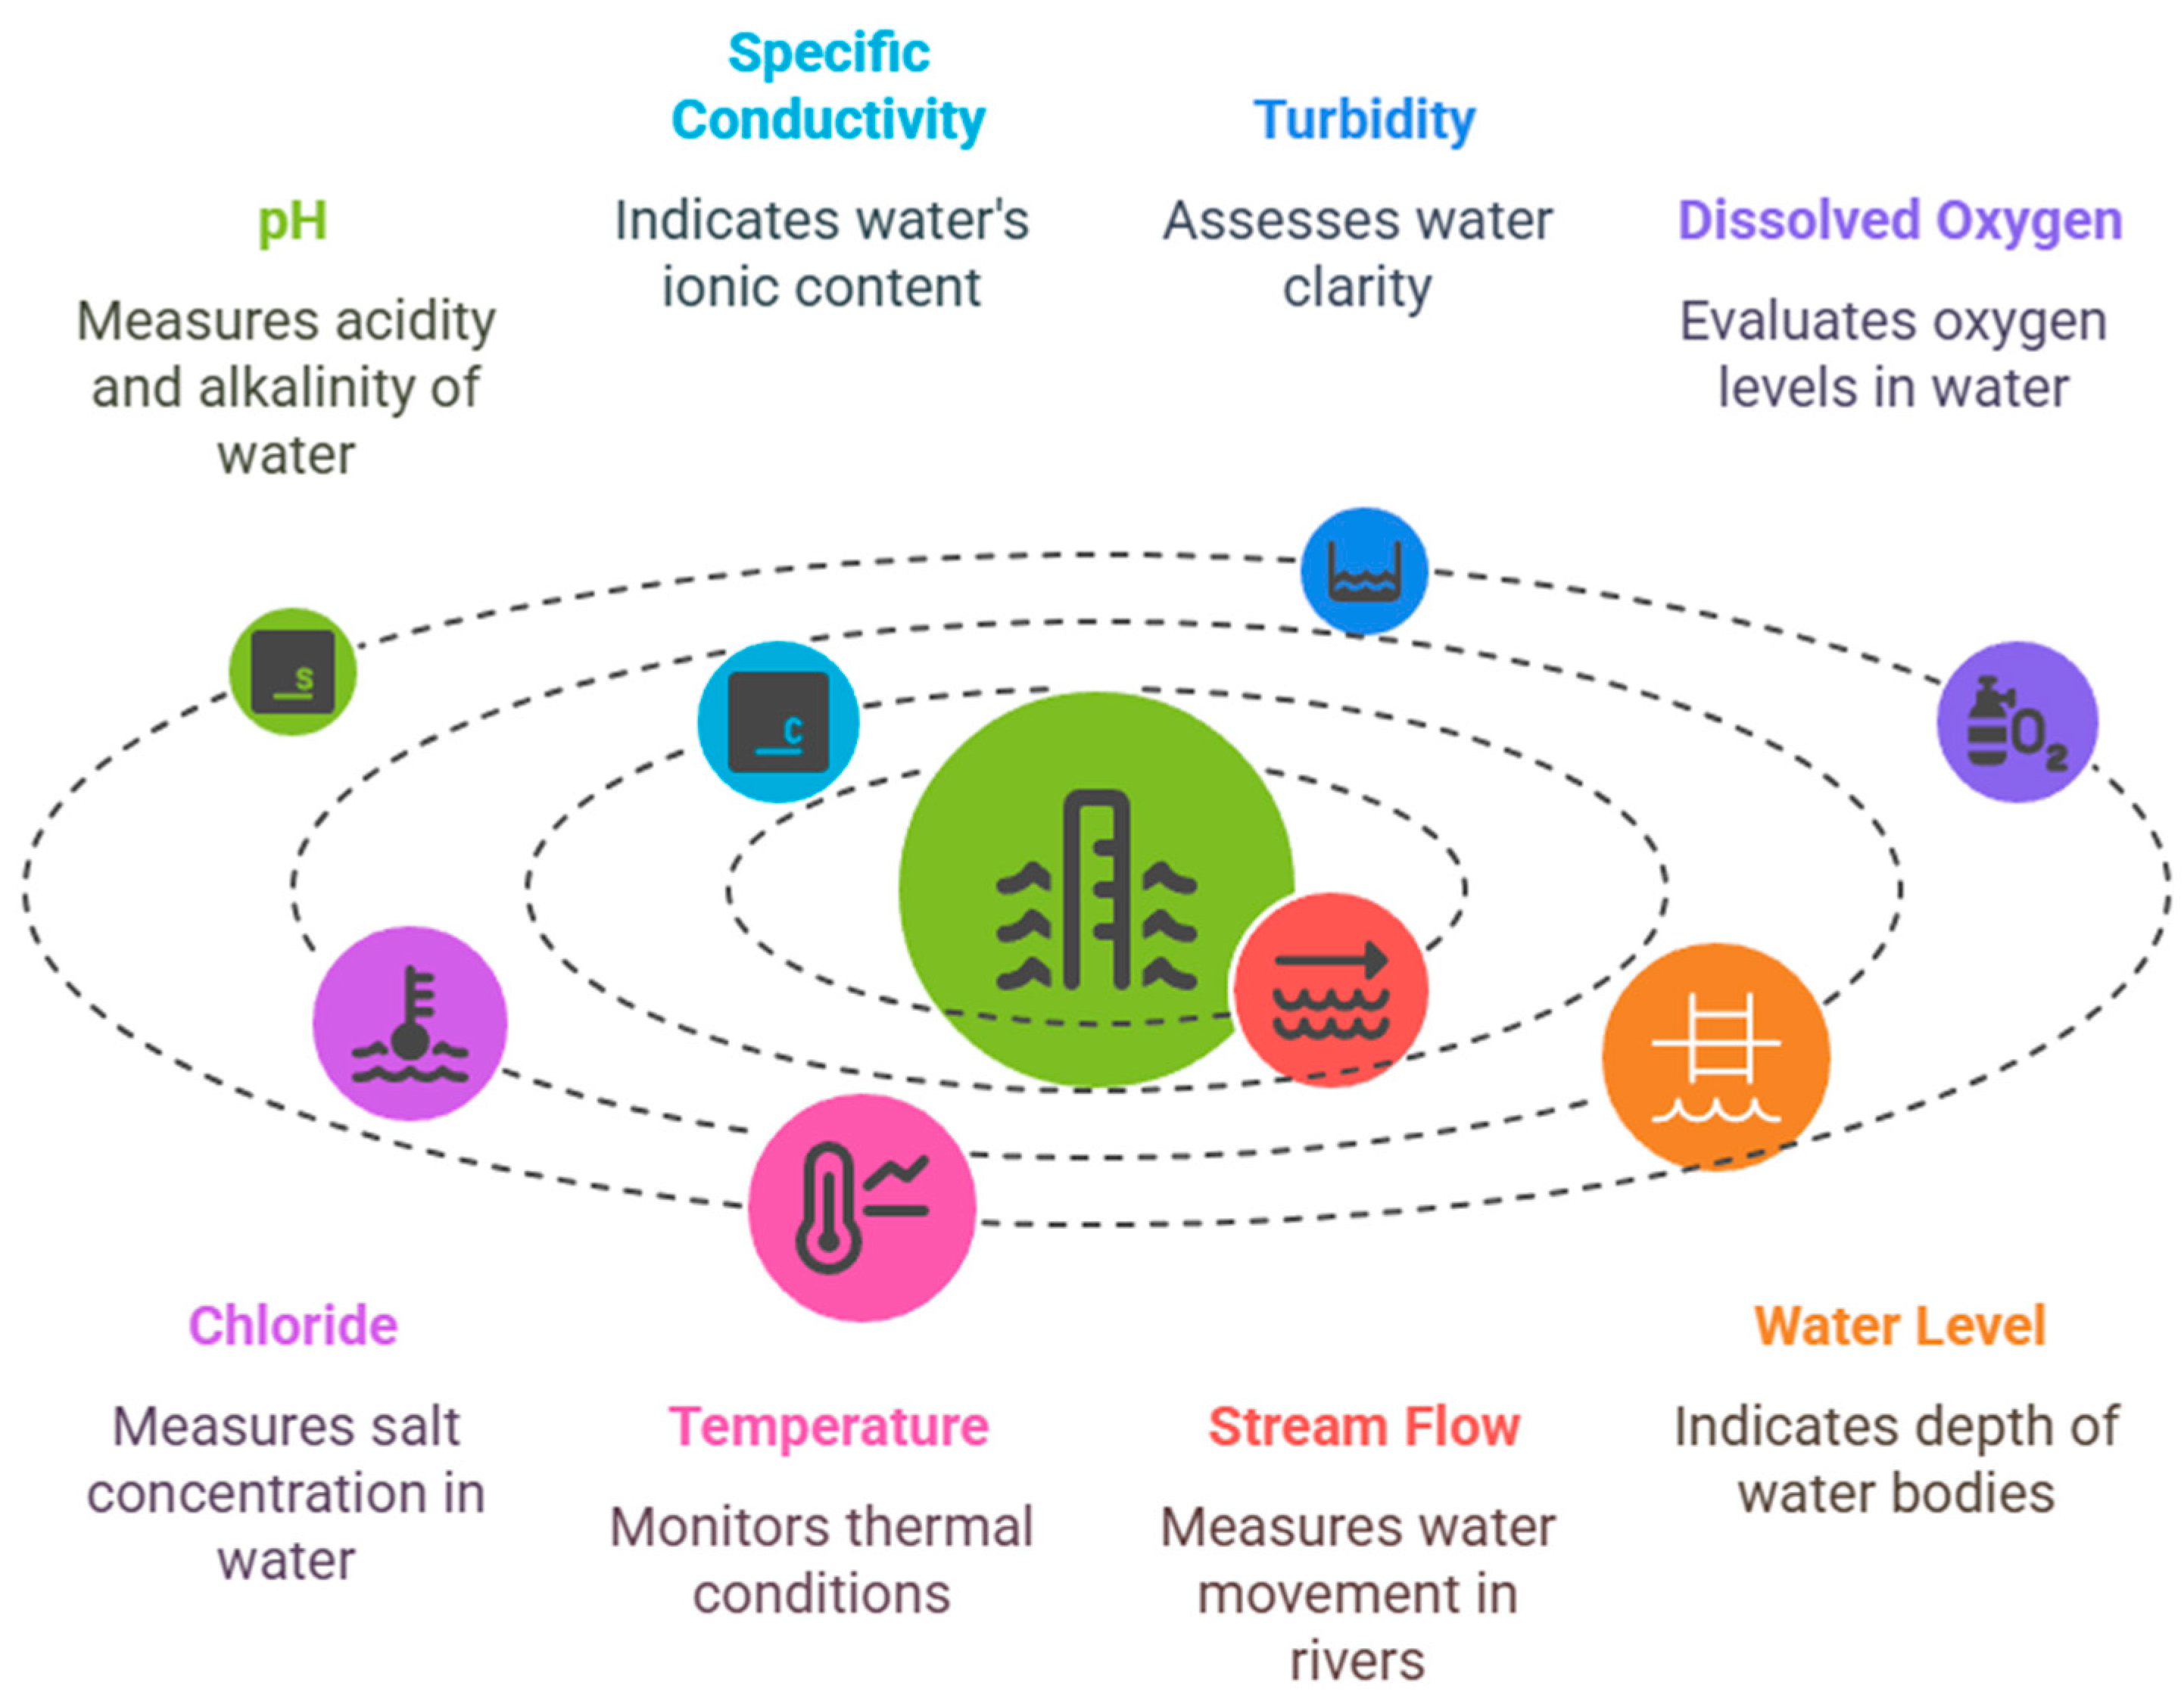
Water quality parameters, including turbidity, specific conductivity, pH, total dissolved solids, water temperature, dissolved oxygen, and chloride, were measured using the multi-parameter probe Hydrolab DX5 (Manufacturer is OTT HydroMet, Loveland, CO, USA), represented in
Table 1. Hydrolab DX5 is a field-deployable water quality sonde equipped with multiple sensors that allow simultaneous and continuous measurement of key physical and chemical parameters. Turbidity reflects water clarity and suspended particles, specific conductivity indicates the ionic content of water, pH measures the degree of acidity or alkalinity, total dissolved solids (TDS) represent the concentration of dissolved substances, water temperature influences chemical reactions and biological activity, dissolved oxygen (DO) is critical for aquatic life, and chloride is a common indicator of urban and road-salt influences on water quality. All the data were obtained from the Credit Valley Conservation Authority (CVC), Ontario, Canada (
https://cvc.ca/), accessed on 6 April 2017.
The scope of this study included the assessment of 15 min interval real-time surface water quality, stream flow, and air temperature data at two CVC stations over the length of the monitoring period (
Table 1). These stations were located at the upstream (Old Derry Rd.) and downstream (Mississauga Golf and Country Club) ends of the Credit River Watershed (
Table 2). Also,
Figure 2 illustrates the description of real-time parameters used for statistical and wavelet analysis.
Pre-Processed Data for Wavelet Analysis
Prior to using MathWorks MATLAB R2017a to run wavelet analysis, data were pre-processed, converting all real-time data received to equal time steps of 15 min. Much of the sensor data was in unequal time steps, as time steps with no values were not always inserted in the data; moreover, some data time steps were simply missing random entries throughout the datasets. Also, on occasion, the seconds and minutes in the data changed, so that two datasets with the same time length would have different times allocated within them. In Excel, all time series in the data were manually reconstructed to equal and identical time steps. Furthermore, due to technical difficulties in running the analysis with such a large dataset (e.g., software would freeze), the data was aggregated to a one-hour interval.
In addition to filter out missing data gaps that spanned several weeks to several months, the following time period data was selected for the seven water quality variables at all stations: (a) Dated 19 April 2012; 3:00 p.m. to 4 November 2016; 7:00 p.m. (referred to as the Spring 2012 to Fall 2016 dataset from hereon). Likewise, the following time periods were selected for the flow and water level data: (b) Dated 28 March 2014; 3:00 p.m. to 31 December 2014; 11:00 p.m. (referred to as the Spring 2014 to Fall 2014 dataset from hereon), and (c) Dated 28 March 2015; 3:00 p.m. to 31 December 2015; 11:00 p.m. (referred to as the Spring 2015 to Fall 2015 dataset from hereon). However, some missing values in the above datasets were still present and were approximated using the moving average method in statistical software R (3.3 version), followed by cubic interpolation to complete the time series (Rajwa-Kuligiewicz et al., 2016 [
2]). Thus, this approach helps in maintaining data continuity; the interpolation technique may introduce distortions in the power spectra. In particular, the spectral slope obtained through this method may exhibit a bias toward lower values.
5. Discussion
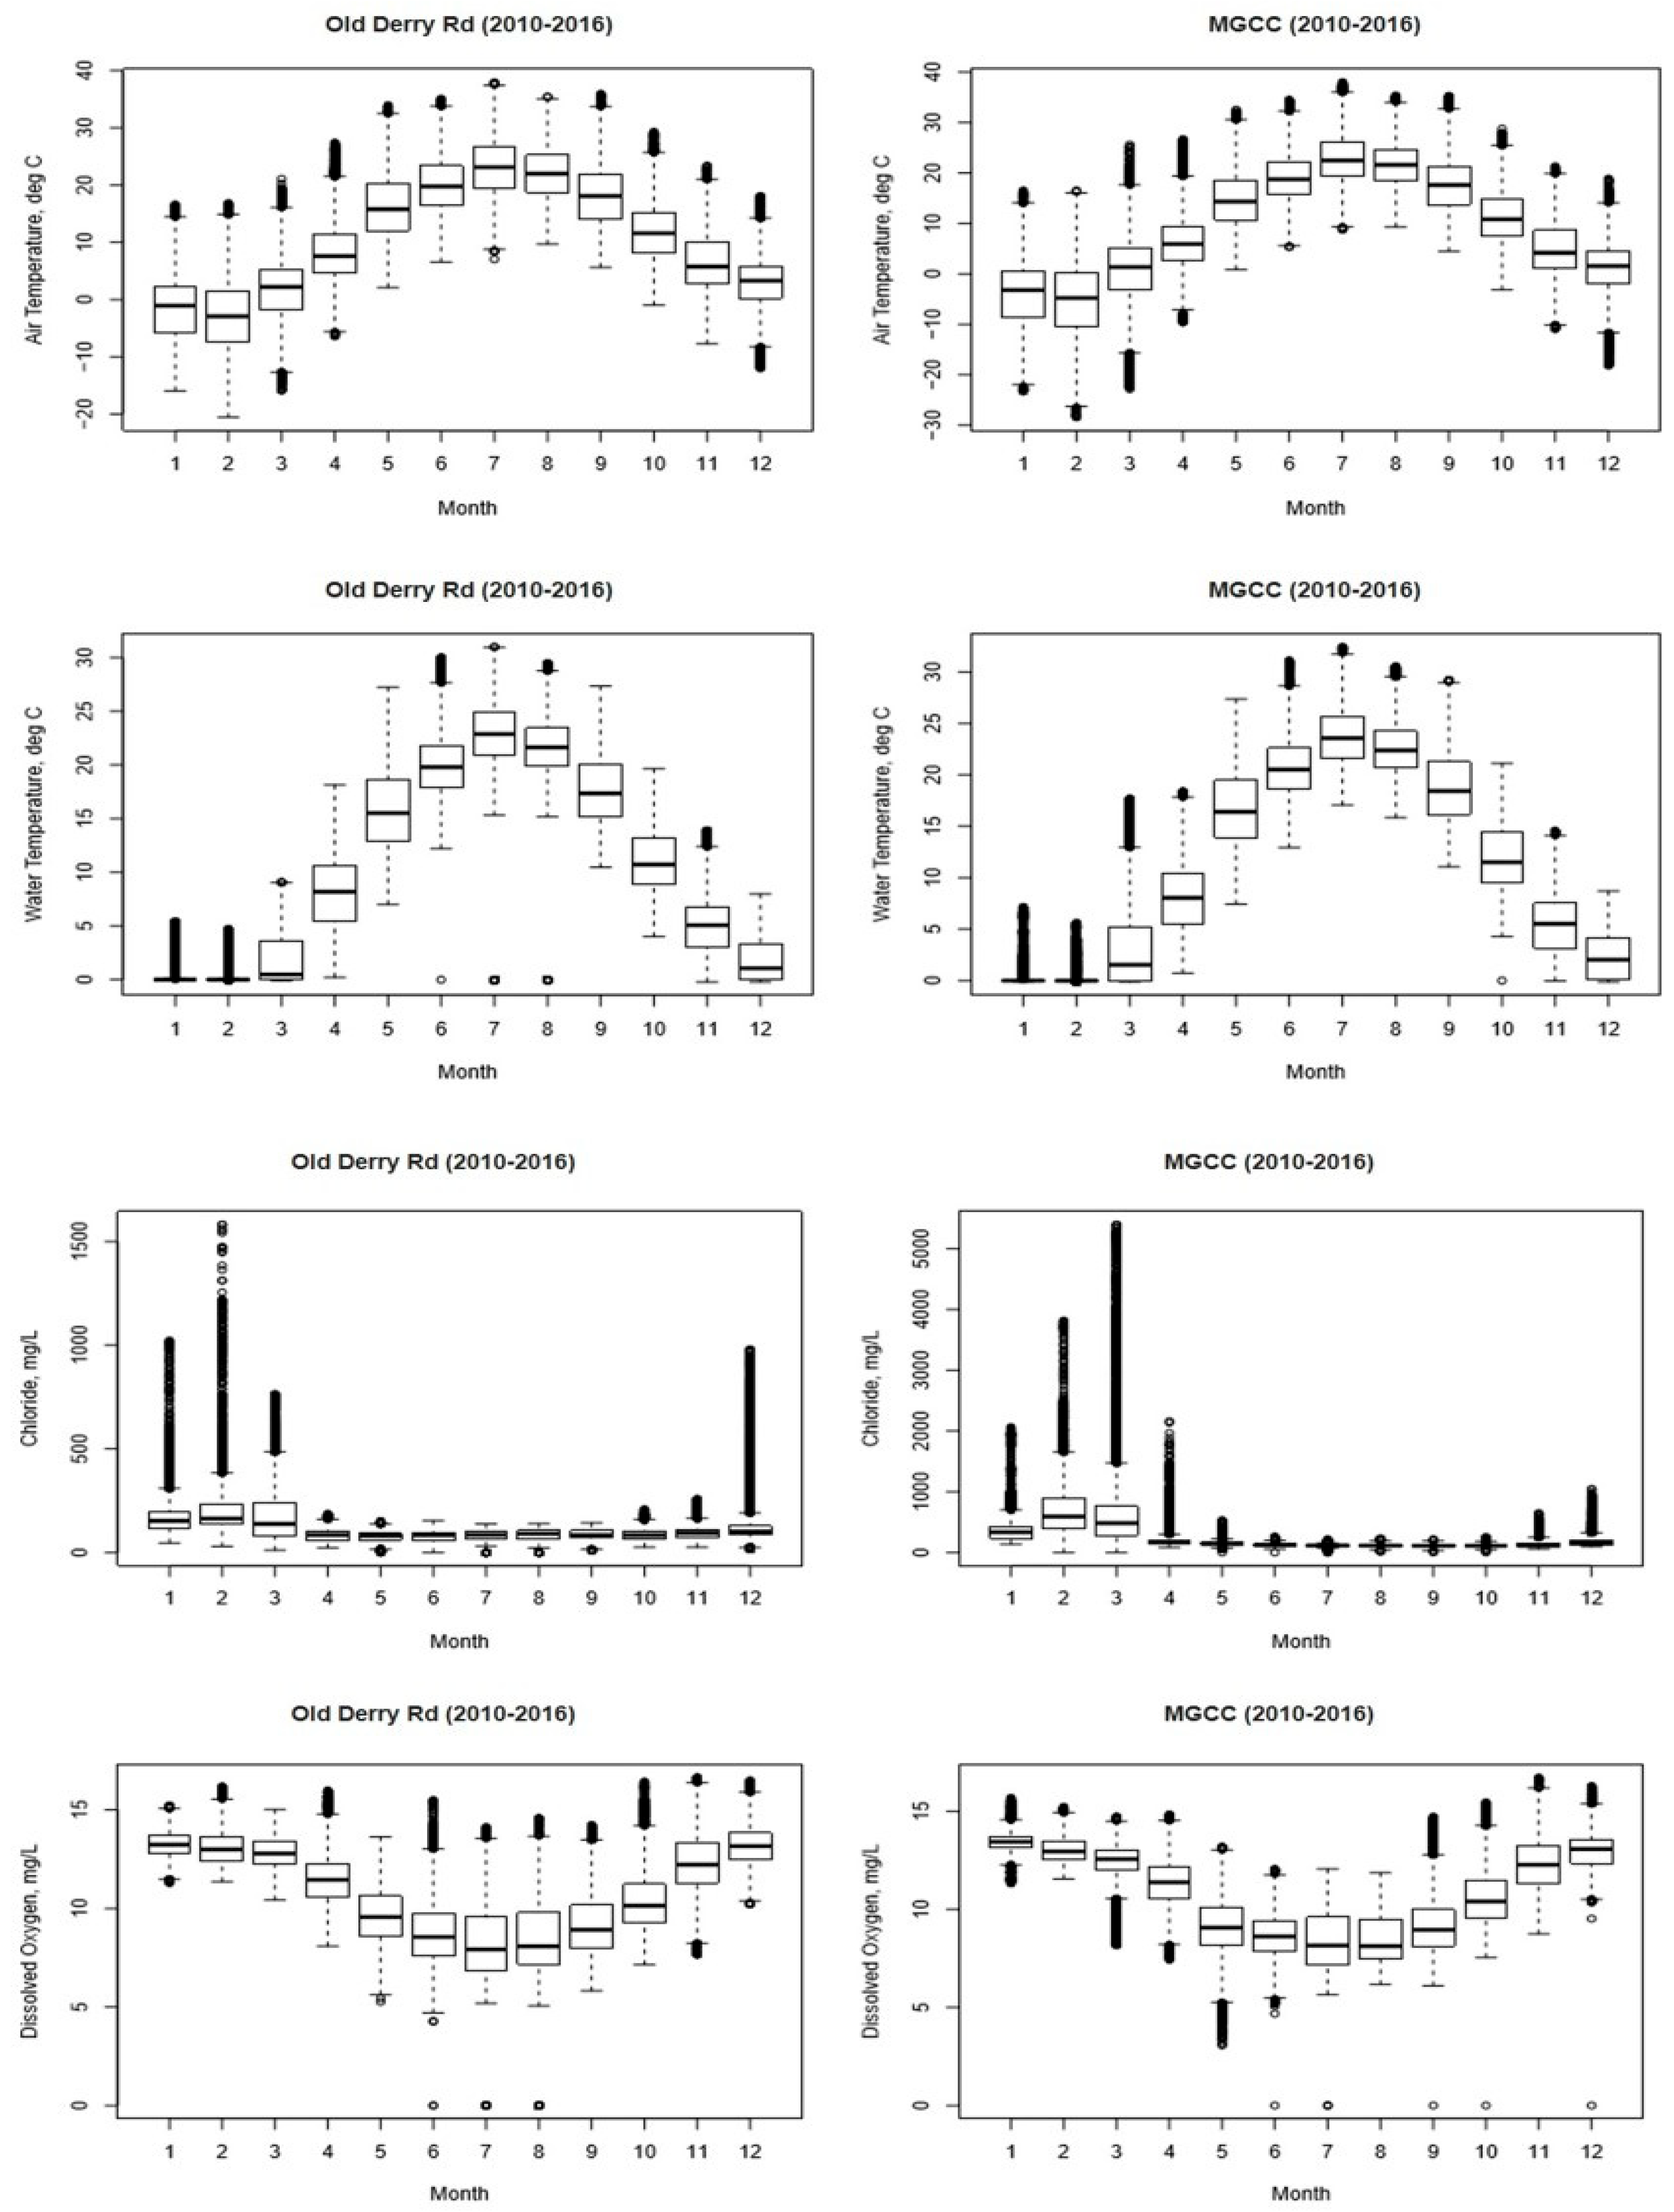
The Old Derry Road and Mississauga Golf Country Club stations generally exhibited similar statistical trends.
Figure 3 depicts notable monthly fluctuations in
,
, and DO means. While the spread of air temperature remains relatively consistent across months, water temperature shows greater variance during the spring and fall compared to July and August. Dissolved oxygen (DO) levels seem to decrease with rising water temperatures, possibly due to heightened oxygen consumption by biological activities. Notably, DO exhibited more variability during the summer months. Winter months often featured outliers in
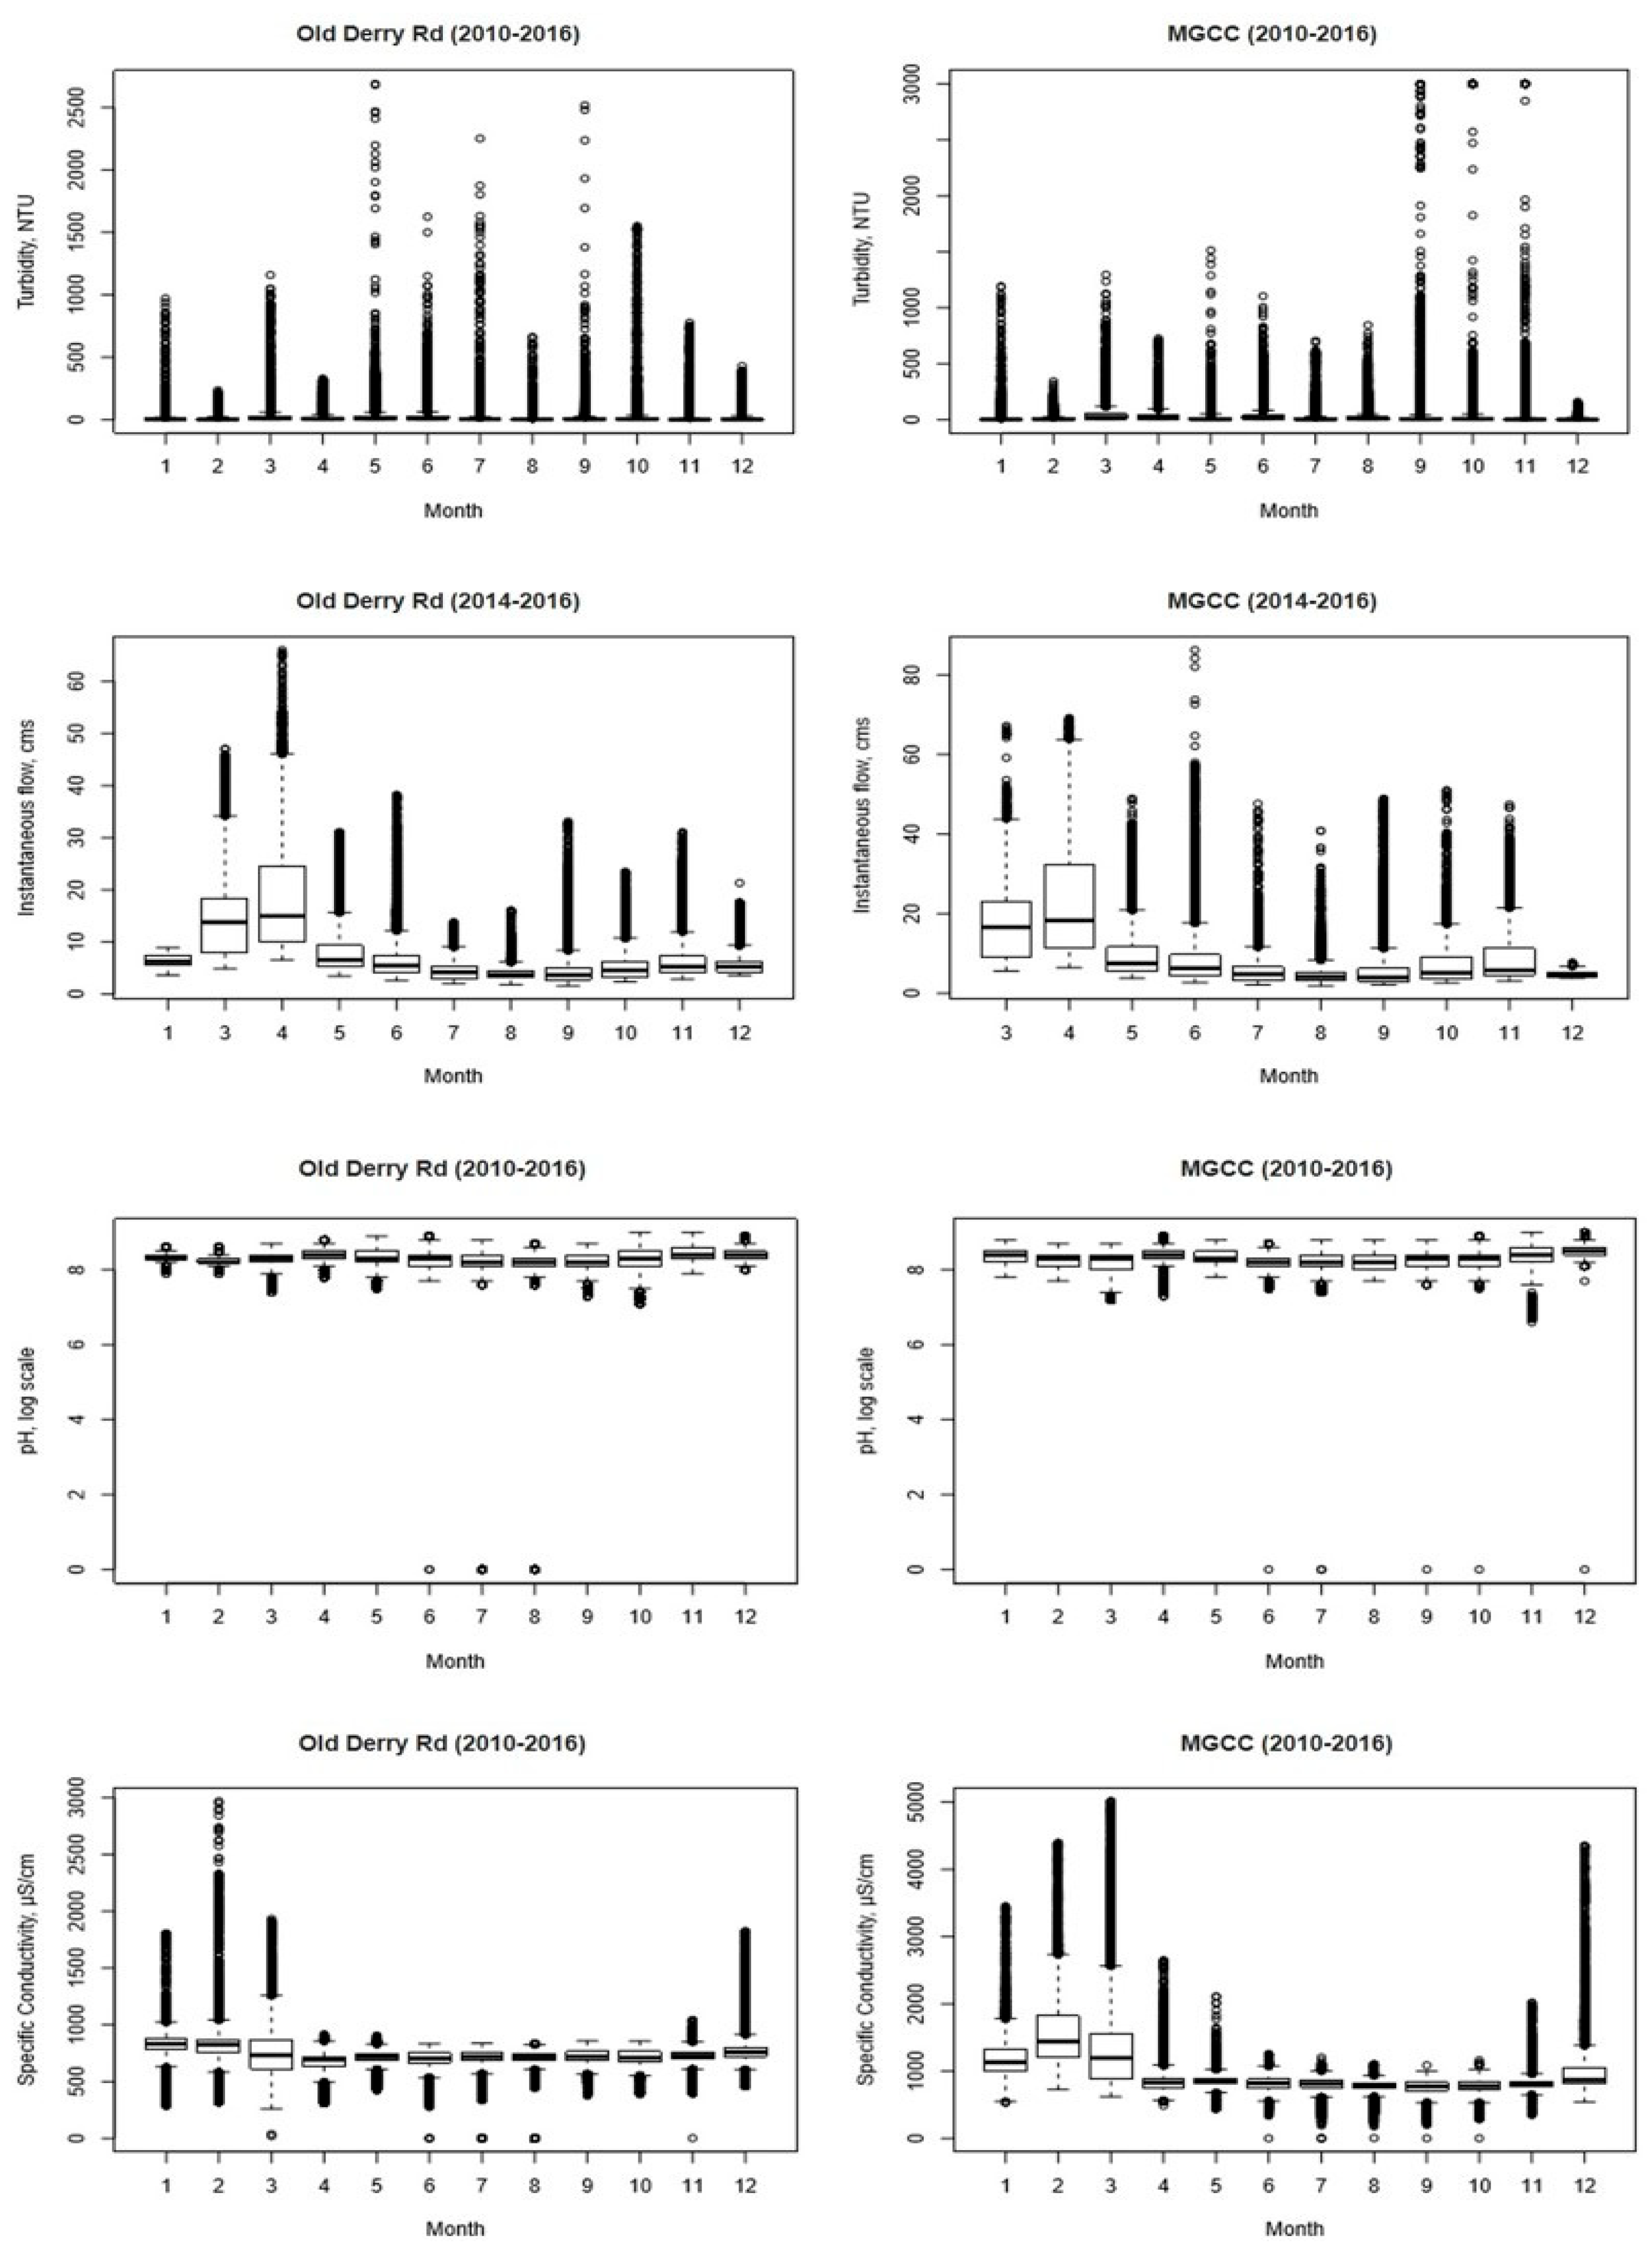
, likely attributable to road salt application. Turbidity and flow exhibited numerous outliers (
Figure 4). Flow peaked in March and April, likely due to snowmelt, with lower flows observed in summer. Mean pH remained stable at around 8.0, across all months. Specific conductivity (
) was higher in winter months. Both MGCC and Old Derry Rd show similar patterns in means, spreads, and outliers (
Figure 3 and
Figure 4). Quantile–quantile plots (
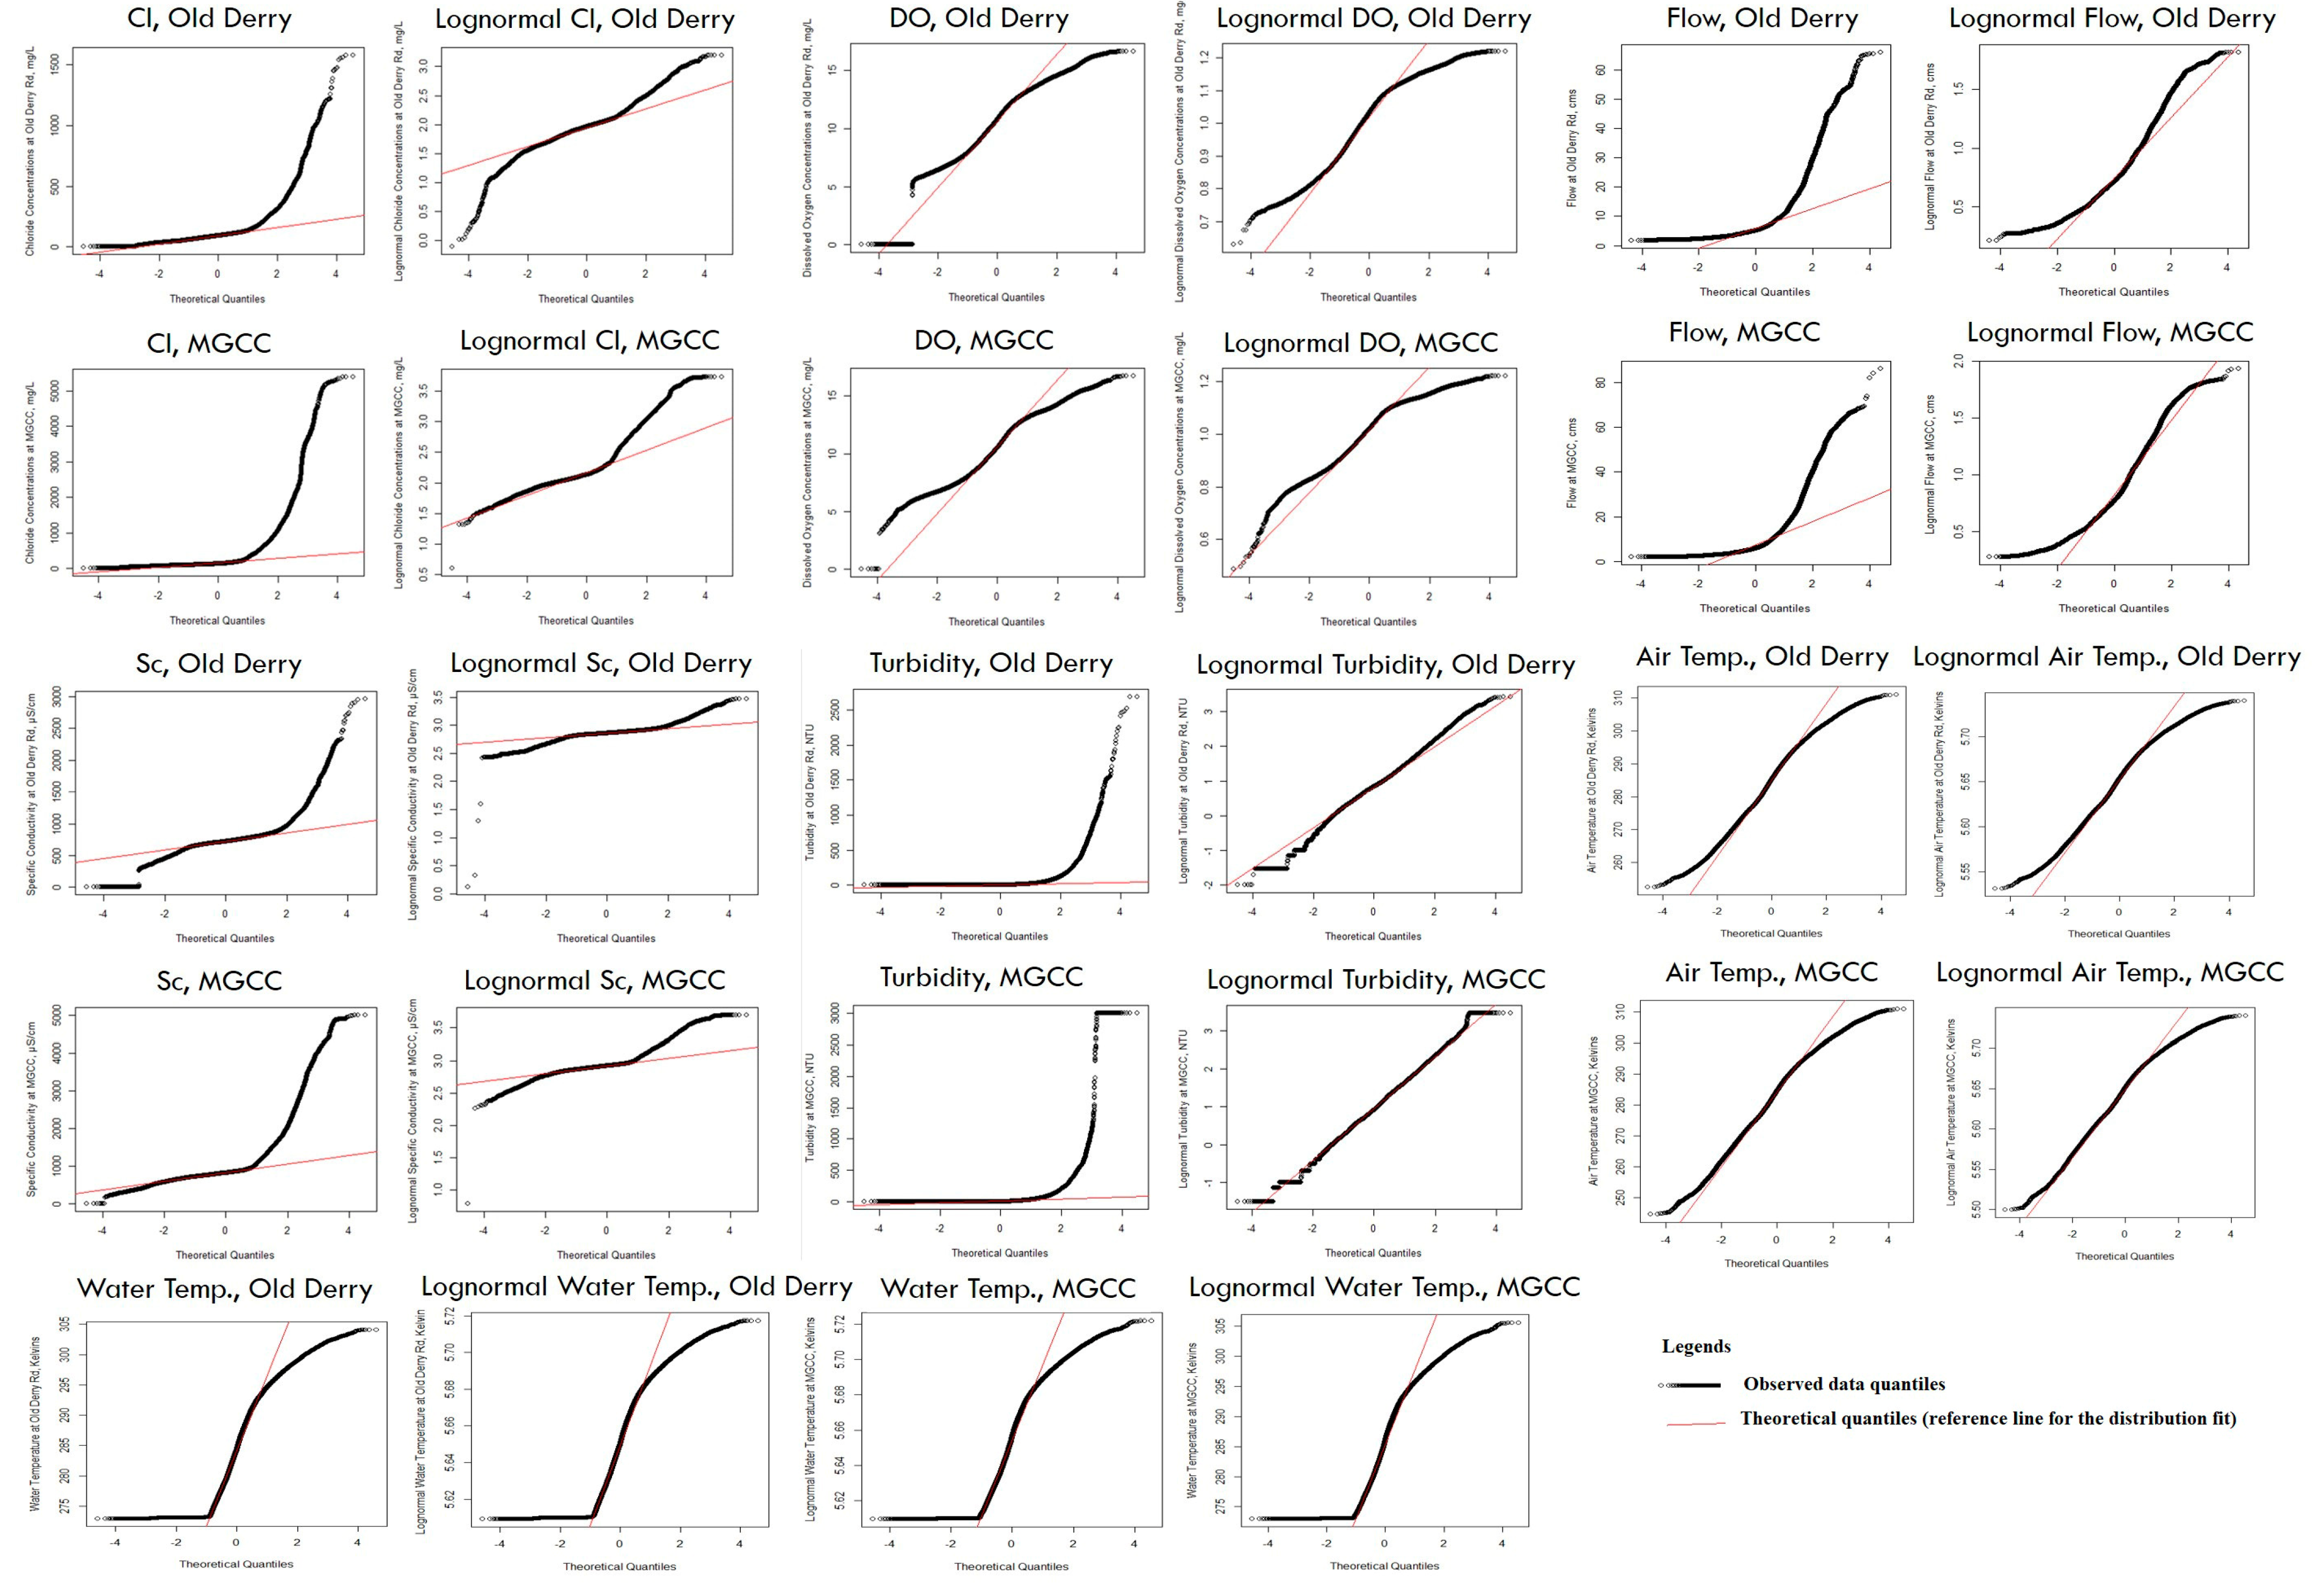
Figure 5) reveal right-skewed or heavy-tailed distributions, with turbidity closely fitting a lognormal distribution. Both flow and
also approximate a lognormal distribution but show heavy tails. However,
,
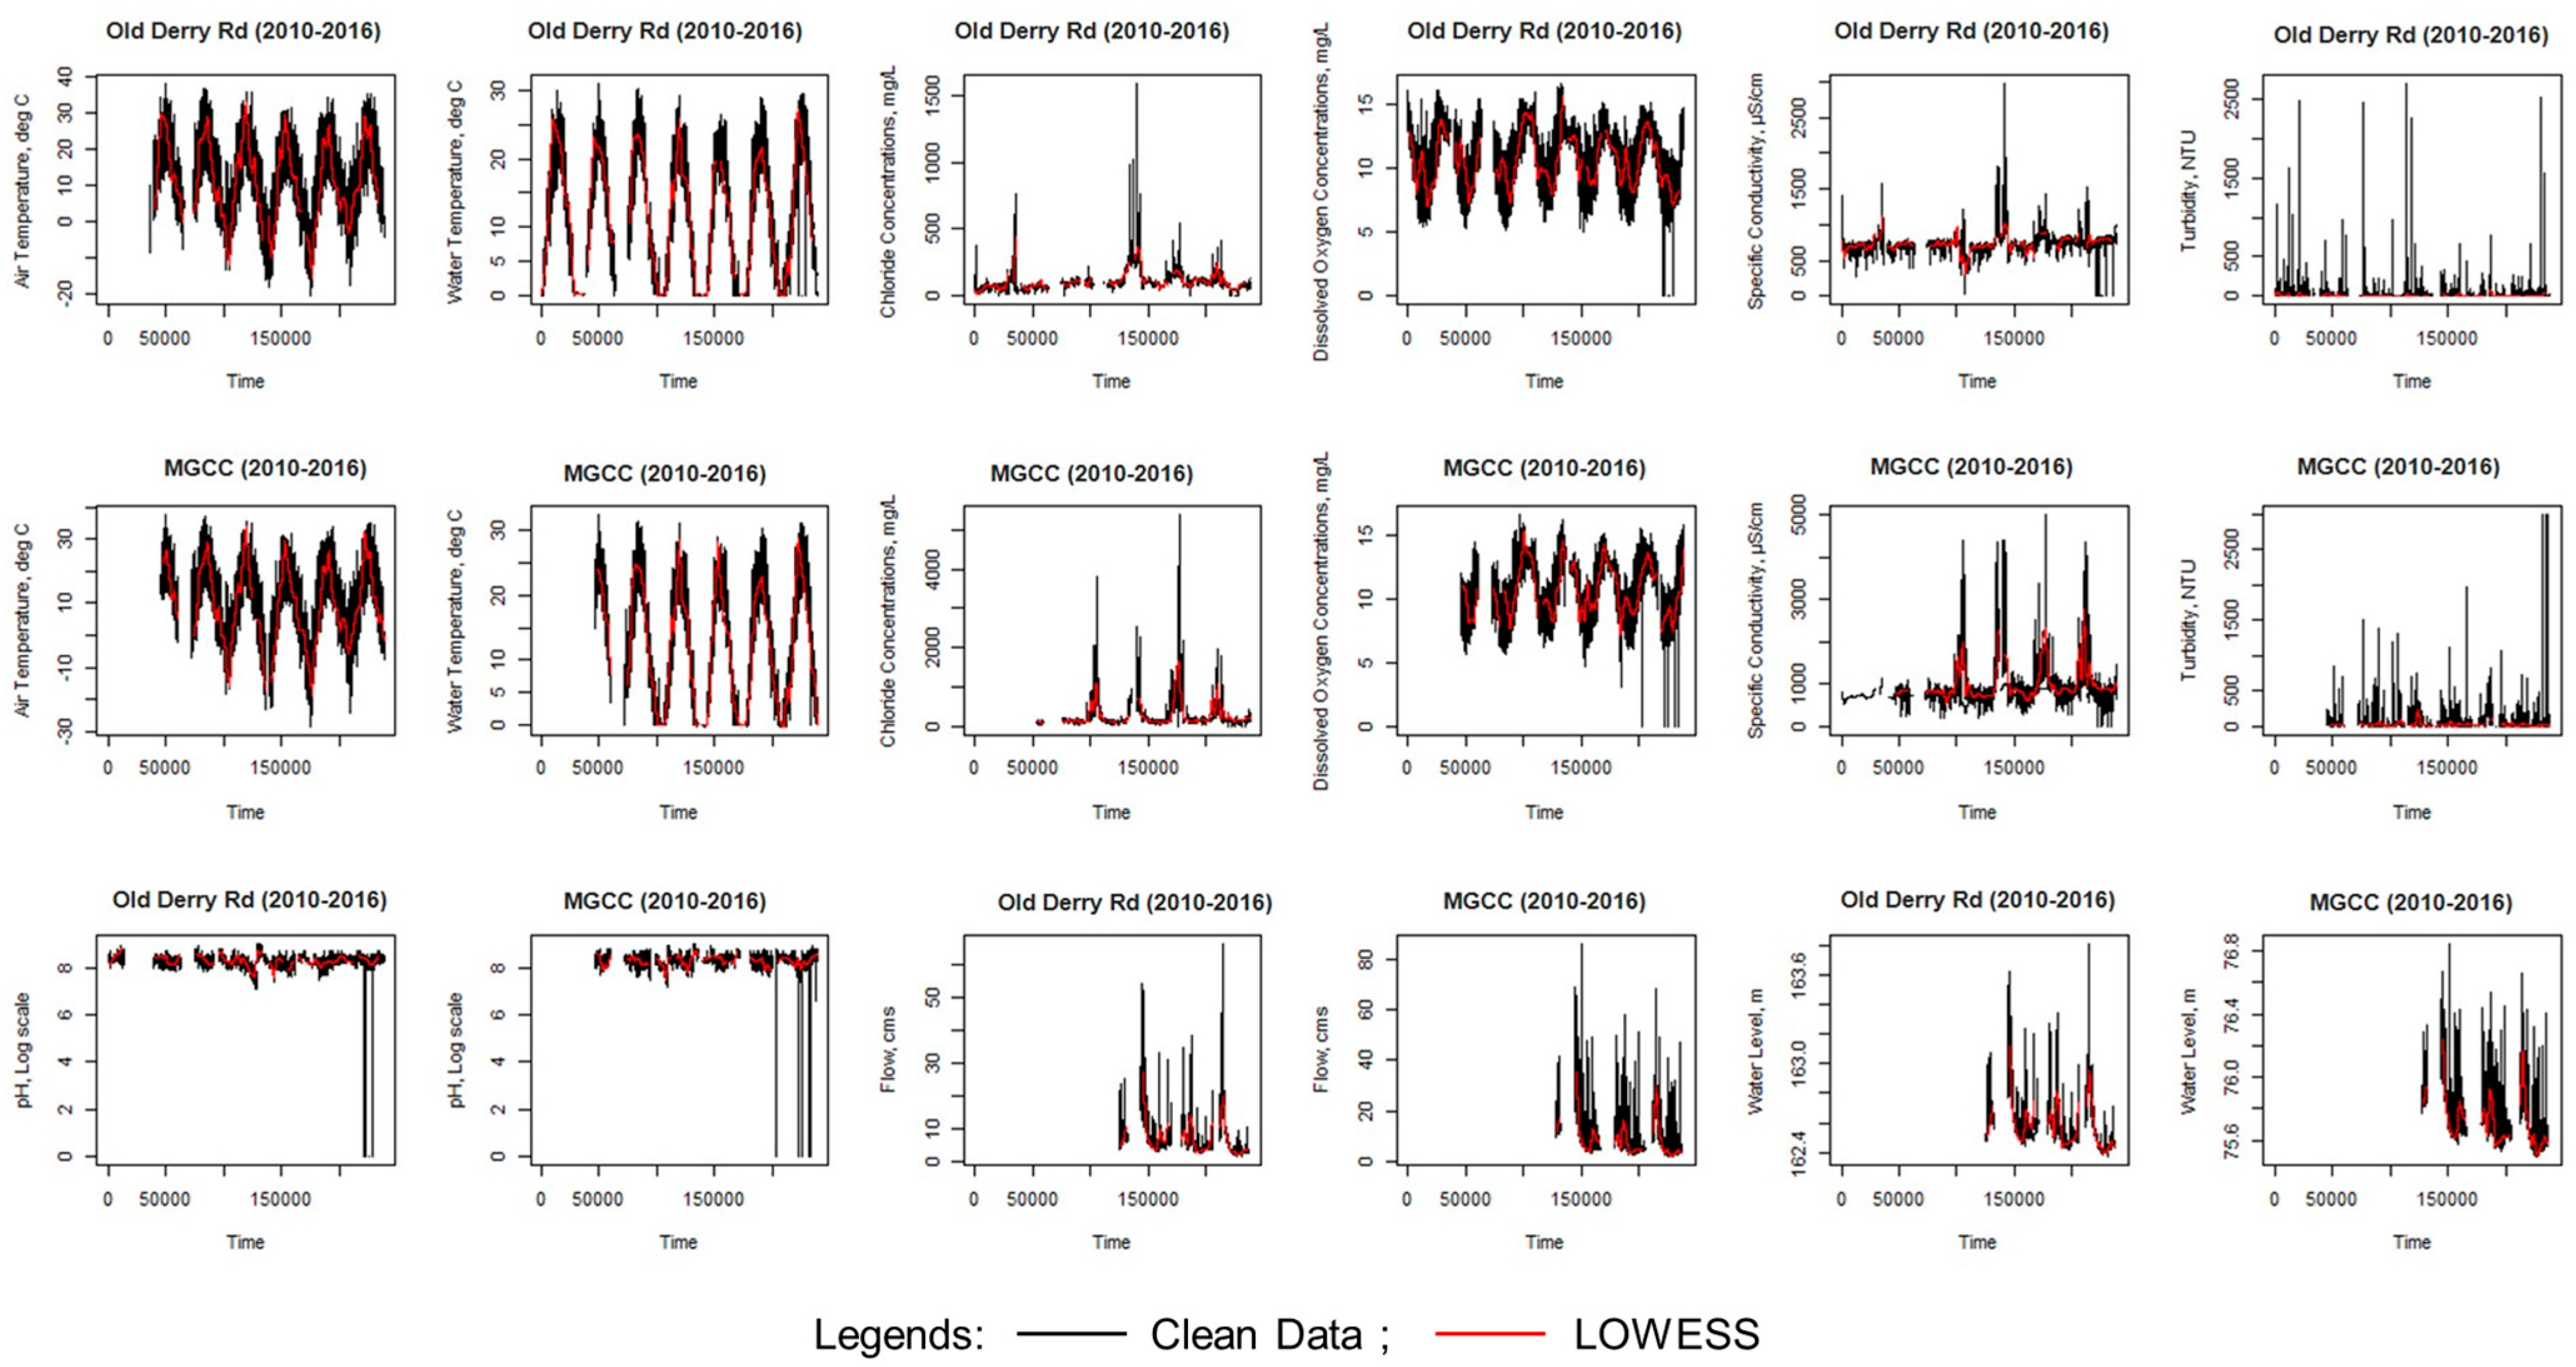
, and DO do not fit this model well. Data lacunae are evident in
Figure 6, particularly with regard to seasonal variations in DO linked to
and
. Peaks are frequent in turbidity,
,
, and flow.
Table 4 highlights significant negative correlations between DO and
or
, with the correlation stronger for
. Specific conductivity shows a strong positive correlation with
, and
also exhibits positive correlations with
, with a weaker correlation to flow, particularly during snowmelt. Turbidity correlates positively with flow, and DO correlates positively with pH. These statistics offer a basic overview of the datasets, while the subsequent wavelet analysis delves deeper into temporal variations and intercorrelations in the data.
The continuous wavelet transform offers a significant advantage over discrete wavelet analysis, as it allows computations to be made for each temporal scale, enabling identification of dominant temporal patterns.
Figure 9,
Figure 11 and
Figure 13, representing
, DO, and pH (similarly
Figure S4, in Supplementary Materials, represents
, respectively, display similar characteristics and will be discussed together. Conversely,
Figure 10 and
Figure 12, representing
and turbidity (similarly,
Figures S3 and S5 in Supplementary Materials correspond to specific conductivity and stream flow/water level) respectively, exhibit similar traits and were also analyzed together. In
Figure 9 and
Figure 11,
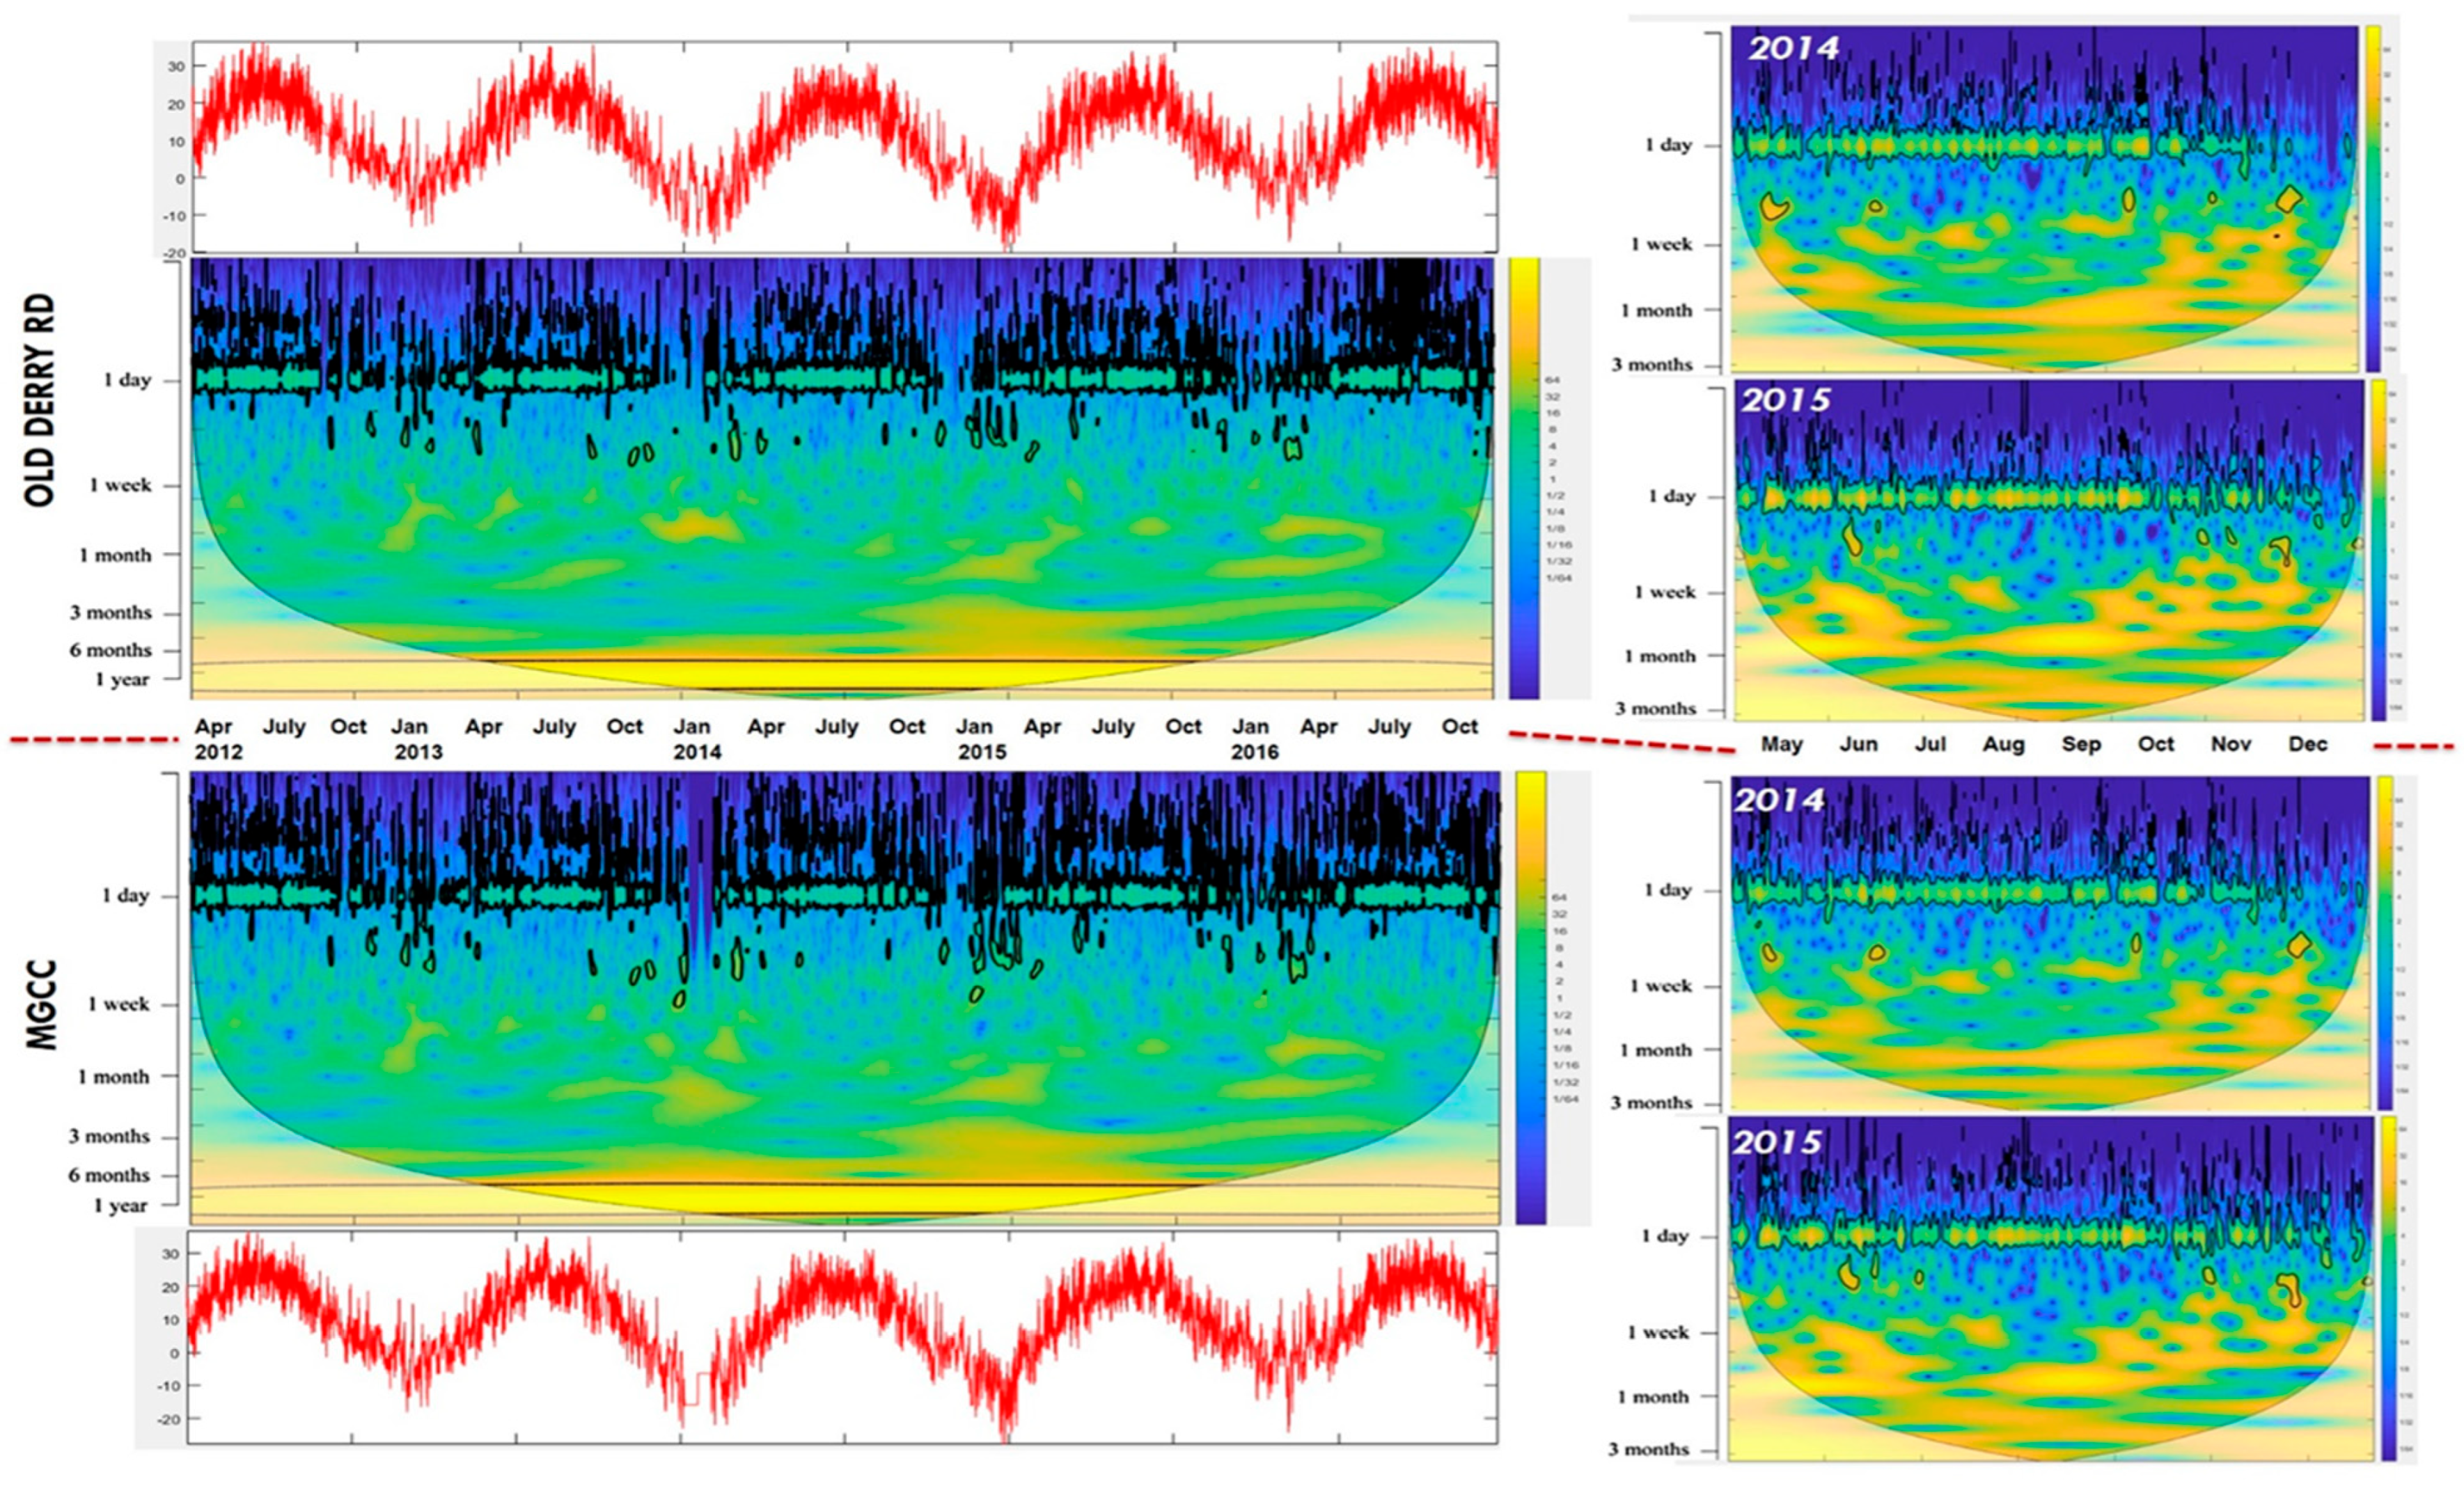
Figures S2 and S4 (in Supplementary Materials), there is notable power at the “1 day” temporal scale with 95% confidence against red noise. The green color in the Spring 2012 to Fall 2016 plots and the yellow-green color in the Spring 2014/2015 to Fall 2014/2015 plots indicate this moderate power. Interestingly, shorter time periods allocate more power to the “1 day” temporal scale. Additionally, as
rises, power at this scale increases, whereas it diminishes below ≈5 °C from late fall to winter, as indicated by the blue color. Notably, the continuous wavelet transform was conducted on the absolute values of temperature in Kelvin to prevent interference from negative numbers.
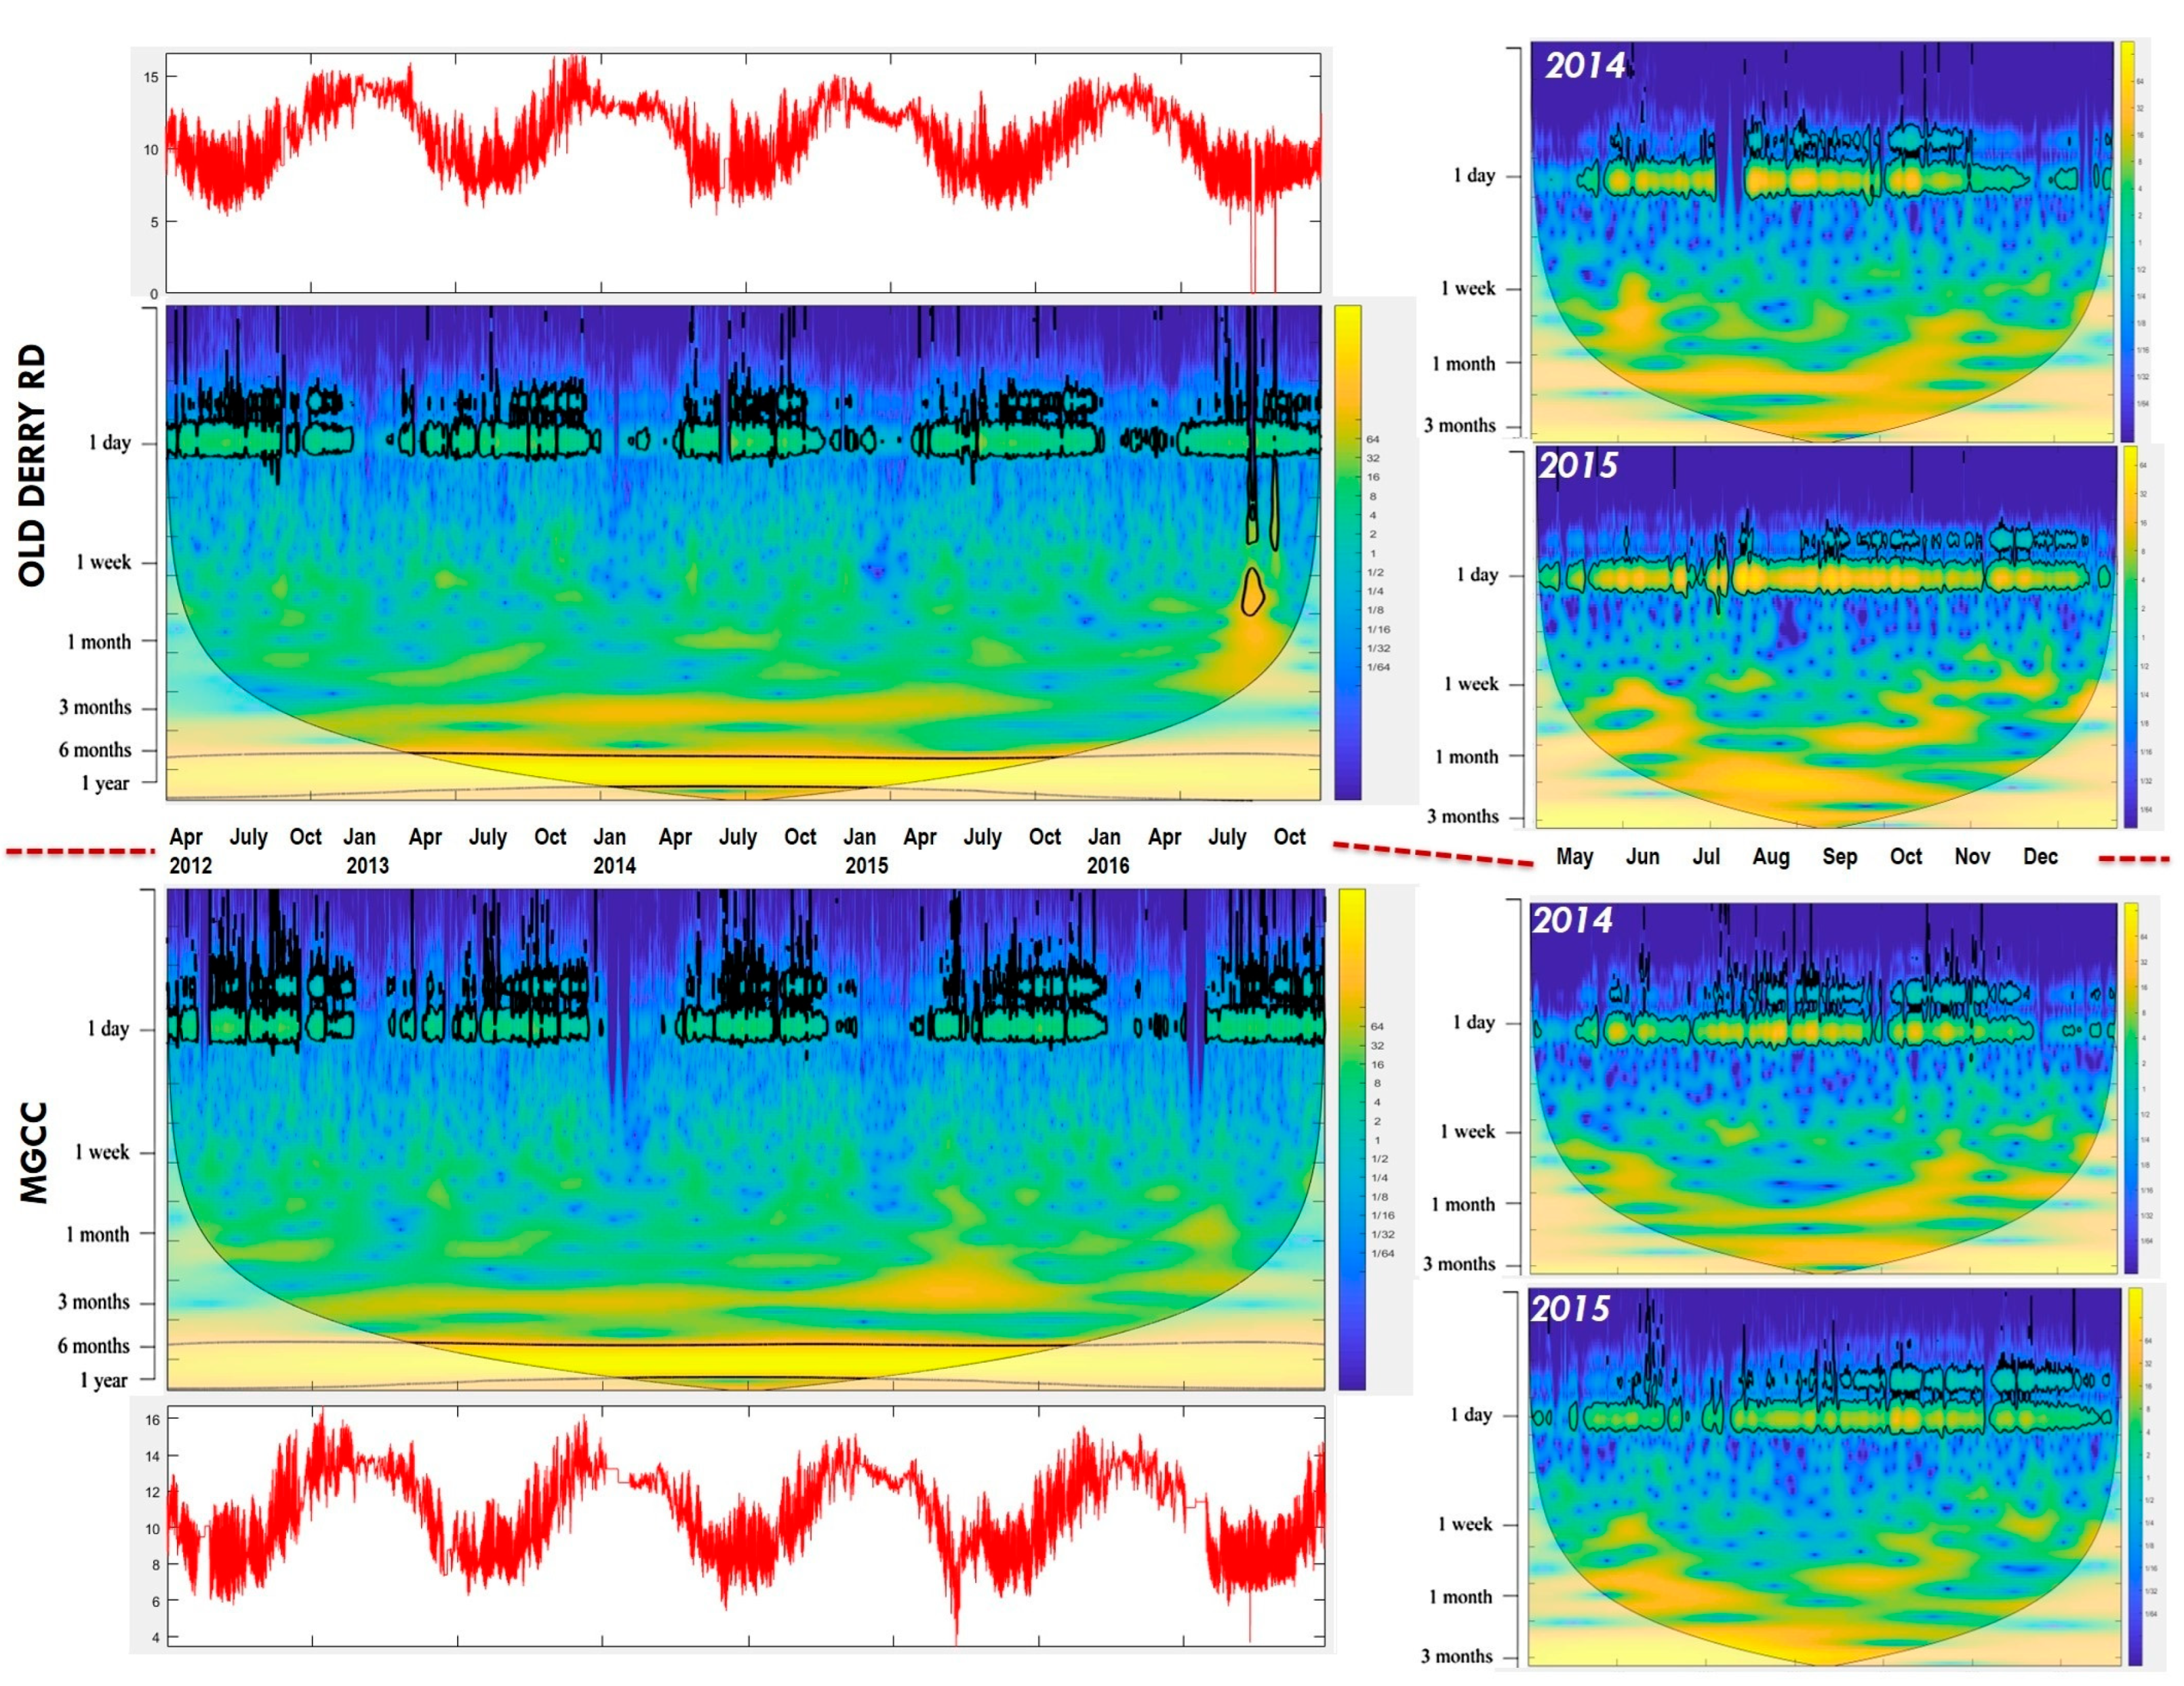
In
Figure 11, the low summer values of DO contributed to the greatest energy on the “1 day” temporal scale, illustrating that lower magnitudes do not necessarily mean lower power. This pattern holds true for
, pH (
Figure S5), and
(
Figure S4). High power with 95% confidence against red noise is found at the “one year” temporal scale in
Figure 9 and
Figure 11,
Figures S2 and S4 (in Supplementary Materials), indicating consistent patterns year after year. Overall,
Figure 9 and
Figure 11,
Figures S2 and S4 show significant power at both the “1 day” scale during spring to early fall and the “one year” scale, highlighting the influence of seasonal variation and daily fluctuations. Additionally, the similarity between the Old Derry Rd and MGCC plots across all datasets suggests no significant changes in temporal variation from upstream to downstream.
Similar findings were observed by Rajwa-Kuligiewicz et al. [
2], who also used continuous wavelet transform on hydrologic and dissolved oxygen time series measured on rivers in northeast Poland. They noted that DO exhibited concentrated power in the 6-month to one-year band, with moderate power at the one-day band. They emphasized that while power tends to be heightened for longer time scales, the specific location of high power is unique to each time series. They also found, in the same study, that during peak biological activity from March to November, DO showed increased power at higher frequencies on the daily temporal scale, correlating with fluctuations in
; however, the greatest power was concentrated at longer time scales.
In the present study, fluctuations in
were primarily influenced by
and insolation, with consistent temperatures observed during winters. The study also observed greater inter-annual variability in
and numerous short-term temporal patterns between periods greater than one week and less than one month. These results indicate that wavelet analysis goes beyond 95% confidence levels, typically significant from a statistical point of view, whereas related results were also observed in the Rajwa-Kuligiewicz et al. [
2] study.
Also, in the existing study, variations in data at “1 day” temporal scales showed low to no power, but at temporal scales of less than “3 months,” they occasionally did hold power (
Figure 10 and
Figure 11) (
Figures S3 and S5 also represent the same kind of output in
Supplementary Materials). Peaks of
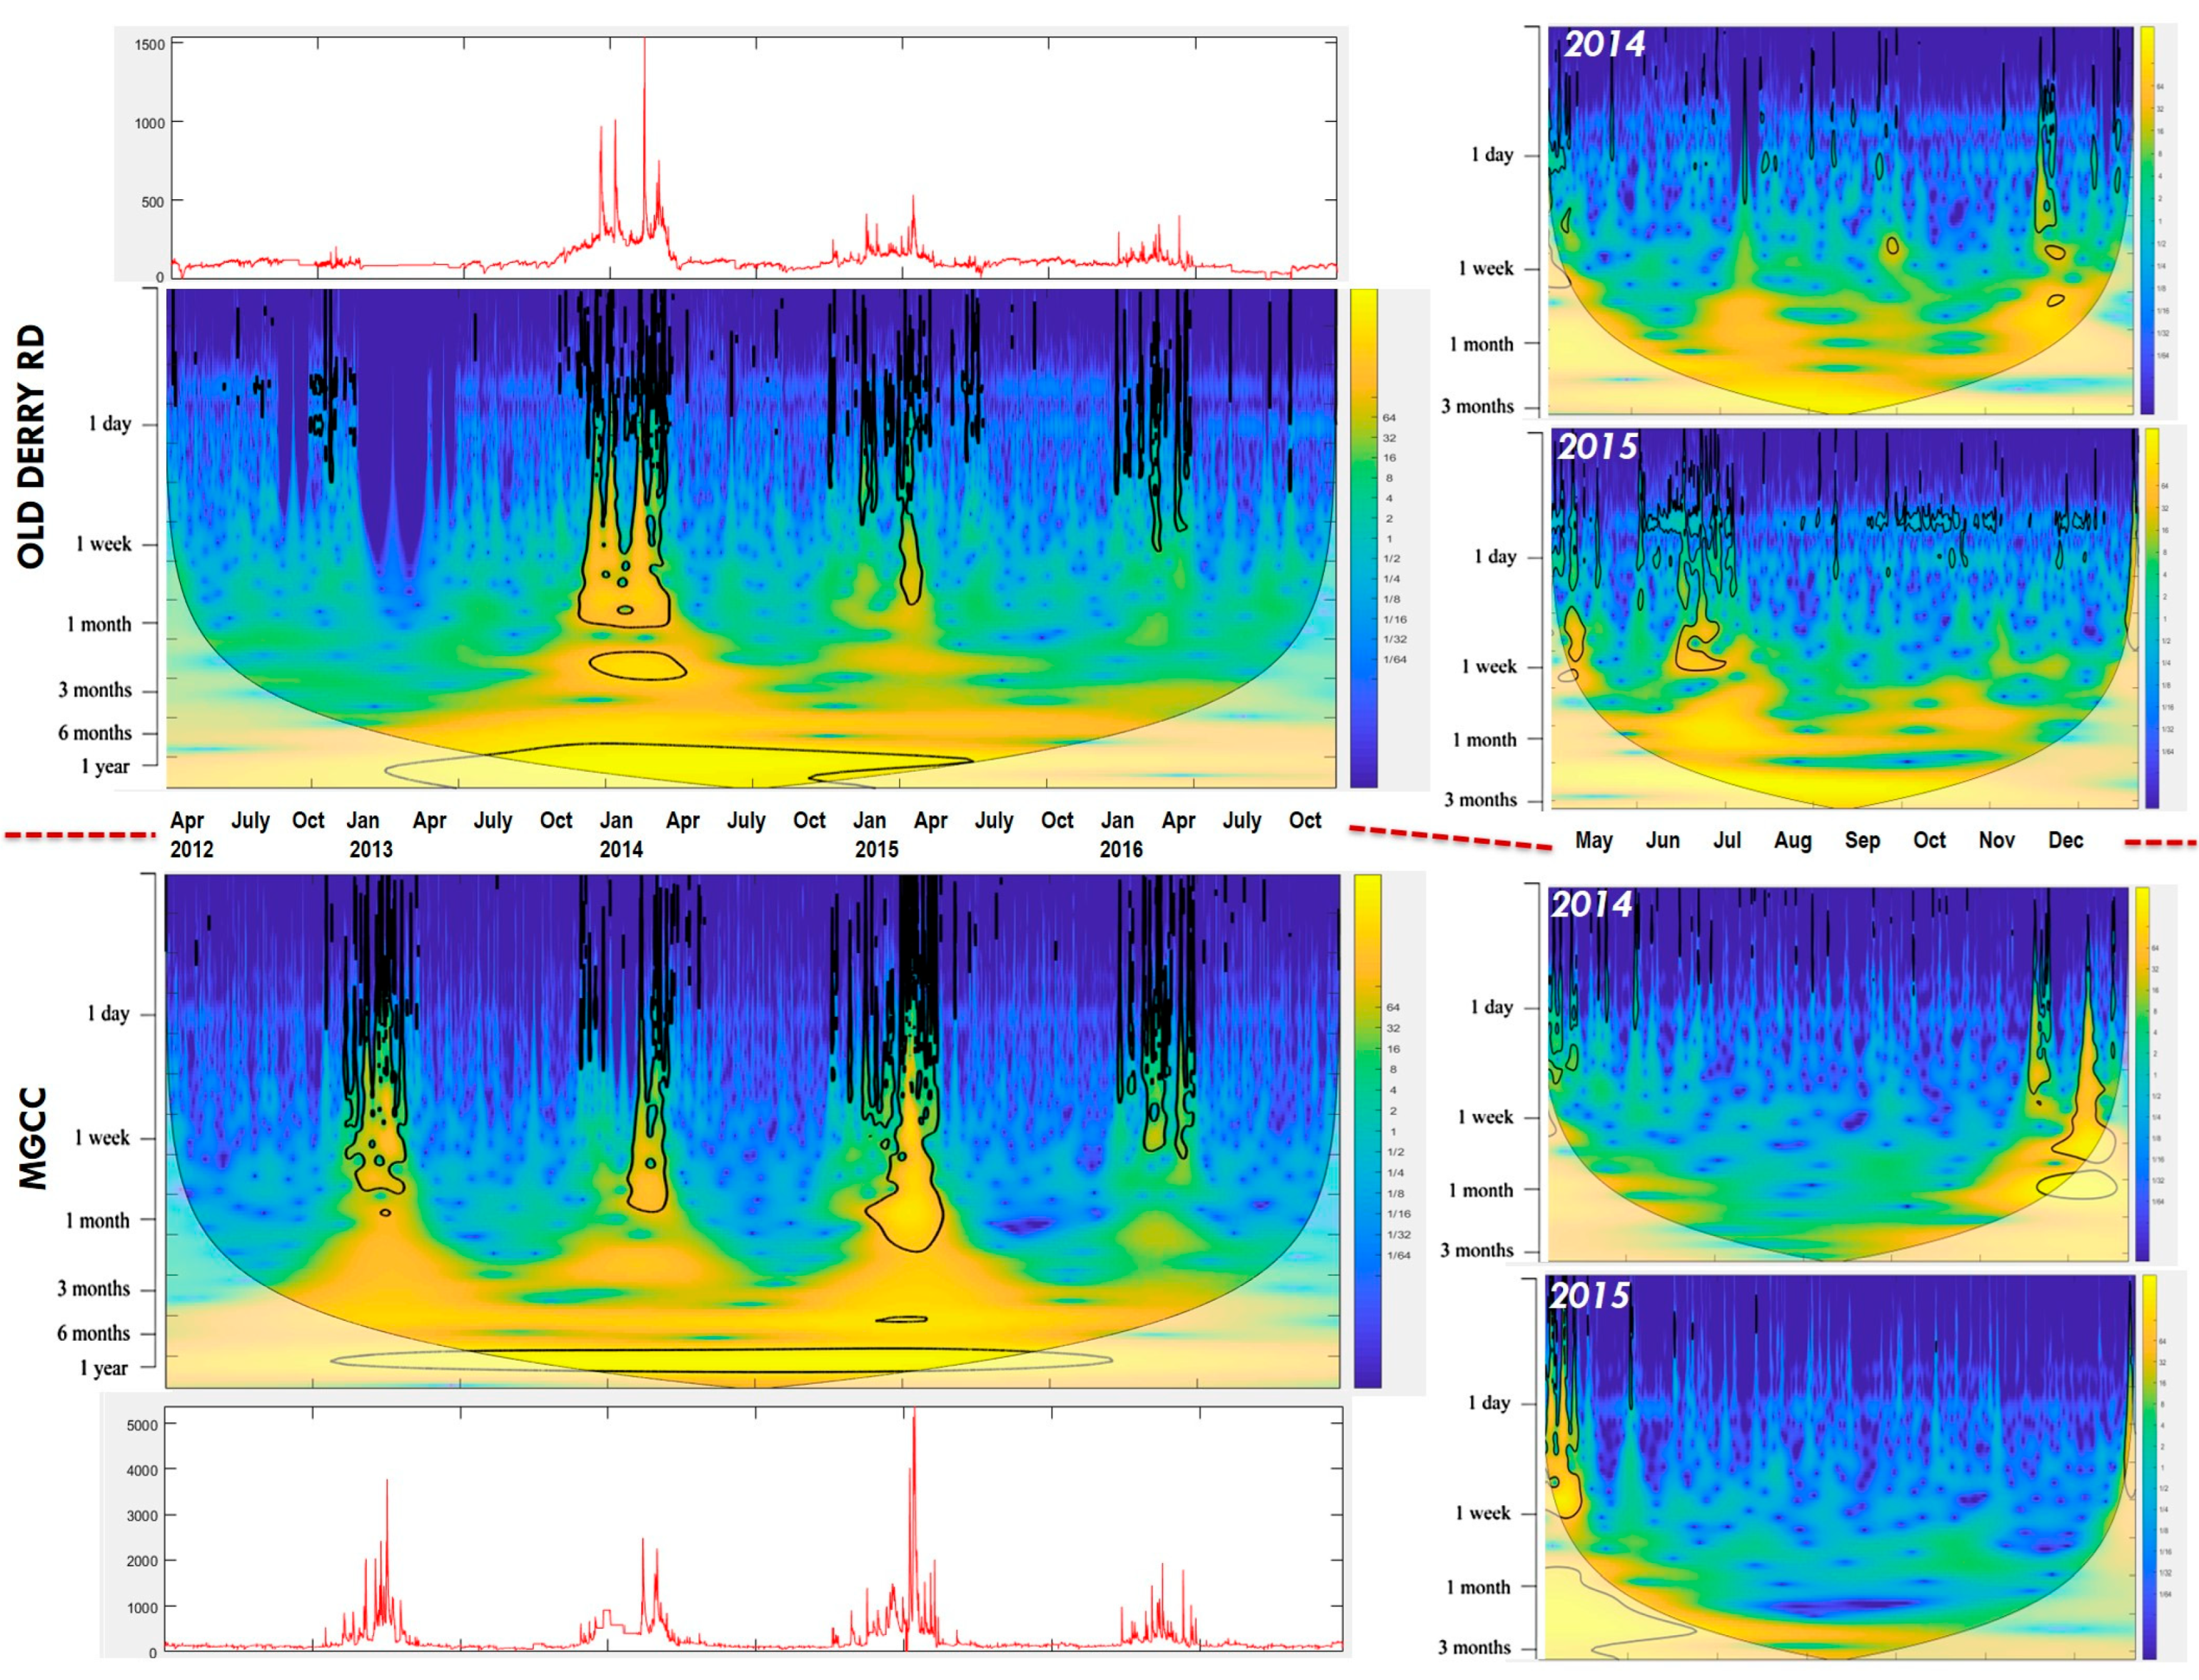
, during the winter months, held the greatest power, with 95% confidence against red noise (
Figure 10). For the Old Derry Rd station, most of the power was held in a single peak from Fall 2013 to the onset of Spring 2014, indicating a significantly greater contribution to
, within that time frame rather than at any other time. In contrast, every winter, the MGCC station showed peaks that held significant power. In general, the MGCC station has significantly higher
and peaks than the Old Derry Rd Station.
Figure S6, showing specific conductivity, illustrates results similar to those shown in
Figure S4, with a greater hold in the winter peaks.
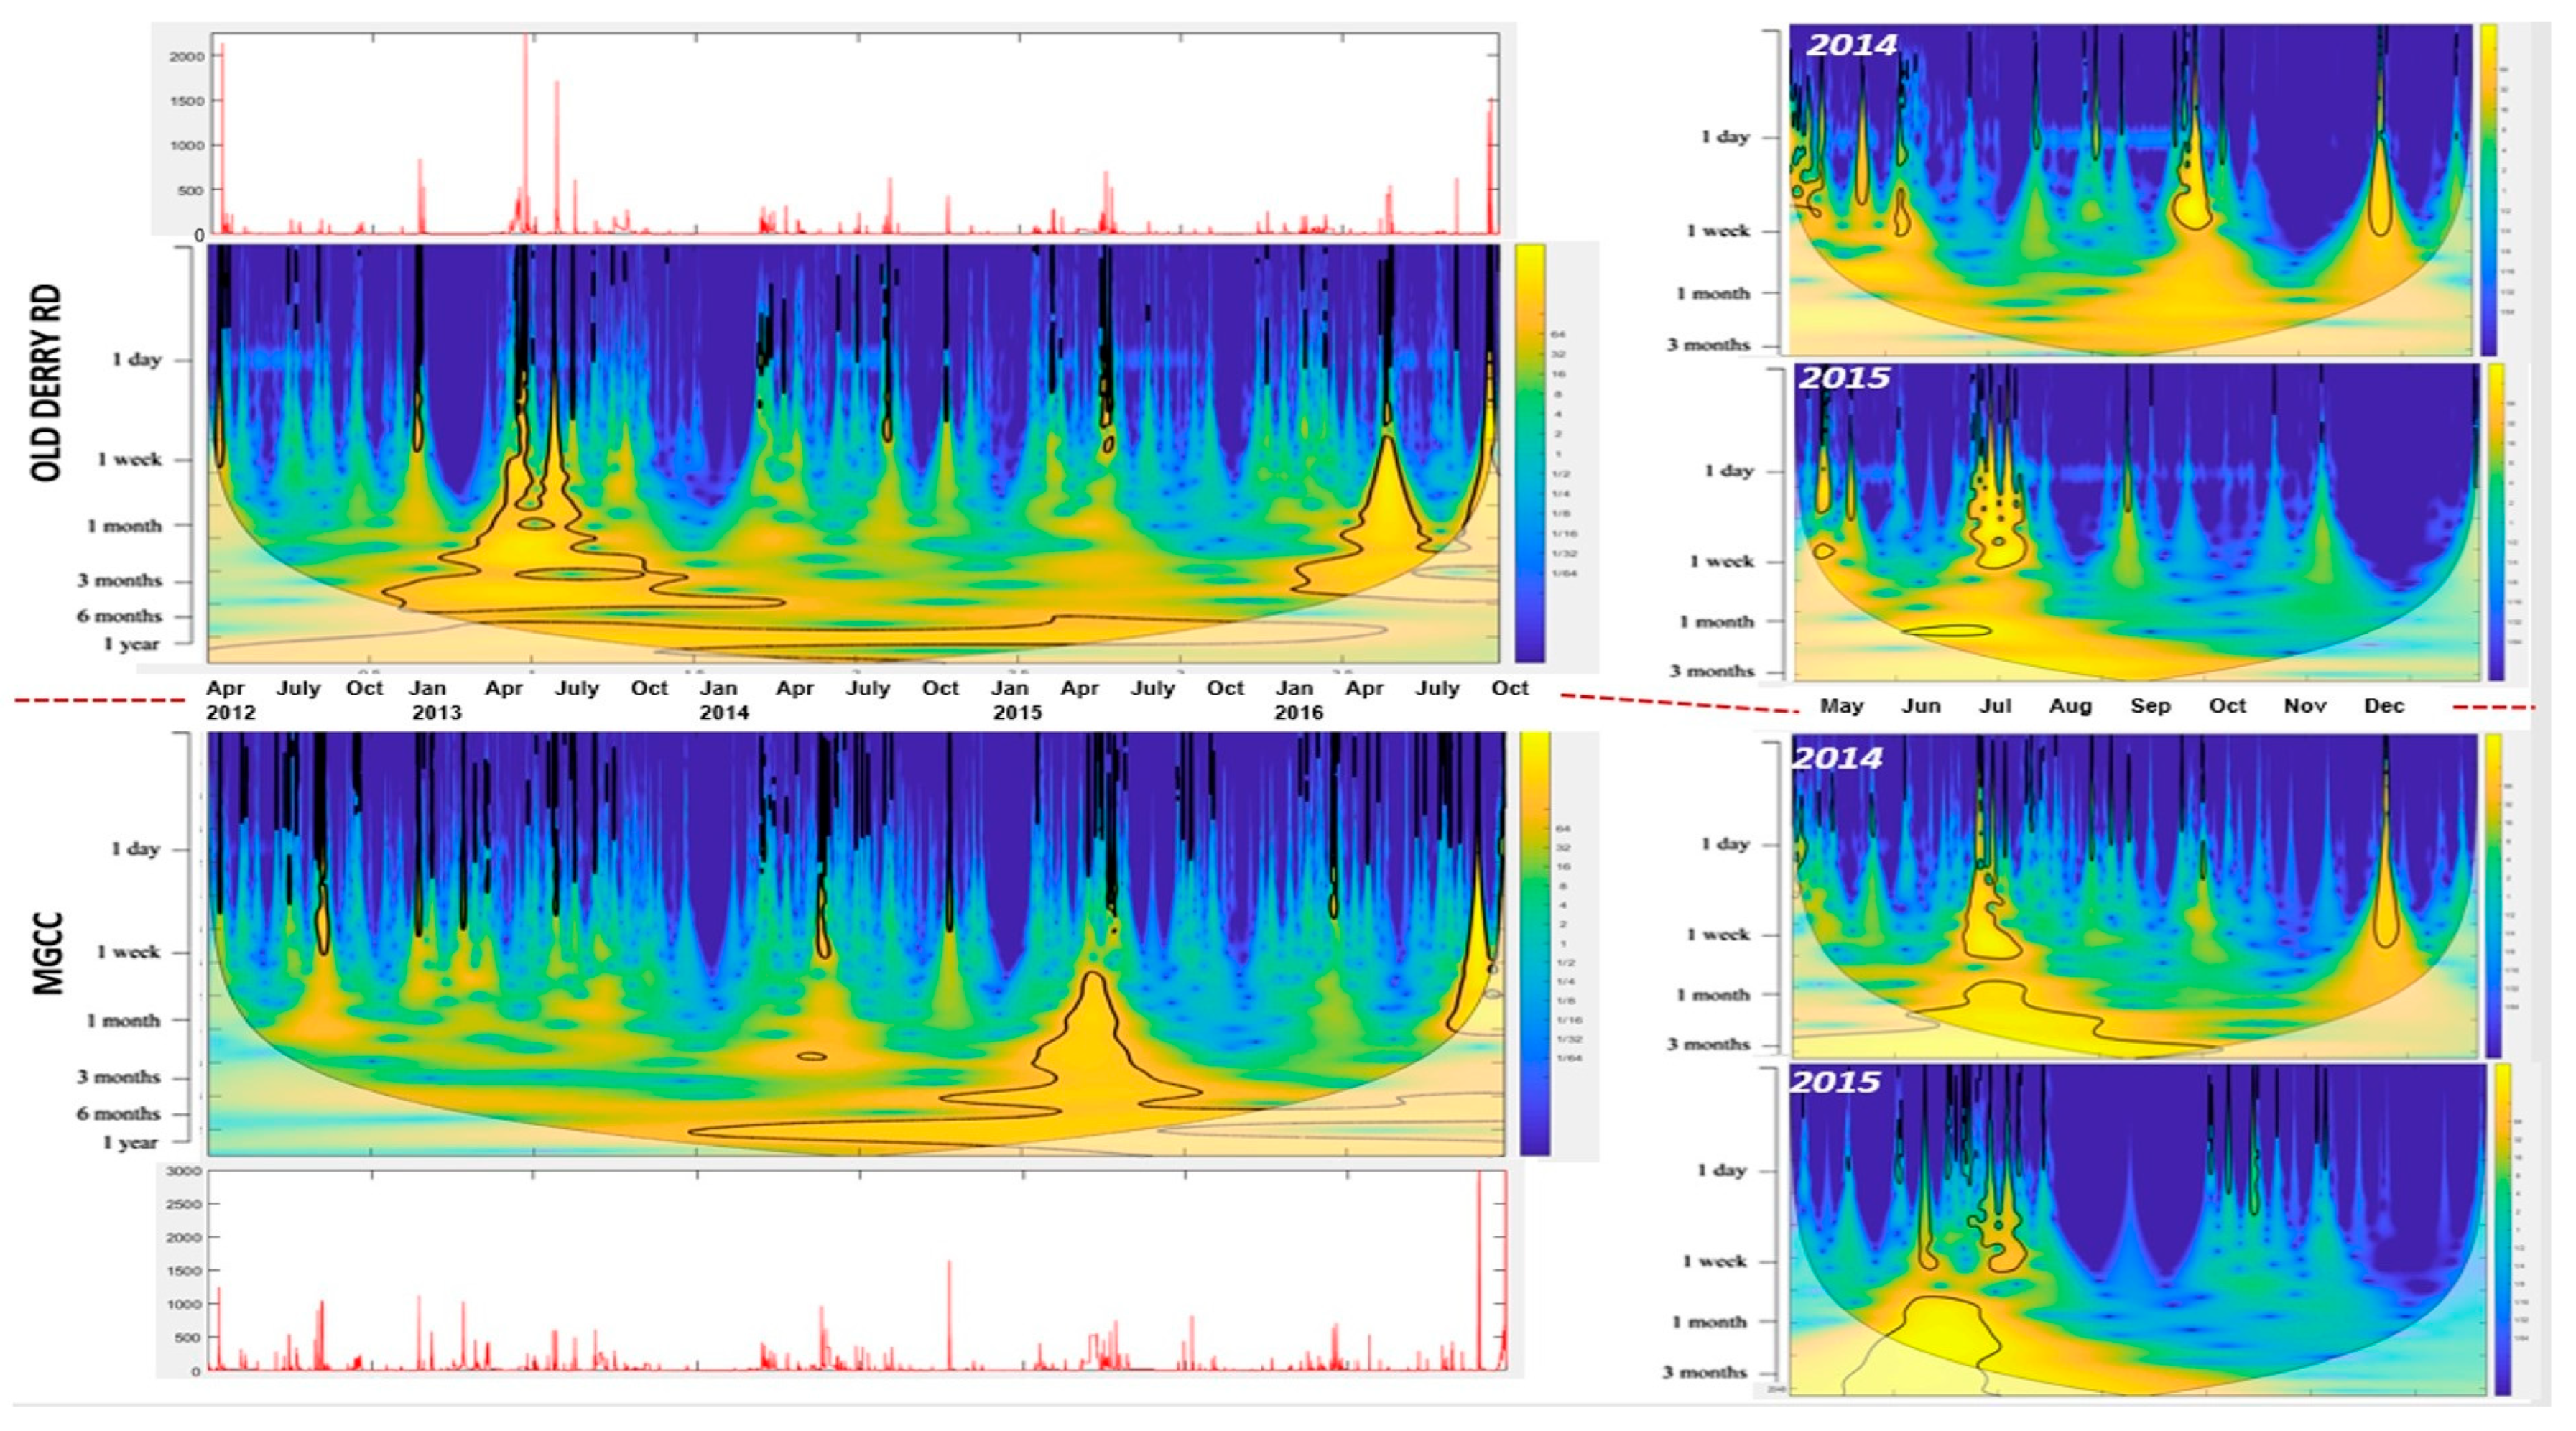
Figure 12 for turbidity shows significant fluctuations in power throughout the year related to significant peaks of turbidity around the “1 month” to “6 month” temporal scales—in this case, the greater magnitude of the turbidity peaks contributes to greater power; in contrast, the greater magnitude of DO during the winter months does not contribute to greater power. Comparing
Figure 12 for turbidity and
Figure S5 (in Supplementary Materials) for flow, it becomes apparent that the turbidity peaks are directly linked to flow.
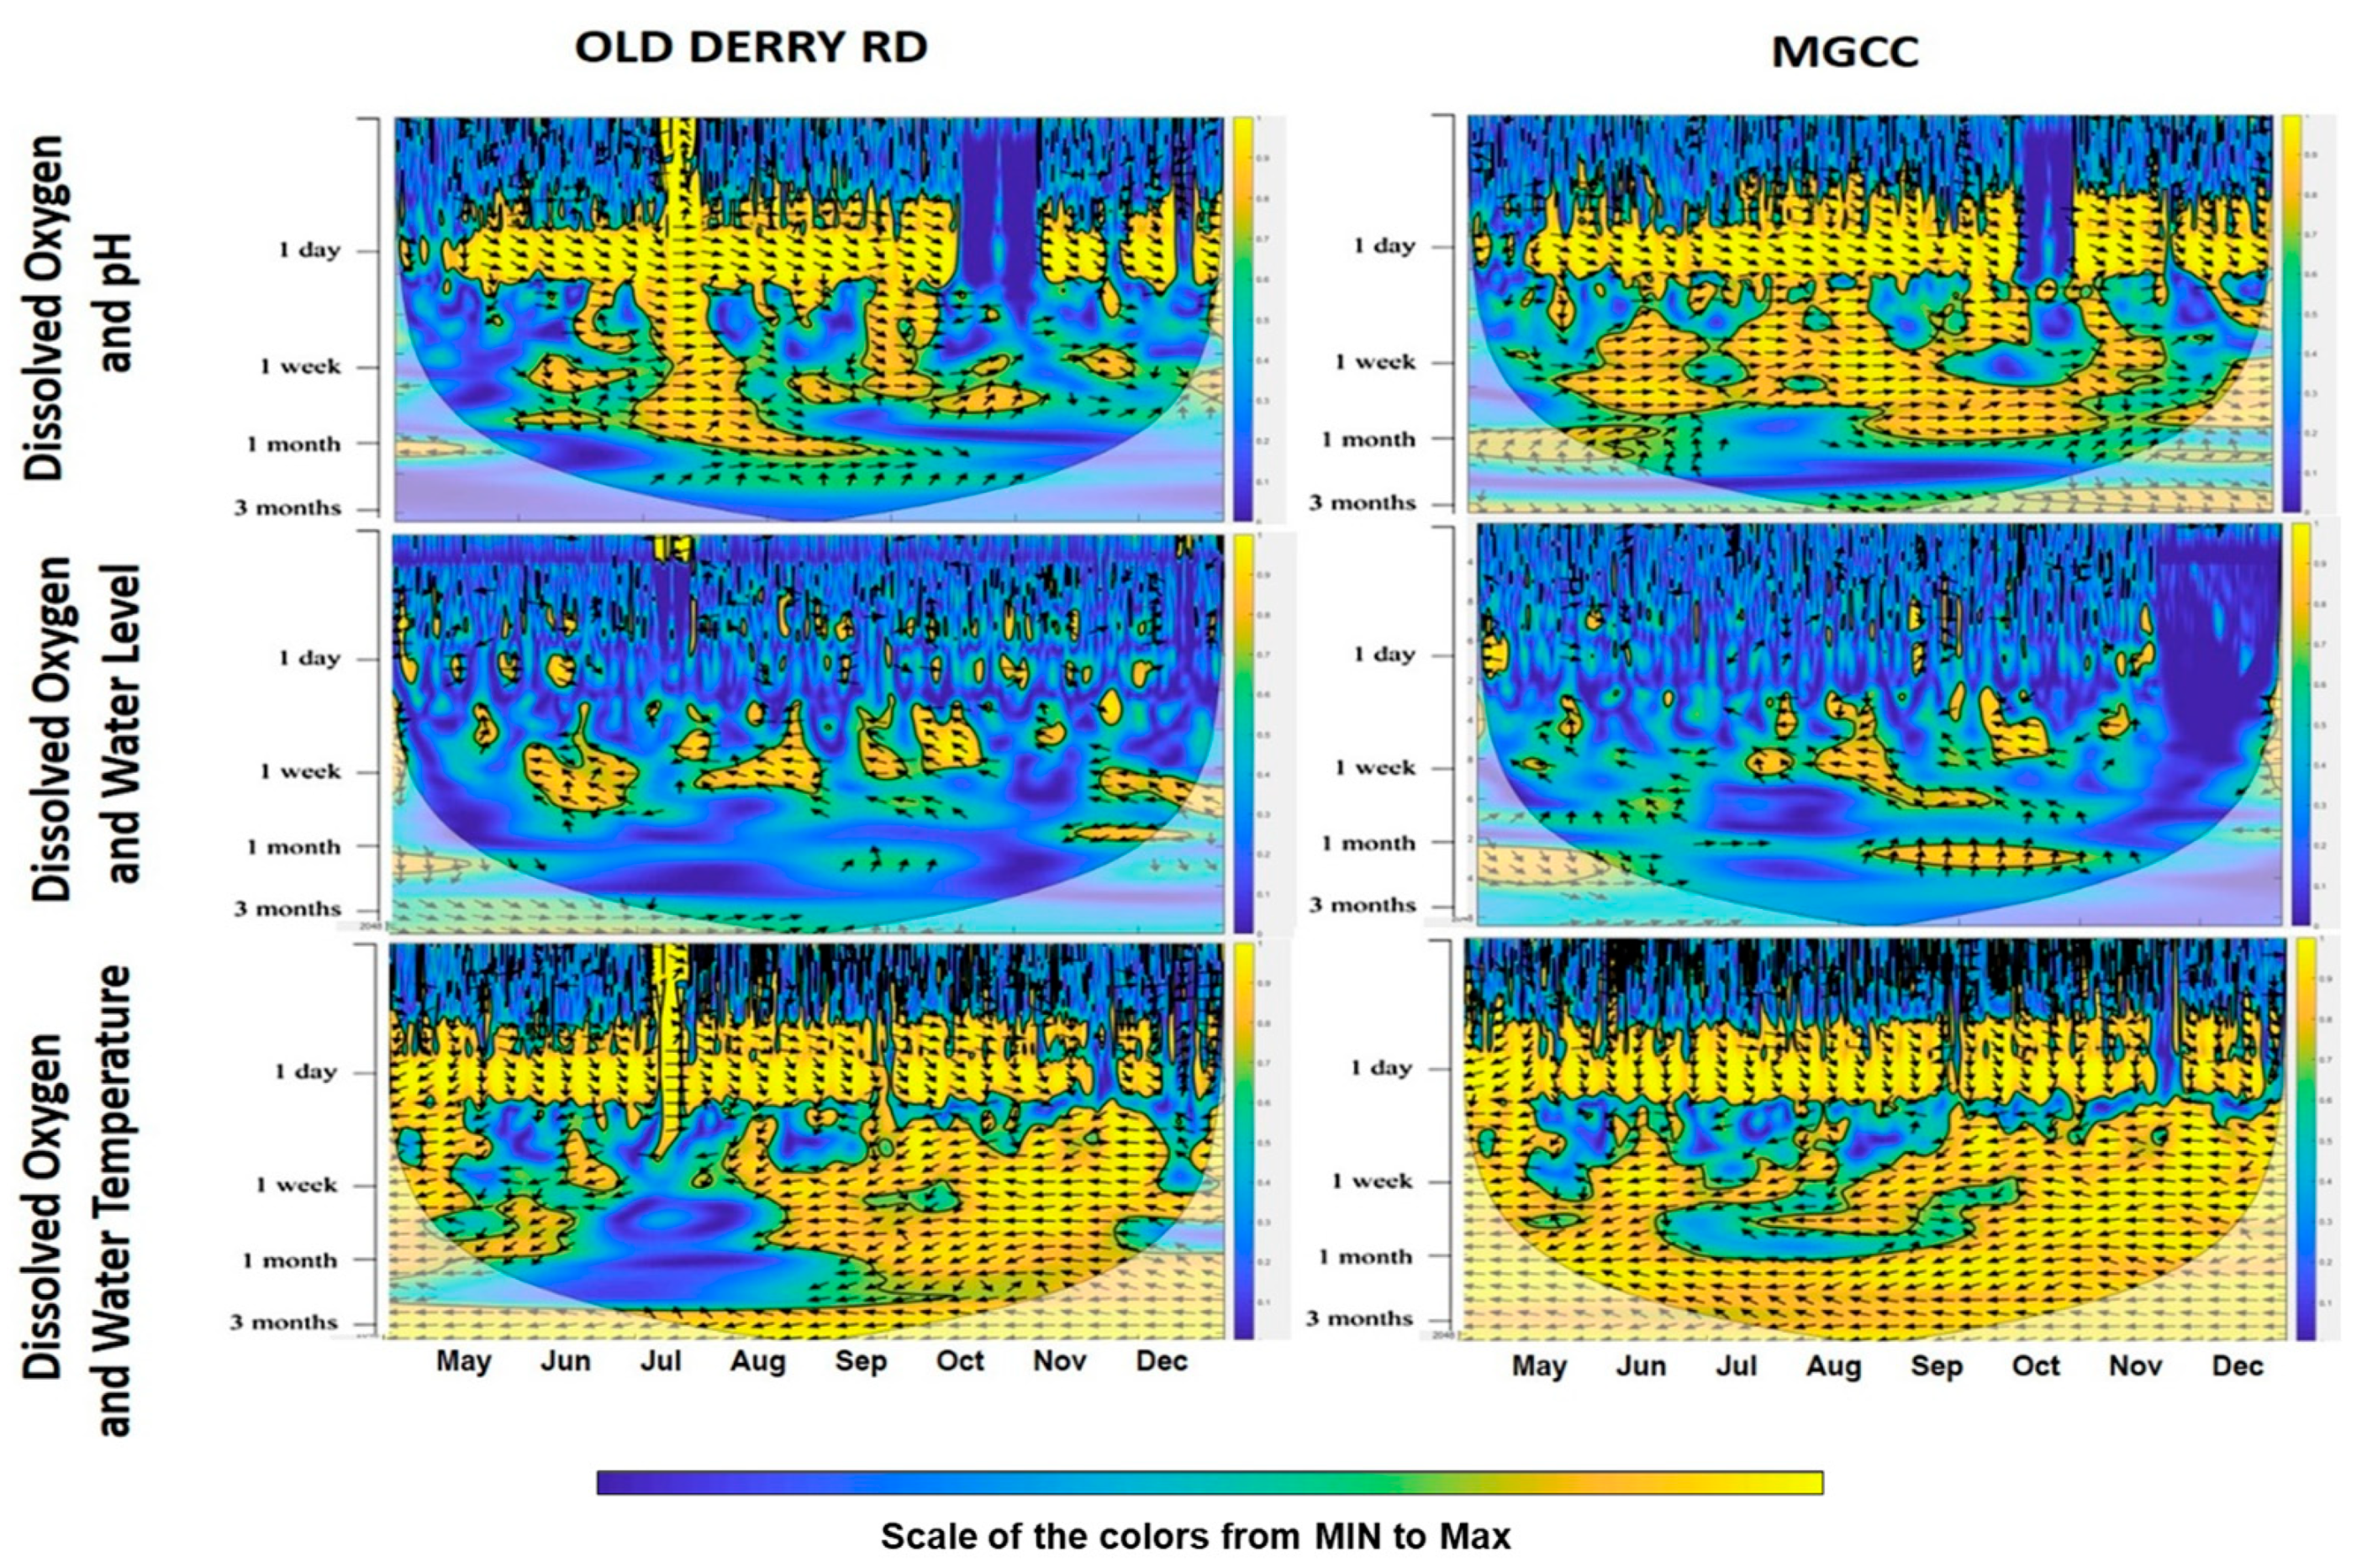
Figure 7 illustrates wavelet coherency between DO and pH, water level, and
at the Old Derry Rd and MGCC stations during the Spring 2014/2015 to Fall 2014/2015 period. The DO and pH showed a high power correlation at the “1 day” temporal scale with a 45° phase angle, indicating a lag period. Additionally, at Old Derry Rd, a high power correlation existed between “1 day” and “1 month” periods in July, while at MGCC, it extended from July to November. At both stations, DO and water level exhibited a poor correlation. Moreover, DO and
showed a 45° and 90° lagged correlation at the “1 day” scale and an out-of-phase correlation at other scales. However, a weak correlation existed between DO and
at temporal scales greater than “1 day” but less than “3 months” during May to August, suggesting a weak relationship between the two parameters in late spring and summer.
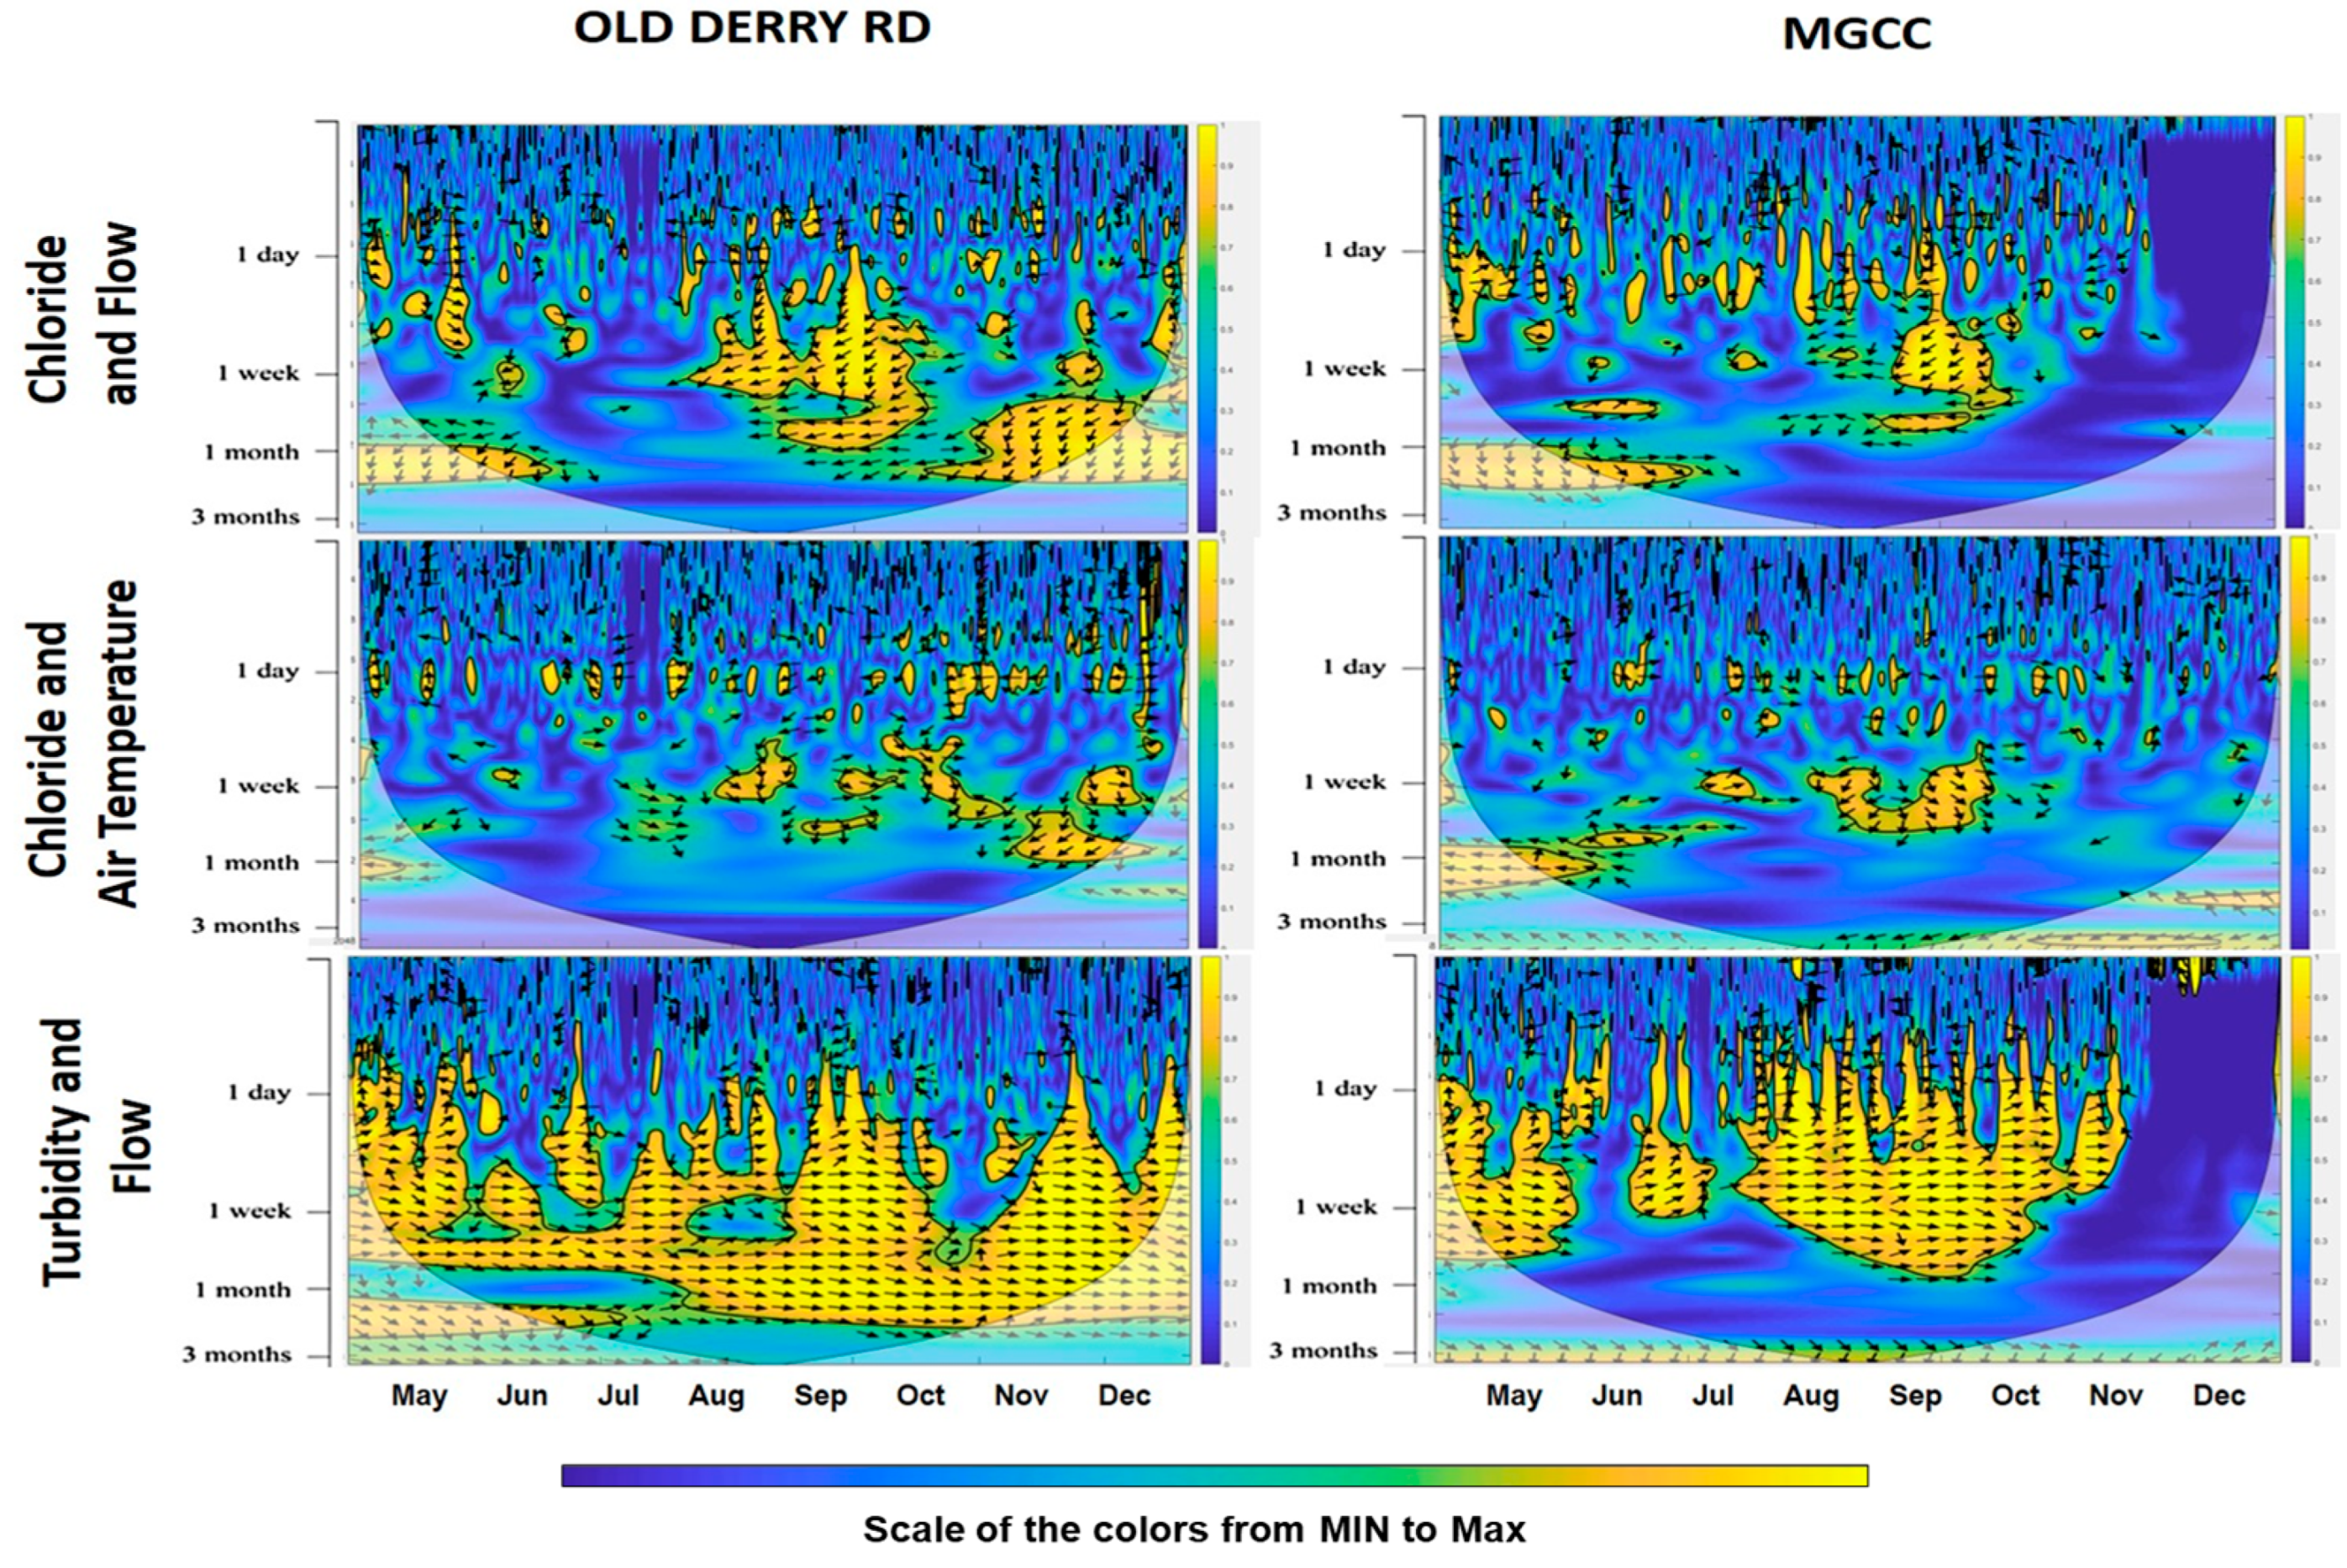
Figure 8 displays wavelet coherency between
,
, flow, and turbidity for the Old Derry Rd and MGCC stations during the Spring 2014/2015 to Fall 2014/2015 period. A lagged correlation existed between
and flow, particularly at the Old Derry Rd Station, at roughly weekly temporal scales in August and September, and “1 month” scales in the winter months. Little to no correlation was observed between
and
at any temporal scale. Turbidity and flow exhibited high power phase correlations, primarily within the “1 day” to “1 month” range at both stations, indicating that flow peaks in daily to monthly timeframes correspond to turbidity peaks.
In general, the wavelet analysis attributed more power to greater fluctuations in the magnitudes of frequency and less power to lower fluctuations in the magnitudes of frequency on a “1 day” scale. These greater fluctuations caused the DO, pH, , and datasets to exhibit greater power during the spring to fall period vs. the winter. In addition, periodicity in the data over an annual basis (due to seasonality) and data that hovered over a constant value (such as pH) were all represented by a horizontal straight line, indicating no change over time.
Outliers in the data, such as those found in the boxplots of turbidity, , and specific conductivity, were all well captured by the continuous wavelet transform. When the magnitude of the peaks was at extreme values, high power was attributed to these extremes as they held significant power in the entire time series.
The continuous wavelet analysis provided an effective representation of the behavior of the measured parameters. The method can be used for quick feature extraction of irregularities; however, the mechanisms that provide the power, such as the increase in the magnitude of frequency, periodicity, or hovering over a constant value or an extreme magnitude relative to the rest of the dataset, need to be kept in mind when assessing the data over the various temporal scales. The temporal scale resolution is innovative, as most time series analysis is limited to plots of the measured parameters over time.
The continuous wavelet transform is computationally efficient in MATLAB; however, estimating continuous wavelet coherency becomes increasingly inefficient when applied to large real-time datasets. For instance, generating wavelet coherency plots for the Spring 2014/2015 to Fall 2014/2015 period took approximately 15 min each, while attempts to analyze the full Spring 2012 to Fall 2016 dataset caused the program to freeze. To address data continuity issues, we filtered out periods with extensive missing data and applied a moving average method in R, followed by cubic interpolation to approximate the remaining gaps. However, these steps were necessary to maintain a continuous dataset for wavelet analysis. In this study, interpolation may have introduced distortions in the power spectra and potentially bias the spectral slope, especially toward lower frequencies. Furthermore, it should be noted that wavelet coherency, which estimates the localized correlation between two time series in time–frequency space, is distinct from wavelet cross-spectrum, which merely conjugates the two wavelet transforms and can yield inconsistent results (Rajwa-Kuligiewicz et al. [
2]; Grinsted et al. [
19]). Due to these computational and methodological constraints, the analysis was limited to selected periods and focused exclusively on wavelet coherency, as detailed in
Table S1.
In general, the continuous wavelet analysis showed that the two stations, Old Derry Rd and MGCC, had similar temporal variations and correlations for DO, pH, , and , while slightly different temporal variations were seen for , flow, turbidity, and specific conductivity. It should be noted that the magnitude of the measured parameters differed between the two stations; however, the wavelet analysis is only concerned with the power relative to the original signal. As such, it appears that, for example, the high-power single peak in at Old Derry Rd around January 2014 was much greater than the high-power single peak at MGCC around the same time. However, the time series indicate that the MGCC peak was of greater magnitude than Old Derry Rd. Hence, a power spectra plot alone can only serve to compare temporal variation between the stations, and not between the magnitude or the numerical value of data at that time. Therefore, the actual or numerical value or magnitude of a value is not automatically transferred into a power spectra plot. If we only did statistical analysis without wavelet analysis, only the magnitude or actual value of the data would be observed, but with the power spectra (in which higher power indicates dominant features), the temporal variation between the stations was also observed.
In addition, as detailed above, it should be noted that when producing a wavelet power plot, longer time periods of data attribute less power to events of a smaller scale than do shorter time periods. The geographic area between the Old Derry Rd and MGCC stations had a significant impact on MGCC
during the winters. The greatest peak in MGCC occurred during the winter of 2015. The winter 2014 peak in
at Old Derry Rd was reflected downstream at the MGCC station as well (
Figure 8).
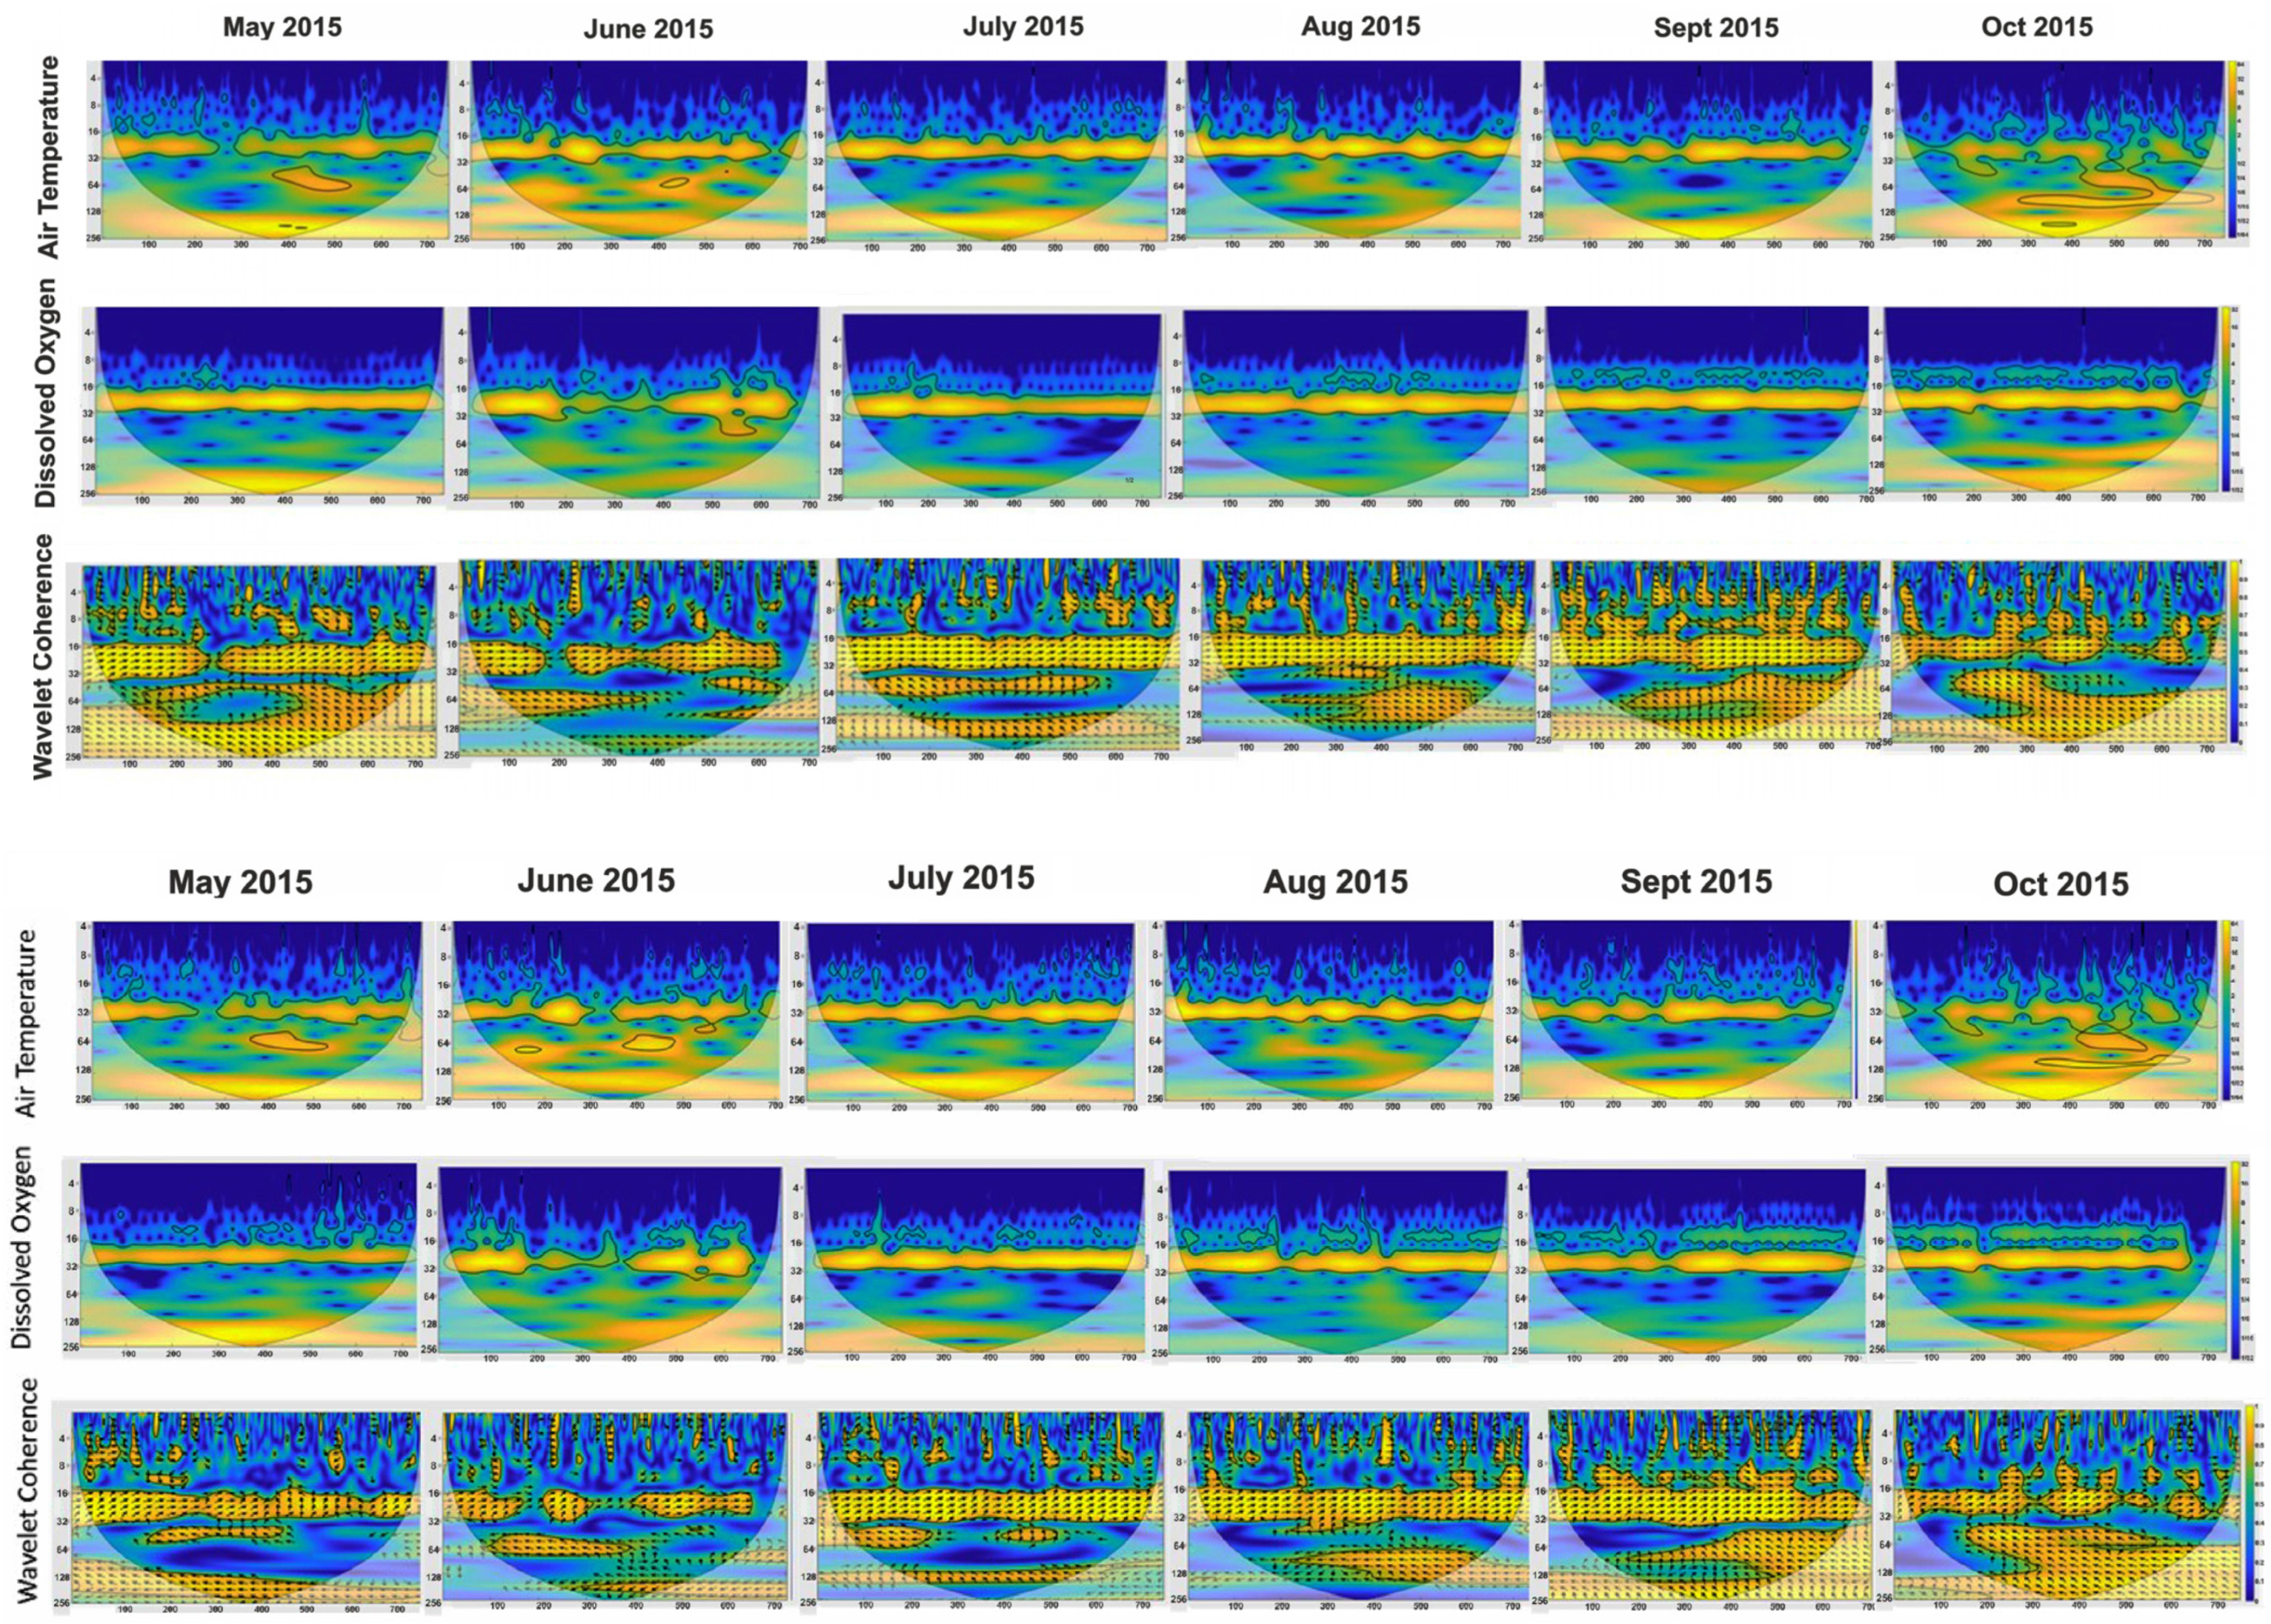
Figure 13 displays results on a smaller temporal scale, using monthly datasets from
and DO for the year 2015 (May to October). Similarly,
Figure S6 in Supplementary Materials depicts flow and turbidity at both the stations. In addition, similar patterns around the 1-day to 1-week scale are observed for these variables, with
and DO showing strong correlation at smaller temporal scales. However, on a monthly basis, the wavelet analysis is also investigated from 1-day to 1-week scale in the graphs shown in
Figure 13. Peaks in flow coincide with peaks in turbidity, likely due to storm event runoff, with slight variations within each month. However, these figures do not offer significantly greater insight compared to wavelet analysis of several years of real-time data, which provides a comprehensive view of patterns across various temporal scales. Wavelet analysis with long-term data ensures that resolution is not lost at smaller scales, and power spectra indicate the significance of individual data points relative to the entire series. It should be noted that the results from wavelet analysis for one month are not directly comparable to other months. For detailed insights at monthly or weekly levels, it is recommended to zoom in on wavelet power spectra or coherence plots generated from complete real-time datasets, rather than breaking down data into smaller intervals for analysis. Therefore, the approach used in
Figure 13 is not advised. In fact, wavelet analysis with several years of real-time data provides the greatest insight into changes in patterns in the time series over a wide range of temporal scales ranging from one day to greater than a year. In addition, the logarithmic scale of the wavelet power spectra ensures that the resolution of the real-time data time series is not lost at smaller scales of 1 day to 1 week. In addition, the wavelet analysis power spectra show the power relative to the length of the time series. As such, performing wavelet analysis on a large dataset of several years without breaking it down into smaller components allows for the wavelet power spectra to indicate the significance and power of the individual data points in the time series relative to the entire time series.
