Article

Assessing Resource Management in Higher Education Sustainability Projects: A Bootstrap Dea Case Study

by
Ricardo Casonatto
*,
Tales Souza
,
Gustavo Silva
,
Victor Oliveira
and
Simone Monteiro
Departament of Industrial Engineering, Faculty of Technology, University of Brasilia (UnB), Brasilia 70910-900, DF, Brazil
*
Author to whom correspondence should be addressed.
Sustainability 2025, 17(19), 8653; https://doi.org/10.3390/su17198653
Submission received: 24 March 2025 / Revised: 23 May 2025 / Accepted: 2 June 2025 / Published: 26 September 2025

Abstract

This case study evaluates the efficiency of STEM-based sustainability initiatives at the University of Brasilia (UnB) using a Bootstrap Data Envelopment Analysis (DEA) approach. Twenty projects were analyzed based on input variables—team size, budget, and workload—and output variables—number of beneficiaries and published papers. The results indicate higher efficiency in the Mathematics and Civil Engineering departments, while Energy Engineering showed the lowest performance. A strong correlation (r = 0.78) was observed between budget and publication volume, but no significant relationship was found between the inputs and number of beneficiaries. SDG 4 (Quality Education) was the most frequently addressed, whereas SDG 16 (Peace, Justice, and Strong Institutions) and SDG 14 (Life Below Water) received less attention. The study identifies key areas for improvement, emphasizing the need for more balanced resource allocation and contextual awareness over sustainability priorities. It also offers an adaptive and replicable framework to other faculties or institutions seeking to optimize sustainability efforts through the lens of resource allocation optimization.

1. Introduction

The increasing frequency of extreme weather events worldwide underscores the urgent need to address climate change and promote sustainability [1]. This urgency has driven a global movement toward sustainable development, a concept popularized by the Brundtland Report, which defines it as “a process that meets the needs of the present without compromising the ability of future generations to meet their own needs” [2]. Among the United Nations’ 17 Sustainable Development Goals (SDGs), combating climate change remains a critical priority.
Within this global context, Brazil has assumed a pivotal role in advancing sustainability through its commitments to the Paris Agreement and the 2030 Agenda. A particular area of concern is the conservation of the Amazon rainforest—one of the world’s most significant natural carbon sinks—which plays a vital role in mitigating climate change by absorbing more greenhouse gases than it emits [3].
Despite implementing a range of sustainability initiatives, Brazil continues to face significant challenges in meeting its targets. According to [4], only 7.7% of the SDGs are currently being achieved satisfactorily. This highlights an urgent need to enhance the efficiency and impact of public policies to generate greater societal value and improve public welfare.
Efficiency is essential for ensuring that sustainability actions lead to meaningful social and environmental outcomes while maximizing the use of available resources and minimizing waste [5]. Studies have shown that efficient projects are not only more environmentally sound but also more socially inclusive, improving quality of life and promoting sustainable economic growth [6]. Therefore, solutions that integrate effectiveness, innovation, and collaboration—especially through public–private partnerships—are crucial for developing transformative policies [7].
Educational institutions play a vital role in shaping sustainability agendas through their socioeconomic, technoscientific, and cultural influence [8]. In this context, the University of Brasilia (UnB), recognized nationally for its commitment to social and environmental sustainability [9], provides an ideal setting to explore the effectiveness of institutional initiatives. This work conducts a case study at UnB, applying a data-driven methodology—specifically, Data Envelopment Analysis (DEA)—to evaluate the efficiency of sustainability-oriented STEM (Science, Technology, Engineering, and Mathematics) projects. While the relevance of sustainability is widely acknowledged, systematic and standardized assessments of how institutional efforts contribute to sustainable development remain limited [10]. By identifying best practices in resource allocation, this study highlights key areas for improvement within the context analyzed while offering an adaptable and replicable framework to other faculties or institutions seeking to optimize sustainability efforts through the lens of resource allocation optimization.

2. Related Works

A bibliometric approach was conducted to review precedents in the use of DEA for measuring the efficiency of sustainability-oriented projects. In order to do that, a three-year period was selected, and documents were collected from the Web of Science (WOS). The search was restricted to journal articles and conference papers within the field of Engineering and Environmental Sciences to ensure a comprehensive and focused cross-analysis in the STEM field. The query was designed around three key dimensions, combined using the AND operator: DEA (DEA OR “Data Envelopment Analysis”), Sustainability (Sustainab* OR Environ* OR Green OR “Socio-environ*”), and Projects (Project OR Initiative).
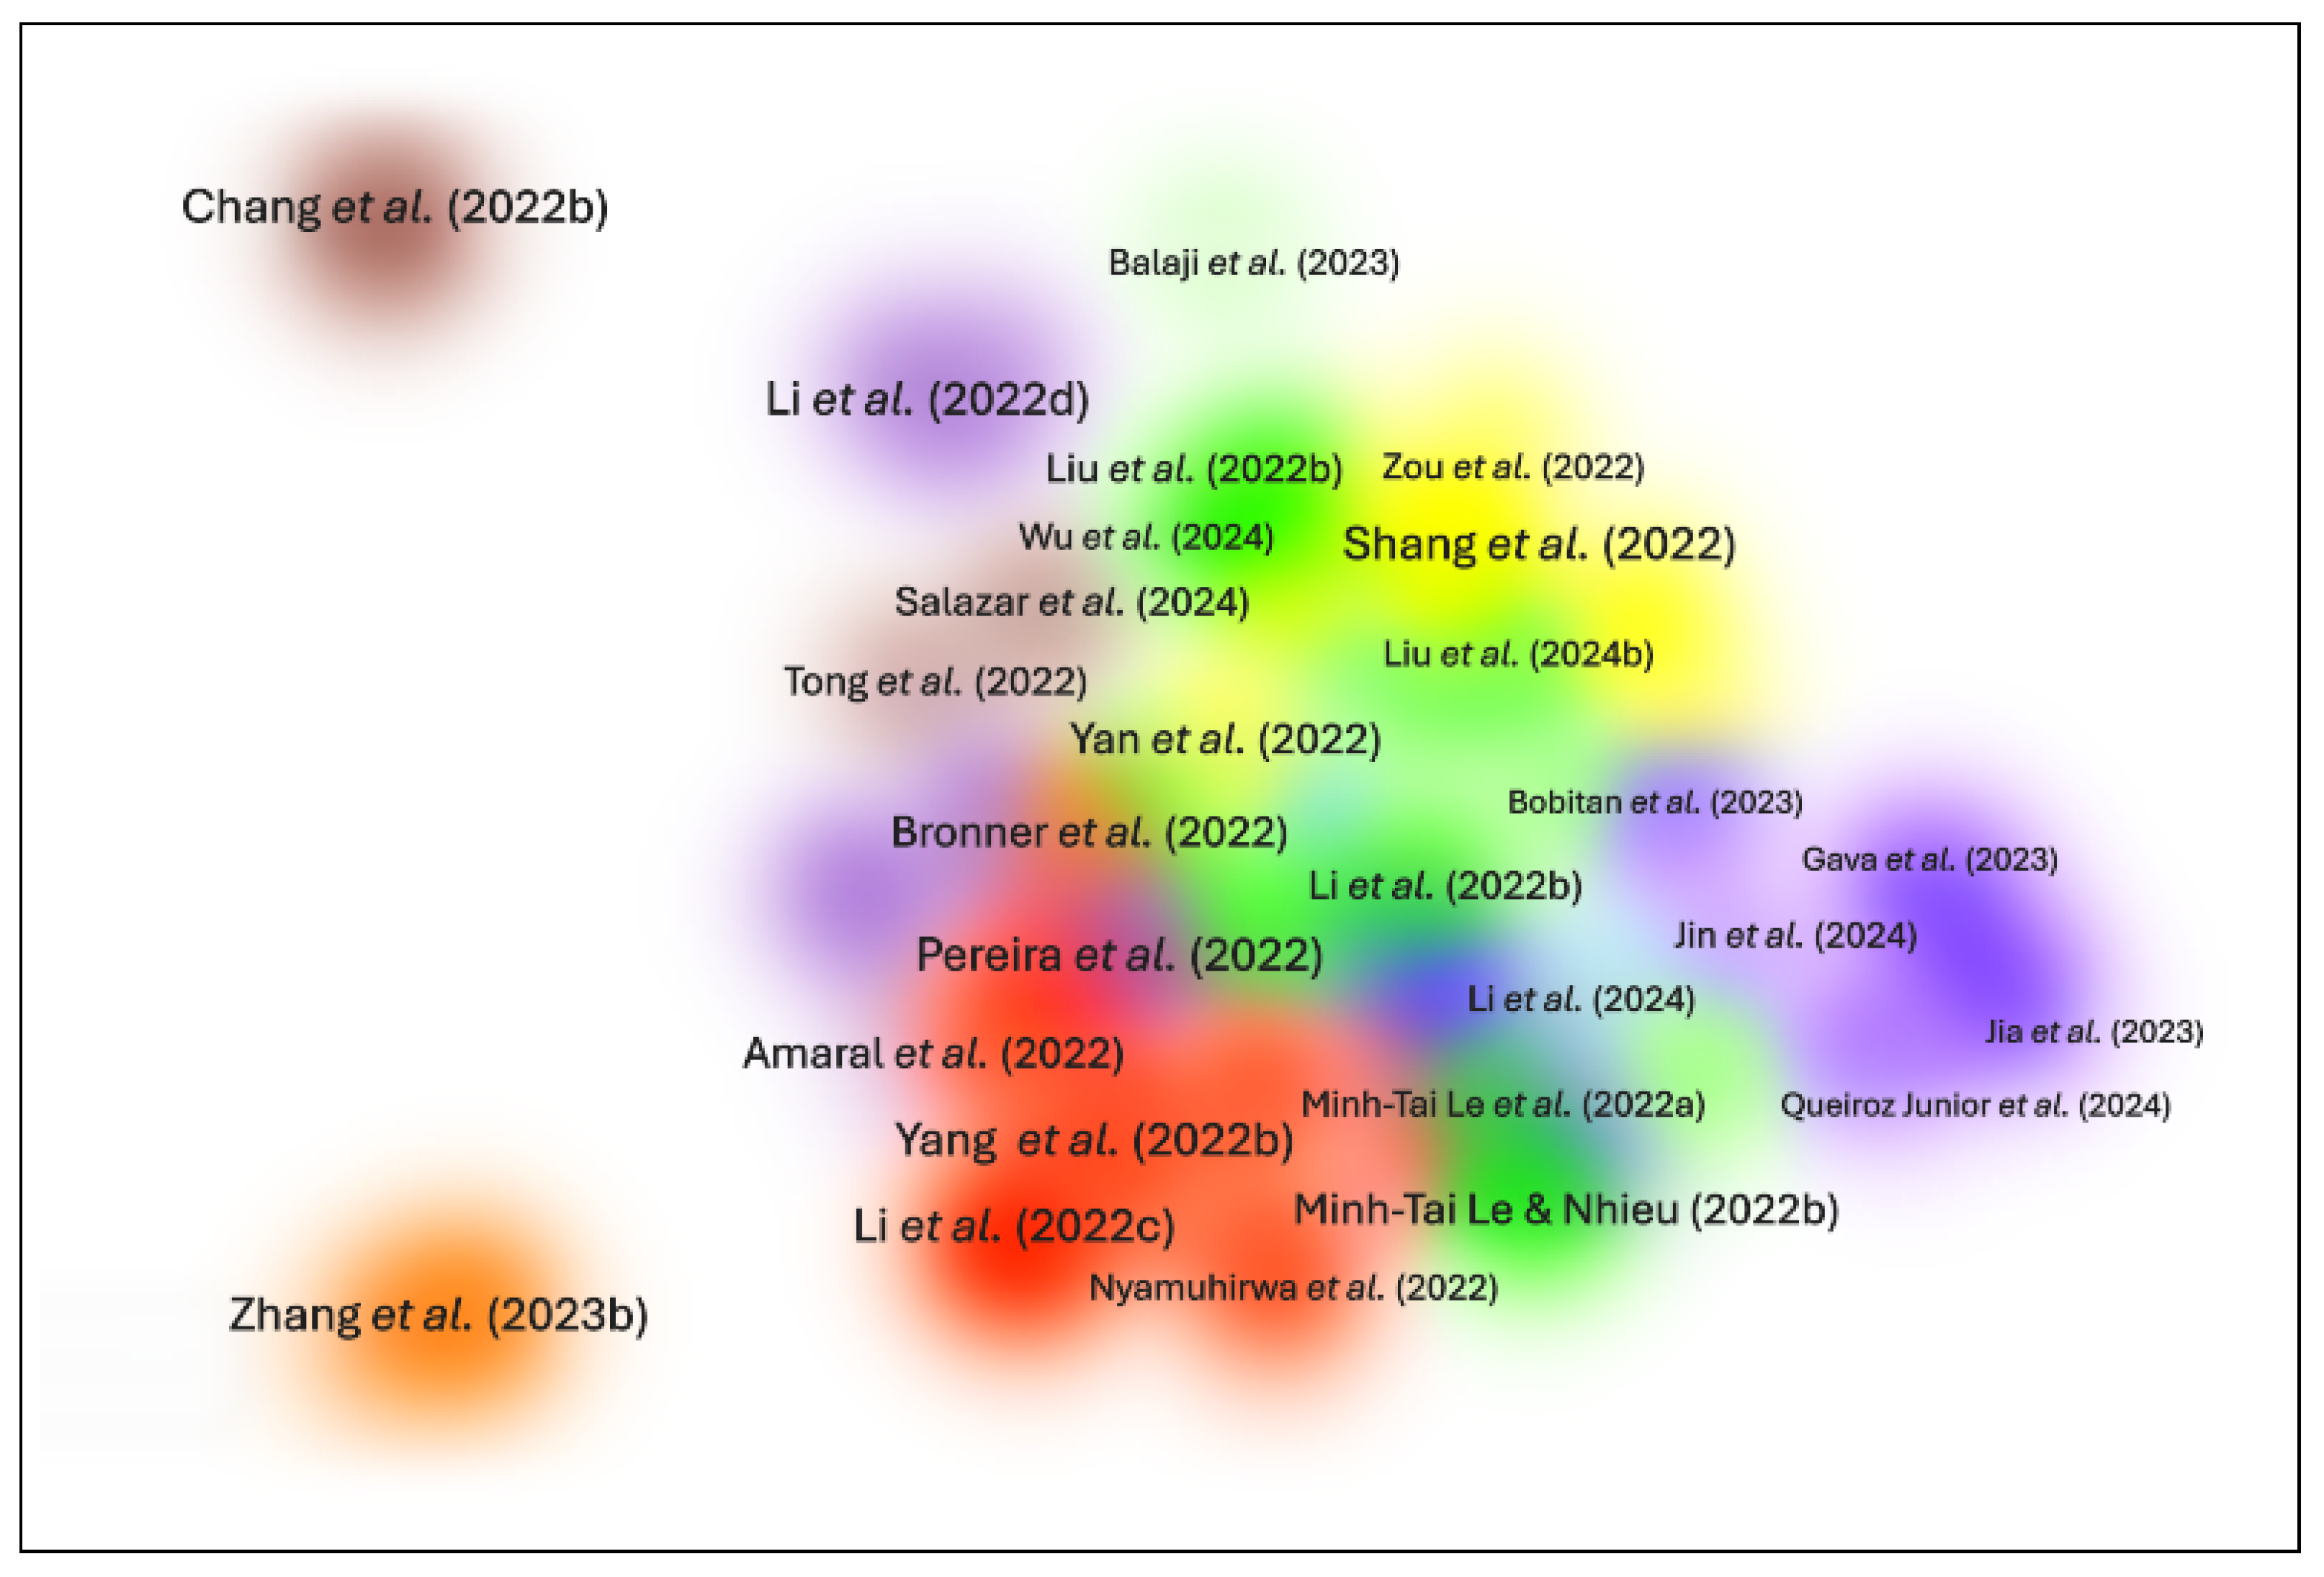
The query yielded 129 articles, which were used to conduct co-citation and bibliographic coupling analyses to identify relevant thematic clusters and shared theoretical foundations, respectively. A summary of the articles most closely aligned with this research was also elaborated. Figure 1 presents the results obtained from the co-citation analysis using the documents retrieved.
Four major clusters were identified from the search, each associated with a specific contribution. The red cluster brings together fundamental studies on DEA. Ref. [11] introduces the CCR model, establishing it as a method for measuring efficiency in units with multiple inputs and outputs. Ref. [12] improves this approach with the slacks-based measure (SBM), which directly addresses inefficiencies in inputs and outputs. Complementarily, ref. [13] proposes a three-stage model that adjusts inputs or outputs to account for environmental effects and statistical noise.
Moreover, the purple cluster includes articles on productivity measurement with a focus on Malmquist indexes. Ref. [14] develops a theoretical foundation for comparing inputs, outputs, and productivity under different production structures, linking Malmquist and Törnqvist indexes, while ref. [15] applies the Malmquist index to analyze productivity growth in 17 Organisation for Economic Co-operation and Development (OECD) countries, decomposing it into technical change and efficiency change.
The green cluster presents contributions on the use of DEA for evaluating sustainability in specific sectors. Ref. [16] proposes a DEA model for intermediate networks, focusing on efficiency and technological inequality, in order to evaluate three stages of the sustainability system: economic growth, environmental protection, and health promotion in Chinese provinces. In contrast, ref. [17] applies DEA to analyze the performance of energy industries, addressing the challenge of balancing economic development with environmental protection.
Lastly, the yellow cluster explores the historical evolution of DEA in different areas. Ref. [18] reviews 40 years of DEA development, discussing its popular models, advantages, limitations and applications, as well as conducting a bibliometric analysis of publication trends. On the other hand, ref. [19] reviews the literature from 2017 to 2020, emphasizing the growing use of DEA to measure sustainability, but pointing out the underrepresentation of the social dimension of sustainability and the use of proxy indices as incomplete substitutes for a multidimensional sustainability assessment.
Based on these observations, the obtained clusters suggest that the main research lines have been built upon classical pioneering works in efficiency and productivity analysis. Current work lies in the application of DEA to specific sectors, with ongoing efforts to refine the original methods through the integration of new tools and frameworks.
Furthermore, Figure 2 displays the results derived from the bibliographic coupling analysis of the selected articles.
Through that analysis, six major clusters were detected. The yellow cluster includes studies on the use of DEA to analyze sustainable performance in specific areas. Ref. [20] investigates how environmental regulations influence the performance of the circular economy in China, showcasing that regulation mainly promotes performance through a catch-up effect. Ref. [21] applies DEA to measure eco-efficiency in the tourism sector in Gansu, revealing that hotels are the largest contributors to carbon emissions. Meanwhile, ref. [22] uses DEA to assess the efficiency of industrial pollution control in Chinese provinces. The authors highlight regional differences while also suggesting improvements in efficiency.
Building on that, the green cluster focuses on efficiency in sustainable technologies and green logistics. Ref. [23] proposes an integrated DEA-SBM approach with projection analysis to assess the performance of green technology R&D in China. Ref. [24] develops a model to analyze efficient locations for renewable energy installations in Vietnam. Meanwhile, ref. [25] evaluates green logistics efficiency in northwest China, highlighting regional differences and proposing strategies to support carbon emission reductions.
The purple cluster seeks to evaluate the impact of different policies and technologies on efficiency and sustainability across various contexts. Ref. [26] analyzes regional differences in traffic restriction policies in China, suggesting dynamic adjustments towards sustainable economic development. In contrast, ref. [27] focuses on strategies for reusing water and substrates in Mediterranean greenhouses, aiming to promote eco-efficiency and agricultural profitability.
Moving further, the red cluster focuses on evaluating efficiency in key sectors such as energy, tourism, and sustainable financing. Ref. [28] investigates the financing efficiency in China’s energy and environmental protection industry, focusing mainly on digital transformation and technological innovation perspectives. Ref. [29] analyzes tourism efficiency in China, identifying patents and government control as key efficiency factors, while ref. [30] proposes a model to assess the performance of the Chinese energy supply chain, aligned with the carbon neutrality and peak emission goals.
Complementarily, the brown cluster focuses on assessing efficiency in sectors related to agriculture and industry, with an emphasis on sustainable practices and its impacts. Ref. [31] analyzes the effect of off-farm employment on agricultural production efficiency in China, pointing out the negative impacts of self-employment, especially at lower levels of off-farm employment. On the other hand, ref. [32] examines environmental efficiency in the salmon industry in Chile, observing an improvement in environmental efficiency after the implementation of stricter regulations following the ISA virus outbreak.
Finally, in the orange cluster, ref. [33] analyzes the cost efficiency in rapeseed production in Hunan, China, using DEA. The study shows that all technical, allocative and cost efficiencies have room for improvement. The authors point out that expanding farmers’ operations may increase efficiency, but it would also lead to negative environmental impacts.
The clusters from coupling highlight how DEA and sustainability have been combined in recent years. The studies predominantly assess various facets of the sustainability domain applied to different sectors, such as energy, tourism and agriculture. Additionally, other studies focus on determining the impact of isolated factors on improving specific indicators and/or productivity, as well as enhancing decision-making through the combination of different multi-criteria methods.
Finally, a summary of the previous work most closely aligned with this study is organized in Table 1.
Although the analyzed studies advance the application of DEA to assess efficiency and resource allocation towards sustainability, some limitations persist. The model proposed by [36] relies on some subjectively measured variables, which may introduce potential biases in its evaluation. Similarly, the approach of [37], despite being robust, employs 15 distinct variables, which compromises its generalizability. Meanwhile, ref. [40] is limited by the scope of its sample by using the project’s covered area as one of the selected inputs, whereas ref. [23,35] prioritize metrics such as publications, patents, and energy consumption, neglecting direct social impacts.
In light of these limitations, this study seeks to differentiate itself by proposing an objective approach with few parameters, focused on optimizing the allocation of managerial resources. This characteristic facilitates its application in different contexts, enabling the extraction of practical decision-making insights through its replication.

3. Methodology

This applied research adopts a quantitative case study approach that utilizes data collected from project reports available on UnB’s central online platform, along with supplementary information gathered through direct contact with project coordinators. The obtained data underwent a rigorous processing phase, including an iterative outlier removal and normalization procedure to ensure comparability across different scales and mitigate potential biases. Additionally, linear correlation analyses were conducted to examine the interrelationships among the variables.
With the processed data, the model’s return to scale and orientation were adjusted to align with the study’s objectives and the specific characteristics of the dataset. Finally, the bootstrap technique was applied to enhance the reliability and robustness of the results.

3.1. Model Selection

This study adopts a technical efficiency perspective, considering the use of DEA. This method allows a suitable comparison of the studied initiatives based on their inputs and outputs, as it has been an extensively used solution for combining economic, environmental, and social indicators with different units within the sustainable domain [41,42].
DEA was chosen over alternative methods such as Stochastic Frontier Analysis (SFA) for several reasons. Although SFA assumes a stochastic structure that allows deviations from the efficiency frontier to reflect both inefficiencies and random noise—an advantage in studies with smaller datasets or measurement uncertainty—it is a parametric approach. As such, SFA requires the specification of a functional form for the production frontier and makes additional assumptions about the structure of the production possibility set and the data-generating process [43]. These assumptions can constrain model flexibility and introduce specification bias in complex, multi-dimensional contexts.
In contrast, DEA is a non-parametric method that does not require predefined functional forms or statistical distributions [19]. It also allows each Decision-Making Unit (DMU) to be evaluated under the most favorable set of weights for its own input-output configuration, enabling a more adaptable and equitable assessment across heterogeneous initiatives.

3.2. Variables Selection

Six complementary variables were selected for the analysis based on their availability, accuracy and relevance to the study. Team size (TS), project budget (B), and workload (W) were considered as inputs, while the amount of published papers (PP) and the number of beneficiaries (NB) were treated as outputs. Table 2 summarizes the variables selected.
The decision to lean the input variables toward a managerial perspective was adopted as an alternative to allow flexible application to projects with different focuses. Concurrently, the output variables were selected to assess both the social impact of the initiatives, measured by the number of people that were benefited, and the scientific contribution, taking into account the academic context in which the sampled projects are situated.

3.3. Data Gathering

The study population comprises all STEM projects associated with sustainability at UnB. To ensure the consistency and comparability of the selected projects, specific inclusion and exclusion criteria were established. Only projects completed between 2020 and 2023 were included, while those associated with junior enterprises, athletic organizations, student chapters, research groups, and competition teams were excluded.
The data for this study were collected through the Integrated System for Academic Activity Management (SIGAA), UnB’s central platform for managing academic processes such as enrollment, grade submission, and communication between students and professors. By applying the filters “Engineering”, “Project”, and “Sustainability”, a detailed list of relevant projects was generated. This list included official project reports on team size, workload, and the number of beneficiaries. Additional data, such as the number of published papers and project budget, were obtained through direct contact with project coordinators, as these details were not available in the SIGAA reports.

3.4. Outlier Detection

Initially introduced by [44] for ranking efficient DMUs, the super-efficiency DEA model allows for efficiency scores greater than 1 by excluding the evaluated DMU from its own reference set. This formulation enables a more nuanced differentiation among efficient units, while inefficient DMUs retain the same scores as in the standard DEA model [45].
In this context, the super-efficiency model also offers a practical mechanism for identifying potential outliers, particularly due to the broader variation it permits in efficiency scores [46]. Accordingly, an iterative procedure was applied to detect and eliminate outliers based on the Interquartile Range (IQR) method. In each iteration, DMUs with super-efficiency scores falling outside the range defined by Q 1 1.5 × IQR or Q 3 + 1.5 × IQR were considered outliers and removed. Here, Q 1 and Q 3 denote the first and third quartiles of the super-efficiency score distribution, respectively, and IQR is the interquartile range, calculated as IQR = Q 3 Q 1 . This process was repeated for three iterations to ensure consistency and robustness in the final dataset. As a result, a total of three projects were identified as outliers and excluded, yielding a final analytical sample of 20 projects. The original dataset and full list of DMUs can be found in Appendix A, Table A1.

3.5. Return to Scale

Ref. [47] emphasizes the importance of understanding the nature of returns to scale for the correct application of the DEA model. Significant distortions in results can arise from incorrect assumptions about returns to scale, potentially leading to losses in statistical efficiency. In this context, the authors propose calculating scale efficiency as:
θ ^ E = p = 1 r θ ^ r , CRS p = 1 r θ ^ r , VRS
where θ ^ E 1 , θ ^ CRS is the constant return to scale efficiency, and θ ^ VRS is the variable return to scale efficiency.
In scenarios where θ ^ E is approximately equal to 1, it is understood that constant returns to scale (CRS) are most appropriate for the data. Conversely, a value significantly lower than 1 may suggest the behavior of variable returns to scale (VRS). For the analyzed sample, θ ^ E 0.69 for the original data and θ ^ E 0.77 after the removal of outliers. Given the value being relatively close to 1, the constant returns to scale (CRS) model was adopted.

3.6. Model Orientation

Furthermore, the study explored input orientation through the lens of an isoquant curve, which illustrates all combinations of productive factors that yield the same level of output. By considering the minimum combination of resources on this curve to achieve a specific level of system output, it becomes possible to delineate the frontier defining the efficient set of combinations [48]. From this perspective, the focus shifts to reducing resource usage across projects while maintaining the same output level.

3.7. Bootstrap

A well-recognized limitation of conventional DEA is its deterministic nature, which assumes that all deviations from the estimated frontier are solely due to inefficiency, overlooking the uncertainty inherent in frontier estimation and sample variability. This assumption can lead to biased efficiency estimates, especially in smaller or noisy datasets. To mitigate this limitation, bootstrapping techniques have been introduced as statistically robust extensions to DEA, enabling bias correction and the construction of confidence intervals for efficiency estimates [49,50,51,52]. These techniques simulate a sampling process by applying the original estimator, ensuring that the simulation replicates the original sample through a Data Generating Process (DGP). The method involves repeated resampling, executed across multiple iterations [53]. In this study, the final results were based on 1000 resamplings, with a significance level ( α ) set at 0.05.

4. Results

This section begins by analyzing the profiles of the projects included in the sample, with particular attention to the relationships among the selected variables and their underlying characteristics. It then presents the application of DEA to assess project efficiency, incorporating a bootstrap approach to improve the robustness and reliability of the results.

4.1. Projects Profile

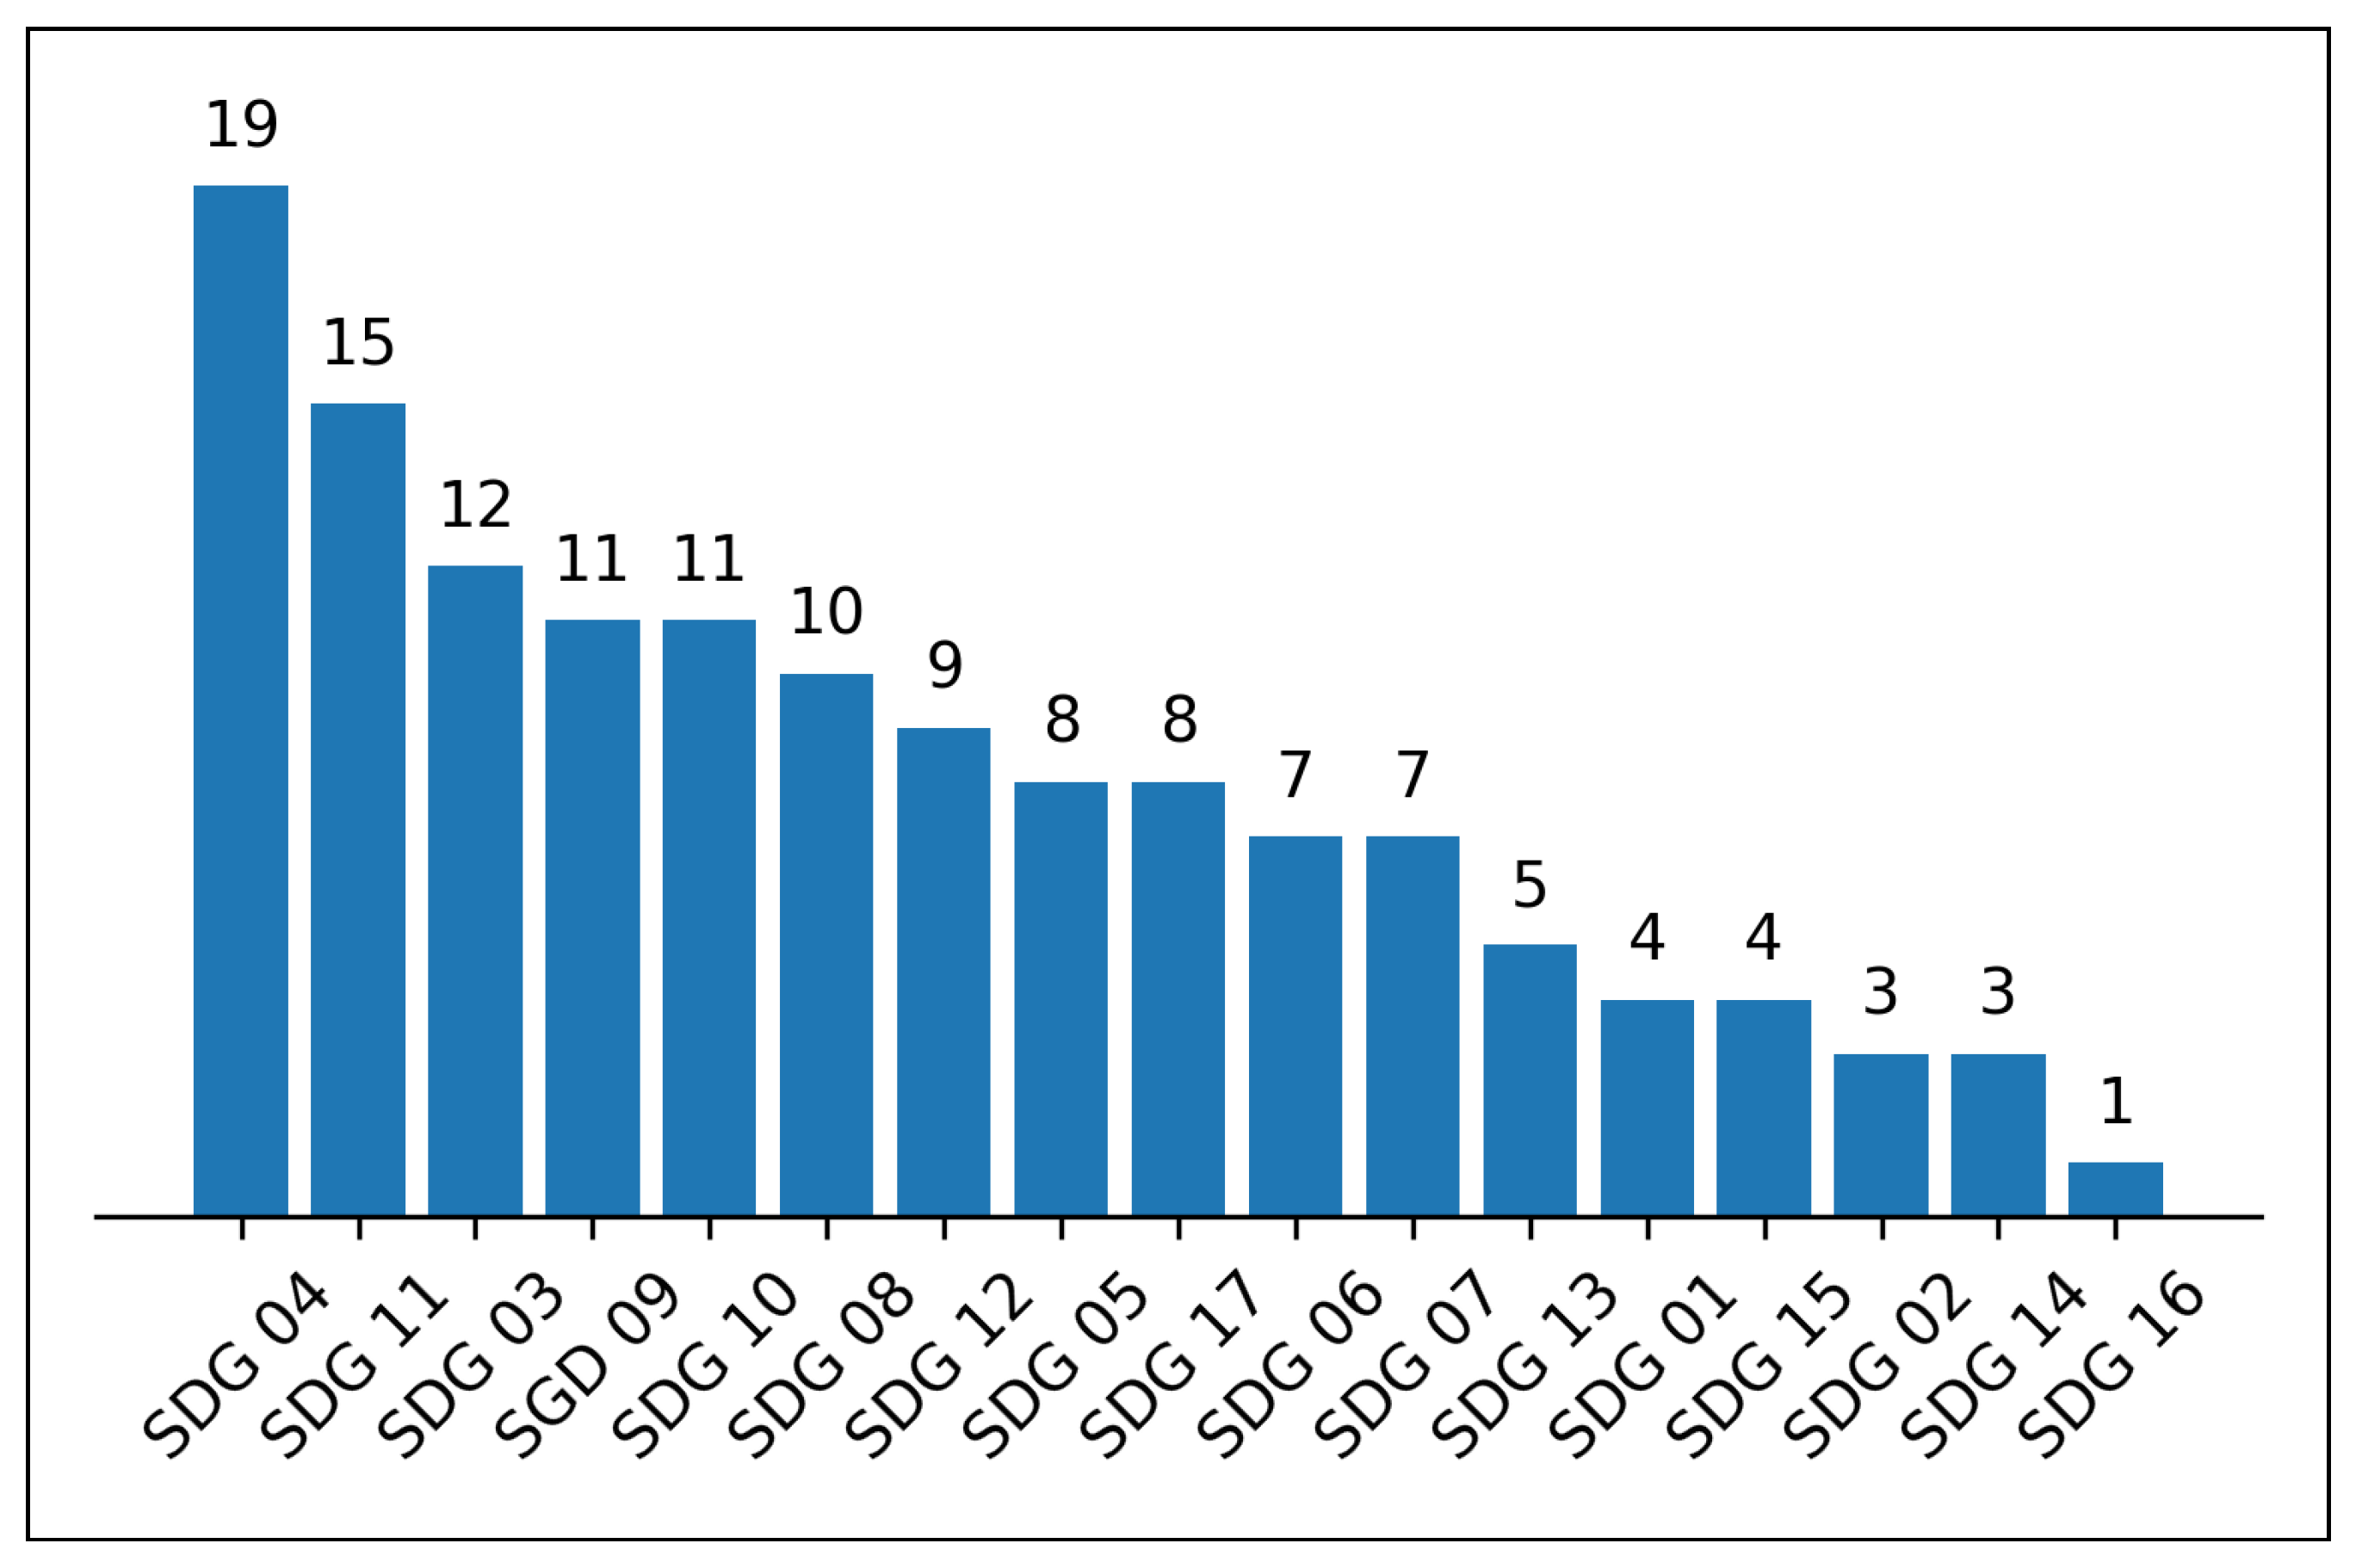
To identify the priorities of action within the evaluated projects, a count of mentions for the different SDGs was conducted. Figure 3 illustrates the findings of this analysis.
As observed, SDG 4 (Quality Education) appeared as the most popular goal among the sampled projects, with a total of 19 citations. Given that the projects originate from a higher education institution, it is reasonable to highlight the emphasis on education, particularly regarding the experiences offered to project participants. Following closely is SDG 11 (Sustainable Cities and Communities), with 15 mentions, which focuses on making cities and communities more inclusive, resilient, and sustainable. Third, SDG 3 (Good Health and Well-Being) is highlighted, emphasizing access to quality healthcare and the promotion of overall well-being.
Conversely, SDG 16 (Peace, Justice, and Strong Institutions), SDG 14 (Life Below Water), and SDG 2 (Zero Hunger and Sustainable Agriculture) were the least addressed, with 1, 3, and 3 mentions, respectively. This pattern may be attributed both to the disciplinary focus of the projects—predominantly rooted in STEM fields—and to the local context in which they were developed. Given that the university is situated in a highly urbanized region with limited agricultural activity and no direct access to marine environments, topics such as food security and marine ecosystems are naturally less prominent. Additionally, themes like institutional governance often align more closely with the social sciences and policy studies, which fall outside the methodological scope of most engineering and technology teams.
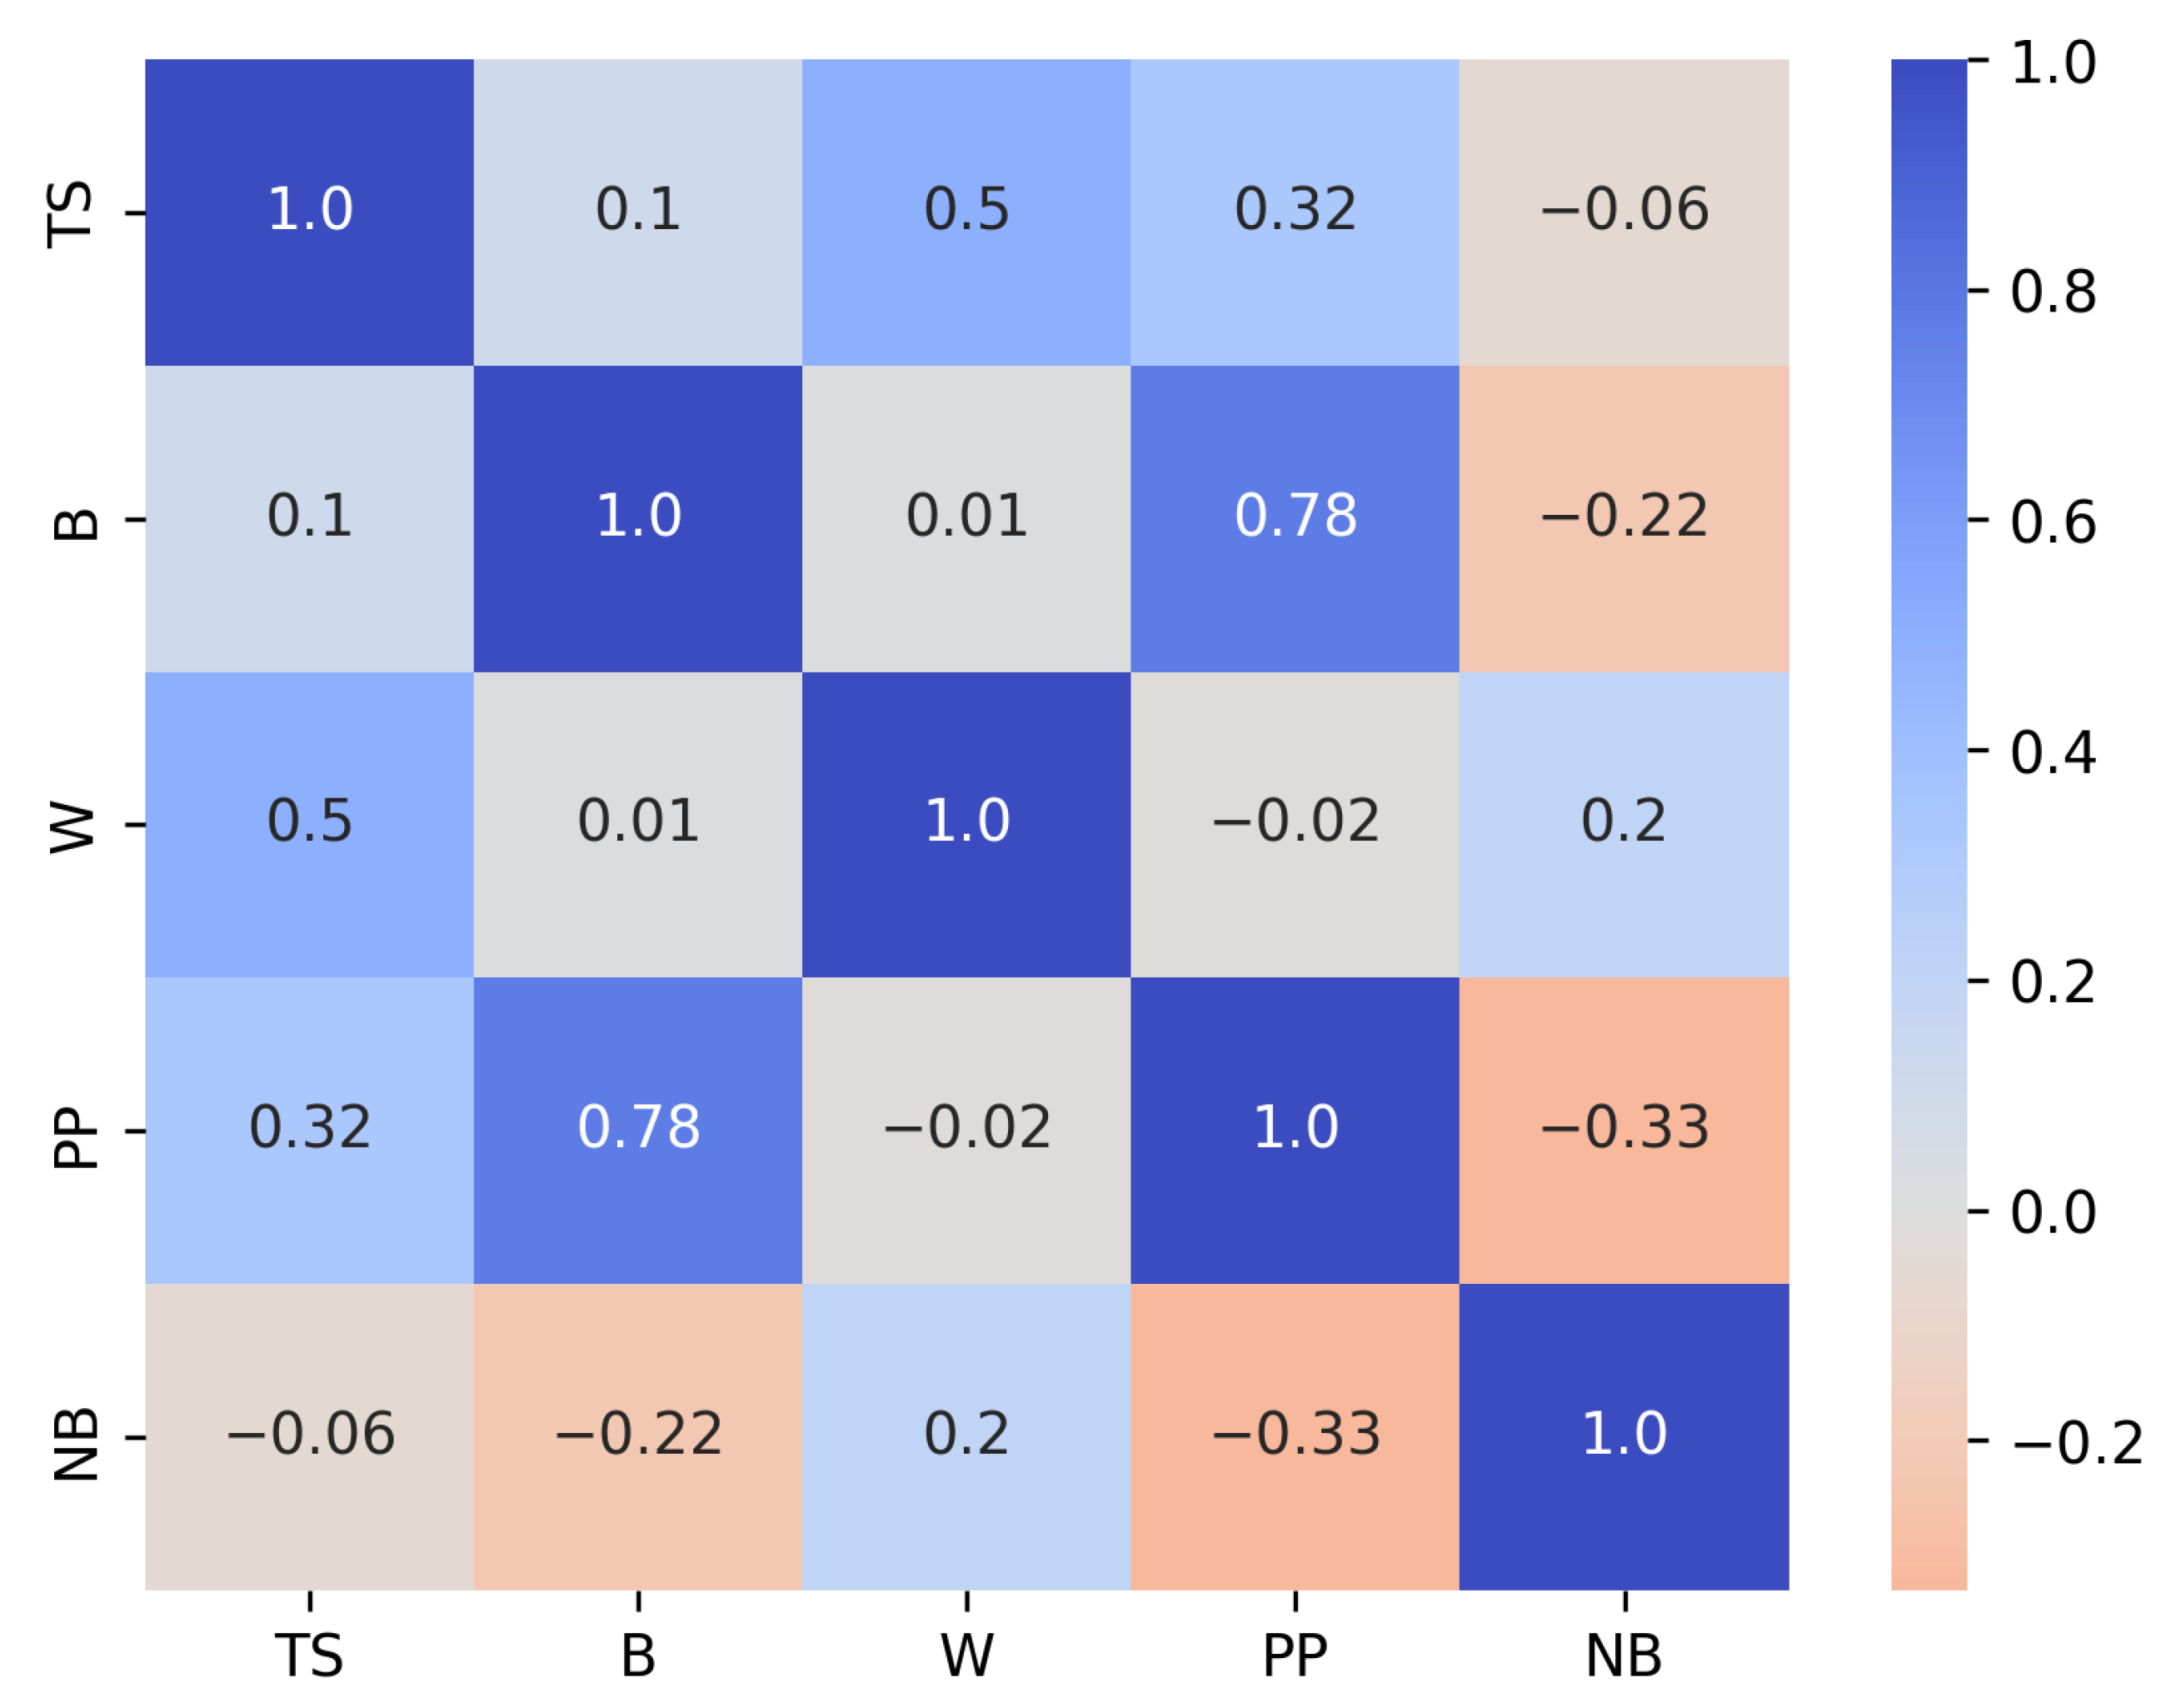
In order to complement this descriptive overview, a quantitative analysis was conducted to examine the relationships between the model’s inputs and outputs. Specifically, Pearson correlation coefficients were calculated to assess the degree of linear association among the variables, as illustrated in Figure 4. For clarity, the following acronyms are used: TS (team size), B (budget), W (workload), PP (number of published papers), and NB (number of beneficiaries).
The results indicate that projects with higher publication volumes are generally associated with larger budgets, as evidenced by a strong positive correlation between these variables (r = 0.78). In contrast, the number of beneficiaries showed a weak negative correlation with the budget ( r = 0.22 ), suggesting that increased financial resources do not necessarily translate into broader reach. Overall, no significant correlations were found between the selected input variables and the number of beneficiaries. Moreover, the two output variables—publications and number of beneficiaries—exhibited a weak negative correlation ( r = 0.33 ), implying a possible trade-off, where prioritizing one output may occur at the expense of the other. This dynamic may be partially explained by institutional incentives: academic researchers are typically evaluated based on publication volume, while there are no standardized indicators or formal mechanisms in place to assess how many people have been impacted by their work. Consequently, outreach and real-world impact may receive less strategic emphasis in project execution.
Finally, team size and workload were moderately correlated ( r = 0.50 ), which is likely due to the direct relationship between the number of team members and the total hours invested in a project.
After establishing an initial understanding of the project profiles and the selected variables, the analysis proceeded with the application of the DEA model.

4.2. Bootstrap DEA Application

Table 3 presents the efficiency scores for each evaluated DMU, which have been anonymized for privacy reasons. It includes both bias-corrected efficiency scores generated by the bootstrapping technique and the corresponding 95% confidence intervals for each project’s efficiency score. The following abbreviations were used for the departments within the sample: Department of Electronic Engineering (EEL), Department of Civil Engineering (ENC), Department of Energy Engineering (EEN), Department of Mechanical Engineering (ENM), Department of Electrical Engineering (ENE), Department of Production Engineering (EPR), Department of Automotive Engineering (EAU), Department of Mathematics (MAT), and Department of Collective Health (DSC).
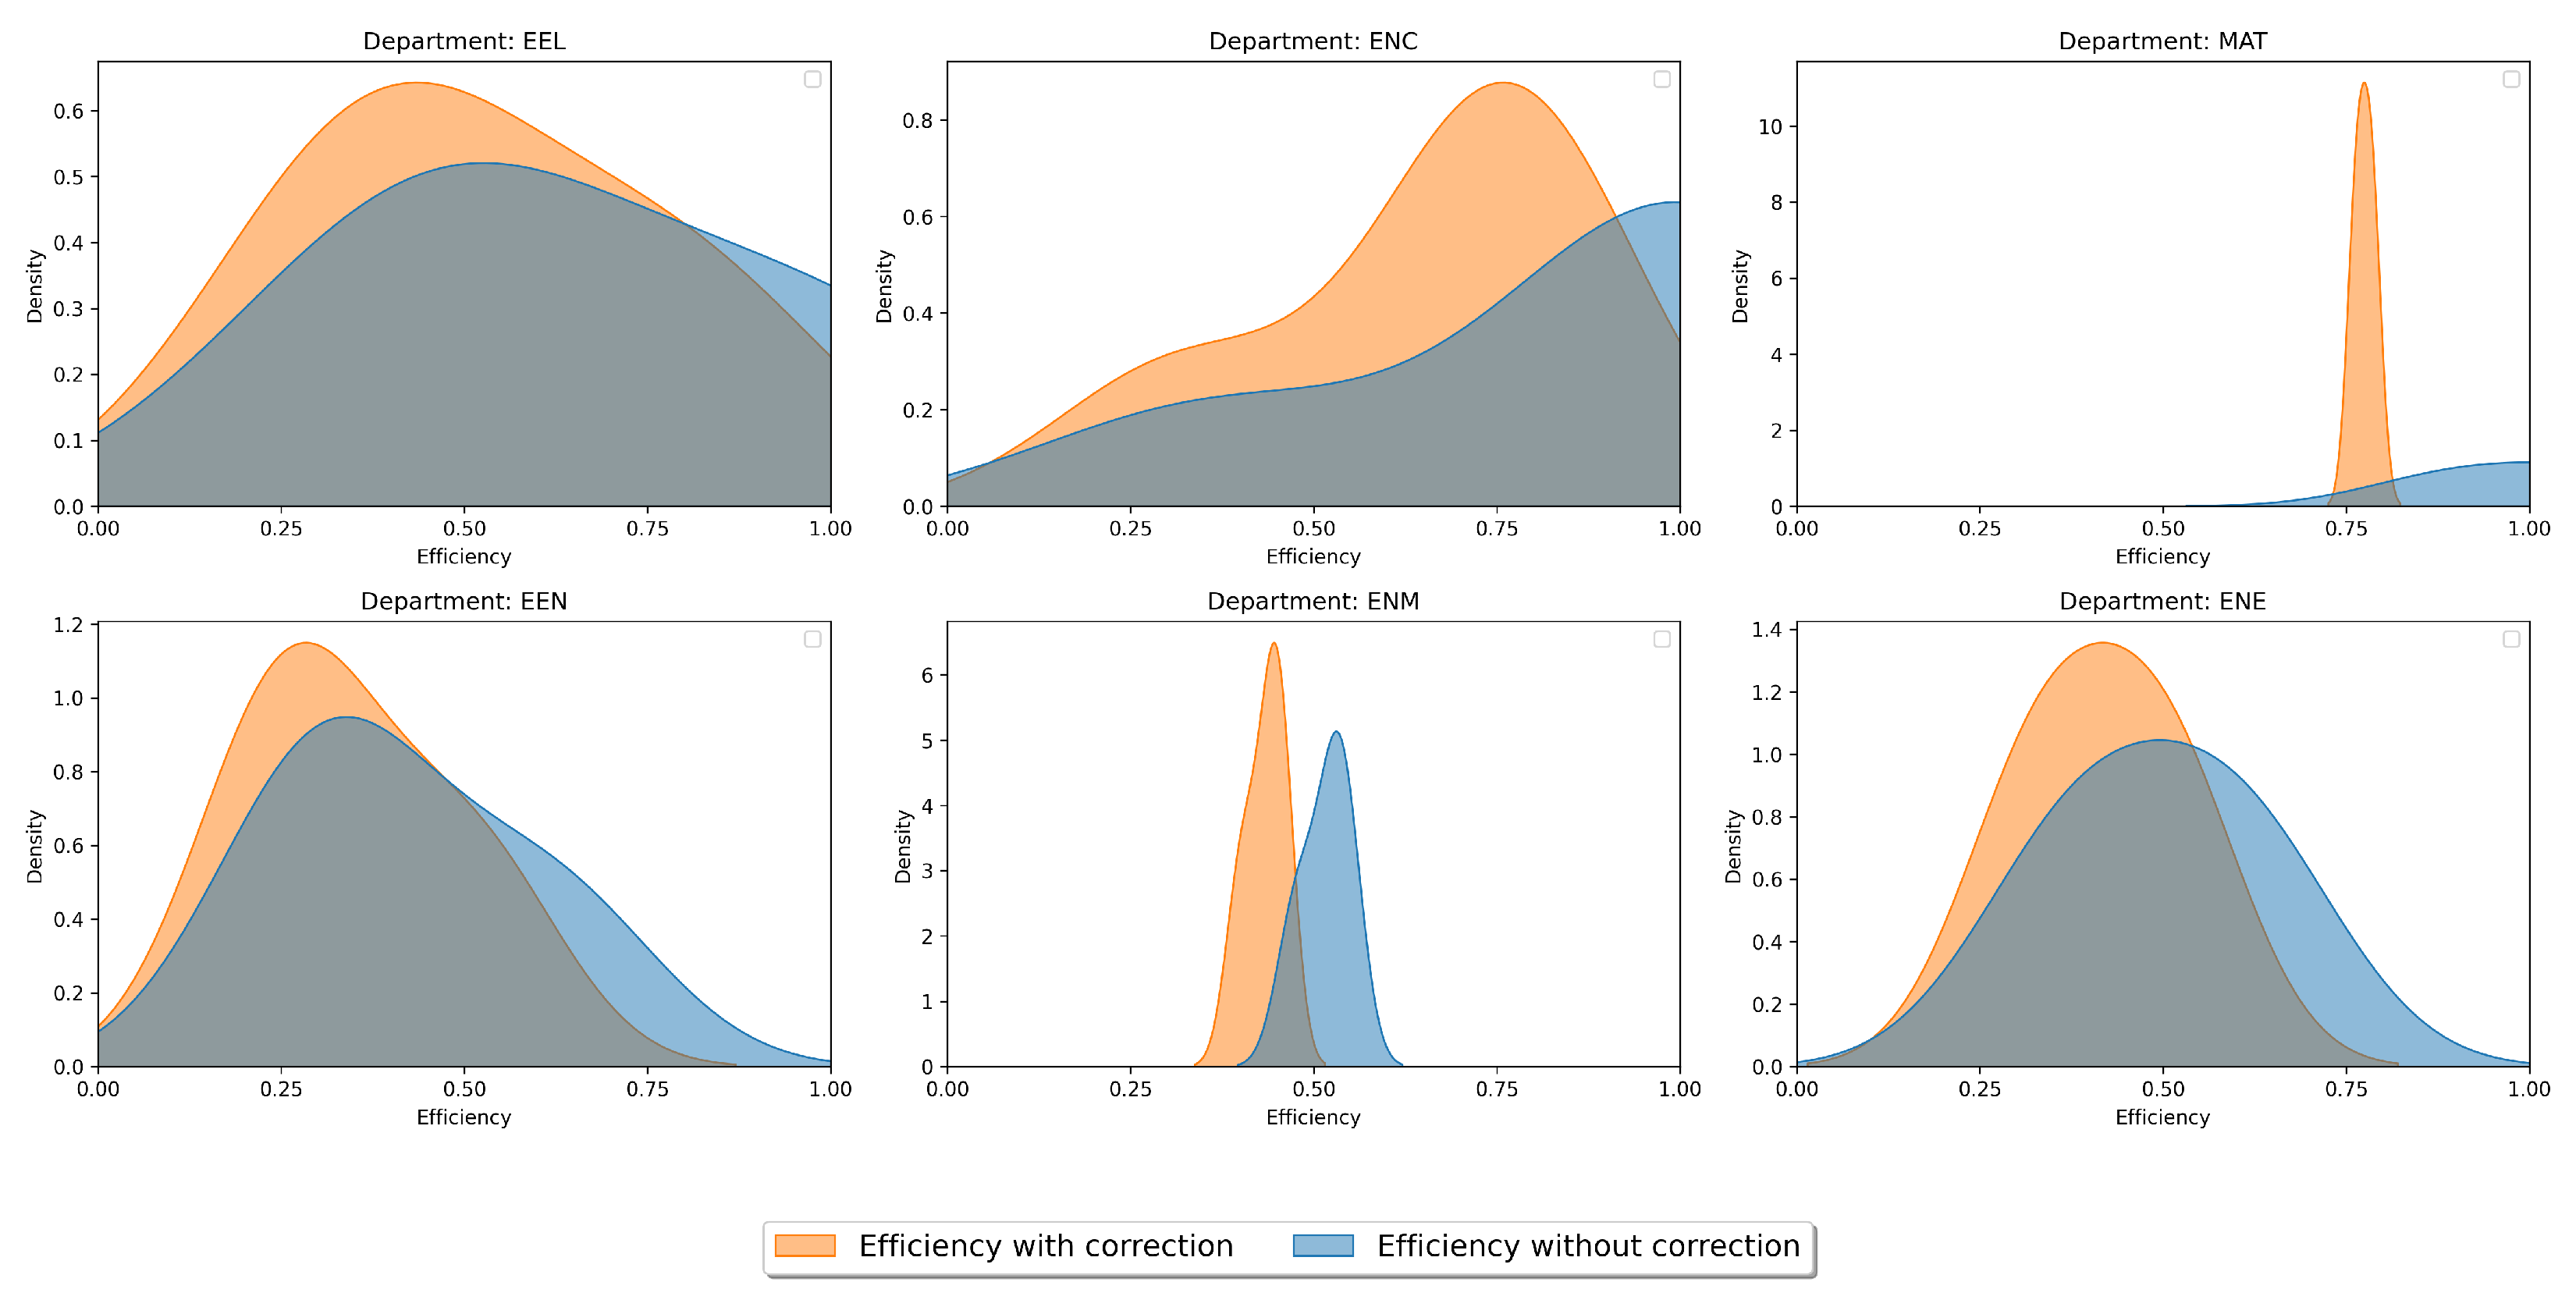
Building on the results presented above, the performance of the various university departments included in the sample was compared based on its distribution patterns. Figure 5 presents density plots illustrating the performance of departments that were associated with more than one project.
Table 3 and Figure 5 reveal that the EEL, ENM, and ENE departments exhibit peak frequencies with efficiency scores around 0.5, while ENC and MAT stand out with the highest efficiency peaks, approximately 0.75. In contrast, the EEN department presents the lowest concentration of efficiency scores, peaking near 0.25. The DSC, EPR, and EAU departments, each represented by a single project, recorded approximate efficiency scores of 0.76, 0.72, and 0.57, respectively, as also summarized in Table 3.
Subsequently, an analysis of input and output slacks across the DMUs was conducted. The optimal objective value ( B ) serves as an indicator of potential input excesses or output shortfalls [12]. Table 4 presents the percentage slack for each variable and DMU, based on their distance from the efficiency frontier. The absolute target values required to eliminate inefficiencies—through input reductions or output increases—are provided in Appendix B, Table A2.
Based on the slack evaluation presented in Table 4, DMU 16 demonstrated the most significant need for input reduction to reach the efficiency frontier. Specifically, it requires a 53.9% reduction in team size (TS) and a 7.5% increase in the number of beneficiaries (NB). For DMU 9, the recommendations include an 8.1% reduction in TS and a 21.7% decrease in workload (W). DMU 18 is advised to reduce W by 11.8%, while for DMU 10, a 9.4% reduction in TS is deemed optimal. These projects represent those requiring the most substantial adjustments to achieve efficiency.
Although a 53.9% reduction in team size may appear drastic, qualitative insights into the operational structure of DMU 16 suggest that the project exhibits significant inefficiencies and potential overstaffing. The recommendation should be interpreted as an indication of underutilized human resources rather than a strict prescription. Still, any major reorganization should be approached cautiously to prevent overburdening remaining team members or disrupting project continuity.
The following section provides a more detailed analysis of these findings, exploring their significance and broader implications for the efficiency of the evaluated projects.

5. Discussion

The results reveal several important insights that merit further exploration. As this case study is situated within a STEM-focused context at UnB, the prioritization of SDGs may reflect both disciplinary emphases and locally specific constraints or incentives. It is likely that SDG engagement varies across academic programs and institutions, shaped by factors such as funding availability, institutional priorities, and the thematic orientation of each field of study. These findings underscore the importance of considering contextual variables when analyzing how sustainability agendas are adopted and operationalized in academic settings.
Additionally, the observed focus on academic publications over broader societal impact may reflect the current academic evaluation systems, where publications are typically seen as more tangible and quantifiable indicators of success. While measuring social outcomes can indeed present challenges, particularly when compared to more straightforward metrics like publication count, this does not preclude the possibility of assessing such impacts. However, it is often more complex and less standardized [10,19]. This tendency to prioritize publication volume might inadvertently create an imbalance between academic achievements and societal contributions. Recognizing both dimensions in evaluation processes may help promote a more comprehensive approach to assessing research, one that values scholarly output alongside its potential societal benefits.
Furthermore, the interpretation of the slack analysis results warrants thoughtful consideration. Although most deviations identified were relatively minor, any changes over current structures should be addressed with caution. As such, the findings presented in Table 4 should be viewed not as definitive conclusions, but rather as prompts for critical reflection and continuous improvement in the internal organization of the evaluated projects.
In practical terms, this study offers a deeper understanding of the structural and contextual challenges faced by sustainability-focused STEM projects at UnB. Moreover, it proposes concrete avenues for enhancing resource efficiency, thereby contributing to the institutional pursuit of the SDGs. The positive correlation identified between project budgets and publication output ( r = 0.78 ) suggests that financial investment can enhance academic dissemination, reinforcing the importance of strategic funding allocation.
While the limited sample size precludes generalization to the broader higher education landscape, this case study provides a replicable and adaptable framework for evaluating the efficiency of sustainability projects in academic settings. It contributes to the ongoing discourse on how universities can assess their contributions to sustainable development using objective, data-driven techniques. As such, the findings may inform institutional strategies not only at UnB but also in other faculties or universities seeking to align performance assessment with the principles of sustainability through the lens of resource allocation optimization.

6. Final Considerations

The study successfully achieved its primary goal of evaluating the efficiency of sustainability-focused STEM initiatives at the University of Brasilia. By assessing the relative efficiency of the selected projects, the study identified strategies for optimal resource allocation through a flexible and replicable framework that can be adapted to other institutions.
A robust methodology was employed, incorporating an extensive literature review, definition of key variables, data collection from ongoing projects and the application of Bootstrap DEA. This comprehensive approach enabled an objective and adaptable evaluation of the initiatives, highlighting areas for improvement and offering actionable recommendations to enhance their performance.
Research limitations include the unavailability of data from 2024 up to the time the current work was written, as well as the low sample of projects linked to specific departments, making it difficult to observe patterns or to detect tendencies.
For future research, extending this analysis to include additional faculties and universities would provide a more comprehensive view of sustainability practices in higher education, enabling meaningful cross-institutional comparisons. This broader perspective could deepen the understanding of how sustainability is pursued across diverse academic contexts and contribute to advancing global efforts toward sustainable development.

Author Contributions

Conceptualization, T.S.; Literature review, V.O.; Methodology, R.C. and G.S.; Data collection, R.C. and G.S.; Data curation, R.C.; Formal analysis, R.C.; Investigation, R.C.; Writing—original draft, R.C., T.S. and S.M.; Supervision, S.M. All authors have read and agreed to the published version of the manuscript.

Funding

This research was funded by the University of Brasilia (UnB).

Institutional Review Board Statement

Not applicable.

Informed Consent Statement

Not applicable.

Data Availability Statement

The data used to support the findings of this study are available in Appendix A, Table A1.

Conflicts of Interest

The authors declare no conflicts of interest.

Appendix A

Table A1. Original data.
DMUTSBWPPNB
DMU 137$8330.002430150
DMU 219$0.00114001000
DMU 39$4080.0012921183
DMU 413$850.00875262
DMU 522$8500.0033962161
DMU 69$680.0016580750
DMU 78$510.0010000255
DMU 84$1360.00360050
DMU 929$73.1034000400
DMU 1016$170.004800260
DMU 1117$51.001522050
DMU 123$2856.007351500
DMU 1315$22,666.6718201100
DMU 146$0.00115525
DMU 155$68.00555057
DMU 1692$15,164.001952459
DMU 172$51,000.001262100
DMU 1842$13,804.0057620510
DMU 1924$68,000.001680870
DMU 2020$0.001530020
Outlier 112$1071.001360030,000
Outlier 25$0.00109518500
Outlier 33$61,443.382701500

Appendix B

Table A2. Goals per DMU.
DMUTSBWPPNB
DMU 136$8330.002430150
DMU 219$0.00114001000
DMU 39$4080.0012921183
DMU 413$850.00875262
DMU 522$8500.0032172161
DMU 69$680.0016580750
DMU 78$510.009860255
DMU 84$1360.00360050
DMU 927$73.1026620400
DMU 1015$170.004800260
DMU 1117$51.001488050
DMU 123$2856.007351500
DMU 1315$22,666.6718151100
DMU 146$0.00115525
DMU 155$68.00555057
DMU 1642$15,164.001952463
DMU 172$51,000.001262100
DMU 1842$13,804.0050790510
DMU 1924$68,000.001680870
DMU 2019$0.001496020

References

  1. Ebi, K.L.; Vanos, J.; Baldwin, J.W.; Bell, J.E.; Hondula, D.M.; Errett, N.A.; Hayes, K.; Reid, C.E.; Saha, S.; Spector, J.; et al. Extreme weather and climate change: Population health and health system implications. Annu. Rev. Public Health 2021, 42, 293–315. [Google Scholar] [CrossRef]
  2. Brundtland, G.H.; Khalid, M. Our Common Future; Oxford University Press: Oxford, UK, 1987. [Google Scholar]
  3. Zaman, K. Environmental cost of deforestation in Brazil’s Amazon Rainforest: Controlling biocapacity deficit and renewable wastes for conserving forest resources. For. Ecol. Manag. 2022, 504, 119854. [Google Scholar] [CrossRef]
  4. Grupo de Trabalho da Sociedade Civil para a Agenda 2030. VIII Relatório Luz da Sociedade Civil da Agenda 2030; GT Agenda 2030. Gestos-Soropositividade, Comunicação e Gênero: Recife, Brazil, 2024. [Google Scholar]
  5. Geissdoerfer, M.; Savaget, P.; Bocken, N.M.P.; Hultink, E.J. The Circular Economy—A new sustainability paradigm? J. Clean. Prod. 2017, 143, 757–768. [Google Scholar] [CrossRef]
  6. Porter, M.E.; Kramer, M.R. Creating shared value. Harv. Bus. Rev. 2011, 89, 62–77. [Google Scholar]
  7. Sachs, J.D. The Age of Sustainable Development; Columbia University Press: New York, NY, USA, 2015. [Google Scholar]
  8. Curi Filho, W.R.; Wood, T. Avaliação do Impacto das Universidades em Suas Comunidades. Cadernos EBAPE. BR 2021, 19, 496–509. [Google Scholar] [CrossRef]
  9. QS. QS World University Rankings: Sustainability 2024. 2024. Available online: https://www.topuniversities.com/sustainability-rankings?countries=br (accessed on 23 March 2025).
  10. Basheer, N.; Ahmed, V.; Bahroun, Z.; Anane, C. Exploring sustainability assessment practices in higher education: A comprehensive review through content and bibliometric analyses. Sustainability 2024, 16, 5799. [Google Scholar] [CrossRef]
  11. Charnes, A.; Cooper, W.W.; Rhodes, E. Measuring the efficiency of decision-making units. Eur. J. Oper. Res. 1978, 2, 429–444. [Google Scholar] [CrossRef]
  12. Tone, K. A slacks-based measure of efficiency in data envelopment analysis. Eur. J. Oper. Res. 2001, 130, 498–509. [Google Scholar] [CrossRef]
  13. Fried, H.O.; Lovell, C.A.K.; Schmidt, S.S.; Yaisawarng, S. Accounting for environmental effects and statistical noise in data envelopment analysis. J. Product. Anal. 2002, 17, 91–114. [Google Scholar] [CrossRef]
  14. Caves, D.W.; Christensen, L.R.; Diewert, W.E. The economic theory of index numbers and the measurement of input, output, and productivity. Econometrica 1982, 50, 1393–1414. [Google Scholar] [CrossRef]
  15. Färe, R.; Grosskopf, S.; Norris, M.; Zhang, Z. Productivity growth, technical progress, and efficiency change in industrialized countries. Am. Econ. Rev. 1994, 84, 66–83. [Google Scholar]
  16. Zhang, R.; Wei, Q.; Li, A.; Chen, S. A new intermediate network data envelopment analysis model for evaluating China’s sustainability. J. Clean. Prod. 2022, 356, 131845. [Google Scholar] [CrossRef]
  17. Sueyoshi, T.; Goto, M. World trend in energy: An extension to DEA applied to energy and environment. J. Econ. Struct. 2017, 6, 1–23. [Google Scholar] [CrossRef]
  18. Panwar, N.; Olfati, M.; Pant, P.; Snasel, V. Review of the evolution of data envelopment analysis: A bibliometric approach. Sustainability 2022, 14, 2219. [Google Scholar]
  19. Tsaples, G.; Papathanasiou, J. Data envelopment analysis and the concept of sustainability: A review and analysis of the literature. Renew. Sustain. Energy Rev. 2021, 138, 110664. [Google Scholar] [CrossRef]
  20. Shang, Y.; Song, M.; Zhao, X. The development of China’s Circular Economy: From the perspective of environmental regulation. Waste Manag. 2022, 149, 186–198. [Google Scholar] [CrossRef]
  21. Xia, B.; Dong, S.; Li, Z.; Zhao, M.; Sun, D.; Zhang, W.; Li, Y. Eco-efficiency and its drivers in tourism sectors with respect to carbon emissions from the supply chain: An integrated EEIO and DEA approach. Int. J. Environ. Res. Public Health 2022, 19, 6951. [Google Scholar] [CrossRef]
  22. Zou, W.; Zhang, L.; Xu, J.; Xie, Y.; Chen, H. Spatial–temporal evolution characteristics and influencing factors of industrial pollution control efficiency in China. Sustainability 2022, 14, 5152. [Google Scholar] [CrossRef]
  23. Li, G.; Wang, P.; Pal, R. Measuring sustainable technology R&D innovation in China: A unified approach using DEA-SBM and projection analysis. Expert Syst. Appl. 2022, 209, 118393. [Google Scholar]
  24. Le, M.T.; Nhieu, N.L. An offshore wind–wave energy station location analysis by a novel behavioral dual-side spherical fuzzy approach: The case study of Vietnam. Appl. Sci. 2022, 12, 5201. [Google Scholar] [CrossRef]
  25. Qin, W.; Qi, X. Evaluation of green logistics efficiency in Northwest China. Sustainability 2022, 14, 6848. [Google Scholar] [CrossRef]
  26. Li, Y.; Yang, Y.; Luo, G.; Huang, J.; Wu, T. The economic recovery from traffic restriction policies during the COVID-19 through the perspective of regional differences and sustainable development: Based on human mobility data in China. Sustainability 2022, 14, 6453. [Google Scholar] [CrossRef]
  27. Gava, O.; Antón, A.; Carmassi, G.; Pardossi, A.; Incrocci, L.; Bartolini, F. Reusing drainage water and substrate to improve the environmental and economic performance of Mediterranean greenhouse cropping. J. Clean. Prod. 2023, 413, 137510. [Google Scholar] [CrossRef]
  28. Li, B.; Huo, Y.; Yin, S. Sustainable financing efficiency and environmental value in China’s energy conservation and environmental protection industry under the double carbon target. Sustainability 2022, 14, 9604. [Google Scholar] [CrossRef]
  29. Yang, G.; Yang, Y.; Gong, G.; Gui, Q. The spatial network structure of tourism efficiency and its influencing factors in China: A social network analysis. Sustainability 2022, 14, 9921. [Google Scholar] [CrossRef]
  30. Huang, X.; Lu, X.; Sun, Y.; Yao, J.; Zhu, W. A Comprehensive Performance Evaluation of Chinese Energy Supply Chain under “Double-Carbon” Goals Based on AHP and Three-Stage DEA. Sustainability 2022, 14, 10149. [Google Scholar] [CrossRef]
  31. Chang, M.; Liu, J.; Shi, H.; Guo, T. The effect of off-farm employment on agricultural production efficiency: Micro evidence in China. Sustainability 2022, 14, 3385. [Google Scholar] [CrossRef]
  32. Salazar, C.; Cárdenas-Retamal, R.; Jaime, M. Environmental efficiency in the salmon industry—An exploratory analysis around the 2007 ISA virus outbreak and subsequent regulations in Chile. Environ. Dev. Sustain. 2023, 25, 8107–8135. [Google Scholar] [CrossRef]
  33. Zhang, Q.; Razzaq, A.; Qin, J.; Feng, Z.; Ye, F.; Xiao, M. Does the expansion of farmers’ operation scale improve the efficiency of agricultural production in China? Implications for environmental sustainability. Front. Environ. Sci. 2022, 10, 918060. [Google Scholar] [CrossRef]
  34. Feng, J.; Wang, N.; Sun, G. Measurement of innovation-driven development performance of large-scale environmental protection enterprises investing in public–private partnership projects based on the hybrid method. Sustainability 2022, 14, 5096. [Google Scholar] [CrossRef]
  35. Han, S.; Park, S.; An, S.; Choi, W.; Lee, M. Research on Analyzing the Efficiency of R&D Projects for Climate Change Response Using DEA–Malmquist. Sustainability 2023, 15, 8433. [Google Scholar] [CrossRef]
  36. Ebnerasoul, M.; Ghannadpour, S.F.; Haeri, A. A collective efficacy-based approach for bi-objective sustainable project portfolio selection using interdependency network model between projects. Environ. Dev. Sustain. 2023, 25, 13981–14001. [Google Scholar] [CrossRef]
  37. Sun, Y.; Zhang, R.; Li, A. A new concept of education-innovation-economy-environment sustainability system: A new framework of strategy-based network data envelopment analysis. Environ. Dev. Sustain. 2024, 1–45. [Google Scholar] [CrossRef]
  38. Li, R.; Luo, Y.; Chen, B.; Huang, H.; Liu, P. Efficiency of scientific and technological resource allocation in Chengdu-Chongqing-Mianyang Urban agglomeration: Based on DEA–Malmquist index model. Environ. Dev. Sustain. 2024, 26, 10461–10483. [Google Scholar] [CrossRef]
  39. Liu, P.; Han, G.; Yang, H.; Li, X. A sustainable development study on innovation factor allocation efficiency and spatial correlation based on regions along the belt and road in China. Sustainability 2024, 16, 2990. [Google Scholar] [CrossRef]
  40. You, M.; Huang, Y.; Wu, N.; Yuan, X. Efficiency Evaluation and Resource Optimization of Forestry Carbon Sequestration Projects: A Case Study of State-Owned Forest Farms in Fujian Province. Sustainability 2025, 17, 375. [Google Scholar] [CrossRef]
  41. Callens, I.; Tyteca, D. Towards Indicators of Sustainable Development for Firms: A Productive Efficiency Perspective. Ecol. Econ. 1999, 28, 41–53. [Google Scholar] [CrossRef]
  42. Zhou, H.; Yang, Y.; Chen, Y.; Zhu, J. Data envelopment analysis application in sustainability: The origins, development and future directions. Eur. J. Oper. Res. 2018, 264, 1–16. [Google Scholar] [CrossRef]
  43. Letti, A.G.; Bittencourt, M.V.L.; Vila, L.E. Stochastic vs. deterministic frontier distance output function: Evidence from Brazilian higher education institutions. J. Product. Anal. 2022, 58, 55–74. [Google Scholar] [CrossRef]
  44. Andersen, P.; Petersen, N.C. A procedure for ranking efficient units in data envelopment analysis. Manag. Sci. 1993, 39, 1261–1264. [Google Scholar] [CrossRef]
  45. Lovell, C.A.K.; Rouse, R. Measuring the efficiency of decision-making units using data envelopment analysis. Oper. Res. 2003, 51, 493–503. [Google Scholar]
  46. Emrouznejad, A.; Cabanda, E. Super-efficiency in DEA: A review of the literature. Int. J. Appl. Manag. Sci. 2014, 6, 167–188. [Google Scholar]
  47. Simar, L.; Wilson, P.W.; Paul, L. A general methodology for bootstrapping in data envelopment analysis. J. Oper. Res. Soc. 2022, 53, 23–29. [Google Scholar]
  48. Peña, J.M. Data Envelopment Analysis: A Methodology for Assessing the Efficiency of Decision-Making Units; Springer Science and Business Media: Berlin/Heidelberg, Germany, 2008. [Google Scholar]
  49. Simar, L.; Wilson, P.W. Sensitivity analysis of efficiency scores: How to bootstrap in nonparametric frontier models. Manag. Sci. 1998, 44, 49–61. [Google Scholar] [CrossRef]
  50. Simar, L.; Wilson, P.W. Statistical inference in nonparametric frontier models: The state of the art. J. Product. Anal. 2000, 13, 49–78. [Google Scholar] [CrossRef]
  51. Simar, L.; Wilson, P.W. A general methodology for bootstrapping in non-parametric frontier models. J. Appl. Stat. 2000, 27, 779–802. [Google Scholar] [CrossRef]
  52. Simar, L.; Wilson, P.W. Two-stage DEA: Caveat emptor. J. Product. Anal. 2011, 36, 205–218. [Google Scholar] [CrossRef]
  53. Serrano, A.L.; Saiki, G.M.; Rosano-Penã, C.; Rodrigues, G.A.P.; Albuquerque, R.D.O.; Villalba, L.J.G. Bootstrap method of eco-efficiency in the Brazilian agricultural industry. Systems 2024, 12, 136. [Google Scholar] [CrossRef]
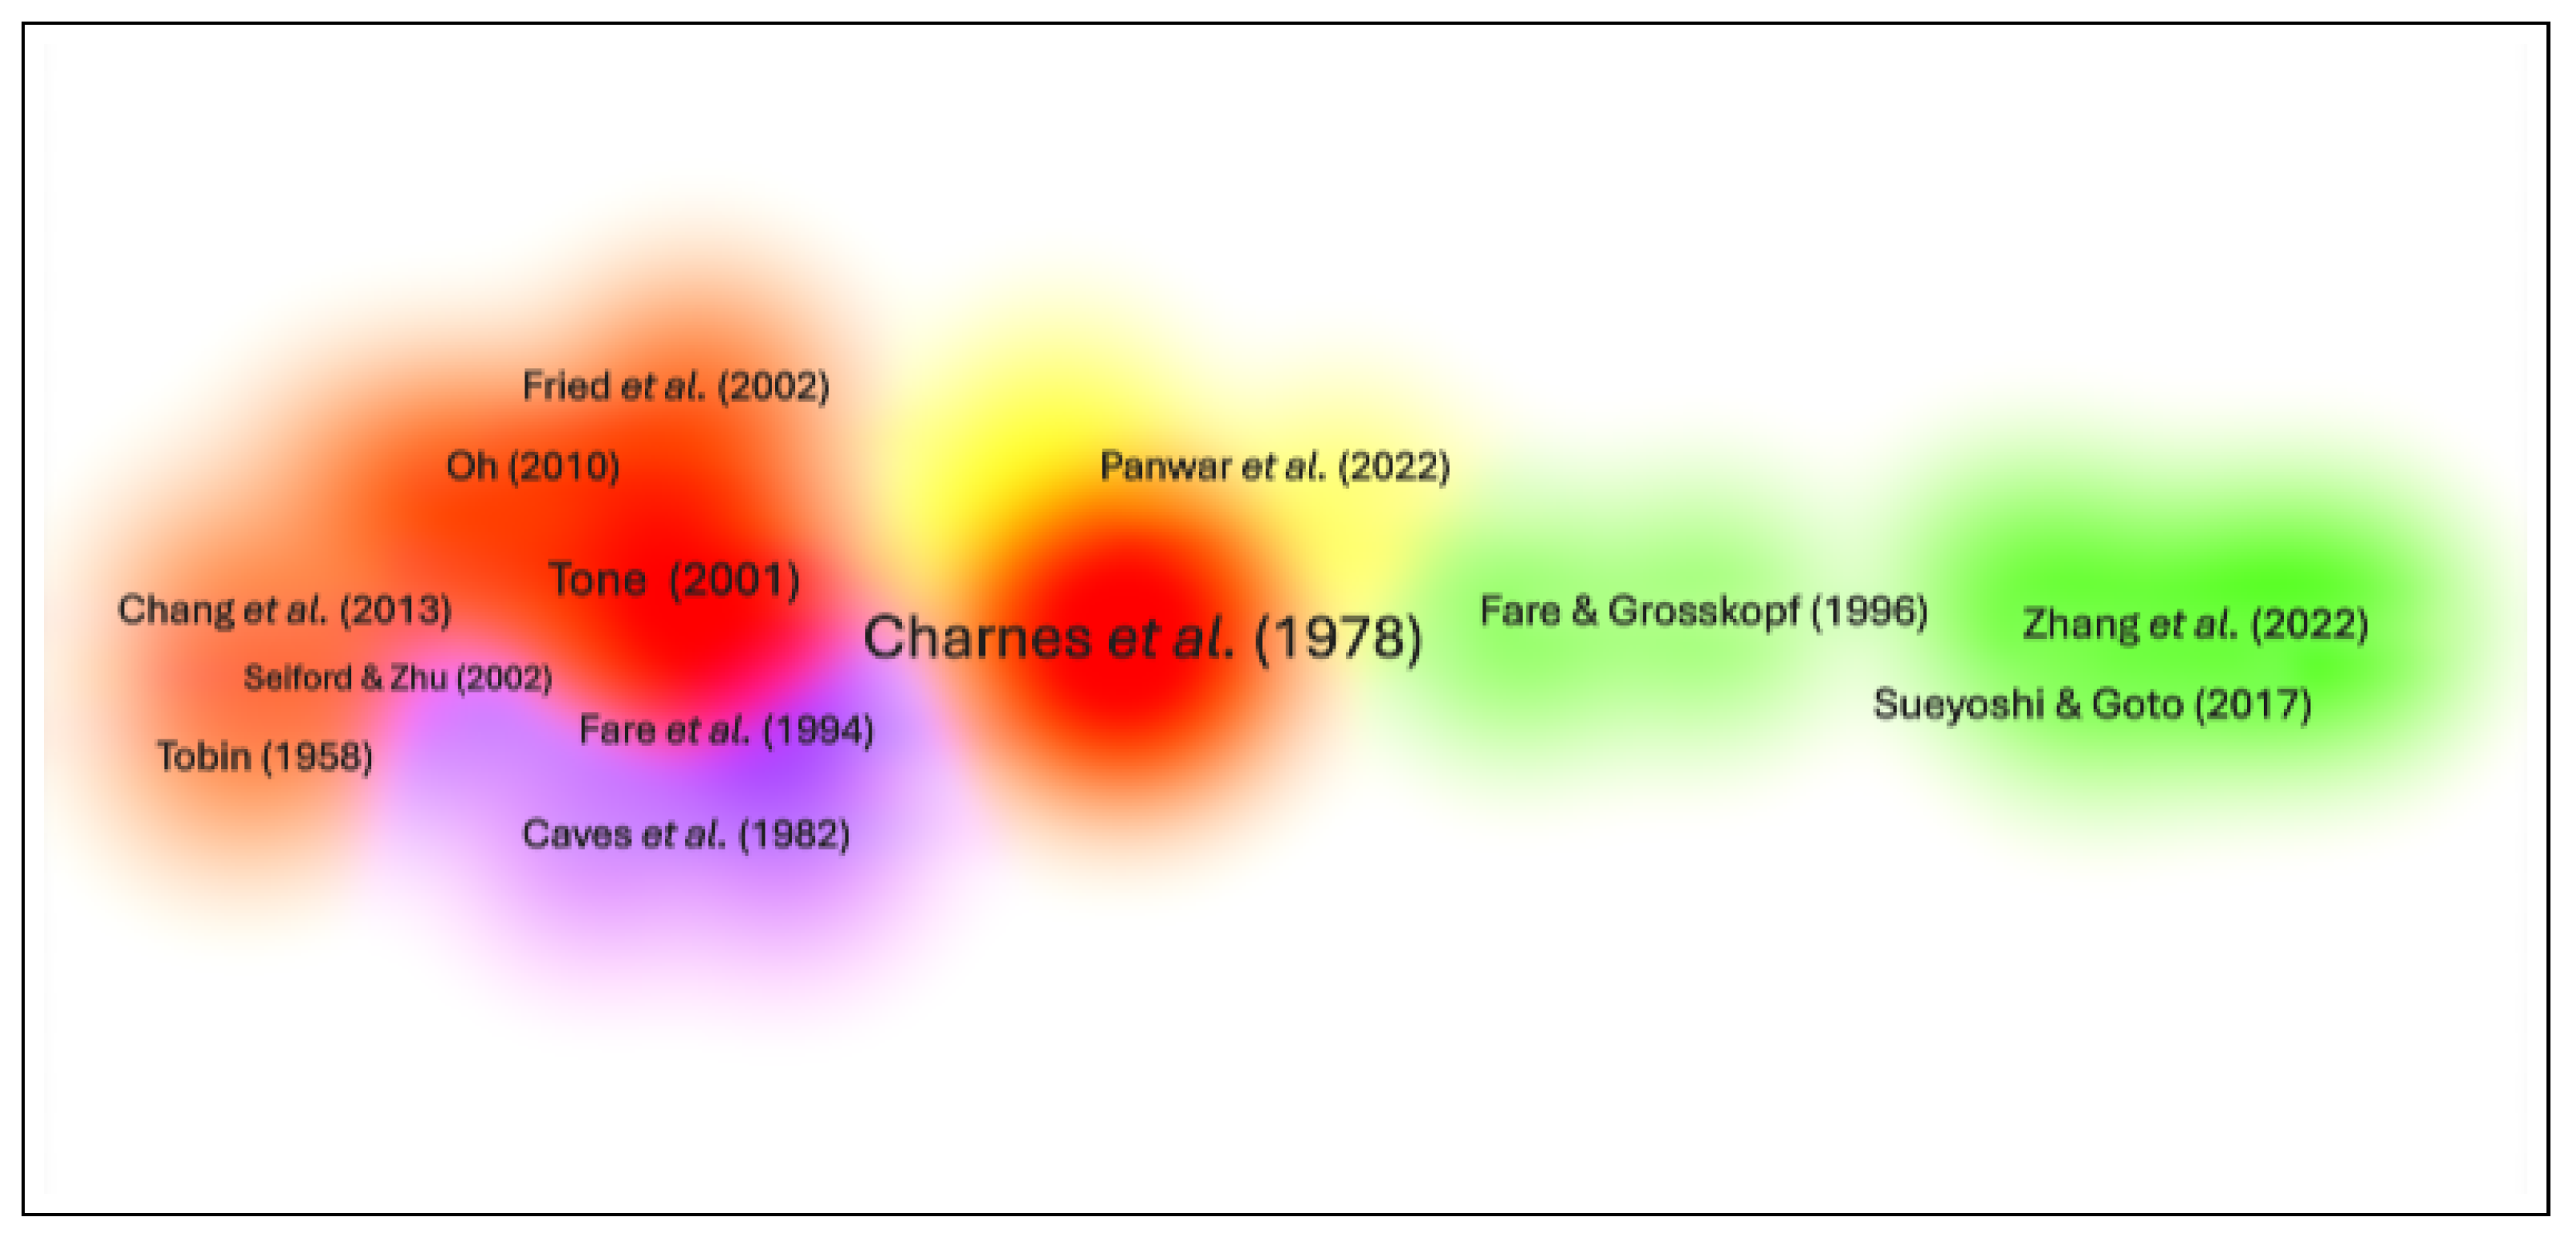
Figure 1. Co-citation heat map generated in VOSviewer using the WOS database [11,12,13,14,15,16,17,18,19].
Sustainability 17 08653 g001
Figure 2. Bibliographic coupling heat map generated in VOSviewer using the WOS database [20,21,22,23,24,25,26,27,28,29,30,31,32,33].
Sustainability 17 08653 g002
Figure 3. Mentions per SDG count.
Sustainability 17 08653 g003
Figure 4. Variables correlation.
Sustainability 17 08653 g004
Figure 5. Density plots per department.
Sustainability 17 08653 g005
Table 1. Previous related studies.
ArticleOverview
[23]Use of a DEA-SBM-PA model to evaluate green technology R&D efficiency in China (2011–2017). The results highlight efficiency disparities and identify improvement potentials for inefficient provinces.
[34]Application of DEA with stochastic frontier analysis to assess innovation-driven performance in 20 environmental protection enterprises (2018–2020). The findings suggest optimizing resource use and labor-capital transformation for better efficiency.
[35]Analysis of 1500 climate change R&D projects in Korea (2014–2020) using DEA. The results highlight inefficiencies in both technical and scale perspectives and propose improvement strategies to enhance national R&D efficiency.
[36]Proposal of a sustainable model for project portfolio selection using DEA and Bayesian network modeling. The authors show the model outperforms traditional methods in a real case with 21 projects.
[37]Introduction of a new sustainability system combining network DEA, K-means clustering, and the Gini coefficient to evaluate university performance in promoting economic growth and environmental protection in China (2007–2019). The results show efficiency regress, with education-innovation gaining greater priority over economy-environment.
[38]Use of DEA-Malmquist analysis to evaluate technological resource allocation efficiency in the Chengdu-Chongqing-Mianyang region (2010–2019). The findings show an upward trend in efficiency, driven by technological progress and strong policy support.
[39]Application of a super-efficient SBM-DEA-Malmquist model to evaluate innovation factor allocation along the Belt and Road in China (2012–2021). The results show strong agglomeration, with policy recommendations for enhancing regional innovation development.
[40]Use of DEA to assess the operational efficiency of 14 state-owned forestry carbon sink projects in Fujian, identifying management capability and climate conditions as key efficiency factors. The findings suggest investment barriers limit small-scale forest farms from engaging in such projects.
Table 2. Selected variables.
TypeVariableAbbreviationUnit of Measure
InputTeam SizeTSPeople
Project BudgetBUSD
WorkloadWHours
OutputPublished PapersPPPapers
Number of BeneficiariesNBPeople
Table 3. Efficiency scores with and without correction.
DMUDepartmentwith Correction95% Confidence LevelWithout Correction
MinimumMaximum
DMU 4EEL0.81310.70310.97231.0000
DMU 7EEL0.46900.40640.55580.5669
DMU 13EEL0.30760.26490.36720.3754
DMU 6ENC0.80300.66890.97541.0000
DMU 17ENC0.74570.62110.98611.0000
DMU 2ENC0.74290.62660.97661.0000
DMU 20ENC0.31840.27510.36160.3668
DMU 14MAT0.78460.67090.97721.0000
DMU 12MAT0.76370.65760.98031.0000
DMU 3EEN0.51360.44680.60530.6211
DMU 1EEN0.29620.25480.34240.3514
DMU 18EEN0.23100.19330.27380.2794
DMU 5ENM0.44660.38040.52870.5393
DMU 8ENM0.45030.39190.51940.5297
DMU 15ENM0.40200.35310.46870.4768
DMU 9ENE0.50310.42660.59230.6065
DMU 11ENE0.33150.28930.37710.3836
DMU 19DSC0.75670.63390.96661.0000
DMU 16EPR0.71900.62600.83390.8597
DMU 10EAU0.57390.49020.68410.6974
Table 4. Percentage slack per DMU.
DMUTSBWPPNB
DMU 12.5%0.0%0.0%0.0%0.0%
DMU 20.0%0.0%0.0%0.0%0.0%
DMU 30.0%0.0%0.0%0.0%0.0%
DMU 40.0%0.0%0.0%0.0%0.0%
DMU 50.0%0.0%5.3%0.0%0.0%
DMU 60.0%0.0%0.0%0.0%0.0%
DMU 70.0%0.0%1.4%0.0%0.0%
DMU 81.2%0.0%0.0%0.0%0.0%
DMU 98.1%0.0%21.7%0.0%0.0%
DMU 109.4%0.0%0.0%0.0%0.0%
DMU 112.7%0.0%2.2%0.0%0.0%
DMU 120.0%0.0%0.0%0.0%0.0%
DMU 130.0%0.0%0.3%0.0%0.0%
DMU 140.0%0.0%0.0%0.0%0.0%
DMU 150.1%0.0%0.0%0.0%0.0%
DMU 1653.9%0.0%0.0%0.0%7.5%
DMU 170.0%0.0%0.0%0.0%0.0%
DMU 180.0%0.0%11.8%0.0%0.0%
DMU 190.0%0.0%0.0%0.0%0.0%
DMU 204.0%0.0%2.2%0.0%0.0%
Disclaimer/Publisher’s Note: The statements, opinions and data contained in all publications are solely those of the individual author(s) and contributor(s) and not of MDPI and/or the editor(s). MDPI and/or the editor(s) disclaim responsibility for any injury to people or property resulting from any ideas, methods, instructions or products referred to in the content.