Article

Spatiotemporal Variation of Soil Enzyme Activities and Their Dominant Drivers in Salinized Wheat Fields of the Yellow River Delta

1
College of Biological and Pharmaceutical Engineering, Shandong University of Aeronautics, Binzhou 256603, China
2
The Yellow River Delta Sustainable Development Institute of Shandong Province, Dongying 257100, China
3
Shandong Provincial Engineering and Technology Research Center for Wild Plant Resources Development and Application of Yellow River Delta, Binzhou 256603, China
4
Institute of Genetics and Developmental Biology, Chinese Academy of Sciences, Beijing 100101, China
*
Authors to whom correspondence should be addressed.
Sustainability 2025, 17(19), 8566; https://doi.org/10.3390/su17198566
Submission received: 1 September 2025 / Revised: 18 September 2025 / Accepted: 22 September 2025 / Published: 24 September 2025

Abstract

Soil salinization is one of the most important factors limiting the sustainable development of global agriculture. As the core driving force of the soil carbon cycle, soil-carbon-metabolism-related enzyme activity is very important for soil ecological balance and fertility enhancement. To explore the spatial and temporal variation characteristics and coupling mechanisms of soil water, salt, nutrients and enzyme activities in different salinized wheat fields in the Yellow River Delta, field experiments were conducted in Dongying City, Shandong Province. The results showed that the soil moisture content of the low-salt wheat field was higher and that the salt content of three wheat fields was concentrated in the 0–20 cm and 80–100 cm soil layers. Here, soil nutrients and enzyme activities are concentrated in the 0–20 cm topsoil, with significant differences in different degrees among salinized wheat fields at the different growth stages of wheat. Overall, invertase activity (S-SC) and amylase activity (S-AL) presented a trend of low salt > high salt > medium salt, while cellulase activity (S-CL) presented a trend of medium salt > low salt > high salt. Redundancy analysis showed that available potassium (AK) (67.6%) and electric conductivity (EC) (21.2%) in the low-salinity wheat field, total nitrogen (TN) (48.6%) and AK (28.8%) in the medium-salinity wheat field, and EC (67%) and soil organic matter (SOM) (19%) in the high-salinity wheat field contributed the most to soil enzyme activity. This study provides a theoretical basis for the management and sustainable development of different salinized wheat fields in the Yellow River Delta.

1. Introduction

Soil salinization is one of the major factors limiting crop production worldwide [1]. Globally, the areas affected by soil salinization include the United States, Pakistan, China, India, Central Asia, and West Asia [2]. As a strategic reserve of China’s potential cultivated land resources, saline–alkali land has garnered national attention regarding its efficient development and utilization [3]. The Yellow River Delta contains important coastal saline–alkali land formed by fluvial, marine, and topographic interactions and suffers from severe soil salinization due to shallow ground water, high mineralization, and poor drainage [4]. Because evaporation exceeds precipitation, salt resurgence during the dry season and salt accumulation in the flood season are severe in this area. Here, the salt content in the topsoil has exceeded the tolerance threshold of common wheat, inhibiting seed germination and seedling growth. Studies confirmed that increased soil salinity significantly reduces wheat yield, with outputs in severely affected areas declining by approximately 25% [5].
Soil environmental quality is pivotal for agricultural productivity, as optimal physicochemical properties directly accelerate crop growth and increase yield [6]. For instance, modifying the soil structure by incorporating sand in the tillage layer has been proven to suppress water evaporation, reduce surface salt accumulation, and enhance soil moisture retention [7]. Essential nutrients such as nitrogen, phosphorus, and potassium play distinct roles in this process. Nitrogen promotes plant height, phosphorus drives photosynthesis and carbohydrate synthesis, and potassium enhances stress resistance [8,9]. Soil organic matter (SOM) further underpins crop growth, aquatic health, and carbon–climate interactions [10].
Soil carbon metabolism is the core process of the carbon cycle in terrestrial ecosystems and can drive soil microbial activity and nutrient cycling to promote crop growth. Soil microorganisms convert organic carbon into inorganic carbon through metabolic activities such as decomposing organic matter, synthesizing their own biomass, and releasing CO2 through respiration, which determines the storage and release of soil carbon [11,12]. Soil carbon metabolic enzymes are important soil enzymes whose core hydrolases are sucrase (S-SC), amylase (S-AL), and S-CL. These enzymes serve as the biological catalysts for the entire process of soil carbon cycle [13] and are mainly composed of proteins. However, due to the amino acid sequence, spatial conformation, and details of the active center, these enzymes can only hydrolyze specific substrates. Unlike other hydrolases, they belong to non-metallic dependent hydrolases and can directly break the glycosidic bonds of the substrate. These enzymes target different carbohydrate substrates and hydrolyze macromolecular organic carbon step by step into small-molecule sugars that can be directly absorbed and utilized by microorganisms and plants, thereby determining the mineralization rate, stability, and carbon sequestration potential of soil carbon [14]. Studies have shown that the activity of soil hydrolases can be increased by adding exogenous substances. High application rates of cattle manure vermicompost significantly increase S-SC activity, while low application rates inhibit such activity [15]. Additionally, salt stress significantly reduces soil enzyme activity [16]. Studies in saline paddy fields of northeastern Thailand observed a significant negative correlation between soil enzyme activity and electrical conductivity (EC) [17]. Similarly, in the saline–alkali soils of western Jilin, China, soil amylase activity decreased with and increase in soil salinity [18]. Notably, washing salt from saline soil through drainage significantly enhanced soil invertase activity, confirming the close relationship between soil salinity (reflected by moisture dynamics) and enzyme functionality [19]. Furthermore, soil nutrients exhibit significant correlations with enzyme activities [20]. For instance, legume–grass intercropping boosts soil enzyme activities by elevating nitrogen, phosphorus, potassium, and organic matter content [21]. Combining organic fertilizers with conservation tillage also synergistically improves soil nutrient availability and enzyme activities [22].
In summary, soil-carbon-metabolism-related enzyme activities can not only drive the soil carbon cycle and affect the stability of soil ecosystems but also maintain soil fertility and promote agricultural production by transforming organic carbon into “carbon food” that can be directly utilized by microorganisms and plants. Wheat is vital to human civilization and plays a prominent role in global food security, accounting for about 20% of calories and protein in the global diet [23]. In the Yellow River Delta region of China, wheat yield and quality are affected by the salinity, nutrient composition, and enzyme activity in saline soils. Although there have been extensive studies on soil carbon metabolism enzyme activities, there are relatively few studies on saline–alkali farmland, especially in the Yellow River Delta region of China. However, whether the temporal and spatial variation characteristics of soil water, salt, nutrients, and carbon-metabolism-related enzyme activities are similar in different salinized wheat fields, and whether there are differences in the influence mechanism of soil water, salt, and nutrients on carbon-metabolism-related enzyme activities deserve further investigation. In this study, we hypothesized that the temporal and spatial variation characteristics of soil water, salt, nutrients, and enzyme activities related to carbon metabolism would be different in different salinized wheat fields and that the influence mechanisms of soil water, salt, and nutrients on enzyme activities related to carbon metabolism would also be different.

2. Materials and Methods

2.1. Study Region

The experiment area was located at the Institute of Seed Innovation, Chinese Academy of Sciences in Dongying of China (37°42′ N, 118°54′ E), situated on the alluvial plain of the Yellow River Delta, where the soil exhibits varying degrees of salinity. Here, the winter is dry and cold, the summer is hot and humid, and the four seasons are distinct. Precipitation is unevenly distributed in time and space, with most of it concentrated in summer (Shandong Province, China).

2.2. Materials

The experimental wheat variety “Nongda 753” is characterized by high yield, multi-resistance, and wide adaptability. This variety is currently being developed and promoted in the saline–alkali soils of the Yellow River Delta. The wheat variety was provided by the Biotechnology Breeding and Space–Biotechnology Team of the Shandong University of Aeronautics.

2.3. Experiment Design and Sample Treatment

As experimental sites, we selected three different cultivated lands with soil salinity of about 1–3‰ (low salinity), 3–5‰ (moderate salinity), and 5–7‰ (high salinity). The wheat was sown in mid-October 2023. During the growing season, conventional field management was applied. Soil samples were collected at five critical growth stages: pre-sowing, jointing, flowering, grain-filling, and maturity. Three replicate points per plot were selected along a diagonal transect. The five soil samples were extracted using a soil auger from a 0–100 cm depth at 20 cm intervals at one point, resulting in 45 samples (wheat fields with 3 different salinity levels × 3 replicate points × 5 different soil depths). The samples were stored in aluminum boxes to determine soil water content (SWC) and stored in Ziploc bags for air-drying, grinding, and sieving through a 20-mesh sieve for the soil test of physical and chemical properties and enzyme activities (Supplementary Figure S1).

2.4. Measurement of SWC and Salinity

SWC was determined using the oven-drying method, calculated as follows [24]:
SWC = (m1 − m2)/m2,
where m1 is the wet soil weight of each sample (50 g), and m2 is the dry soil weight of each sample.
Soil salinity was measured via soil electric conductivity (EC). We added 25 mL CO2-free distilled water to 5 g air-dried soil (5:1 water-to-soil ratio), followed by 3 min of shaking, 30 min of settling, and analysis with a calibrated conductivity meter.

2.5. Measurement of Nutrient Components Content

Available phosphorus (AP) content was determined with the Olsen method [25]. Firstly, we weighed 2.5 g of the air-dried soil sample and passed it through a 2 mm sieve. The sample was then dissolved into a 10 mL 0.5 mol L−1 NaHCO3 solution. Next, we titrated the solution with 0.5 mol L−1 H2SO4 until the supernatant changed from blue to yellow. Subsequently, we added 5.0 mL of a freshly prepared molybdenum–antimony-ascorbic acid color-developing agent and let the solution stand for 30 min. The absorbance was measured at λ = 700 nm using a spectrophotometer. The specific calculation formula was as follows:
AP = ρ(P) × V × D/m,
where ρ (P) is determined from the standard curve or regression equation. Here, V represents the volume of the color-developed solution, D is the aliquot multiple, and m signifies the mass of the air-dried soil sample.
Available potassium (AK) content was determined with the extraction-flame photometry method [26]. Firstly, we weighed 5 g of the air-dried soil sample and passed it through a 1 mm sieve. Next, we added 50 mL of a 1mol L−1 NH4OAc solution. Then, the solution from filtrating and a series of potassium standard solutions (0, 5, 10, 20, 30, and 50 mg L−1) were prepared with the same batch of extractant, and all were analyzed simultaneously. The emission intensity of the potassium was measured at λ = 750 nm using a flame photometer. The specific calculation formula was as follows:
AK = (c1 − c2) × V/m,
where c1 is the measured potassium concentration, c2 is the blank potassium concentration, V represents the total volume of the extract, and m indicates the weight of the soil sample.
SOM content was determined with the potassium dichromate external heating method [27]. First, we weighed 0.1 g of the air-dried soil sample and passed it through a 0.25 mm sieve. Then, we added 5 mL of the 0.8 mol L−1 K2Cr2O7 standard solution and 5 mL concentrated H2SO4. After an oil bath, digestion, and cooling, we added 2–3 drops of the phenanthroline indicator and titrated the sample with 0.2 mol L−1 Fe2SO4 standard solution. The calculation formula was as follows:
SOM = (V0 − V) × c × 0.003 × 1.724 × 1000/m,
where V0 is the volume of Fe2SO4 consumed by the blank, V is the volume consumed by the sample, c is the concentration of Fe2SO4, and m is the weight of the soil sample.
Total nitrogen (TN) content was determined using the Kjeldahl method [28]. Firstly, we weighed 0.5 g of the air-dried soil sample and passed it through a 0.25 mm sieve. Next, we added 2 g of a mixed catalyst (K2SO4:CuSO4·5H2O:Se = 100:10:1, mass ratio), 5 mL concentrated H2SO4, and 2 drops of 30% H2O2. After digestion and cooling, the solution was transferred to a Kjeldahl nitrogen analyzer. Then, we added 40% NaOH for distillation. The distilled ammonia was absorbed with 20 g L−1 boric acid and then titrated with 0.05 mol L−1 standard HCl until the pH reached 4.65. The specific calculation formula was as follows:
TN = (V − V0) × N × 0.014 × 100/W,
where V represents the volume of the hydrochloric acid standard solution used during titration of the sample, V0 is the volume of the hydrochloric acid standard solution used during titration of the blank, N denotes the equivalent concentration of the hydrochloric acid standard solution, and W indicates the weight of the soil sample.

2.6. Measurement of Enzyme Activity

The activities of S-SC, S-AL, and S-CL were uniformly determined using the 3,5-dinitrosalicylic acid (DNS) colorimetric method [29]. For S-SC, we took 5 g of the air-dried soil sample and placed it in a conical flask. Then, we added 15 mL of 8% sucrose solution, 5 mL of phosphate buffer solution with pH 5.5, and 5 drops of toluene. The mixture was shaken well and incubated in an incubator at 37 °C for 24 h. After the suspension was filtered, 1 mL was taken into a test tube, 3 mL of 3,5 dinitrosalicylic acid was added, and the mixture was heated in a boiling water bath for 5 min. After cooling under a tap water flow, the solution was diluted to 50 mL and then analyzed at a wavelength of 508 nm using a spectrophotometer (TU-1901, Beijing Puxi General Instrument Co., Ltd., Beijing, China). The invertase activity was expressed as the glucose content in 1 g of soil after 24 h.
For S-AL, we took 5 g of the air-dried soil sample and placed it in a conical flask. Then, we added 10 mL of 1% starch solution, 10 mL of phosphate buffer solution with pH 5.6, and 5 drops of toluene. The mixture was shaken and incubated in an incubator at 37 °C for 24 h. After the suspension was filtered, 1 mL was taken into a test tube, 2 mL of 3,5 dinitrosalicylic acid was added, and the mixture was heated in a boiling water bath for 5 min. After cooling under a tap water flow, the solution was diluted to 50 mL and then analyzed at a wavelength of 508 nm with a spectrophotometer. Amylase activity was expressed as the maltose content in 1 g soil after 24 h.
For S-CL, we took 10 g of the air-dried soil sample and placed it in a conical flask. Then, we added 20 mL of 1% carboxymethyl cellulose solution and 5 mL of phosphate buffer solution with pH 5.5 and 1.5 ml of toluene. The mixture was shaken and incubated in an incubator at 37 °C for 72 h. After incubation, the mixture was filtered and diluted to 25 mL. Then, we transferred 1 mL to a test tube and added 3 mL of 3,5 dinitrosalicylic acid. The mixture was then heated in a boiling water bath for 5 min, cooled under a tap water flow, diluted to 25 mL, and measured at a 540 nm wavelength using a spectrophotometer. Cellulase activity was expressed as the glucose content in 1 g soil after 24 h. To avoid the influence of some compounds similar to matrix decomposition products and spontaneous matrix decomposition products in the soil on the results, all samples were subjected to no matrix control and no soil control. When calculating enzyme activity, the data of the control samples were subtracted from the data of the test samples to obtain the quantity of the enzymatic matrix formation products.

2.7. Data Processing and Analysis

The experimental data were organized using Microsoft Excel 2019. SPSS software 27.0 (IBM, Armonk, NY, USA) was used to analyze the significance of relevant indicators at different soil depths through ANOVA (all data passed the Kolmogorov–Smirnov normality and homogeneity tests in the SPSS software before the analysis of variance). To ensure the accuracy of the results, Tukey’s HSD test was performed. Then, the correlation between the indicators was analyzed with a t-test using the SPSS software 27.0. The Origin 2021 software (Origin Lab Company, Northampton, MA, USA) was used to draw contour maps with the wheat growth period and soil depth as independent variables and soil moisture content (or electrical conductivity) as the dependent variable. This software was also used to draw bar charts with soil nutrients (or enzyme activities) as the dependent variable. Redundancy analyses of soil water–salt, nutrients, and enzyme activities were performed using the Canoco 5 software, and the corresponding plots were completed.

3. Results

3.1. Spatial–Temporal Distribution Characteristics of Soil Water and Salt Under Wheat Fields with Different Salinity

The spatial–temporal distribution of SWC in wheat fields with different salinity is shown in Figure 1. In general, SWC gradually decreased as salinity increased, with the deeper soil layers exhibiting higher SWC compared with that in the tillage layer at the same salinity. Throughout the entire growth period of the wheat, the SWC in different soil layers of low- and high-salinity wheat fields exhibited minimal changes with wheat development. However, the SWC at maturity in moderate-salinity fields increased by 10.52%, 0.45%, 0.58%, 1.92%, and 5.13% in the 0–20 cm, 20–40 cm, 40–60 cm, 60–80 cm, and 80–100 cm layers, respectively, compared with the pre-sowing levels. Spatially, the SWC of the deep soil layer (80–100 cm) in low- and high-salinity fields presented negligible changes relative to the tillage layer (0–20 cm), while moderate-salinity fields exhibited notable differences. The SWC increased by 0.46% at maturity in low-salinity fields, 5.32% at the jointing stage in high-salinity fields, and 15.33% at maturity in moderate-salinity fields.
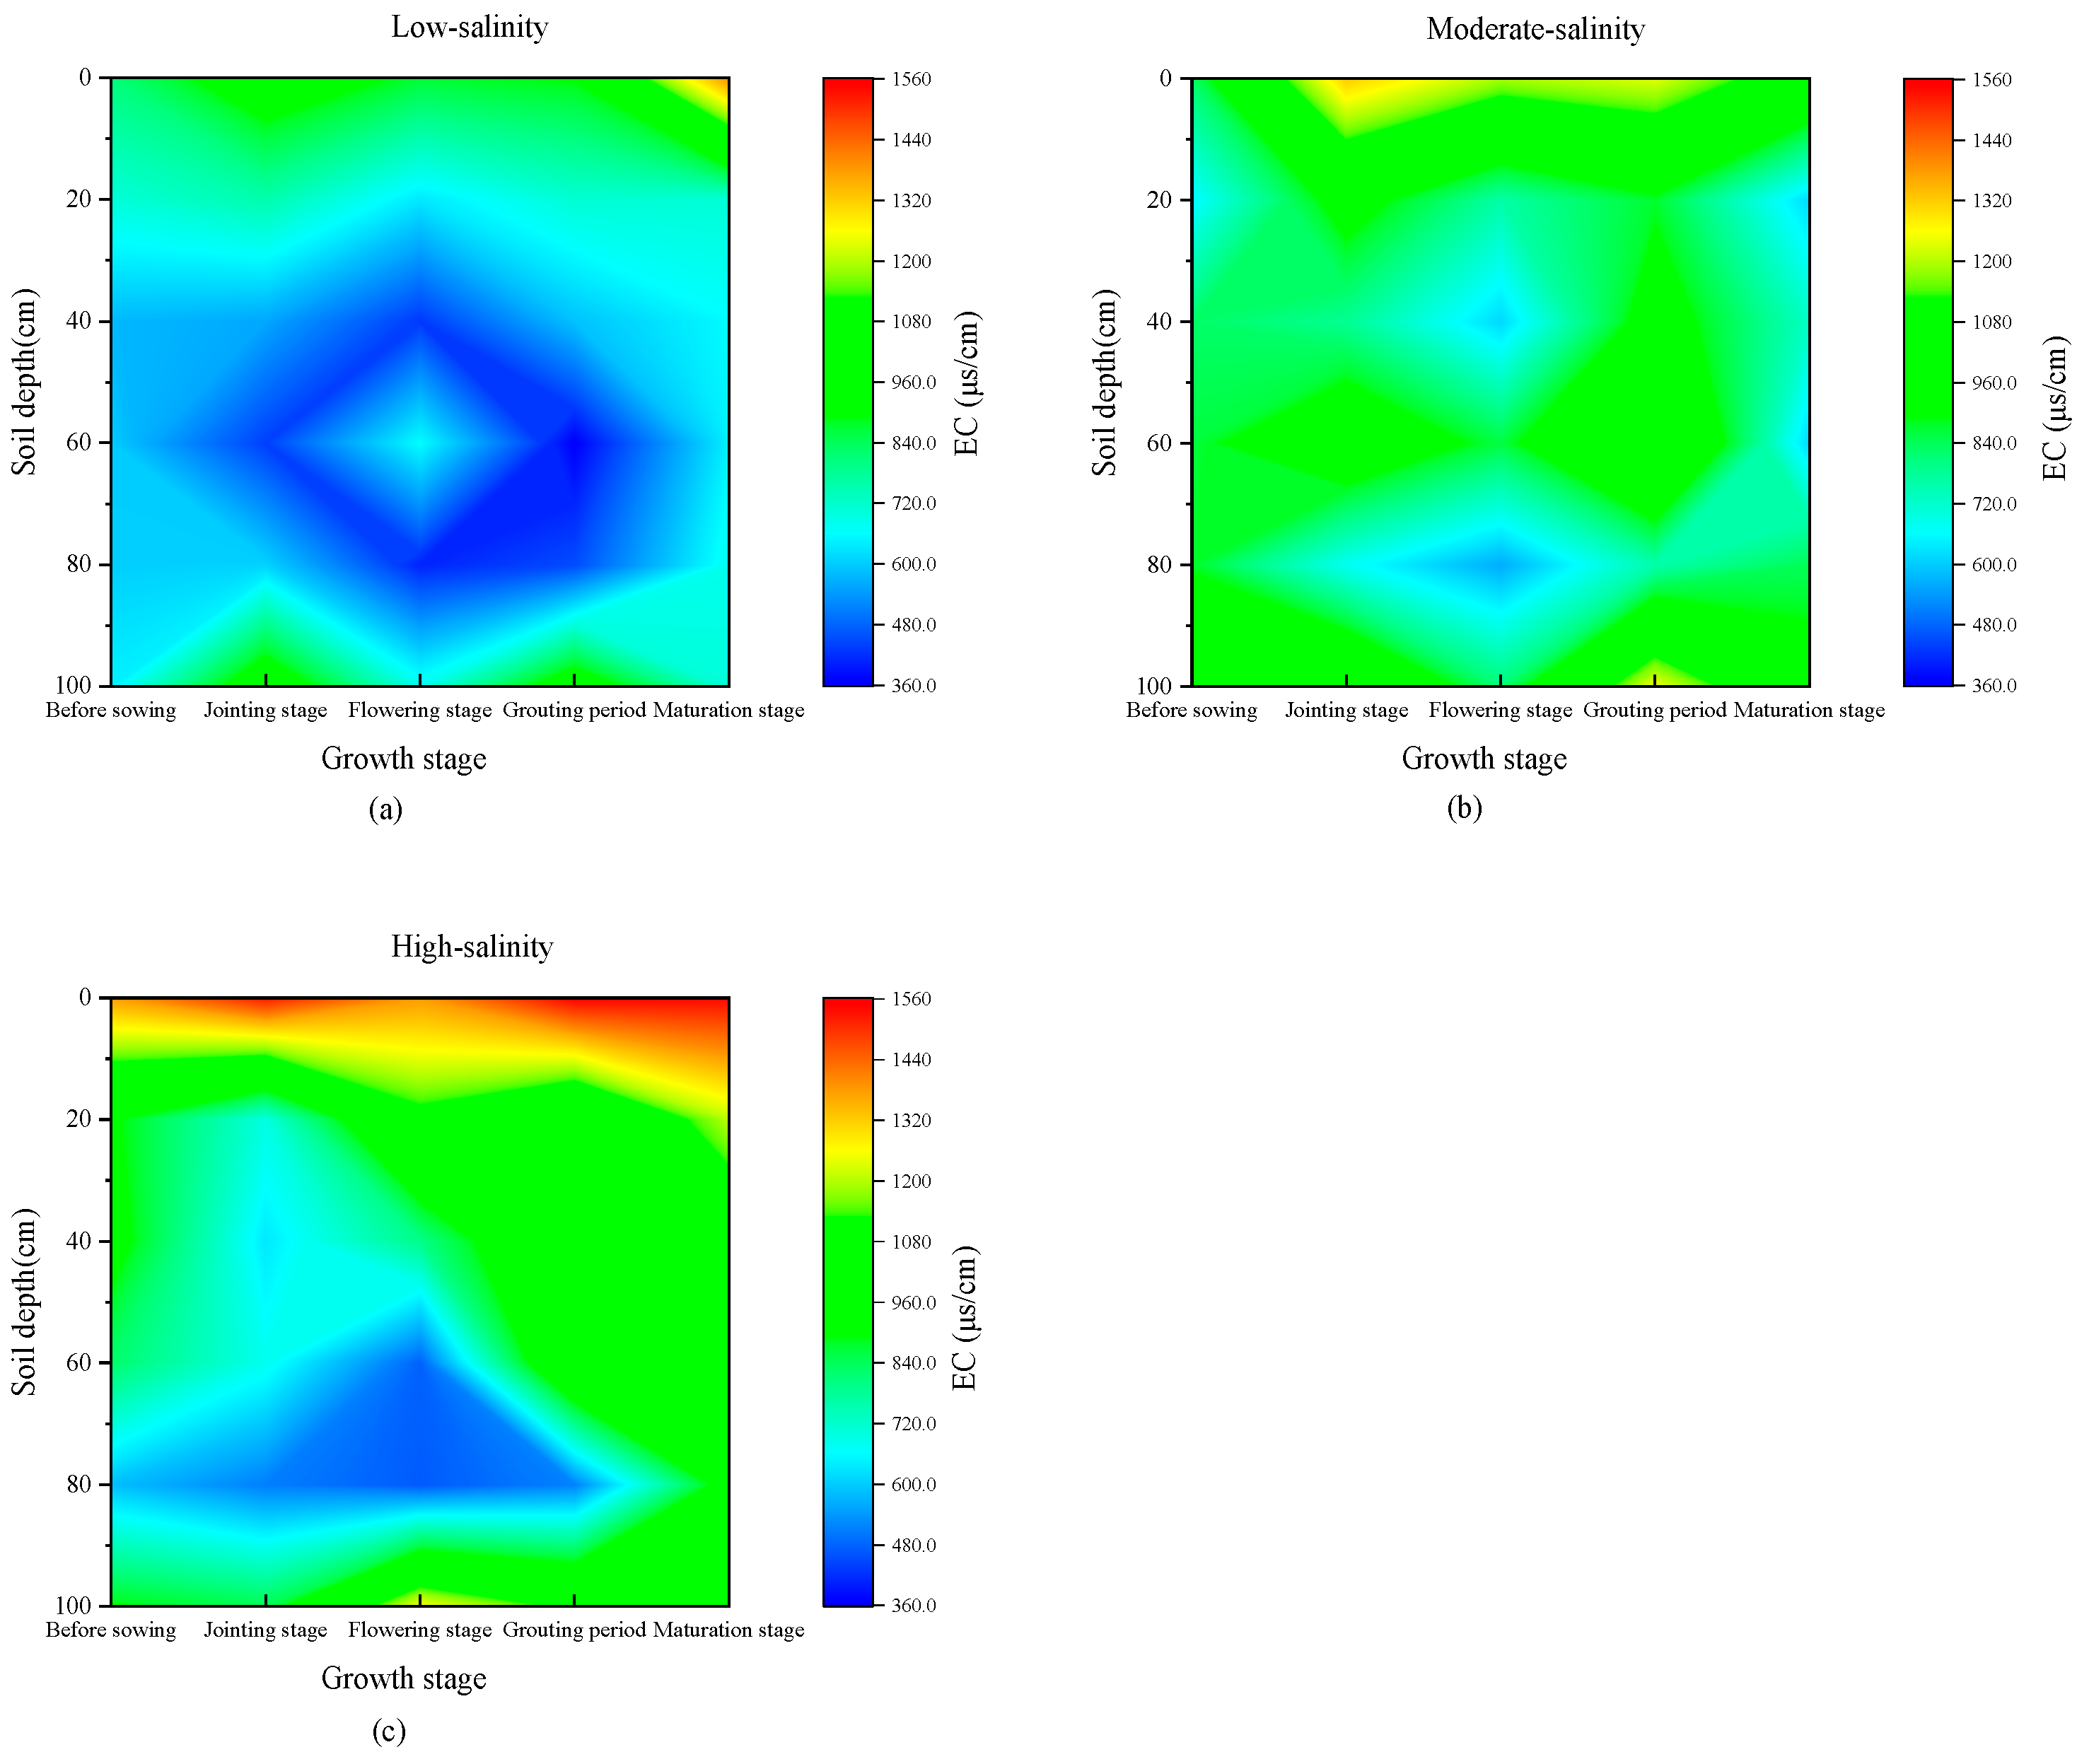
The spatial–temporal distribution of EC in differently salinized wheat fields is shown in Figure 2. The EC in the 0–100 cm layer of wheat fields under different salinity levels produced distinct patterns. Overall, the EC of low-salinity and high-salinity fields showed larger variations but demonstrated smaller fluctuations in moderate-salinity fields. Temporally, the EC across all three fields peaked during the wheat maturity stage, with the most significant changes observed in low- and high-salinity fields, whereas moderate-salinity fields remained comparatively stable. Spatially, the EC in all fields generally followed a “high–low–high” trend with an increase in soil depth in the same fields. Specifically, the tillage layer (0–20 cm) exhibited a significantly higher EC than that of the other layers in high-salinity fields, while low- and moderate-salinity fields presented smaller variations across depths.

3.2. Spatial–Temporal Distribution Characteristics of Nutrient Component Under Wheat Fields with Different Salinity

In order to investigate the spatial–temporal distribution characteristics of soil nutrient factors under wheat fields with different salinity, AP, AK, SOM, and total TN were measured (Supplementary Table S1). The contents of AP in differently salinized wheat fields are shown in Figure 3. The highest AP content was recorded in the low-salinity wheat fields, surpassing that of the medium- and high-salinity fields by 40.8% and 12.1%, respectively. Temporally, all three fields showed higher AP levels during the jointing, flowering, and filling stages compared to those of the pre-sowing and maturity stages. Spatially, the tillage layer (0–20 cm) maintained significantly higher AP content than that of other soil layers, with statistically significant differences between different depths.
The contents of AK in differently salinized wheat fields are shown in Figure 4. The lowest AK content appeared in the low-salinity fields, measuring 205% and 127.4% lower than the values in the medium- and high-salinity fields, respectively. Temporally, peak AK content in the low-salinity fields occurred during the grain-filling stage, whereas the medium- and high-salinity fields reached their maximum levels during the jointing stage of wheat. Spatially, the tillage layer (0–20 cm) in all three fields presented significantly higher AK content compared to that in deeper soil layers, with statistically significant differences observed across all soil depths.
The SOM of different salinized wheat fields is shown in Figure 5. The highest SOM content appeared in the high-salinity fields and was higher by 14.3% and 28.2% than the values in the low- and moderate-salinity fields, respectively. Temporally, the lowest SOM content in the medium- and high-salinity fields occurred during the grain-filling stage, with no significant temporal difference observed in the low-salinity fields. Spatially, the tillage layer (0–20 cm) in all three fields had significantly higher SOM content than that of the deeper soil layers, but the variation magnitude between medium- and high-salinity fields was smaller than that in the low-salinity fields.
Based on the TN content in differently salinized wheat fields shown in Figure 6, the high-salinity fields exhibited the lowest TN content. The values were lower by 70% and 98% than those in the low- and moderate-salinity fields, respectively. Temporally, the TN content at the flowering stage in low- and moderate-salinity fields was significantly higher than that in other growth periods, while the high-salinity fields showed relatively minor variation. Spatially, the tillage layer (0–20 cm) of low- and moderate-salinity fields presented significantly higher TN content compared with that in the deeper soil layers, but this pattern was less pronounced in the high-salinity fields.

3.3. Spatial–Temporal Distribution Characteristics of Soil Enzyme Activities in Wheat Fields with Different Salinity Levels

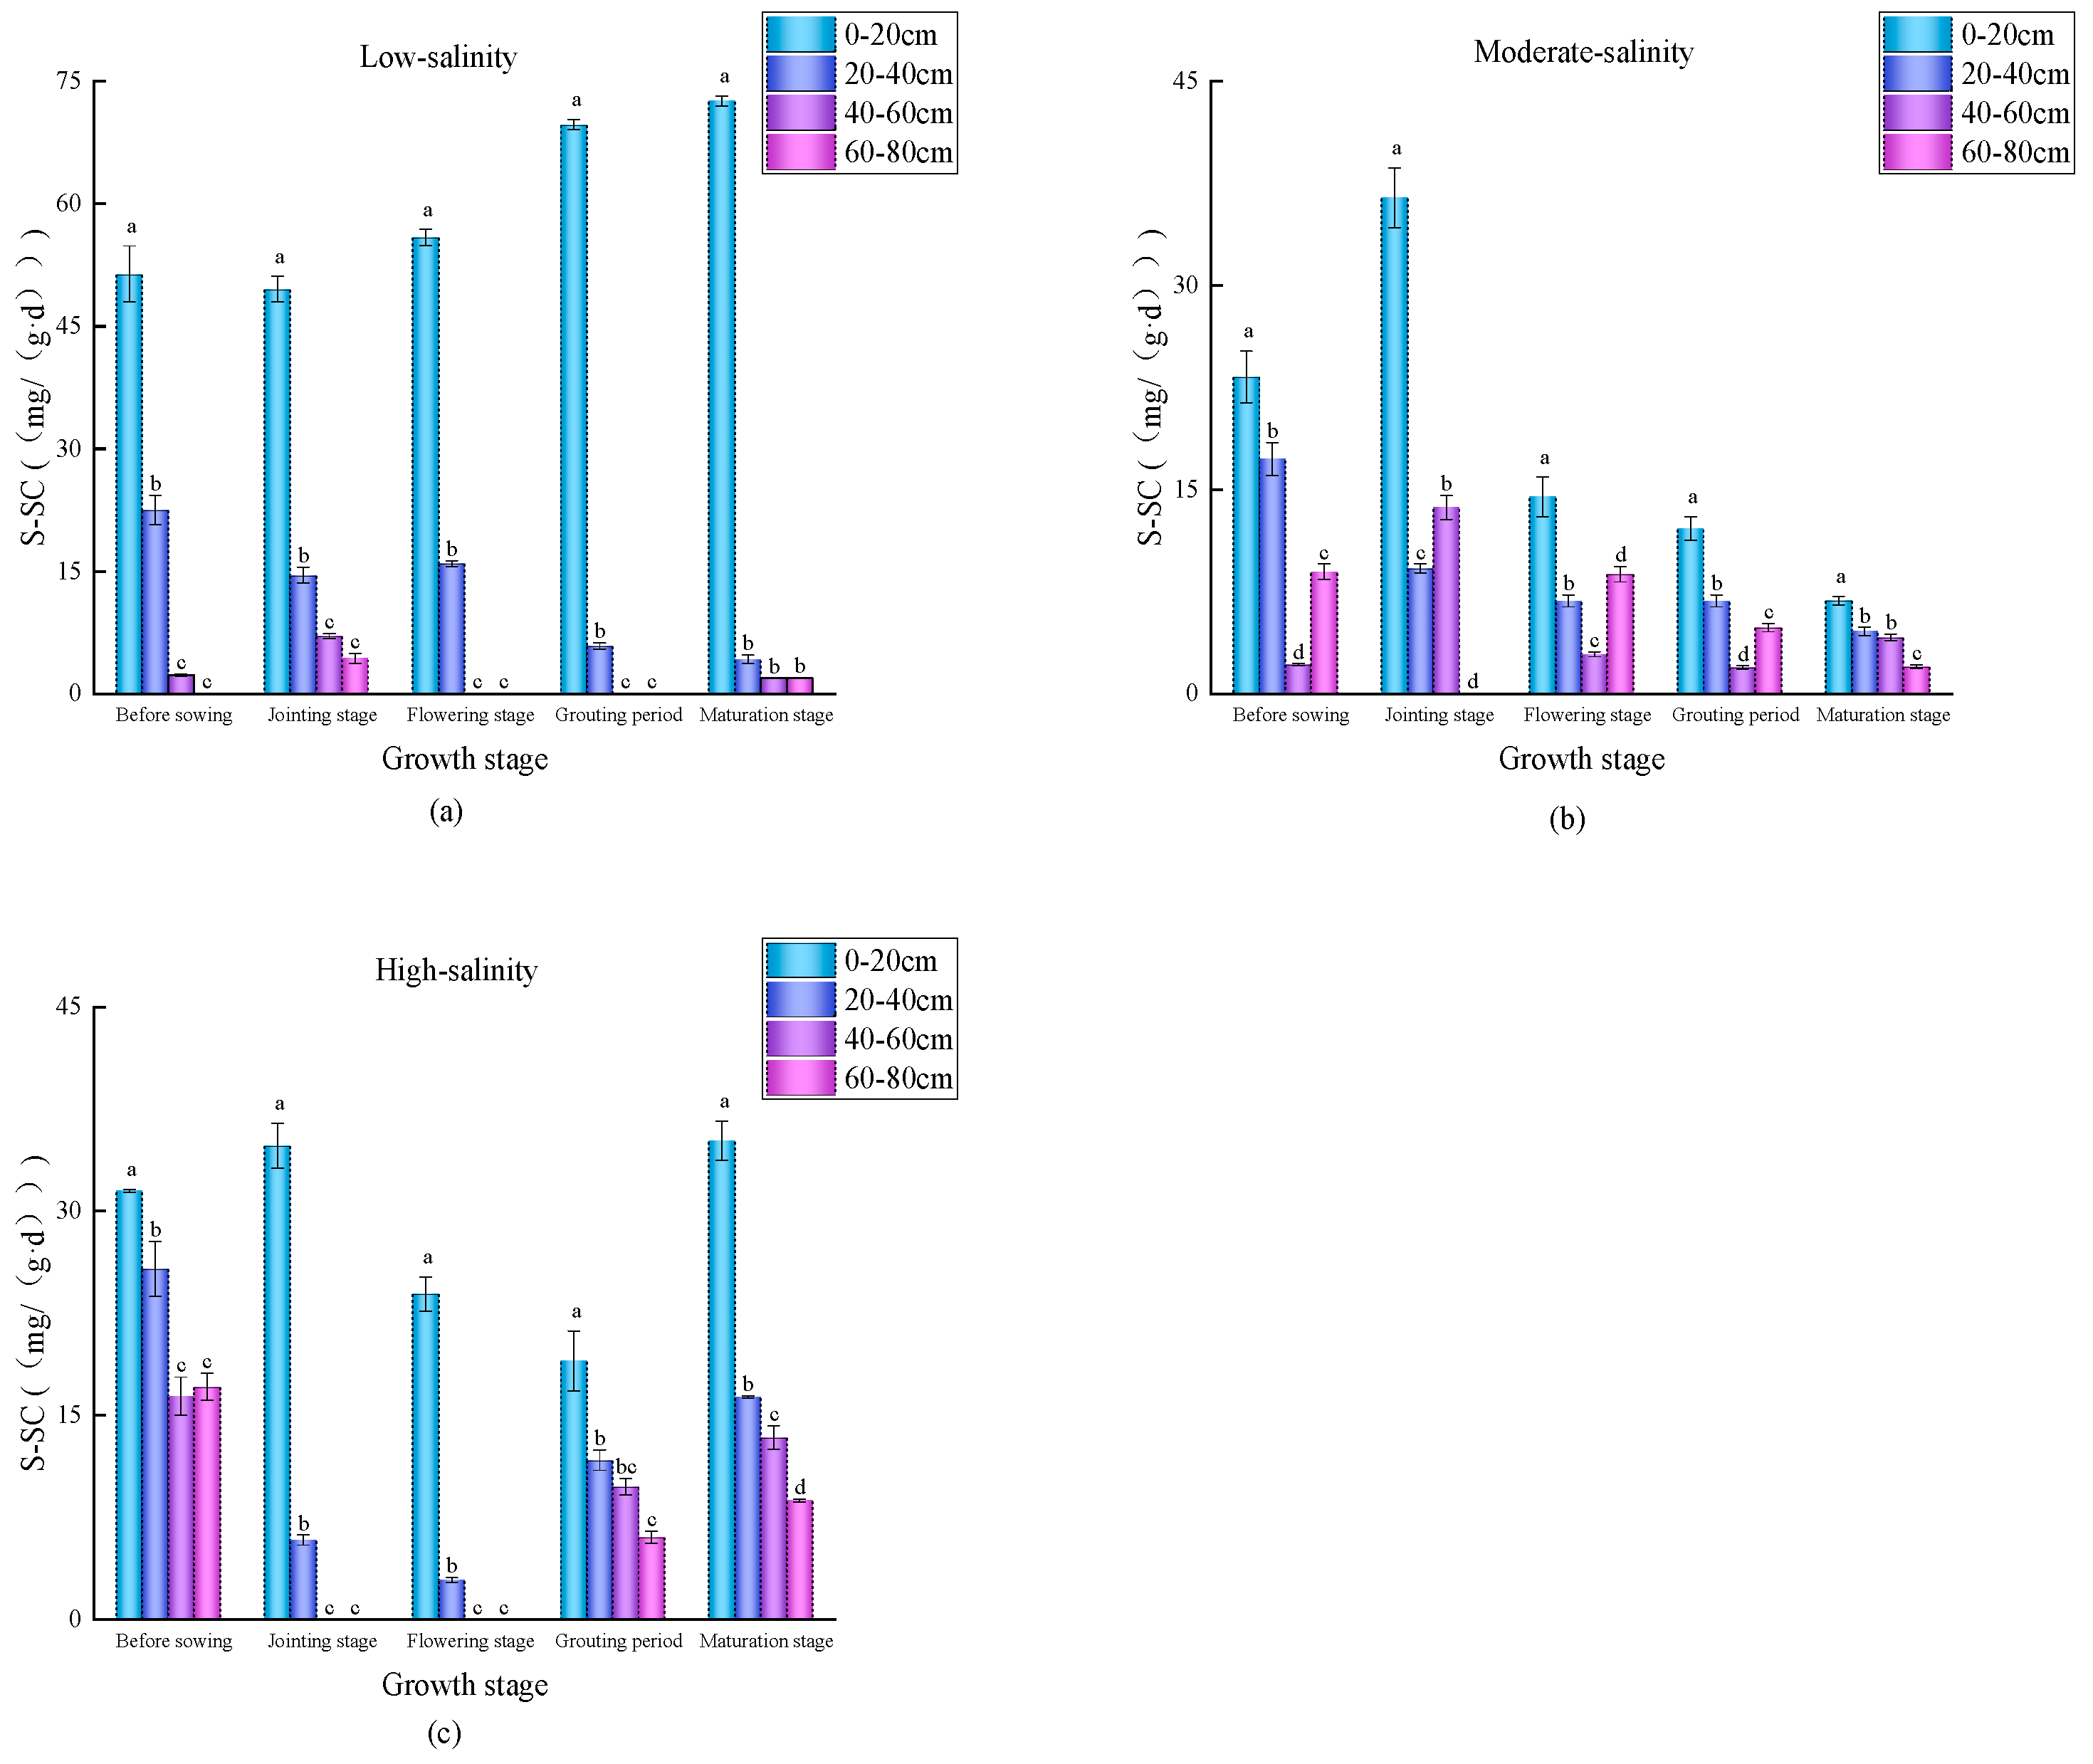
To explore the spatial–temporal distribution characteristics of soil enzyme activities under fields with different salinity, S-SC, S-AL, and S-CL were investigated (Supplementary Table S2). As shown in Figure 7, the activity of S-SC in exhibited distinct patterns in the different salinized wheat fields. Low-salinity fields displayed significantly higher S-SC activity compared to that in moderate- and high-salinity fields, with the most significant difference observed in the tillage layer (0–20 cm). Temporally, all three fields showed minor temporal variations in S-SC activity across the wheat growth stages, indicating stable enzymatic function despite plant developmental changes. This stability likely stemmed from the sustained microbial community structure or organic matter inputs buffering salinity stress. Spatially, the tillage layer (0–20 cm) universally exhibited significantly higher S-SC activity than that in deeper soils across all fields, with the most extreme contrast observed in low-salinity fields.
As shown in Figure 8, S-AL activity in salinized wheat fields exhibited distinct patterns. Moderate-salinity fields presented significantly lower S-AL activity than that in both low- and high-salinity fields, indicating that moderate salinity most strongly inhibits enzyme synthesis due to ionic stress disrupting microbial function and substrate availability. Temporally, all three types of fields peaked in S-AL activity during the flowering stage, with low-salinity fields presenting the highest activity. From a spatial perspective, the S-AL activity in the cultivated layer (0–20 cm) was higher than that in the deep soil during most growth stages of wheat in wheat fields with different salinity levels.
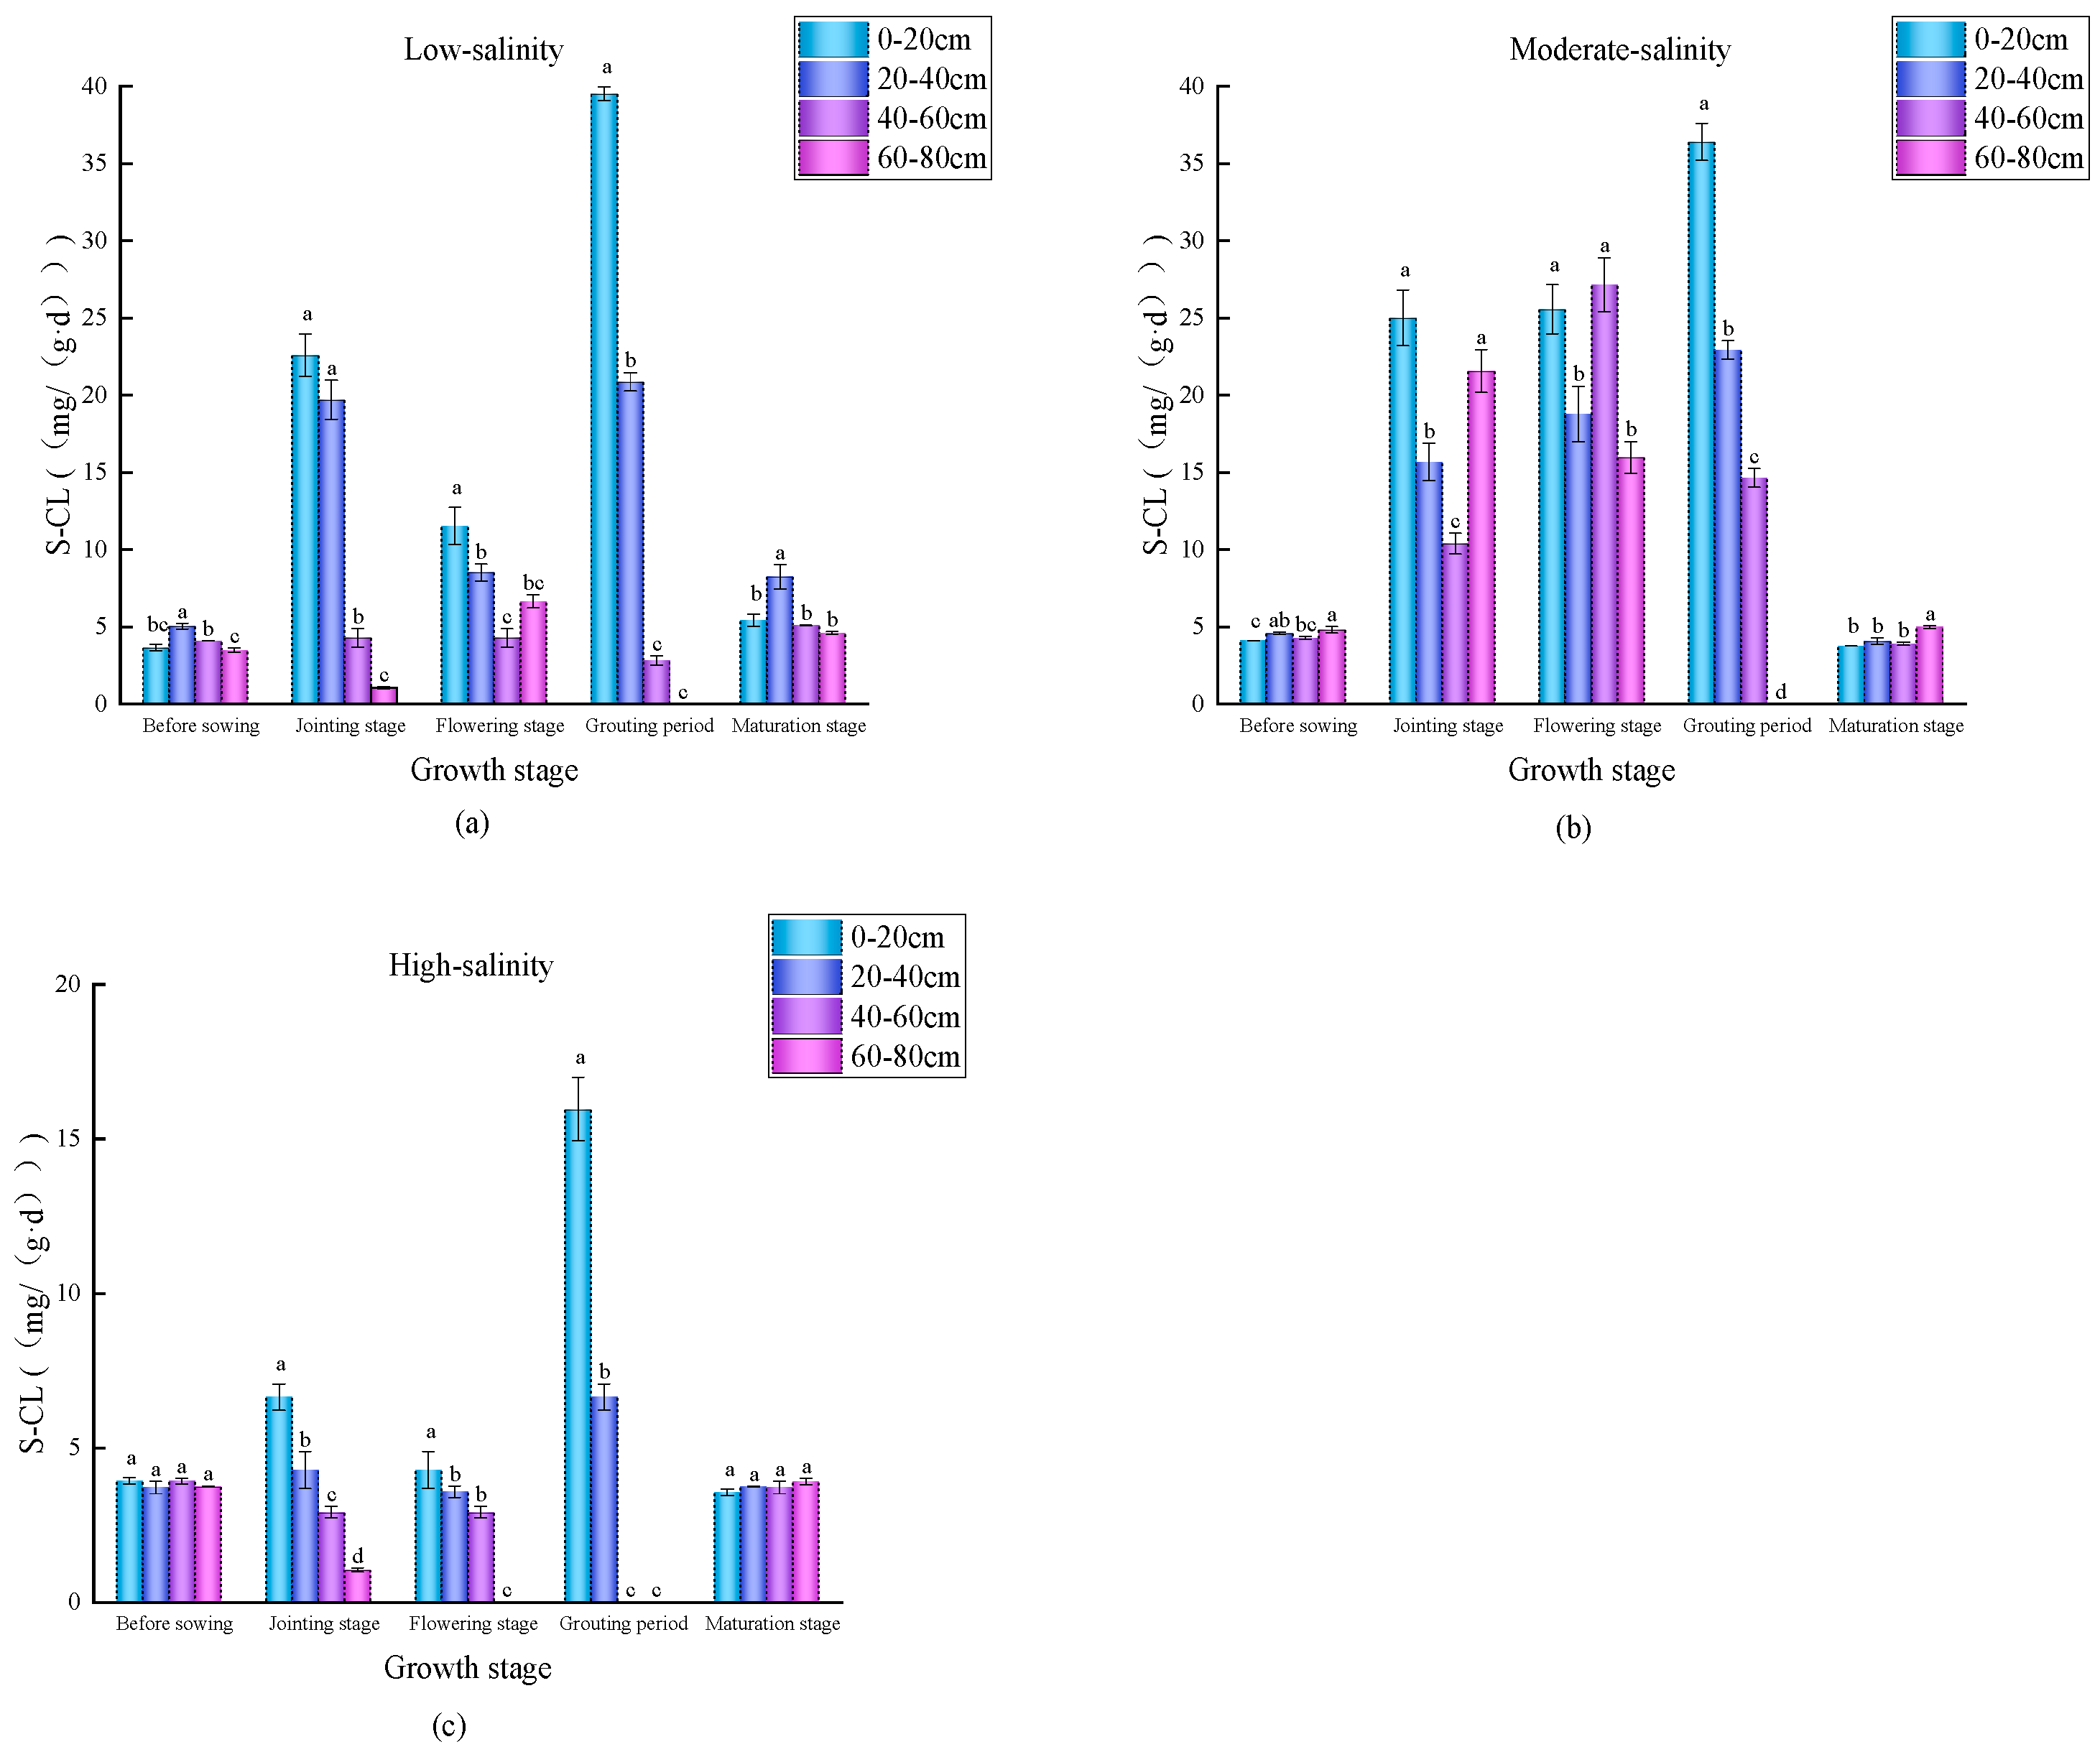
As shown in Figure 9, moderate-salinity fields exhibited significantly higher S-CL activity than both low- and high-salinity fields. Temporally, peak S-CL activity occurred during the grain-filling stage in low- and high-salinity fields, whereas moderate-salinity fields reached peak activity at the flowering stage. Spatially, the tillage layer (0–20 cm) consistently demonstrated the highest S-CL activity during the jointing, flowering, and grain-filling stages across all salinity conditions. In contrast, variations between soil layers were less pronounced during the pre-sowing and maturity stages compared to those in other growth phases. This stratification could arise from concentrations of root exudates and organic residues in the tillage layer and salt leaching into deeper layers suppressing microbial activity in saline soils.

3.4. Correlation Between Soil Physicochemical Properties and Enzyme Activities

The Pearson correlation analysis between soil physicochemical properties and enzyme activities throughout the wheat growth cycle is presented in Figure 10 (Supplementary Table S3). In low-salinity wheat fields, S-SC activity exhibited a highly significant negative correlation with SWC (p ≤ 0.01) and highly significant positive correlations with EC, AK, and SOM (p ≤ 0.01). This activity also showed significant positive correlations with AP and TN (p ≤ 0.05). S-AL activity had a significant negative correlation with SWC (p ≤ 0.05) and highly significant positive correlations with EC and TN (p ≤ 0.01). S-CL activity showed a significant negative correlation with SWC (p ≤ 0.05), significant positive correlations with AP and TN (p ≤ 0.05), and a highly significant positive correlation with AK (p ≤ 0.01). These results suggest that SWC inhibits all three enzymes (especially S-SC) in low-salinity fields, likely due to the dilution of substrates and enzymes, thereby reducing reaction efficiency. In moderate-salinity wheat fields, S-SC activity was significantly positively correlated with AK (p ≤ 0.01) and SOM (p ≤ 0.05). S-AL activity had a significant negative correlation with SWC (p ≤ 0.05). AP showed significant positive correlations with S-AL and S-CL activities (p ≤ 0.05), while TN had highly significant positive correlations with both enzymes (p ≤ 0.01). Thus, increasing TN enhances S-AL and S-CL activities, whereas elevated AK promotes S-SC activity. In high-salinity wheat fields, S-SC activity showed highly significant positive correlations with EC and AP (p ≤ 0.01). S-AL activity had a significant positive correlation with EC (p ≤ 0.05) and a highly significant positive correlation with AP (p ≤ 0.01). S-CL activity exhibited significant positive correlations with EC (p ≤ 0.05) and AP (p ≤ 0.05), and a highly significant positive correlation with TN (p ≤ 0.01; AK mentioned in the original was inconsistent and removed based on context). These results indicate that EC and AP exert stronger influences on all three enzyme activities than other soil properties under high salinity.
The redundancy analysis (RDA) between soil physicochemical properties and enzyme activities (as Figure 11) revealed distinct drivers across salinity gradients (Supplementary Table S4). In low-salinity fields, the combined physicochemical indicators (SWC, EC, A-P, AK, SOM, and TN) explained 87.8% of the variation in soil enzyme activities. The first and second RDA components contributed 85.87% and 1.93% to the total variance, respectively. Key drivers were AK (67.6%, F = 26.3, p = 0.002) and EC (21.2%, F = 14.4, p = 0.002). In moderate-salinity fields, physicochemical properties collectively explained 69.19% of enzyme activity variation. The first component contributed 50.21%, while the second accounted for 18.98%. Dominant factors included TN (48.6%, F = 9.1, p = 0.002) and AK (28.8%, F = 7.3, p = 0.008). In high-salinity fields, the indicators explained 70.16% of the variation, with component contributions of 65.72% (first) and 4.44% (second). EC (67%, F = 16, p = 0.002) and SOM (19%, F = 5.7, p = 0.02) were the primary impact factors.

4. Discussion

4.1. Characteristics of Water and Salt Transport in Different Salinized Wheat Fields

The Yellow River Delta contains approximately 0.9 million hectares of saline land, representing about 6% of China’s total saline land area, primarily distributed along the Bohai Rim. Here, arable saline land occupies approximately 0.27 million hectares, accounting for 54.7% of the regional saline area [30]. Salinization alters soil structure, causing compaction, poor aeration, and impeded water infiltration, which promotes salt accumulation on the surface and ultimately disrupts crop growth [31]. One principle observed in coastal saline areas is that “salt moves with water inflow and outflow”. This principle demonstrates a significant positive correlation between cumulative soil water evaporation and salt accumulation [32]. In high-salinity environments, SWC decreases as elevated osmotic pressure in the soil solution impairs water retention capacity [33]. As a natural solvent for soil salts, water dissolves and transports soluble mineral salts during its movement. Surface salts dissolve and migrate to deeper soil layers during rainfall or irrigation, but water evaporation drives salts upward, accumulating in the topsoil under arid conditions [34]. Crop growth in coastal saline land could be damaged by both soil properties and saline ground water because the roots penetrate the deeper soil layer, with growth inhibited by the distribution of SWC and salinity [35]. SWC is closely related to salinity levels and decreased with increases in salinity levels across the three wheat fields in this study, consistent with the results of Xu et al. [36]. Additionally, the distribution characteristics of salt differ across the various soil layers because of SWC. In the low-salinity fields, salts accumulation was primarily distributed in the tillage layer (0–20 cm) and the deepest layer (80–100 cm). Salt distribution was relatively uniform in the moderate-salinity fields. In contrast, salt accumulation was concentrated in the tillage layer (0–20 cm) in high-salinity fields. This result indicates that layer-specific salinity exists in the wheat fields and that salt accumulation is distributed in the tillage layer (0–20 cm) in highly saline soils, while uniform or dual-layer distribution occurs under lower salinity.

4.2. Temporal and Spatial Variation Characteristics of Soil Nutrients and Enzyme Activities in Differently Salinized Wheat Fields

In soil studies in Isfahan, Iran, higher levels of A-P and AK were found in the topsoil [37]. The spatial distribution of SOM in farmland soil in eastern China is affected by climate, but the SOM content in surface soil is relatively high due to plant residues and artificial fertilization [38]. The results showed that the contents of soil nutrients (A-P, AK, SOM, and TN) in the three different salinized wheat fields corresponded to a higher trend in surface soil, which was consistent with the results of previous studies.
During different growth stages of wheat, soil nutrients such as A-P, AK, TN, and SOM showed obvious dynamic changes [39,40]. Such changes may be the result of crop absorption, root activity, fertilization, soil microbial action, and environmental factors. Meanwhile, we found that the content of A-P was highest in the low-salinity wheat field, the content of TN was highest in the medium-salinity wheat field, and the content of SOM and AK was highest in the high-salinity wheat field. In wheat field soil, phosphorus decomposing bacteria can activate phosphorus in calcium phytate, thereby increasing the A-P content [41]. A low-salinity environment is beneficial to the activity of these bacteria, which may indirectly promote the release of A-P in soil. Under medium salinity condition, the ratio of Na+ to K+ in soil may be closer to the tolerance threshold of plants, thereby reducing the interference of salt stress on the root absorption function. SOM content is positively correlated with microbial activity, while increased salinity inhibits the microbial metabolism of carbon sources and reduces SOM content [42]. Under a low-salinity environment, the EC value is low, which reduces the competitive adsorption of potassium ions and makes it easier for AK to be preserved in soil [43]. However, contrary to previous studies, a high-salinity environment may form an ecological niche conducive to SOM accumulation by regulating microbial functional groups, changing the chemical structure of SOM, and enhancing physical protection. However, long-term high salt stress may also lead to an imbalance of nutrient cycling by inhibiting microbial diversity.
S-SC and S-AL in the upper soil layers of different vegetation types were higher than those in the lower soil layers [13]. S-CL mainly was concentrated around 0–20 cm and increased continuously with an increase in straw incorporation years. The activity after 7 years was 19% higher than that of the control group [44]. The soil enzyme activities of three different salinized wheat fields showed a trend of decreasing gradually with an increase in soil depth. Due to the existence of plant residues and root exudates, tillage soil provides raw materials for enzymatic reactions. The suitable environment of this soil enhances the activity of microorganisms and accelerates the enzymatic reaction of soil. Soil enzyme activities showed significant differences at different growth stages of wheat and varied in different salinized wheat fields. These differences were mainly due to the combined effects of root exudates, microbial communities, soil temperature and humidity, and nutrient requirements. Meanwhile, we also found that S-SC and S-AL were highest in the low-salinity wheat field but that S-CL was higher in the medium-salinity wheat field, which may be because the medium-salinity wheat field transformed salt stress into the driving force of S-CL high expression, thus realizing a reverse response of enzyme activity higher than that of the low-salinity soil.

4.3. Correlations Between Soil Physicochemical Factors and the Enzyme Activity of Carbon Metabolism in Different Salinized Wheat Fields

Soil carbon metabolism is the energy engine and material foundation for wheat growth, affecting nutrient uptake and yield. For every 1 ton per hectare increase in soil organic carbon, the global average wheat yield increases by 0.42 to 0.74 tons per hectare [45]. S-SC, S-AL, and S-CL directly drive soil carbon metabolism by catalyzing the decomposition of macromolecular organic carbon, and their activity variations not only affect carbon turnover efficiency but also regulate carbon pool stability and the microbial energy supply [46]. Variations in the activity of S-SC, S-AL, and S-CL across salinized wheat fields arise from differences in intrinsic soil physicochemical properties. On the one hand, enzyme activity is suppressed by water stress and salinity through osmotic imbalances, ion toxicity, and pH perturbation. High salinity dehydrates and lethally damages microorganisms, curtailing the substrate supply for enzyme synthesis [47]. Na+, Cl, and others disrupt enzyme protein structures, e.g., by inactivating the active site of amylase [48]. Salinization is often accompanied by an increase in pH, which changes the optimal catalytic environment of enzymes. On the other hand, a reciprocal type of feedback exists between soil nutrients and carbon-metabolizing enzymes. Increasing SOM enhances enzyme activity. For instance, the return of straw supplies substrates for S-CL, thereby promoting glucose production [49]. When soil salinity exceeds 3‰ (mass fraction), the microbial decomposition capacity is constrained. Consequently, organic matter fails to convert into enzymatic substrates, inducing a negative correlation between enzyme activity and SOM. This manifests as a ‘high-SOM, low-enzyme-activity’ regime due to undegraded SOM accumulation [50].
The results revealed some differences in the mechanisms of soil water, salt, and nutrients affecting enzyme activity in differently salinized wheat fields. Continuous flooding or alternate drying and wetting significantly reduced soil enzyme activity, while high-fertility soil could alleviate water stress on enzyme activity [51]. The results showed that SWC was negatively correlated with the activities of three enzymes in the low-salinity wheat field, which indicated that SWC was oversaturated in this area. When SWC continued to increase, soil microbial activities were inhibited, and soil enzyme activities decreased. AK is an important environmental factor affecting the activities of various soil enzymes. An increase in enzyme activity can increase the AK content in soil [52]. Similar to this study, AK contributed more to soil enzyme activity in low- and medium-salinity wheat fields with a positive correlation. TN in the soil surface layer was positively correlated with hydrolytic enzyme activity, and the correlation decreased gradually with an increase in soil depth [53]. In this study, TN and soil enzyme activities in the three salinized wheat fields showed a positive correlation, which was consistent with previous research results, and TN offered the highest contribution index to soil enzyme activities in wheat fields with medium salinity. Nitrogen, as a basic factor regulating soil microorganism and enzyme activity, provides direct support for microorganisms to synthesize enzyme proteins and utilize carbon sources, which is also an intuitive embodiment of carbon–nitrogen coupling.
Salt stress changes ion concentrations in the soil, further affecting microbial communities and enzyme reaction efficiency [16]. Mild salinity can slightly increase the activity of alkaline phosphate in soil, but severe salinity can inhibit the activity of soil enzymes [54]. In the soil studies of the three garden plants, it was further confirmed that high-concentration salt stress has an inhibitory effect on soil enzyme activity [55]. Interestingly, in this study, the EC values were significantly positively correlated with soil enzyme activities in both low- and high-salinity wheat fields, with contribution rates of 21.2% and 47.1%, respectively. Conversely, the EC values were not significantly correlated with soil enzyme activities in the medium-salinity wheat fields, with very low contribution rates. This results conflicts with previous studies [16,54,55], possibly due to changes in the ecological factors that dominate soil enzyme activity under different salinity levels. A slight increase in EC values in low-salinity wheat fields may increase the availability of soil nutrients, while an increase in nutrients may enhance soil microbial activity and community diversity, resulting in an increase in soil enzyme activity. Increases in the EC values in moderately saline wheat fields caused the effects of salt stress to increase. On the one hand, salt-sensitive microorganisms began to be inhibited, thereby reducing soil enzyme activity. On the other hand, the nutrient availability introduced by salt still exists, promoting enzyme activity. These two opposite effects indicate an insignificant correlation between EC and soil enzyme activity. However, in the high-salinity wheat field, when salinity exceeded a certain threshold, the soil environment was poor, and all the microorganisms that could not tolerate salt were eliminated. In this process, highly adaptive and salt-tolerant microorganisms evolved. In halophilic bacteria from Rajasthan, India, 34% of the strains produced S-CL, and 23% produced S-AL [56]. Bacillus licheniformis LRK1 and other strains can not only tolerate 15% NaCl but also produce a variety of hydrolytic enzymes at the same time [57]. In addition to microbial effects, plant residues also have significant effects on soil enzyme activities. In high-salinity wheat fields, the wheat plants burn out under the influence of salt stress, and dead plant residues enter the soil, providing a carbon source for microorganisms and increasing the SOM in the soil. This factor also led to the high SOM in the high-salinity wheat field in the present study.

5. Conclusions

This study investigated the characteristics of water–salt transport; the spatiotemporal distribution of nutrients; dynamic changes in carbon metabolism enzyme activities; and the correlations between water–salt parameters, nutrient factors, and enzyme activities in the soils of wheat fields with three salinity levels. The SWC, salinity, and wheat growth stages significantly influenced the patterns of water–salt movement, soil nutrient parameters (including the SOM, AP, AK, and TN contents at different soil depths), and the activities of S-SC, S-AL, and S-CL enzymes. Overall, the soil nutrients and enzyme activities of the three wheat fields were spatially concentrated in the 0–20 cm soil layer. A-P, S-SC, and S-AL were highest in the low-salinity wheat field, TN and S-CL were highest in the medium-salinity wheat field, and AK and SOM were highest in the high-salinity wheat field. Redundancy analysis showed that EC and AK offered higher contribution rates to soil enzyme activities in the low-salinity wheat field, TN and AK offered higher contribution rates to soil enzyme activities in the medium-salinity wheat field, and EC and SOM offered higher contribution rates to soil enzyme activities in the high-salinity wheat field.
For wheat cultivation in saline soils, tailored fertilizer management strategies are required across different salinity levels. In low-salinity fields, balanced fertilization with well-decomposed organic manure should be employed to enhance soil buffering capacity, while optimizing the nitrogen–potassium ratio to stimulate urease and S-CL enzyme activities. For moderate-salinity fields, synergistic potassium–nitrogen management is essential due to the dominant regulation of enzyme activities by AK and TN, with the controlled-release nitrogen fertilizer application rates reduced by 20% to mitigate osmotic stress. Genetically, selecting salt-tolerant wheat cultivars exhibiting 3- to 5-fold increases in peroxidase gene expression under high salinity is critical [58]. In high-salinity fields, where salinity severely inhibits microbial decomposition and reduces SOM mineralization (limiting available nitrogen conversion), controlled-release nitrogen fertilizer should replace conventional urea. This measure would ensure that nitrogen availability synchronizes with peak wheat growth demand, minimizing leaching losses under osmotic stress.

Supplementary Materials

The following supporting information can be downloaded at: https://www.mdpi.com/article/10.3390/su17198566/s1, Figure S1: Collection of field soil samples. Table S1: Dynamic changes of A-P, AK, SOM and TN contents in 0–80 cm soil layer of different salinized wheat fields. Table S2: Dynamic changes of S-SC, S-AL and S-CL activities in 0–80 cm soil layer of different salinized wheat fields. Table S3: P-value of correlation analysis results. Table S4: Results of redundancy analysis between soil physical and chemical properties (SWC, EC, A-P, AK, SOM, TN) and enzyme activities (S-SC, S-AL, S-CL) in wheat fields with different degrees of salinization.

Author Contributions

Conceptualization, S.Z. and J.W.; methodology, M.L. and S.Z.; software, M.L. and X.S.; data analysis, M.L. and S.Z.; investigation, M.L., S.G. (Sijia Guo) and S.G. (Sai Guan); resources, J.W. and J.X.; data curation, M.L., S.G. (Sijia Guo) and S.G. (Sai Guan); writing—original draft preparation, M.L. and S.Z.; writing—review and editing, S.Z., J.X. and D.Z.; supervision, Y.W. and S.Z.; project administration, Y.W. and S.Z.; funding acquisition, J.X. and J.L. All authors have read and agreed to the published version of the manuscript.

Funding

This research was funded by the Natural Science Foundation of Shandong Province (ZR2022QC121, ZR2023YQ024, ZR2019PC040), National Natural Science Foundation of China (32071954, 32302671), Youth Science and Technology Rising Star Program Project of Binzhou City (QMX2023002) and a PhD initiative project (2019Y17) from Shandong University of Aeronautics (formerly known as Binzhou University).

Institutional Review Board Statement

Not applicable.

Informed Consent Statement

Not applicable.

Data Availability Statement

Data are contained within the article and Supplementary Materials. Further inquiries can be directed to the corresponding author.

Conflicts of Interest

The authors declare no conflicts of interest.

Abbreviations

The following abbreviations are used in this manuscript:
SWCSoil water content
ECElectrical conductivity
A-PAvailable phosphorus
AKAvailable potassium
SOMSoil organic matter
TNTotal nitrogen
S-SCSucrase
S-ALAmylase
S-CLCellulase
RDARedundancy analysis

References

  1. Pistocchi, C.; Ragaglini, G.; Colla, V.; Branca, T.A.; Tozzini, C.; Romaniello, L. Exchangeable Sodium Percentage Decrease in Saline Sodic Soil after Basic Oxygen Furnace Slag Application in a Lysimeter Trial. J. Environ. Manag. 2017, 203, 896–906. [Google Scholar] [CrossRef]
  2. Daliakopoulos, I.N.; Tsanis, I.K.; Koutroulis, A.; Kourgialas, N.N.; Varouchakis, A.E.; Karatzas, G.P.; Ritsema, C.J. The Threat of Soil Salinity: A European Scale Review. Sci. Total Environ. 2016, 573, 727–739. [Google Scholar] [CrossRef] [PubMed]
  3. Xu, C.; Dong, Y.; Lu, J.; Zhang, Y.; Cheng, M.; Cheng, M.; Ma, J. Research Progress of Soil Improvement and Soil Resources Utilization of Coastal Saline-alkaline Land in China. World For. Res. 2020, 33, 68–73. (In Chinese) [Google Scholar] [CrossRef]
  4. Li, X.; Xia, J.; Zhao, X.; Chen, Y. Effects of Planting Tamarix Chinensis on Shallow Soil Water and Salt Content under Different Groundwater Depths in the Yellow River Delta. Geoderma 2019, 335, 104–111. [Google Scholar] [CrossRef]
  5. Sun, H.; Qu, J.; Wang, X.; Zheng, W.; Li, C.; Liu, Y. The response of soil organic nitrogen fractions and nitrogen availability to salinity in saline soils of the Yellow River Delta. Chin. J. Eco-Agric. 2021, 29, 1397–1404. (In Chinese) [Google Scholar] [CrossRef]
  6. De Souza Cruz, D.L.; Do Vale Júnior, J.F.; Timoni Camargo Neves, L.; De Brito Carvalho, L.; Koblam Ahouangbonou, O.R. Soil Physical Quality: A Comprehensive Analysis of Its Importance for Agricultural Production. AGRO@MBIENTE ON-LINE 2024, 18, 1–23. [Google Scholar] [CrossRef]
  7. Wang, Y.; Guo, H.; Li, J.; Shi, C. Influence of Different Soil Organic Reconstruction Methods on Microstructure of Saline-Alkali Soil. J. Irrig. Drain. 2019, 38, 75–78. (In Chinese) [Google Scholar] [CrossRef]
  8. Zhang, L.; Zhao, L.; Yi, H.; Lan, S.; Chen, L.; Han, G. Nitrogen Addition Alters Plant Growth in China’s Yellow River Delta Coastal Wetland through Direct and Indirect Effects. Front. Plant Sci. 2022, 13, 1016949. [Google Scholar] [CrossRef]
  9. Alharbi, K.; Alnusairi, G.S.H.; Alnusaire, T.S.; Alghanem, S.M.S.; Alsudays, I.M.; Alaklabi, A.; Soliman, M.H. Potassium Silica Nanostructure Improved Growth and Nutrient Uptake of Sorghum Plants Subjected to Drought Stress. Front. Plant Sci. 2024, 15, 1425834. [Google Scholar] [CrossRef] [PubMed]
  10. Song, H.J.; Galgo, S.J.C.; Turner, B.L.; Mishra, U.; Kim, P.J. Greater Root Biomass Offsets Soil Organic Carbon Loss under Climate Impact in Rice Paddies. Soil Biol. Biochem. 2025, 209, 109888. [Google Scholar] [CrossRef]
  11. Duan, F.; Tan, F.; Zhao, X.; Feng, H.; Wang, J.; Peng, H.; Zhang, N.; Huang, Y. Microbial Life Strategies-Mediated Differences in Carbon Metabolism Explain the Variation in SOC Sequestration between Kandelia Obovata and Sonneratia Apetala. For. Ecosyst. 2025, 14, 100341. [Google Scholar] [CrossRef]
  12. Xu, X.; Schimel, J.P.; Janssens, I.A.; Song, X.; Song, C.; Yu, G.; Sinsabaugh, R.L.; Tang, D.; Zhang, X.; Thornton, P.E. Global Pattern and Controls of Soil Microbial Metabolic Quotient. Ecol. Monogr. 2017, 87, 429–441. [Google Scholar] [CrossRef]
  13. Wang, H.; Wu, J.; Li, G.; Yan, L. Changes in Soil Carbon Fractions and Enzyme Activities under Different Vegetation Types of the Northern Loess Plateau. Ecol. Evol. 2020, 10, 12211–12223. [Google Scholar] [CrossRef] [PubMed]
  14. Lebedev, V.; Lebedeva, T.; Tikhonova, E.; Shestibratov, K. Assessing Impacts of Transgenic Plants on Soil Using Functional Indicators: Twenty Years of Research and Perspectives. Plants 2022, 11, 2439. [Google Scholar] [CrossRef] [PubMed]
  15. Wu, H.; Chu, S.; Ouyang, X.; Zou, Z.; Fu, H.; Liu, Y.; Shi, X.; Zhang, Y.; Ouyang, K.; Zhang, L.; et al. Effects of Cow-Dung Vermicomposting on Soil Carbon Mineralization and Temperature Sensitivity in Camellia Oleifera Forest. Agriculture 2024, 14, 1973. [Google Scholar] [CrossRef]
  16. Han, D.; Zhang, D.; Han, D.; Ren, H.; Wang, Z.; Zhu, Z.; Sun, H.; Wang, L.; Qu, Z.; Lu, W.; et al. Effects of Salt Stress on Soil Enzyme Activities and Rhizosphere Microbial Structure in Salt-Tolerant and-Sensitive Soybean. Sci. Rep. 2023, 13, 17057. [Google Scholar] [CrossRef]
  17. Sritongon, N.; Sarin, P.; Theerakulpisut, P.; Riddech, N. The Effect of Salinity on Soil Chemical Characteristics, Enzyme Activity and Bacterial Community Composition in Rice Rhizospheres in Northeastern Thailand. Sci. Rep. 2022, 12, 20360. [Google Scholar] [CrossRef]
  18. Qu, Y.; Tang, J.; Liu, B.; Lyu, H.; Duan, Y.; Yang, Y.; Wang, S.; Li, Z. Rhizosphere Enzyme Activities and Microorganisms Drive the Transformation of Organic and Inorganic Carbon in Saline–Alkali Soil Region. Sci. Rep. 2022, 12, 1314. [Google Scholar] [CrossRef]
  19. Cheng, Y.; Bai, T.; Hu, J.; Yang, J.; Liu, Q.; Ge, Y.; Xiao, X.; Zhou, Z.; He, H. Drainage for decreasing salt affects the soil properties and microbial community diversity in coastal saline-alkali land. Acta Microbiol. Sin. 2025, 65, 2479–2498. (In Chinese) [Google Scholar] [CrossRef]
  20. Xie, X.; Pu, L.; Wang, Q.; Zhu, M.; Xu, Y.; Zhang, M. Response of Soil Physicochemical Properties and Enzyme Activities to Long-Term Reclamation of Coastal Saline Soil, Eastern China. Sci. Total Environ. 2017, 607–608, 1419–1427. [Google Scholar] [CrossRef] [PubMed]
  21. Wang, Z.-G.; Bao, X.-G.; Li, X.-F.; Jin, X.; Zhao, J.-H.; Sun, J.-H.; Christie, P.; Li, L. Intercropping Maintains Soil Fertility in Terms of Chemical Properties and Enzyme Activities on a Timescale of One Decade. Plant Soil 2015, 391, 265–282. [Google Scholar] [CrossRef]
  22. Meena, S.N.; Sharma, S.K.; Singh, P.; Meena, B.P.; Ram, A.; Meena, R.L.; Singh, D.; Meena, R.B.; Nogiya, M.; Jain, D.; et al. Comparative Analysis of Soil Quality and Enzymatic Activities under Different Tillage Based Nutrient Management Practices in Soybean–Wheat Cropping Sequence in Vertisols. Sci. Rep. 2024, 14, 6840. [Google Scholar] [CrossRef] [PubMed]
  23. Shiferaw, B.; Smale, M.; Braun, H.-J.; Duveiller, E.; Reynolds, M.; Muricho, G. Crops That Feed the World 10. Past Successes and Future Challenges to the Role Played by Wheat in Global Food Security. Food Secur. 2013, 5, 291–317. [Google Scholar] [CrossRef]
  24. O’Kelly, B.C. Accurate Determination of Moisture Content of Organic Soils Using the Oven Drying Method. Dry. Technol. 2004, 22, 1767–1776. [Google Scholar] [CrossRef]
  25. Holford, I.C.R. Soil Phosphorus: Its Measurement, and Its Uptake by Plants. Soil Res. 1997, 35, 227. [Google Scholar] [CrossRef]
  26. Jadoon, S.; Aljaff, H.K.; Hamawandy, J.K.; Pashdary, S.S.; Zakhoy, A.S. Assessment of the Available Potassium in the Soil of Baharka District, Kurdistan-Iraq. Der Pharma Chem. 2015, 7, 1–8. [Google Scholar]
  27. Liu, B.; Chen, H. The Method of Measuring Organic Matter in Soil. Guangdong Chem. Ind. 2017, 44, 238–240. (In Chinese) [Google Scholar]
  28. Sáez-Plaza, P.; Michałowski, T.; Navas, M.J.; Asuero, A.G.; Wybraniec, S. An Overview of the Kjeldahl Method of Nitrogen Determination. Part I. Early History, Chemistry of the Procedure, and Titrimetric Finish. Crit. Rev. Anal. Chem. 2013, 43, 178–223. [Google Scholar] [CrossRef]
  29. Feng, C.; Yi, Z.; Qian, W.; Liu, H.; Jiang, X. Rotations Improve the Diversity of Rhizosphere Soil Bacterial Communities, Enzyme Activities and Tomato Yield. PLoS ONE 2023, 18, e0270944. [Google Scholar] [CrossRef]
  30. Zuo, Q.; Wu, X.; Shi, J.; Wang, Q.; Liu, Z.; Zhu, A.; Yin, D.; Feng, Q.; Ji, W.; Kang, S. Constraints and Coordinated Allocation Strategies of Water and Land Resources for Sustainable Use of Coastal Saline-Alkali Land in the Yellow River Delta. Strateg. Study CAE 2023, 25, 169–179. (In Chinese) [Google Scholar] [CrossRef]
  31. Fan, X.; Liu, G.; Tang, Z.; Shu, L. Analysis on Main Contributors Influencing Soil Salinization of Yellow River Delta. J. Soil Water Conserv. 2010, 24, 139–144. (In Chinese) [Google Scholar] [CrossRef]
  32. Zhao, D.; Ma, H.; Li, S.; Qi, W. Seed Germination Demonstrates Inter-Annual Variations in Alkaline Tolerance: A Case Study in Perennial Leymus Chinensis. BMC Plant Biol. 2024, 24, 397. [Google Scholar] [CrossRef] [PubMed]
  33. Zhao, M.; Shen, S.; Wang, X.; Lv, Q.; Zhang, M.; Zhou, Y.; Yu, X. Distribution characteristics of soil carbon metabolism related enzyme activities under different vegetation types in Xianghai Wetland. J. Northeast. Norm. Univ. Nat. Sci. Ed. 2023, 55, 119–126. (In Chinese) [Google Scholar] [CrossRef]
  34. Gao, P. Spatial Multi-Scale Variation, Driving Mechanism, Prediction and Early Warning of Soil Salinization in the Coastal Area of the Yellow River Delta. Ph.D. Thesis, Shandong Agricultural University, Taian, China, 2022. (In Chinese). [Google Scholar]
  35. Li, Y.; Zhao, S.; Liu, G.; Li, J.; Siddique, K.H.M.; Zhao, D. Agronomic Traits, Nutrient Accumulation, and Their Correlations in Wheat, as Affected by Nitrogen Supply in Rainfed Coastal Saline Soils. Plants 2025, 14, 1022. [Google Scholar] [CrossRef]
  36. Xu, Y.; Kong, F.; Zhang, M.; Du, H.; Dai, S.; Zhang, Z. Effects of Initial Water and Salt Content on Permeability and Microstructure of Sodic-Saline Loessal Soils. Bull. Eng. Geol. Environ. 2024, 83, 496. [Google Scholar] [CrossRef]
  37. Kordlaghari, P.K.; Panahikordlaghari, S.; Rahimi, A. Variation in soil available phosphorus and potassium and their relationships with soil properties in some Isfahan soil series of Iran. Res. Crops 2013, 14, 604–607. [Google Scholar]
  38. Liu, S.; Xie, X.; Wang, X.; Feng, X.; Hou, X.; Wang, S.; Lin, K.; Huang, M.; Jia, S.; Hou, Y.; et al. Distribution Characteristics and Prediction Model of Farmland Soil Organic Carbon in Eastern China. Environ. Res. Commun. 2022, 4, 055012. [Google Scholar] [CrossRef]
  39. Ma, Q.; Wang, Z.; Hui, X.; Zhang, X.; Zhang, Y.; Hou, S.; Huang, N.; Luo, L.; Zhang, S.; Dang, H. Optimization of Phosphorus Rate and Soil Available Phosphorus Based on Grain Yield and Nutrient Contents in Dryland Wheat Production Scientia. Agric. Sin. 2019, 52, 73–85. (In Chinese) [Google Scholar]
  40. Li, M.; Yan, Y.; Li, M.; Shi, L.; Kem, S.P.D.; Wang, X. Effects of rice straw returning combined with nitrogen fertilizer on carbon and nitrogen of soil, and growth characteristics and yield of wheat. Hubei Agric. Sci. 2025, 64, 33–41, 55. (In Chinese) [Google Scholar] [CrossRef]
  41. Sun, Y.; Ye, S.; Fan, G.; Zhang, Y.; Liu, X.; Wu, D.; Wang, F. Isolation and Phosphate Solubilizing Capability of Phosphate-Solubilizing Bacteria in a Wheat Field. Acta Agric. Boreali-Occident. Sin. 2022, 31, 379–387. (In Chinese) [Google Scholar]
  42. Gao, W.; Yang, W.; He, J.; Jia, Y.; Xu, W.; Ma, H. Effects of biochar on soil microbial community metabolism in wheat field. Chin. J. Ecol. 2020, 39, 3998–4004. (In Chinese) [Google Scholar] [CrossRef]
  43. Chen, X.; Mi, Q.; Xu, X. Soil Microbial Community Construction Processes and Its Driving Factors in Wheat Field at Local-Scale. Soils 2023, 55, 812–820. (In Chinese) [Google Scholar] [CrossRef]
  44. Hou, J.; Zhang, S.; Yuan, J.; Cheng, S.; Liu, J.; Liu, S.; Liang, Y.; Ren, J.; Cai, H. Effects of maize straw-derived organic materials on improving soil nutrient availability and enzyme activities in a Mollisol. J. Plant Nutr. Fertil. 2021, 27, 610–618. (In Chinese) [Google Scholar]
  45. Wang, N.; Ai, Z.; Zhang, Q.; Leng, P.; Qiao, Y.; Li, Z.; Tian, C.; Shi, X.; Cheng, H.; Chen, G.; et al. The Variations of Wheat–Maize Production, Soil Organic Carbon, and Carbon Footprints: Insights from a 20–Year on–Farm Observational Experiment in the North China Plain. Front. Plant Sci. 2025, 16, 1547431. [Google Scholar] [CrossRef]
  46. Feng, J.; Yu, D.; Sinsabaugh, R.L.; Moorhead, D.L.; Andersen, M.N.; Smith, P.; Song, Y.; Li, X.; Huang, Q.; Liu, Y.; et al. Trade-Offs in Carbon-Degrading Enzyme Activities Limit Long-Term Soil Carbon Sequestration with Biochar Addition. Biol. Rev. 2023, 98, 1184–1199. [Google Scholar] [CrossRef]
  47. Yin, Y.; Zhang, Z.; Yang, K.; Gu, P.; Liu, S.; Jia, Y.; Zhang, Z.; Wang, T.; Yin, J.; Miao, H. Deeper Insight into the Effect of Salinity on the Relationship of Enzymatic Activity, Microbial Community and Key Metabolic Pathway during the Anaerobic Digestion of High Strength Organic Wastewater. Bioresour. Technol. 2022, 363, 127978. [Google Scholar] [CrossRef]
  48. Yang, Z.; Nan, H.; Lu, X.; Dai, M.; Zhao, K.; Fan, Y.; Zhu, X.; Zhang, M.; Wang, L.; Sun, Y.; et al. GhDMT7-mediated DNA Methylation Dynamics Enhance Starch and Sucrose Metabolism Pathways to Confer Salt Tolerance in Cotton. Plant J. 2025, 123, e70364. [Google Scholar] [CrossRef]
  49. Yang, Q.; Sun, Y.; Wang, H.; Pan, H.; Lou, Y.; Zhu, G. Research Progress and Prospect of Saline-alkali Land Improvement and Comprehensive Utilization Technology. J. Shandong Agric. Univ. Nat. Sci. Ed. 2025, 56, 384–395. (In Chinese) [Google Scholar]
  50. Chen, M.; Kuzyakov, Y.; Zhou, J.; Zamanian, K.; Wang, S.; Abdalla, K.; Wang, J.; Li, X.; Li, H.; Zhang, H.; et al. High Soil Salinity Reduces Straw Decomposition but Primes Soil Organic Carbon Loss. Soil Biol. Biochem. 2025, 207, 109835. [Google Scholar] [CrossRef]
  51. Li, W.; Wu, M.; Liu, M.; Jiang, C.; Chen, X.; Kuzyakov, Y.; Rinklebe, J.; Li, Z. Responses of Soil Enzyme Activities and Microbial Community Composition to Moisture Regimes in Paddy Soils Under Long-Term Fertilization Practices. Pedosphere 2018, 28, 323–331. [Google Scholar] [CrossRef]
  52. Tang, J.; Zhang, L.; Zhang, J.; Ren, L.; Zhou, Y.; Zheng, Y.; Luo, L.; Yang, Y.; Huang, H.; Chen, A. Physicochemical Features, Metal Availability and Enzyme Activity in Heavy Metal-Polluted Soil Remediated by Biochar and Compost. Sci. Total Environ. 2020, 701, 134751. [Google Scholar] [CrossRef] [PubMed]
  53. Ma, Z.; Xu, W.; Chen, Y.; Liu, M.; Wen, J. A Study of the Influence of the Type of Land Use on the Enzymatic Activity of Soils in Southwestern China. Forests 2024, 15, 581. [Google Scholar] [CrossRef]
  54. Deng, D.; Li, D.; Zhai, Z.; Deng, T.; Wang, J.; Huang, J. Effects of Applying Microbial Fertilizer on Physical and Chemical Properties and Enzyme Activities of Citrus Soil under Salt Stress. Nat. Sci. Hainan Univ. 2020, 38, 226–232. (In Chinese) [Google Scholar] [CrossRef]
  55. Zou, X.; Zheng, X.; Lie, Z.; Xue, L. Responses of soil element and enzyme activity of landscape plants of three species to salt stress. J. Cent. South Univ. For. Technol. 2018, 38, 41–49. (In Chinese) [Google Scholar] [CrossRef]
  56. Yadav, D.; Singh, A.; Mathur, N.; Agarwal, A.; Sharma, J. Isolation of Halophilic Bacteria and Their Screening for Extracellular Enzyme Production. J. Sci. Ind. Res. 2021, 80, 617–622. [Google Scholar] [CrossRef]
  57. Purohit, M.S.; Tipre, D.R.; Shah, M.B.; Dave, S.R. Isolation of halotolerant and halophilic bacteria and screening of their poly enzyme potential. Indian J. Mar. Sci. 2016, 45, 129–136. [Google Scholar]
  58. Sun, J.; Wang, X. Effects of Salt Stress on Gene Expression of Peroxidase Isozyme in Wheat. J. Triticeae Crops 2006, 42–44, 61. (In Chinese) [Google Scholar]
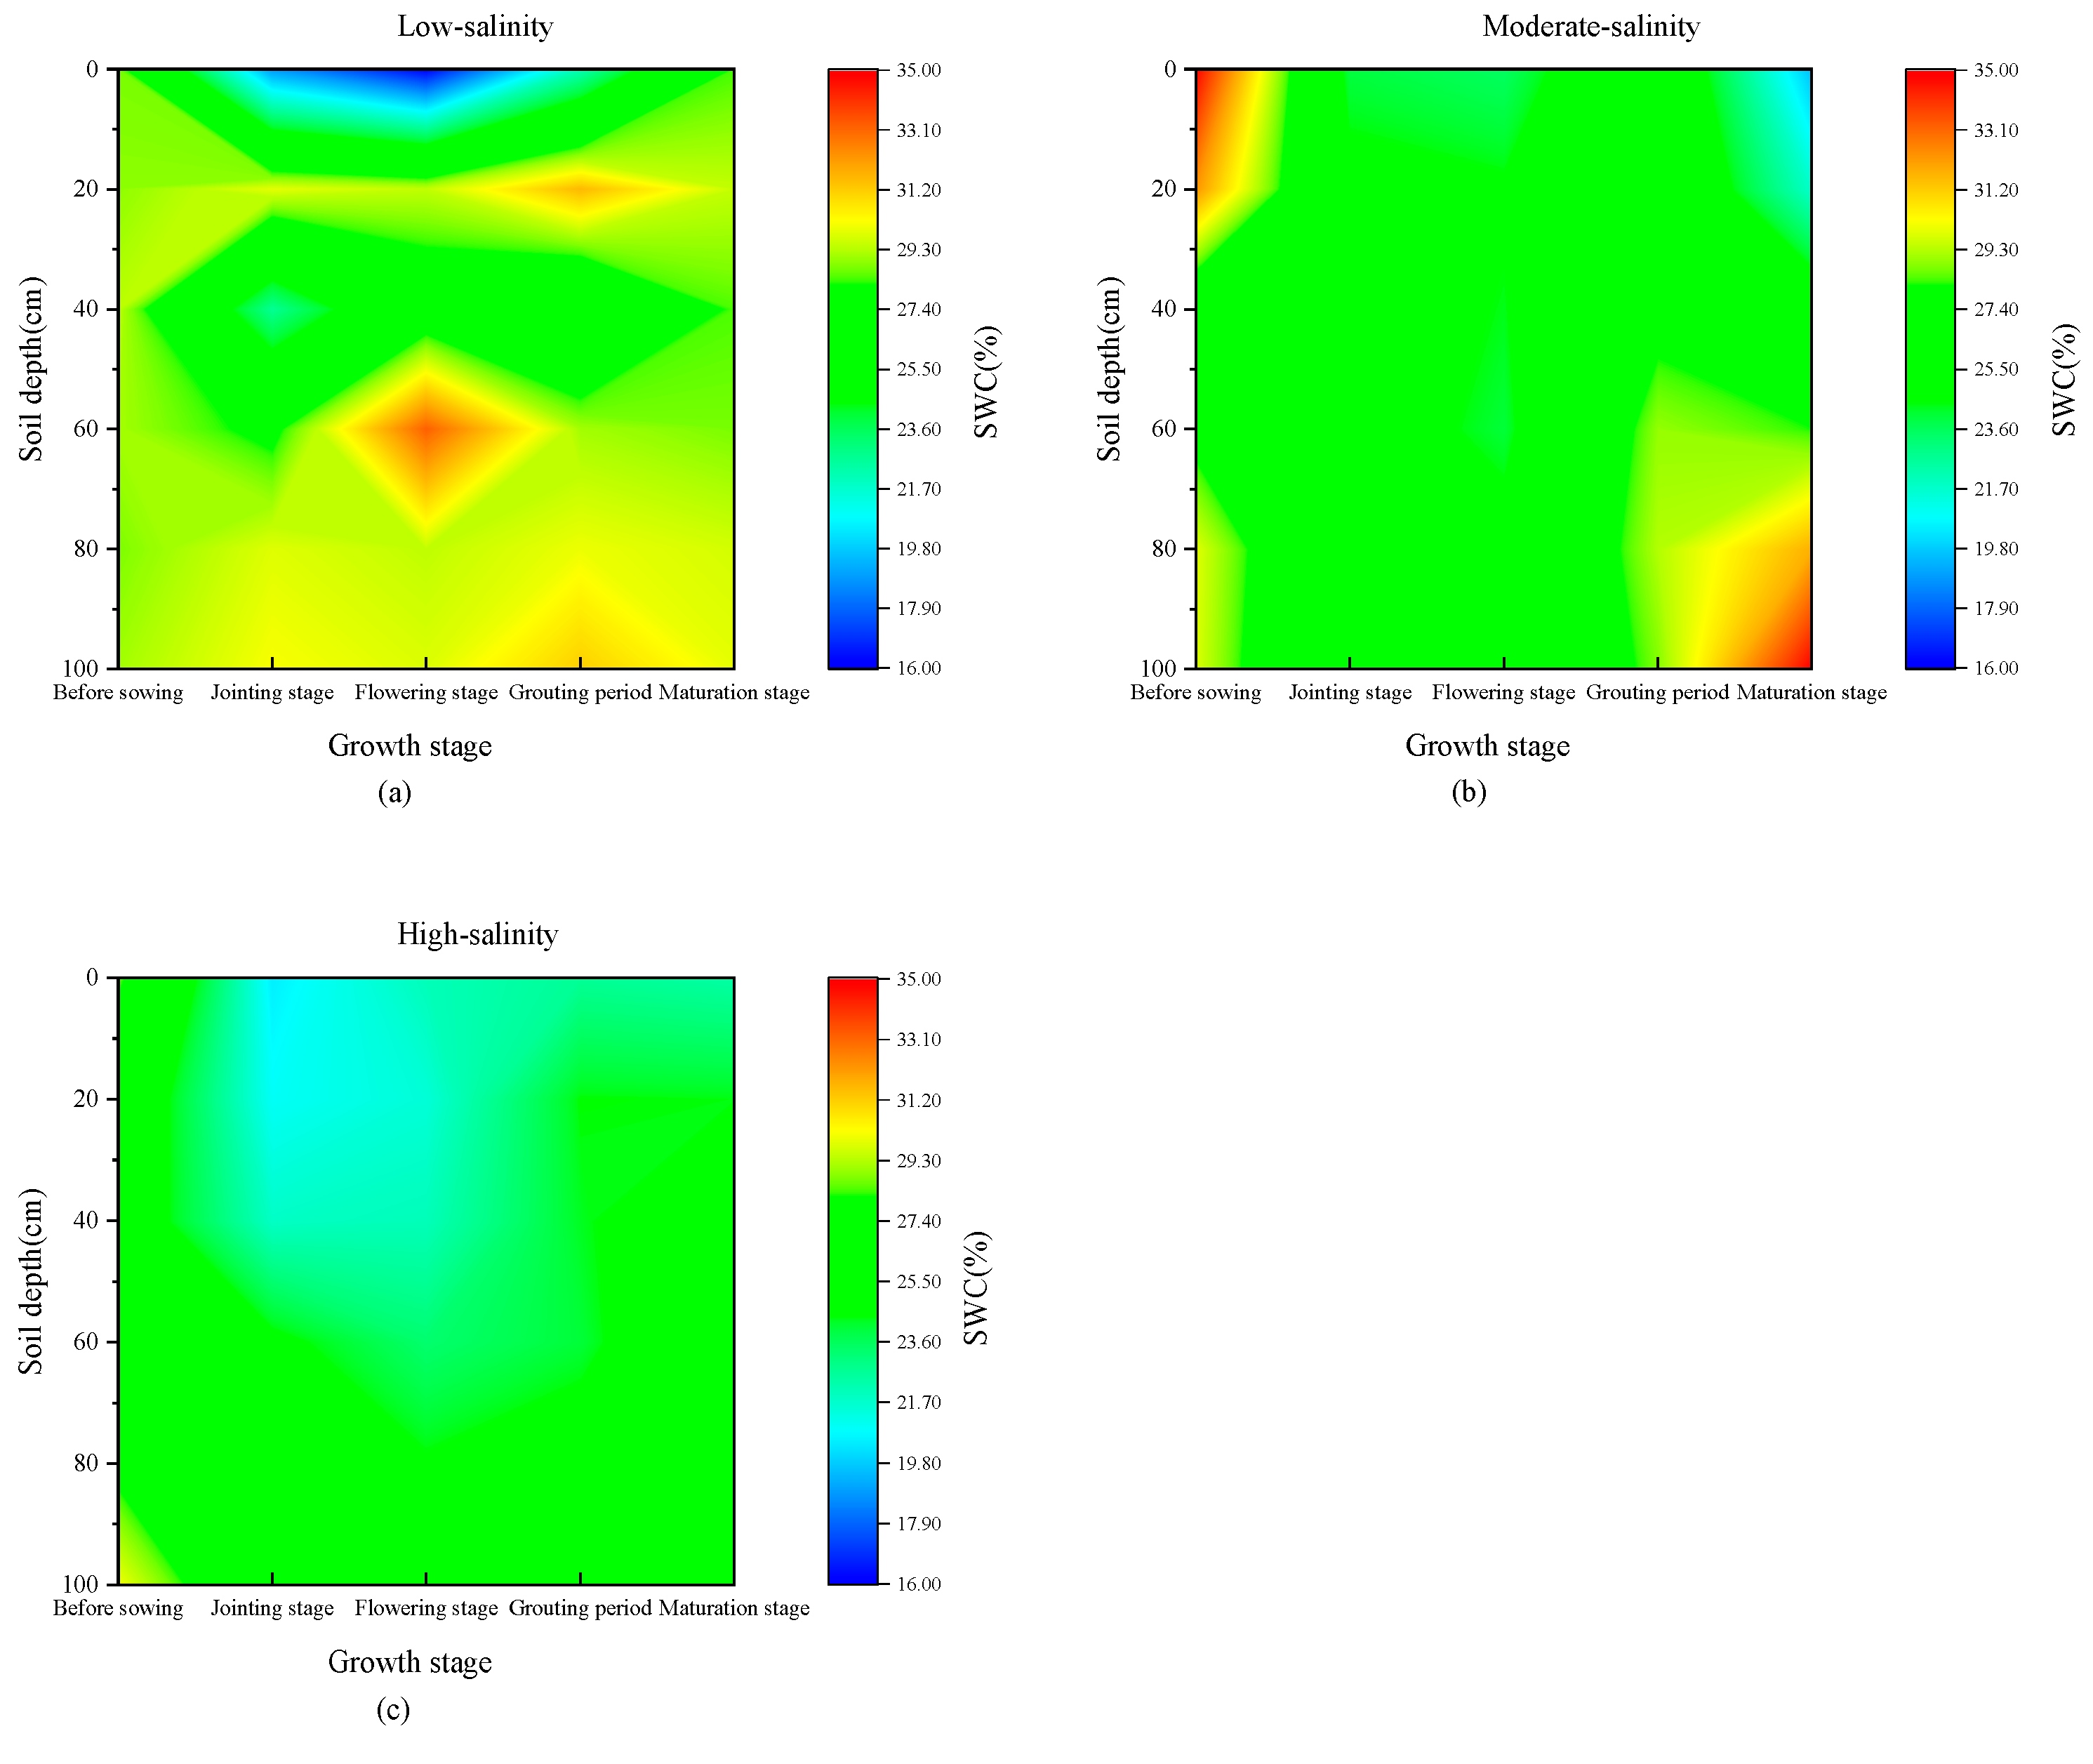
Figure 1. Temporal and spatial variation characteristics of SWC in wheat fields with different salinity levels. (a) low salinity; (b) moderate salinity; (c) high salinity.
Sustainability 17 08566 g001
Figure 2. Temporal and spatial variation characteristics of EC in different salinized wheat fields. (a) low salinity; (b) moderate salinity; (c) high salinity.
Sustainability 17 08566 g002
Figure 3. Dynamic changes in A-P in the 0–80 cm soil layers of differently salinized wheat fields. Note: The soil nutrient and enzyme activity levels below 80 cm were extremely low, so determination of the soil nutrients and enzyme activity in this experiment was conducted between 0 and 80 cm. Different lowercase letters in the figure indicate significant differences between soil layers (p < 0.05). This convention applies throughout the subsequent analyses, with the same below. (a) low salinity; (b) moderate salinity; (c) high salinity.
Sustainability 17 08566 g003
Figure 4. Dynamic changes in AK in the 0–80 cm soil layers of differently salinized wheat fields. (a) low salinity; (b) moderate salinity; (c) high salinity. Different lowercase letters in the figure indicate significant differences between soil layers (p < 0.05).
Sustainability 17 08566 g004
Figure 5. Dynamic changes in SOM in the 0–80 cm soil layers of differently salinized wheat fields. (a) low salinity; (b) moderate salinity; (c) high salinity. Different lowercase letters in the figure indicate significant differences between soil layers (p < 0.05).
Sustainability 17 08566 g005
Figure 6. Dynamic changes in TN in the 0–80 cm soil layers of differently salinized wheat fields. (a) low salinity; (b) moderate salinity; (c) high salinity. Different lowercase letters in the figure indicate significant differences between soil layers (p < 0.05).
Sustainability 17 08566 g006
Figure 7. Dynamic changes in S-SC in the 0–80 cm soil layers of differently salinized wheat fields. (a) low salinity; (b) moderate salinity; (c) high salinity. Different lowercase letters in the figure indicate significant differences between soil layers (p < 0.05).
Sustainability 17 08566 g007
Figure 8. Dynamic changes in S-AL in the 0–80 cm soil layers of differently salinized wheat fields. (a) low salinity; (b) moderate salinity; (c) high salinity. Different lowercase letters in the figure indicate significant differences between soil layers (p < 0.05).
Sustainability 17 08566 g008
Figure 9. Dynamic changes in S-CL in the 0–80 cm soil layers of different salinized wheat fields. (a) low salinity; (b) moderate salinity; (c) high salinity. Different lowercase letters in the figure indicate significant differences between soil layers (p < 0.05).
Sustainability 17 08566 g009
Figure 10. Correlation analysis of soil water, salt, nutrients, and enzyme activities in differently salinized wheat fields. Note: The different colors of the circles represent positive and negative correlations, and the sizes represent correlation coefficients. (*) indicates that the two metrics are significantly correlated at a 0.05 probability level; (**) indicates a highly significant correlation between the two indicators at a 0.01 probability level. (a) low salinity; (b) moderate salinity; (c) high salinity.
Sustainability 17 08566 g010
Figure 11. Redundancy analysis of soil water, salt, nutrients, and enzyme activities in differently salinized wheat fields. (a) low salinity; (b) moderate salinity; (c) high salinity.
Sustainability 17 08566 g011
Disclaimer/Publisher’s Note: The statements, opinions and data contained in all publications are solely those of the individual author(s) and contributor(s) and not of MDPI and/or the editor(s). MDPI and/or the editor(s) disclaim responsibility for any injury to people or property resulting from any ideas, methods, instructions or products referred to in the content.