Article

Ammonia Nitrogen Removal and MAP Crystal Morphology Affected by Reaction Conditions in High-Concentration Wastewater

1
College of Civil and Transportation Engineering, Shenzhen University, Shenzhen 518060, China
2
School of Metallurgy, Northeastern University, Shenyang 110819, China
3
GAD Environmental Technology Co., Ltd., Shenzhen 518067, China
4
Key Laboratory of Ecological Metallurgy of Multimetal Mineral, Ministry of Education, Shenyang 110819, China
5
School of Management Engineering, Zhengzhou University of Aeronautics, Zhengzhou 450046, China
*
Authors to whom correspondence should be addressed.
Sustainability 2025, 17(19), 8550; https://doi.org/10.3390/su17198550
Submission received: 5 August 2025 / Revised: 14 September 2025 / Accepted: 19 September 2025 / Published: 23 September 2025
(This article belongs to the Section Sustainable Water Management)

Abstract

The MAP (magnesium ammonium phosphate) method is a convenient and efficient approach for the recovery of ammonia nitrogen from high-concentration wastewater, with the resulting product being suitable for use as a slow-release fertilizer. The crystal morphology of MAP is a key indicator of its appropriateness for this application, yet there is a lack of systematic research on this topic. This paper explores the relationship between the efficiency of ammonia nitrogen removal, morphological characteristics of the product, and reaction conditions (i.e., pH, reaction temperature and time, phosphorus–nitrogen (n(P):n(N)) and magnesium–nitrogen mole ratios (n(Mg):n(N)), and stirring speed). The results show that the influence of the reaction parameters on the nitrogen removal efficiency decreases in this order: the pH > n(Mg):n(N) > the stirring speed > n(P):n(N). The highest ammonia nitrogen removal efficiency (97.97%) was achieved under the following optimal conditions: pH 9.5, n(Mg):n(N) = 1.3, n(P):n(N) = 1.0, a stirring speed of 150 rpm, a reaction time of 30 min, and a temperature of 30 °C. The obtained products were MAP crystals with different morphologies, which gradually transitioned from X- to needle-shaped with a decreasing crystal size as the values of the pH, n(Mg):n(N), stirring speed, and reaction time increased. These findings are relevant for both the effective removal of ammonia nitrogen from high-concentration wastewater and the control of MAP crystal morphology.

Graphical Abstract

1. Introduction

Ammonia nitrogen (NH3–N) is a critical pollutant in wastewater and is strictly regulated due to its ecological and health impacts. In China, although nutrient discharges have declined since 2016, legacy nitrogen contamination in rivers and groundwater remains widespread, often exceeding regulatory thresholds [1]. The implementation of Special Discharge Limits (SDL) has further tightened NH3–N standards, yet compliance frequently demands energy- and chemical-intensive upgrades, posing economic and operational challenges [2]. Similar issues are reported globally, underscoring the urgent need for more efficient and resource-oriented treatment technologies.
Ammonia nitrogen wastewater is commonly classified as high-concentration, medium-concentration, or low-concentration [3]. High-concentration ammonia nitrogen wastewater (HANW) generally refers to wastewater with an ammonia nitrogen concentration of more than 500 mg/L [4], whose sources include urban domestic sewage, landfill leachate, and industrial wastewater produced by the petroleum, printing and dyeing, pharmaceutical, leather, and other industries [5]. A common and significant challenge in the efficient treatment and recovery of high-concentration ammonia nitrogen wastewater is its high biotoxicity and poor biodegradability.
The common treatment methods and applicable scenarios for ammonia nitrogen wastewater are listed in Table A1. HANW represents a valuable “nutrient + energy + water” (NEW) resource [6,7]. Achieving the resource-oriented recovery of its constituent elements and its reuse as a water resource byproduct is of considerable significance [8,9]. Currently, the main resource recovery methods used include air-stripping, alkalization evaporation treatment, and magnesium ammonium phosphate (MAP, struvite) crystallization using ammonia nitrogen as a nutrient [10,11]. The air-stripping method can achieve relatively good removal in wastewater with an ammonia nitrogen concentration of 2000–4000 mg/L. The stripping efficiency is affected by a variety of factors which are difficult to control, especially the temperature [12], and the ammonia steam distillation method is generally suitable for use with wastewater with a medium ammonia nitrogen concentration of 3000–100,000 mg/L [13]. In alkalization evaporation treatment, high ammonia nitrogen concentrations may cause equipment corrosion or scaling, impairing operational stability, while low concentrations increase operating costs due to the high steam demand for heating [14]. The MAP crystallization method is suitable for medium- to high-concentration ammonia nitrogen wastewater (500–3000 mg/L) [15,16]. Struvite has the chemical formula MgNH4PO4·6H2O, is an inorganic compound formed from a chemical equilibrium reaction between ammonia, phosphate, and magnesium ions [17]. MAP precipitation has been demonstrated to occur safely and stably in complex wastewater matrices [18,19]. This process can be expressed as Equation (1):
N H 4 + + M g 2 + + H n P O 4 3 n + 6 H 2 O M g N H 4 P O 4 · 6 H 2 O + n H + ,         n = 0,1 , 2
Previous studies confirm that MAP precipitation can be safely achieved in complex wastewater and that struvite is a marketable slow-release fertilizer [17,19,20]. However, research efforts to date have largely focused on two directions: (i) the treatment and nutrient recovery from complex industrial wastewaters, where issues such as ion interference (Ca2+, heavy metals, organic matter) and product variability are critical [16]; and (ii) pilot- or full-scale applications, emphasizing nitrogen removal efficiency, energy consumption, and life-cycle assessment of process sustainability. While these are important for practical deployment, they often bypass systematic laboratory investigations of how fundamental reaction parameters control the morphology, size distribution, crystallinity, and purity of struvite crystals.
Crystal morphology and purity strongly determine the stability, settling, and reuse value of struvite products. By contrast, phosphorus recovery studies have shown that pH and supersaturation directly influence both removal efficiency and the particle characteristics of MAP [21,22]. For example, Shaddel used lab-scale batch experiments to vary supersaturation (via pH, Mg and NH4 concentrations) and quantified how these changes affect crystal size and morphology while also assessing phosphorus recovery and process performance [23]. In another study using digestate from anaerobic digestion, the effects of n(Mg):n(N), n(P):n(N), pH, and temperature on struvite yield and SEM-observed crystal morphology were systematically evaluated via Taguchi experimental design [24]. Similarly, studies in (synthetic or real) urine have shown that particle size, crystal habit, and separation behavior depend very sensitively on pH, supersaturation, and mixing intensity [25]. Extending such knowledge to nitrogen recovery is essential to provide the mechanistic understanding needed for optimizing product quality and supporting industrial-scale application.
The formation of struvite can include nucleation and crystallization processes, and its morphology is controlled by physicochemical factors [26]. In this study, single-factor experiments were conducted to investigate the influence of six key factors—the pH, temperature, reaction time, stirring speed, n(Mg):n(N), and n(P):n(N)—on the removal of nitrogen from high-ammonium nitrogen wastewater (HANW) via magnesium ammonium phosphate (MAP) precipitation. These experiments enabled a detailed analysis of how each factor affects the removal efficiency and product formation through crystallization during the MAP recycling process.
To better evaluate the complex relationships between the operational parameters and nitrogen removal efficiency, a comparative modeling framework was established using six machine learning regression algorithms, including linear regression, polynomial regression, Ridge Regression, Lasso Regression, Random Forest Regression, and Gradient Boosting Regression. Random Forest Regression (RFR) constructs multiple decision trees from bootstrap-resampled datasets and averages their predictions, offering high prediction accuracy, strong generalization, and effective mitigation of overfitting. This makes RFR particularly suitable for datasets with multiple variables and limited samples. Additionally, RFR’s ability to assess the feature importance allows for a clear understanding of each influencing factor’s relative significance.
Overall, this work combines single-factor experiments with machine learning analysis to provide a comprehensive understanding of the HANW nitrogen removal process using the MAP method. It helps establish a technical foundation for the efficient recovery of high-concentration ammonia nitrogen wastewater.

2. Materials and Methods

2.1. Materials

To increase the applicability of this experiment, high-concentration ammonia nitrogen wastewater was created with synthetic wastewater. Ammonium chloride (NH4Cl), disodium hydrogen phosphate (Na2HPO4), magnesium chloride (MgCl2), sodium hydroxide (NaOH), analytical-grade reagents, were purchased from Tianjin Damao Reagent Co., Ltd., Tianjin, China, detailed information is provided in Table A2. The experiments were conducted using deionized water.

2.2. Experimental Procedures

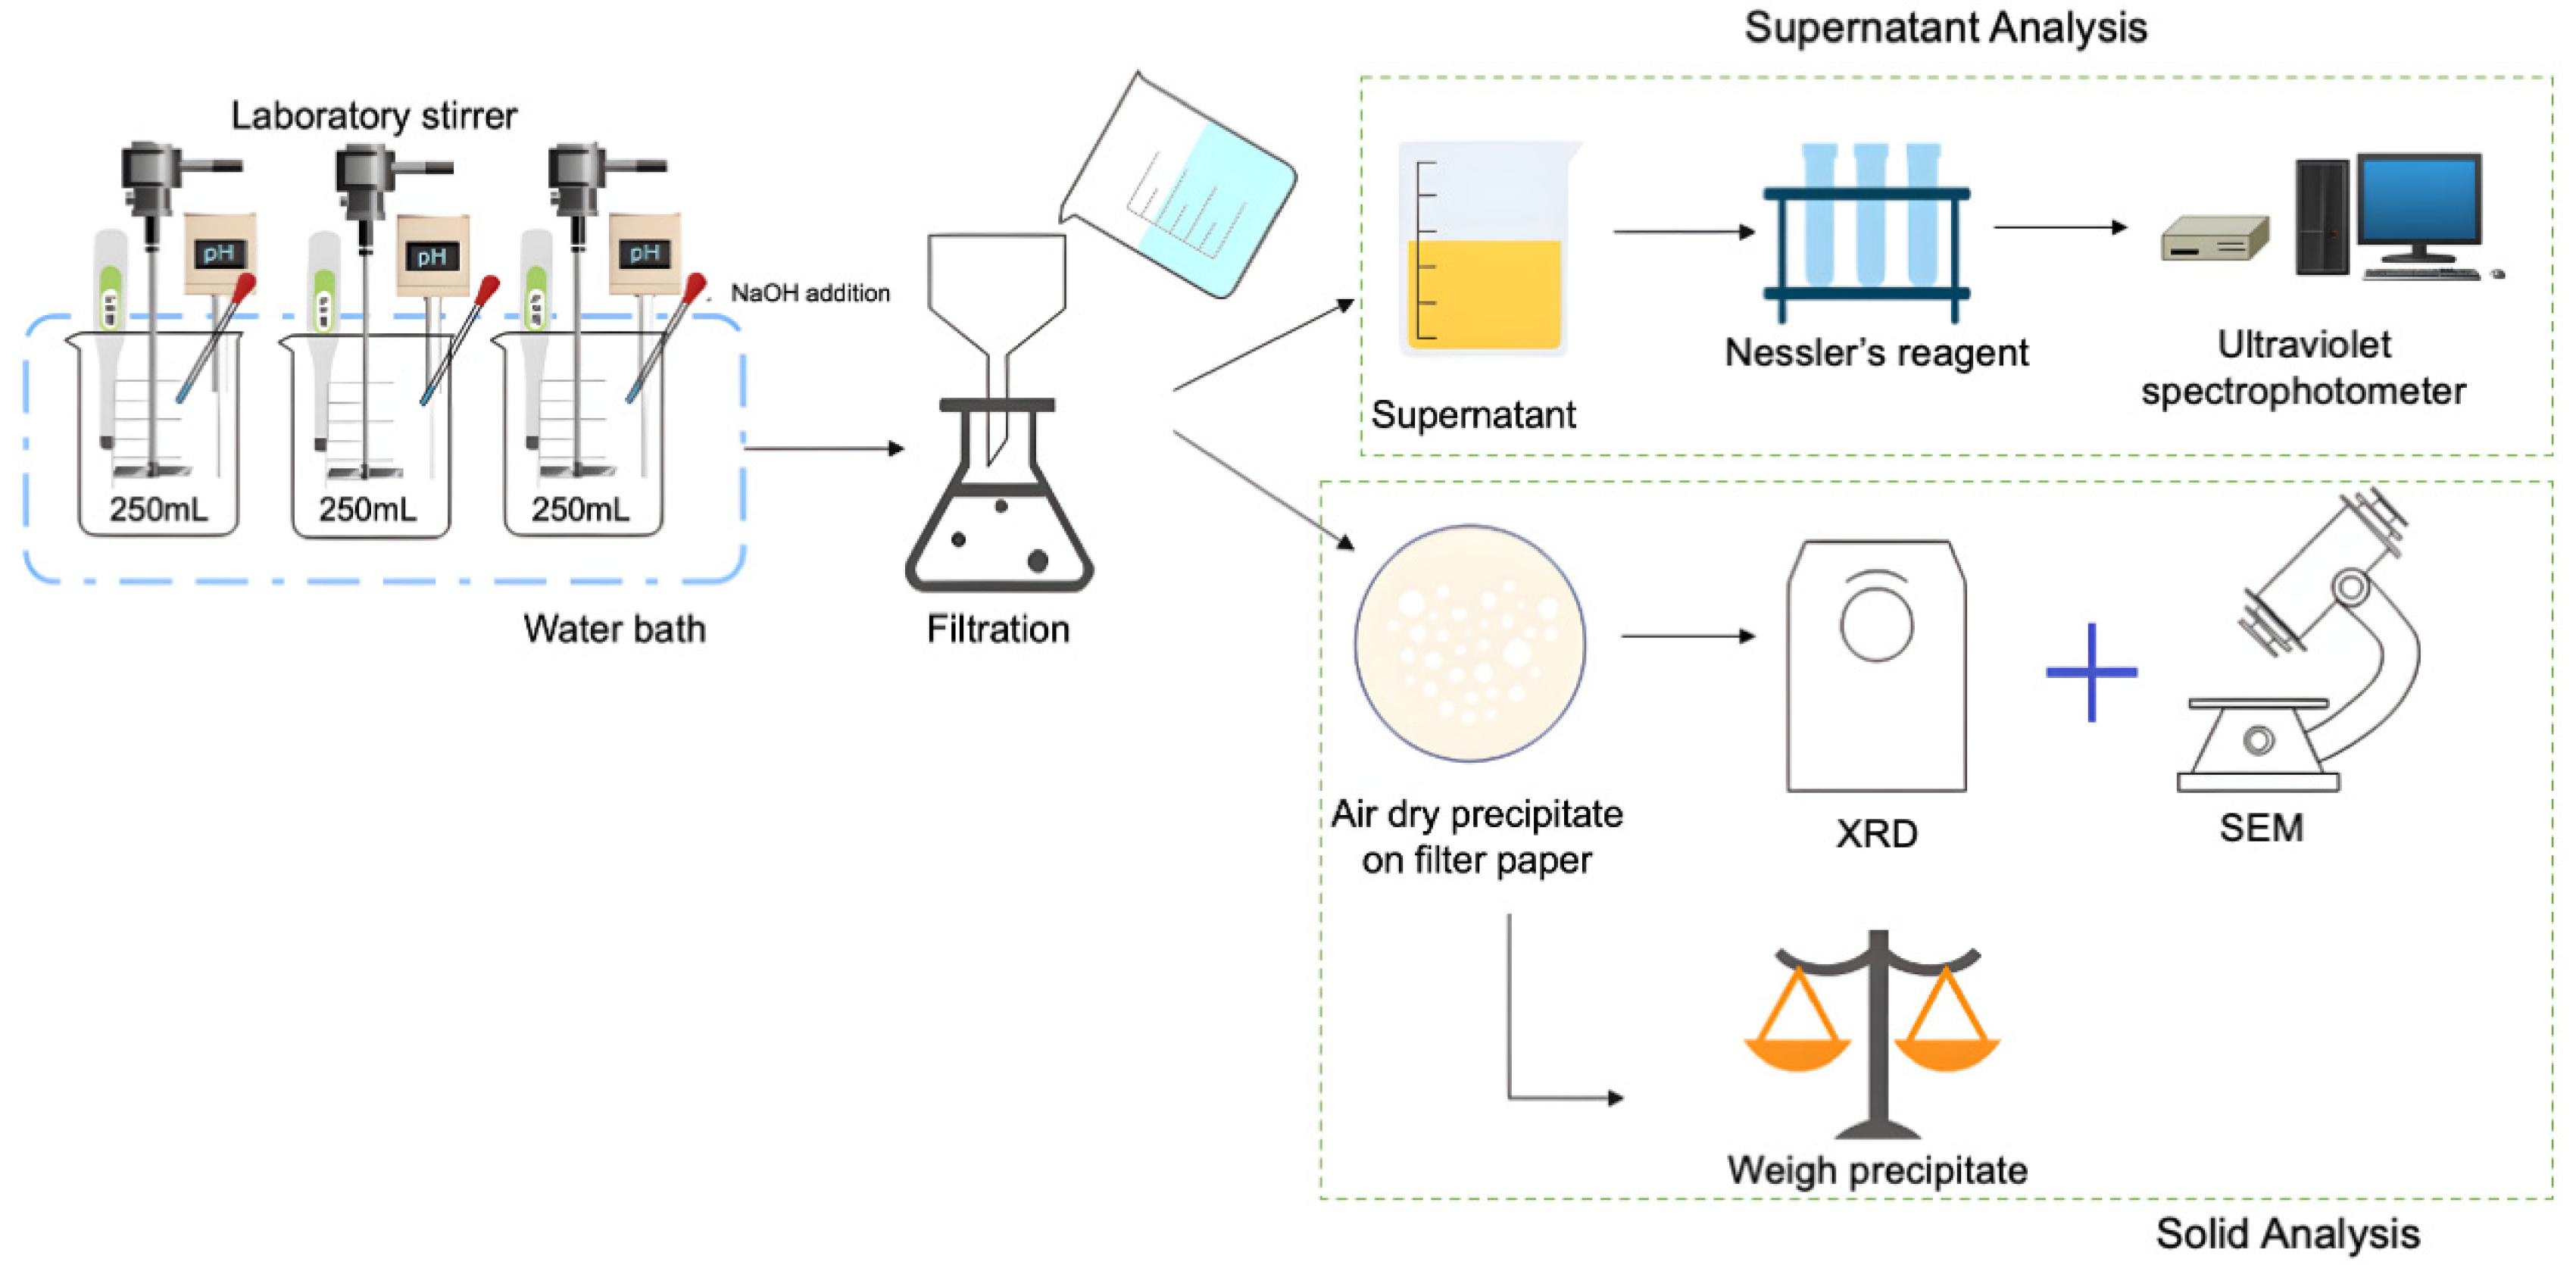
After adjusting the molar ratios of the Mg and P solutions to different values using MgCl2 and Na2HPO4, respectively, 25 mL of each solution was simultaneously added to a 250 mL beaker containing 100 mL of synthetic wastewater. At the same time, the magnetic stirrer was turned on at the set speed. Subsequently, the pH was adjusted to the target value using NaOH (5.0 M) monitored continuously using a pH meter (PHSJ-3F, Rex, PR, Shanghai, China). After reaching the target time, the stirrer automatically turned off. Finally, a vacuum suction filter (SHZ-D (III), PR, Shanghai, China) was used to separate the precipitate from the reacted solution, which was dried at room temperature for 24 h.

2.3. Experimental Design

2.3.1. Single-Factor Experimental Design

According to Equation (1), the stoichiometric molar ratio of Mg2+:NH4+:PO43− is 1:1:1, and the reaction is highly pH-sensitive. The formation of the product is influenced by multiple factors, including the solution pH, concentrations of Mg2+, NH4+-N, and HPO4n−3 (n = 0, 1, 2), temperature, and stirring speed [27].
Studies have indicated that phosphorus predominantly exists as HPO42− rather than PO43− when the pH is below 8, thereby impeding the formation of MgNH4PO4. In strongly alkaline conditions (pH > 11), phosphorus tends to form highly insoluble Mg3(PO4)2, while Mg(OH)2 precipitation occurs simultaneously [28]. The experimental conditions were set as follows: the reaction was conducted within a pH range of 8.0–10.0. The molar ratios were maintained at n(Mg):n(N) = 1–1.4 and n(P):n(N) = 0.9–1.3. The stirring speed was controlled within 120–240 rpm, the reaction time was set to 20–60 min, and the temperature was maintained at 15–35 °C.
The experimental conditions are shown in Table A3, and the experimental procedure for MAP precipitation is shown in Figure A1.

2.3.2. Machine Learning Models

To evaluate the predictive performance of different machine learning approaches for the nitrogen removal efficiency (Φ, %) (raw data are listed in Table A4), six commonly used regression models were employed. Each model offered unique strengths in capturing linear or non-linear patterns in the data. These models were constructed using the Python programming language and the scikit-learn library.
Linear regression (LR) is a foundational statistical technique that models the linear relationship between independent variables and a continuous dependent variable. Despite its simplicity and interpretability, LR often faces limitations in handling non-linearity and multicollinearity [29].
Polynomial regression (PR) enhances the flexibility of linear regression by incorporating higher-degree predictor terms, allowing for the modeling of curved trends. In this study, second-degree polynomial features were used to capture the interactions and quadratic effects in the input space [30].
Ridge Regression is a regularized version of linear regression that introduces an L2 penalty term to reduce the impact of multicollinearity among the predictors. It improves the stability of a model by shrinking the coefficients while retaining all the input variables [31].
Lasso Regression, or the Least Absolute Shrinkage and Selection Operator, applies an L1 penalty to perform both regularization and feature selection. By forcing some coefficients to exactly zero, it results in simpler and more interpretable models, particularly when the predictor set is large [32].
Random Forest is a robust ensemble learning method that builds multiple decision trees using bootstrapped data and aggregates their outputs [33]. It handles non-linear relationships and interactions effectively and is well-suited to complex environmental modeling datasets with heterogeneous features [34].
Gradient Boosting is another ensemble method that builds decision trees sequentially, with each new tree trained to correct the prediction error of the previous ensemble. It often achieves higher accuracy than other models but is more sensitive to overfitting and the hyperparameter selection [35].

2.4. Analysis Methods

2.4.1. Nitrogen Removal Efficiency (Φ, %)

The efficiency of nitrogen removal (Φ, N removal (%)) was calculated based on the difference between the initial and final nitrogen concentrations in the wastewater samples, normalized by the initial concentration. This metric is commonly employed as a benchmark for evaluating the efficiency of the MAP precipitation method in removing ammonia nitrogen.
Nessler’s reagent and sodium potassium tartrate (KNaC4H4O6·4H2O) were used as chromogenic and masking agents, respectively, to measure the ammonia nitrogen concentration. The residual N concentration was measured using an Ultraviolet–Visible (UV–Vis) spectrophotometer at 420 nm (TU-1901, Beijing General Instrument Co., Ltd., Beijing, China).
Using Equation (2), the N removal (%) (Φ, %) was calculated from the difference between the initial (initial m(NH4+-N), mg/L) and remaining concentrations (residual m(NH4+-N), mg/L). The initial NH4-N concentration was 560 mg/L.
Φ % = m N H 4 + N i n i t i a l m N H 4 + N r e s i d u a l m N H 4 + N i n i t i a l × 100 %

2.4.2. Calculation of MAP Purity

If the release of ammonia nitrogen as ammonia gas is not considered, all the removed ammonia nitrogen is converted into MAP precipitate and fixed. The purity of the MAP (PMAP, (%)) in the obtained precipitate was calculated as the ratio of the theoretical mass of MAP (corresponding to the molar quantity of nitrogen removed) to the total mass of the precipitate.
P M A P % = N 0 × Φ 1000 × 14 × M s t r u v i t e m p × 100 %
where [N]0 is the initial N concentration, Φ is the N removal efficiency, mp is the total mass of the precipitate, and Mstruvite is the molar mass of the struvite.

2.4.3. Morphological Analysis Methods

X-ray diffraction (XRD) patterns of the precipitates were evaluated using an X-ray diffractometer (D8 advance, Bruker Corp., Germany) with a Cu Kα tube (λ = 1.5406 Å, 40 kV, 30 mA) scanned over a 2θ range of 10–70° at a rate of 10°/min. The morphology and structure of the sample were studied using a Gemini SEM 300 scanning electron microscope (SEM-EDS, ZEISS Corp., Jena, Germany) at the experimental facility in Shenyang City, Liaoning Province, China.

2.4.4. Model Development

Data analysis and computations were conducted using Python (version 3.12.4) in a Jupyter Notebook (version 7.0.8) environment. The following libraries were employed: Pandas (version 2.2.2) for data loading and preprocessing, NumPy (version 1.26.4) for numerical operations, and Scikit-learn (version 1.4.2) for machine learning tasks, including data scaling (StandardScaler), feature transformation (PolynomialFeatures), data splitting (train_test_split), and model training with linear models (Linear Regression, Ridge, Lasso) and ensemble methods (RandomForestRegressor, GradientBoostingRegressor). Model performance was evaluated using Scikit-learn metrics (r2_score, mean_squared_error, mean_absolute_error). Visualizations were generated using Matplotlib (version 3.8.4).
1.
Dataset Size
The dataset consists of 90 samples, corresponding to the experimental conditions detailed in Table A4. This dataset was derived from controlled experiments simulating high-concentration ammonia nitrogen wastewater treatment, ensuring a representative range of pH, molar ratios (n(Mg):n(N), n(P):n(N)), stirring speed, time, and temperature for model training and validation.
2.
Handling of Outliers
No specific outlier removal was performed, as the experimental data in Table A4 were pre-validated to ensure consistency. Standardization using “StandardScaler” was applied to normalize the feature distributions, mitigating the impact of potential outliers.
3.
Data Splitting Strategy
The dataset was split into training and testing in a 80/20 ratio, consistent with prior studies [36]. And the dataset sets used “train_test_split” with a fixed random state of 42 to ensure reproducibility.
4.
Feature Selection Rationale
Features including pH, n(Mg):n(N), n(P):n(N), stirring speed, time, and temperature were selected based on their known influence on nitrogen removal efficiency, as informed by experimental design and prior literature [37]. No automated feature selection was applied.
5.
Model hyperparameters
Linear Regression and Polynomial Regression (degree = 2) used default settings; Ridge Regression with alpha = 1.0, Lasso Regression with alpha = 0.1, Random Forest with n_estimators = 100 (optimized via GridSearchCV with n_estimators = [50, 100, 200], max_depth = [None, 10, 20], min_samples_split = [2, 5]), and Gradient Boosting with n_estimators = 100. Default values for other parameters. Hyperparameter tuning for Random Forest was conducted using 5-fold cross-validation via GridSearchCV to minimize mean squared error [38].
6.
Cross-Validation Procedure
A 5-fold cross-validation procedure was implemented during hyperparameter tuning with GridSearchCV to assess model performance robustly across different data subsets. This choice of 5 folds balances computational efficiency and reliability, aligning with common practices in machine learning studies [39].
The following metrics were used to assess accuracy and generalization: R 2 (coefficient of determination), RMSE (root mean square error), and MAE (mean absolute error) were calculated to assess the model’s accuracy and generalization ability. After validation, the best-performing model was used to evaluate the feature importance, identifying which factors most significantly influenced HANW nitrogen removal.
R 2 = 1 i = 1 n y i y ^ i 2 i = 1 n y i y ¯ 2
R M S E = 1 n i = 1 n y i y ^ i 2
M A E = 1 n i = 1 n y i y ^ i
A d j u s t e d   R 2 = 1 1 R 2 n 1 n k 1
where y i is the observed value, y ^ i is the predicted value, y - is the mean of the observed values, R 2 is the coefficient of determination, n is the number of samples, and k is the number of predictors.

3. Results

3.1. Effects of Parameters on N Removal Efficiency and Precipitate Characteristics

3.1.1. Effects of pH

The pH is an important parameter in MAP crystal formation, affecting the existing forms of phosphate and ammonia nitrogen. To investigate the effect of pH, experiments A1–A5 were conducted, and the results are shown in Figure 1.
As shown in Figure 1a, the nitrogen removal efficiency increased with pH, reaching a peak of 95.92% at pH 10. The observed trend is primarily attributed to the enhanced deprotonation of ammonium and phosphate species at higher pH levels [40]. Specifically, as the pH increased, ammonium was converted to NH3, and the conversion of phosphate to H2PO3 and H2PO4 was inhibited [41,42]. Simultaneously, the concentration of the residual nitrogen in the solution decreased with an increasing pH, further confirming more efficient N removal. The MAP purity remained above 94% across all pH levels, indicating selective formation of struvite over competing phases such as magnesium hydroxide or amorphous phosphate salts. The mass of the precipitate also increased with the pH, reflecting the greater extent of crystallization and possibly the formation of larger or more densely packed crystals.
The phase identity of the precipitates is confirmed by the XRD patterns in Figure 1b, which show strong agreement with the reference pattern of struvite (JCPDS 77-2303). The characteristic peaks at 2θ angles of approximately 15.79°, 20.85°, and 33.27° are present in all the samples, confirming MAP formation under all the tested pH values [43]. The increase in the peak intensity at pH 9.5 indicates improved crystallinity, likely due to optimal ion availability and reduced solubility under these conditions. However, an overly high pH (>10) may also favor the co-precipitation of magnesium hydroxide, which could interfere with MAP’s purity and morphology. Variations in the relative intensity of reflections within the crystalline material’s X-ray diffraction (XRD) pattern indicate alterations in its texture and, more precisely, the size of its crystals [44].
The SEM images in Figure 1c–g provide visual evidence of pH-dependent morphological changes. At lower pH (8.0–8.5), the precipitates exhibit irregular and poorly defined crystal shapes, suggesting limited nucleation and growth due to insufficient supersaturation. As the pH increases to 9.0 and 9.5, the crystals become more uniform and elongated, exhibiting the typical rod- or needle-like morphology of well-formed struvite, similar to the figures in previous studies [23,45]. These structures indicate favorable growth conditions and stable crystallization. At pH 10.0, although the crystals’ quantity increases, their morphology becomes more aggregated and disordered, possibly due to excessive nucleation rates or incorporation of secondary phases such as amorphous magnesium phosphate.
Combined with the results shown in Figure 1a,c–g, this demonstrates that although the N removal efficiency (%) is the highest at pH 10.0, the oversized particles and lower purity of the MAP crystals make them unsuitable for subsequent application [46]. From the perspective of the N removal efficiency and MAP characteristics, it is most appropriate to set the pH of the reaction system to 9.5.

3.1.2. Effects of n(Mg):n(N)

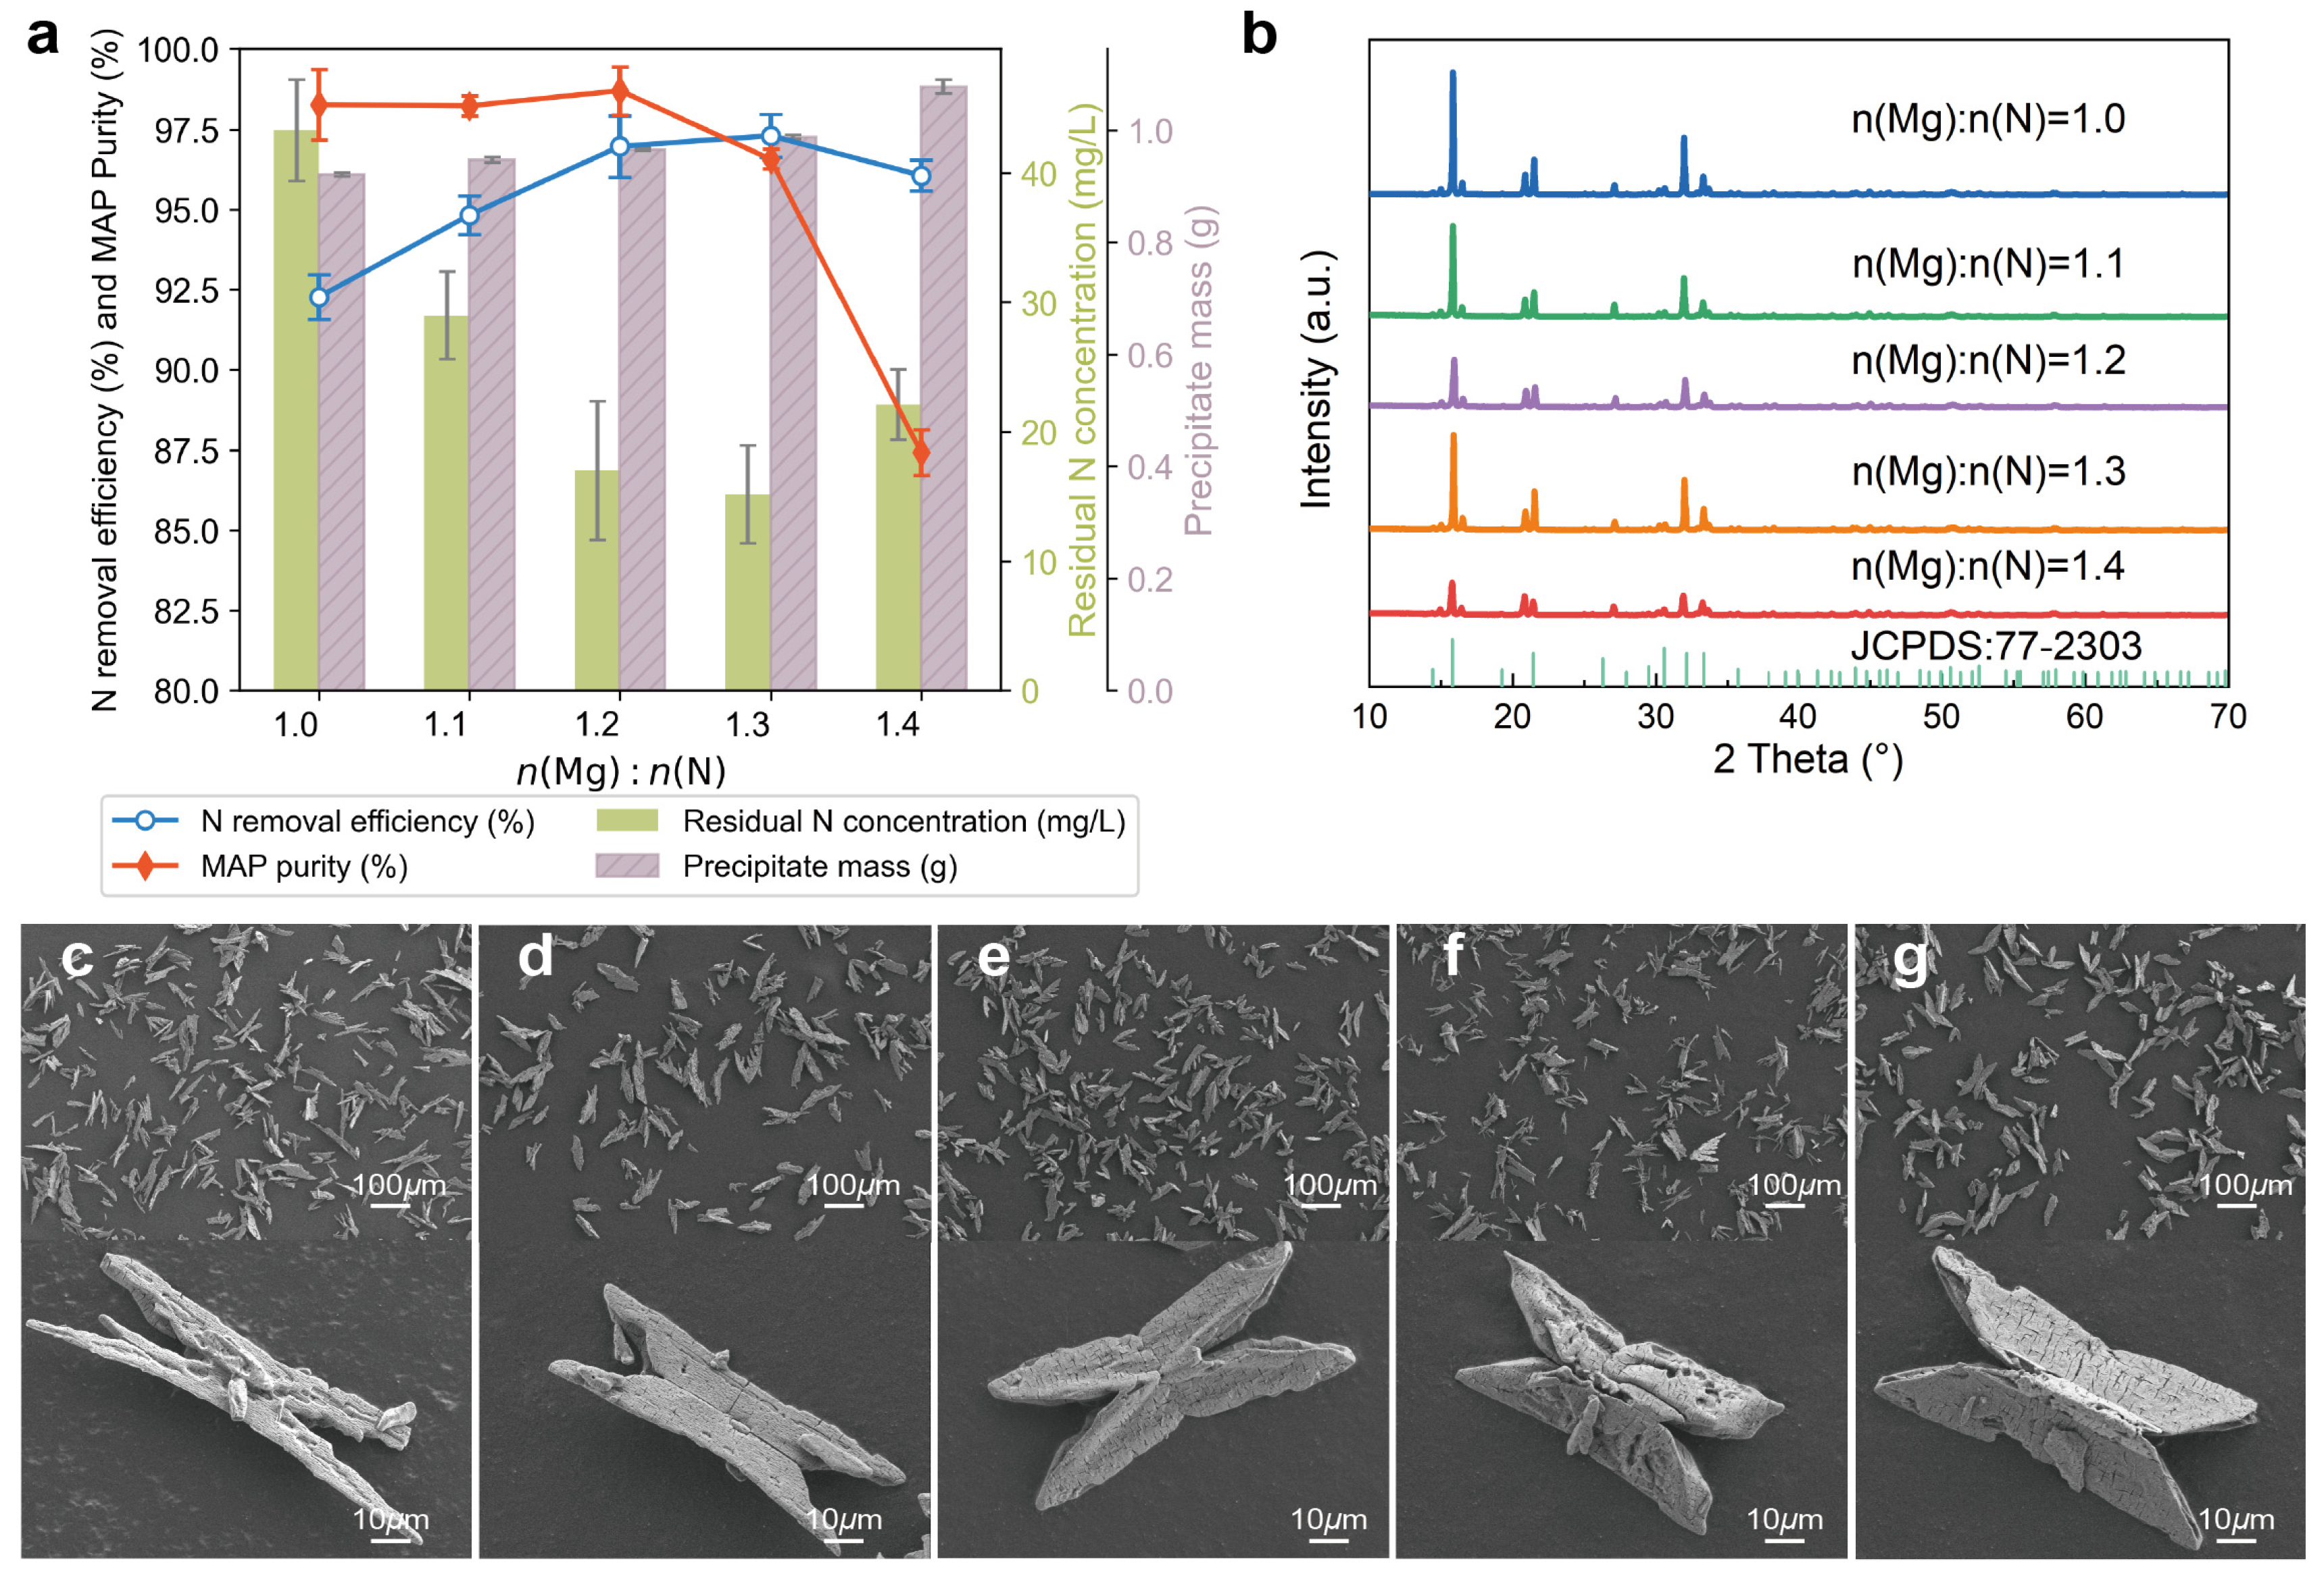
To explore the impact of the n(Mg):n(N) molar ratio, experiments B1–B5 were carried out, with the outcomes presented in Figure 2.
As shown in Figure 2a, the nitrogen removal efficiency increased from 92.27% to 97.3% as the n(Mg):n(N) molar ratio rose from 1.0 to 1.3, as an appropriate excess of Mg2+ promotes complete precipitation by driving the equilibrium reaction forward [47]. However, when the ratio exceeded 1.3, further addition of Mg2+ resulted in a decline in both nitrogen removal efficiency and MAP purity, likely due to the formation of secondary phases such as Mg(OH)2 or amorphous magnesium phosphate. This is consistent with previous studies showing that excessive Mg2+ increases the risk of non-struvite precipitates, reducing the selectivity of the crystallization process [48].
The XRD patterns shown in Figure 2b confirm that struvite was the main crystalline phase under all the tested conditions, with strong diffraction peaks aligned with JCPDS 77-2303. The increase in the peak intensity up to n(Mg):n(N) = 1.3 reflects improved crystallinity, while the emergence of peak broadening at 1.4 suggests a decrease in the product quality and possible interference from amorphous or poor crystalline impurities.
The SEM images shown in Figure 2c–g reveal morphological evolution with varying n(Mg):n(N) ratios. At low ratios (1.0–1.1), the crystals’ development is limited, and they are needle-shaped. With increasing Mg2+ (1.2–1.3), better-defined rod-like crystals are observed, characteristic of struvite formed under favorable growth conditions. At 1.4, particle aggregation and morphological distortion are evident, likely caused by accelerated nucleation and the presence of undesired phases, as previously reported in high-Mg systems [49].
In summary, controlling the n(Mg):n(N) molar ratio is critical for balancing the nitrogen recovery efficiency and product quality. An optimal ratio of n(Mg):n(N) = 1.3 ensures high removal efficiency and well-crystallized MAP with minimal secondary-phase contamination.

3.1.3. Effects of n(P):n(N)

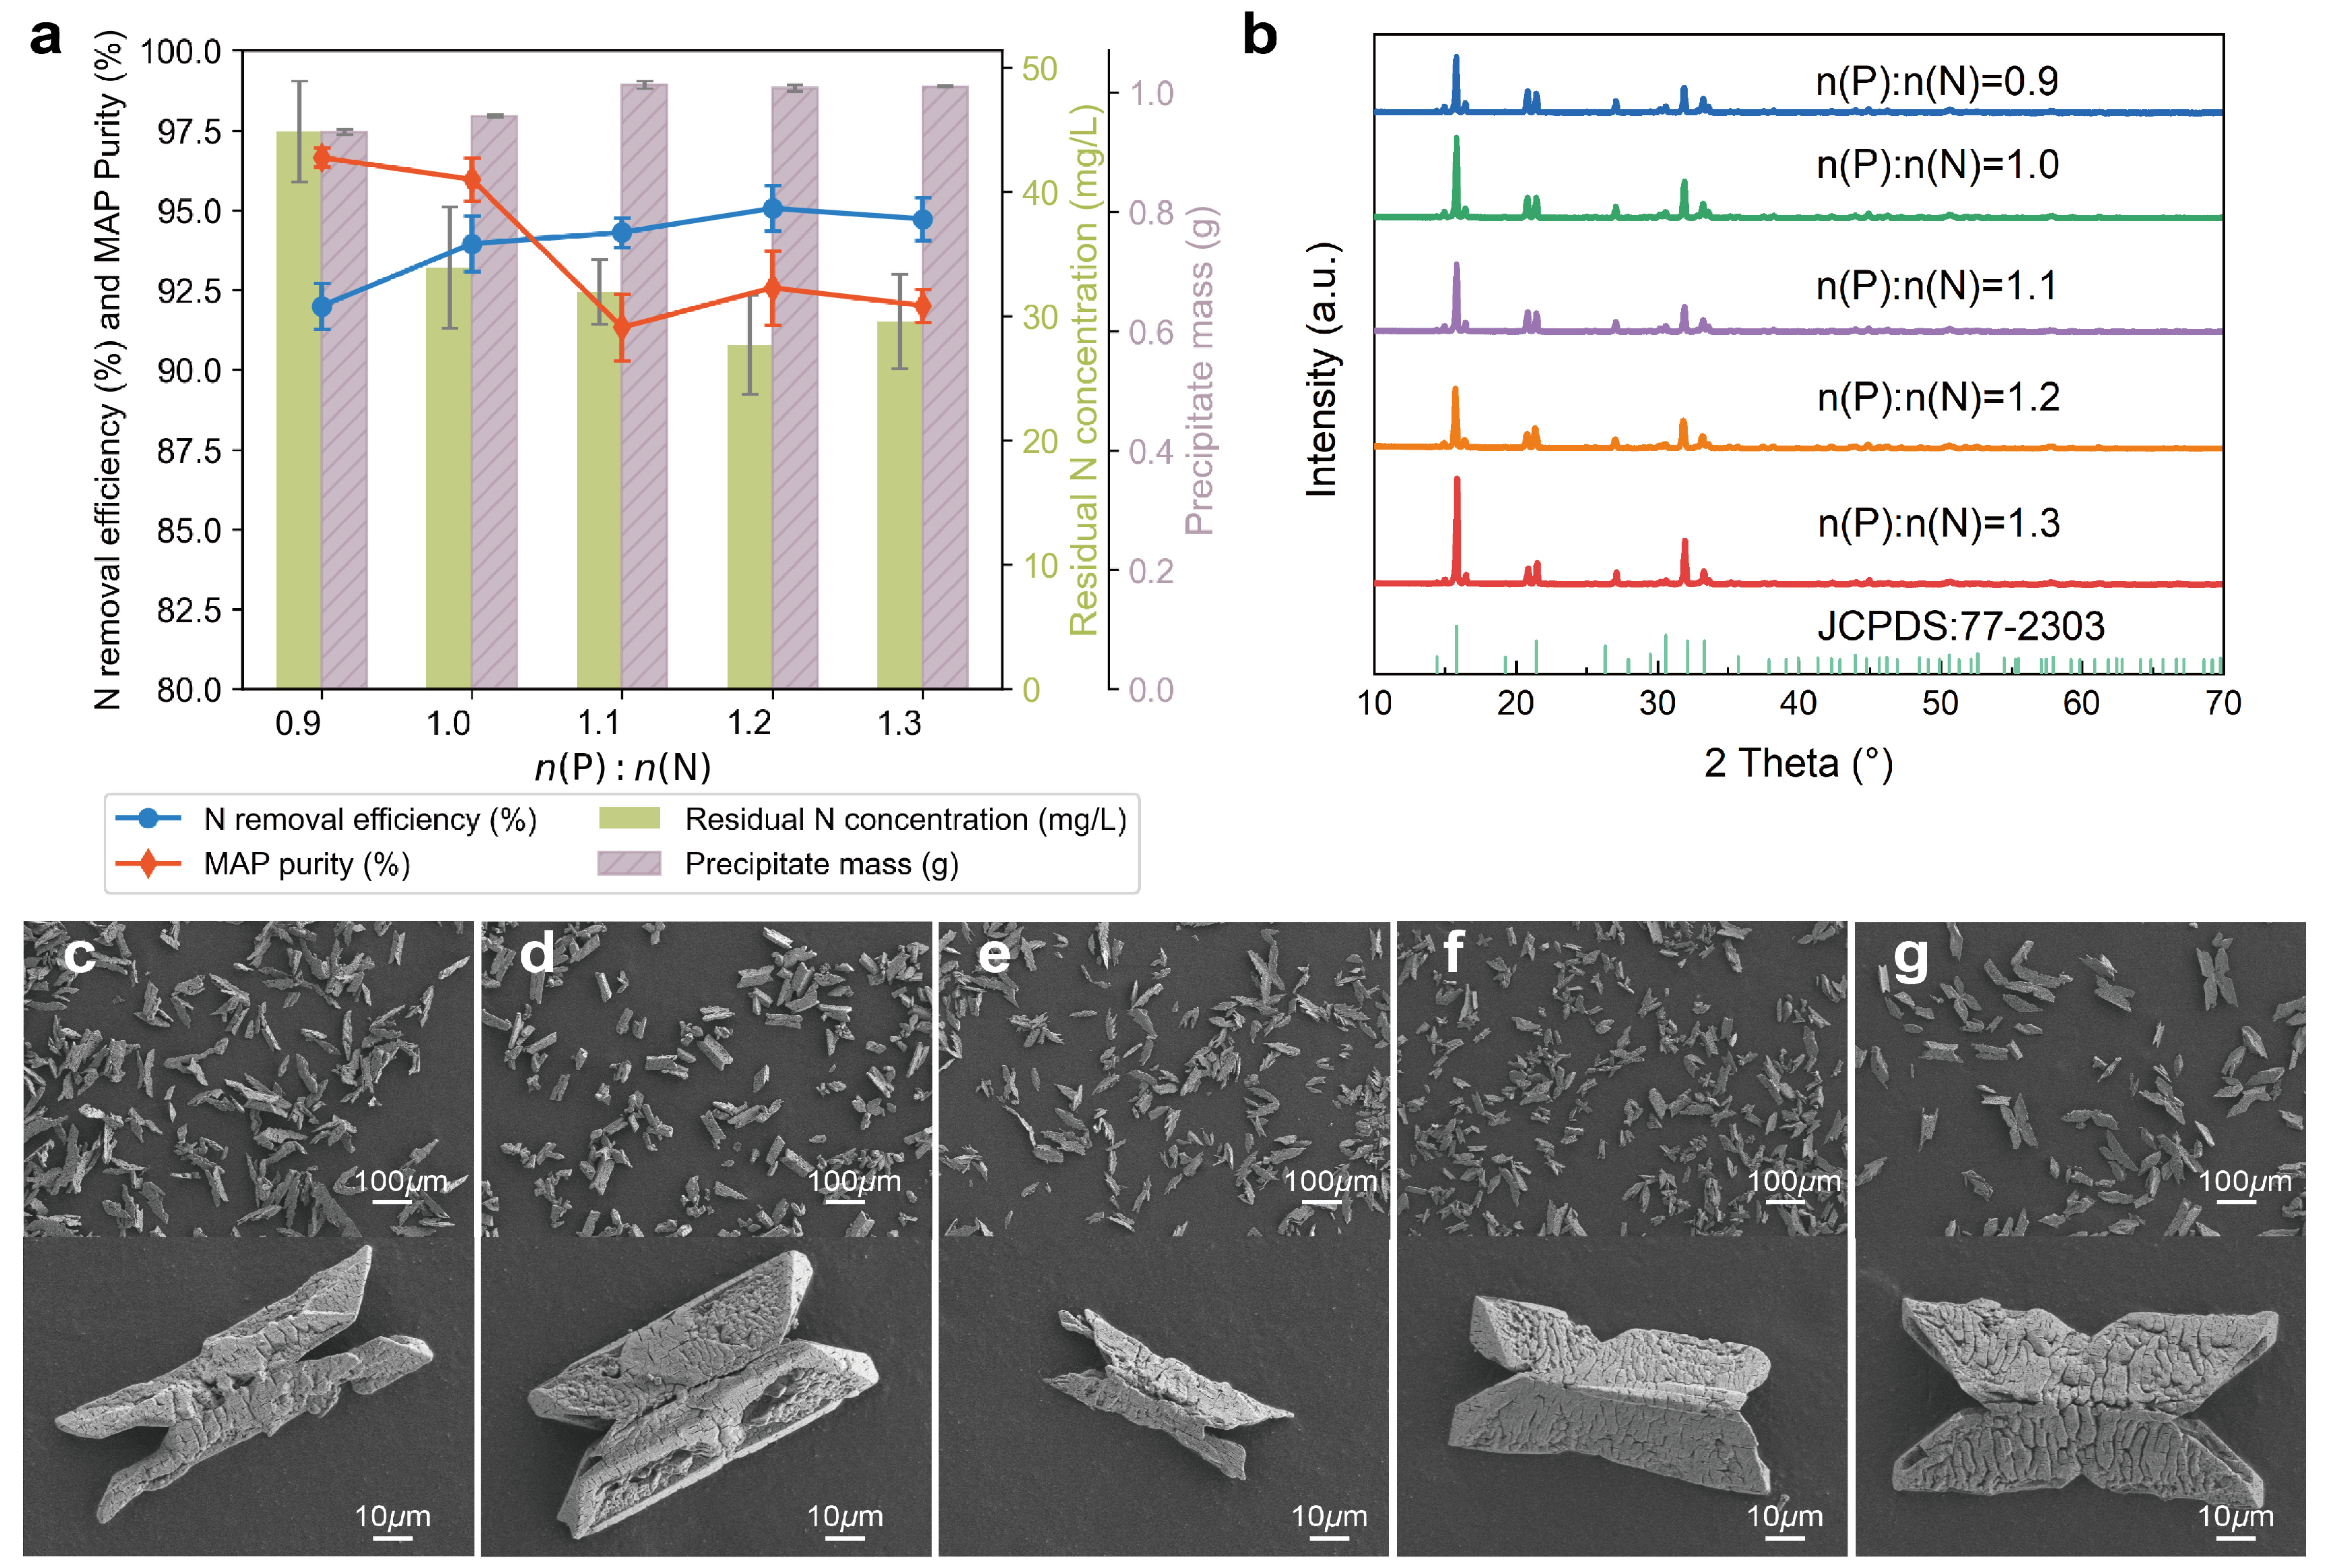
To investigate the effect of the n(P):n(N) molar ratio, experiments C1–C5 were carried out, with the outcomes presented in Figure 3.
As shown in Figure 3a, the nitrogen removal efficiency peaked at n(P):n(N) = 1.2 with a value of 95.06%. However, further increasing the phosphorus dosage did not improve the nitrogen removal but instead caused a decline in the MAP purity. This can be attributed to the presence of excess phosphate in the system, which may have favored the co-precipitation of amorphous or alternative phosphate phases [50].
The XRD patterns in Figure 3b confirm that all the precipitates exhibited the characteristic peaks of struvite, as identified using JCPDS card No. 77-2303. The peak heights at n(P):n(N) ratios of 0.9, 1.1, and 1.2 are significantly lower than those at n(P):n(N) ratios of 1.3 and 1.0, showing the better purity of MAP at n(P):n(N) ratios of 1.3 and 1.0 [43].
The morphological changes observed in the SEM images shown in Figure 3c–g are consistent with these trends. At the optimal ratio shown in Figure 3d, well-defined rod-like struvite crystals dominate, reflecting stable and controlled growth. Below this stoichiometric ratio (Figure 3c), the crystal formation is incomplete due to a limited phosphate availability. When phosphorus is in excess, as shown in Figure 3e–g, the precipitates become irregular and poorly developed, suggesting that supersaturation disrupts normal crystal development and promotes secondary nucleation.
MAP with an even size and shape distribution is more conducive to improving fertilizer performance [51]. It can therefore be concluded that n(P):n(N) = 1.0 is the optimum reaction condition.

3.1.4. Effects of Stirring Speed

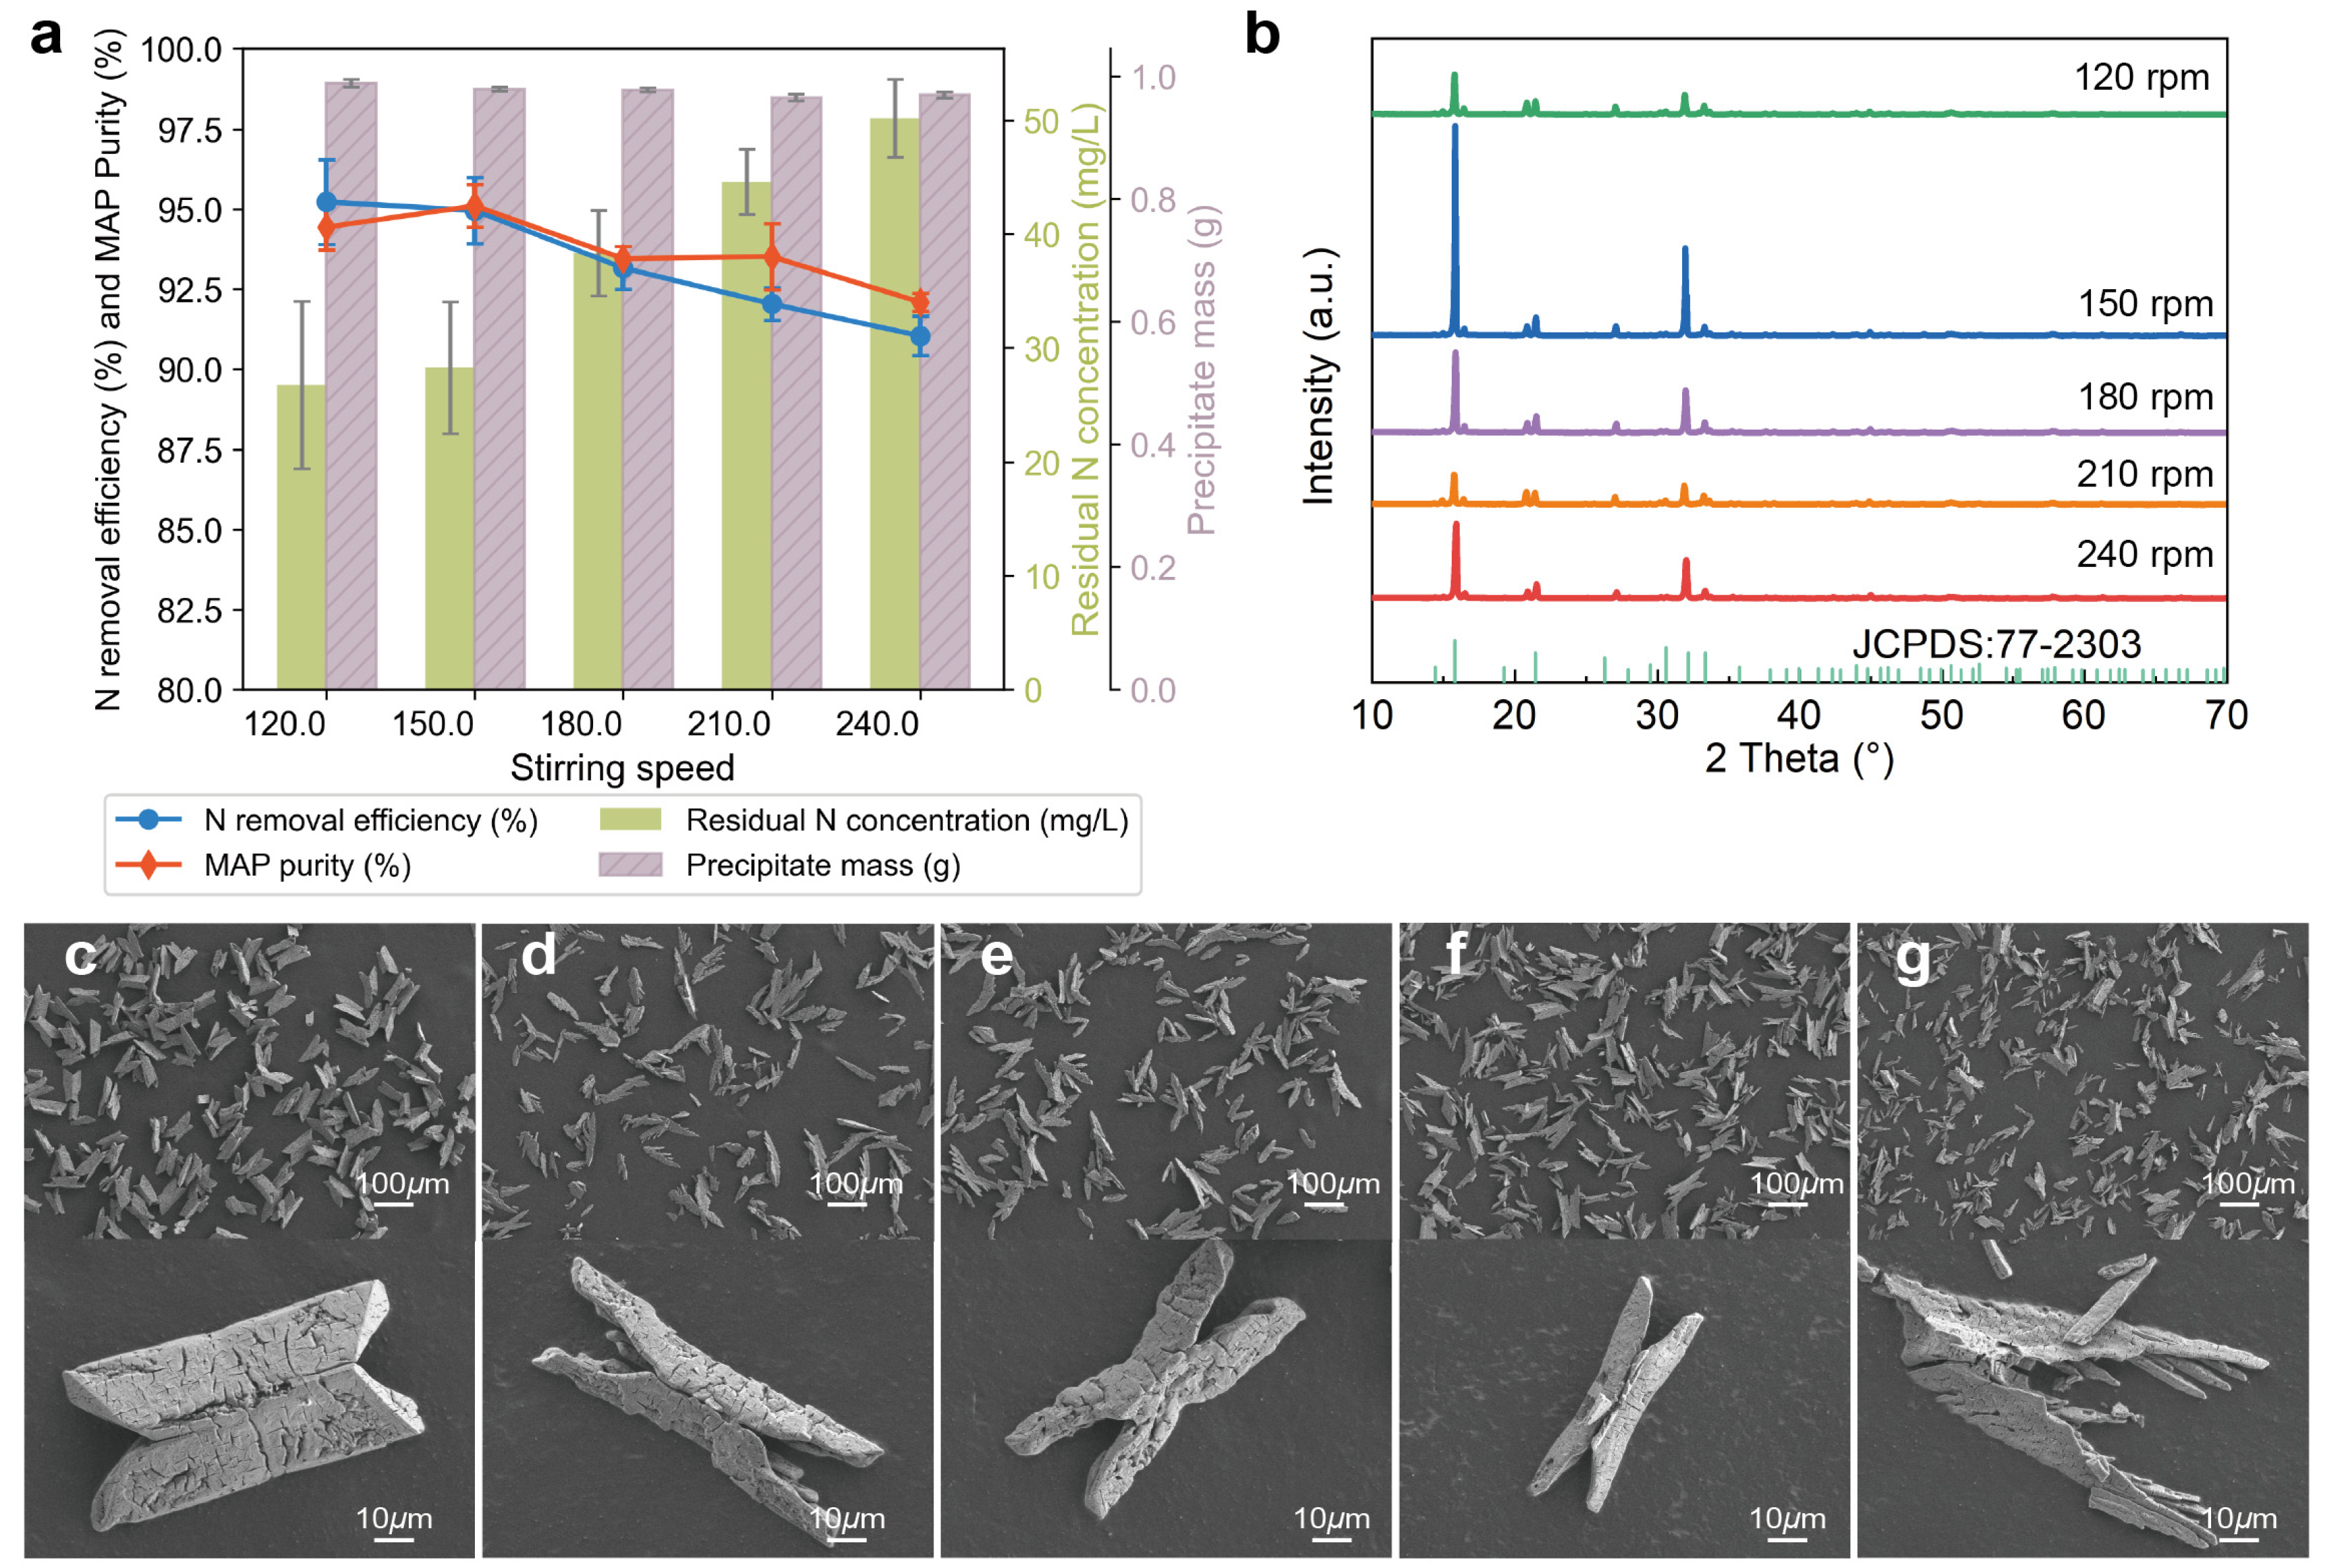
In order to investigate the influence of stirring speed, a series of experiments (D1–D5) were performed, and the corresponding results are presented in Figure 4.
As shown in Figure 4a, the nitrogen removal efficiency reached its maximum of 94.95% at 150 rpm and declined monotonically thereafter with further increases in stirring speed. This trend suggests that moderate agitation enhances mass transfer and promotes homogenous supersaturation, thereby accelerating nucleation and improving precipitation efficiency. In contrast, excessive shear may interfere with the crystal growth process by reducing the particle residence time in the supersaturated zone and inducing partial redissolution of forming nuclei due to turbulence [52].
With increased stirring speed, the purity and quality of MAP showed limited variation. While higher speeds enhanced collision frequency and slightly increased the total precipitate mass, they may have compromised crystal uniformity.
XRD analysis, as shown in Figure 4b, confirmed that struvite (JCPDS No. 77-2303) was the dominant crystalline phase under all tested conditions. The most intense and well-defined diffraction peaks appear at 120 rpm, indicating that this stirring speed favors the formation of highly crystalline and phase-pure struvite. At higher speeds, broader and less intense peaks may reflect incomplete crystallization or the presence of amorphous content, potentially caused by unstable mixing conditions and localized supersaturation [53].
The SEM images shown in Figure 4c–g reveal distinct morphological changes associated with the stirring speed. At 120–150 rpm, as shown in Figure 4c,d, struvite displays well-developed rod-like or prismatic crystals with smooth surfaces and uniform sizes, indicative of a stable growth environment with a sufficient nutrient supply and minimal mechanical disruption. In contrast, images at higher stirring speeds (Figure 4f,g) reveal fragmented and irregular structures, likely resulting from shear-induced crystal damage. Based on these findings, 150 rpm is identified as the optimal stirring speed.

3.1.5. Effects of Reaction Time

To explore the impact of the reaction time, experiments E1–E5 were carried out, with the outcomes presented in Figure 5.
As shown in Figure 5a, the nitrogen removal efficiency increased with the reaction time, suggesting that the majority of NH4+ was removed during this initial period due to rapid struvite precipitation.
Interestingly, the MAP purity followed a non-monotonic trend, increasing from 20 to 40 min and then decreasing slightly at longer reaction times. This pattern can be attributed to the competitive dynamics between crystal growth and secondary processes. During the first 40 min, supersaturation drives both nucleation and orderly growth of struvite, resulting in high purity. However, after 40 min, the accumulation of byproducts or possible incorporation of impurities may reduce the relative purity of MAP.
The precipitate mass showed a steady increase with time, consistent with ongoing crystal growth and continuous removal of ions from the solution. Even though the majority of NH4+ was removed within 40 min, crystal growth continued as residual PO43− and Mg2+ remained available, contributing to mass accumulation.
The XRD patterns shown in Figure 5b confirm that struvite (JCPDS 77-2303) was the dominant crystalline phase across all time points. The sharpest peaks are observed at around 50–60 min, indicating good crystallinity. As shown in the SEM images in Figure 5c–g, the overall crystal size decreases with an increasing reaction time. The morphology evolves from a standard X-shape to a branched structure and gradually develops into an irregular, needle-like form, When the reaction time is extended to 60 min, the crystals tend to regain a more defined and complete morphology, ultimately forming a standard X-shaped structure. These observations support the idea that the reaction time modulates the transition from nucleation- to growth-dominated crystallization [54]. The shape changes as the variation in supersaturation and reaction time [23,55]. Initially, rapid supersaturation promotes nucleation; with time, crystal growth results in larger, more ordered particles. However, excessively long reaction times may allow secondary processes to occur [56], which can compromise the MAP purity despite continued mass gains.
According to Figure 5a–g, a reaction time of 30 min not only maintains the relative integrity of the crystalline structure but also ensures denitrification.

3.1.6. Effects of Temperature

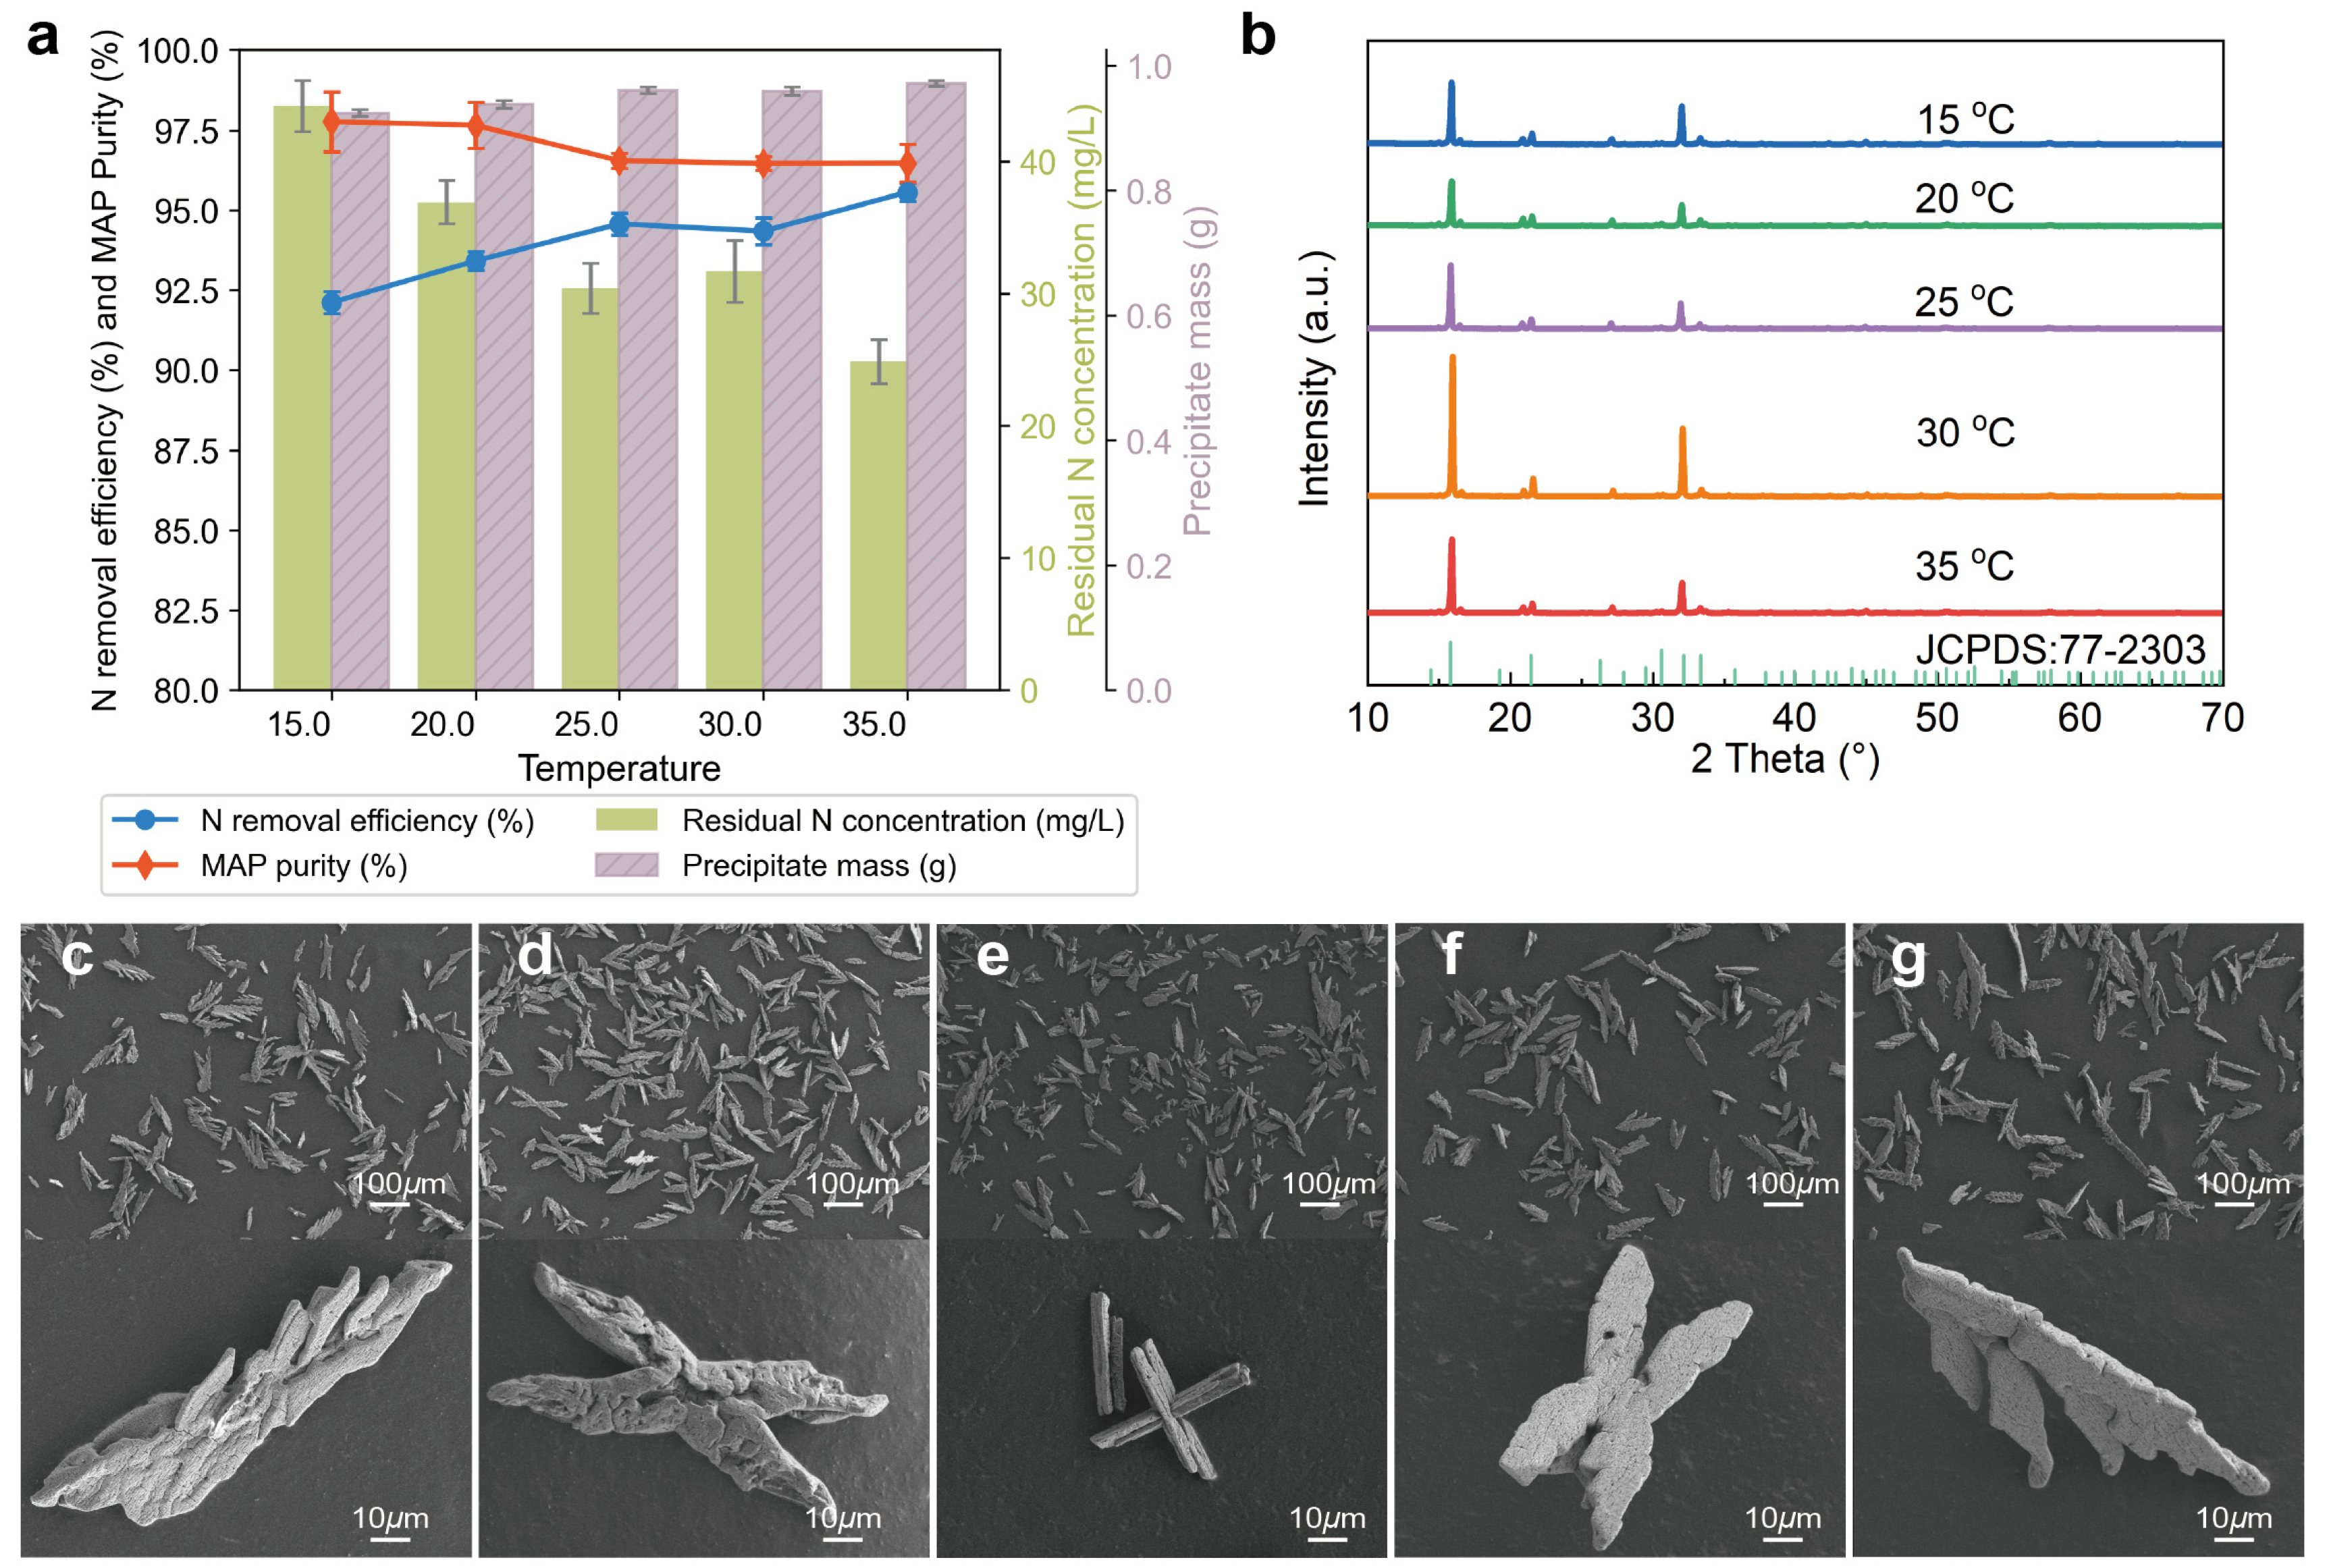
To explore the impact of the reaction temperature, experiments F1–F5 were carried out, with the outcomes presented in Figure 6.
As shown in Figure 6a, an increase in the reaction temperature from 15 °C to 35 °C had an impact on the N removal efficiency, MAP purity, and precipitate mass. Overall, with an increase in the reaction temperature, the N removal efficiency and precipitate quality gradually increased, and the MAP purity showed a trend of gradually decreasing.
The reaction temperature had no discernible influence on the nucleation kinetics but exerted a pronounced effect on ionic solubility and reaction rate constants [57,58]. In the range of 25–30 °C, a modest temperature rise enhanced the ionic diffusivity and accelerated both nucleation and crystal growth, resulting in increased nitrogen removal and stoichiometric completion of the reaction. However, temperatures above 30 °C may destabilize the process, potentially due to increased struvite solubility or formation of competing phases, causing a slight decrease in MAP purity. The precipitate mass increased steadily with temperature, which may be attributed to both enhanced reaction rates and co-precipitation of secondary compounds at higher temperatures.
The XRD patterns shown in Figure 6b confirm that struvite was the dominant crystalline phase across all the reaction temperatures. The highest peak intensity appears at 30 °C, corresponding to the optimal crystallization conditions. At 35 °C, a slight reduction in the peak sharpness may indicate lower crystallinity or the presence of a minor amorphous phase.
The SEM images shown in Figure 6c–g reveal temperature-induced changes in the crystal morphology. At 15 °C, the precipitate forms loose, irregular agglomerates with a jagged outline. When the temperature is increased by 5 °C to 20–25 °C, the particle size decreases significantly, with wedge-shaped crystals mainly being formed, similar with previous study [25]. Further heating to 25–30 °C shows the recovery of greater sizes, the formation of polyhedral rod-shaped crystals with smooth sides, and a narrow size distribution, indicating that the growth kinetics are optimal. At 35 °C, the crystals appear to be slightly roughened and begin to cluster, suggesting instability at elevated temperatures, possibly due to surface dissolution or re-nucleation [59].
In summary, 30 °C appears to be the optimal temperature for struvite recovery under the studied conditions, balancing high nitrogen removal, high MAP purity, and a desirable crystal morphology.

3.2. Regression Model Equations

In this study, the dependent variable is the product yield (y). The independent variables include: pH (x1), the molar ratio of magnesium to nitrogen (x2, n(Mg):n(N)), the molar ratio of phosphorus to nitrogen (x3, n(P):n(N)), stirring speed (x4, rpm), reaction time (x5, min), and temperature (x6, °C). The empirical regression equation for the Linear models is expressed as Table 1.
Unlike the linear regression models, ensemble methods such as Random Forest Regressor and Gradient Boosting Regressor do not have a simple empirical regression equation. These models operate on a series of complex decision rules derived from the training data rather than a fixed set of coefficients. This non-parametric nature allows them to capture intricate, non-linear relationships in the data more effectively, as evidenced by their superior performance metrics.

3.3. Factor Importance Analysis for Nitrogen Removal

To better understand each operational factor’s relative importance to the nitrogen removal efficiency, a comparative analysis was conducted.
The model performance was evaluated using the R 2 , RMSE, MAE, and adjusted R 2 (Table 2). Among all the models, Random Forest achieved the highest R 2 (0.911) and lowest RMSE (0.754) and MAE (0.652), indicating the best overall predictive accuracy. The optimized Random Forest showed similar performance ( R 2 = 0.908), while the linear, polynomial, Ridge, and Gradient Boosting models showed moderate performance ( R 2   ≈ 0.89). Lasso Regression performed the worst, likely due to over-regularization. Given its superior results, the Random Forest model was selected to perform further analysis of the feature importance.
Table 3 compares the optimal nitrogen removal conditions obtained from historical experiments and model predictions. Under the experimental optimal conditions (No. B4) of pH 9.5, an n(Mg):n(N) of 1.3, n(P):n(N) of 1.0, stirring speed of 150 rpm, 30 min reaction time, and 30 °C, 97.97% nitrogen removal was achieved. The model predicted optimal conditions of a slightly higher pH (9.8) and lower temperature (25 °C), with the other parameters unchanged, yielding a predicted nitrogen removal efficiency of 96.98%. The similarity between the two sets of conditions confirms the model’s reliability in optimizing the operational parameters.
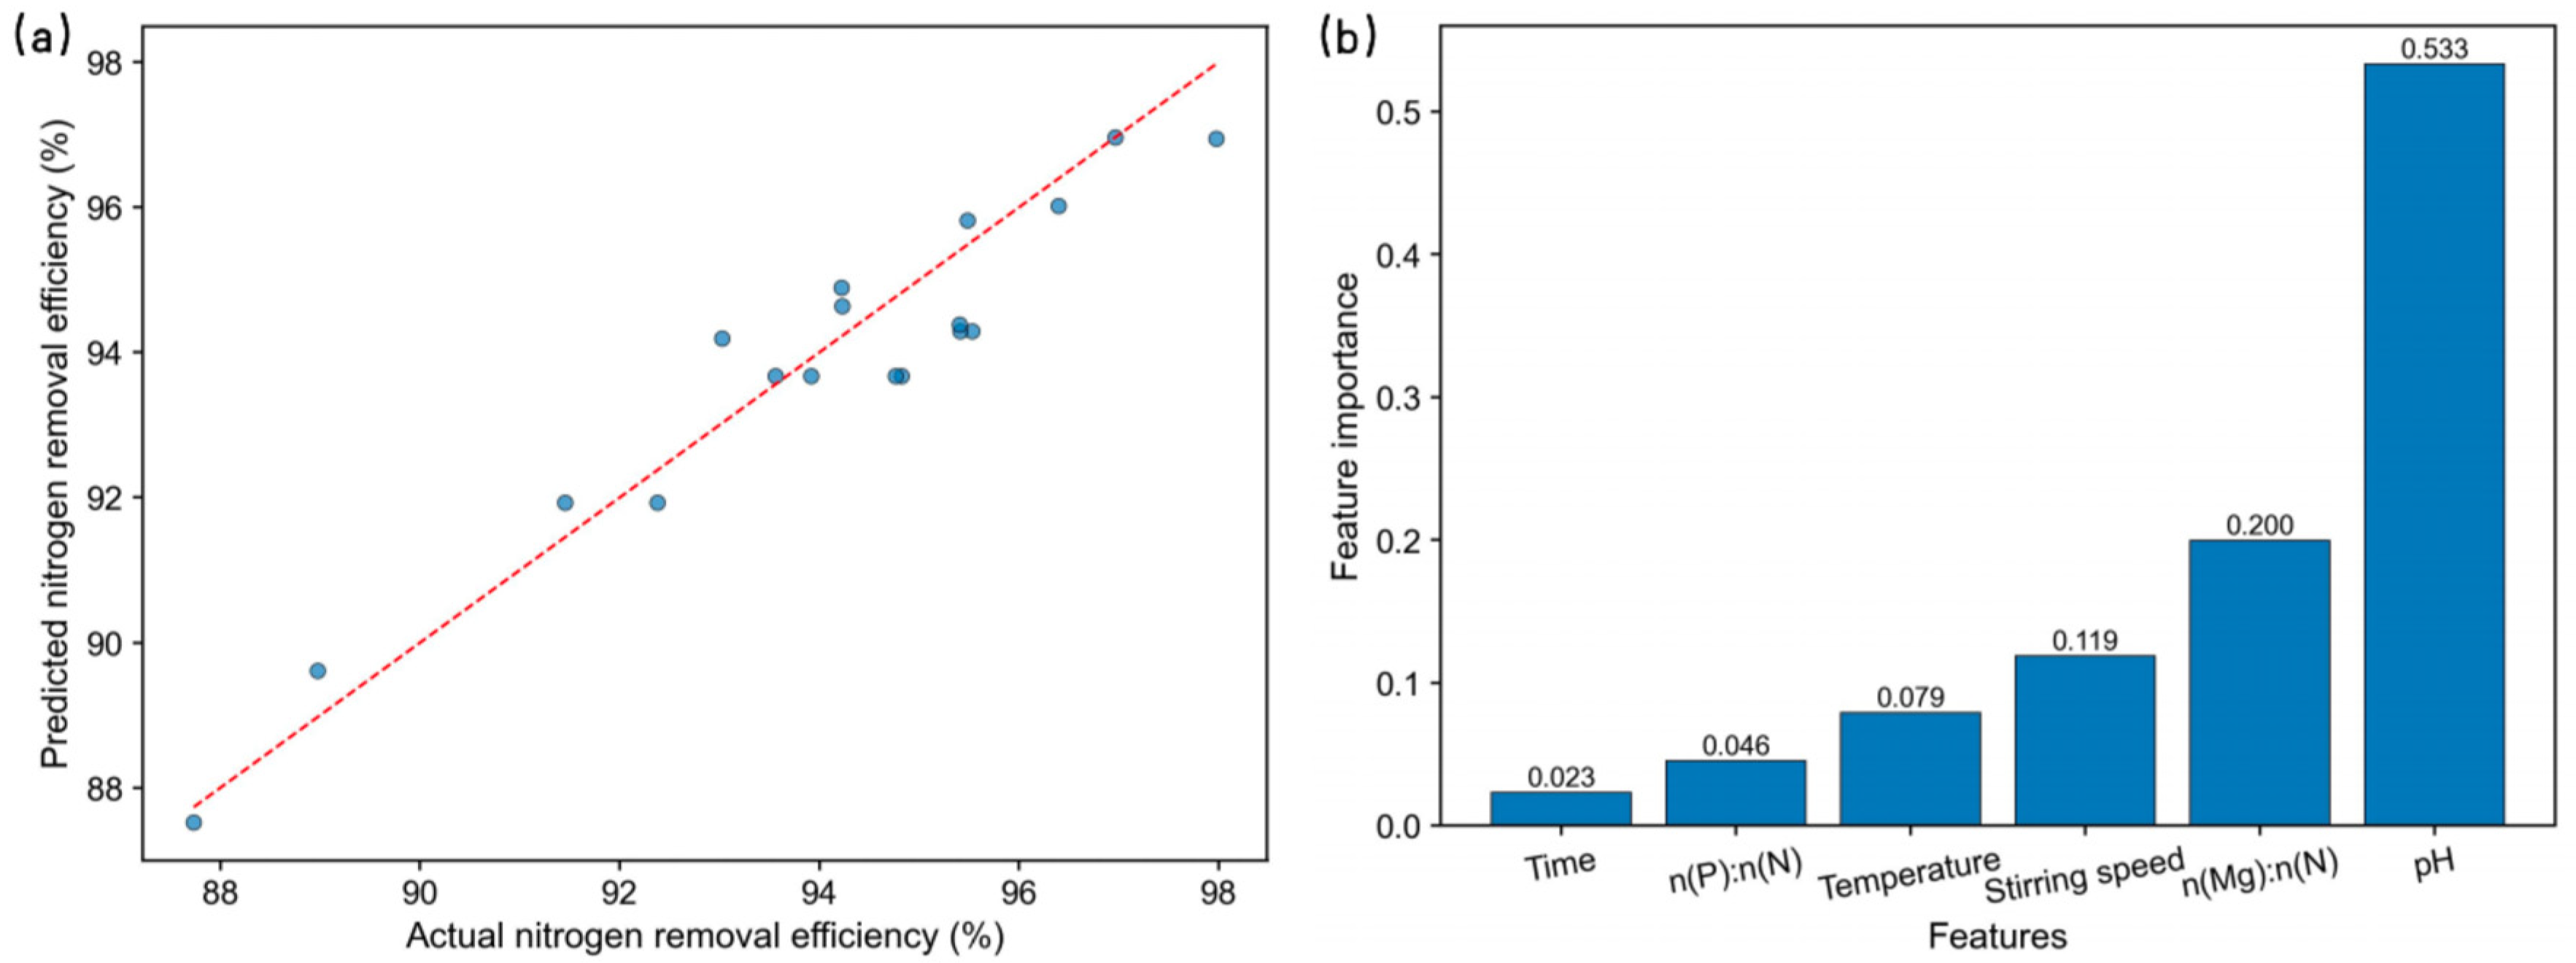
Figure 7a depicts the correlation between the actual N removal values and those predicted by the Random Forest model. The scatter points are closely aligned with the 1:1 reference line, indicating a strong concordance between the predictions and measurements. This visual alignment, corroborated by quantitative metrics, validates the model’s accuracy in simulating N removal behavior. Such reliability supports the model’s application in process optimization and predictive analysis.
Figure 7b illustrates the relative importance of the input features to the Random Forest model’s predictions. It can be seen that the pH was the most important factor affecting N removal, highlighting its key role in this process. The n(Mg):n(N) ratio, stirring speed, and temperature also affected N removal, listed in order of decreasing importance.

4. Discussion

4.1. Effects of Operational Parameters on Struvite Formation

The formation efficiency and quality of struvite precipitates are significantly influenced by multiple operational parameters. Among the tested conditions, pH, molar ratios, stirring speed, reaction time, and temperature collectively determined the extent of nitrogen removal, MAP purity, and precipitate yield.
Section 3.1 illustrates that pH plays a crucial role in shaping crystal morphology, resulting in reduced crystal size and a transition from thick, broad structures to sharper, more slender forms. When the pH value reaches 10.0, crystallinity decreases compared to that under neutral conditions, which is closely related to the lattice distortion caused by residual sodium ions in the system [60]. Additionally, excess Na+ in the alkaline medium can occupy lattice sites through competitive complexation, resulting in limited three-dimensional crystal growth [61].
The molar ratios of n(Mg):n(N) and n(P):n(N) both favored the development of a looser, more porous crystal structure. In particular, increasing n(Mg):n(N) promoted a transformation from X-shaped to rod-like crystals, while higher n(P):n(N) values induced a shift from wedge-shaped to rod- and plate-like morphologies. According to classical kinetic theory, when the molar ratio exceeds 1.2, nuclear acceleration exceeds the crystal growth rate, which is consistent with the “explosive nucleation” phenomenon described by the LaMer model [62].
Stirring intensity had a notable impact on the crystal integrity, causing fragmentation and size reductions. Higher stirring speeds resulted in smaller crystals with more apparent morphological disruption. Stirring impacts the thickness of the diffusion boundary layer, fluid shear intensity, and the distribution of ions at the crystal–solution interface [63]. Insufficient agitation leads to concentration polarization and localized supersaturation, favoring uncontrolled nucleation. Excessive agitation may create shear stress that disrupts critical nuclei before they mature into stable crystals [64].
A prolonged reaction time facilitates structural rearrangement and crystal maturation, leading to the gradual formation of well-defined X-shaped crystals. This process is often accompanied by an increased surface roughness, indicating continued crystal growth and morphological development.
Temperature also had a significant influence, with MAP crystals exhibiting diverse morphologies, such as serrated, X-shaped, plate-like, and cross-shaped structures. At higher temperatures, signs of morphological degradation were evident, suggesting that thermal damage to the crystals impacted their growth and stability.

4.2. Scalability Considerations for MAP Process in HANW Treatment

While the laboratory-scale experiments demonstrated effective nitrogen removal and high-purity struvite precipitation under optimized conditions, scaling the MAP process to pilot or full-scale applications for high ammonia nitrogen wastewater (HANW) treatment presents several challenges and opportunities. The optimized parameters may require adjustments to accommodate the complex matrix of HANW, which often contains high salinity, organic matter, or heavy metals [65]. These components could interfere with crystal nucleation and growth, potentially reducing struvite purity and yield [16]. Pre-treatment steps, such as filtration or chemical conditioning, may be necessary to mitigate these effects, increasing operational complexity and costs.
From an engineering perspective, reactor design and operational conditions must be tailored for larger scales. For instance, achieving uniform mixing in large reactors to avoid concentration polarization, as observed with insufficient agitation in lab studies, requires advanced impeller designs or continuous flow systems. Excessive shear stress from high stirring speeds, which disrupts crystal integrity in lab settings, could be amplified in industrial reactors, necessitating precise control systems. Additionally, thermal management becomes critical at scale, as temperature fluctuations could exacerbate morphological degradation, as noted in Section 3.1.
Economic feasibility is another critical factor. While lab-scale MAP processes demonstrate high nitrogen removal efficiency, the costs of reagents (e.g., Mg and P sources) and energy for mixing and heating must be evaluated for full-scale implementation. Pilot studies integrating cost–benefit analyses and real-world HANW compositions are essential to validate scalability. Future research should focus on optimizing reactor configurations and exploring low-cost reagent alternatives to enhance the practical applicability of the MAP process.

5. Conclusions

This study investigated the influence of key operational parameters on ammonia nitrogen removal via magnesium ammonium phosphate (MAP) crystallization. Nitrogen removal efficiency was most affected by pH, followed by the n(Mg):n(N) molar ratio and stirring speed. It increased with pH, peaked at a moderate n(Mg):n(N), and declined as the stirring speed increased. Morphologically, MAP crystals underwent notable changes under varying conditions. A higher pH, n(Mg):n(N), stirring speed, and reaction time resulted in reduced crystal size and a transformation from typical X-shaped to needle-like structures. Under an increasing n(P):n(N), the crystals’ size first decreased and later increased, with their morphology shifting from X-shaped to rod- and needle-like forms. The highest removal efficiency (97.97%) was achieved at pH 9.5, n(Mg):n(N) = 1.3, n(P):n(N) = 1.0, 150 rpm, 30 min, and 30 °C. Future studies should prioritize pilot-scale experiments to validate the scalability of the MAP process for HANW treatment, addressing engineering and economic challenges to ensure practical implementation.
This study provides a theoretical and technical basis for magnesium ammonium phosphate crystallization treatment of high-concentration ammonia nitrogen wastewater, demonstrating that it is an important means to achieve sustainable development. This approach supports resource circularity by transforming nitrogen into a valuable agricultural product, reducing reliance on synthetic fertilizers and mitigating environmental impacts like eutrophication. The optimized parameters enhance process efficiency, paving the way for scalable, low-impact wastewater treatment solutions, as discussed in Section 4.2. This work aligns with sustainable policies for pollution control and circular economy, offering socio-economic benefits through waste valorization.

Author Contributions

Conceptualization, S.Z. and M.D.; methodology, M.D.; software, H.Z.; validation, S.Z., Y.X. and M.D.; formal analysis, S.Z.; investigation, S.Z., Y.X., H.Z. and M.D.; resources, X.X. and M.D.; data curation, Y.X.; writing—original draft preparation, S.Z. and Y.X.; writing—review and editing, H.G., M.D., X.S. and X.C.; visualization, S.Z.; supervision, H.G., X.S. and X.C.; project administration, M.D.; funding acquisition, X.X., H.Z., M.D. and X.S. All authors have read and agreed to the published version of the manuscript.

Funding

This research was funded by the National Natural Science Foundation of China, grant numbers 52204417, U1908226, U1502273, and 51674084; the National Key Research and Development Program of China, grant number 2022YFC3901005; and the Humanities and Social Sciences Research Program of the Ministry of Education of China, grant number 23YJC630261. The APC was funded by the National Natural Science Foundation of China.

Institutional Review Board Statement

Not applicable.

Informed Consent Statement

Not applicable.

Data Availability Statement

The data supporting the findings of this study are available from the corresponding author upon reasonable request.

Acknowledgments

The authors acknowledge the administrative and technical support provided by Northeastern University and Shenzhen University.

Conflicts of Interest

Author Hui Gao was employed by the company GAD Environmental Technology Co., Ltd. The remaining authors declare that the research was conducted in the absence of any commercial or financial relationships that could be construed as a potential conflict of interest.

Abbreviations

The following abbreviations are used in this manuscript:
HANWHigh-concentration ammonia nitrogen wastewater
MAPMagnesium ammonium phosphate
n(Mg):n(N)Magnesium–nitrogen mole ratio
n(P):n(N)Phosphorus–nitrogen mole ratio
N removal (%)Efficiency of nitrogen removal
PMAP (%)Purity of MAP
LRLinear regression
PRPolynomial regression
RFRRandom Forest Regression
R 2 Coefficient of determination
RMSERoot mean square error
MAEMean absolute error

Appendix A

Figure A1. Schematic representation of the experimental procedure for MAP precipitation. The process includes solution preparation in stirred conical flasks (250 mL), followed by filtration. The supernatant is analyzed using Nessler’s reagent and UV–vis spectrophotometry, while the precipitate is air-dried on filter paper. Subsequent analysis includes weighing, X-ray diffraction (XRD), and scanning electron microscopy (SEM).
Sustainability 17 08550 g0a1
Table A1. Comparison of treatment methods for ammoniacal nitrogen wastewater.
MethodApplicable NH4+-N Conc. (mg/L)Removal Efficiency (%)Cost-EffectivenessAdvantagesDisadvantagesReferences
Air Stripping500–500080–95%Moderate to HighSimple process, easy operation
Effective for high concentrations
Relatively low equipment investment
Requires pH adjustment to 10.5–11.5
Prone to scaling and clogging
Poor performance in winter
Cause secondary air pollution
[66,67]
Breakpoint Chlorination50–100085–99%Low to ModerateStable and reliable treatment effect
Short reaction time
Unaffected by temperature
High consumption of chlorinating agents
High operating costs
Generates by-products like chloramines
Uneconomical for high concentrations
[68]
Ion Exchange20–50090–98%ModerateHigh-quality effluent
Simple operation
Allows for ammonia nitrogen recovery
Resin is susceptible to fouling/poisoning
Requires frequent regeneration
Limited application scope
High pretreatment requirements
[69,70]
Struvite Precipitation (MAP)200–800085–95%Moderate to HighRecovers nitrogen and phosphorus resources
Low sludge production
Effective for high concentrations
By-product can be used as fertilizer
Requires addition of Mg2+ and PO43−
Strict pH control is necessary
Potential for scaling issues
Higher investment costs
[71,72]
Biological Nitrification-Denitrification20–20085–95%HighLow operating costs
Environmentally friendly
Simultaneously remove COD
Mature and established technology
Long start-up time
Sensitive to high ammonia concentrations
Requires an external carbon source
Large footprint
[73,74]
Electrochemical Oxidation100–200070–90%LowMild reaction conditions
No chemical reagents needed
Small footprint
High degree of automation
High electricity consumption
Electrode passivation is common
High investment costs
Short electrode lifespan
[75]
Membrane Separation50–100090–99%Low to ModerateExcellent separation efficiency
Small footprint
Stable effluent quality
Can achieve ammonia recovery
Severe membrane fouling
High operating costs
Concentrate stream requires further treatment
High pretreatment requirements
[76]
Catalytic Oxidation100–500080–95%ModerateFast reaction speed
High treatment efficiency
Strong adaptability
Can handle high concentrations
Catalyst is prone to deactivation
Relatively high operating costs
Complex process
Pretreatment is often required
[77,78]
Table A2. Chemicals and reagents.
Chemical FormulaMassVolume Concentration
NH4Cl1.07 g500 mL560 mg/L
MgCl2Based on experimental conditions--
Na2HPO4Based on experimental conditions--
NaOH--5.0 M
KNaC4H4O6·4H2O50 g100 mL500 g/L
Note: All chemical reagents used were of analytical grade and purchased from Tianjin Damao Reagent Co., Ltd., China.
Table A3. Experimental conditions for each test group (A1–F5), showing variations in pH, molar ratios (n(Mg):n(N), n(P):n(N)), stirring speed, reaction time, and temperature for MAP crystallization. Each experimental group corresponds to a specific parameter variation tested in the study.
No.pHn(Mg):n(N)n(P):n(N)Stirring Speed (rpm)Time (min)Temperature (°C)
A18111503030
A28.5111503030
A39111503030
A49.5111503030
A510111503030
B19.5111503030
B29.51.111503030
B39.51.211503030
B49.51.311503030
B59.51.411503030
C19.510.91503030
C29.5111503030
C39.511.11503030
C49.511.21503030
C59.511.31503030
D19.5111203030
D29.5111503030
D39.5111803030
D49.5112103030
D59.5112403030
E19.5111502030
E29.5111503030
E39.5111504030
E49.5111505030
E59.5111506030
F19.5111503015
F29.5111503020
F39.5111503025
F49.5111503030
F59.5111503035
Table A4. Triplicate nitrogen (N) removal efficiency (%) measurements for each experimental condition in Table A3.
No.N Removal (%)-1N Removal (%)-2N Removal (%)-3
A187.733286.715487.5769
A290.047388.971290.1234
A391.012491.190889.7693
A495.128193.916394.3044
A595.483695.686896.5900
B191.570892.272892.9749
B294.219294.826295.4331
B396.013196.965697.9180
B496.621497.297697.9737
B595.501396.391796.2822
C191.269591.995092.7205
C293.076993.950594.8242
C393.834294.300394.7663
C495.407795.526694.2454
C594.048194.725695.4032
D193.908995.222596.5361
D293.919294.954295.9892
D392.391693.493493.5953
D492.298192.374291.4503
D590.443591.019191.6715
E192.111292.644193.1770
E292.084292.823593.5627
E393.124493.744294.3640
E494.380393.026794.0731
E594.711493.074694.4377
F192.455192.110591.7658
F293.271093.744293.2174
F394.229894.569394.9087
F493.923494.342194.7608
F595.449195.896595.3421

References

  1. Liu, X.; Yue, F.-J.; Li, L.; Zhou, F.; Wen, H.; Yan, Z.; Wang, L.; Wong, W.W.; Liu, C.-Q.; Li, S.-L. Chronic nitrogen legacy in the aquifers of China. Commun. Earth Environ. 2025, 6, 58. [Google Scholar] [CrossRef]
  2. Yi, H.; Gu, W.; Wang, Q.; Liu, B.; Zhang, B. Cost of raising discharge standards: A plant-by-plant assessment from wastewater sector in China. J. Environ. Manag. 2022, 308, 114642. [Google Scholar] [CrossRef]
  3. Gonzalez-Salgado, I.; Bounouba, M.; Dubos, S.; Mengelle, E.; Guigui, C.; Sperandio, M. Influence of feed salinity on ammonia recovery from high-strength effluents in transmembrane chemical absorption process. J. Membr. Sci. 2023, 687, 122086. [Google Scholar] [CrossRef]
  4. Chen, Y.; Chen, H.; Chen, Z.; Hu, H.; Deng, C.; Wang, X. The benefits of autotrophic nitrogen removal from high concentration of urea wastewater through a process of urea hydrolysis and partial nitritation in sequencing batch reactor. J. Environ. Manag. 2021, 292, 112762. [Google Scholar] [CrossRef]
  5. Liu, J.; Ren, N.; Qu, C.; Lu, S.; Xiang, Y.; Liang, D. Recent Advances in the Reactor Design for Industrial Wastewater Treatment by Electro-Oxidation Process. Water 2022, 14, 3711. [Google Scholar] [CrossRef]
  6. Galeano, M.B.; Sulonen, M.; Ul, Z.; Baeza, M.; Baeza, J.A.; Guisasola, A. Bioelectrochemical ammonium recovery from wastewater: A review. Chem. Eng. J. 2023, 472, 144855. [Google Scholar] [CrossRef]
  7. Ma, H.; Chen, G.; Huang, F.; Li, Y.; Zhang, L.; Jin, Y. Catalytic ozonation of ammonia nitrogen removal in wastewater: A review. J. Water Process Eng. 2023, 52, 103542. [Google Scholar] [CrossRef]
  8. Zhang, Y.; Wang, Y.; Chen, Z.; Hu, C.; Qu, J. Recovering nutrients and unblocking the cake layer of an electrochemical anaerobic membrane bioreactor. Nat. Commun. 2024, 15, 9111. [Google Scholar] [CrossRef]
  9. Zheng, M.; Hu, Z.; Liu, T.; Sperandio, M.; Volcke, E.I.P.; Wang, Z.; Hao, X.; Duan, H.; Vlaeminck, S.E.; Xu, K.; et al. Pathways to advanced resource recovery from sewage. Nat. Sustain. 2024, 7, 1395–1404. [Google Scholar] [CrossRef]
  10. Ronteltap, M.; Maurer, M.; Gujer, W. The behaviour of pharmaceuticals and heavy metals during struvite precipitation in urine. Water Res. 2007, 41, 1859–1868. [Google Scholar] [CrossRef] [PubMed]
  11. Park, J.; Lee, W.; Choe, J.K.; Choi, Y. Non-evaporative solid phase ammonium sulfate separation from ammonia-stripped sulfuric acid solution by solvent-driven fractional crystallization. Sep. Purif. Technol. 2023, 318, 123869. [Google Scholar] [CrossRef]
  12. Yellezuome, D.; Zhu, X.; Wang, Z.; Liu, R. Mitigation of ammonia inhibition in anaerobic digestion of nitrogen-rich substrates for biogas production by ammonia stripping: A review. Renew. Sustain. Energy Rev. 2022, 157, 112043. [Google Scholar] [CrossRef]
  13. Yuan, M.-H.; Trinh, M.V.; Chen, Y.-H.; Lu, Y.-J.; Wang, L.-P.; Cheng, S.; Li, Z.; Santikunaporn, M.; Asavatesanupap, C. Steam Stripping for Recovery of Ammonia from Wastewater Using a High-Gravity Rotating Packed Bed. Environments 2024, 11, 206. [Google Scholar] [CrossRef]
  14. Zhan, L.; Hou, D.; Chen, H.; Wang, Y.; Zheng, S.; Li, Z.; Wu, H.; Chen, H.; Ma, X.; Yang, L. Occurrence states and migration of water during the evaporation of desulfurization wastewater. Desalination 2024, 578, 117435. [Google Scholar] [CrossRef]
  15. Zhou, S.; Dong, M.; Ding, X.; Xue, X.; Yang, H. Application of RSM to optimize the recovery of ammonia nitrogen from high chromium effluent produced in vanadium industry using struvite precipitation. J. Environ. Chem. Eng. 2021, 9, 106318. [Google Scholar] [CrossRef]
  16. Farghali, M.; Chen, Z.; Osman, A.I.; Ali, I.M.; Hassan, D.; Ihara, I.; Rooney, D.W.; Yap, P.-S. Strategies for ammonia recovery from wastewater: A review. Environ. Chem. Lett. 2024, 22, 2699–2751. [Google Scholar] [CrossRef]
  17. Kirinovic, E.; Leichtfuss, A.R.; Navizaga, C.; Zhang, H.; Schuttlefield Christus, J.D.; Baltrusaitis, J. Spectroscopic and Microscopic Identification of the Reaction Products and Intermediates during the Struvite (MgNH4PO4·6H2O) Formation from Magnesium Oxide (MgO) and Magnesium Carbonate (MgCO3) Microparticles. ACS Sustain. Chem. Eng. 2017, 5, 1567–1577. [Google Scholar] [CrossRef]
  18. Huang, Y.; Cai, J.; Ye, Z.L.; Lin, L.; Hong, Z. Morphological crystal adsorbing tetracyclines and its interaction with magnesium ion in the process of struvite crystallization by using synthetic wastewater. Water Res. 2022, 215, 118253. [Google Scholar] [CrossRef]
  19. Iftikhar, A.; Tao, W. Recovery of struvite for organic production: Mineral-based magnesium supplementation and pH elevation. J. Clean. Prod. 2024, 452, 142244. [Google Scholar] [CrossRef]
  20. Chen, Y.; Long, J.; Chen, S.; Xie, Y.; Xu, Z.; Ning, Z.; Zhang, G.; Xiao, T.; Yu, M.; Ke, Y.; et al. Multi-step purification of electrolytic manganese residue leachate using hydroxide sedimentation, struvite precipitation, chlorination and coagulation: Advanced removal of manganese, ammonium, and phosphate. Sci. Total Environ. 2022, 805, 150237. [Google Scholar] [CrossRef]
  21. Wang, G.; Diao, J.; Liu, L.; Li, M.; Li, H.; Li, G.; Xie, B. Highly efficient utilization of hazardous vanadium extraction tailings containing high chromium concentrations by carbothermic reduction. J. Clean. Prod. 2019, 237, 117832. [Google Scholar] [CrossRef]
  22. Sena, M.; Seib, M.; Noguera, D.R.; Hicks, A. Environmental impacts of phosphorus recovery through struvite precipitation in wastewater treatment. J. Clean. Prod. 2021, 280, 124222. [Google Scholar] [CrossRef]
  23. Shaddel, S.; Ucar, S.; Andreassen, J.-P.; Østerhus, S.W. Engineering of struvite crystals by regulating supersaturation—Correlation with phosphorus recovery, crystal morphology and process efficiency. J. Environ. Chem. Eng. 2019, 7, 102918. [Google Scholar] [CrossRef]
  24. Corona, F.; Hidalgo, D.; Martin-Marroquin, J.M.; Antolin, G. Study of the influence of the reaction parameters on nutrients recovering from digestate by struvite crystallisation. Environ. Sci. Pollut. Res. Int. 2021, 28, 24362–24374. [Google Scholar] [CrossRef]
  25. Ronteltap, M.; Maurer, M.; Hausherr, R.; Gujer, W. Struvite precipitation from urine—Influencing factors on particle size. Water Res. 2010, 44, 2038–2046. [Google Scholar] [CrossRef]
  26. Jia, G. Nutrient Removal and Recovery by the Precipitation of Magnesium Ammonium Phosphate; The university of Adelaide: Adelaide, Australia, 2014. [Google Scholar]
  27. Luo, Z.; Wang, D.; Yang, J.; Huang, H.; Su, G. Nitrogen removal from digested piggery wastewater using fermented superphosphate within the pretreatment stage and an MAP fertilizer pot test. J. Clean. Prod. 2019, 212, 372–380. [Google Scholar] [CrossRef]
  28. Tünay, O.; Kabdasli, I.; Orhon, D.; Ates, E. Characterization and pollution profile of leather tanning industry in Turkey. Water Sci. Technol. 1995, 32, 1–9. [Google Scholar] [CrossRef]
  29. Draper, N.R.; Smith, H. Applied Regression Analysis; McGraw-Hill. Inc.: New York, NY, USA, 1998; Volume 326. [Google Scholar]
  30. Ambler, G.; Royston, P. Fractional polynomial model selection procedures: Investigation of type i error rate. J. Stat. Comput. Simul. 2001, 69, 89–108. [Google Scholar] [CrossRef]
  31. Hoerl, A.E.; Kennard, R.W. Ridge regression: Biased estimation for nonorthogonal problems. Technometrics 1970, 12, 55–67. [Google Scholar] [CrossRef]
  32. Tibshirani, R. Regression Shrinkage and Selection Via the Lasso. J. R. Stat. Soc. Ser. B Stat. Methodol. 1996, 58, 267–288. [Google Scholar] [CrossRef]
  33. Biau, G. Analysis of a random forests model. J. Mach. Learn. Res. 2012, 13, 1063–1095. [Google Scholar]
  34. Breiman, L. Random Forests. Mach. Learn. 2001, 45, 5–32. [Google Scholar] [CrossRef]
  35. Friedman, J.H. Greedy function approximation: A gradient boosting machine. Ann. Stat. 2001, 29, 1189–1232. [Google Scholar] [CrossRef]
  36. Racz, A.; Bajusz, D.; Heberger, K. Effect of Dataset Size and Train/Test Split Ratios in QSAR/QSPR Multiclass Classification. Molecules 2021, 26, 1111. [Google Scholar] [CrossRef]
  37. Leng, L.; Kang, B.; Xu, D.; Kapusta, K.; Xiong, T.; Xu, Z.; Fan, L.; Liu, T.; Peng, H.; Li, H. Machine-learning-aided prediction and optimization of struvite recovery from synthetic wastewater. J. Water Process Eng. 2024, 58, 104896. [Google Scholar] [CrossRef]
  38. Burzykowski, T.; Geubbelmans, M.; Rousseau, A.J.; Valkenborg, D. Validation of machine learning algorithms. Am. J. Orthod. Dentofac. Orthop. 2023, 164, 295–297. [Google Scholar] [CrossRef]
  39. Yadav, S.; Shukla, S. Analysis of k-fold cross-validation over hold-out validation on colossal datasets for quality classification. In Proceedings of the 2016 IEEE 6th International Conference on Advanced Computing (IACC), Bhubaneswar, India, 27–28 February 2016; pp. 78–83. [Google Scholar] [CrossRef]
  40. Wu, H.; Hao, B.; Zhou, Q.; Xu, K.; Cai, Y.; Liu, G. Contribution of various categories of environmental factors to sediment nitrogen-removal in a low C/N ratio river. Ecol. Eng. 2021, 159, 106121. [Google Scholar] [CrossRef]
  41. Qiu, H.; Geng, J.; Ren, H.; Ding, L.; Xu, K.; Zhang, Y. Aquatic transformation of phosphite under natural sunlight and simulated irradiation. Water Res. 2017, 109, 69–76. [Google Scholar] [CrossRef] [PubMed]
  42. Du, H.; Ren, X.; Pan, D.; An, Y.; Wei, Y.; Liu, X.; Hou, L.; Liu, B.; Liu, M.; Guo, Z. Effect of phosphating solution pH value on the formation of phosphate conversion coatings for corrosion behaviors on AZ91D. Adv. Compos. Hybrid. Mater. 2021, 4, 401–414. [Google Scholar] [CrossRef]
  43. Qiu, L.; Shi, L.; Liu, Z.; Xie, K.; Wang, J.; Zhang, S.; Song, Q.; Lu, L. Effect of power ultrasound on crystallization characteristics of magnesium ammonium phosphate. Ultrason. Sonochem. 2017, 36, 123–128. [Google Scholar] [CrossRef] [PubMed]
  44. Quintana, M.; Sánchez, E.; Colmenarejo, M.F.; Barrera, J.; García, G.; Borja, R. Kinetics of phosphorus removal and struvite formation by the utilization of by-product of magnesium oxide production. Chem. Eng. J. 2005, 111, 45–52. [Google Scholar] [CrossRef]
  45. Polat, S.; Sayan, P. Application of response surface methodology with a Box–Behnken design for struvite precipitation. Adv. Powder Technol. 2019, 30, 2396–2407. [Google Scholar] [CrossRef]
  46. Wei, L.; Zhang, T.; Hong, T.; Dong, Y.; Ji, D.; Luo, L.; Li, R.; Li, Z.; Tang, Y. Revealing and quantifying the effect of cattiite coprecipitation on the purity of K-struvite in aqueous solution. J. Environ. Chem. Eng. 2023, 11, 109764. [Google Scholar] [CrossRef]
  47. Le Corre, K.S.; Valsami-Jones, E.; Hobbs, P.; Parsons, S.A. Phosphorus Recovery from Wastewater by Struvite Crystallization: A Review. Crit. Rev. Environ. Sci. Technol. 2009, 39, 433–477. [Google Scholar] [CrossRef]
  48. Yetilmezsoy, K.; Sapci-Zengin, Z. Recovery of ammonium nitrogen from the effluent of UASB treating poultry manure wastewater by MAP precipitation as a slow release fertilizer. J. Hazard. Mater. 2009, 166, 260–269. [Google Scholar] [CrossRef]
  49. Ronteltap, M.; Maurer, M.; Gujer, W. Struvite precipitation thermodynamics in source-separated urine. Water Res. 2007, 41, 977–984. [Google Scholar] [CrossRef]
  50. Wang, Y.; Mou, J.; Liu, X.; Chang, J. Phosphorus recovery from wastewater by struvite in response to initial nutrients concentration and nitrogen/phosphorus molar ratio. Sci. Total Environ. 2021, 789, 147970. [Google Scholar] [CrossRef]
  51. Nunes, A.P.P.; Santos, C.F.; Guelfi, D. Interfaces between biodegradable organic matrices coating and MAP fertilizer for improve use efficiency. Sci. Total Environ. 2022, 804, 149896. [Google Scholar] [CrossRef]
  52. Chai, L.-y.; Peng, C.; Min, X.-b.; Tang, C.-j.; Song, Y.-x.; Zhang, Y.; Zhang, J.; Ali, M. Two-sectional struvite formation process for enhanced treatment of copper–ammonia complex wastewater. Trans. Nonferrous Met. Soc. China 2017, 27, 457–466. [Google Scholar] [CrossRef]
  53. Ariyanto, E.; Sen, T.K.; Ang, H.M. The influence of various physico-chemical process parameters on kinetics and growth mechanism of struvite crystallisation. Adv. Powder Technol. 2014, 25, 682–694. [Google Scholar] [CrossRef]
  54. Hutnik, N.; Kozik, A.; Mazienczuk, A.; Piotrowski, K.; Wierzbowska, B.; Matynia, A. Phosphates (V) recovery from phosphorus mineral fertilizers industry wastewater by continuous struvite reaction crystallization process. Water Res. 2013, 47, 3635–3643. [Google Scholar] [CrossRef]
  55. Zhao, T.L.; Li, H.; Jiang, H.F.; Yao, Q.Z.; Huang, Y.; Zhou, G.T. Morphogenesis and evolution mechanisms of bacterially-induced struvite. Sci. Rep. 2021, 11, 170. [Google Scholar] [CrossRef]
  56. Kozik, A.; Hutnik, N.; Piotrowski, K.; Matynia, A. Continuous reaction crystallization of struvite from diluted aqueous solution of phosphate(V) ions in the presence of magnesium ions excess. Chem. Eng. Res. Des. 2014, 92, 481–490. [Google Scholar] [CrossRef]
  57. Krishnamoorthy, N.; Dey, B.; Unpaprom, Y.; Ramaraj, R.; Maniam, G.P.; Govindan, N.; Jayaraman, S.; Arunachalam, T.; Paramasivan, B. Engineering principles and process designs for phosphorus recovery as struvite: A comprehensive review. J. Environ. Chem. Eng. 2021, 9, 105579. [Google Scholar] [CrossRef]
  58. Bah, A.T.; Shen, Z.; Yan, J.; Li, F. Phosphorous recovery from water via batch adsorption enrichment combined with struvite crystallization in a fluidized bed reactor. J. Environ. Chem. Eng. 2023, 11, 110180. [Google Scholar] [CrossRef]
  59. Sugiyama, S.; Yokoyama, M.; Ishizuka, H.; Sotowa, K.; Tomida, T.; Shigemoto, N. Removal of aqueous ammonium with magnesium phosphates obtained from the ammonium-elimination of magnesium ammonium phosphate. J. Colloid. Interface Sci. 2005, 292, 133–138. [Google Scholar] [CrossRef] [PubMed]
  60. Yu, R.; Geng, J.; Ren, H.; Wang, Y.; Xu, K. Struvite pyrolysate recycling combined with dry pyrolysis for ammonium removal from wastewater. Bioresour. Technol. 2013, 132, 154–159. [Google Scholar] [CrossRef]
  61. Wang, D.; Chen, J.; Li, Y.; Feng, S. Solid State Chemistry and Inorganic Synthetic Chemistry—Novel Structures and Accurate Syntheses of Inorganic Materials. Small Methods 2025, 9, e2401491. [Google Scholar] [CrossRef] [PubMed]
  62. Whitehead, C.B.; Watzky, M.A.; Finke, R.G. “Burst Nucleation” vs. Autocatalytic, “Burst” Growth in Near-Monodisperse Particle-Formation Reactions. J. Phys. Chem. C 2020, 124, 24543–24554. [Google Scholar] [CrossRef]
  63. Barbosa, S.G.; Peixoto, L.; Meulman, B.; Alves, M.M.; Pereira, M.A. A design of experiments to assess phosphorous removal and crystal properties in struvite precipitation of source separated urine using different Mg sources. Chem. Eng. J. 2016, 298, 146–153. [Google Scholar] [CrossRef]
  64. Mugwili, M.E.; Waanders, F.B.; Masindi, V.; Fosso-Kankeu, E. Effective removal of ammonia from aqueous solution through struvite synthesis and breakpoint chlorination: Insights into the synergistic effects of the hybrid system. J. Environ. Manag. 2023, 334, 117506. [Google Scholar] [CrossRef]
  65. Rahman, M.M.; Salleh, M.A.M.; Rashid, U.; Ahsan, A.; Hossain, M.M.; Ra, C.S. Production of slow release crystal fertilizer from wastewaters through struvite crystallization—A review. Arab. J. Chem. 2014, 7, 139–155. [Google Scholar] [CrossRef]
  66. Hasar, H.; Unsal, S.A.; Ipek, U.; Karatas, S.; Cinar, O.; Yaman, C.; Kinaci, C. Stripping/flocculation/membrane bioreactor/reverse osmosis treatment of municipal landfill leachate. J. Hazard. Mater. 2009, 171, 309–317. [Google Scholar] [CrossRef]
  67. Ukwuani, A.T.; Tao, W. Developing a vacuum thermal stripping—Acid absorption process for ammonia recovery from anaerobic digester effluent. Water Res. 2016, 106, 108–115. [Google Scholar] [CrossRef]
  68. Pressley, T.A.; Bishop, D.F.; Roan, S.G. Ammonia-nitrogen removal by breakpoint chlorination. Environ. Sci. Technol. 2002, 6, 622–628. [Google Scholar] [CrossRef]
  69. Maghfiroh, M.; Park, N.; Chang, H.; Lim, H.; Kim, W. Ammonium removal and recovery from greywater using the combination of ion exchange and air stripping: The utilization of NaOH for the regeneration of natural zeolites. J. Water Process Eng. 2023, 52, 103581. [Google Scholar] [CrossRef]
  70. Arias-Paić, M.S.; Korak, J.A. Forward Osmosis for Ion Exchange Waste Brine Management. Environ. Sci. Technol. Lett. 2020, 7, 111–117. [Google Scholar] [CrossRef]
  71. Song, W.; Li, Z.; Liu, F.; Ding, Y.; Qi, P.; You, H.; Jin, C. Effective removal of ammonia nitrogen from waste seawater using crystal seed enhanced struvite precipitation technology with response surface methodology for process optimization. Environ. Sci. Pollut. Res. Int. 2018, 25, 628–638. [Google Scholar] [CrossRef] [PubMed]
  72. Tansel, B.; Lunn, G.; Monje, O. Struvite formation and decomposition characteristics for ammonia and phosphorus recovery: A review of magnesium-ammonia-phosphate interactions. Chemosphere 2018, 194, 504–514. [Google Scholar] [CrossRef] [PubMed]
  73. Miao, L.; Yang, G.; Tao, T.; Peng, Y. Recent advances in nitrogen removal from landfill leachate using biological treatments—A review. J. Environ. Manag. 2019, 235, 178–185. [Google Scholar] [CrossRef] [PubMed]
  74. Ruiz, G.; Jeison, D.; Chamy, R. Nitrification with high nitrite accumulation for the treatment of wastewater with high ammonia concentration. Water Res. 2003, 37, 1371–1377. [Google Scholar] [CrossRef]
  75. Li, L.; Liu, Y. Ammonia removal in electrochemical oxidation: Mechanism and pseudo-kinetics. J. Hazard. Mater. 2009, 161, 1010–1016. [Google Scholar] [CrossRef]
  76. Darestani, M.; Haigh, V.; Couperthwaite, S.J.; Millar, G.J.; Nghiem, L.D. Hollow fibre membrane contactors for ammonia recovery: Current status and future developments. J. Environ. Chem. Eng. 2017, 5, 1349–1359. [Google Scholar] [CrossRef]
  77. Huang, T.L.; Macinnes, J.M.; Cliffe, K.R. Nitrogen removal from wastewater by a catalytic oxidation method. Water Res. 2001, 35, 2113–2120. [Google Scholar] [CrossRef] [PubMed]
  78. Wang, C.; Ren, D.; Harle, G.; Qin, Q.; Guo, L.; Zheng, T.; Yin, X.; Du, J.; Zhao, Y. Ammonia removal in selective catalytic oxidation: Influence of catalyst structure on the nitrogen selectivity. J. Hazard. Mater. 2021, 416, 125782. [Google Scholar] [CrossRef] [PubMed]
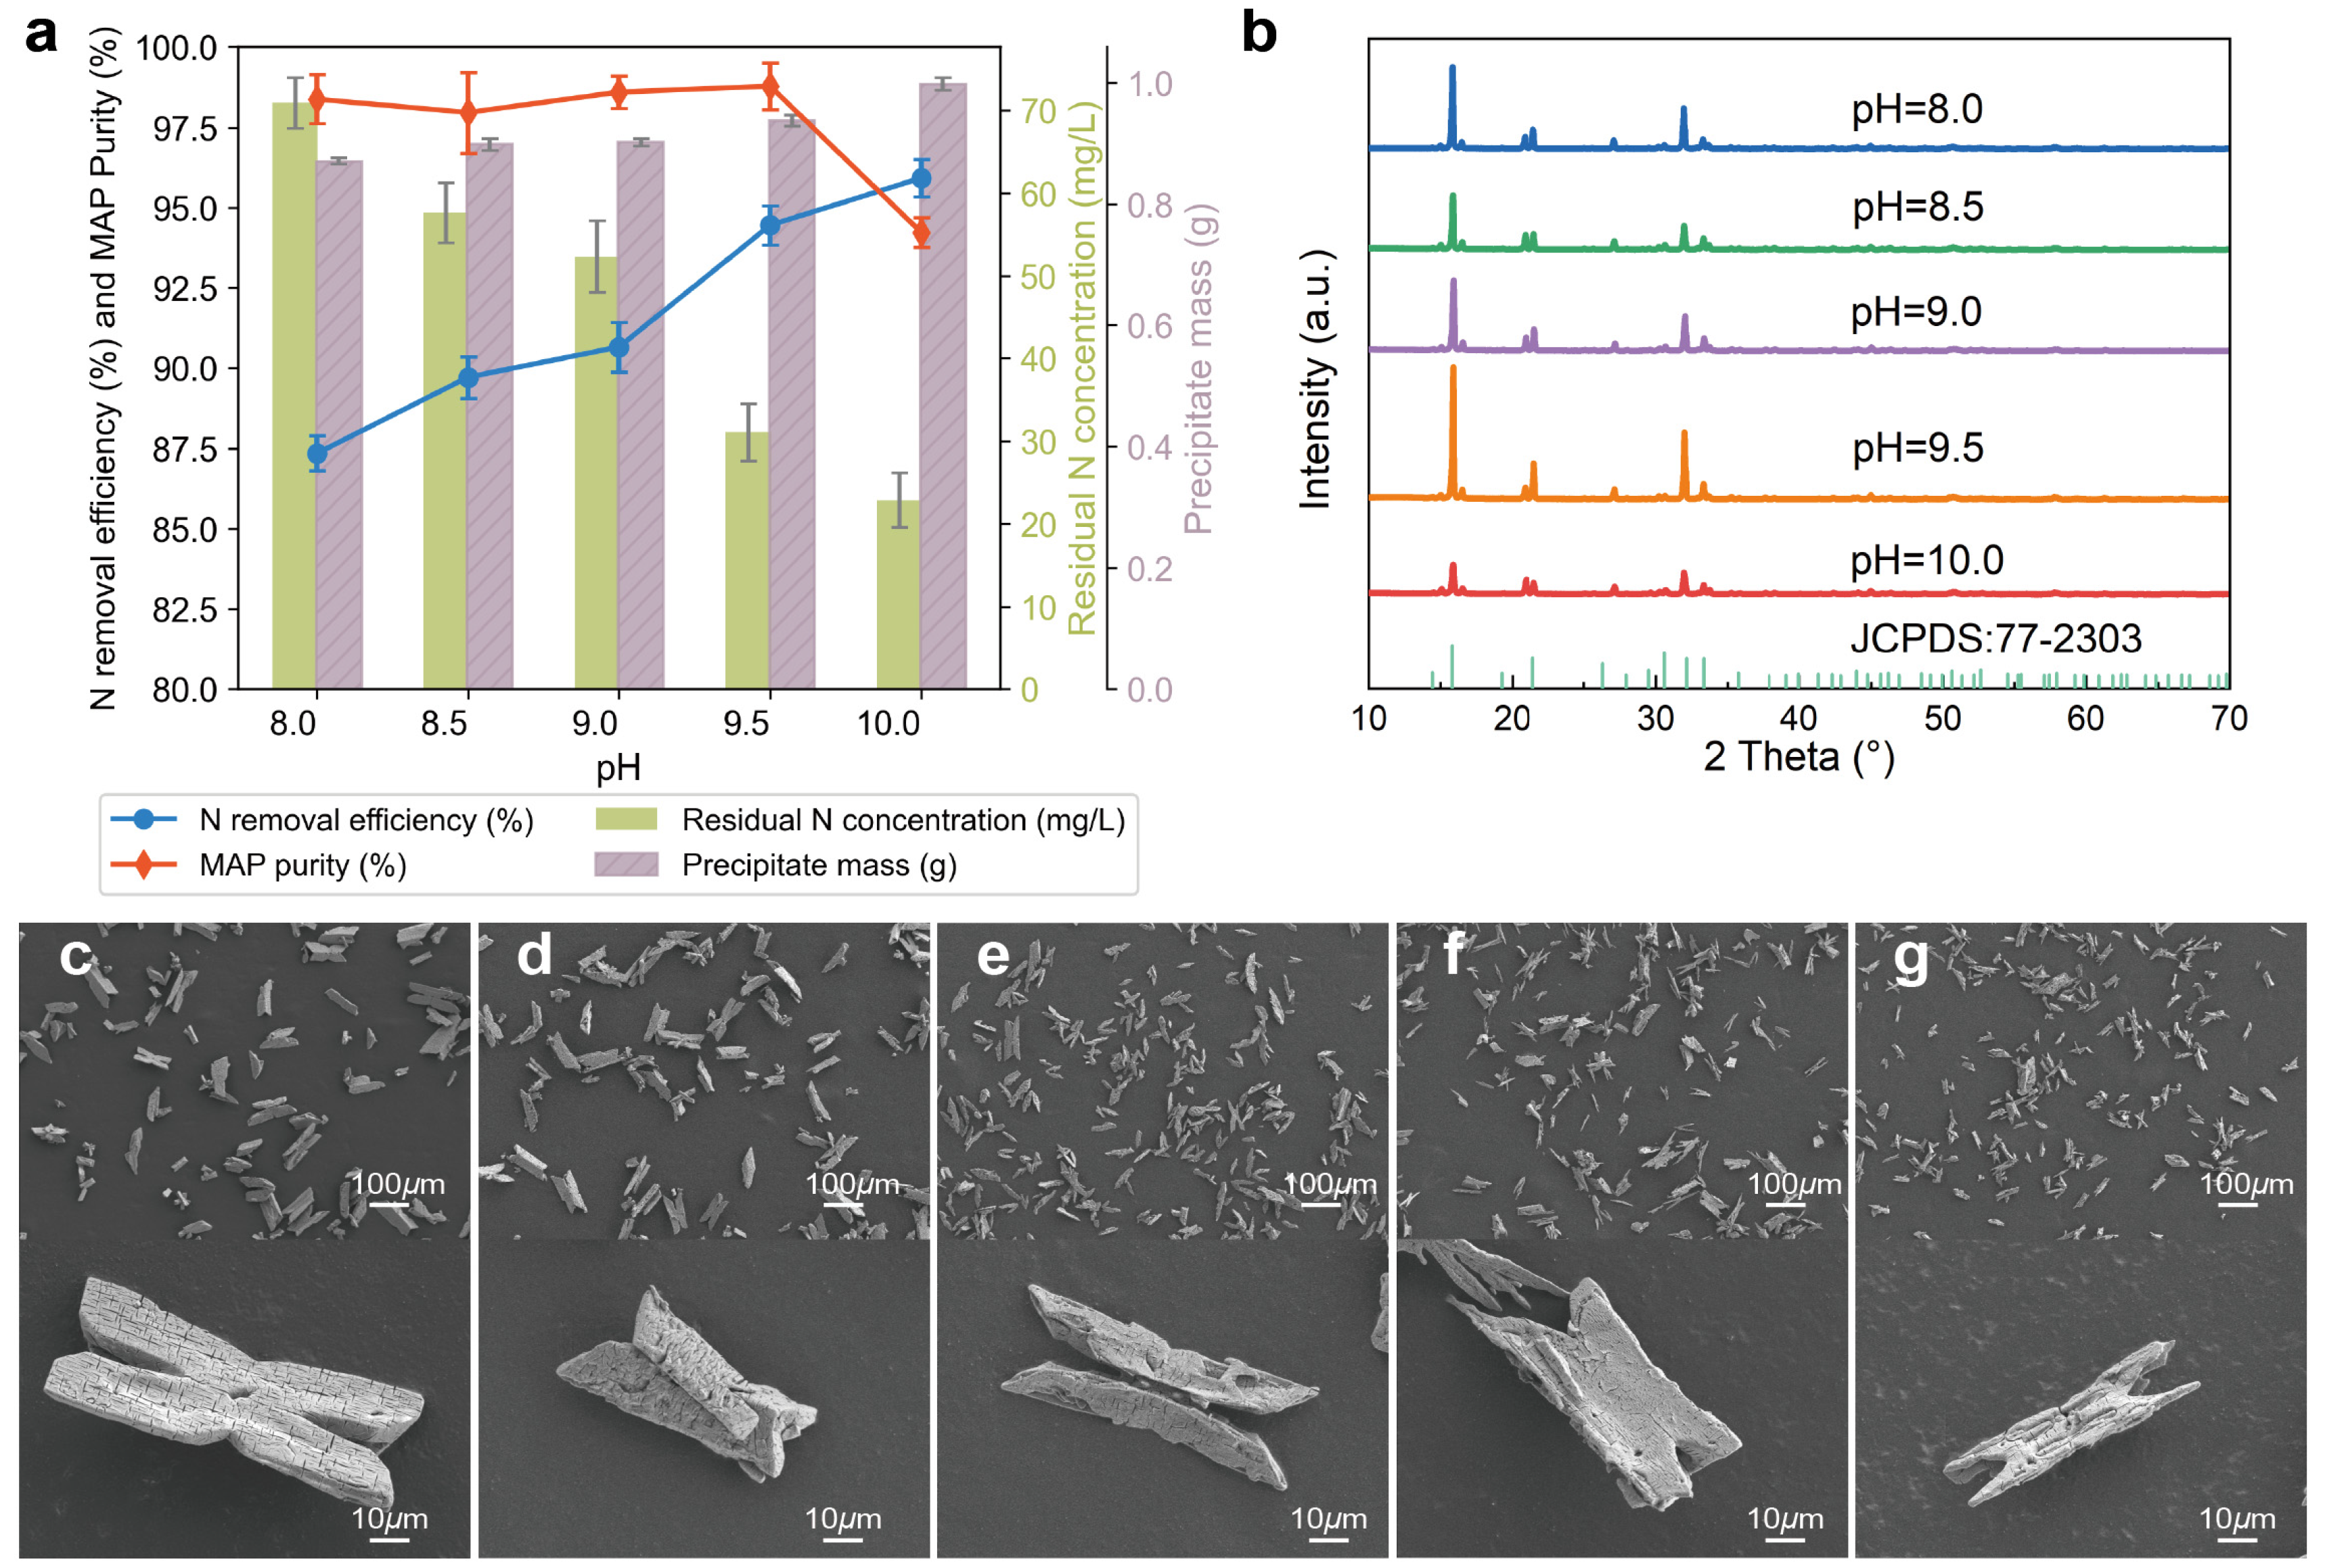
Figure 1. Effect of pH on nitrogen removal efficiency and precipitate characteristics. (a) Variation in nitrogen removal efficiency (%), residual nitrogen concentration (mg/L), MAP purity (%), and precipitate mass (g) under different pH values. Blue line: nitrogen removal efficiency; red line: MAP purity; green bars: residual nitrogen concentration; purple bars: precipitate mass. (b) X-ray diffraction (XRD) patterns of precipitates at different pH levels, showing the characteristic peaks of struvite (JCPDS: 77-2303). The intensity and sharpness of peaks vary with pH, indicating differences in crystallinity. (cg) Scanning electron microscopy (SEM) images of precipitates at pH 8.0 (c), 8.5 (d), 9.0 (e), 9.5 (f), and 10.0 (g). Each image includes a full view (top: 100 μm scale) and a close-up (bottom: 10 μm scale). Morphological transitions can be observed from irregular to more elongated and defined crystal structures as pH increases.
Sustainability 17 08550 g001
Figure 2. Effect of n(Mg):n(N) on nitrogen removal efficiency and precipitate characteristics. (a) Nitrogen removal efficiency (%), MAP purity (%), residual nitrogen concentration (mg/L, green bars, left y-axis), and precipitate mass (g, purple bars, right y-axis) under varying n(Mg):n(N) molar ratios (1.0–1.4). Line plots show nitrogen removal efficiency (blue) and MAP purity (red). (b) XRD patterns of precipitates formed at different molar ratios, overlaid against the struvite reference (JCPDS: 77-2303). Peak intensity increases with molar ratio, indicating enhanced crystallinity at n(Mg):n(N) = 1.3 (cg) SEM images of precipitates under n(Mg):n(N) conditions of (c) 1.0, (d) 1.1, (e) 1.2, (f) 1.3, and (g) 1.4. Each includes a 100 μm overview and 10 μm close-up. Morphological differences are minor but may relate to changes in reaction stoichiometry.
Sustainability 17 08550 g002
Figure 3. Effect of n(P):n(N) on nitrogen removal efficiency and precipitate characteristics. (a) Nitrogen removal efficiency (%) and MAP purity (%) plotted as lines; residual nitrogen concentration (mg/L, green bars) and precipitate mass (g, purple bars) plotted as bars; (b) XRD patterns of precipitates obtained under different n(P):n(N) ratios, with reference pattern JCPDS: 77-2303 included for comparison; (cg) SEM images of precipitates formed at different n(P):n(N) ratios: (c) 0.9, (d) 1.0, (e) 1.1, (f) 1.2, and (g) 1.3. Each includes a 100 μm overview and 10 μm close-up. Morphological differences are minor but may relate to changes in reaction stoichiometry.
Sustainability 17 08550 g003
Figure 4. Effect of stirring speed on nitrogen removal efficiency and precipitate characteristics. (a) Nitrogen removal efficiency (%) and MAP purity (%) shown as line graphs; residual nitrogen concentration (mg/L, green bars) and precipitate mass (g, purple bars) shown as bar graphs across different stirring speeds; (b) XRD patterns of precipitates formed under various stirring conditions, with standard reference JCPDS: 77-2303 shown for struvite phase comparison; (cg) SEM images of precipitates obtained at different stirring speeds: (c) 120 rpm, (d) 150 rpm, (e) 180 rpm, (f) 210 rpm, and (g) 240 rpm. Each includes a 100 μm overview and 10 μm close-up.
Sustainability 17 08550 g004
Figure 5. Effect of reaction time on nitrogen removal efficiency and precipitate characteristics. (a) Nitrogen removal efficiency (%) and MAP purity (%) shown as line graphs; residual nitrogen concentration (mg/L, green bars) and precipitate mass (g, purple bars) shown as bar graphs across different reaction times; (b) XRD patterns of precipitates at 20–60 min intervals, with struvite reference peaks shown from JCPDS: 77-2303; (cg) SEM images of precipitates at various reaction times: (c) 20 min, (d) 30 min, (e) 40 min, (f) 50 min, and (g) 60 min. Each includes a 100 μm overview and 10 μm close-up.
Sustainability 17 08550 g005
Figure 6. Effect of temperature on nitrogen removal efficiency and precipitate characteristics. (a) Nitrogen removal efficiency (%) and MAP purity (%) are presented as line graphs, while residual nitrogen concentration (mg/L, green bars) and precipitate mass (g, purple bars) are shown as bar graphs across different temperatures; (b) XRD patterns of precipitates at 15–35 °C, with struvite reference peaks shown from JCPDS: 77-2303; (cg) SEM images of precipitates under different temperatures: (c) 15 °C, (d) 20 °C, (e) 25 °C, (f) 30 °C, and (g) 35 °C. Each includes a 100 μm overview and 10 μm close-up.
Sustainability 17 08550 g006
Figure 7. (a) Comparison of actual and predicted nitrogen removal efficiency (%) using the Random Forest model. The red dashed line represents the ideal 1:1 reference line. (b) Relative feature importance derived from the Random Forest model. The importance values are normalized and indicate each parameter’s contribution to prediction accuracy. Parameters include pH, molar ratios n(Mg):n(N) and n(P):n(N), stirring speed (rpm), temperature (°C), and reaction time (min).
Sustainability 17 08550 g007
Table 1. Empirical regression equations for linear models.
ModelEmpirical Regression Equation
Linear Regressiony = 39.7778 + 4.4016x1 + 8.8262x2 + 4.9330x3 − 0.0312x4 + 0.0118x5 + 0.0939x6
Ridge Regressiony = 50.8501 + 4.1982x1 + 3.7786x2 + 1.2674x3 − 0.0341x4 + 0.0033x5 + 0.1108x6
Lasso Regressiony = 97.7371 + 0.0000x1 + 0.0000x2 + 0.0000x3 − 0.0284x4 + 0.0000x5 + 0.0103x6
Note: The coefficients for pH, n(Mg):n(N), n(P):n(N), and Time were regularized to zero by the Lasso model, indicating their minimal contribution to the predictive model.
Table 2. Comparison of regression model performance in predicting nitrogen removal efficiency on the test dataset. Metrics include coefficient of determination (R2), root mean square error (RMSE), mean absolute error (MAE), and adjusted R2. The Random Forest and Optimized Random Forest models showed the highest predictive performance based on R2 and error reduction.
Model R 2 RMSEMAE Adjusted   R 2
Linear Regression0.8900610.8380680.7368860.830094
Polynomial Regression0.8908630.8350050.7303080.831334
Ridge Regression0.8892550.8411350.7357330.828849
Lasso Regression0.8657460.9261210.7673740.792516
Random Forest0.9109940.7540740.6519880.862445
Gradient Boosting0.8898090.8390270.7200850.829705
Optimized RF0.9082390.7656550.6509530.858187
Table 3. Comparison of experimentally determined and model-predicted optimal conditions for nitrogen removal via magnesium ammonium phosphate (MAP) crystallization. Parameters include pH, molar ratios of magnesium and phosphorus to nitrogen (n(Mg):n(N) and n(P):n(N)), stirring speed (rpm), reaction time (min), and temperature (°C). Nitrogen removal efficiency (%) is provided as the performance outcome.
ParameterExperimental Optimal ConditionsModel-Predicted Optimal Conditions
Experiment No.27
pH9.59.8
n(Mg):n(N)1.31.2
n(P):n(N)1.01.0
Stirring speed (rpm)150150
Reaction time (min)3030
Temperature (°C)3025
N removal (%)97.9796.98
Disclaimer/Publisher’s Note: The statements, opinions and data contained in all publications are solely those of the individual author(s) and contributor(s) and not of MDPI and/or the editor(s). MDPI and/or the editor(s) disclaim responsibility for any injury to people or property resulting from any ideas, methods, instructions or products referred to in the content.