Article

Decoding Multi-Scale Environmental Configurations for Older Adults’ Walkability with Explainable Machine Learning

1
College of Landscape Architecture and Art, Fujian Agriculture and Forestry University, Fuzhou 350100, China
2
Faculty of Engineering and Information Technology, University of Technology Sydney, Sydney 2007, Australia
*
Author to whom correspondence should be addressed.
Sustainability 2025, 17(18), 8499; https://doi.org/10.3390/su17188499
Submission received: 17 August 2025 / Revised: 12 September 2025 / Accepted: 19 September 2025 / Published: 22 September 2025

Abstract

The rapid growth of the aging population, alongside functional decline and more older adults living independently, has increased demand for age-friendly infrastructure and walkable communities. This study proposes a quantitative framework to assess how multi-scale built environments influence older adults’ walkability, addressing the scarcity of scalable and interpretable models in age-friendly urban research. By combining the cumulative opportunity method, street-scene semantic segmentation, XGBoost, and GeoSHapley-based spatial effect analysis, the study finds that (1) significant spatial disparities in walkability exist in Xiamen’s central urban area. Over half of the communities (54.46%) failed to meet the minimum threshold (20 points) within the 15 min community life circle (15-min CLC), indicating inadequate infrastructure. The primary issue is low coverage of older adults’ welfare facilities (only 16.26% of communities are within a 15 min walk). Despite renovations in Jinhu Community, walkability remains low, highlighting persistent disparities. (2) Communities with abundant green space are predominantly newly developed areas (64.06%). However, these areas provide fewer facilities on average (2.3) than older communities (5.7), resulting in a “green space–service mismatch”, where visually appealing environments lack essential services. (3) Human perception variables such as safety, traffic flow, and closure positively influence walkability, while visual complexity, heat risk, exposure, and greenness have negative effects. (4) There is a clear supply and demand mismatch. Central districts combine high walkability with substantial older adults’ service demand. Newly built residential areas in the periphery and north have low density and insufficient pedestrian facilities. They fail to meet daily accessibility needs, revealing delays in age-friendly development. This framework, integrating nonlinear modeling and spatial analysis, reveals spatial non-stationarity and optimal thresholds in how the built environment influences walkability. Beyond methodological contributions, this study offers guidance for planners and policymakers to optimize infrastructure allocation, promote equitable, age-friendly cities, and enhance the health and wellbeing of older residents.

1. Introduction

Population aging is a growing global issue. According to the United Nations, the proportion of people aged 60 and above is projected to nearly double from 12% in 2017 to 23% by 2050 [1]. Developed countries like Japan and Germany have long been aging societies, and developing nations, including China, are rapidly following suit. By 2050, the proportion of people aged 60 and older in China is expected to rise from 16% (230 million) in 2017 to 35% (480 million), comprising nearly a quarter of the global older adults population [2]. These demographic shifts, coupled with limited resources, threaten the well-being of older adults and hinder broader social development [3]. As a result, creating age-friendly urban environments that support healthy aging has become a policy priority.
Walking, the primary mode of transportation for older adults, plays a critical role in maintaining their physical and mental well-being by reducing risks of chronic diseases and slowing cognitive decline [4]. However, older adults face limitations due to declining physical abilities, which restrict their capacity to engage in daily activities within a reasonable walking distance from their homes [5]. With the importance of walking for older populations, critical gaps remain in research on walkability within the 15 min city concept, particularly in addressing the specific mobility needs of older adults [2]. Given these gaps, greater attention must be paid to the quality of the built environment, which is crucial, as it directly influences their walking behavior, social participation, and overall health.
The “15-min CLC” and related concepts have attracted considerable attention in recent years as sustainable urban planning models [6] due to their potential to mitigate pollution, carbon emissions, and congestion while promoting active transportation modes. The evolution of the 15 min city is grounded in long-standing planning and development principles, with early approaches such as Howard’s Garden City [7] and Clarence Perry’s neighborhood unit [8] serving as important precursors. These models share the common goal of fostering sustainable and livable cities by promoting active transportation and ensuring that residents can meet their daily needs within a reasonable distance from home. It is crucial to emphasize the universal applicability of the 15 min CLC for all demographic groups. By 2050, individuals aged 60 and above in China will constitute about one-quarter of the global older adults population [9]. In response to these demographic shifts, the introduction of the “15-min CLC” and sustainable urban planning models [6] offers a key framework for addressing mobility challenges and meeting the growing demand for community services, particularly alleviating travel difficulties for older adults with limited mobility [10]. Shanghai was the first city in China to implement the “15-min CLC” model https://ghzyj.sh.gov.cn/nw2423/ (accessed on 2 January 2025). This strategy adopts a hierarchical structure of 5, 10, and 15 min zones to address daily needs in a spatially optimized and differentiated way, thereby improving service accessibility [11]. Then, cities such as Beijing, Xiamen, and Wuhan have incorporated the 15 min CLC into their urban planning framework, furthering its practice through policy guidance and financial incentives.
In 2023, Xiamen launched initiatives in urban renewal, historic district renovation, and older adults care facility construction. The city set phased goals for its older adult care service system, by 2025, to establish a “15-min CLC” offering accessible and high-quality services and, by 2035, to build an integrated system based on home care, supported by communities, supplemented by institutions, and combining medical and older adults care. This vision shifts from targeted welfare to universal coverage and from limited access to equitable provision [12]. As aging accelerates globally and economic capacities grow in China and other developing countries, many cities are expected to follow Xiamen’s trajectory. Thus, Xiamen serves as a representative case for examining equity in older adult care service facilities (ECSF) construction in developed Chinese cities, providing reference for other developing regions.
Therefore, this study focuses on the built environment within walking distance for older adults to support the precise implementation of the “15-min CLC” model. It conducts an in-depth analysis of how multiple environmental factors interact to shape walking behavior in this demographic. The objective is to develop a livable urban environment that enables independent living among older adults, particularly by meeting their daily walking needs. Such efforts are crucial not only for improving spatial governance at the community level and enhancing the quality of life for older adults but also for advancing national strategies, including the 20th Party Congress’s call to enhance people’s well-being and the broader initiative to actively address population aging.

1.1. Related Work

In recent years, researchers have sought to refine methodologies for identifying and measuring accessibility within the framework of 15 min CLC. For example, Dunning et al. estimated the minimum walking duration between postal code areas and various categories of services [13]. Willberg et al. utilized statistical grid data to examine seasonal variations in older adults’ access to grocery stores [14]. Weng et al. employed POI data and Baidu Maps to estimate the shortest walking distances between communities and service facilities, thereby evaluating the spatial structure of the 15 min CLC [15]. An OD cost matrix was subsequently used to determine the population-weighted separation between buildings and public service amenities [16]. At the same time, research has increasingly focused on the multi-scale characteristics of the built environment. Research increasingly focuses on the built environment’s multi-scale characteristics, distinguishing neighborhood-scale attributes such as urban form and destination accessibility [17] from street-scale design details such as sidewalk width and street greening [18]. These elements influence walking behavior both directly and indirectly. Various micro-scale factors have been identified as facilitators of walking among older adults. Such factors include adequate street greenness, diverse street-level commercial activities, high-quality sidewalks and pedestrian infrastructure, aesthetically pleasing street design, appropriate lighting, and favorable thermal conditions [19,20]. However, gaps remain in research on walkability for older adults within the 15 min CLC. Many studies overlook the unique mobility needs of older adults, relying on generalized standards that fail to account for their specific safety and comfort requirements. Additionally, most studies remain fragmented across different spatial scales, such as 5 min community life circle, 10 min community life circle, and 15 min community life circle (5, 10, and 15 min CLCs), without integrated cross-scale comparisons. This hinders a comprehensive understanding of how environmental factors impact walkability across multiple spatial scales. Research has shown that the built environment influences walking behavior through factors like green space layout and land-use mix, but the strength of these effects varies by spatial scale [21]; to address these issues, cross-scale comparative studies are essential to uncover the dynamic mechanisms shaping walkability. Such studies can help guide environmental optimization tailored to the spatial characteristics of distinct urban zones. Additionally, there is an urgent need to establish a multi-scale assessment framework that integrates both objective indicators of walkability and subjective perceptions in order to capture the differentiated user needs across varying walking distance ranges. While the 15 min CLC offers a framework for optimizing community environments, current research lacks a comprehensive understanding of the complex, nonlinear relationships between multidimensional factors, subjective perceptions, and spatial interactions that affect older adults’ walkability.
Although the 15 min CLC provides a valuable framework for optimizing community environments, existing research still lacks a comprehensive understanding of the complex, nonlinear relationships among multidimensional factors, subjective perceptions, and spatial interactions influencing older adults’ walkability. Most conventional studies primarily focus on evaluating street-level pedestrian environments across various geographic scales, yet the limited online representation of older adults, particularly on social media, may result in insufficient data coverage and undermine the reliability of such conclusions. Traditional models, including machine learning algorithms like XGBoost, provide valuable insights into these issues but often suffer from limited interpretability due to their “black-box” nature. To address this challenge, the SHapley Additive exPlanations (SHAP) method has been employed to enhance model transparency, though its application to complex spatial effects remains limited. The integration of the “XGBoost–GeoShapley” framework offers a promising solution by merging geographic coordinates (X, Y) into a unified geospatial feature, enabling more accurate analysis of spatial effects and their interactions with other influencing variables [22]. Comparative studies further confirm that this integrated framework outperforms traditional spatial models, such as the Spatial Lag Model (SLM) and Multi-scale Geographically Weighted Regression (MGWR), in capturing nonlinear spatial–non-spatial interactions and spatial heterogeneity [22].
These analytical tools are valuable for exploring the influence of community environmental factors on older adults’ walking behavior. A comprehensive understanding of human–nature interactions, environmental perception [23], and quantifying landscape preferences [24] provides robust theoretical support for studying the influence of community environments on older adults’ walking behavior. Therefore, there is an urgent need to establish a perception-based assessment framework that captures older adults’ subjective experiences of the community-built environment, including perceived safety, accessibility, and environmental comfort. Such a framework would allow urban designers and decision-makers to leverage big-data environmental assessment models, improving the efficiency of urban renewal planning and extending the practical value of experimental research.

1.2. Research Objectives

To address these research gaps, this study uses Xiamen, a rapidly aging coastal city in China, as a case study and proposes a multidimensional framework specifically designed to evaluate walkability for older adults. Its goal is to develop and apply a multi-scale evaluation system that integrates and optimizes the cumulative opportunities method to assess walkability scores of public facilities. By integrating geographic data from the Baidu API and other sources, this study quantifies the walkability of essential daily service facilities for older adults within 5, 10, and 15 min walking distances in Xiamen’s central urban area. Furthermore, the study aims to identify spatial disparities in service coverage by analyzing accessibility patterns and by mapping the distribution of older adults. This paper introduces an innovative integration of machine learning and spatial interpretability by combining XGBoost models with the GeoSHAP method. Specifically, this approach addresses two major limitations inherent in conventional SHAP methodologies when applied to geospatial data. (1) Traditional SHAP techniques are primarily designed for tree-based models such as decision trees, random forests, and gradient boosting, which limits their ability to capture complex spatial interactions. (2) Geographic location attributes should be treated as joint contributors rather than as isolated variables. This study offers new insights into the underlying mechanisms by which multidimensional factors shape the walking experiences of older adults.
Based on this, this study aims to address the following four core issues: RQ1: How can the walkability for older adults be quantified in 5, 10, and 15 min CLC? RQ2: What are the spatial disparities in walkability across different areas? RQ3: What supply–demand dynamics emerge in the bivariate spatial relationship between population density and walkability scores? RQ4: How do environmental, safety, and social variables interact to influence walkability?

2. Data and Methods

2.1. Research Area

Xiamen, the only special economic zone in Fujian Province and one of China’s seven such zones, has experienced rapid economic growth. However, the city simultaneously faces increasingly severe demographic pressures. The proportion of residents aged 0–14 is slightly below the provincial average, while those aged 60 and above account for only 9.56%, which is a relatively low figure that may conceal the underlying risks of accelerated population aging [25]. In this study, “older adults” refers to citizens aged 60 and above, consistent with China’s statutory retirement age and the definition in the Law on the Protection of the Rights and Interests of the older adults. Indeed, most geriatric studies in China adopt this age threshold [26]. Approximately 50% of the older adult population in the city resides on the island [27], resulting in a paradoxical situation where a superficially youthful demographic structure masks the intensifying pressures of aging [28]. Population aging represents a growing global challenge. Walking, one of the most important ways for older adults to manage their health independently [29], is influenced by neighborhood environment (NE) as well as the accessibility of services and facilities [30]. To address these issues, Xiamen implemented its “15-min CLC” policy, designed in response to the city’s demographic challenges and spatial constraints. This study focuses on Xiamen’s central urban area, excluding Gulangyu Island, encompassing Siming District and Huli District (Figure 1). Against the backdrop of rapid population aging and a highly concentrated urban form, this region exemplifies both the opportunities and challenges of implementing the “15-min CLC” in high-density urban cores.

2.2. Theoretical Framework

This study investigates the influence of street-level environmental variables, human perception variables, environmental exposure, heat risks, and community-level variables on older adults’ walking behavior within multi-scale living circles. The research is divided into three phases: (1) Data Collection: Integrating multi-source data, such as questionnaires on older adults’ walking safety perceptions, street view images, and temperature data. (2) Indicator Calculation: Using machine learning models to extract landscape and visual perception indicators. (3) Data Analysis: Applying the XGBoost–GeoSHapley model for modeling and interpretability to explore how multi-scale environmental configurations influence older adults’ walkability. The significance of various indicators is examined through XGBoost–GeoSHapley feature importance analysis, cluster maps, and partial dependency plots. The data were collected from multiple sources, followed by indicator acquisition, data processing, and final analysis to ensure the reliability of the results (Figure 2).
Data Collection: In March 2025, POI data were retrieved from the Xiamen City Gaode Map Open Platform, cleaned, and standardized in terms of coordinate systems. The data were categorized using ARCMAP 10.6 into eight categories, including catering services. Residential data from Anjuke (as of April 2025) contained 2769 entries, including community names and coordinates. Older adults’ Safety Perception Scores were collected through face-to-face interviews with 400 older adult volunteers from 20 February to 2 March 2025. We conducted a comprehensive survey of locally acclimatized adults aged ≥ 60 to obtain public landscape-perception scores and minimize interpretive bias, thereby strengthening instrument validity. Participants were predominantly 60–70 years old, followed by 71–80 and 81–90, with the ≥90 group least represented. Thus, the sample is concentrated in the 60–80 range, and the high participation rate among 60–70-year-olds indicates their relatively higher mobility compared to older cohorts in this cohort. The temperature data were derived from Landsat 8 TIRS imagery (2025) provided by the United States Geological Survey (USGS). Prior to acquisition, the imagery underwent radiometric and atmospheric corrections [31]. Images with less than 5% cloud cover and a spatial resolution of 30 m were selected and subsequently processed in ENVI 5.6 for thermal risk analysis. Spatial vitality data was sourced from the Baidu Heat Map and averaged from 7:00 to 21:00 during designated holidays. The heat map can reflect the distribution of vitality across different spatial ranges in real time [32]. Population density data were sourced from the Seventh National Population Census [33]. From 15 to 23 April 2025, experts scored indicator importance, and weights were calculated using the older adults’ physiological and Analytic Hierarchy Process (AHP), incorporating psychological characteristics. The consistency ratio (CR = 0.07 < 0.1) confirmed reliability.
(1)
Indicator Calculation: This study employs network analysis in ArcGIS to construct a walking network, with community centers serving as the starting points for calculating 5 min, 10 min, and 15 min walkable reach areas. Previous research has shown that walking speed decreases with age. For most healthy adults, the average walking speed is about 3 miles per hour (≈1.34 m/s), while, for individuals aged 60 years and above, it declines to around 2.7 miles per hour and further decreases to about 2.1 miles per hour after age 65 [34]. In this study, the walking speed for older adults is set at 80% of the general adult population’s average speed, which corresponds to approximately 2.7 km/h (≈0.75 m/s), a value widely accepted as representative of older adults [35].
(2)
The CNN-BiLSTM model (with three convolutional layers and two Long Short-Term Memory (LSTM) layers), combined with TrueSkill matching for sample labeling, was used to extract visual quality indicators. It was trained on 80% of the sample data. Meanwhile, landscape perception indicators were extracted from images via Fully Convolutional Networks (FCN) and Matlab R2023b software.
(3)
Data analysis was conducted using an XGBoost–GeoSHapley model to evaluate the marginal, spatial, and interaction effects of variables on walking accessibility for older adults. SHAP-based feature importance, partial dependence, and interaction analyses were further employed to interpret the results.

2.3. Variable Selection

To ensure the objectivity and accuracy of research indicators and facilitate meaningful comparisons, a review of major publications from the past decade was conducted to select applicable indicators (Table 1). This study identified quantifiable walking indicators used in relevant research and refined them through experimental innovation.
While street perception evaluation studies show similarities, notable disparities arise in the selection of human perception indicators and methodologies for defining and applying qualitative measures. Scholars have proposed qualitative definitions for five urban design qualities: imaginability, closure, human scale, transparency, and complexity [36]. Ma et al. (2021) developed a framework to objectively evaluate human perception using physical feature pixel indices [37], while Qiu et al. (2022) designed an objective framework based on six perceptual qualities: greenness, walkability, safety, imaginability, closure, and complexity [38]. Despite providing valuable frameworks, inconsistencies in core indicators, definitions, and quantification methods make comparisons difficult and hinder the construction of a unified assessment system.
To address these challenges, this study aims to integrate a more operational and comparable assessment framework. A synthesis of existing research will be conducted to assess urban street walkability. Walking accessibility scores within 5, 10, and 15 min thresholds were used as dependent variables, with community points of interest (POIs) serving as the unit of analysis to better capture population distribution patterns. The establishment of a 15 min CLC walking assessment system tailored for older adults has been achieved based on the optimized cumulative opportunity method. The following six indicators were selected for the evaluation of the independent variables: greenness, paving degree, traffic flow, closure, social interaction promotion, and visual complexity. The following text is intended to provide a comprehensive overview of the subject matter. The “Greenness” is selected for its positive impact on air quality, physical activity, and stress reduction, which has been linked to improved walkability among older adults [39]. “Paving degree” refers to the psychological impact of the walking surface, as accessible and well-maintained pavements can enhance perceived safety and comfort, thereby optimizing walking environments [17]. “Closure” refers to the extent to which the built environment creates a sense of space, affecting intimacy, livability, and safety [18,36]. “Safety perception” is critical for vulnerable groups, with pedestrian-friendly infrastructure enhancing perceived safety [40]. “Traffic flow” distinguishes vehicle types and their potential threat to pedestrians, assessed using the collision aggressiveness index (CAI) [41]. “Social interaction promotion” refers to facilities that encourage social engagement, such as benches. “Visual complexity” denotes the level of visual intricacy, which influences sensory perception [42]. Furthermore, an affirmative correlation has been demonstrated between ambient temperature and the number of steps taken by older adults [43]. The influence of the community social environment and heat exposure risk on health has also been demonstrated. Physical characteristics of residential areas, such as housing prices, building age, and internal greening rates, influence the availability of green spaces and, in turn, affect walkability. These factors, in turn, exert an indirect influence on walkability for the older adults [35].
The current study concentrates on identifying significant indicators that quantify the walkability of older adults. Several scholars have undertaken a combined analysis of socioeconomic and land use attributes with a view to investigating the accessibility of older adults. The extant literature predominantly concentrates on macro-level accessibility, with only a limited number of studies directing their attention to the environmental conditions of accessible streets at the urban level. The quantification of the environmental characteristics of streets at the street level within a 15 min city framework is of crucial importance for residents’ walking activities. The built environment exerts a significant influence on the physical activity and mental health of urban residents and older adults. To this gap, the present study employs visual perception, landscape perception, exposure-based heat risk, and community-level variables to quantify the street environment characteristics of Xiamen’s urban core and to explore the nonlinear relationship between multidimensional factors and walkability.

2.4. Selection of Facilities

To construct a comprehensive 15 min CLC indicator system, this paper reviews key planning guidelines and literature in China. The “Shanghai 15-min CLC Planning Guide” categorizes service facilities within the circle into six areas: culture, education, healthcare, older adults’ welfare, sports, and commerce. Given the aging population, older adult welfare facilities are a primary response to demographic shifts [44]. The 2021 Complete Community Construction Guidelines (GB50180-2018) emphasize the importance of providing services for the older adults and children, alongside essential services like older adults’ care, medical care, and convenient services such as commerce and public transport [11]. Thus, from a policy perspective, older adults’ care and medical facilities, in addition to commercial and recreational services, are considered essential within the 15 min CLC.
Table 1. Research factor breakdown table.
Indicator CategoryVariablesResearch Indicators
(Abbreviation)
WeightExplanation of Suitability Indicators for Older AdultsQuantitative Methods
dependent variable5 min CLC score
10 min CLC score
15 min CLC score
Dining service0.067Using community points of interest (POIs) as research units can accurately reflect the distribution of residents. Calculate the walkability score for the entire urban area of Xiamen and analyze the differences between different areas.Optimized cumulative opportunity method
Scenic spots0.127
Shopping services0.081
Transportation facilities0.087
Science and Culture services0.090
Sports and leisure services0.094
Pension and welfare facilities0.142
Healthcare services0.146
independent variableHuman perception variableOlder adults safety scores (OASS)0.2632Safety is a critical requirement for older adults participating in physical activities [43]. Safety perception scores for walking among older adults in urban streets.TrueSkill/CNN-BiLSTM
Landscape perception Paving degree (PD)0.0333Meeting older adults’ walking needs: ratio of pavement area to total road width.Fcn
Greenness0.0428The proportion of green space in images affects the walking and physical activity of older adults [39].Fcn
Closure0.0287Effectively mitigate traffic risks during the travel activities of older adults; the proportion of ornamental trees, buildings, streetlights, and other vertical elements in images influences their sense of safety and exploration space [18].Fcn
Traffic flow (TF)0.0483Proportion of motor vehicles in images, quantifying differences in the threat weight of different vehicle types to pedestrian safety for older adults [41].Fcn
Social interaction promotion (SIP)0.0191The density of seats on streets and its role in promoting social behavior among older adults [45].Arc GIS
Spatial vitality (SV)0.0383Population vitality indicators within the region are significantly influenced by the peer clustering effect.Python
Visual perceptionVisual complexity (VC)0.1579Image entropy values, older adults are easily affected by visual complexity [42].Matlab
Community-level variablesGreenery within the community
(GWTC)
0.0975The greening rate of residential areas attracts older adults to participate in walking activities [39].Arc GIS
Housing price (HP)0.0135The housing prices of residential buildings affect the accessibility of transportation for older adults [46].Arc GIS
Building age (BA)0.0469Building age has a statistically significant positive effect on walking ability in older adults [47].Arc GIS
ExposurePopulation density0.0185Spatial proximity of the older adult population to heat-related disaster neighborhood baseline conditions and population density to characterize exposureArcGIS
Paving degree0.0123
Neighborhood building height0.0308
Neighborhood building density0.0246
Greenness0.0308
Surface temperatureHeat risk (HR)0.0935Surface temperature, which reflects temperature differences within cities, is a key factor in studying regional and even global surface physical processes [48].ENVI 5.6

2.5. Data Collection and Processing

2.5.1. Baidu Street View Images (SVI)

Street view images is a method for obtaining data on the appearance of cities [49]. This method has been widely used to study the objective attributes of streets and subjective human perceptions [50]. Baidu Maps https://map.baidu.com/ (accessed on 11 January 2025) is the largest online map provider in China. Baidu Maps provides panoramic images similar to Google Street View (GSV) [51]. To explore the relationship between visual perception and physical characteristics of streets, this study used OpenStreetMap (OSM) https://www.openstreetmap.org/#map=6/46.45/2.21 (accessed on 3 January 2025) to obtain the road network data of the study area. The road network data were used to create road maps, which were then transferred into ArcGIS10.2 to simplify the network into single-lane streets. We used ArcGIS to set street view sampling points at 50 m intervals. The total number of sampling points established within the study area was 14,870. The panoramic photograph of each sampling point was divided into four images; the angular resolutions of 0, 90, 180, and 270 are 2560 × 1440 pixels, and the bit depth is 24. Due to the absence of street view images at certain sampling points, a total of 44,002 street view images were ultimately obtained.

2.5.2. High-Resolution Networks for Semantic Segmentation (FCN)

To explore the potential impact of urban streets on walking convenience for older adults, this study employed the FCN model for image semantic segmentation and extracted 151 landscape indicators (Formula (1)). This approach is particularly suitable for complex street scenes [52].
L P = P l a n d s c a p e   p e r c e p t i o n P T o t a l × 100 %
The term LP denotes the perceptibility of the landscape in the panoramic image, whilst Plandscape_perception signifies the total number of pixels identified as landscape during the semantic segmentation process. Finally, PTotal represents the total number of pixels within a specific region of the image. The extraction of six landscape indicators was conducted in accordance with Formula (1). These metrics provide a foundation for quantifying the relationship between street physical characteristics and human perception. A subset of images was utilized for the training of the convolutional neural network–bidirectional long short-term memory (CNN-BiLSTM) model, which, in conjunction with the TrueSkill algorithm, facilitates the generation of safety perception scores for older adults. This approach enables the analysis of the impact of subjective perceptions on walkability.

2.5.3. Image Calculation Method Based on Matching Mechanism (TrueSkill) and Convolutional Neural Network–Bidirectional Long Short-Term Memory (CNN-BiLSTM) Prediction

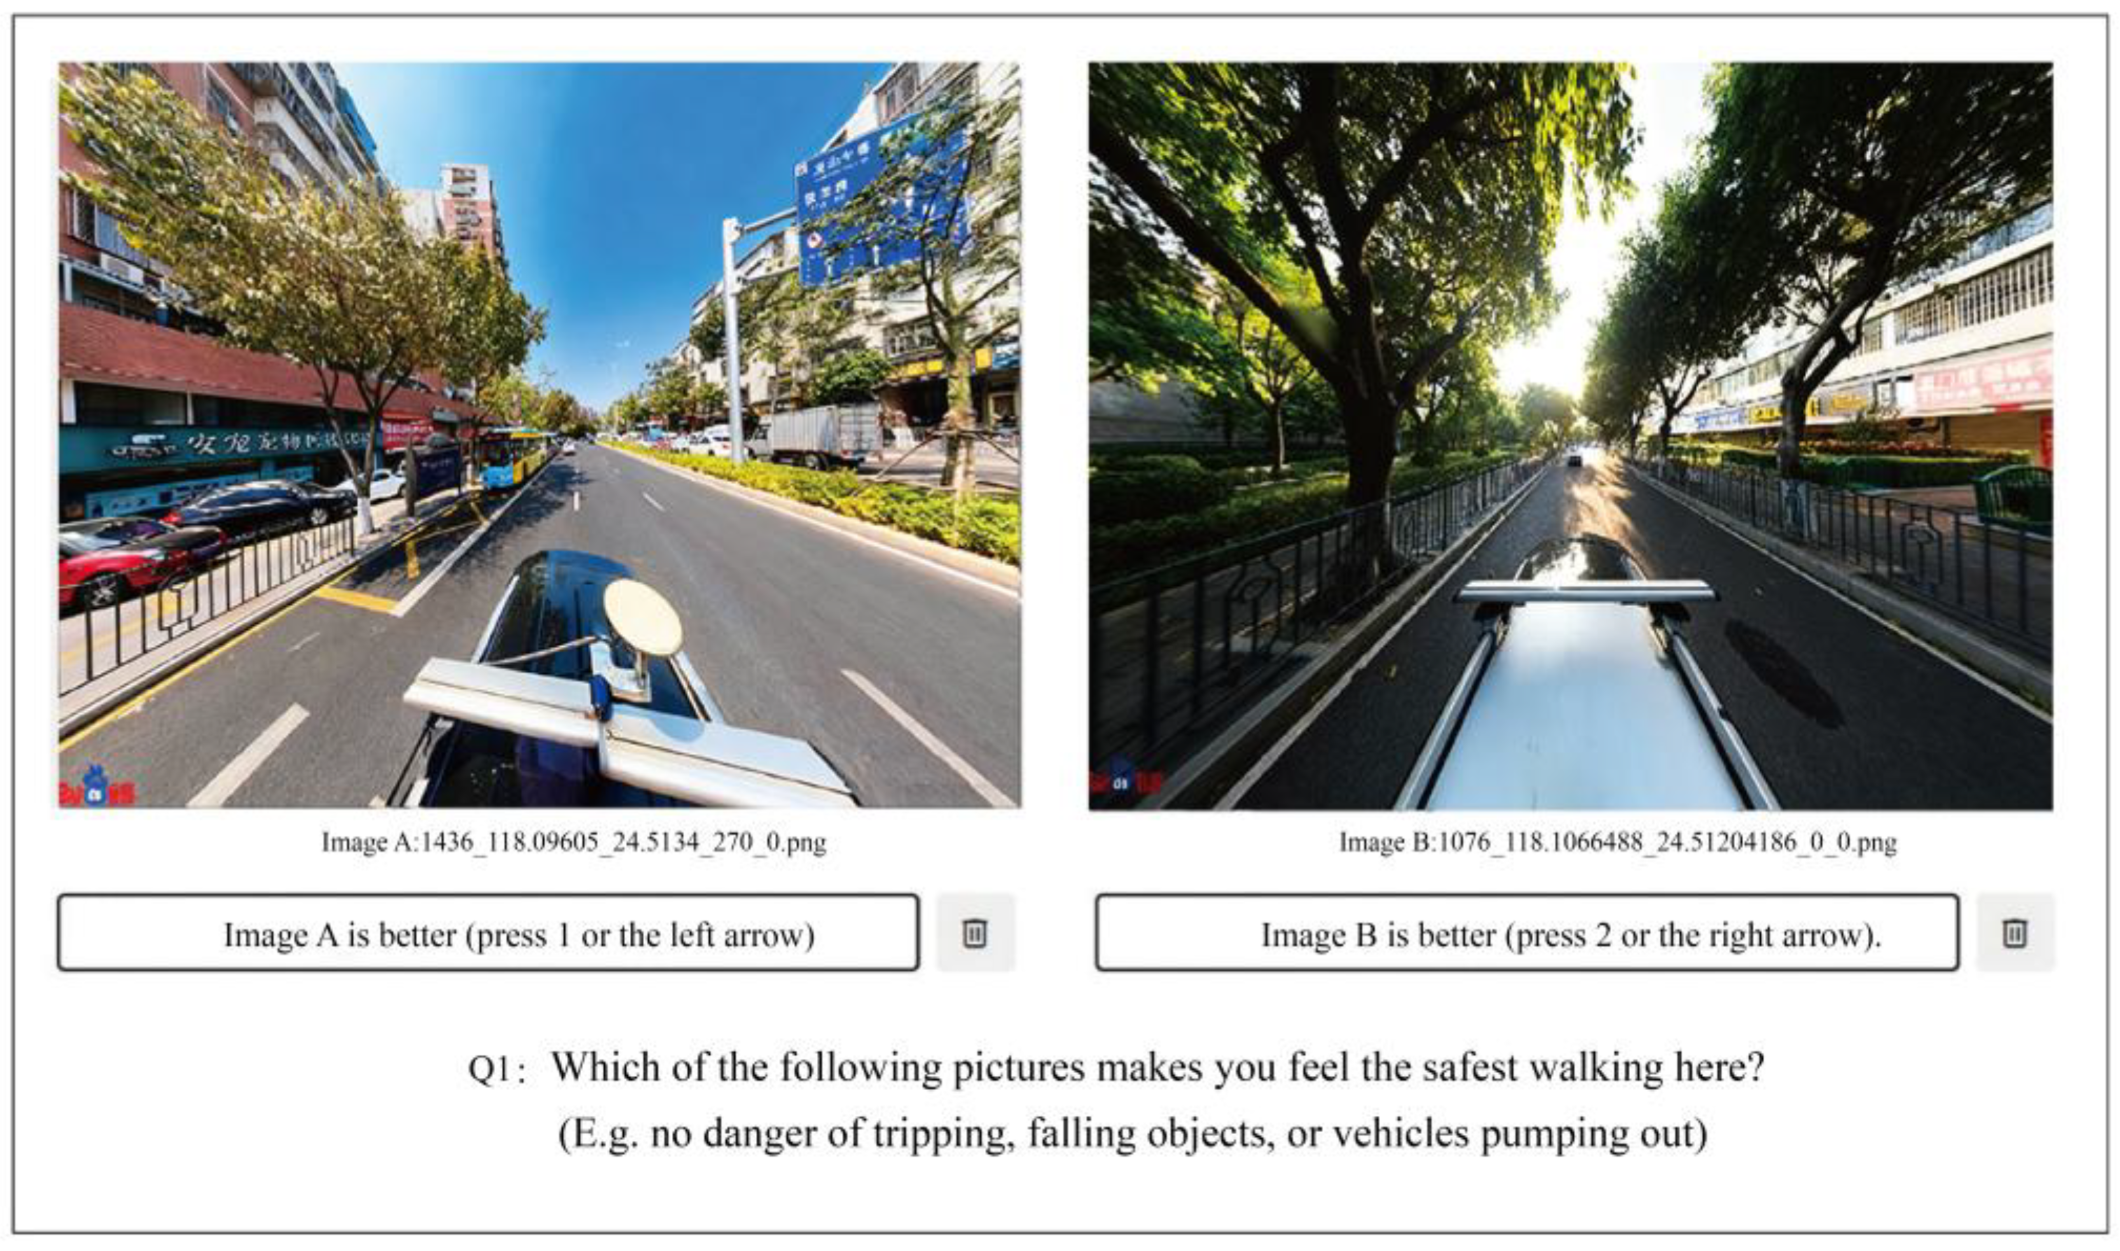
To construct a training dataset characterized by relative stability and standardization, this study employs the TrueSkill algorithm to label the training samples. TrueSkill is a Bayesian scoring system that generates overall ranking scores based on the cumulative results of pairwise matches. The system is designed to recalculate the scores of each player after each match, thereby generating a dynamic ranking of the winners and losers [53]. The present study employs the logical design of the TrueSkill algorithm to rank and score street view image pairs. It integrates the optimized evaluation module into a tablet terminal, forming a low-threshold evaluation system for older adult users. Firstly, separate competition modules are constructed for the purpose of assessing older adults’ pedestrian safety perception. The results of each round of competition are used to calculate corresponding ranking scores, which are then averaged to obtain older adults’ safety scores. In this study, 2769 community-built environment landscape image (SVI) questionnaire data were collected at random (approximately 20%, Figure 3). Participants were tasked with selecting the image that most closely corresponded to the description provided on the designated platform, as outlined in the questionnaire (Figure 3). The training and prediction of the remaining city street images were achieved through the utilization of a CNN-BiLSTM model, with 80% of the data allocated for training and 20% designated for evaluation. A random sample of community SVI questionnaire data informed this approach. The effectiveness of the model was evaluated using the mean absolute error (MAE) and the coefficient of determination (R2). The R2 value was found to be 0.867 and the MAE was 0.864. The model effectively combines the advantages of convolutional neural networks (CNN) in capturing local features and spatial structures in images, and we successfully obtained pedestrian older adults’ safety scores in the main urban area of Xiamen.

2.5.4. Matlab Visual Complexity Calculation

Visual complexity is a critical visual feature. As demonstrated in Kaplan’s 1989 research [54], expansive and intricate environments promote prolonged exploratory behavior, thereby mitigating cognitive fatigue. In fields including landscape ecology, landscape aesthetics, and human visual perception, visual complexity is often utilized as a measure of an image’s total intricacy. The Matlab software employs a sequence of procedures to compute visual entropy, encompassing image grayscale enhancement, region segmentation, and area computation. Formula (2) for visual entropy calculation is as follows (Formula (2)):
H x = i = 1 n P ( a i ) log P ( a i )
The symbol i denotes the partitioned region and P(a) denotes the probability of region a appearing (i = 1, 2, …, n). Furthermore, H(x) signifies the total amount of information generated by a complete visual object composed of n regions. This study uses Matlab software to calculate visual complexity by quantifying the organizational complexity of visual elements within street scenes in order to derive visual complexity metrics. This indicator is closely associated with the walkability experienced by older adults and provides quantitative evidence for investigating the bidirectional influence of spatial perception on the emotional state of older adults.

2.5.5. Calculation of Network Distance and Walking Time

We used ArcGIS network buffers to define 5 min CLC, 10 min CLC, and 15 min CLC walking districts, excluding areas not accessible on foot. Older adults typically walk more slowly than younger adults. This results in a marked reduction in accessibility for older adults when traversing equivalent distances. The approximate walking ranges can be represented by 5 min (≈225 m), 10 min (≈450 m), and 15 min (≈675 m) thresholds [55]. However, instead of applying circular buffers with fixed radii, this study delineates network-based service areas (isochrones) at these time thresholds to more realistically capture the actual accessible areas and evaluate the walkability score for the older adults. Utilization of street-based network buffers as spatial units for the measurement of the built environment has been demonstrated to accurately reflect the geographical context within which people undertake their daily activities [34]. To minimize discrepancies between measured and actual environments for older adults, this method is more accurate than circular buffer zones with a fixed radius relative to other spatial units.

2.5.6. Calculation of Walkability Scores Based on Optimized Cumulative Opportunity Metrics

The enhanced cumulative accessibility approach was applied to estimate walkability scores for 5, 10, and 15 min catchment areas. Originating in the early to mid-20th century, this method has since undergone extensive refinement, critique, and extension by numerous scholars [56]. A plethora of accessibility assessment tools have been developed to address a range of issues and assumptions. However, owing to its straightforward design, the cumulative opportunity measure remains widely used [57]. It is based on the total number of reachable destinations, with a static decay function applied to weight facilities by their distance. Decay functions are frequently employed in studies of accessibility and walkability, assuming forms such as negative exponential, normalized exponential, or Richards functions [58]. Parameter values are generally derived from questionnaire-based surveys and mathematical modeling. Based on earlier research into walking behaviors [59], this research applies a piecewise static decay function f(t) defined as 0 < t ≤ 5, f(t) = 1; for 5 < t ≤ 10, f(t) = 0.6; for 10 < t ≤ 15, f(t) = 0.25. Here, t represents the time required to walk from a residential area to a convenience facility. This formulation reflects the decline patterns observed in older adults: negligible, moderate, and substantial reductions in accessibility within 0–5 min, from 5 to 10 min, and from 10 to 15 min, respectively. The walkability score was subsequently calculated using this optimized cumulative opportunity function.
S k = N i × f ( t )
S j = k = 1 n W k × S k
S = j = 1 m S j × W j × S j S j m i n S j m a x S j m i n × 100
In Formula (3), S k is the score for type k amenity (second-level indicator). N i is the number of type k amenities belonging to a specific walking time threshold. f ( t ) is the decay function of walking time. In Formula (4), S j is the score for category j service (first-level indicator). W k is the local weight of type k amenity. In Formula (5), S is the walkability score of a specific community. W j is the weight of category j service (first-level indicator). S j m i n is the minimum value of score for category j service among all the communities. S j m a x is the maximum value of score for category j service among all the communities.

2.5.7. XGBoost–GeoSHapley Additive Interpretable Model

Extreme Gradient Boosting (XGBoost) is a tree-based ensemble algorithm that iteratively minimizes training error using a gradient-boosting framework, achieving high computational efficiency and predictive accuracy [60]. SHAP, derived from Shapley value theory, decomposes model predictions into feature contributions for both local and global interpretability [61].
Traditional Shapley value methods face limitations in representing variables with inherent spatial properties, as they consider coordinates (X, Y) independently rather than as a unified spatial feature. To address this issue, Li et al. proposed GeoSHapley [62], which consolidates coordinates into a single geospatial variable and measures its interactions with other predictors. This approach enables a more accurate assessment of spatial influences in model predictions and is implemented in the Python 3.8 GeoSHapleylibrary Equation (6).
ϕ i = S F { i } | S | ! ( | F | | S | 1 ) ! | F | ! [ f ( S { i } ) f ( S ) ]
In the formula, ϕ i is the GeoSHapley value of feature i; S is a feature subset excluding i; F is the full feature set; | S | is the size of the subset; | F | is the size of the feature set; f ( S ) is the model prediction using only the subset; and f ( S { i } ) is the prediction with feature with i included.
Based on the aforementioned algorithmic principles, the present study employs the XGBoost regression algorithm to construct a prediction model, utilizing cross-validation to optimize hyperparameters. The squared error objective function is adopted as the optimization goal, with root mean square error (RMSE), mean absolute error (MAE), and the coefficient of determination (R2) serving as metrics for evaluating model performance. The results show that R2 ranges from 0.806 to 0.906, MAE from 0.856 to 0.910, and RMSE from 0.97 to 1.14, indicating robust model performance. Regarding tree structure parameters, the maximum depth of a single tree is set to 26 layers, the minimum sample weight required to generate child nodes (min_child_weight) is constrained as 18, and the minimum loss reduction required for node splitting is set to 0.1. During the training phase, a learning rate of 0.1 is used to regulate the gradient descent step size. Additionally, a random sampling method is implemented, utilizing 85% of training samples and 90% of feature columns for each tree construction, which enhances the model’s generalization capacity and mitigates overfitting.
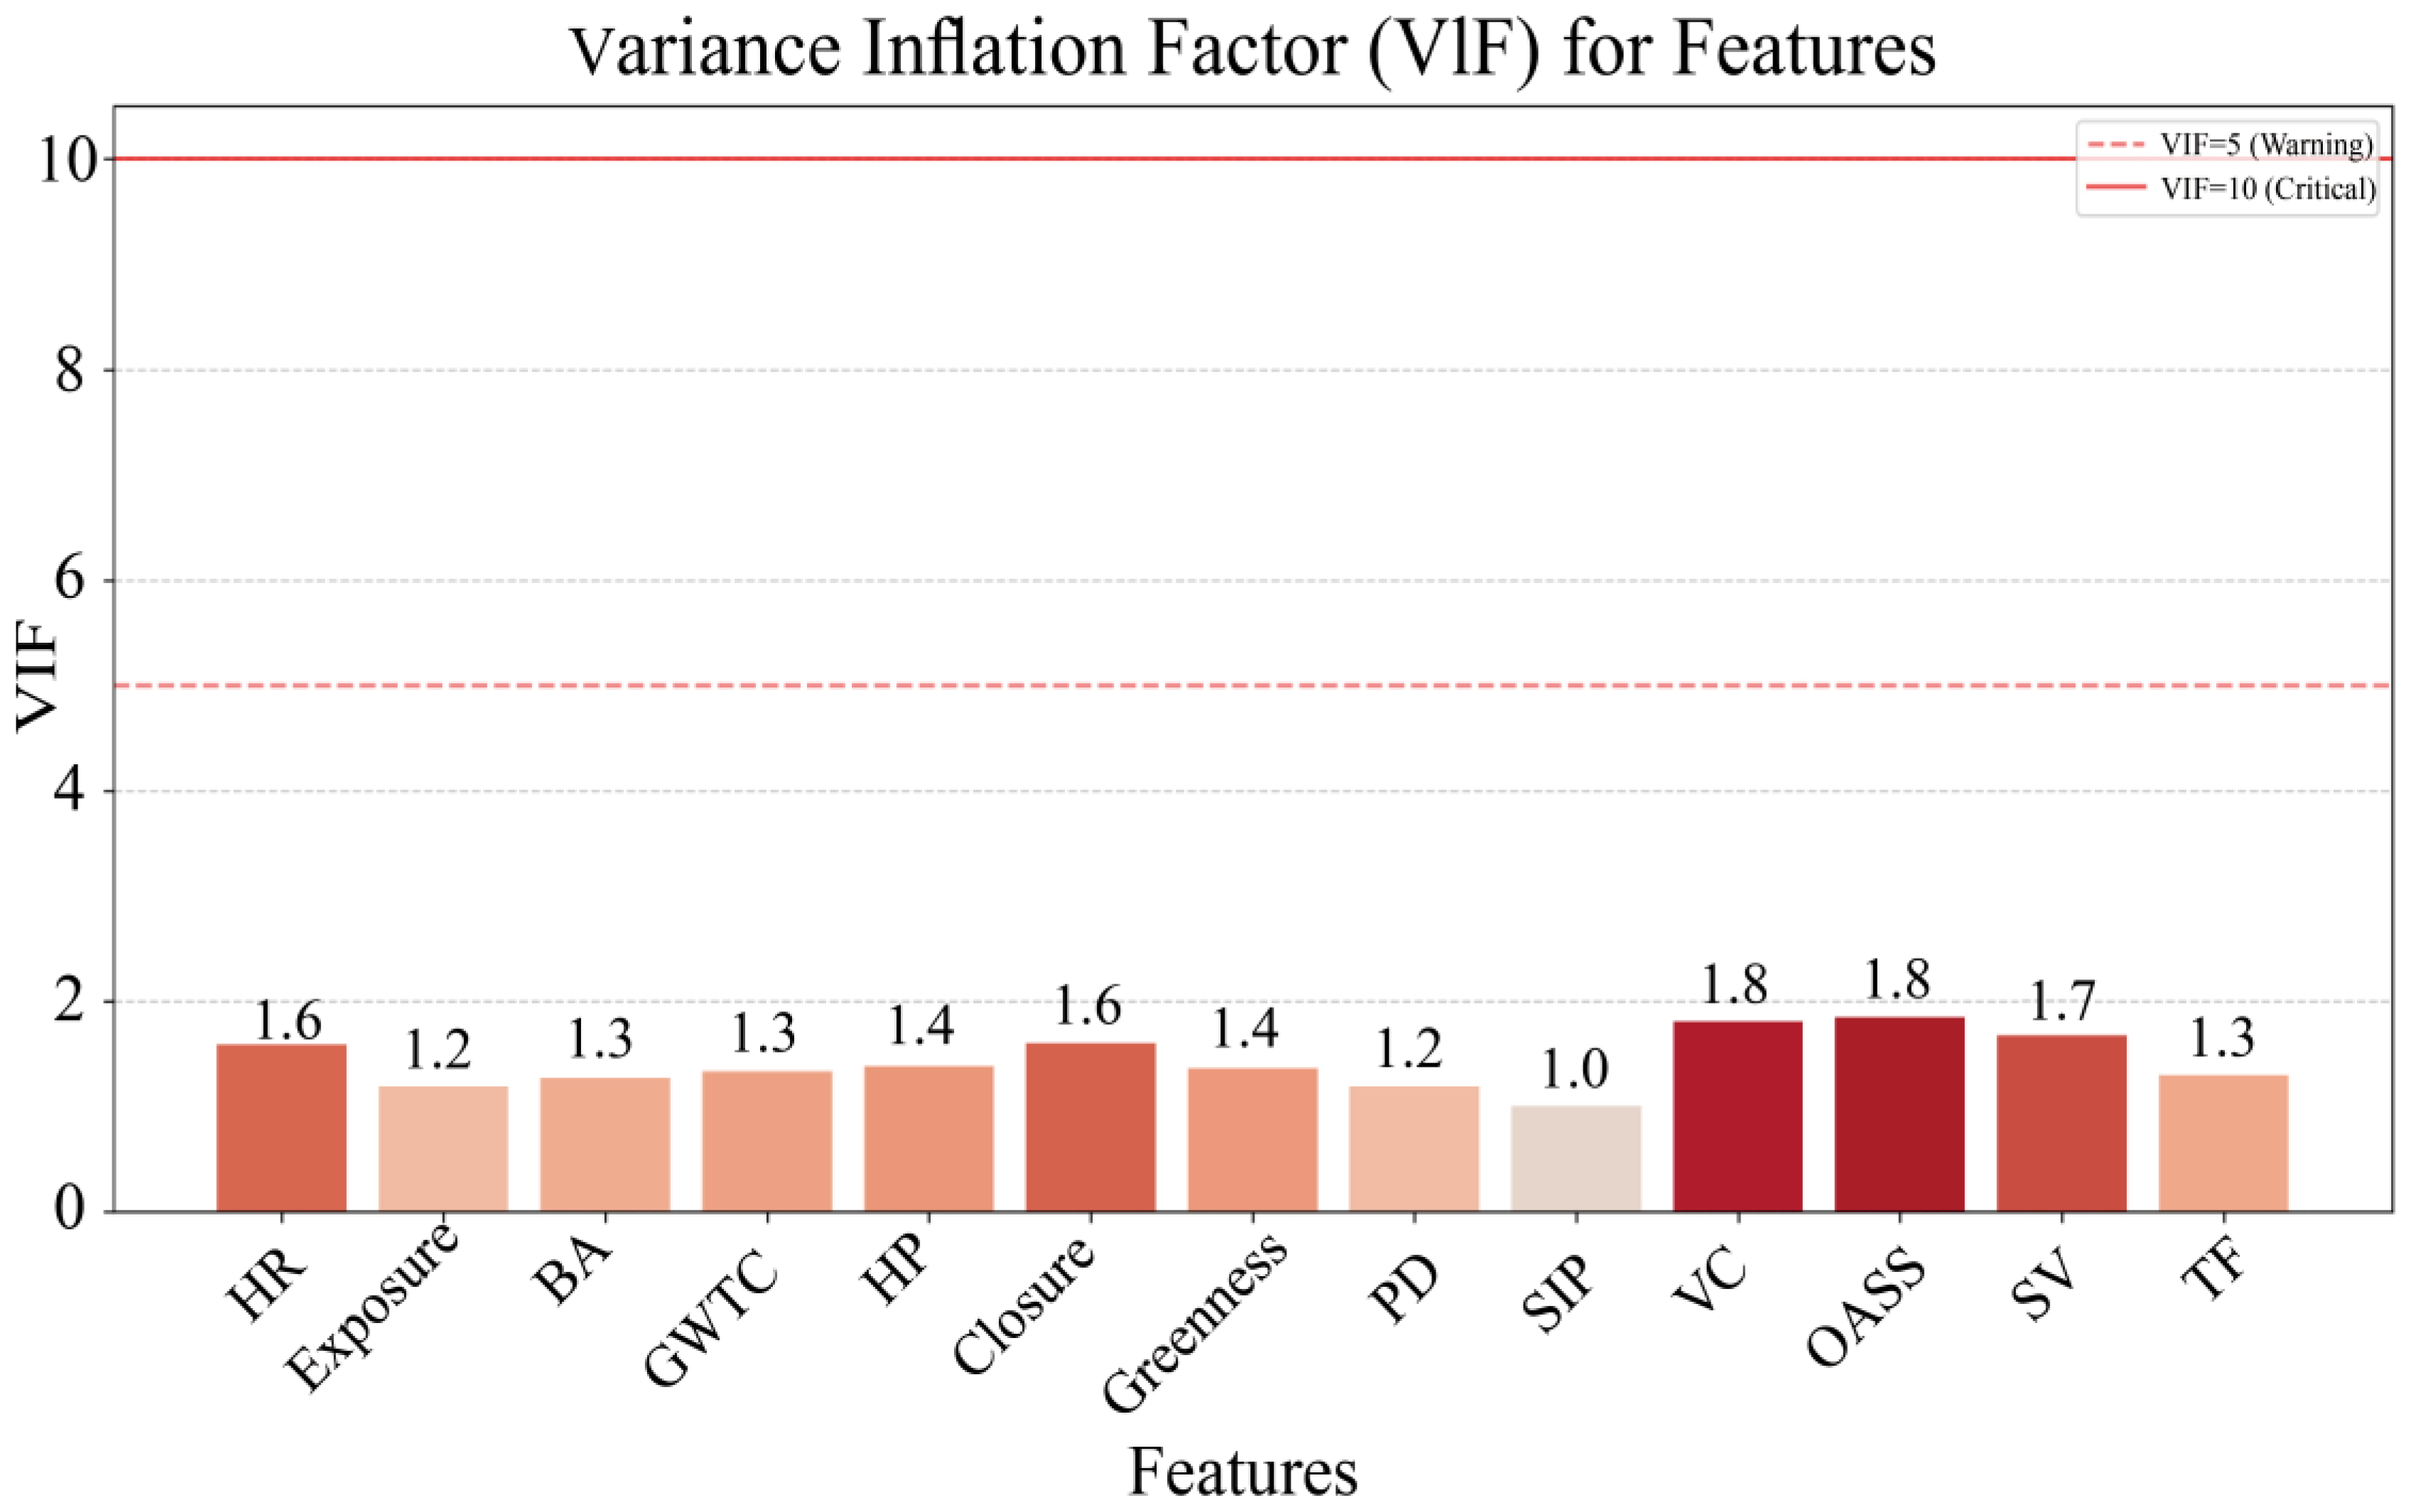
The robust model developed through this training process is employed to examine the correlation between walkability ratings and community-level characteristics, perceptions of safety, heat risk, and street-level environmental elements. Prior to model construction, it is essential to evaluate multicollinearity among independent variables, as significant multicollinearity can distort results. By convention, a variance inflation factor (VIF) exceeding 5 for an individual predictor indicates considerable multicollinearity, warranting potential removal of that predictor. As demonstrated in Figure 4, the VIF values of all independent variables in this study are less than 5, thus ruling out the influence of multicollinearity.

3. Results

3.1. Accessibility Analysis of Services for the Older Adults

In the community, 80.43% of older adults can access seven or more services within a 15 min walk, of whom 71.52% can access all eight services (Figure 5). Communities with high walkability exhibit prominent spatial clustering characteristics. The high walkability of the city center is indicative of its compact land use and historically formed central location, forming a spatial pattern of dense central core and dispersed periphery. However, as walking time decreased, walkability declined significantly, with only 38.28% of services accessible within a 10 min radius and 27.63% within a 5 min radius. However, significant challenges remain in peripheral communities. Within the 15, 10, and 5 min CLC, 6.22%, 12.95%, and 34.7% of older adults, respectively, can only access four or fewer services, reflecting inadequate facility coverage in peripheral communities due to uneven resource allocation. Furthermore, it was found that certain communities, farther from high-walkability centers, showed declining access to services; the types of services available within the 5, 10, and 15 min CLC consistently decrease as the allowed walking time window shrinks. This decline is likely due to insufficient investment by local authorities, failing to match the development pace of suburban areas. Consequently, older adults living in these neighborhoods depend on transit alternatives to walking to fulfill their needs. The data reveals that coverage rates for dining, shopping, and transportation exceed 90%, while medical coverage within a 15 min radius is commendably high at 96.80% (Figure 6). However, the key issue lies in the severe shortage of community-based older adult welfare facilities, with only 16.26% of communities able to access services within 15 min, thus rendering this the weakest link in the system. Furthermore, the coverage rate of medical services within a 10 min radius decreased by 10% (to 85.42%). This is further compounded by the fact that older adults use 10 min radius services more frequently. This highlights an urgent need to expand medical and elder-care facilities in peripheral communities. In light of the demographic shift towards an aging population, the provision of community-level facilities for older adults has emerged as a pivotal concern in residential area planning.

3.2. Spatial Pattern of Walkability Scores in Different Time-Based Living Circles

We calculated the walkability scores for the 5, 10, and 15 min CLC of each community and used inverse distance weighting for spatial visualization (Figure 7). The results indicate that there is considerable spatial differentiation across all three scales of living circles. The core area (surrounding Yundang Lake and Lianhua North Road) demonstrates significantly higher scores, while the peripheral areas and certain communities continue to exhibit lower scores, with spatial inequality intensifying as the scope of the living circle expands. This pattern is consistent with the aforementioned service distribution. It is noteworthy that several communities within the 15 min CLC achieved high scores (7.98% of communities attained a score of over 50 points), with 54.46% of communities scoring below 20 points. This finding underscores a pronounced imbalance in the allocation of facilities. The mean walkability scores and ranges both increased with walking time, further indicating that the spatial inequality in the 15 min and 10 min CLC was significantly higher than that in the 5 min CLC.

3.3. Spatial Co-Relation Characteristics Between Older Adults’ Walking Activity and Population Density

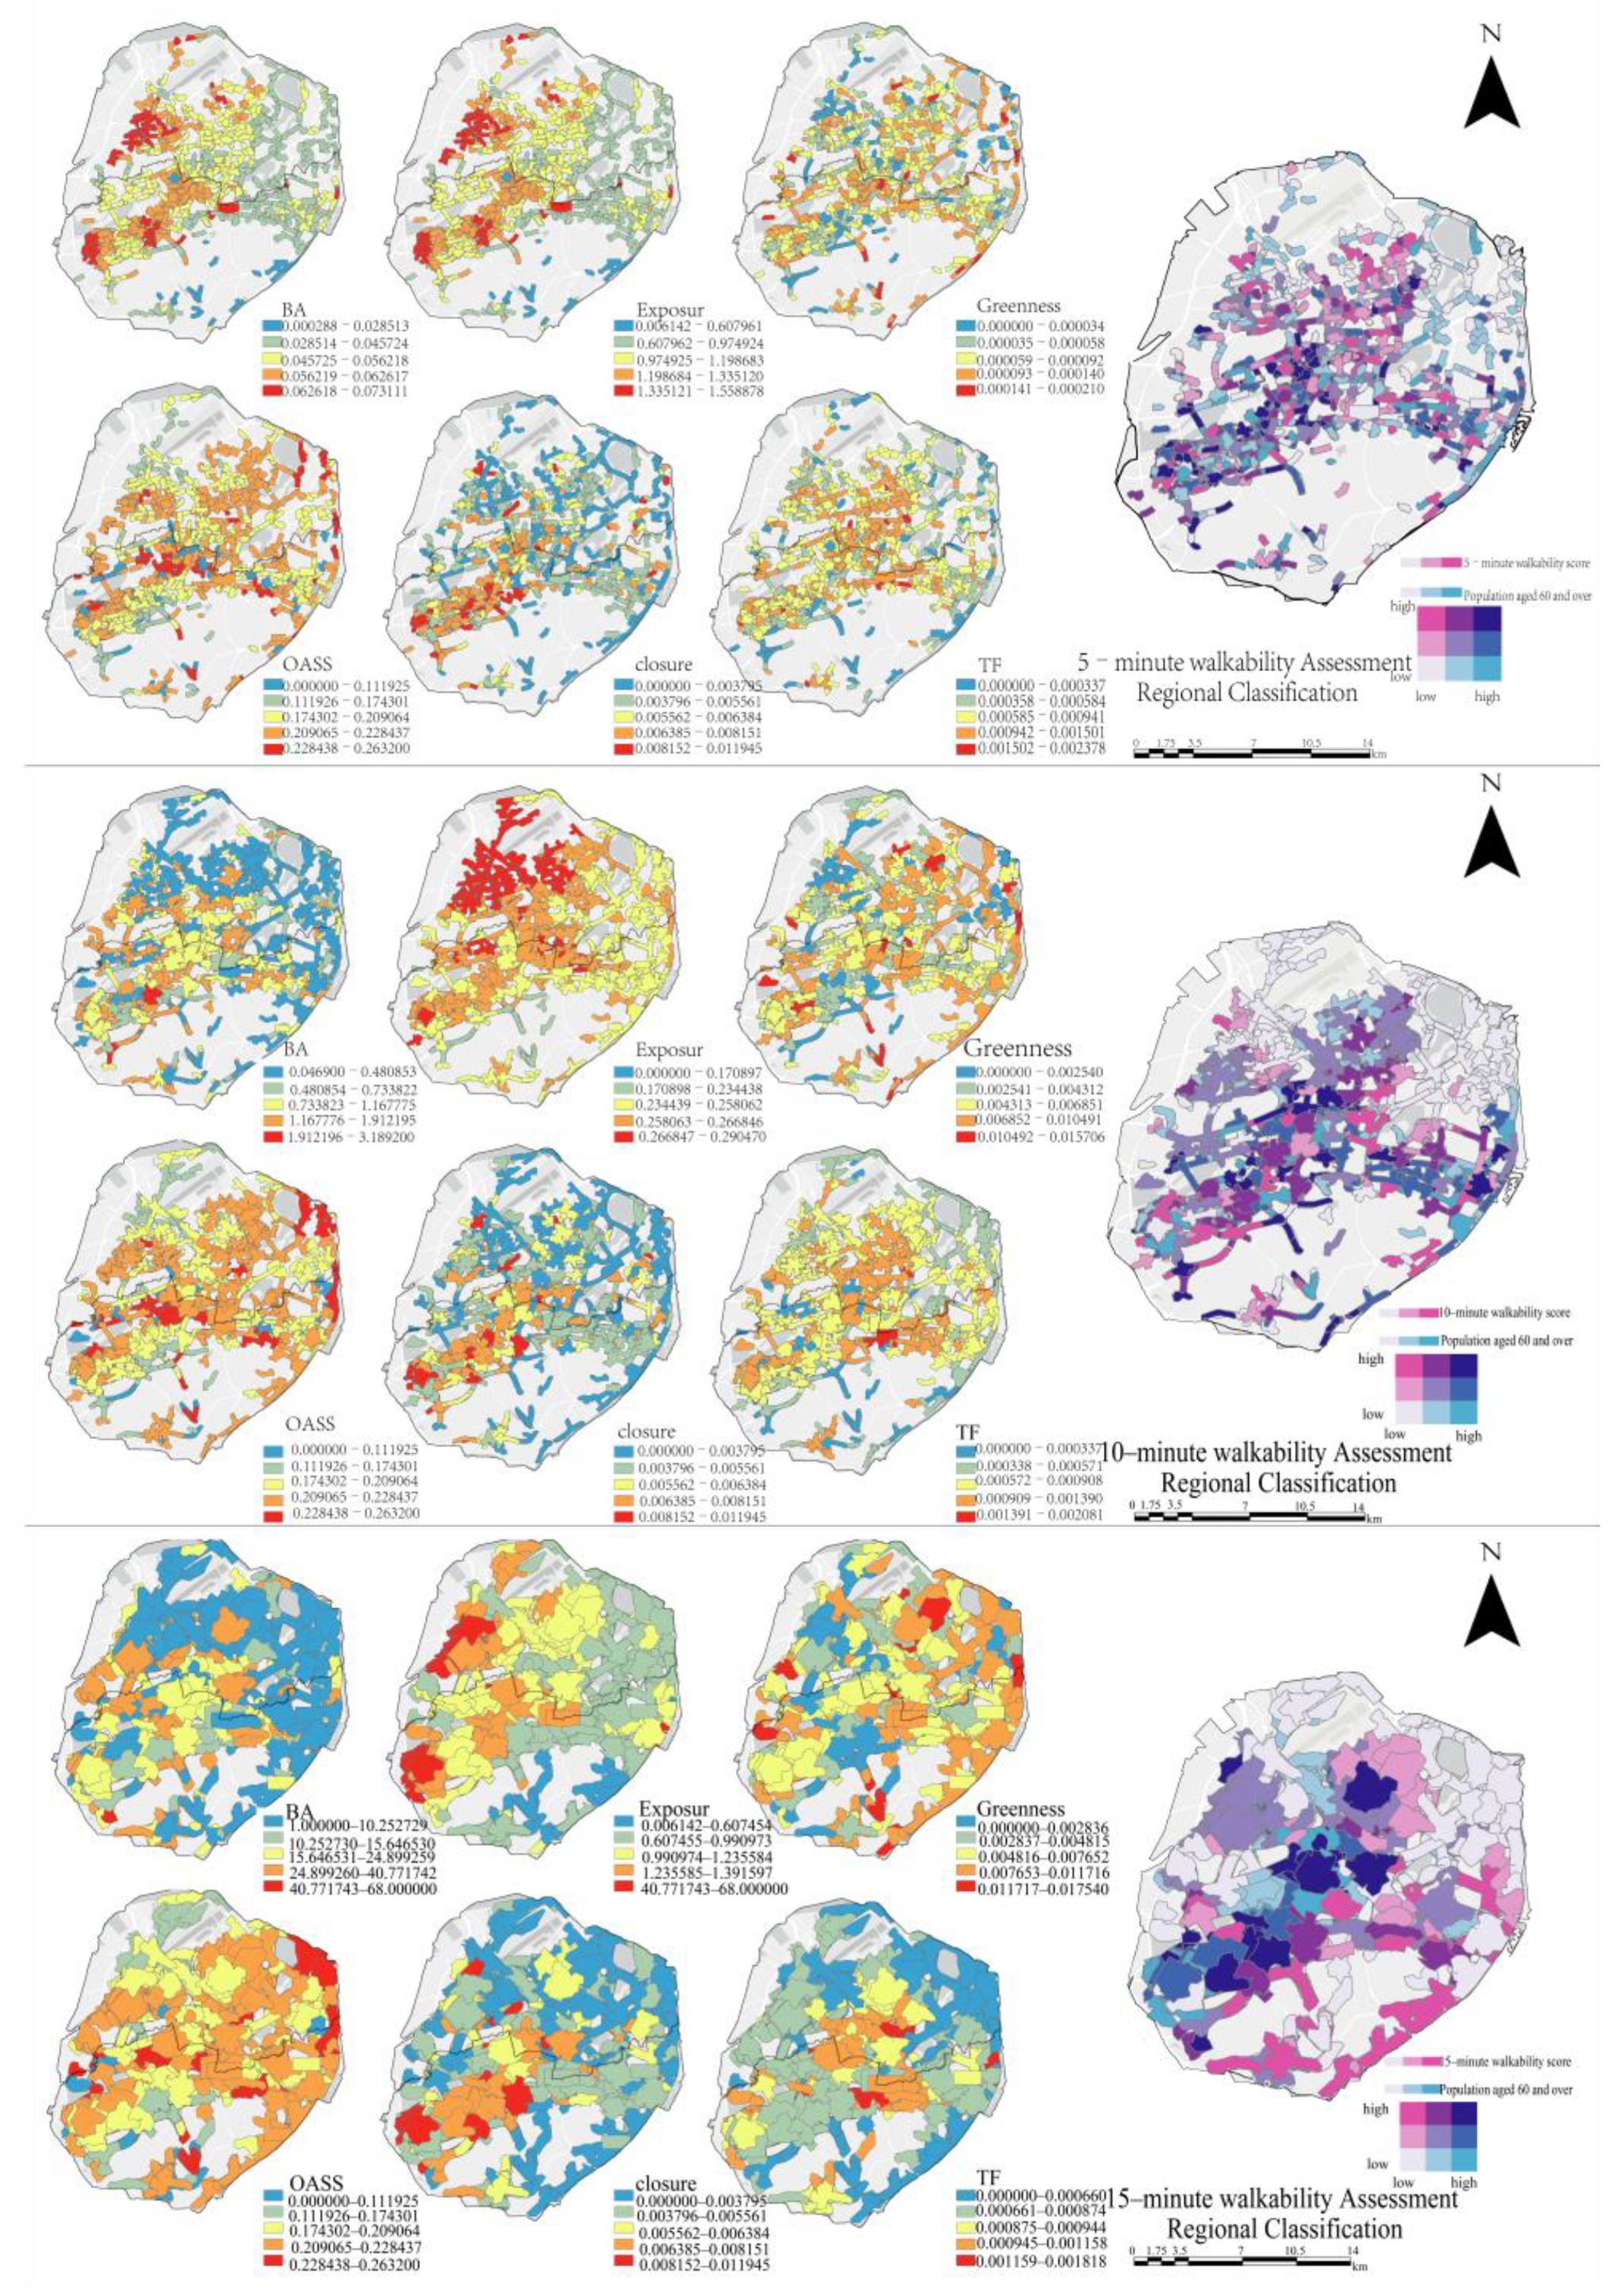
Bivariate spatial analysis of elderly population density and walkability was conducted, with selected variable distribution maps (Figure 8). Demand is stronger in high older adults clusters, requiring higher walkability, whereas low-density areas call for scaled provision. The central streets of Siming District demonstrate a high degree of spatial alignment between the 5 min and 10 min CLC, effectively accommodating concentrated demand. In contrast, the eastern area exhibits a significant supply–demand mismatch due to low spatial closure in newly built residential zones, which limits older adults’ mobility, and low traffic volumes that reduce walkability despite high population density. Meanwhile, the northern area, characterized by high openness and mid-life building stock, often shows a mismatch between high accessibility and low population density, resulting in underutilization of facilities.
Within the 15 min CLC, central streets again perform well, with high walkability and dense populations, whereas central-western districts show negative mismatches; high population density and aging buildings suppress walkability and widen disparities. Southeastern areas also show negative mismatches, where high accessibility but low population density limit utilization despite newer infrastructure. These patterns reflect Xiamen’s urban trajectory, strong demand differentiation in core areas, more balanced peripheries, and functional specialization in designated districts. Closing gaps in northeastern 5 and 10 min CLC and in positively mismatched southeastern 15 min zones can raise resource efficiency, enable demand-oriented planning, and scale central-district successes, reinforcing a positive feedback loop among spatial environments, older adults’ walkability, and population needs.
The next section applies the GeoSHapley contribution model with XGBoost to identify key drivers.

3.4. Plots for Spatial Effects, Nonlinear Effects, and Interaction Effects for the XGBoost Model

3.4.1. Research Method and Core Feature Identification

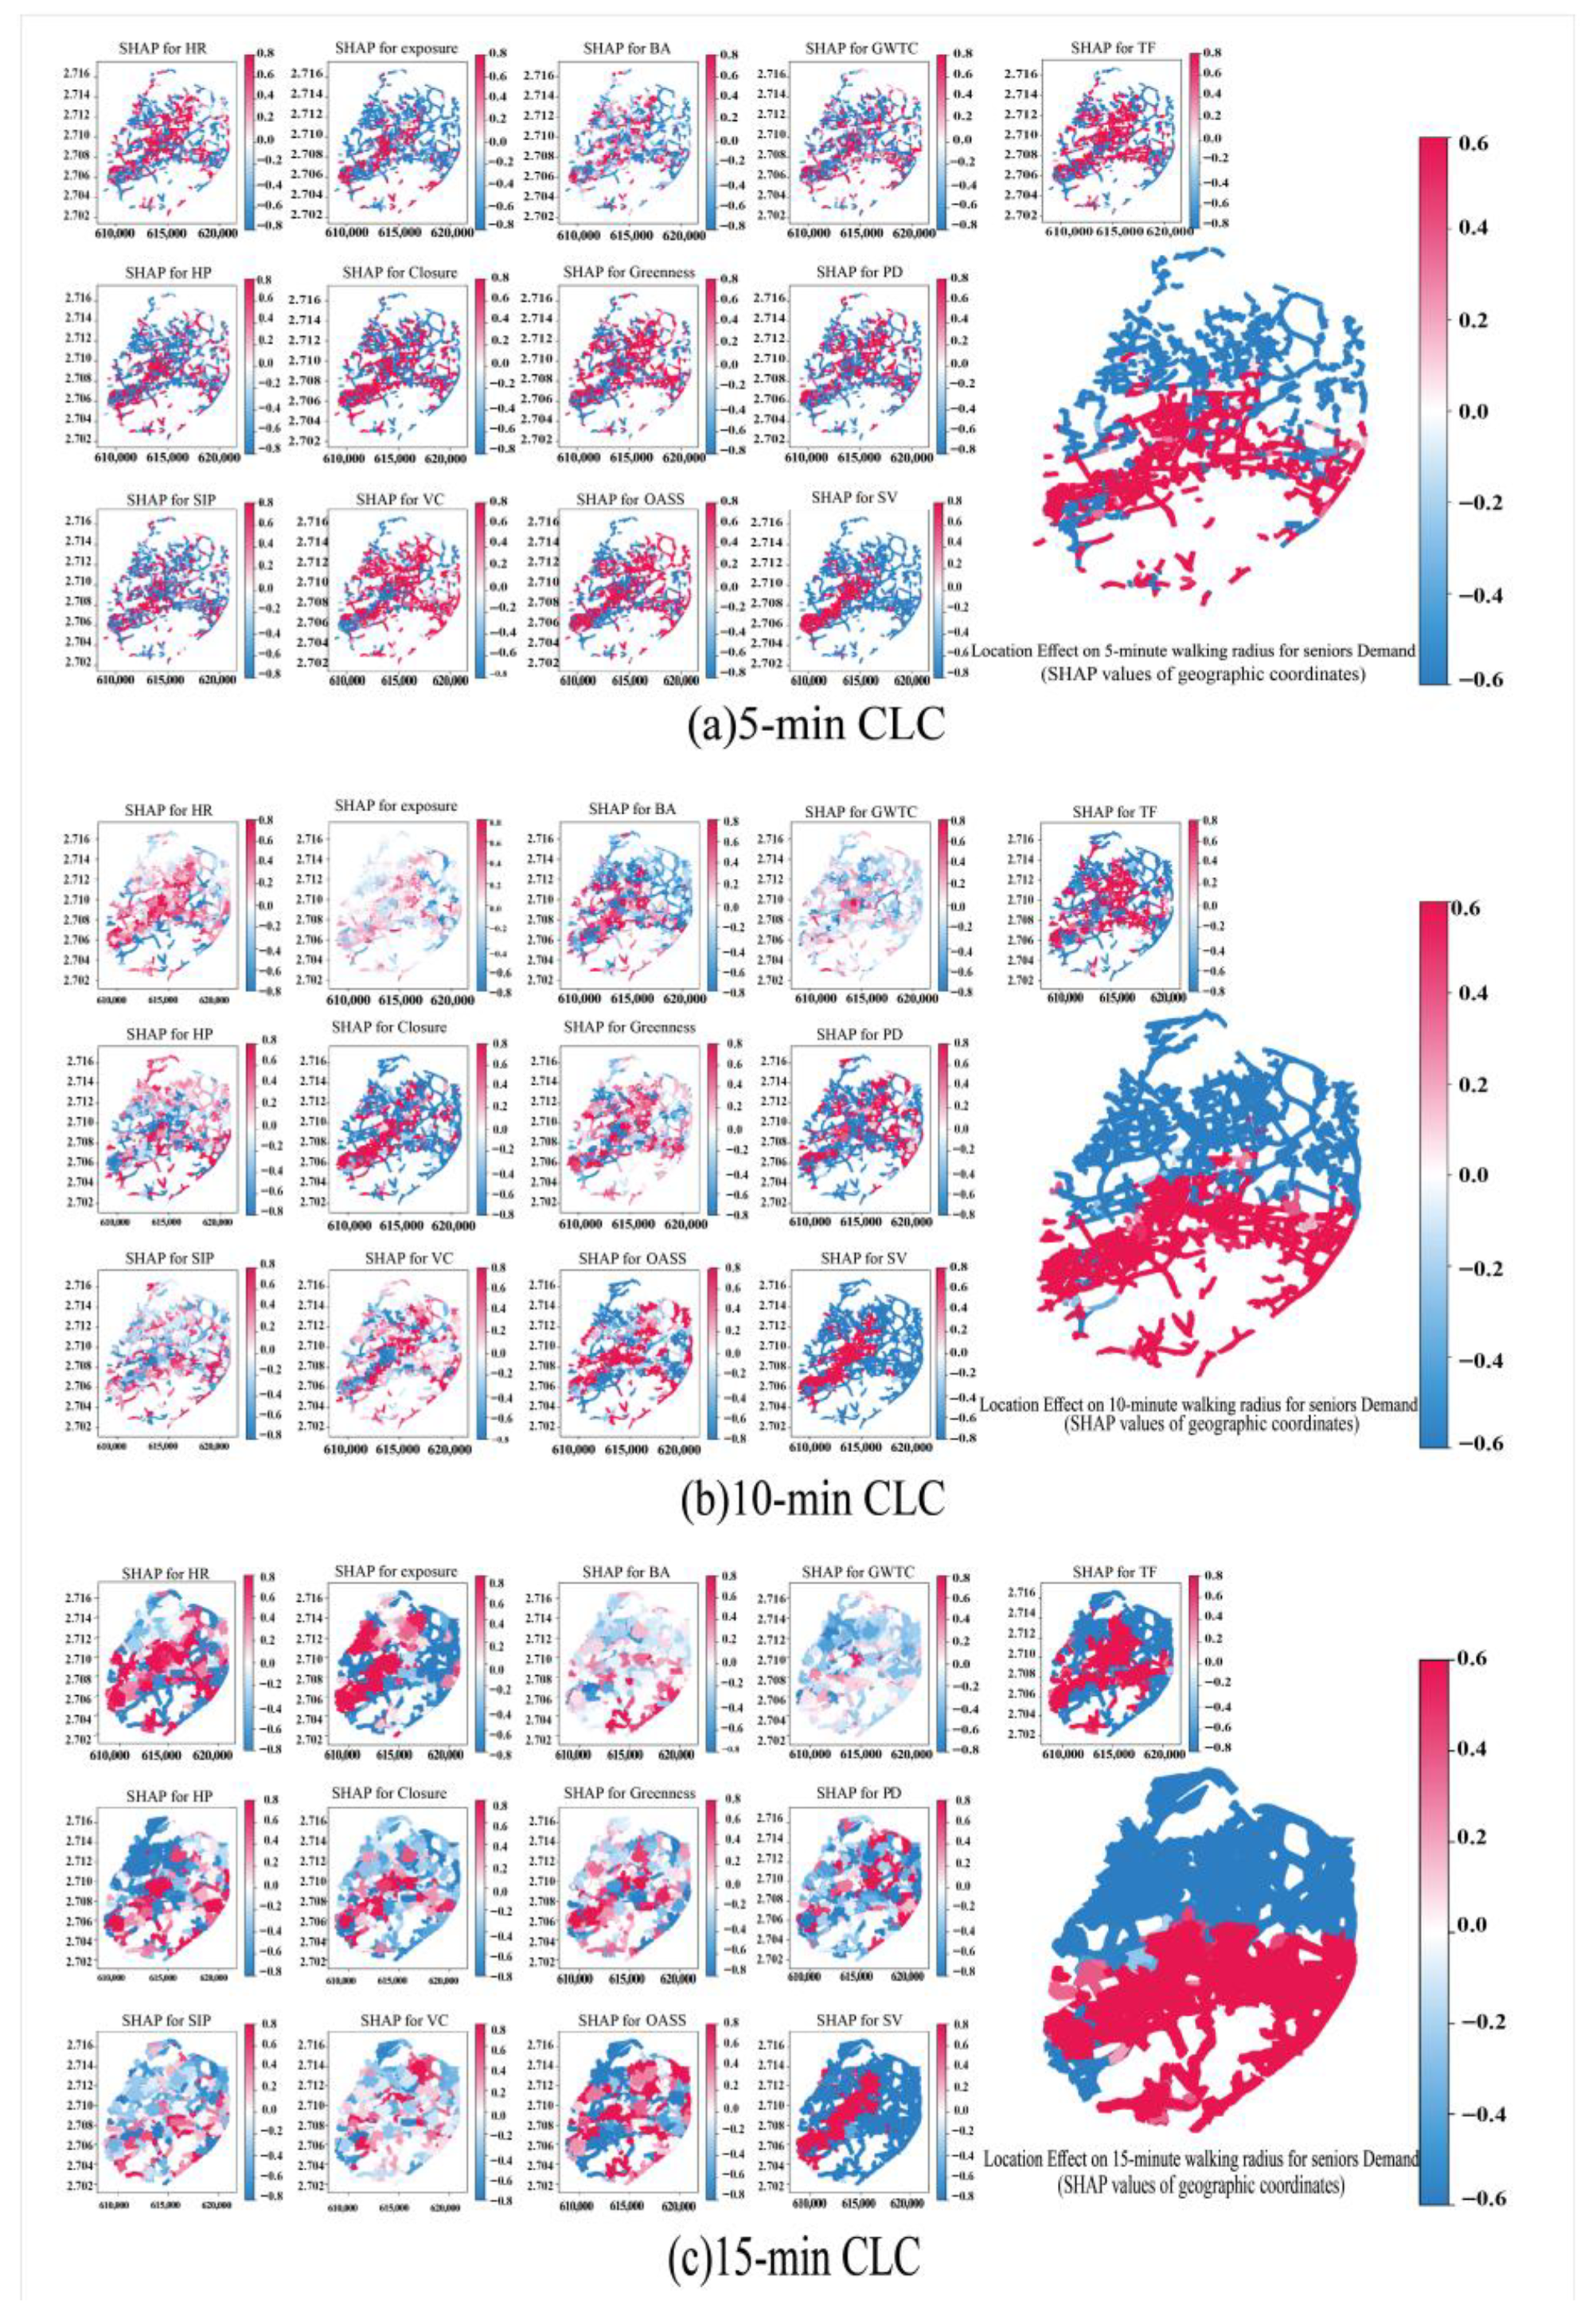
This study adopts the GeoSHapley contribution model based on XGBoost to systematically examine the effects of community environmental variables on older adults’ walking behavior. Figure 9 (feature importance), Figure 10 (cluster distribution), and Figure 11 (spatial contribution distribution) provide analytical support. The blue bar chart reflects average feature contributions, while the SHAP bee swarm plot further reveals how feature values influence model outputs. Results confirm that spatial vitality is the key determinant of walkability across multiple CLC scales (5, 10, and 15 min). Marginal effects indicate that enhancing street vitality significantly promotes walking. Furthermore, integrating community centroid coordinates (X, Y) into a GeoSHAP joint spatial feature enables quantification of spatial effects and variable interactions across different temporal scales.

3.4.2. Effects at the 5 min Walking Scale

At the 5 min CLC, effects exhibit strong scale specificity. Street closure and perceived safety emerge as the primary determinants of walking scores, while traffic volume exerts only a minor influence. This suggests that, within very short walking distances, comfort is shaped mainly by micro-scale street quality rather than large-scale connectivity. A synergistic effect between spatial vitality and perceived safety enhances walkability, underscoring the combined role of vitality and security. Spatially, the Y-coordinate (GeoSHapley contribution 5.7437) is more influential than the X-coordinate (2.0299), indicating a north–south differentiation in walkability, consistent with the contrast between the dense southern urban core and the mixed-use northern zones of Xiamen Island.

3.4.3. Effects at the 10 min Walking Scale

At the 10 min CLC, traffic volume shows a stronger association with walking scores and interacts significantly with spatial vitality. High-traffic areas are typically linked to stronger economic activity and social surveillance, where moderate traffic may enhance safety and thus encourage walking participation. Walkability is further shaped by infrastructure quality and regional economic vitality. The interaction between the Y-coordinate and spatial vitality reinforces the “higher south, lower north” pattern in walking scores, highlighting the regulatory role of spatial structure.

3.4.4. Effects at the 15 min Walking Scale

At the 15 min CLC, several new patterns emerge. First, exposure-related factors exert stronger negative effects on walkability, attributable to Xiamen’s subtropical climate (annual mean ~22 °C), where prolonged walking without shade increases perceived temperatures by 3–5 °C, exceeding older adults’ tolerance thresholds and discouraging long-distance walking [63]. Second, a negative interaction between spatial vitality and greenness is observed; in high-vitality areas, greater greenness correlates with lower walking scores. Third, while traffic volume remains influential, the X-coordinate continues to show low importance, likely due to the relatively flat east–west topography, thereby reinforcing the dominance of north–south spatial differentiation.

3.5. Nonlinear Marginal Effects

It is evident that previous studies have neglected to adequately consider the potential nonlinear marginal effects of divergent grading standards for each variable. This has resulted in a paucity of understanding regarding the complex spatial dynamics of walkability scores among older adults [48]. The findings of this study indicate that the contributions of independent variables manifest as nonlinear marginal effects (Figure 12).
As the threshold living circle is exceeded by 5, 10, and 15 min, the Shapley values for traffic flow, spatial vitality, pavement coverage, older adults’ safety scores, and social interaction promotion all exhibit a marginal increasing effect. In comparison to traffic flow, traffic congestion in densely populated areas also renders walking a more convenient mode of transportation [64]. However, in high-density areas, slight negative effects may occur. This phenomenon may be explained by the increased risk of injury in overcrowded environments, particularly among older adults, who often experience diminished physical capabilities. The correlation between older adults’ safety scores and their geographical context is indicative of a positive correlation in both central urban areas and their surrounding areas. This suggests that streets with high levels of construction and heavy traffic flow in central urban areas tend to have higher walkability scores, thereby providing people with a better sense of safety. Visual complexity, heat risk, and greenness negatively affect older adults’ walkability. High visual complexity increases cognitive demands, potentially deterring older adults from walking, while elevated surface temperatures reduce walkability, with the impact becoming significant enough to act as a hindrance. Excessive greenness, especially with dense vegetation, can obstruct visibility and create insecurity, weakening street vitality. The contribution of walking scores to street environment variables varies with time. In a 5 min radius, the effect of exposure risk initially increases but then decreases, reflecting older adults’ behavior of seeking shaded, well-ventilated areas during heatwaves. Xiamen’s low-latitude region, with intense sunlight, enhances vegetation growth, improving heat exchange between green spaces and the environment [65]. Green spaces with cooling functions facilitate walking during hot periods [66]. However, at 10 and 15 min radii, excessive exposure and high temperatures discourage older adults from walking. The positive effect of environmental closure is evident within 5 to 10 min but, after 15 min, an overly closed environment becomes unwelcoming, hindering social interaction. Research suggests that transportation networks’ effectiveness in reducing travel time is linked to their openness [67]. A large, closed environment can obstruct sightlines and reduce community engagement, reducing its appeal to older adults.
This building age has an impact on walkability and its relationship with various community factors. When the age of the building is within a 5 min radius, the SHAP value is close to zero, indicating that building age has a neutral impact on walking scores for older adults, neither promoting nor hindering walkability. However, in the 10 min radius, a marginal increase in effects is observed. For the 15 min range, older buildings are likely associated with aging infrastructure and a lack of accessible facilities. Newly developed areas often prioritize internal development over high-density, mixed-use connections with surrounding areas, resulting in fewer accessible daily services, which reduces walking efficiency and attractiveness. Therefore, the impact of a building’s age is not determined solely by its physical age but by several factors, including spatial organization, facility availability, and the level of age-friendly infrastructure. Additionally, how well these factors align with the walking needs at different time scales is crucial.
In the 5 min radius, no significant impact on walkability from greenery within the community is observed. By contrast, in the 10 and 15 min ranges, the GeoSHapley contribution values show a diminishing effect, suggesting that areas with higher green space ratios tend to have fewer available facilities. The presence of new communities in these greener areas contributes to the decline in walkability. Housing prices, on the other hand, have a neutral impact within a 5 min range, yet this effect weakens in the 10 and 15 min ranges. Walkable communities typically offer shorter walking distances, easy access to amenities, and higher property values. Nevertheless, excessively high housing prices can be a barrier for older adults with limited financial resources [68]. High house prices may lead to the development of high-end, specialized commercial spaces, which reduce the density of affordable, essential services for older adults and limit green space. Taken together, these factors present significant challenges to walkability in areas with larger walking distances, weakening the positive impact of walkability for older adults.

4. Discussion

4.1. New Insights into the Key Factors Affecting Walkability Among Older Adults in Xiamen City

This study employed the optimized cumulative opportunity method and the XGBoost–GeoSHapley model to evaluate walkability for older adults in Xiamen at 5, 10, and 15 min scales, analyze factors influencing walkability scores, assess the diversity and balance of older-adult-related facilities in central districts, and measure the overall accessibility of community facilities. This rating reflects the potential for walking based on facility accessibility, and the study will further explore how street-level built environment characteristics influence older adults’ walking experience. Further, a bivariate spatial analysis of population density and older adults’ walkability reveals significant disparities in service provision, showing that residents in more developed areas enjoy broader facility access, highlighting the cumulative effects of urban development.
This study employs the XGBoost–GeoSHapley interpretable additive model to provide insights into the optimization of 15 min CLC. The results indicate a positive association between spatial vitality and walkability. As shown in Figure 10, areas of high vitality are concentrated in the urban core and closely aligned with high population density [69], enabling diversified service provision and improving walkability to better meet the daily needs of older adults. Within a 10 min walking radius, the proportion of old buildings is also positively correlated with walkability, suggesting that residents in historic districts enjoy more convenient service access. However, these areas often lack sufficient green space and are subject to higher environmental exposure risks, resulting in poorer walking environments. By contrast, newly built communities (0–5 years) provide significantly fewer facilities (2.3 on average) than older communities (5.7), while high-greenscape communities are predominantly new developments (64.06%). Mature urban districts face tensions between high-density housing and green space supply, leading to a reduction in accessible services. Although green space contributes to mental health and physical activity, excessive expansion risks encroaching upon functional service spaces. Therefore, urban greening and service provision should be planned in coordination to effectively enhance the well-being of the older adults.

4.1.1. The Considerable Impact of Regional Development Imbalances

Siming District has the highest aging rate and the largest number of registered older adults in the city (177,300 people), accounting for 37.44% of the city’s total older adult population. Huli District follows, with nearly 80,000 permanent and 60,000 registered older adults and an aging rate of 13.2%. To address the needs of older adults, particularly in the outskirts, service facilities must be enhanced in Huli District. Although Huli District has a higher greenness (0.75) than Siming District (0.70), further improvement is needed. This study found that neighborhoods with higher safety scores are mostly in suburban, newly developed, or low-density areas, where safety measures like green spaces are easier to implement. However, these areas often lack adequate infrastructure and have dispersed commercial facilities, making car travel necessary. By contrast, city centers and dense older urban districts are more pedestrian-friendly but are perceived as less safe due to traffic congestion, with 54.46% of communities scoring below 20 on the 15 min walkability index. Research conducted on other urbanized areas has demonstrated that surrounding urban areas frequently exhibit deficiencies in access to healthcare, education, and transportation, resulting in a decline in quality of life [70]. This social inequality, especially for vulnerable groups such as the older adults, will further exacerbate their health risks, social isolation, and difficulties in life.
Despite renovations aimed at improving walkability in the Jinhu Community, it still has a low score. The “village-to-residential” conversion has led to a dispersed layout and inefficient facility distribution, increasing travel distance and complexity for older adults and limiting the effectiveness of renovations. The low closure ratio, low spatial vitality, and poor traffic flow and greening in community streets reduce walkability. Commercial activities remain imbalanced, with upscale areas focusing on dining and the nighttime economy, which do not meet the daily needs of older adults (Figure 7) [71].
It is noteworthy that the service balance is at its lowest in the Dongping Mountain Park and Botanical Garden area of Siming District, where the topography of two hills restricts the layout of facilities. Although sports activities are permitted on hillsides, most mountainous areas have been designated as urban nature reserves to maintain the stability of the ecosystem. Moreover, empirical evidence from other hilly cities has demonstrated that complex terrain factors can impede access to services for vulnerable groups, while eco-friendly development has the potential to transform disadvantages into advantages [72]. The incorporation of sports and recreational facilities, such as mountain trails, has been demonstrated to optimize the value of the terrain while concurrently safeguarding the ecological functions of the hills.

4.1.2. Differentiated Needs and Gaps Across Community Living Circle

Service gaps in the 5 min CLC. Over the past decade, the number and proportion of older adult residents in Xiamen have risen sharply. Yet, within the 5 min CLC, only 27.63% of older adult residents can access seven or more services, while 34.7% have access to no more than four. This highlights severe service undersupply, rooted in limited accessibility of essential facilities within a short walking distance. Urban planners therefore have a responsibility to prioritize the deployment of frequently used infrastructure when designing 5 min CLC.
Recreational and landscape accessibility in the 5 and10 min CLC. Although older adults frequently use both the 5 and 10 min CLC, they face insufficient access to recreational and landscape resources within a 10 min walking range. Sports and leisure facilities, as well as scenic areas, are vital not only for entertainment but also for maintaining mental health, fostering social integration, alleviating depression, and slowing cognitive decline, thereby enhancing overall well-being [73]. Providing accessible facilities such as pocket parks and community centers significantly promotes physical activity, social interaction, and quality of life [74]. Thus, ensuring convenient access to parks, public squares, and recreation centers is essential for active and healthy aging, while also addressing current service gaps.
Older adult care shortages in the 15 min CLC. Within the 15 min CLC, older adult care facilities remain critically insufficient, with only 16.26% of older residents able to access care services. The “aging in place” model, which provides necessary care within local communities, effectively reduces hospital burdens, supports older adults in familiar environments, and extends life expectancy [75]. Compared with institutional care, community-based care demonstrates higher cost-effectiveness and sustainability within long-term care systems [76]. Accordingly, embedding micro-scale, community-oriented care facilities into urban planning is crucial for building localized older adult care systems that improve quality of life, reduce medical costs, and promote healthy aging—especially in areas with high proportions of older adult residents.

4.2. Planning and Design Recommendations for Improving Older-Adult-Friendly Walking Environments

Xiamen is facing multiple challenges arising from rapid population aging. Over the past decade, both the number and proportion of older residents have increased significantly, intensifying the mismatch between basic public service provision and aging-related needs. Survey data show that, within a 5 min CLC, only 27.63% of older adults can access seven or more daily services, while as many as 34.7% can access four or fewer. This service gap highlights deficiencies in the existing spatial structure and resource allocation. Urban planners must therefore prioritize high-frequency infrastructure within short walking distances, with particular attention to micro-scale medical services, while ensuring comprehensive daily functions at the 10 min scale.
In terms of spatial layout, a decentralized supply model integrated with public transport should redistribute core urban functions toward suburban and newly developed areas, easing pressure on central districts. Legislative and fiscal incentives are needed to attract private investment into healthcare, retail, and age-friendly cultural and recreational facilities, thereby enhancing equity of access in underserved communities. The model thus emphasizes not only equal provision but also equitable adaptation, narrowing disparities in accessibility across regions and social groups.
Facility allocation in senior living circles was determined according to their demand and use frequency [77]. First, healthcare facilities, including hospitals, clinics, and pharmacies, remain critical for maintaining health and delaying decline [78]; daily living services, such as markets, supermarkets, grocery stores, and restaurants, form the backbone of routine support [79], recreational amenities, including green spaces, waterfronts, and outdoor activity areas, and support physical exercise, mental health, and social interaction [80]. Ensuring the availability of high-frequency services within a five min walking radius not only meets basic physiological needs but also aligns with older adults’ preference for low-intensity, short-distance mobility. In historic districts and aging communities, improving spatial quality is especially urgent. Micro-scale interventions such as pocket parks in alleyways and vertical or rooftop greening in dense markets can improve environmental quality without reducing facility density. Walking safety and comfort depend heavily on micro-level conditions such as pavement smoothness, boundary definition, lighting, and traffic order, all of which influence seniors’ willingness to walk.
To address urban heat island effects and extreme weather, 15 min scale planning should establish continuous shading systems, frequent rest points, and adaptive service hours to ensure safe mobility during heat events. Traffic calming, sightline optimization, improved lighting, and active street-front design can mitigate unsafe walking conditions.
At the community scale, day-care centers, nursing stations, and respite services should be embedded within a 5 and 10 min walking range and linked to parks, greenways, and fitness facilities, thus creating seamless home–community care networks. Such embedded care not only facilitates daily activity and social connection but also reduces risks of isolation. Moreover, in key corridors, real-time monitoring of heat, pedestrian flows, traffic speeds, and dwell times should inform dynamic responses such as temporary shading, adaptive traffic signals, and adjusted business hours.
In sum, by addressing structural supply and demand imbalances and shifting from equal provision to equitable adaptation, Xiamen can advance toward an inclusive, age-friendly walking city, responding directly to the needs of its older adult population while promoting urban sustainability and social equity.

4.3. Research Contributions

The exploration of diverse planning methodologies for CLC is increasingly important. Unlike previous 15 min city studies focused on the general population, this study proposes a novel, transferable framework for assessing older adults’ walkability by integrating an optimized cumulative opportunity method with the XGBoost–GeoSHapley model. Methodologically, the optimized accessibility model introduces a piecewise time-decay function tailored to older adults’ walking characteristics, offering a more realistic, weighted measure of service reachability. The XGBoost–GeoSHapley integration enhances interpretability by capturing joint spatial effects and nonlinear interactions, addressing the limitations of conventional SHAP in geographic modeling. Although focused on Xiamen, this approach, which combines multi-scale buffers, machine learning, and human perception data, is replicable in other aging, high-density cities. It provides actionable insights for spatial equity and age-friendly planning beyond the case study context.

4.4. Limitations of the Study

This study develops a framework that extracts streetscape features via semantic segmentation, evaluates multi-scale environmental impacts on older adults’ walkability using XGBoost, and interprets feature importance and spatial effects with GeoSHapley. However, it does not incorporate dynamic pedestrian data, such as real-time foot traffic [81] or individual walking trajectories [82], and therefore cannot capture the spatiotemporal dynamics of walking behavior. Future research could integrate actual walking trajectories of older adults with real-time pedestrian flow data to examine the dynamic response mechanisms between multi-scale environmental configurations and walking behavior, thereby enhancing the practical applicability of evaluation systems. In addition, this study employs the cumulative opportunity method, which is intuitive and effective for comparing street-level facility accessibility, but it also has limitations. Specifically, as noted by [83], this method does not account for potential competition among facilities or variations in their attractiveness, which may affect the accuracy of accessibility assessments. Furthermore, using community centers as reference points for service accessibility may introduce spatial aggregation errors. In particular, the heterogeneous internal structure of communities and the varying distances from residential areas to these centers are not considered, potentially leading to biased estimates of actual walking distances and times.

5. Conclusions

To develop a multi-scale community walkability assessment system tailored to China’s older adult population, this study uses the central urban area of Xiamen as a case study and establishes a comprehensive analytical framework that integrates multi-source data with interpretable machine learning models. Three network-based service areas, namely the 5 min (≈225 m), 10 min (≈450 m), and 15 min (≈675 m) walking isochrones, are adopted to reflect the practical travel needs of older adults in daily life.
(1)
A walkability scoring system was constructed by optimizing the cumulative-opportunity method, incorporating multiple dimensions such as facility accessibility, streetscape perception, heat exposure, community environment, and population distribution. Unlike traditional approaches, we introduce the XGBoost–GeoSHapley model to identify critical determinants, uncover spatial heterogeneity and interaction mechanisms, and enhance both interpretability and precision in urban governance.
(2)
The analysis reveals pronounced spatial disparities in walkability. Although overall facility coverage is relatively high within 15 min CLC, coverage of older adults’ care services is severely insufficient, with only 16.26% of communities having access to such facilities within this range. Moreover, 54.46% of communities scored below 20 points in the 15 min walkability index, indicating substantial room for improvement. This study further identifies a “green space–service mismatch,” whereby abundant green resources coexist with inadequate service provision, particularly in newly developed areas.
(3)
Spatial bivariate analysis highlights mismatches between population aging patterns and walkability. While central districts exhibit a “high population–high accessibility” alignment, peripheral and eastern zones face a “high demand–low supply” gap, and northern areas show evidence of underutilized facilities. These findings underscore the necessity of balancing population density with spatial accessibility, emphasizing demand-driven micro-scale urban renewal.
(4)
Nonlinear marginal and interaction effect analyses reveal that heat risk, visual complexity, and greenery within the community negatively affect walkability under certain conditions, whereas spatial vitality, closure, and perceived safety significantly improve short-distance walkability. Furthermore, walkability at the 5 min CLC is primarily influenced by micro-environmental factors, while the 15 min CLC is more strongly shaped by macro-level transport accessibility and environmental exposure.
This research provides both a scientific tool and theoretical foundation for urban planning and age-friendly community design. The proposed walkability scoring system can be widely applied to urban regeneration, optimization of community service facilities, redevelopment of aging neighborhoods, and the design of elder-friendly public spaces. Policymakers and public health practitioners may also employ this system to identify underserved areas, guide targeted resource allocation, and promote daily physical activity and overall well-being among older adults.

Author Contributions

Conceptualization: C.S. and Z.C.; methodology: C.S.; software: Y.C.; data curation: C.S. and Z.C.; writing—original draft preparation: C.S.; writing—review and editing: C.S., Z.C., Y.C. and S.C.; supervision: W.L. and Z.D.; funding acquisition: Z.D. All authors have read and agreed to the published version of the manuscript.

Funding

This study was funded by the Special Funding Project of the China Agriculture and Forestry University Design Art Alliance (Grant Numbers 111900050).

Institutional Review Board Statement

This study was conducted in accordance with the Declaration of Helsinki and approved by the Institutional Review Board of Fujian Agriculture and Forestry University (protocol code FAFUIRB-2025-02242 and date 23 January 2025 of approval).

Informed Consent Statement

Informed consent was obtained from all participants involved in the study.

Data Availability Statement

Data are contained within the article. The data presented in this study can be requested from the authors.

Acknowledgments

We sincerely appreciate the editor and all anonymous reviewers for their constructive comments, which greatly improved the quality of the manuscript. We also appreciate the organizations that provided valuable data for this study.

Conflicts of Interest

The authors declare no conflicts of interest.

References

  1. WHO. World Population Ageing, 2024, World Population Ageing 2017 Highlights|Population Division. (n.d.); 17 September 2024, from 2024; World Health Organization: Geneva, Switzerland, 2017. [Google Scholar]
  2. Chen, Y.; Zhang, J. A Study on the Influence of an Outdoor Built Environment on the Activity Behavior of the Elderly in Small Cities in Cold Regions—A Case Study of Bei’an City. Sustainability 2025, 17, 2260. [Google Scholar] [CrossRef]
  3. Li, J.; Zhu, L.; Yang, Y.; Li, Y.; Fu, P.; Yuan, H. Prevalence and potential influencing factors for social frailty among community-dwelling older adults: A systematic review and meta-analysis. BMC Geriatr. 2024, 24, 762. [Google Scholar] [CrossRef] [PubMed]
  4. Alodhialah, A.M.; Almutairi, A.A.; Almutairi, M. The Role of Physical Activity and Exercise in Enhancing Resilience and Delaying Frailty in Saudi Arabia. Healthcare 2025, 13, 1461. [Google Scholar] [CrossRef] [PubMed]
  5. Cheng, L.; Chen, X.; Yang, S.; Cao, Z.; De Vos, J.; Witlox, F. Active travel for active ageing in China: The role of built environment. J. Transp. Geogr. 2019, 76, 142–152. [Google Scholar] [CrossRef]
  6. Hosford, K.; Beairsto, J.; Winters, M. Is the 15-minute city within reach? Evaluating walking and cycling accessibility to grocery stores in Vancouver. Transp. Res. Interdiscip. Perspect. 2022, 14, 100602. [Google Scholar] [CrossRef]
  7. Richert, E.D.; Lapping, M.B. Ebenezer Howard and the garden city. J. Am. Plan. Assoc. 1998, 64, 125–127. [Google Scholar] [CrossRef]
  8. Perry, C. The Neighbourhood Unit; Reprinted Routledge/Thoemmes: London, UK, 1998. [Google Scholar]
  9. Cheng, L.; Caset, F.; De Vos, J.; Derudder, B.; Witlox, F. Investigating walking accessibility to recreational amenities for elderly people in Nanjing, China. Transp. Res. Part D Transp. Environ. 2019, 76, 85–99. [Google Scholar] [CrossRef]
  10. Asher, L.; Aresu, M.; Falaschetti, E.; Mindell, J. Most older pedestrians are unable to cross the road in time: A cross-sectional study. Age Ageing 2012, 41, 690–694. [Google Scholar] [CrossRef]
  11. GB 50180-2018; Standard for Urban Residential Area Planning and Design. Ministry of Construction of the People’s Republic of China: Beijing, China, 2018.
  12. Xiamen Civil Affairs Bureau. Special Planning for Elderly Care Facilities in Xiamen (2020–2035); 2020. Available online: https://mzj.xm.gov.cn/xxgk/zwgk/tzgg/202010/t20201013_2483618.htm (accessed on 2 January 2025).
  13. Dunning, R.J.; Dolega, L.; Nasuto, A.; Nurse, A.; Calafiore, A. Age and the 20-min city: Accounting for variation in mobility. Appl. Geogr. 2023, 156, 103005. [Google Scholar] [CrossRef]
  14. Willberg, E.; Fink, C.; Toivonen, T. The 15-minute city for all?—Measuring individual and temporal variations in walking accessibility. J. Transp. Geogr. 2023, 106, 103521. [Google Scholar] [CrossRef]
  15. Weng, M.; Ding, N.; Li, J.; Jin, X.; Xiao, H.; He, Z.; Su, S. The 15-minute walkable neighborhoods: Measurement, social inequalities and implications for building healthy communities in urban China. J. Transp. Health. 2019, 13, 259–273. [Google Scholar] [CrossRef]
  16. Song, L.; Kong, X.; Cheng, P. Supply-demand matching assessment of the public service facilities in 15-minute community life circle based on residents’ behaviors. Cities 2024, 144, 104637. [Google Scholar] [CrossRef]
  17. Zhou, H.; He, S.; Cai, Y.; Wang, M.; Su, S. Social inequalities in neighborhood visual walkability: Using street view imagery and deep learning technologies to facilitate healthy city planning. Sustain. Cities Soc. 2019, 50, 101605. [Google Scholar] [CrossRef]
  18. Yin, L.; Wang, Z. Measuring visual enclosure for street walkability: Using machine learning algorithms and Google Street View imagery. Appl. Geogr. 2016, 76, 147–153. [Google Scholar] [CrossRef]
  19. Di Marino, M.; Tomaz, E.; Henriques, C.; Chavoshi, S.H. The 15-minute city concept and new working spaces: A planning perspective from Oslo and Lisbon. Eur. Plan. Stud. 2023, 31, 598–620. [Google Scholar] [CrossRef]
  20. Zhao, G.; Cao, M.; De Vos, J. Exploring walking behaviour and perceived walkability of older adults in London. J. Transp. Health 2024, 37, 101832. [Google Scholar] [CrossRef]
  21. You, N. Exploring the relationship between preferred routes for walking exercise and green space layout in a dense urban area: A series of poisson regression models. J. Asian Archit. Build. Eng. 2024, 24, 4279–4294. [Google Scholar] [CrossRef]
  22. Li, Z. Extracting spatial effects from machine learning model using local interpretation method: An example of SHAP and XGBoost. Comput. Environ. Urban Syst. 2022, 96, 101845. [Google Scholar] [CrossRef]
  23. Chen, J.; Wang, K.; Du, P.; Zang, Y.; Zhang, P.; Xia, J.; Chen, C.; Yu, Z. Quantifying the main and interactive effects of the dominant factors on the diurnal cycles of land surface temperature in typical urban functional zones. Sustain. Cities Soc. 2024, 114, 105727. [Google Scholar] [CrossRef]
  24. Zhao, J.; Guo, F.; Zhang, H.; Dong, J. Mechanisms of non-stationary influence of urban form on the diurnal thermal environment based on machine learning and MGWR analysis. Sustain. Cities Soc. 2024, 101, 105194. [Google Scholar] [CrossRef]
  25. National Bureau of Statistics of China. Office of the Leading Group for the Seventh National Census of the State Council, the Seventh National Census Bulletin (No. 5)—Age Composition of the Population. 2021; pp. 10–11. Available online: https://www.stats.gov.cn/sj/tjgb/rkpcgb/qgrkpcgb/202302/t20230206_1902005.html (accessed on 2 January 2025).
  26. He, S.Y.; Cheung, Y.H.; Tao, S. Travel mobility and social participation among older people in a transit metropolis: A socio-spatial-temporal perspective. Transp. Res. Part A Policy Pract. 2018, 118, 608–626. [Google Scholar] [CrossRef]
  27. Liu, M.; Zheng, X.; Fan, J.; Wang, M. “Self-Driven Power” in the Sustainable Social Innovation Design of Ageing Districts—Based on an Investigation into the Southern Spring Town Historical District in Wuxi. J. Des. Serv. Soc. Innov. 2023, 1, 16–33. [Google Scholar] [CrossRef]
  28. Xiamen Bureau of Statistics. Yearbook of Xiamen Special Economic Zone 2023; China Statistics Press: Beijing, China, 2023. [Google Scholar]
  29. Zhu, D.; Song, D.; Zhu, B.; Zhao, J.; Li, Y.; Zhang, C.; Zhu, D.; Yu, C.; Han, T. Understanding complex interactions between neighborhood environment and personal perception in affecting walking behavior of older adults: A random forest approach combined with human-machine adversarial framework. Cities 2024, 146, 104737. [Google Scholar] [CrossRef]
  30. Duan, M.; Xu, L.; Chen, Y.; Zhao, Q.; Zhang, Y.; Cui, X.; Tian, S. Optimizing Urban Environments for Sustainable Development: Strategies and Practices to Enhance Mobility Among Older Adults. Sustainability 2025, 17, 3531. [Google Scholar] [CrossRef]
  31. Zhao, S.; Da, L.; Tang, Z.; Fang, H.; Song, K.; Fang, J. Ecological consequences of rapid urban expansion: Shanghai, China. Front. Ecol. Environ. 2006, 4, 341–346. [Google Scholar] [CrossRef]
  32. Zhang, P.; Zhou, J.; Zhang, T. Quantifying and visualizing jobs-housing balance with big data: A case study of Shanghai. Cities 2017, 66, 10–22. [Google Scholar] [CrossRef]
  33. Ju, Y.; Liang, Y.; Kong, J.; Wang, X.; Wen, S.; Shang, H.; Wang, X. 100-m resolution Age-Stratified Population Estimation from the 2020 China Census by Township (ASPECT). Sci. Data 2025, 12, 1058. [Google Scholar] [CrossRef]
  34. Alves, F.; Cruz, S.; Ribeiro, A.; Bastos Silva, A.; Martins, J.; Cunha, I. Walkability index for elderly health: A proposal. Sustainability 2020, 12, 7360. [Google Scholar] [CrossRef]
  35. Jiang, Z.; Wu, C.; Chung, H. The 15-minute community life circle for older people: Walkability measurement based on service accessibility and street-level built environment—A case study of Suzhou, China. Cities 2025, 157, 105587. [Google Scholar] [CrossRef]
  36. Ewing, R.; Handy, S. Measuring the Unmeasurable: Urban Design Qualities Related to Walkability. J. Urban Des. 2009, 14, 65–84. [Google Scholar] [CrossRef]
  37. Ma, X.; Ma, C.; Wu, C.; Xi, Y.; Yang, R.; Peng, N.; Zhang, C.; Ren, F. Measuring human perceptions of streetscapes to better inform urban renewal: A perspective of scene semantic parsing. Cities 2021, 110, 103086. [Google Scholar] [CrossRef]
  38. Qiu, W.; Zhang, Z.; Liu, X.; Li, W.; Li, X.; Xu, X.; Huang, X. Subjective or objective measures of street environment, which are more effective in explaining housing prices? Landsc. Urban Plan. 2022, 221, 104358. [Google Scholar] [CrossRef]
  39. Yang, Y.; He, D.; Gou, Z.; Wang, R.; Liu, Y.; Lu, Y. Association between street greenery and walking behavior in older adults in Hong Kong. Sustain. Cities Soc. 2019, 51, 101747. [Google Scholar] [CrossRef]
  40. Lee, M.; Lee, H.; Hwang, S.; Choi, M. Understanding the impact of the walking environment on pedestrian perception and comprehension of the situation. J. Transp. Health 2021, 23, 101267. [Google Scholar] [CrossRef]
  41. Broberg, A.; Kyttä, M.; Fagerholm, N. Child-friendly urban structures: Bullerby revisited. J. Environ. Psychol. 2013, 35, 110–120. [Google Scholar] [CrossRef]
  42. Wang, R.; Lu, Y.; Zhang, J.; Liu, P.; Yao, Y.; Liu, Y. The relationship between visual enclosure for neighbourhood street walkability and elders’ mental health in China: Using street view images. J. Transp. Health 2019, 13, 90–102. [Google Scholar] [CrossRef]
  43. Togo, F.; Watanabe, E.; Park, H.; Shephard, R.J.; Aoyagi, Y. Meteorology and the physical activity of the elderly: The Nakanojo Study. Int. J. Biometeorol. 2005, 50, 83–89. [Google Scholar] [CrossRef]
  44. Shanghai Urban Planning. Planning Guidance of 15-Minute Community-Life Circle; Shanghai Urban Planning and Land Re-sources Administration Bureau: Shanghai, China, 2016. [Google Scholar]
  45. He, X.; He, S.Y. Decoding the spatial effects of walkability on walking behavior among older adults by integrating big data and small data. Cities 2025, 156, 105537. [Google Scholar] [CrossRef]
  46. Su, S.; Pi, J.; Xie, H.; Cai, Z.; Weng, M. Community deprivation, walkability, and public health: Highlighting the social inequalities in land use planning for health promotion. Land Use Policy 2017, 67, 315–326. [Google Scholar] [CrossRef]
  47. Fang, C.; He, S.; Wang, L. Spatial Characterization of Urban Vitality and the Association With Various Street Network Metrics From the Multi-Scalar Perspective. Front. Public Health 2021, 9, 677910. [Google Scholar] [CrossRef]
  48. Kim, M.-J.; Sung, J.H.; Park, K.-S. Effect of High Temperature on Walking among Residents of Rural and Urban Communities. Yonsei Med. J. 2022, 63, 1130–1137. [Google Scholar] [CrossRef]
  49. He, J.; Zhang, J.; Yao, Y.; Li, X. Extracting human perceptions from street view images for better assessing urban renewal potential. Cities 2023, 134, 104189. [Google Scholar] [CrossRef]
  50. Li, Y.; Yabuki, N.; Fukuda, T. Measuring visual walkability perception using panoramic street view images, virtual reality, and deep learning. Sustain. Cities Soc. 2022, 86, 104140. [Google Scholar] [CrossRef]
  51. Tang, Y.; Zhang, J.; Liu, R.; Li, Y. Exploring the impact of built environment attributes on social followings using social media data and deep learning. ISPRS Int. J. Geo-Inf. 2022, 11, 325. [Google Scholar] [CrossRef]
  52. Zhou, B.; Zhao, H.; Puig, X.; Fidler, S.; Barriuso, A.; Torralba, A. Scene parsing through ade20k dataset. In Proceedings of the IEEE Conference on Computer Vision and Pattern Recognition, Honolulu, HI, USA, 21–26 July 2017; pp. 633–641. [Google Scholar]
  53. Minka, T.; Cleven, R.; Zaykov, Y. Trueskill 2: An Improved Bayesian Skill Rating System. Microsoft. 2018. Available online: https://www.microsoft.com/en-us/research/publication/trueskill-2-improved-bayesian-skill-rating-system/ (accessed on 2 January 2025).
  54. Alvarado, O. Quantifying ecosystem services from trees of an urban park in Amsterdam. Water Int. 2025, 50, 266–297. [Google Scholar] [CrossRef]
  55. Coffin, A.; Morrall, J. Walking speeds of ederly pedestrians at crosswalks. Transp. Res. Rec. 1995, 1487, 63. [Google Scholar]
  56. Qiu, Y.; Liu, Y.; Liu, Y.; Li, Z. Exploring the Linkage between the Neighborhood Environment and Mental Health in Guangzhou, China. Int. J. Environ. Res. Public Health 2019, 16, 3206. [Google Scholar] [CrossRef]
  57. Miller, E.J. Accessibility: Measurement and application in transportation planning. Transp. Rev. 2018, 38, 551–555. [Google Scholar] [CrossRef]
  58. Singh, S.S.; Sarkar, B. Cumulative opportunity-based accessibility measurement framework in rural India. Transp. Policy 2022, 117, 138–151. [Google Scholar] [CrossRef]
  59. Tiran, J.; Lakner, M.; Drobne, S. Modelling walking accessibility: A case study of Ljubljana, Slovenia. Morav. Geogr. Rep. 2019, 27, 194–206. [Google Scholar] [CrossRef]
  60. Kumari, P.; Toshniwal, D. Extreme gradient boosting and deep neural network based ensemble learning approach to forecast hourly solar irradiance. J. Clean. Prod. 2021, 279, 123285. [Google Scholar] [CrossRef]
  61. Yang, C.; Zeng, W.; Yang, X. Coupling coordination evaluation and sustainable development pattern of geo-ecological environment and urbanization in Chongqing municipality, China. Sustain. Cities Soc. 2020, 61, 102271. [Google Scholar] [CrossRef]
  62. Li, Z. GeoShapley: A game theory approach to measuring spatial effects in machine learning models. Ann. Am. Assoc. Geogr. 2024, 114, 1365–1385. [Google Scholar] [CrossRef]
  63. Klenk, J.; Büchele, G.; Rapp, K.; Franke, S.; Peter, R.; Group, A.S. Walking on sunshine: Effect of weather conditions on physical activity in older people. J. Epidemiol. Community Health 2012, 66, 474–476. [Google Scholar] [CrossRef]
  64. Oakes, J.M.; Forsyth, A.; Schmitz, K.H. The effects of neighborhood density and street connectivity on walking behavior: The Twin Cities walking study. Epidemiol. Perspect. Innov. 2007, 4, 16. [Google Scholar] [CrossRef]
  65. Xia, Z.; Li, H.; Chen, Y. Assessing neighborhood walkability based on usage characteristics of amenities under Chinese metropolises context. Sustainability 2018, 10, 3879. [Google Scholar] [CrossRef]
  66. Kim, D. The transportation safety of elderly pedestrians: Modeling contributing factors to elderly pedestrian collisions. Accid. Anal. Prev. 2019, 131, 268–274. [Google Scholar] [CrossRef]
  67. Chen, C.; Cao, Y.; Xu, G.; Zhong, Q.; Chen, B. How do urban block built environments affect older adults’ walking activities and health effects: A case study in Nanjing, China. Front. Public Health 2024, 12, 1479305. [Google Scholar] [CrossRef]
  68. Bereitschaft, B. Neighborhood Walkability and Housing Affordability among U.S. Urban Areas. Urban Sci. 2019, 3, 11. [Google Scholar] [CrossRef]
  69. Cervero, R.; Kockelman, K. Travel demand and the 3Ds: Density, diversity, and design. Transp. Res. Part D Transp. Environ. 1997, 2, 199–219. [Google Scholar] [CrossRef]
  70. Iamtrakul, P.; Padon, A.; Chayphong, S.; Hayashi, Y. Unlocking Urban Accessibility: Proximity Analysis in Bangkok, Thailand’s Mega City. Sustainability 2024, 16, 3137. [Google Scholar] [CrossRef]
  71. Yang, Y.; Qian, Y.; Zeng, J.; Wei, X.; Yang, M. Walkability measurement of 15-minute community life circle in Shanghai. Land 2023, 12, 153. [Google Scholar] [CrossRef]
  72. Xiong, R.; Zhao, H.; Huang, Y. Spatial heterogeneity in the effects of built environments on walking distance for the elderly living in a mountainous city. Travel Behav. Soc. 2024, 34, 100693. [Google Scholar] [CrossRef]
  73. Nakanishi, M.; Shimizu, S.; Murai, T.; Yamaoka, A. “Ageing in place” policy in japan: Association between the development of an integrated community care system and the number of nursing home placements under the public long-term care insurance program among municipal governments. Ageing Int. 2015, 40, 248–261. [Google Scholar] [CrossRef]
  74. Doty, P. Cost-effectiveness of home and community-based long-term care services. Wash. DC US Dep. Health Hum. Serv. 2000, 18, 1–24. [Google Scholar]
  75. Van Cauwenberg, J.; Nathan, A.; Barnett, A.; Barnett, D.W.; Cerin, E.; The Council on Environment and Physical Activity (CEPA)-Older Adults Working Group. Relationships Between Neighbourhood Physical Environmental Attributes and Older Adults’ Leisure-Time Physical Activity: A Systematic Review and Meta-Analysis. Sports Med. 2018, 48, 1635–1660. [Google Scholar] [CrossRef]
  76. Ali, M.J.; Rahaman, M.; Hossain, S.I. Urban green spaces for elderly human health: A planning model for healthy city living. Land Use Policy 2022, 114, 105970. [Google Scholar] [CrossRef]
  77. Hu, G.; Huang, J.; Niu, Q. Review and revelation of the community service facilities research under the background of aging. Urban Dev. Stud. 2016, 23, 78–83. [Google Scholar]
  78. Li, Q.; Peng, K.; Cheng, P. Community-level urban green space equity evaluation based on spatial design network analysis (sDNA): A case study of central wuhan, China. Int. J. Environ. Res. Public Health 2021, 18, 10174. [Google Scholar] [CrossRef]
  79. Xu, J.; Wei, X.; Liu, X. Research on evaluation index system of livability in Shanghai urban communities. City Plan. Rev. 2020, 1, 70–78. [Google Scholar]
  80. Yafei, Y.; Dongfeng, Y.; Dan, X. Exploration and Examination of the Influence Mechanism of Urban Blue-Green Space on the Elderly’s Mental Health. Landsc. Archit. 2022, 29, 71–77. [Google Scholar]
  81. Pfiester, L.M.; Thompson, R.G.; Zhang, L. Spatiotemporal exploration of Melbourne pedestrian demand. J. Transp. Geogr. 2021, 95, 103151. [Google Scholar] [CrossRef]
  82. Malekzadeh, M.; Reuschke, D.; Long, J.A. Quantifying local mobility patterns in urban human mobility data. Int. J. Geogr. Inf. Sci. 2025, 39, 975–998. [Google Scholar] [CrossRef]
  83. Kelobonye, K.; Zhou, H.; McCarney, G.; Xia, J.C. Measuring the accessibility and spatial equity of urban services under competition using the cumulative opportunities measure. J. Transp. Geogr. 2020, 85, 102706. [Google Scholar] [CrossRef]
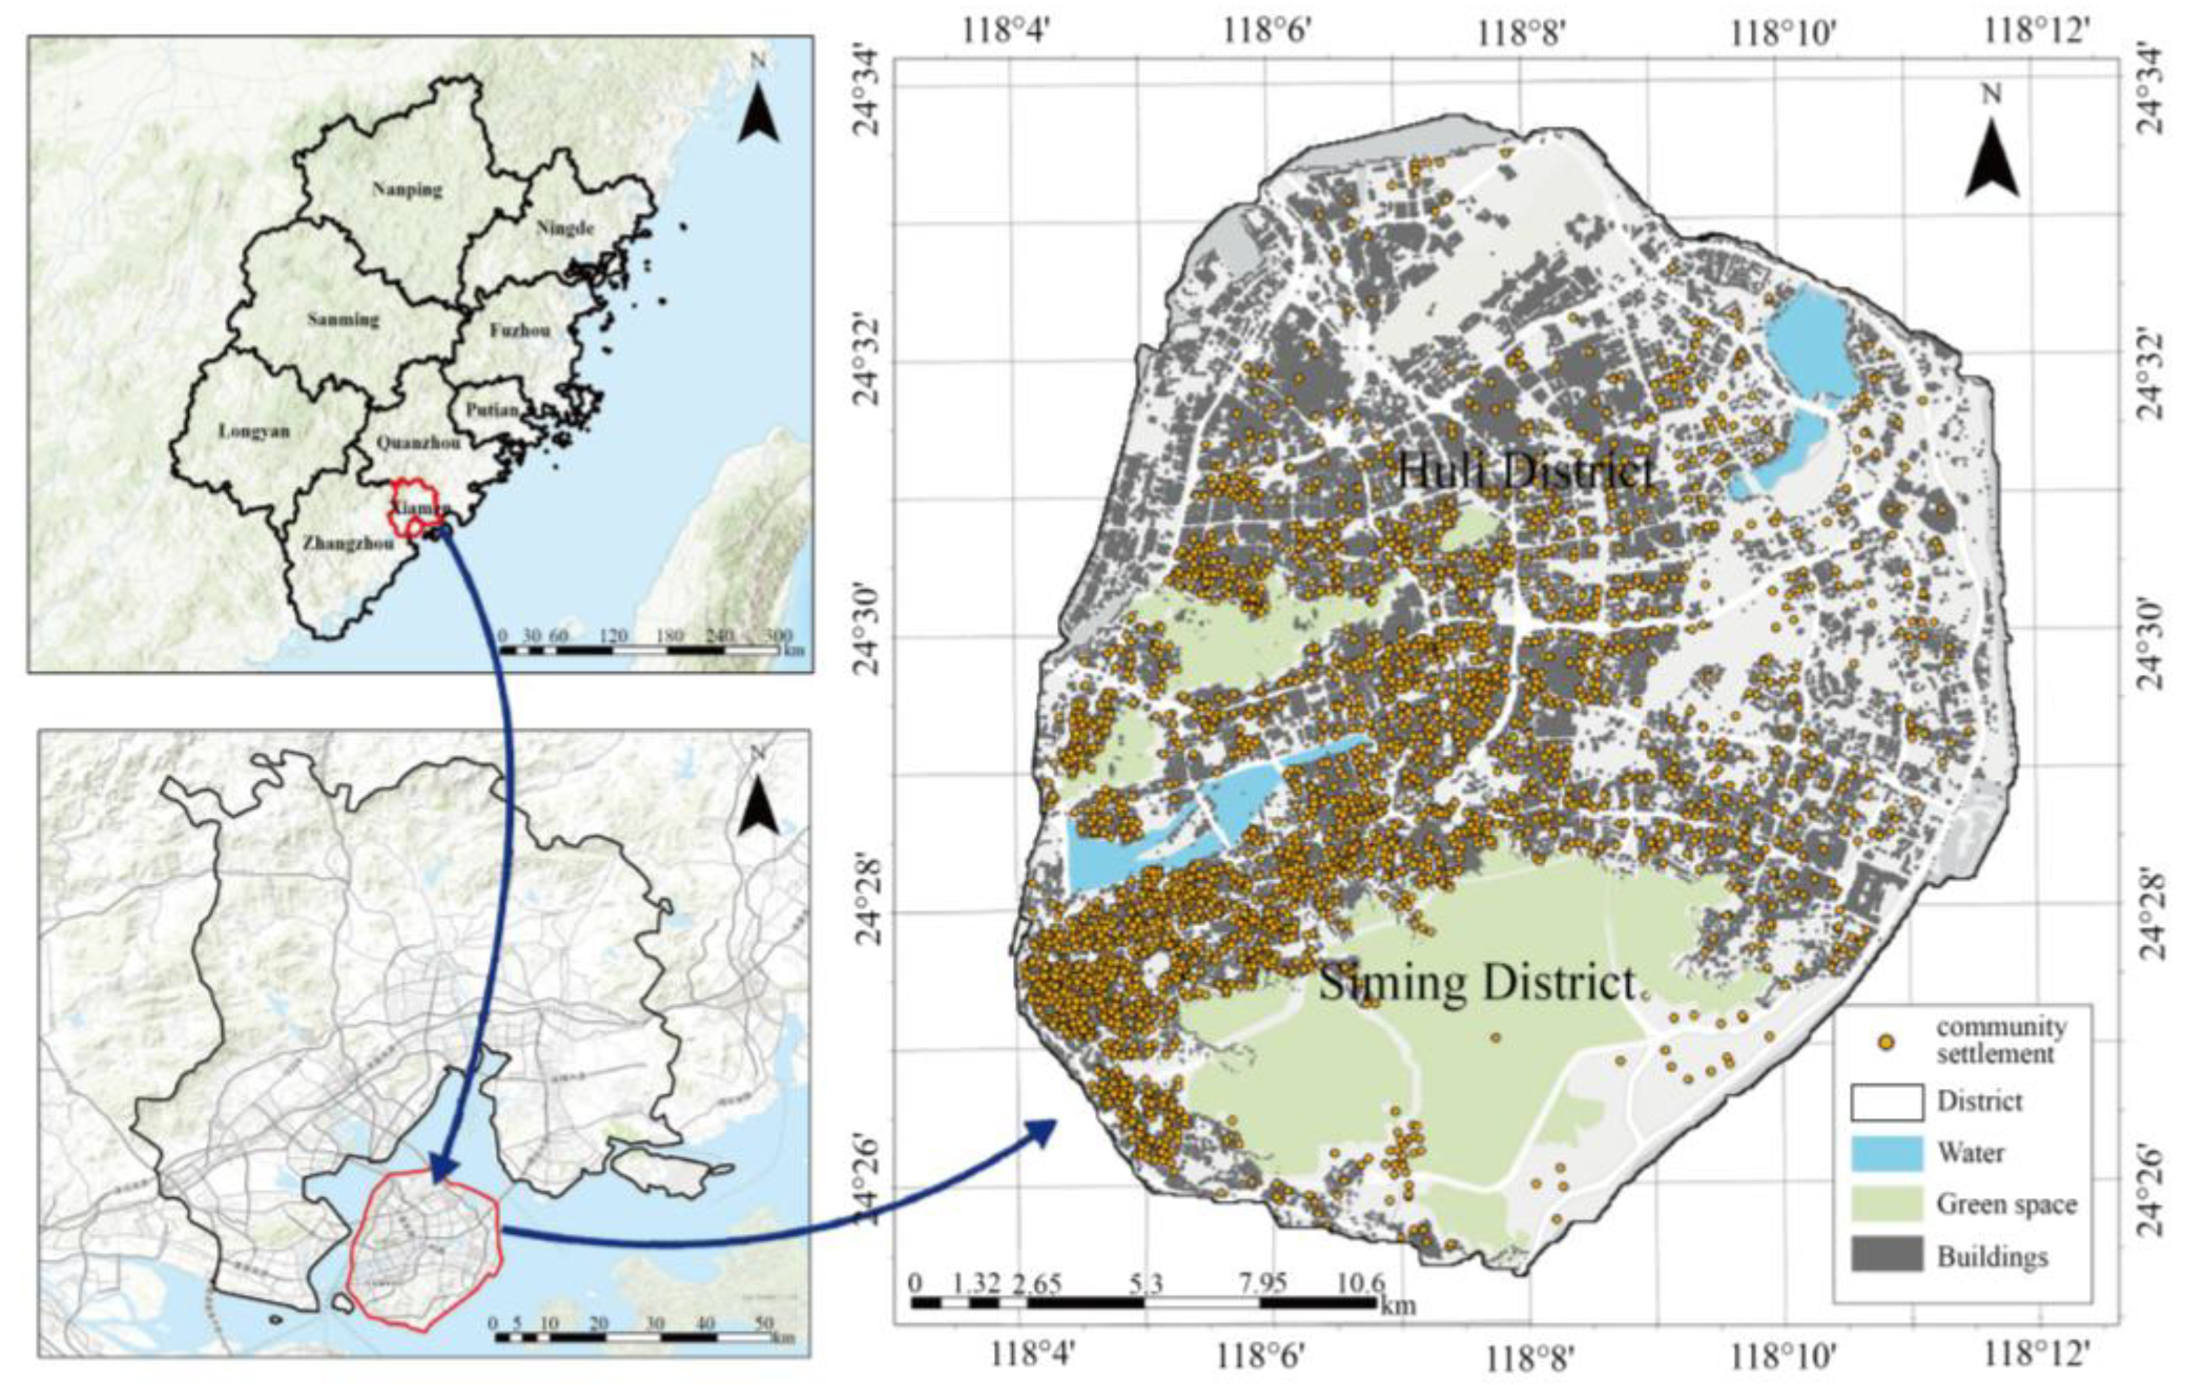
Figure 1. The research area.
Sustainability 17 08499 g001
Figure 2. Theoretical framework.
Sustainability 17 08499 g002
Figure 3. TrueSkill algorithm interface.
Sustainability 17 08499 g003
Figure 4. Variance inflation factor (VIF) for features.
Sustainability 17 08499 g004
Figure 5. (a) Types of services obtained by older adults within a 5-min Community Life Circle (CLC); (b) Types of services obtained by older adults within a 10-min Community Life Circle (CLC); (c) Types of services obtained by older adults within a 15-min Community Life Circle (CLC).
Sustainability 17 08499 g005
Figure 6. The percentage (%) of walking access to different service types for older people.
Sustainability 17 08499 g006
Figure 7. (a) Walking ability scores of older adults at 5 min; (b) Walking ability scores of older adults at 10 min; (c) Walking ability scores of older adults at 15 min.
Sustainability 17 08499 g007
Figure 8. Distribution map of bivariate spatial correlation characteristics between elderly walking activity and population density.
Sustainability 17 08499 g008
Figure 9. (a) Important contribution map based on GeoShapley at 5 min; (b) Important contribution map based on GeoShapley at 10 min; (c) Important contribution map based on GeoShapley at 15 min.
Sustainability 17 08499 g009
Figure 10. (a) GeoShapley contribution values in the XGBoost model at 5 min; (b) GeoShapley contribution values in the XGBoost model at 10 min; (c) GeoShapley contribution values in the XGBoost model at 15 min. * Indicates the primary factor in the interaction effect.
Sustainability 17 08499 g010
Figure 11. Spatial geographic distribution of GeoShapely contribution values.
Sustainability 17 08499 g011
Figure 12. (a) Marginal effect plot for 5 min; (b) Marginal effect plot for 10 min; (c) Marginal effect plot for 15 min CLC. The red dashed line denotes the zero baseline.
Sustainability 17 08499 g012
Disclaimer/Publisher’s Note: The statements, opinions and data contained in all publications are solely those of the individual author(s) and contributor(s) and not of MDPI and/or the editor(s). MDPI and/or the editor(s) disclaim responsibility for any injury to people or property resulting from any ideas, methods, instructions or products referred to in the content.