Abstract
The aim of our study is to achieve a comprehensive understanding of the global distribution of suitable habitats for Sophora alopecuroides L., as well as how these habitats might change in response to climate change. We employed the MaxEnt niche model to integrate distribution data from the Global Biodiversity Information Platform, incorporating 19 bioclimatic factors. This approach enabled us to predict the potential geographic distribution of S. alopecuroides L. worldwide under both current climatic conditions and future greenhouse gas emission scenarios. The results were visualized via ArcGIS 10.8 software. The findings indicate that currently, the suitable habitat for S. alopecuroides L. spans 12,897,100 km2, with the majority situated in the arid regions of Central and Eastern Asia. The key environmental variables influencing its distribution are annual mean temperature, maximum temperature of the warmest month, precipitation of the warmest season, and mean temperature of the coldest season. For future climate projections, suitable habitats generally exhibit a shrinking trend. The most pronounced decrease is anticipated under the moderate greenhouse gas emission scenario (SSP245). However, under the high greenhouse gas emission scenario (SSP585), the suitable habitat area is projected to increase marginally by 2060. This dynamic change warning suggests that it is necessary to optimize climate adaptation strategies, strengthen ecological protection and restoration in suitable areas, so as to maintain the ecological service functions of S. alopecuroides L. in arid and semi-arid ecosystems, such as sand fixation and soil conservation, and maintain biodiversity, and provide basic guarantee for the sustainable development and utilization of its medicinal and forage resources. This study reveals the dynamic impact of climate change on the distribution of S. alopecuroides L. suitable areas, which not only provides a scientific basis for ecological restoration and S. alopecuroides L. resource protection in arid and semi-arid areas, but also has important practical significance for promoting the regional practice of the concept of sustainable development of “harmonious coexistence between man and nature.”
1. Introduction
Climate change exerts a pivotal influence in shaping the spatial patterns of vegetation, operating primarily through two fundamental mechanisms. Heat drives plant metabolic processes, whereas water regulates these functions and is fundamental to cellular integrity [1]. Numerous studies have demonstrated that global warming will substantially affect vegetation growth, development, geographic distribution, and biodiversity [2]. The IPCC Sixth Assessment Report indicates that global surface temperatures have exhibited a consistent upward trend from 2011 to 2020, with an average increase of 1.1 °C relative to the pre-industrial baseline (1850–1900) [3]. This accelerated climate change is profoundly altering the distribution of plant community niches. Thus, developing a predictive model for species distribution under climate change is of both academic significance and practical relevance. It deepens our comprehension of the interrelationship between biodiversity and climate change and facilitates the formulation of robust ecological protection strategies.
Sophora alopecuroides L. is a perennial legume exhibiting morphological traits of both herbs and subshrubs. It possesses a lignified stem base and reaches a maximum height of approximately one meter. Predominantly distributed in arid regions of northern China, including Inner Mongolia, Xinjiang, and Gansu, and along the periphery of the Qinghai–Tibetan Plateau, it is also sporadically distributed in arid zones of Eurasia extending from Russia to northern India [4]. Studies on its ecological adaptability indicate that it typically inhabits desert-steppe ecotones and sandy substrates at altitudes ranging from 500 to 1600 m above sea level [5] and displays strong resistance to multiple abiotic stresses, such as cold, drought, salinity, and wind erosion [6,7]. As a key pioneer species in desertification control, it serves a crucial ecological function in ameliorating soil structure, stabilizing mobile sand dunes, and inhibiting desert expansion [8]. Furthermore, S. alopecuroides L., a traditional medicinal plant, harbors bioactive compounds such as alkaloids throughout the plant. It is characterized by a cold property, bitter flavor, and toxicity. Clinically, it is incorporated into formulations for heat-clearing, detoxifying, antibacterial, and analgesic effects. In folk medicine, it is commonly used to alleviate symptoms including sore throat, respiratory disorders, and skin inflammations [9,10,11,12]. Modern medicine primarily utilizes alkaloids extracted from the plant in pharmaceutical manufacturing. Additionally, as a leguminous species, S. alopecuroides L. harbors root nodules capable of fixing atmospheric nitrogen into ammonia [13], which is then incorporated into the soil for plant absorption. This process plays a vital role in maintaining ecosystem balance and stability [14,15].
Although the multiple stress resistance mechanisms and ecological medicinal functions of S. alopecuroides L. have been systematically explained, there is still a lack of kilometer level spatial answers to where can this species fall and how well it can grow under different climate soil scenarios. Research on predicting species suitable habitats faces substantial constraints when dependent on traditional field survey methods, primarily due to the demands of integrating multidimensional environmental datasets and the spatiotemporal heterogeneity of ecological processes. Developing distribution models that demonstrate predictive robustness, evaluative accuracy, and cross-regional applicability has become a focal research area in this discipline. Among current species distribution models, the MaxEnt model stands out for its algorithmic efficiency and superiority [16,17]. By leveraging ecological niche parameter inversion technology, this model ensures high-precision predictions with computational efficiency, and its output potential distribution range shows greater spatial consistency with reality than traditional models [18]. The MaxEnt model’s modeling mechanism is rooted in the maximum entropy principle. By integrating existing geographic distribution records of the target species with multidimensional environmental factor data, it infers the species’ spatial distribution pattern under ecological niche constraints that maximize entropy, thus identifying potential suitable habitats [19]. Since its debut in 2004, the application of this model in ecological research has been expanding, with successful applications in diverse research domains, such as native species habitat simulation, climate change response assessment, and invasive species dispersal early warning [20,21,22,23,24]. Numerous prior studies have utilized the MaxEnt model for predicting species distribution and suitable habitats [25,26]. For example, Duan Yizhong et al. utilized niche modeling approaches to predict the potential distribution of Ammopiptanthus species in China under future climate scenarios, providing critical insights for ecological restoration in northwestern China [27]. Lei Juncheng et al. applied the MaxEnt model to predict the potential distribution of Solidago canadensis in China, providing a robust basis for studies on invasive alien plants [28]. Similarly, Zhang Hua et al., using the MaxEnt model, predicted the potential geographic distribution of Populus euphratica in China under future climate change scenarios, contributing significantly to the conservation of this valuable drought-resistant forest resource, oasis restoration, and desert environment improvement [29].
Although MaxEnt has been successfully applied to medicinal plants such as Glycyrrhiza uralensis and related species of S. alopecuroides L., the above studies either focus on a single province or ignore the toxicity risk, resulting in less research on the distribution dynamics of the dual attributes of medicinal toxicity at the global scale. S. alopecuroides L. is a perennial resource plant in arid and semi-arid areas. It is an important source of matrine and is currently widely planted and utilized in northern China. First, as a nitrogen fixing plant, it can improve the soil, second, it can extract botanical pesticides, and third, it can use the desert land and returning farmland to forest land for planting and utilization. It is an excellent species of ecological and economic type. At present, the living environment of S. alopecuroides L. is facing severe challenges due to the rapid change in climate, and the distribution of its global suitable areas is unknown, which seriously restricts the protection and rational development and utilization of this precious resource. Therefore, accurately understanding the potential distribution area of S. alopecuroides L. in the world is of great significance for the rational protection, development and utilization of this plant resource and in-depth understanding of its relationship with global climate change. This paper provides reference for the cultivation and utilization of S. alopecuroides L. in global desertification areas, and provides Chinese wisdom for the world. Based on MaxEnt and cmip6 climate scenarios, this study proposed three testable hypotheses to quantify the dynamic changes in the distribution of S. alopecuroides L. global suitable areas. Firstly, in view of “which climate variables determine the distribution”, Hypothesis 1 is put forward: annual average temperature (BIO1), maximum temperature in the warmest month (bio5), precipitation in the warmest season (bio18) and standard deviation of seasonal variation of temperature (bio4) are the limiting factors for the growth of S. alopecuroides L., and the cumulative contribution rate in MaxEnt is greater than 50%. Secondly, we answer “how will the distribution change in the future”, and put forward Hypothesis 2: under the future climate scenario, the suitable area may shrink in general. Finally, we answer “what is the trend of dynamic change in the future”, and put forward Hypothesis 3: under the climate change environment, the dynamic change decreases with climate change.
2. Materials and Methods
2.1. Acquisition and Screening of Sophora alopecuroides L. Distribution Data
The geographical distribution data of S. alopecuroides L. were derived from the Global Biodiversity Information Facility (GBIF, https://doi.org/10.15468/dl.6t6ynr, accessed on 8 September 2025) [30], the China Virtual Herbarium (http://www.cvh.ac.cn/, accessed on 15 October 2024), the Flora of China (https://www.iplant.cn/, accessed on 16 October 2024), and other authoritative botanical databases. After filtering out duplicate latitude–longitude records and ambiguous distribution data, a total of 952 valid distribution points for S. alopecuroides L. were acquired. To mitigate model overfitting caused by spatial autocorrelation in S. alopecuroides L. occurrence points [31], the data were imported into ArcGIS 10.8 software. The Spatially Rarefy Occurrence Data for SDMs tool (SDM Toolbox), which is specifically designed to mitigate spatial autocorrelation, was employed to screen S. alopecuroides L. points, retaining a single point within each 5 km buffer. Ultimately, 282 valid distribution points for S. alopecuroides L. (Figure 1) were acquired and saved in CSV format for subsequent model implementation.
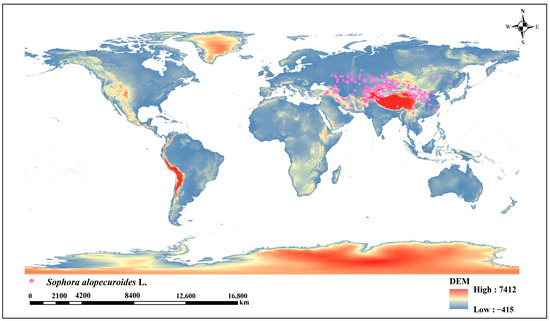
Figure 1.
Global distribution of current climate Sophora alopecuroides L.
2.2. Acquisition and Processing of Environment Variables
In view of the high vacancy rate of global soil/keeger data in arid areas, and compared with the relatively uniform sandy matrix, low topographic relief and consistent sedimentary rock background in the study area, the introduction of non climatic factors has limited gain on the model, so this study is temporarily driven by climate variables. In this study, we utilized 19 bioclimatic factors commonly applied in species distribution models to predict spatiotemporal changes in suitable habitats of S. alopecuroides L. worldwide (Table 1). These bioclimatic variables were obtained from WorldClim (https://worldclim.org/), featuring a consistent spatial resolution of 2.5 arc-minutes. For the current climate scenario, we used bioclimatic data ranging from 1970 to 2000, whereas for future climate projections, we employed the BCC-CSM2-MR climate system model developed by the Beijing Climate Center. The Shared Socioeconomic Pathways (SSP) [32], namely SSP126, SSP245, and SSP585, were used to characterize low, medium, and high greenhouse gas emission scenarios, respectively, for the selected timeframes of 2021–2040 and 2041–2060. As the downloaded future climate data comprise 19 bioclimatic factors datasets, the first step involved importing these data into ArcMap 10.8 for individual extraction. Subsequently, all climate data were converted to standard ASCII (.asc) format for subsequent model analysis.

Table 1.
Bioclimatic factors.
The correlation among environmental variables can lead to model overfitting [31], thereby impairing the accuracy of prediction outcomes. To mitigate the impacts of multicollinearity on predictions, this study first imported19 bioclimatic factors into the MaxEnt model for preliminary simulations, deriving the average contribution rate and permutation importance of each environmental variable through 10 simulation iterations. Subsequently, ENMTools (version 1.1.5) was employed to perform a correlation analysis on these 19 bioclimatic factors, generating a correlation coefficient matrix with a cutoff value of 0.8. When the correlation coefficient |r| between two climatic variables was ≥0.8, the variable with the higher contribution rate was selected for model prediction. This threshold was chosen after sensitivity tests at 0.7 and 0.9, which showed that 0.8 best balanced predictive accuracy (AUC) and model parsimony. Ultimately, five climatic variables with significant impacts on S. alopecuroides L. suitable habitat distribution were identified: annual mean temperature (Bio1), temperature seasonality (standard deviation) (Bio4), maximum temperature of the warmest month (Bio5), precipitation of the warmest quarter (Bio18), and mean temperature of the coldest quarter (Bio11) (Table 2).
Table 2.
Contribution rate of environmental variables.
2.3. Predicting Suitable Growing Areas of Sophora alopecuroides L. Globally Using the MaxEnt Model
2.3.1. Prediction Methodology and Parameter Tuning
The data consisting of 282 distribution points of S. alopecuroides L. (in CSV format) and five selected environmental variables (in ASC format) were introduced into the MaxEnt model individually. The options “Create response curves” and “Conduct jackknife for variable importance assessment” were employed to evaluate the impact of environmental variables. We allocated 25% of S. alopecuroides L. distribution points as the test dataset for model validation and 75% as the training dataset for model calibration [29]. The simulation was performed with 10 iterations, employing the Bootstrap resampling method for iterative validation. The “Random seeds” option was activated to ensure distinct random samples for each iteration, enabling diverse random test-training splits [33]. The “Write plot data” option was also enabled to generate visualization data. The regularization coefficient was configured to the default value of 1, and the output format was specified as logistic [34].
2.3.2. Model Accuracy Assessment
In the context of model performance assessment, the Area Under the Receiver Operating Characteristic Curve (AUC-ROC) is utilized as a quantitative evaluation metric. The calculation principle of this method is based on the matching degree between the prediction probability of the model and the real distribution. The AUC value range is 0–1, and the higher the value, the stronger the discrimination ability of the model [35]. The MaxEnt model automatically generates the ROC curve and calculates the corresponding AUC value via its built-in algorithm. The quantitative classification criteria are as follows: AUC > 0.9 indicates an excellent level of model discrimination [36,37].
2.3.3. Division of Suitable Habitats for Sophora alopecuroides L.
Based on the prediction results obtained from the MaxEnt model, the suitable habitats for S. alopecuroides L. were classified into four categories using the reclassification tool in ArcGIS 10.8: non-suitable areas (0–0.2), low-suitable areas (0.2–0.4), moderately suitable areas (0.4–0.6), and high-suitable areas (0.6–1.0) [38]. The area of each habitat type was calculated using the field calculator and pixel size within the reclassified attribute table.
2.3.4. Dynamic Changes of Suitable Areas for Sophora alopecuroides L. Under Future Climate Scenarios
To uncover the spatio-temporal evolution patterns of suitable areas for S. alopecuroides L., this study establishes a multi-climate scenario simulation framework to compare and analyze the spatial configuration and migration characteristics of potential suitable areas for this species under different climate models in both the current and future periods. Initially, this study employs the reclassification function in ArcGIS 10.8 to categorize the current and future results into a binary map, distinguishing between non-suitable areas (0–0.2) and suitable areas (0.2–1). Subsequently, these maps are converted into vector files for overlay analysis. Finally, they are transformed into raster data while maintaining consistent pixel sizes to produce a map illustrating the dynamic changes in suitable areas.
3. Results
3.1. Model Accuracy Evaluation and Importance of Environmental Variables
After 10 repetitions, the average AUC value of the MaxEnt model’s training dataset was 0.969 (Figure 2). Under different greenhouse gas emission scenarios, the average AUC values for the future periods (2021–2040 and 2041–2060) exceeded 0.95 (Table 3). This indicates that the MaxEnt model exhibited remarkably high prediction accuracy and could accurately reflect the relationship between the distribution of S. alopecuroides L. suitable habitats and environmental variables.
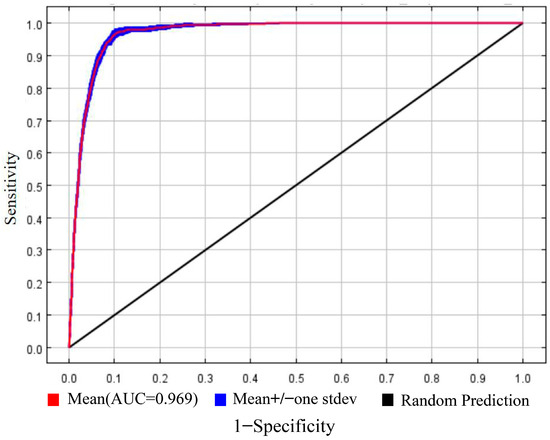
Figure 2.
ROC curve of S. alopecuroides L. prediction model.
Table 3.
Potential suitable area of S. alopecuroides L. under future climate scenarios.
Integrating three complementary metrics—percent contribution, permutation importance, and jackknife unique gain—this study first screened the climatic determinants of S. alopecuroides L. suitability at the global scale. Annual mean temperature (Bio1) emerged as the single most influential descriptor, accounting for 25% of model contribution and 54.7% of permutation importance. Maximum temperature of the warmest month (Bio5) and precipitation of the warmest season (Bio18) completed the top triad, whereas temperature seasonality (Bio4) was flagged as the key proxy for thermal instability. Jackknife (Figure 3) resampling further revealed that Bio1, Bio5 and mean temperature of the coldest quarter (Bio11) produced the largest independent information gain, corroborating the pre-eminent role of temperature axes in delimiting the species’ potential range [18].
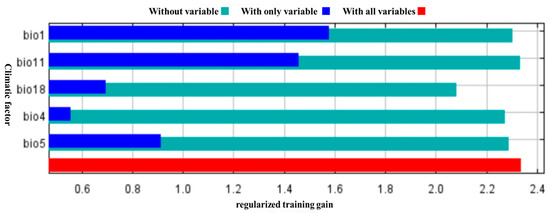
Figure 3.
Different environmental variables knife cut test scores.
When the above drivers were examined individually, habitat suitability responded unimodally to each gradient (Figure 4): probability rose to a maximum and then declined, defining narrow climatic envelopes within which the species is likely to thrive. Peak suitability (0.6–1) corresponds to 8.2–11.9 °C in annual mean temperature, 30.3–31.7 °C for the hottest-month maximum, −7.0 to 1.8 °C for the coldest-quarter mean, and 36.8–87.8 mm of rainfall during the warmest quarter. These intervals imply that S. alopecuroides L. occupies habitats where winters are cold yet not severe, summers are hot but not extreme, and late-growing-season moisture is moderate—conditions that jointly restrict the global extent of its climatically suitable niche.
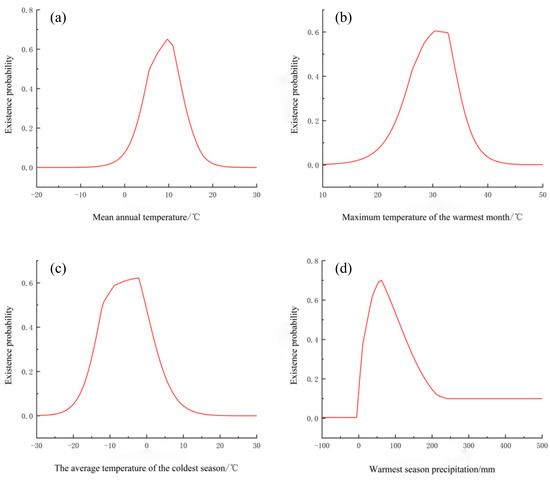
Figure 4.
Response curve of existence probability and environmental variables of Sophora alopecuroides L. (a) Mean annual temperature/°C, (b) Maximum temperature of the warmest month/°C, (c) The average temperature of the coldest season/°C and (d) Warmest season precipitation/mm.
3.2. Distribution of Suitable Areas for Sophora alopecuroides L. Under Current Climate
Based on the spatial simulation of contemporary climate scenarios, the total suitable habitat area is 12,879,100 km2, accounting for 8.64% of the total land area in the world. The core distribution area is concentrated in the hinterland of Eurasia at 30–50° north latitude, including the transition zone from the arid region of Central Asia to the monsoon region of East Asia. The secondary distribution areas are scattered in discontinuous patches in the west of the Great Plains of North America, the Western Asia plateau, the Mediterranean Sea, and the Black Sea coast. To sum up, S. alopecuroides L. presents a continuous core belt of “Central Asia Northwest China Mongolia Plateau”, and the rest of the countries are mostly marginal or sporadic. Among them, the high fitness area is 2,208,300 km2, accounting for 17.14% of the total fitness area. It is mainly distributed in Northwest China (north of the Tianshan Mountains in Northern Xinjiang, the Tacheng region, the Changji Hui Autonomous Prefecture, north of the Tarim Basin in southern Xinjiang, north of central Gansu, and north of Ningxia in Southwest China), west of North China (west of Inner Mongolia), south of Mongolia, east and west of Kazakhstan, and a small amount is distributed in the Midwest of the United States, eastern Turkey, northwest Iran, and Southeast Afghanistan, showing a discontinuous distribution as a whole. The moderately suitable area is 4,757,000 km2, accounting for 36.94% of the total suitable area. It is mainly distributed in Northwest China (Altay, Xinjiang, Tarim Basin, central Qinghai, western Gansu, and central Ningxia), North China (western Inner Mongolia), southern Mongolia, a large area of central Kazakhstan, eastern Ukraine, and part of the Russian region bordering it. The overall distribution is massive. The low suitable area is 5,913,800 km2, accounting for 45.92% of the total suitable area. It is mainly distributed in the central and western United States, the southwest region of the Great Lakes, the northern coastal region of the Mediterranean, the northwestern coastal region of the Black Sea, the northern and southern regions of Kazakhstan, the central and eastern regions of Uzbekistan, the central and northern regions of Turkmenistan, and North China (northern and southern Shaanxi, southern Shanxi, southern Hebei, and central and northern Henan).
Based on the current suitability distribution map of S. alopecuroides L. (Figure 5), suitable habitats are predominantly distributed in inland arid zones between 30–55° N, reflecting that arid climatic conditions are optimal for S. alopecuroides L. growth. The majority of potential suitable habitats occur in temperate continental climate zones, with minor occurrences in plateau mountain and temperate monsoon climate zones.
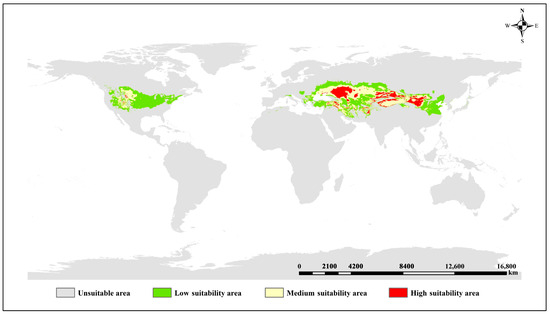
Figure 5.
Distribution of suitable areas of S. alopecuroides L. under current climate.
3.3. Distribution and Area Change of S. alopecuroides L. Suitable Areas Under Future Climate Conditions
Using the multi-scenario simulation framework (SSP126, SSP245, and SSP585) from the BCC-CSM2-MR climate system, this study compared and analyzed the short-term (2021–2040) and medium-term (2041–2060) spatial distribution response characteristics of S. alopecuroides L. The results (Figure 6) show that the core distribution area of S. alopecuroides L. exhibits significant geographical pattern stability in Eurasia, consistently occupying the transition area between the Central Asian arid zone and the East Asian monsoon region. Notably, the ecological suitability under different emission scenarios exhibits latitudinal gradient differentiation. The response threshold of the suitable area extending to high latitudes, driven by the high-temperature chamber gas emission scenario (SSP585), is notably significant. Compared to the current distribution of suitable areas, the range of low-suitability areas in Central and Eastern Asia expands toward middle- and high-suitability areas, occupying some of these areas. In North America, the range of low-suitability areas expands eastward from 2021 to 2040 and shrinks from 2041 to 2060. The distribution of middle and high fitness areas in Central and Eastern Asia showed an inward contraction trend, while there was no significant change in North America.
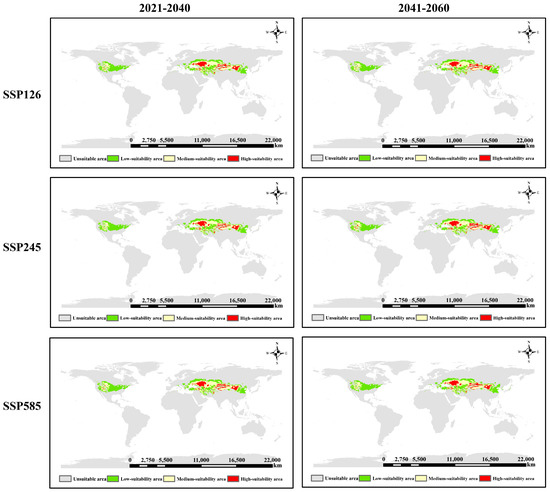
Figure 6.
Distribution of potential suitable areas of S. alopecuroides L. under future climatic conditions.
Compared to the current potential suitable area of S. alopecuroides L., its distribution under future climate conditions will differ according to greenhouse gas emission scenarios. Overall, the suitable area will decrease to varying degrees (Table 3). Under the SSP126 scenario, from 2021 to 2040, low-, medium-, and high-fitness areas have decreased by varying degrees (a total of 1,676,200 km2). The most significant decrease occurred in the medium-fitness area (721,300 km2), followed by the low- and high-fitness areas (358,600 km2 and 596,400 km2, respectively). From 2041 to 2060, the overall suitable area decreased slightly by 38,600 km2. The low suitable area expanded by 149,300 km2, while the medium and high suitable areas decreased by 126,700 km2 and 61,200 km2, respectively. Under the SSP245 scenario, during the period from 2021 to 2040, the areas of low, medium, and high fitness areas have reduced to varying degrees (a total reduction of 2,294,000 km2), of which the most obvious is the medium fitness area, with a reduction of 1,045,700 km2, while the areas of low and high fitness areas have decreased by 576,500 km2 and 671,800 km2, respectively. During the period from 2041 to 2060, the change in the total suitable area was small (decreased by 34,400 km2); the low and medium suitable areas showed an expansion trend, increased by 21,500 km2 and 260,800 km2, respectively, while the high suitable area decreased significantly, decreased by 316,800 km2. Under the SSP585 scenario, during the period from 2021 to 2040, the areas of low, medium, and high fitness areas have been reduced to varying degrees (a total reduction of 1,578,100 km2), and the areas of low, medium, and high fitness areas have been reduced by 362,000 km2, 922,900 km2, and 293,200 km2, respectively. During the period from 2041 to 2060, the area of suitable areas changed slightly in general, showing an increasing trend (an increase of 28,500 km2). The change in low suitable areas was the least obvious, with a decrease of 8500 km2. The most obvious change was the middle suitable areas, with an increase of 241,900 km2, and the area of high suitable areas decreased by 204,900 km2.
3.4. Dynamic Changes in the Suitable Areas of S. alopecuroides L. Under Future Climate Conditions
In comparison to the current period, the potential suitable habitat area of S. alopecuroides L. exhibited a significant global contraction, whereas stable and expanding regions showed minor changes, reflecting an overall shrinkage trend. As depicted in Figure 7, the North American distribution of S. alopecuroides L. exhibited a clear contraction during 2021–2040. This contraction was most pronounced under low to high GHG emission scenarios, particularly in the eastern and western peripheries of its distribution, the southwestern Great Lakes region, and northern fringes, resulting in an overall area reduction. The Asian distribution of S. alopecuroides L. remained stable; however, obvious contraction trends were observed in Northern China (north and south Shaanxi, south Shanxi, south Hebei, and central-northern Henan), alongside contiguous areas of contraction in central and western Turkmenistan. Under low GHG emission scenarios, a strip-like expansion zone emerged in Northern Kazakhstan, though this transitioned to contraction under medium and high emission scenarios. During 2041–2060, the North American distribution of S. alopecuroides L. underwent minor changes, with the Great Lakes region exhibiting expansion-particularly under high GHG emission scenarios. The Asian distribution remained dominated by stable regions, with expansion primarily concentrated in Northern Kazakhstan, where the expansion magnitude increased with rising GHG emission levels. Under low GHG emission scenarios, pronounced European expansion occurred, primarily in Southeastern Moldova, southern Romania, and the north, east, and South of Bulgaria, with most expansion areas exhibiting strip-distributed patterns.
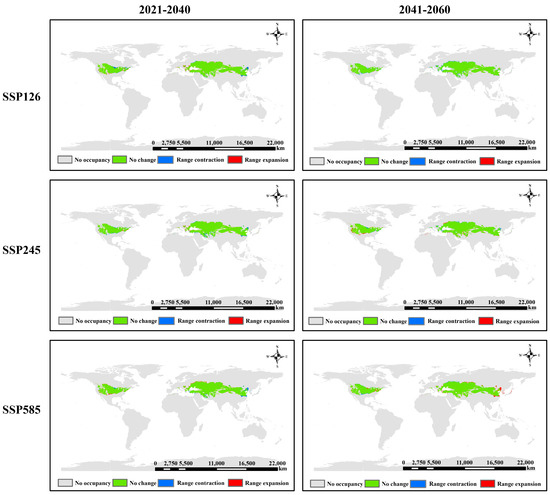
Figure 7.
Dynamic changes in suitable area of S. alopecuroides L. under future climate conditions.
4. Discussion
Based on the prediction outcomes, temperature and precipitation emerge as the key limiting factors for the distribution of S. alopecuroides L. in its climatic environment. The most critical factors include annual mean temperature, maximum temperature of the warmest month, mean temperature of the coldest season, and precipitation during the warmest season. These findings align with the key environmental factors reported by Yao Zheng Yu et al. [39]. Hydrothermal conditions affect plant physiological activities and biochemical processes, thereby influencing plant distribution [40]. Temperature exerts a profound influence on plant growth and development, substantially dictating plant distribution [41,42,43]. Plants exhibit adaptation to specific temperature ranges, beyond which their distribution declines or ceases [44]. In this study, the annual average temperature of the most suitable distribution of S. alopecuroides L. is 8.20~11.90 °C, and the maximum temperature in the warmest month is 30.27~31.74 °C, indicating that its growth and development needs heat level. According to the current distribution map of S. alopecuroides L. (Figure 1), S. alopecuroides L. is mostly distributed in arid inland areas, which is drought tolerant, but its demand for water is also essential. Warmest-season precipitation is a critical factor influencing its distribution, with an optimal range of 36.81–87.79 mm that aligns with its growth habitat. During the warmest season, characterized by high evaporation, the fruiting period occurs from August to October [45], during which S. alopecuroides L. requires substantial water resources, necessitating timely supplementation to sustain normal physiological functions. These findings are consistent with the model projections of this study, confirming that warmest-season precipitation is a key climatic factor restricting the species’ growth and distribution.
Using ArcGIS 10.8 geographic information system software and the MaxEnt niche model, we projected the distribution of potential suitable habitats for S. alopecuroides L. in the current period and two future periods (2021–2040 and 2041–2060), leveraging species distribution point data and screened climatic variables. Future potential suitable habitats and dynamic changes in S. alopecuroides L. worldwide were comprehensively analyzed under three greenhouse gas emission scenarios (SSP126, SSP245, and SSP585). The model achieved an AUC value of 0.969 (Figure 1), demonstrating its high predictive accuracy for S. alopecuroides L. suitable habitat distribution. Simulation analysis of current climatic variables revealed a multicentered distribution pattern for S. alopecuroides L. globally. The potential suitable ecological zone covers an area of 12,879,100 km2, centered in the arid inland regions of Asia between 30° and 55° N latitude. This zone encompasses typical grassland ecosystems extending from the Mongolian Plateau to Northwestern China. Secondary habitat areas are dispersed along the continental westerly wind zone, including the semi-arid corridor on the eastern slope of the North American Rocky Mountains, the eastern Anatolian Plateau, and low-altitude alluvial plains surrounding the Black Sea. This highlights the species’ remarkable adaptability to continental climates.
Under the three shared socio-economic paths (SSP 126, SSP 245 and SSP 585), the area of S. alopecuroides L. global suitable area showed a decreasing trend, but its amplitude had a nonlinear response to the emission scenario (Figure 6). Specifically, the reduction in the medium emission scenario (SSP 245) was the most significant, indicating that the combination of temperature and humidity under this path would generally exceed the physiological tolerance threshold of S. alopecuroides L. On the contrary, the loss of suitable areas in the high emission scenario (SSP 585) is the smallest, and there is a slight net increase of 28,500 km2 from 2041 to 2060, suggesting that the warming and humidifying effect driven by high concentration of CO2 may form a new climate niche in the high latitude/high altitude marginal Zone, thus partially compensating for the retreat of the low mid latitude core area. If higher resolution regional soil terrain data are obtained in the future, the water salt dynamics and wind erosion process should be further coupled to refine the settleability differences within the suitable area. The response of S. alopecuroides L. to future climate is not a simple monotonous decline, but a scenario dependent spatial redistribution; When formulating long-term protection and utilization strategies, it is necessary to focus on the early monitoring and Germplasm reserve of potential expansion areas under high emission scenarios, and give priority to the establishment of climate shelters in strong recession areas under medium emission scenarios.
5. Conclusions
S. alopecuroides L. is an important part of natural vegetation and medicinal plant resources in arid and semi-arid areas of China, which has high ecological function and medicinal value. At present, the development and utilization of S. alopecuroides L. have been paid more and more attention. In this study, MaxEnt model was used to predict the geographical distribution of S. alopecuroides L. The geographical distribution of S. alopecuroides L. is mainly affected by temperature and precipitation environmental factors. Under the current climate, S. alopecuroides L. presents a multi-center distribution pattern in the world, and the suitable area of S. alopecuroides L. will shrink slightly in the future. It is worth emphasizing that the prediction of future climate by niche model is limited by certain conditions and uncertainties. Therefore, the stable and suitable area can be used as the priority “provenance protection area” and “Introduction and cultivation area” for ecological restoration; At the same time, it is suggested to establish a “climate shelter” or “in situ conservation community” in the retreat zone of Central Asia and Northwest China, and strengthen population monitoring and genetic resource collection. In view of the uncertainty of niche model, the suitability map should be used as an early warning and priority screening tool, combined with field investigation, expert knowledge and multi model integration, to dynamically adjust the management strategy, so as to provide a scientific basis for the rational development and sustainable protection of S. alopecuroides L. resources.
Author Contributions
Z.Y. (Zhigang Yang) and F.M.: Conceptualization, writing—original draft, and methodology; M.W. and X.H.: Conceptualization, investigation, formal analysis, and funding acquisition; C.L.: Conceptualization and formal analysis; K.P.: Formal analysis and software; Z.Y. (Zhen’an Yang): Validation and writing—review and editing. All authors have read and agreed to the published version of the manuscript.
Funding
This research was funded by National Natural Science Foundation of China (Grant No. 32560091), Xinjiang Production and Construction Corps (XPCC) Science and Technology Program (Grant No. 2025DA026), XPCC Guiding Science and Technology Plan Project (Grant No. 2023ZD088), Technical challenge project in key field of Xinjiang Production and Construction Corps (Grant No.2024AB075),Development and demonstration of key technologies for desertification monitoring and evaluation and ecological restoration in Tarim reclamation area.
Institutional Review Board Statement
Not applicable.
Informed Consent Statement
Not applicable.
Data Availability Statement
The original contributions presented in the study are included in the article, further inquiries can be directed to the corresponding authors.
Acknowledgments
We wish to express our gratitude to all the authors of this study, and all provided useful feedback on our manuscript.
Conflicts of Interest
The authors declare no conflicts of interest.
References
- Fang, J. Ecoclimatological analysis of the forest zones in China. Acta Ecol. Sin. 1991, 11, 377–387. [Google Scholar]
- Wu, F.; Jin, Y.; Liu, J.; Shang, L.; Zhao, D. Response of vegetation distribution to global climate change in Northeast China. Geogr. Sci. 2003, 23, 564–570. [Google Scholar] [CrossRef]
- Elith, J.; Leathwick, R. Species distribution models: Ecological explanation and prediction across space and time. Annu. Rev. Ecol. Evol. Syst. 2009, 40, 677–697. [Google Scholar] [CrossRef]
- Wang, R.; Deng, X.; Gao, Q.; Wu, X.; Han, L.; Gao, X.; Zhao, S.; Chen, W.; Zhou, R.; Li, Z.; et al. Sophora alopecuroides L.: An ethnopharmacological, phytochemical, and pharmacological review. J. Ethnopharmacol. 2020, 248, 112172. [Google Scholar] [CrossRef]
- Wang, Y.; Yu, W.; Zhou, K.; Wang, G.; Cao, F. Diversity analysis and comprehensive evaluation on phenotypic traits of Sophora alopecuroides. Guihaia 2019, 39, 1147–1158. [Google Scholar] [CrossRef]
- Li, R.; Gao, Q.; Mao, L.; Liu, W.; Sun, L.; Zhang, P.; Liu, F.; Jiang, X.; Xu, J. Molecular mechanism of saline-alkali stress tolerance in the green manure crop Sophora alopecuroides. Environ. Exp. Bot. 2023, 210, 105321. [Google Scholar] [CrossRef]
- Zhao, L.; Deng, Z.; Yang, W.; Cao, Y.; Wang, E.; Wei, G. Diverse rhizobia associated with Sophora alopecuroides grown in different regions of the Loess Plateau in China. Syst. Appl. Microbiol. 2010, 33, 468–477. [Google Scholar] [CrossRef]
- Wang, Y.; Zhang, N.; Li, Z. The study of Sophora alopecuroides seeds and seedling drought and salt tolerance. Mol. Plant Breed. 2017, 15, 1090–1095. [Google Scholar] [CrossRef]
- Li, J.; Dai, W.; Zhou, X.; Rao, K.; Zhang, Z.; Liu, D.; Chen, X.; Li, R.; Li, H. Matrine-type alkaloids from the seeds of Sophora alopecuroides and their potential anti-inflammatory activities. Chem. Biodivers. 2021, 18, e2001066. [Google Scholar] [CrossRef]
- Ma, T.; Li, W.; Hong, Y.; Zhou, Y.; Tian, L.; Zhang, X.; Liu, F.; Liu, P. TMT-based proteomic profiling of Sophora alopecuroides leaves reveals flavonoid biosynthesis processes in response to salt stress. J. Proteomics 2022, 253, 104457. [Google Scholar] [CrossRef]
- Luo, D.; Lin, Q.; Tan, J.L.; Zhao, H.Y.; Feng, X.; Chen, N.H.; Wu, Z.N.; Fan, C.L.; Li, Y.L.; Ding, W.L.; et al. Water-soluble matrine-type alkaloids with potential anti-neuroinflammatory activities from the seeds of Sophora alopecuroides. Bioorg. Chem. 2021, 116, 105337. [Google Scholar] [CrossRef] [PubMed]
- Shoukat, R.F.; Shakeel, M.; Rizvi, S.A.H.; Zafar, J.; Zhang, Y.; Freed, S.; Xu, X.; Jin, F. Larvicidal, ovicidal, synergistic, and repellent activities of Sophora alopecuroides and its dominant constituents against Aedes albopictus. Insects 2020, 11, 246. [Google Scholar] [CrossRef]
- Wang, L.; Sun, B.; Wang, C.; Xia, Z.; Ma, G. Isolation and nitrogen-fixing activity detection of bacteria from four desert plants. Xinjiang Agric. Sci. 2024, 61, 2742–2749. [Google Scholar] [CrossRef]
- Xiong, Y.; Wang, Z. Biodiversity and Ecoadaptability of Leguminosae. Chin. J. Nat. 2018, 40, 64–70. [Google Scholar]
- Rogiers, N.; Conen, F.; Furger, M.; Stöckli, R.; Eugster, W. Impact of past and present land-management on the C-Balance of a grassland in the swiss alps. Glob. Chang. Biol. 2008, 14, 2613–2625. [Google Scholar] [CrossRef]
- Bellard, C.; Jeschke, J.M.; Leroy, B.; Mace, G.M. Insights from modeling studies on how climate change affects invasive alien species geography. Ecol. Evol. 2018, 8, 5688–5700. [Google Scholar] [CrossRef]
- Bao, R.; Li, X.; Zheng, J. Feature tuning improves MAXENT predictions of the potential distribution of Pedicularis longiflora Rudolph and its variant. PeerJ 2022, 10, e13337. [Google Scholar] [CrossRef]
- Booth, T.H.; Nix, H.A.; Busby, J.R.; Hutchinson, M.F. Bioclim: The first species distribution modeling package, its early applications and relevance to most current MaxEnt studies. Divers. Distrib. 2014, 20, 1–9. [Google Scholar] [CrossRef]
- Li, X.; Zhang, C.; He, S.; Wang, Y.; Miao, L. Research progress analysis on the comprehensive application of the MaxEnt model. J. Green Sci. Technol. 2020, 14, 14–17. [Google Scholar] [CrossRef]
- Zhang, L. Application of the MaxEnt maximum entropy model in predicting potential distribution range of species. Bull. Biol. 2015, 50, 9–12. [Google Scholar]
- Zhang, K.; Zhang, Y.; Zhou, C.; Meng, J.; Sun, J.; Zhou, T.; Tao, J. Impact of climate factors on future distributions of Paeonia ostii across China estimated by MaxEnt. Ecol. Inf. 2019, 50, 62–67. [Google Scholar] [CrossRef]
- Ji, W.; Gao, G.; Wei, J. Potential global distribution of Daktulosphaira vitifoliae under climate change based on MaxEnt. Insects 2021, 12, 347. [Google Scholar] [CrossRef] [PubMed]
- Sayit, H.; Nurbay, A.; Xu, Z.; Arman, J.; Shao, H.; Vinira, Y. Simulation of potential distribution patterns of the invasive plant species Xanthium spinosum L. (Bathurst burr) in Xinjiang under climate change. Acta Ecol. Sin. 2018, 39, 1551–1559. [Google Scholar] [CrossRef]
- Coro, G. A global-scale ecological niche model to predict SARS-CoV-2 coronavirus infection rate. Ecol. Modell. 2020, 431, 109187. [Google Scholar] [CrossRef] [PubMed]
- Ancillotto, L.; Mori, E.; Bosso, L.; Agnelli, P.; Russo, D. The Balkan long-eared bat (Plecotus kolombatovici) occurs in Italy—First confirmed record and potential distribution. Mamm. Biol. 2019, 96, 61–67. [Google Scholar] [CrossRef]
- Garcia, N.; Alírio, J.; Silva, D.; Campos, J.C.; Duarte, L.; Arenas-Castro, S.; Pôças, I.; Sillero, N.; Teodoro, A.C. MontObEO, Montesinho biodiversity observatory: An Earth observation tool for biodiversity conservation. Proc. SPIE 2023, 12734, 335–345. [Google Scholar] [CrossRef]
- Duan, Y.; Wang, C.; Wan, G.; Du, Z.; He, Y.; Cai, G. Predicting the potential of Ammopiptanthus species in China under different climates using ecological niche models. Acta Ecol. Sin. 2020, 40, 7668–7680. [Google Scholar] [CrossRef]
- Lei, J.; Xu, H. MaxEnt-based prediction of potential distribution of Solidago canadensis in China. J. Ecol. Rural Environ. 2010, 26, 137–141. [Google Scholar]
- Zhang, H.; Zhao, H.; Wang, H. Potential geographical distribution of Populus euphratica in China under future climate change scenarios based on Maxent model. Acta Ecol. Sin. 2020, 40, 6552–6563. [Google Scholar]
- GBIF Occurrence Download. Available online: https://doi.org/10.15468/dl.6t6ynr (accessed on 8 September 2025).
- Pearson, R.G.; Raxworthy, C.J.; Nakamura, M.; Peterson, A.T. Predicting species distributions from small numbers of occurrence records: A test case using cryptic geckos in Madagascar. J. Biogeogr. 2007, 34, 102–117. [Google Scholar] [CrossRef]
- Zhang, F.; Xu, N.; Wu, F. Research on China’s CO2 emissions projections from 2020 to 2100 under the shared socioeconomic pathways. Acta Ecol. Sin. 2021, 41, 9691–9704. [Google Scholar] [CrossRef]
- Chen, Y.; Yu, F.; Guo, C.; Yang, G.; Zhang, W. Prediction and analysis of global potential suitable areas for Phyllostachys edulis based on MaxEnt ecological niche model. Acta Ecol. Sin. 2024, 22, 47–58. [Google Scholar]
- Yang, Z.; Chen, D.; Lu, S.; Zhou, P.; Wang, B. Evaluation of habitat suitability for Macaca thibetana in Hunan Mangsha national nature reserve based on MaxEnt model. Life Sci. Res. 2025, 29, 247–254, 264. [Google Scholar] [CrossRef]
- Wang, Y.; Xie, B.; Wan, F.; Xiao, Q.; Dai, L. Application of ROC curve analysis in evaluating the performance of alien species’ potential distribution models. Biodivers. Sci. 2007, 15, 365–372. [Google Scholar] [CrossRef]
- Jessica, B.S.; Christine, R.W.; Karen, V.R. Developing macrohabitat models for bats in parks using maxent and testing them with data collected by citizen scientists. Int. J. Biodivers. Conserv. 2014, 6, 171–183. [Google Scholar] [CrossRef]
- Araújo, M.B.; Pearson, R.G.; Thuiller, W.; Erhard, M. Validation of species–climate impact models under climate change. Glob. Change Biol. 2005, 11, 1504–1513. [Google Scholar] [CrossRef]
- Li, Y.; Zhang, X.; Fang, Y. Responses of the distribution pattern of Quercus chenii to climate change following the Last Glacial Maximum. Chin. J. Plant Ecol. 2016, 40, 1164–1178. [Google Scholar] [CrossRef]
- Yao, Z.; Han, Q.; Lin, B. Prediction of distribution area of main noxious and miscellaneous weeds in Xinjiang based on MaxEnt model. Acta Ecol. Sin. 2023, 43, 5096–5109. [Google Scholar] [CrossRef]
- Wang, D.; Zhao, W.; Chen, B.; Zhang, J. Potential Suitable Areas of Crataegus pinnatifida in China based on MaxEnt Modeling. Sci. Silvae Sin. 2022, 58, 43–50. [Google Scholar] [CrossRef]
- Khanum, R.; Mumtaz, A.S.; Kumar, S. Predicting impacts of climate change on medicinal asclepiads of Pakistan using maxent modeling. Acta Oecol. 2013, 49, 23–31. [Google Scholar] [CrossRef]
- Ye, P.; Zhang, G.; Zhao, X.; Chen, H.; Si, Q.; Wu, J. Potential geographical distribution and environmental explanations of rare and endangered plant species through combined modeling: A case study of northwest Yunnan, China. Ecol. Evol. 2021, 11, 13052–13067. [Google Scholar] [CrossRef] [PubMed]
- Zeng, J.; Li, C.; Liu, J.; Li, Y.; Hu, Z.; He, M.; Zhang, H.; Yan, H. Ecological assessment of current and future Pogostemon cablin benth. potential planting regions in China based on MaxEnt and ArcGIS models. J. Appl. Res. Med. Aromat. Plants 2021, 24, 100308. [Google Scholar] [CrossRef]
- Khodorova, N.V.; Boitel-Conti, M. The role of temperature in the growth and flowering of geophytes. Plants 2013, 2, 699–711. [Google Scholar] [CrossRef] [PubMed]
- Zhang, Y.; Su, D.; Wang, Y.; Zhen, C.; Su, X.; Liu, Y. The review of xerophyte plant Sophora alopecuroides. Chin. Wild Plant Resour. 2021, 40, 55–58. [Google Scholar]
Disclaimer/Publisher’s Note: The statements, opinions and data contained in all publications are solely those of the individual author(s) and contributor(s) and not of MDPI and/or the editor(s). MDPI and/or the editor(s) disclaim responsibility for any injury to people or property resulting from any ideas, methods, instructions or products referred to in the content. |
© 2025 by the authors. Licensee MDPI, Basel, Switzerland. This article is an open access article distributed under the terms and conditions of the Creative Commons Attribution (CC BY) license (https://creativecommons.org/licenses/by/4.0/).