Article

Improving Wind Environment in Low-Rise Residential Areas of Bangi-Dong, Seoul: Enhancing Natural Ventilation Performance Through CFD Simulation

Division of Architecture, Dankook University, Yongin 16890, Republic of Korea
*
Author to whom correspondence should be addressed.
Sustainability 2025, 17(18), 8472; https://doi.org/10.3390/su17188472
Submission received: 22 August 2025 / Revised: 10 September 2025 / Accepted: 16 September 2025 / Published: 21 September 2025

Abstract

This study addresses inadequate natural ventilation in low-rise residential areas of Bangi-dong, Seoul, where 46.2% of the area experiences wind stagnation below 0.3 m/s due to buildings being spaced less than 2 m apart. Using SimScale CFD with LBM and 13 million grids, multiple urban configurations were simulated to analyze how building orientation, spacing, and height affect pedestrian-level (1.5 m) wind flow. Results show that simple open space expansion yields minimal improvement (5–7%), while strategic interventions achieve significant effects. Connecting open spaces to main roads via 35 m × 45 m corridors increases wind speed by 20.4%, perpendicular building orientation with 12-story buildings improves wind speed by 166.67%, 6 m building spacing enhances ventilation (with a 57.80% improvement), and a continuous 12-story building arrangement along roads achieves a 59.73% improvement. While statistical validation requires future field measurements, the significant improvements (17–167%) demonstrate clear practical benefits. The study proposes four design guidelines: prioritize open space-road connectivity; orient buildings perpendicular to prevailing winds (WNW) with 6 m spacing; implement selective high-rise development (8–12 stories at ventilation nodes); and adopt incremental redevelopment strategies. These findings demonstrate that significant environmental improvements are achievable without costly total redevelopment, providing a replicable model for similar high-density, low-rise areas. The research contributes by establishing a quantitative framework for assessing low-speed wind stagnation zones, previously overlooked in wind environment standards.

1. Introduction

1.1. Background and Purpose

Low-rise residential areas in downtown Seoul were initially developed as low-density residential zones dominated by single-family houses. However, due to accelerated urbanization and continuous development pressure, many areas have become highly densified. In particular, the legalization of multi-family housing in 1985 and multi-household housing in 1989 accelerated the transformation of housing types, with single-family houses of 1–2 floors being redeveloped into 3–5 floor buildings on a plot-by-plot basis. The simple increase in development density without expanding social infrastructure such as streets and parks has deteriorated the sunlight and ventilation performance of low-rise residential areas, becoming a major cause of degradation in residential and urban environmental quality. In particular, the increase in development density significantly affects the comfort of outdoor spaces and natural ventilation performance, with the wind environment acting as an important variable in the urban microclimate [1,2].
Smooth airflow in outdoor spaces is essential for dispersing pollutants, reducing air temperature, and improving indoor ventilation performance [3]. However, as high-rise buildings increase, excessive wind speeds around buildings cause problems for pedestrian and outdoor space activities [4]. In response, Korea mandated wind environment assessment for high-rise and large-scale buildings through the 2021 Building Act Revision [5]. However, these policies and research mainly focus on high-rise buildings, with relatively insufficient approaches from urban design and architectural planning perspectives to solving wind environment changes at pedestrian level in low-rise urban fabric.
Wind environment problems in densely developed low-rise residential areas cause various negative impacts including pollutant accumulation, deterioration of street comfort, and reduced ventilation efficiency. These problems worsen the overall environmental quality, requiring systematic countermeasures. Therefore, this study aims to go beyond existing high-rise building-centered wind environment improvement measures to analyze the pedestrian-level wind environment in the relatively under-researched low-rise urban fabric and present practical urban planning measures for improving ventilation performance.

1.2. Scope and Method

This study first examined the Gangnam area of Seoul, where urban structure is standardized and planned development has taken place, as the research target area. To minimize variables due to topographic elevation differences, the Bangi-dong area in Songpa-gu, which has flat terrain, was selected as the research area. Since high-density low-rise residential areas have difficulty naturally forming wind corridors and frequently experience problems related to wind stagnation, this study focused on developing and verifying wind environment improvement measures. For wind environment simulation, SimScale LBM, a cloud computing-based CFD, was used.
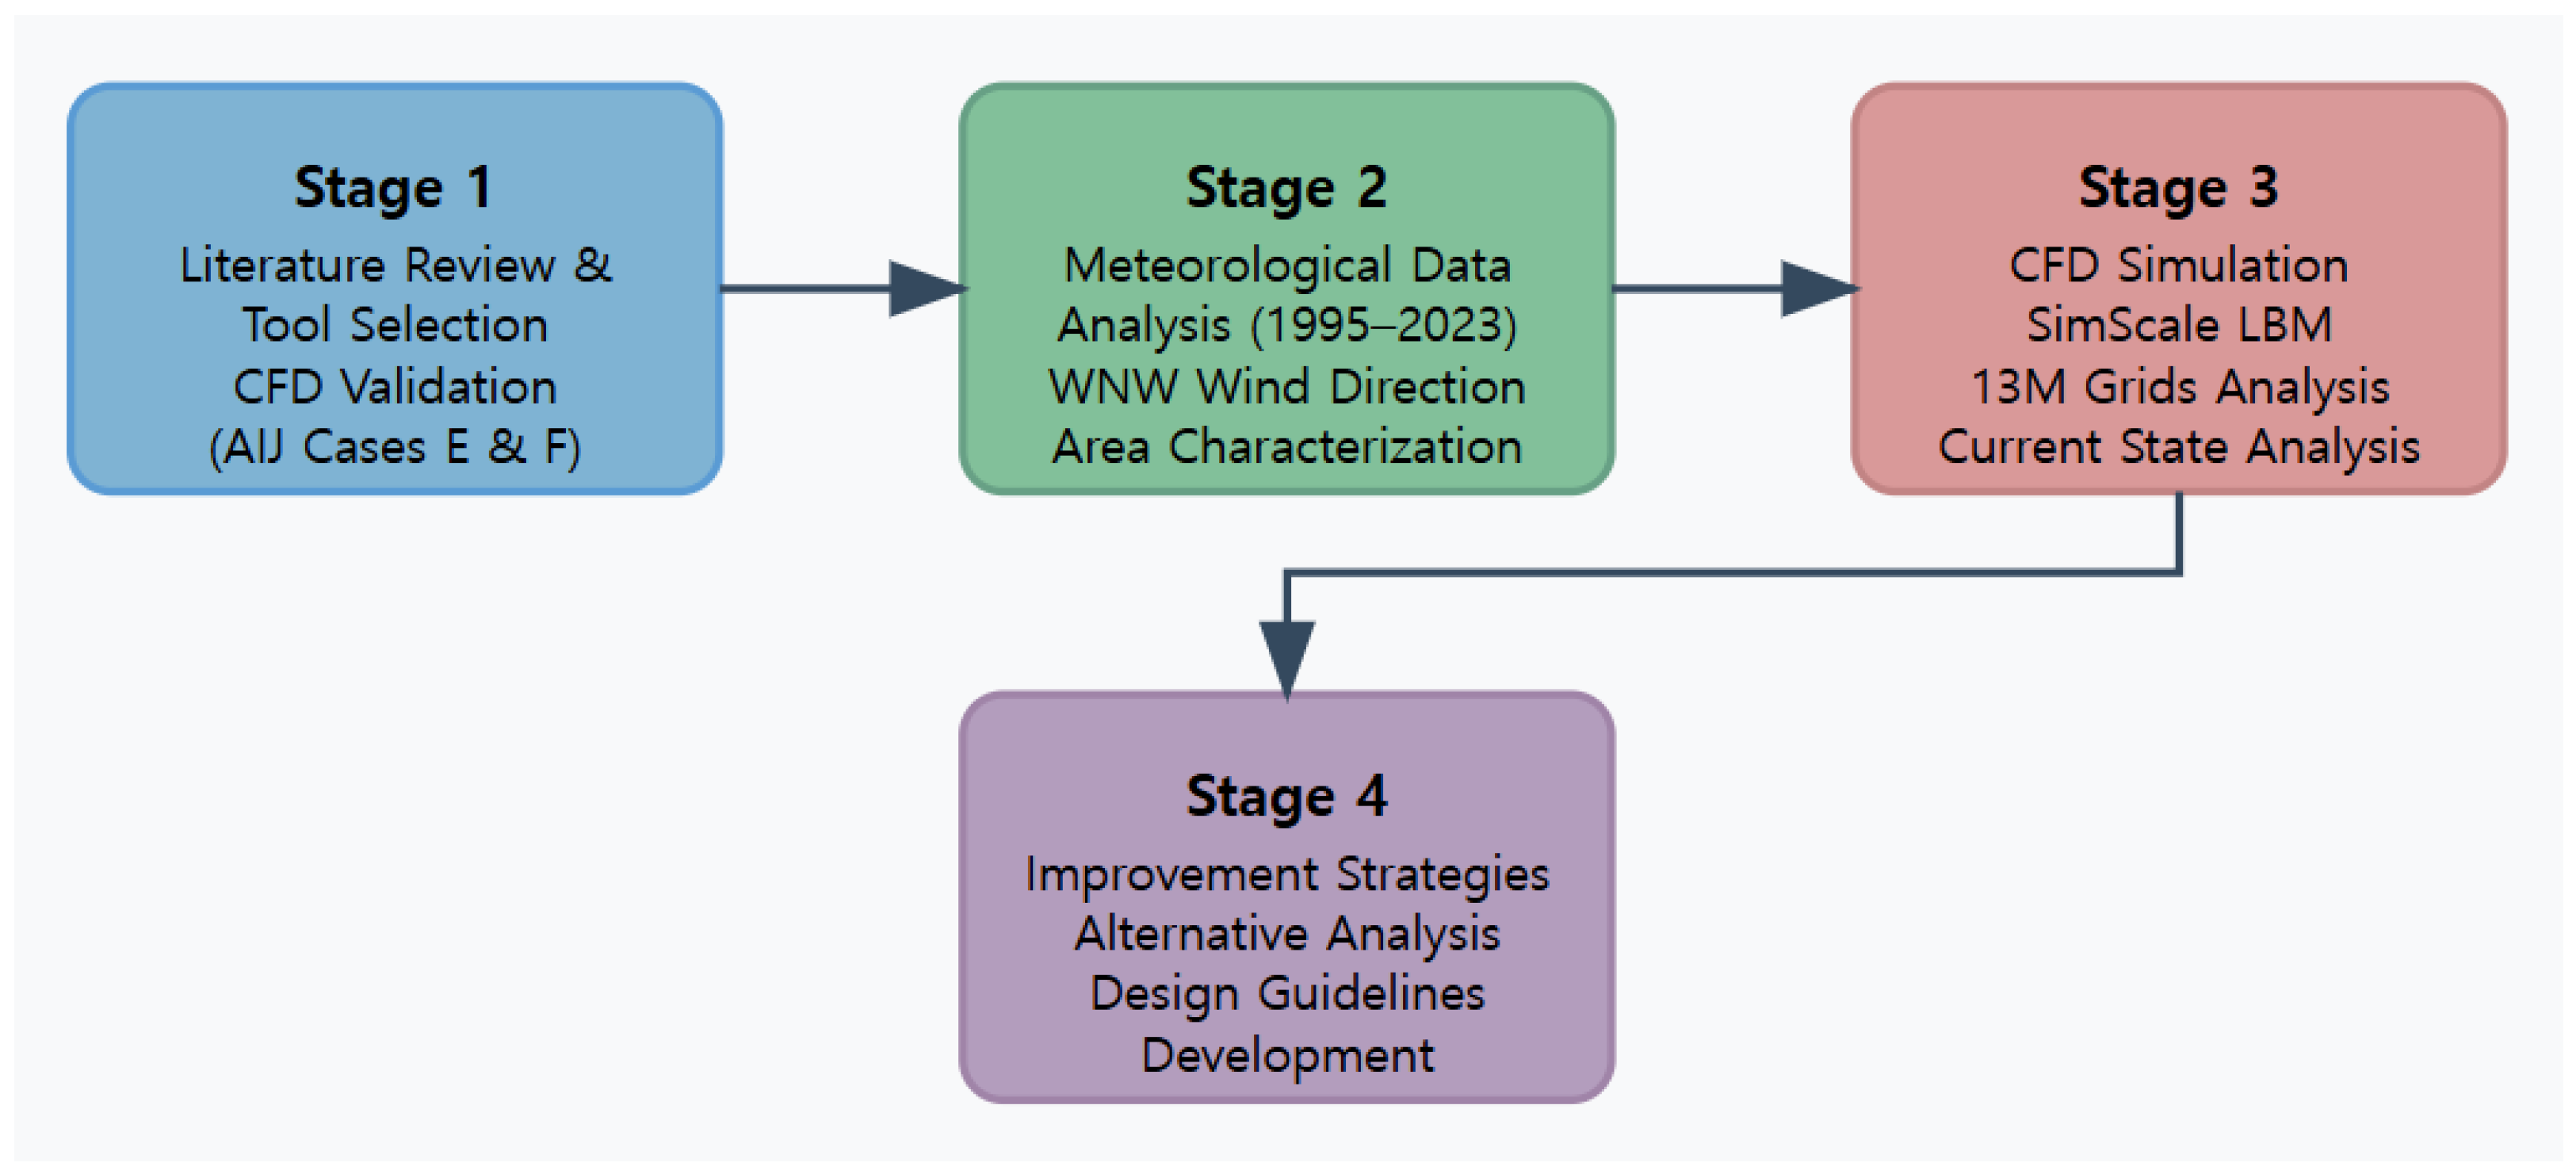
As shown in Figure 1, In the first stage of the research, previous studies related to pedestrian-level wind environment research were reviewed, and simulation tools for wind environment analysis were selected and their validity was verified. In the second stage, derivations of 1-h average wind speeds by wind direction based on climate data from the past 30 years and derivation of wind exposure for the research area were performed. Subsequently, the urban architectural characteristics of the research area were identified and wind environment analysis was conducted for the area of interest. In the final stage of the research, alternatives for improving the wind environment were examined, and based on this, an improvement model for low-rise residential areas was proposed.

2. Literature Review and Pedestrian Wind Environment Criteria

2.1. Implications from Previous Studies

Existing studies have mainly focused on wind environment problems around high-rise buildings and wind reduction measures in pedestrian spaces, with extensive research using wind tunnel experiments and CFD simulations, but there has been limited attention to low-rise dense residential areas. Kim et al. (2008) [6] analyzed wind environment problems occurring in pedestrian passages in Seoul and confirmed the wind speed reduction effect after installing windbreak walls, suggesting that design approaches at the pedestrian level are effective. Zheng et al. (2016) [7] analyzed—through CFD simulation and wind tunnel experiments—the possibility that outdoor platforms of high-rise buildings could cause adverse wind environments, emphasizing the need to consider pedestrian environments during design.
Meanwhile, studies have also examined the effects of urban fabric changes such as superblocks on ventilation performance. Maing (2022) [8] revealed through CFD analysis using SimScale and field measurements that while high-density development exacerbates urban heat islands and air pollution, open spaces within superblocks can contribute to improving internal ventilation and wind environment. The main contents of the above-mentioned studies are summarized in Table 1.
However, existing studies have concentrated on analyzing the effects of high-rise buildings and large-scale urban fabric changes on wind environment and ventilation, representing a significant research gap in understanding wind speed stagnation and ventilation deterioration problems specific to low-rise high-density residential areas. While high-rise building studies provide valuable insights, the unique characteristics of low-rise dense urban fabric—including smaller building heights, narrow spacing, and different flow patterns—require dedicated investigation of this issue, which existing literature has insufficiently addressed. This study aims to apply the ventilation effects of open spaces presented in Maing’s (2022) [8] research to low-rise high-density residential areas, analyzing and evaluating the impact of securing green spaces on wind environment improvement.
Therefore, this study specifically targets the under-researched domain of low-rise urban fabric to quantitatively analyze the pedestrian-level wind environment and present practical urban planning measures for improving urban heat islands and ventilation problems. The research results are expected to provide practical direction not only for environmental improvement of low-rise residential areas but also for urban redevelopment and dense area management.

2.2. Wind Environment Evaluation Criteria

Since pedestrian wind environment in urban settings significantly affects comfort and safety, it is evaluated quantitatively using various criteria. Wind environment evaluation criteria are established considering pedestrian activity types and wind speed conditions, with representative examples including NEN 8100 [9], the Lawson criteria, and the Ministry of Land, Infrastructure and Transport’s pedestrian behavior grade. These criteria are used as basic data for urban design and architectural planning to ensure pedestrian comfort and safety.

2.2.1. NEN 8100

As shown in the Table 2, the NEN 8100 standard, established in the Netherlands, provides guidelines for evaluating discomfort and danger caused by wind in built environments. It evaluates the wind environment and assigns one of comfort levels (Grade A~E) based on the frequency of hourly average wind speeds exceeding 5 m/s for different pedestrian activity types [9]. Pedestrian activities are classified into three categories: Good, Moderate, and Poor, corresponding to traversing, strolling, and sitting activities [10]. For example, if the probability of wind speed exceeding 5 m/s is less than 2.5%, it is evaluated as Grade A (excellent), and if it exceeds 20%, it is classified as Grade E (uncomfortable).

2.2.2. Lawson Wind Comfort Criteria

As shown in the Table 3, the Lawson criteria specify the upper limit of wind speed measured at pedestrian height (1.5~1.75 m) at a given location and evaluates the wind environment based on the probability of exceeding this threshold. The standard is classified into five categories (A~E), each defining acceptable wind speed ranges according to different pedestrian activities [11].
Grade A: Suitable for long-term sitting (less than 1.8 m/s)
Grade B: Suitable for short-term sitting (less than 3.6 m/s)
Grade C: Suitable for leisurely walking (less than 5.3 m/s)
Grade D: Suitable for fast walking (less than 7.6 m/s)
Grade E: Uncomfortable environment (exceeding 7.6 m/s)

2.2.3. Lawson LDDC and Lawson 2001

As shown in the Table 4, the Lawson LDDC criteria establish five grades A~E based on the probability of wind speeds appearing less than 5%, additionally assigning an ‘Unsafe(S)’ grade when the probability of wind speeds exceeding 15 m/s is above 0.022%. As shown in the Table 5, the Lawson 2001 [11] criteria expanded this by adding S15 (above 15 m/s, dangerous for vulnerable groups) and S20 (above 20 m/s, dangerous for all pedestrians) stages, constructing a 7-stage evaluation system [12].

2.2.4. Ministry of Land, Infrastructure and Transport Pedestrian Behavior Grade

As shown in the Table 6, The Ministry of Land, Infrastructure and Transport’s Building Wind Reduction Guidelines [13] classify pedestrian activity levels into five grades A~E considering pedestrian safety. The evaluation criteria are based on the probability of exceeding the hourly average wind speed from the previous 5 years at meteorological stations. Grade E means wind speeds exceeding 15 m/s hourly average, requiring safety measures. This is similar to NEN 8100, with activity ranges for each grade defined accordingly.

2.3. Evaluation Criteria for Wind Speed Stagnation and Ventilation Performance at Pedestrian Level

Wind environment comfort criteria such as Lawson and NEN 8100 were established based on Beaufort in 1978, mainly presenting evaluation criteria for high-speed sections, but clear criteria for low-speed stagnation sections have not been presented. In particular, the Lawson criteria consider wind speeds below 2.5 m/s as comfortable for sitting in open spaces, but no detailed subdivisions below this are established [8].
This study applies the pedestrian-level natural ventilation evaluation criteria used in Hong Kong’s high-density urban environment to more systematically analyze wind speed stagnation problems in low-rise high-density residential areas. These criteria have been used to evaluate ventilation conditions according to changes in open area and building density in Hong Kong from the 1980s to the 2020s [8], serving as useful indicators for quantitatively analyzing urban ventilation performance. Therefore, this study applies these to evaluate the effects of street width, green spaces, and building height differences on mitigating wind speed stagnation problems in low-rise dense areas, focusing on deriving measures to improve comfort and ventilation performance at pedestrian level. Table 7 shows Hong Kong’s pedestrian-level stagnation zone classification criteria, which were used as reference indicators for evaluating ventilation performance in low-rise high-density residential areas in this study.

2.4. Surface Roughness Criteria

Wind flow in urban environments is greatly influenced by topographical conditions and building arrangements. Accordingly, the Building Design Load standard (KDS 41 12 00:2022) [14] classifies surface roughness into four grades A~D to quantitatively evaluate wind flow (Table 8). These criteria are established by comprehensively considering various environmental factors such as soil conditions, building density, and the distribution of green spaces and parks, serving as basic data for improving ventilation performance and wind environment in cities.

3. Basic Analysis of the Study Area

3.1. Current Status of the Study Area

As shown in Figure 2, the Jamsil area in Songpa-gu, where the target site is located, was developed through large-scale urban planning from the late 1970s to the 1980s, showing a mixed form of grid road network and radial street system centered around Seokchon Lake and Jamsil Station. This is the result of a planned approach to build an efficient transportation network centered on major urban points while partially reflecting existing natural topography. In particular, high-rise apartment complexes are concentrated along the Han River, with medium and low-rise residential areas formed toward the rear. This arrangement follows urban planning strategies to maximize Han River views and arrange residential functions in stages.
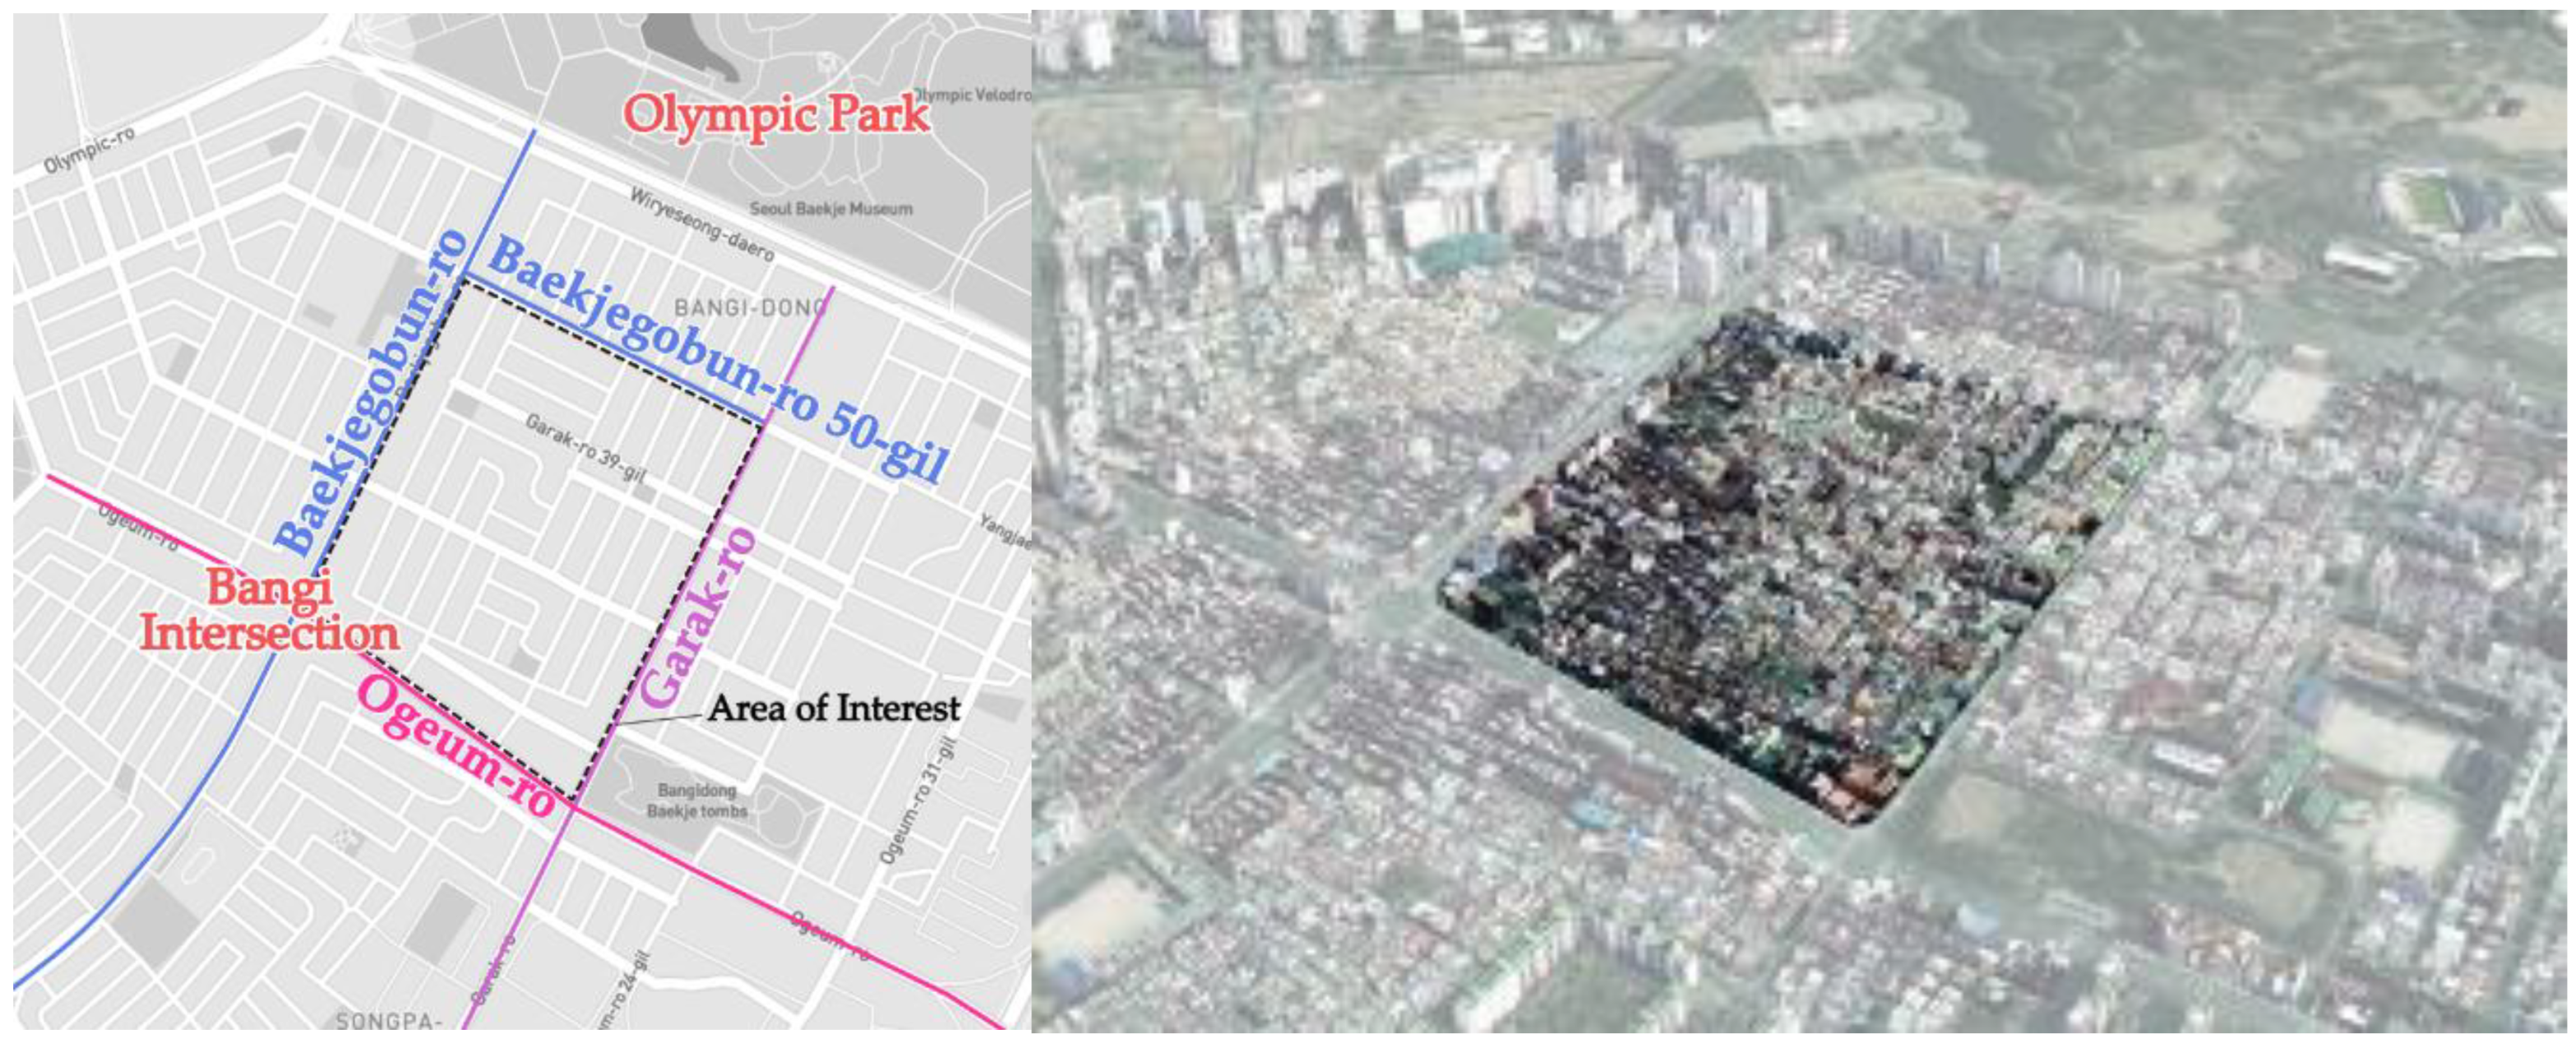
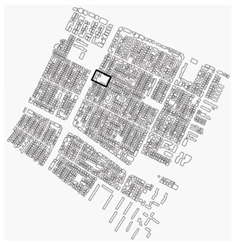
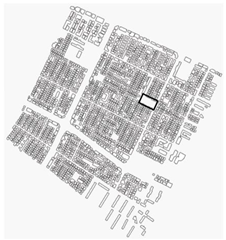
As shown in Figure 3, the study area is a Type 2 General Residential Area located in Bangi-dong, Songpa-gu, Seoul, bounded by Baekjegobun-ro 50-gil to the northeast, Garak-ro to the southeast, Ogeum-ro to the southwest, and Baekjegobun-ro to the northwest. It is dominated by low-rise buildings on a plot basis, covering an area of approximately 0.3 km2. Buildings in the area are mainly formed as 2~5 floor low-rise residential areas, with some plots having buildings of seven floors or more. The tallest building in the area is a 12-floor slab-type apartment, which acts as an element affecting the regional skyline in contrast to surrounding low-rise residential areas.
On the west side of the site, an approximately 35 m wide 8-lane road passes through, with some commercial functions distributed along it. Main streets have a mix of low-rise commercial buildings and residential facilities, with dense low-rise residential areas formed when entering inner blocks.
The building coverage ratio and floor area ratio within the site comply with the legal standards for Type 2 General Residential Areas. The legal building coverage ratio for this area is regulated at 60% and the floor area ratio at 200%, though some plots exceed current standards as they were built before the building use classification and apply standards from when their building permits were issued. This reflects differences in individual plot development characteristics according to changes in urban planning and regulations.

3.2. Characteristics of the Study Area

3.2.1. Street System, Block Structure, and Plot Size

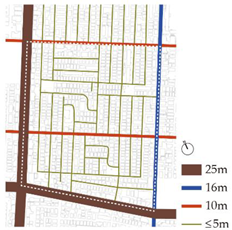
The main road system of the site is divided into auxiliary arterial roads and collector roads. The auxiliary arterial roads are Baekjegobun-ro and Ogeum-ro with a width of 25 m, intersecting at Bangi Intersection located west of the site. Both roads are seven lanes in both directions, but Baekjegobun-ro temporarily expands to eight lanes in some U-turn sections.
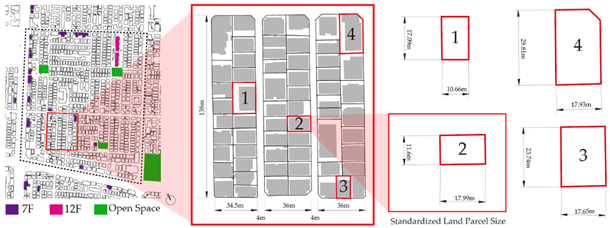
Collector roads have widths of 10 m to 16 m, performing the role of connecting major intersections and blocks within the site. Meanwhile, access to individual plots is through mixed pedestrian-vehicle roads of 5 m width or less. The standard plot size is approximately 12 m × 18 m, though some plots have been divided or merged.
Regarding spacing between individual buildings within the site, approximately 5~8 m is maintained between buildings on opposite sides of roads, secured for vehicle and pedestrian movement. Side and rear spacing between individual buildings is very narrow at approximately 2 m. Such narrow spacing is likely to negatively affect ventilation and sunlight environments, and in dense residential environments, it also creates constraints on pedestrian and vehicle access routes. In particular, the narrower the distance between buildings, the poorer the air circulation, which can affect indoor air quality and external microclimate environments.

3.2.2. Green Spaces and External Spaces

Olympic Park located northeast of the study area and provides extensive green space, but there is a lack of green spaces or external spaces on individual plot units within the study area. Green spaces within the site are unevenly distributed and insufficient, as shown in the Open Space in Table 9. Some street trees are planted along major roads, but continuity of green spaces is not secured due to road width and vehicle traffic impacts. Additionally, the narrow margin between houses and roads limits the utilization of green spaces around individual houses. This situation can affect the microclimate environment of the site.

3.2.3. Building Use, Type, and Number of Floors

Buildings within the study area mostly consist of low-rise residential areas, with some commercial facilities mixed along major roads. Building uses are mainly single-family houses, multi-family houses, and multi-household houses, with most having 2~5 floors. Some buildings of seven floors or more are distributed along the major arterial roads, and the 12-floor apartment located northeast of the study area acts as an element affecting the area’s skyline. These high-rise buildings form a contrasting landscape with surrounding low-rise residential areas and may affect density increase and sunlight rights within the area (Table 10). Individual plot units have buildings arranged with high adjacency to roads, with building spacing becoming narrower when entering inner blocks.

4. Simulation Conditions and Criteria

CFD (Computational Fluid Dynamics) analysis for urban wind environment analysis can vary greatly depending on set modeling conditions and analysis methods. This study conducted simulations referring to criteria presented in the wind environment evaluation guidelines using CFD analysis techniques from the Korea Institute of Construction Technology [5]. These guidelines provide standard analysis techniques for evaluating the pedestrian-level wind environment in urban environments, presenting general CFD analysis criteria including elements such as computational domain setting, boundary condition application, turbulence model selection, and computational grid configuration. This study secured CFD analysis reliability based on these guidelines and performed optimal modeling reflecting the characteristics of the study area.

4.1. Derivation of Wind Speed by Direction

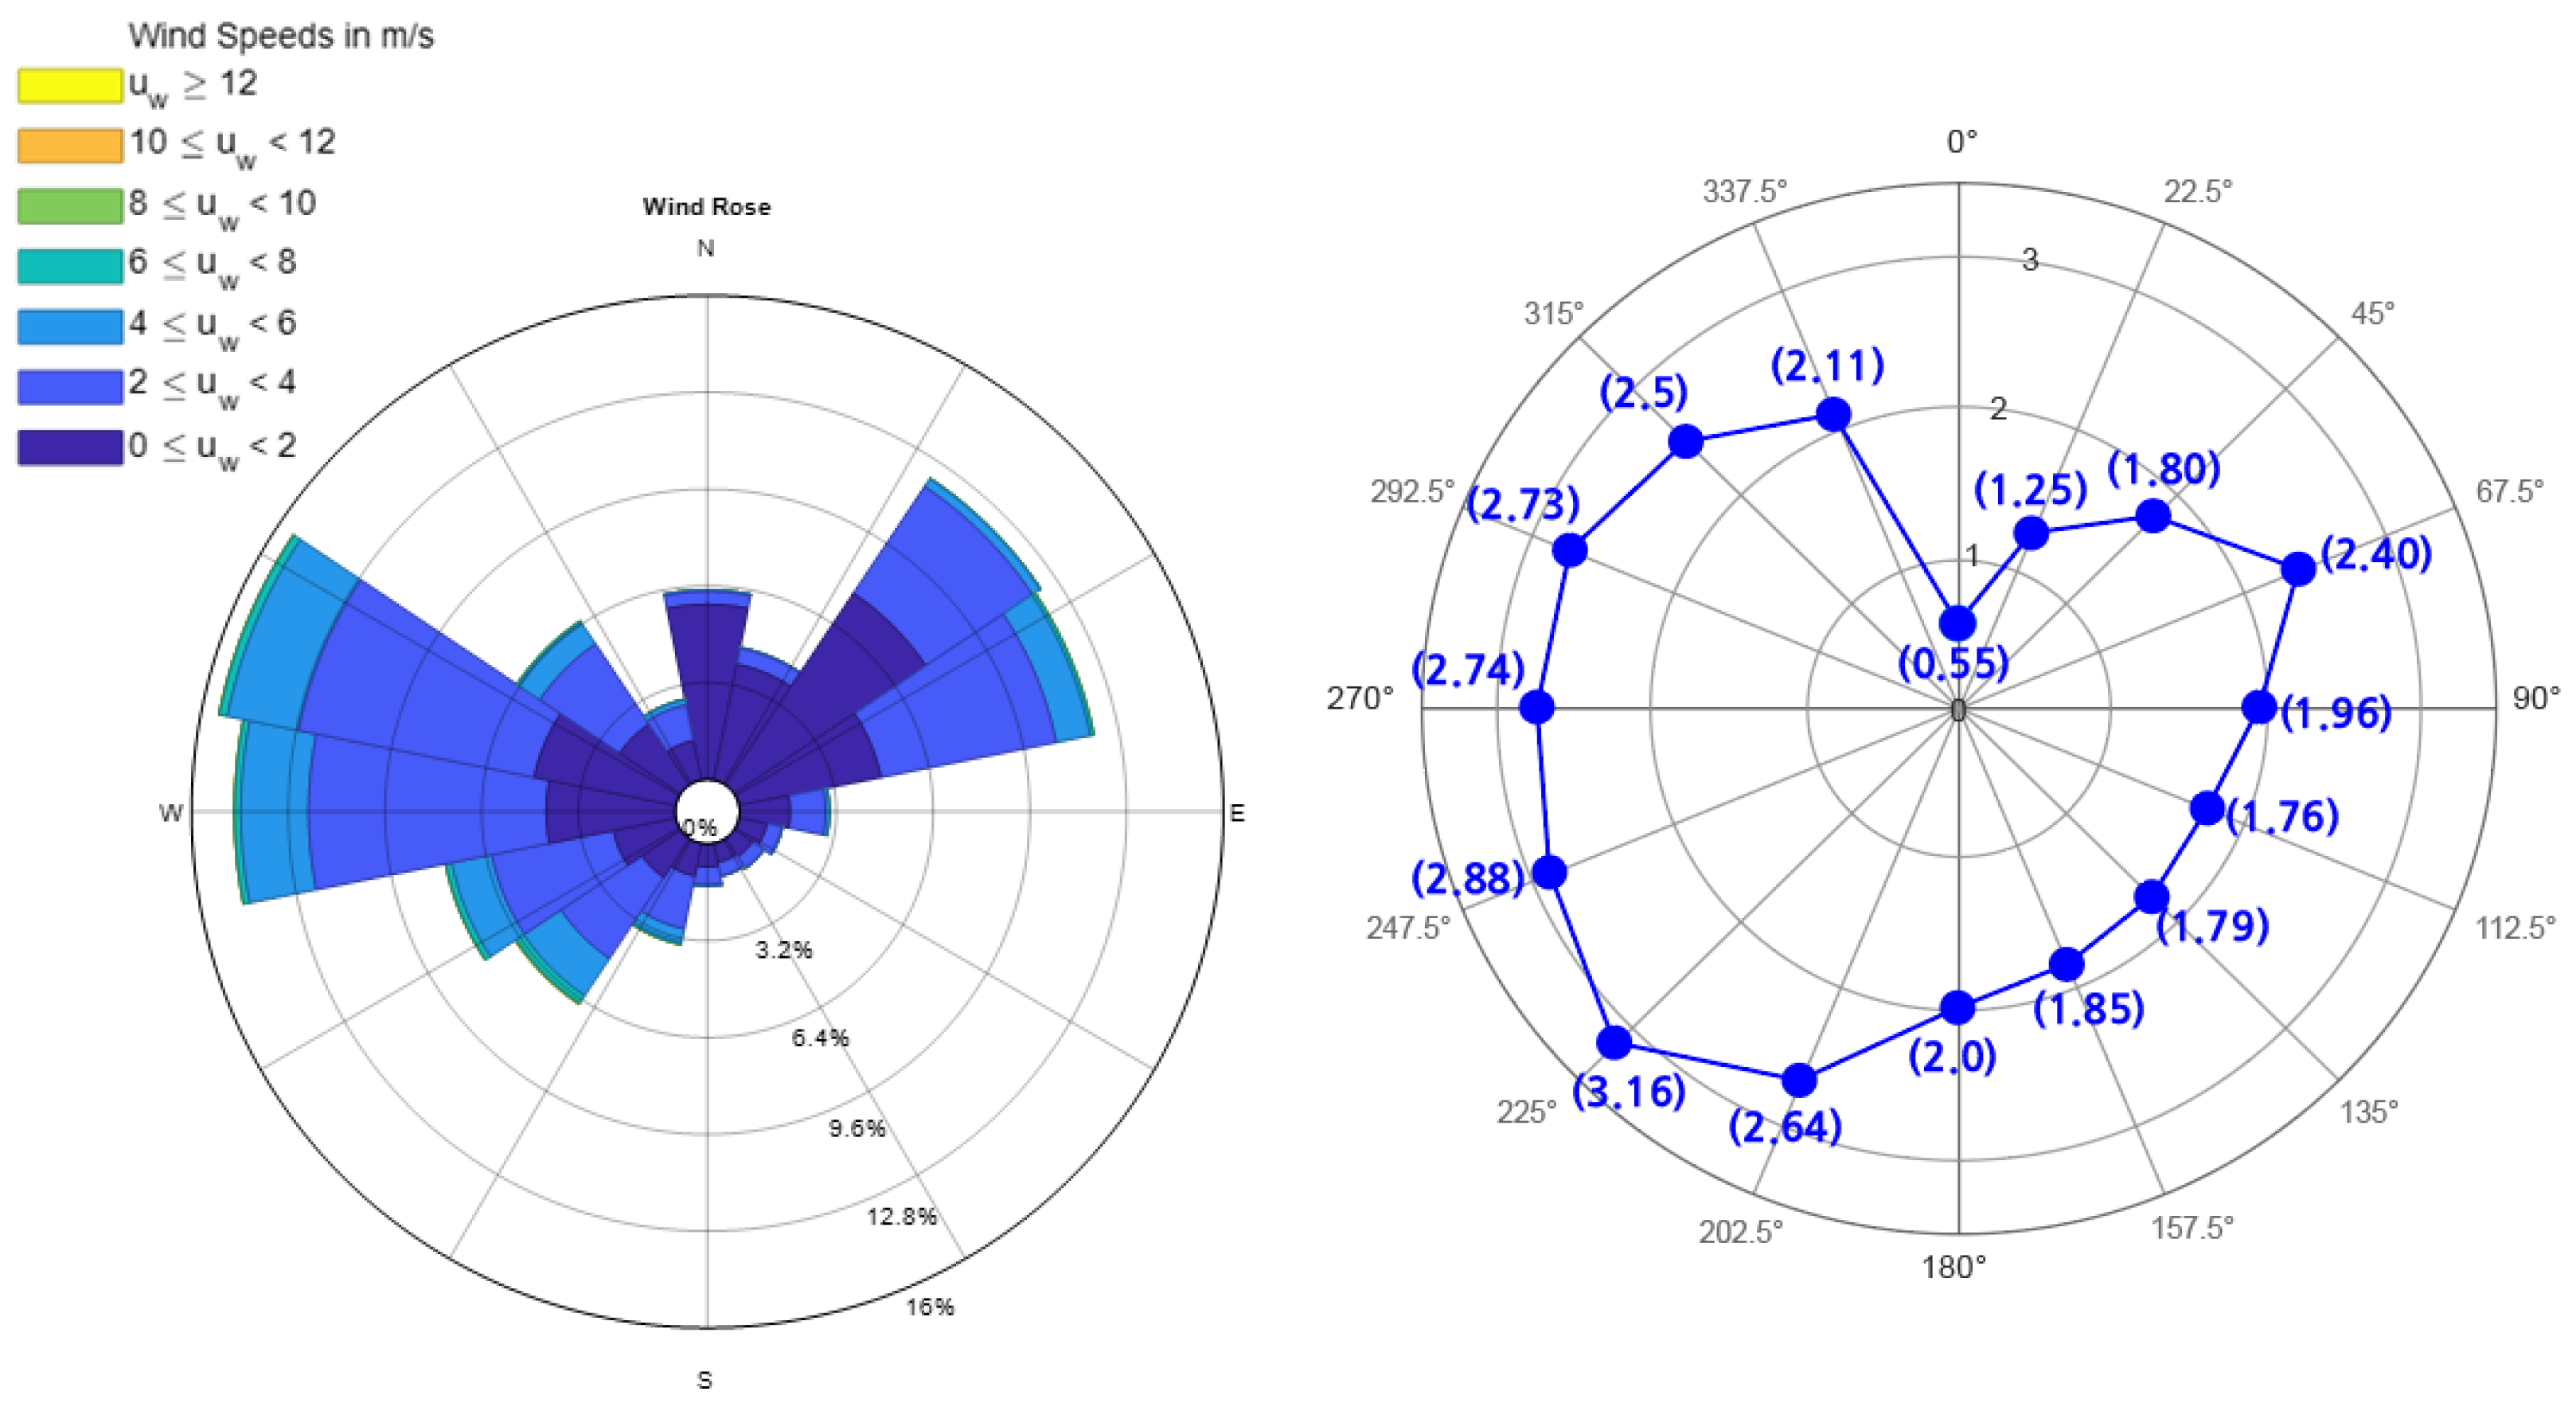
For the wind environment analysis of the study area, 28 years (1995~2023) of wind speed and direction data from the Seoul Meteorological Administration (ASOS) were utilized. As shown in Figure 4, the data analysis results showed that the wind direction with the highest occurrence frequency in the study area was WNW (292.5°), and this study set this direction as the representative wind direction for the CFD simulation.

4.2. Surface Roughness Calculation

To accurately reproduce air flow in the CFD simulation, it is important to appropriately set the surface roughness (Roughness Length). In this study, surface characteristics within a 1 km radius of the research area were analyzed and classified into grades A–C. Areas with dense high-rise buildings were set as surface roughness A, low-rise residential areas in the city center as surface roughness B, and open spaces such as Olympic Park as roughness C. As shown in Table 11, the representative wind direction of 292.5° (WNW) was simulated with grade A roughness applied.

4.3. CFD Modeling Area and Wind Tunnel Settings

The CFD model was constructed including not only the area of interest but also the surrounding environment (Context area). As shown in Figure 5, modeling was performed including 3 times the height (H) of the tallest building in the study area or a minimum 300 m radius, and the wind tunnel size was set to inlet 5H, outlet 15H, sides 5H, and top 5H to ensure CFD analysis stability.

4.4. Boundary Conditions and Flow Characteristics Setting

4.4.1. Domain

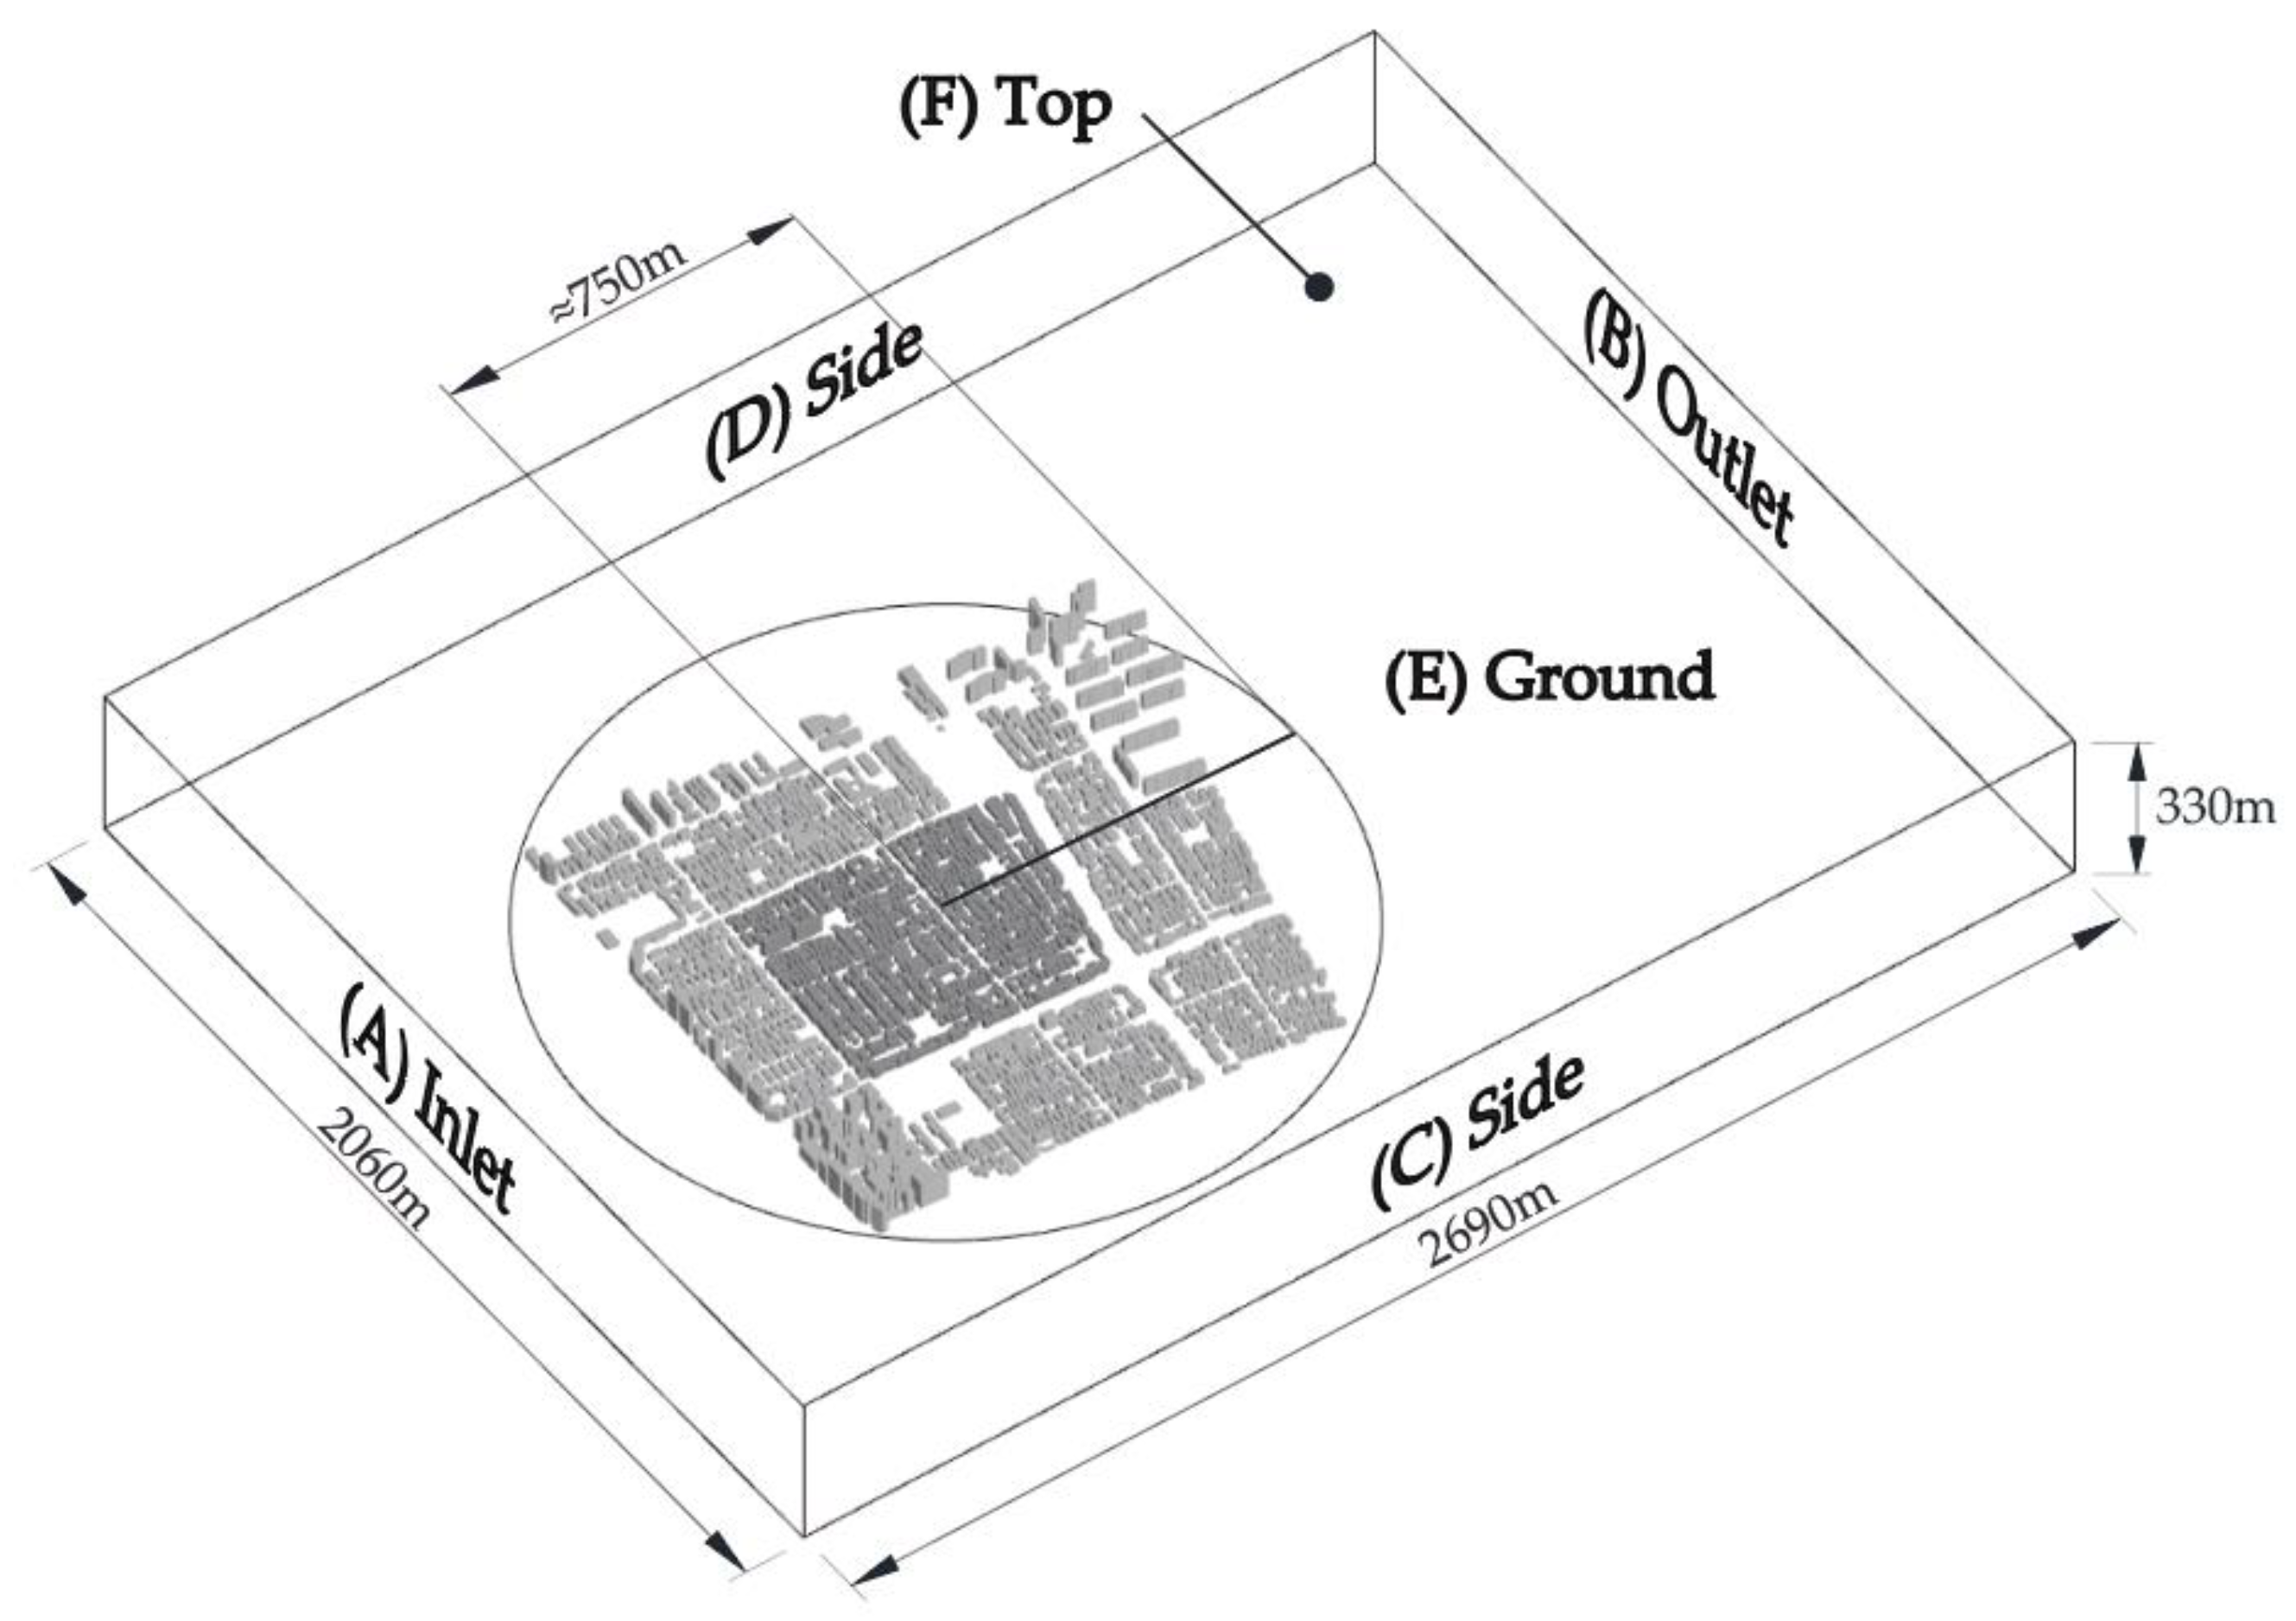
The tallest building in the modeling, including the area of interest and Context area, was 21 floors (63 m), with the total modeling radius set at approximately 750 m (Figure 6). According to guidelines [5], the separation distances for the inlet, left and right sides, height, and outlet were calculated based on maximum building height. The inlet and left/right sides’ height was set as ‘63 m × 5 = 315 m’, and the outlet separation distance was set as ‘63 m × 15 = 945 m’. These separation distance values were added to the total modeling radius to determine the wind tunnel size, thereby meeting the minimum wind tunnel size criteria presented in the guidelines.
Figure 6. Wind Tunnel CFD Computational domain size for a Low-rise Residential Area. Boundary conditions: A-Inlet, B-Outlet, C,D-Side walls, E-Ground, F-Top surface (refer to Table 12 and Table 13 for detailed specifications).
Sustainability 17 08472 g006
Table 12. Computational Domain and Wind Tunnel Dimensions Based on the Highest Building Height.
LegendInput Data
Modeling ConditionRadius≈750 m
Maximum Building Height63 m
Separation DistanceInlet/Left Side/Right Side≥315 m
Outlet≥945 m
Height≥315 m
Wind Tunnel DomainWidth2060 m
Length2690 m
Height330 m
The SimScale LBM simulation utilized approximately 13 million computational cells with a corresponding 14.2 million vertices (nodes). The mesh density varied from 1-m resolution in the central analysis area to 3–5 m in peripheral regions, ensuring adequate capture of building-scale flow phenomena while maintaining computational efficiency. This mesh configuration provides sufficient detail for analyzing pedestrian-level wind patterns while remaining computationally feasible for parametric studies involving multiple design scenarios.

4.4.2. Setting

Physical environment and boundary conditions were set to ensure CFD simulation accuracy. The fluid used was air, applying the Newtonian viscosity model with kinematic viscosity set at 0.00001529 m2/s. The atmospheric boundary layer inlet conditions applied were: reference velocity 2.73 m/s, reference height 10 m, and ground roughness 1 m to reflect the urban environment.
Boundary conditions were set in compliance with guidelines. The pressure outlet allowed natural outflow, and Slip conditions were applied to external domain side boundaries to minimize impact on air flow. No-slip conditions were applied to the ground boundary, considering terrain effects by reflecting aerodynamic surface roughness. Additionally, Slip conditions were applied to the top boundary surface to allow free air flow. Detailed information on the boundary conditions is presented in Table 13.

4.5. Validation of SimScale CFD Model

To ensure the reliability of SimScale CFD simulations, validation was performed by comparing our wind tunnel experiments and field measurement data using the benchmark cases (AIJ Case E and Case F) from the Architectural Institute of Japan’s Guidebook for Practical Applications of CFD to Pedestrian Wind Environment around Buildings (2008) [15]. However, a significant limitation of this study is the absence of field measurements from the actual study area for direct validation.
Case 1: AIJ Case E AIJ Case E is a validation case that compares SimScale results with AIJ wind tunnel experimental data using a simplified model of complex urban buildings. The experimental results showed that the Pearson correlation coefficients between SimScale CFD and wind tunnel results ranged from 0.70 to 0.86, indicating high agreement. Additionally, a SimScale LBM simulation demonstrated reduced computation time (from 2–3 days to 10 h) compared to conventional CFD (OpenFOAM V12® etc.), enabling real-time analysis.
Case 2: AIJ Case F AIJ Case F is a validation case for evaluating the pedestrian-level wind environment in urban settings, comparing SimScale’s relative wind speed prediction accuracy with field measurement data and wind tunnel experimental results. The experimental results revealed that the correlation coefficient between SimScale and field measurements (R2 = 0.6008) showed higher agreement than that between wind tunnel and field measurements (R2 = 0.43), confirming reliable results in experimental conditions. Furthermore, utilizing automatic mesh settings, the difference between very fine mesh and moderate mesh results was minimal, confirming that efficient simulation is possible by selecting an appropriate mesh for analysis purposes.
In conclusion, through validation with AIJ Cases E and F, our SimScale CFD simulations demonstrated high correlation with both wind tunnel experiments and field measurement data, with improved computational speed and practicality compared to conventional CFD methods. Detailed validation results and graphical comparisons can be found in SimScale’s validation documentation [16,17]. While the SimScale LBM solver demonstrates reliable performance in benchmark cases with correlation coefficients of R2 = 0.70–0.86, the lack of site-specific field measurements represents a crucial limitation that affects the absolute accuracy validation of results in this particular urban context. Previous studies have shown that uncertainty ranges in urban CFD simulations typically fall within ±5–10% for mean wind speeds [18,19], which serves as a benchmark for evaluating the significance of results in this study. Future research should prioritize field measurement campaigns to validate CFD predictions in the specific study area and confirm the practical applicability of any proposed design guidelines.

5. Pedestrian Level Wind Environment Analysis

5.1. Analysis of Pedestrian Level Wind Speed Distribution Based on WNW Wind Direction

Wind speed at the pedestrian level is greatly influenced by the building arrangement, road network structure, spacing, and the presence of open spaces. This study quantitatively analyzed wind speed distribution at pedestrian height (1.5 m) for the low-rise residential area in Bangi-dong, Songpa-gu, based on the representative wind direction (WNW) (292.5°). The simulation utilized SimScale’s LBM (Lattice Boltzmann Method) based CFD model, applying fixed grids of 1 m or less in the central area and irregular grids of 3~5 m in peripheral areas. The total number of grids exceeded approximately 13 million, securing a resolution capable of reproducing fine flows in urban microclimates. The representative wind speed was set at an average of 2.73 m/s based on long-term meteorological data from Seoul Meteorological Administration ASOS from 1995 to 2023, and simulation inlet conditions were configured accordingly.
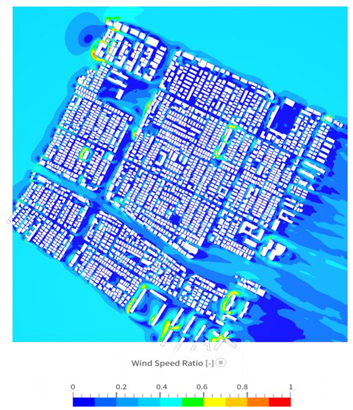
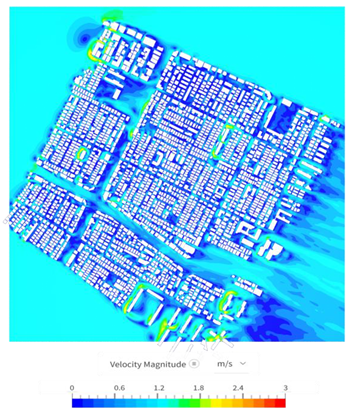
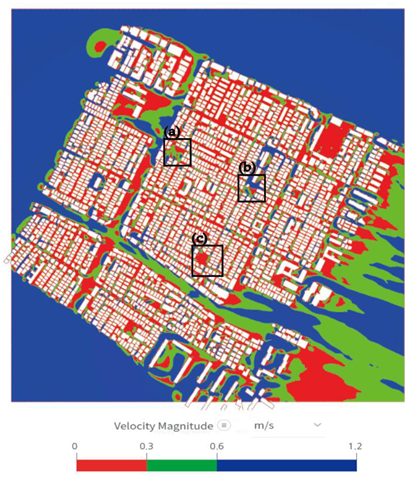
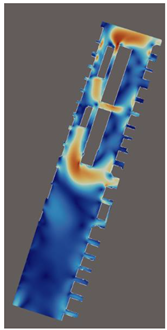
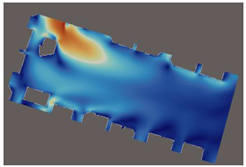
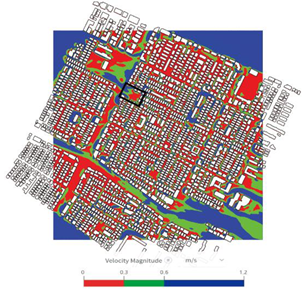
As shown in the simulation results in Table 14, average wind speeds at the pedestrian level generally concentrated in the 0.6~1.2 m/s range, with wind speeds above 1.8 m/s maintained only to a limited degree in sections with wide and continuous street axes like arterial roads. Particularly, areas where wind speed locally exceeded 2.0 m/s appeared in parts of the southern Ogeum-ro area and northeastern arterial roads, but this accounted for less than 5% of the total simulation area. In most low-rise residential interiors, alleys, and narrow spacing areas, wind speeds decreased to below 0.3~0.6 m/s, showing clear wind speed stagnation phenomena.
In arterial road sections (Baekjegobun-ro, Ogeum-ro, Garak-ro), the wide road width and uniform height and arrangement of buildings on both sides did not obstruct wind linearity, maintaining wind speeds at 1.5–2.0 m/s levels close to simulation inflow values. In contrast, wind speeds rapidly attenuated when entering secondary and back roads, with alleys less than 5 m wide and dense blocks with building separation distances of less than 2 m showing wind speeds below 0.3 m/s, confirmed as stagnation areas.
Open spaces (including green areas) located in the northeast and central areas showed relatively bright tones (0.8~1.2 m/s) but could not function as practical wind corridors due to surrounding buildings, with some sections connected to stagnation areas. These results suggest that wind inlet and diffusion paths in low-rise high-density residential areas are determined by spatial composition, with securing wind paths and spatial openness being key factors for wind environment improvement.

5.2. Exploration of Causes for Stagnation Zone Formation

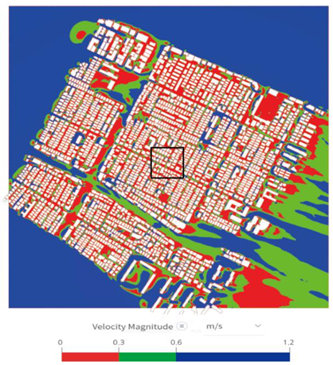
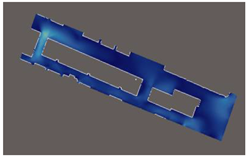
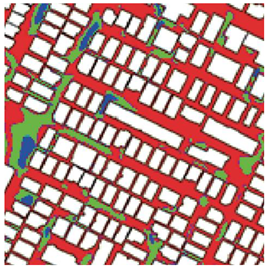
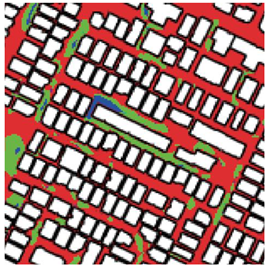
Stagnation zones at pedestrian level refer to spaces where air flow is extremely limited with wind speeds maintained below 0.3 m/s. This study defined spaces with wind speeds below 0.3 m/s as stagnation areas through binary processing of simulation results (as shown in Table 15) and analyzed the area ratio relative to the total area. Analysis results showed that stagnation areas accounted for approximately 46.2% of the total simulation area.

5.2.1. Narrow Spacing Between Buildings

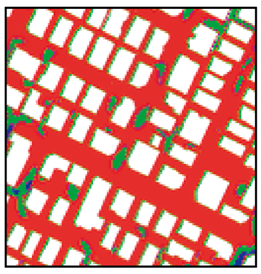
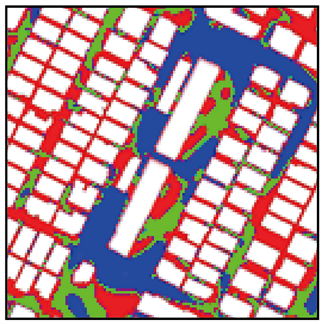
Most plots within the site have very narrow building spacing of 2 m or less, forming closed block structures disconnected from the outside. In particular, alleys less than 5 m wide and dead-end alleys physically block wind inlet, with simulation results showing wind speeds mostly measured at 0.2~0.4 m/s as shown in Table 16. These spaces are observed as red blocks in the simulation, with over 70% of total stagnation area occurring in such structures. From an urban design perspective, this type of road network can be considered vulnerable to the wind environment.

5.2.2. Wind Shadow Occurrence Due to Building Height Differences

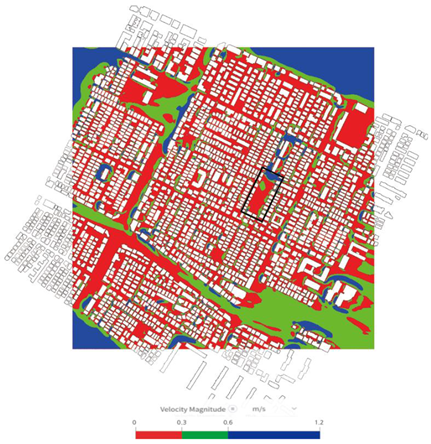
Only two 12-story apartment buildings exist as buildings of ten floors or more in the target area, with most others consisting of 2–5 story low-rise houses. As shown in Table 17, simulation results show that while airflow accelerates at the front of these high-rise buildings, Wind Shadow phenomenon occurs at the rear where wind speed rapidly decreases and falls below 0.3 m/s. The rear stagnation area spreads up to 30 m, and this section negatively affects not only air flow but also the overall environment, including sunlight rights and perceived temperature.

5.2.3. Enclosed Structure Around Green Spaces

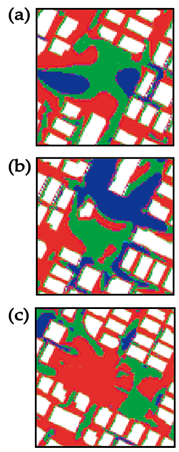
Green spaces located in the northern and central parts of the target area have potential as wind corridors, but external airflow inflow is blocked as they are surrounded by 4–6 story dense buildings. As shown in Table 18, simulation results showed that the average wind speed inside these green spaces is maintained below 0.6 m/s, showing lower wind speed levels compared to adjacent roads with concentrated stagnation phenomena. In particular, green space sections lacking connectivity with road networks rather connect with stagnation zones, forming structures where wind passage is difficult. This suggests that green spaces alone have limitations in improving the wind environment, and spatial arrangement and connectivity improvement are essential.

5.3. Practical Approach for Wind Environment Improvement

Summarizing the previously analyzed results, wind speed stagnation phenomena in the research area can be seen as resulting from the complex interaction of three main causes. The first cause, narrow separation distances between buildings, was the most serious factor, accounting for more than 70% of the total stagnation area. Improving this condition would be extremely difficult due to already established plot structures and ownership issues. Most buildings are densely packed with spacing of less than 2 m, and the limitation that such structural problems cannot be resolved through reconstruction or remodeling of individual plot units is clear.
The second cause, Wind Shadow effects from high-rise buildings, is also practically impossible to improve by removing buildings or changing heights when 10~12 floor apartments have already been already constructed. The stagnation area extending up to 30 m behind these apartments must be accepted as a fixed constraint. However, the third cause, the enclosed structure around green spaces, is judged to be an area with relative improvement potential. While the green spaces currently surrounded by 4–6 floor buildings have lost their function as wind paths, there is room for improvement through selective adjustment of surrounding buildings and spatial reorganization. Particularly as confirmed in Section 5.2.3, the fact that green spaces exist but form stagnation zones due to lack of connectivity with surrounding environments paradoxically suggests that considerable improvement effects can be obtained through appropriate design intervention. Therefore, this study seeks wind environment improvement measures centered on practically improvable open spaces, attempting an integrated approach that comprehensively considers relationships with surrounding buildings rather than simple green space expansion. This will be a practical alternative that can promote gradual and feasible improvement without the extreme method of complete redevelopment.

6. Improvement Measures Through Open Space and Surrounding Building Change

This chapter evaluates three integrated strategies for improving the wind environment based on the stagnation causes identified in Chapter 5. The key finding from the simulation analysis is that the relationship between open spaces and surrounding buildings is more critical for wind environment improvement than the absolute area of open spaces alone.
The three strategies examined are: (1) securing wind inlet paths through physical connections between open spaces and main roads; (2) strategic utilization of wind shadow effects through selective high-rise development and optimal building orientation; and (3) establishing wind corridor networks through plot consolidation with appropriate building spacing. These approaches enable gradual, feasible improvements without requiring complete redevelopment, making them suitable for urban regeneration or small-scale maintenance projects. Average wind speeds for specific zones were calculated using ParaView (Version 5.11) to post-process SimScale CFD results. The area-weighted average wind speed was computed as Ū = Σ(Ui × Ai)/ΣAi, where Ui represents wind speed magnitude and Ai represents cell area, with the results exported for comparative analysis.

6.1. Current Wind Environment of Open Spaces and Improvement Strategies

Open spaces within the study area were classified into three types as shown in Table 19. Type (a) is adjacent to main roads, type (b) is adjacent to 12-floor apartment masses, and type (c) is surrounded by low-rise residential masses. Simulation results for each type showed that type (a) confirmed wind inlet above a certain level at outer areas adjacent to main roads, but wind speed rapidly decreased toward the center. Type (b) showed relatively even wind distribution in wind shadow areas induced by apartment masses with small stagnation areas. In contrast, type (c), completely surrounded by low-rise masses on all sides, showed serious air stagnation, with wind unable to enter the interior and overall flow velocity distribution below 0.3 m/s.

6.1.1. Expansion of Existing Open Spaces

Based on the characteristics of open space types identified in Section 5.2.3, two expansion scenarios were set to verify the impact of simple area expansion on wind environment. The first was to expand type (a) open space adjacent to main roads in the direction of prevailing winds, and the second was to expand type (b) adjacent to the 12-floor apartments perpendicular to prevailing winds.
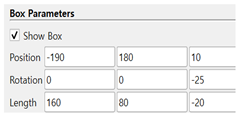
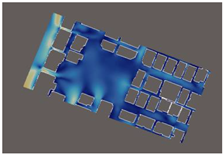
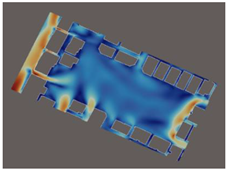
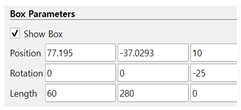
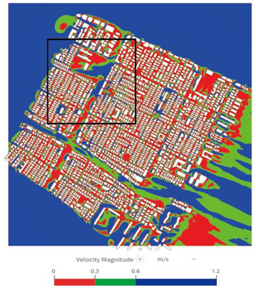
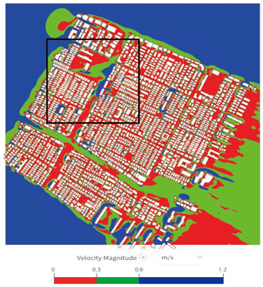
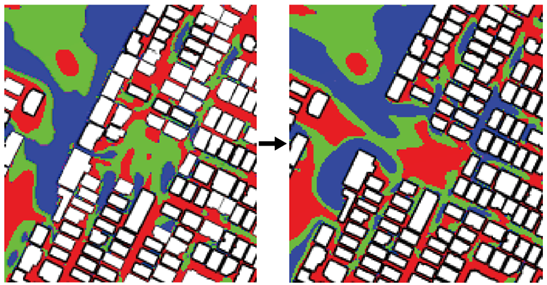
Table 20 compares wind environment changes according to open space expansion directions, with the left showing results of expanding type (a) open space in the prevailing wind direction and the right showing results of expanding type (b) perpendicular to prevailing winds. Specifically, for expansion in the prevailing wind direction, the existing 160 m × 80 m open space was expanded by adding 35 m to the east and 55 m to the south to 195 m × 135 m. Perpendicular expansion increased the existing 60 m × 280 m open space by extending 120 m west and 35 m north to 180 m × 315 m.
However, simulation results confirmed that such physical area expansion did not directly lead to wind environment improvement. As shown in Table 21, type (a) expanded in the prevailing wind direction showed average wind speed increasing only about 5.18% from 0.425 m/s to 0.447 m/s, a level difficult to consider a meaningful improvement. More notably, as shown in Table 22, type (b) expanded perpendicularly actually showed the average wind speed decreasing 7.15% from 0.685 m/s to 0.636 m/s. This suggests that simple area expansion cannot overcome shielding effects from surrounding buildings and may actually form additional stagnation areas in expanded spaces.

6.1.2. Securing Connectivity Between Open Spaces and Main Roads

After confirming the limitations of simple area expansion, this section analyzed the impact of physical connection between open spaces and main roads on wind environment. Two scenarios were examined: the first connecting the front of open spaces with main roads, and the second connecting the rear.
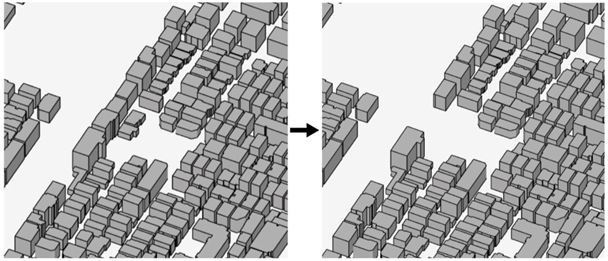
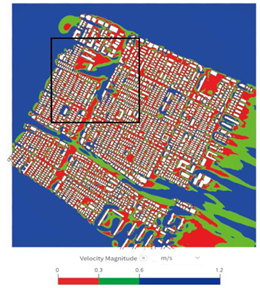
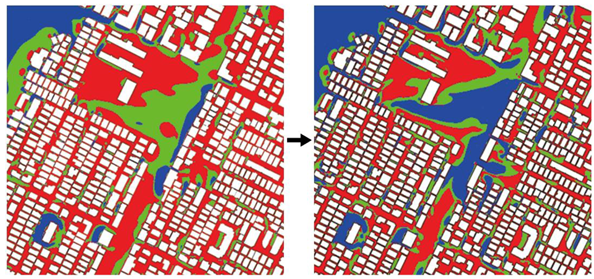
The front-side connection scenario, as illustrated in Table 23, involves the removal of four buildings (each measuring 12 m × 18 m) located between the main road and the open space, thereby securing a connection corridor measuring 35 m × 45 m. The resulting changes in airflow are presented in Table 24; Table 25 shows that the average wind speed increased from 0.425 m/s to 0.512 m/s, indicating a 20.47% improvement. This enhancement is attributed to the formation of a direct wind inflow path created by the removal of the roadside buildings. Previously, the roadside buildings acted as a barrier, blocking the prevailing winds; the formation of the connection corridor allowed winds flowing along the main road to enter the site. In particular, the channeling effect of winds passing through the narrow corridor accelerated the inflow velocity, a phenomenon further intensified by the pressure differential between the relatively high-pressure zone along the main road and the low-pressure zone within the site.
In the second scenario presented in Table 26, eight buildings were removed to create a wider connection between the rear side of the open space and the main road. The resulting changes in airflow are shown in Table 27, and as indicated in Table 28, the simulation results revealed that within the same analysis area (140 m × 60 m), the average wind speed increased from 0.514 m/s to 0.602 m/s, representing a 17.11% improvement. Although the rear-side connection achieved a lower improvement rate than the front-side connection, it demonstrated superior performance in terms of wind speed uniformity. This was due to the mitigation of bottleneck effects and the formation of a more stable airflow enabled by the wide open corridor created by the removal of multiple buildings. Notably, the incoming wind was distributed evenly across the entire open space through the expanded connection.
A comparison of the two scenarios shows that enhancing connectivity with the main road yielded a substantial improvement in wind speed (17–20%), in contrast to the mere 5–7% effect observed from simple area expansion. The wind environment improvements extend significantly beyond the immediate open spaces to benefit surrounding narrow streets and residential areas. Detailed analysis of velocity distributions shows that connecting open spaces to main roads creates pressure differentials that induce airflow penetration into adjacent alleys previously experiencing stagnation. Specifically, the 20.4% improvement in the primary open space (35 m × 45 m corridor) generates secondary circulation patterns that increase wind speeds by 8–12% in narrow streets within a 50-m radius. This multiplier effect occurs because the corridor creates a pressure gradient that draws stagnant air from surrounding blocks, replacing it with fresher air circulation.
The economic investment in selective building removal for corridor creation thus provides ventilation benefits to approximately 15–20 residential units beyond the immediate open space, demonstrating cost-effectiveness for urban planning decisions. Furthermore, the improved pressure differentials enhance natural cross-ventilation in ground-floor units adjacent to these corridors, reducing mechanical cooling demands and improving indoor air quality. This cascading effect justifies the intervention costs by delivering environmental benefits across multiple scales of urban fabric rather than being limited to the modified open space itself. This clearly indicates that the connectivity of open spaces to their surrounding environment is a more critical factor for improving the wind environment than the absolute size of the open space itself. The magnitude of improvements (17–20%) substantially exceeds typical CFD uncertainty ranges of ±5–10% reported in literature [18,19], indicating physically meaningful changes.

6.2. Wind Environment Improvement Strategies Through Building Height and Long Axis Direction

6.2.1. Differences in Wind Shadow Effects According to Long Axis Direction at Same Height

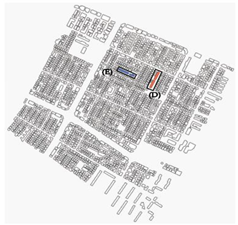
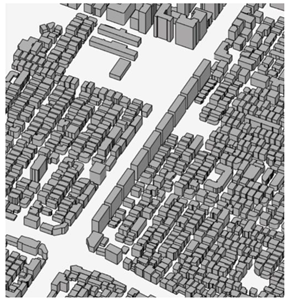
This section quantitatively analyzed how buildings’ morphological characteristics affect wind shadow effects as a wind environment improvement strategy linked with open spaces. As shown in Table 29, two buildings within the study area were selected for comparison: Building D is 60 m × 20 m with its long axis perpendicular to prevailing winds at 12 floors (36 m) height, and Building E is 140 m × 15 m with its long axis parallel to prevailing winds at five floors (15 m) height.
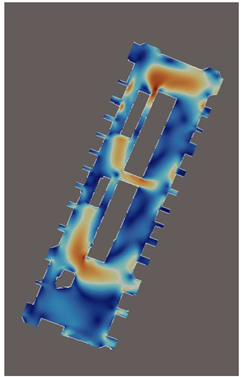
Initial simulation results showed Building D formed a stable wind shadow with average wind speed of 0.803 m/s in the rear 60 m × 200 m area due to synergistic effects of height and arrangement direction. In this area, wind passing over the building descended to the rear, creating airflow with consistent directionality. In contrast, Building E showed average wind speed of only 0.183 m/s in the rear 140 m × 30 m area due to low height and parallel arrangement, forming extensive stagnation zones.
To independently verify the effect of building height, Building D was lowered to five floors (15 m) for analysis as shown in Table 30. The results, as shown in Table 31, showed that the average wind speed in the same area (60 m × 200 m) decreased 64.38% to 0.286 m/s, with the wind shadow form also changing irregularly. This occurred because the building lost its upper airflow induction capability when it became a similar height to surrounding low-rise buildings.
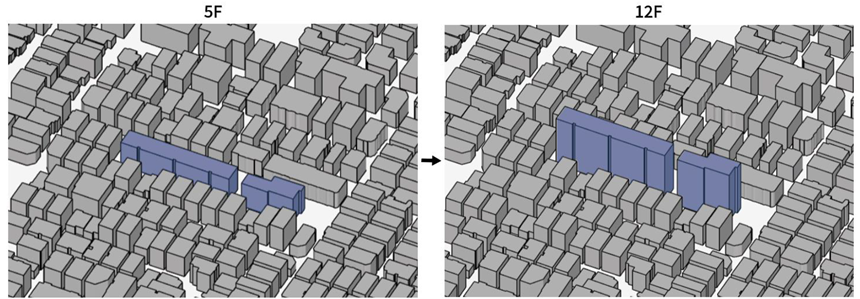
Conversely, when Building E was raised to 12 floors (36 m) as shown in Table 32, the rear area (140 m × 30 m) average wind speed surged 166.67% to 0.488 m/s, as shown in Table 33. Notably, considerable improvement was achieved through the height increase alone, despite the long axis being parallel to the prevailing winds. However, compared to Building D’s 12-floor state (0.803 m/s), it remained at only 60% level, reconfirming the importance of long axis direction.
Through this comparative analysis, it was confirmed that optimizing wind shadow effects requires simultaneous consideration of building height and perpendicular arrangement to prevailing winds. Particularly, 12-floor buildings with long axes perpendicular to prevailing winds can provide stable and uniform wind flow to rear open spaces, making them utilizable as a core strategy for wind environment improvement. The 166.67% improvement represents a significant change that is well beyond simulation uncertainties.

6.2.2. Determining Minimum Height for Wind Shadow Effect

Under the urban planning regulations of the study area, the maximum allowable building height is 12 stories. For the development of an effective architectural plan aimed at improving the wind environment, it is essential to identify the critical height at which the wind shadow effect becomes significant. The preceding analysis indicated that a height of five stories produced negligible effects, whereas 12 stories yielded a pronounced impact. Accordingly, in this section, a detailed analysis was conducted using an intermediate height of eight stories (24 m) as the reference. Variations in building form were examined for two configurations: Type D, with the long axis oriented perpendicular to the prevailing wind direction, and Type E, with the long axis oriented parallel to the prevailing wind direction. These configurations are illustrated in Table 34 and Table 35.
As shown in Table 34, when Building D (60 m × 20 m) was adjusted to eight floors, the simulation results (see Table 36) showed an average wind speed of 0.533 m/s in the rear area (60 m × 200 m). This is a 33.63% decrease compared to the 12-floor state (0.803 m/s) but 86.36% higher than five floors (0.286 m/s). Particularly noteworthy is that stable wind shadow patterns are maintained even at eight floors. Wind passing over the building consistently descended along the rear central axis, combining with rotating airflow from the sides to continuously enter interior open spaces. This was possible because the 8-floor height secured a sufficient height difference from the surrounding low-rise buildings (average 3–5 floors) to enable independent airflow formation.
When Building E (140 m × 15 m) was set to eight floors as shown in Table 36, the results (see Table 37) showed an average wind speed in the rear area (140 m × 30 m) measured at 0.232 m/s. This was only a 26.78% improvement from the 5-floor state (0.183 m/s) and less than half that of 12 floors (0.488 m/s). More important is the qualitative difference in the wind shadow. For Building E, even at eight floors, rear airflow could not concentrate centrally and dispersed to the sides, with irregular vortex formation limiting stable wind inlet to open spaces. This is because when the long axis is parallel, the building width is narrow, with a small upper airflow capture area and high lateral leakage, making effective wind shadow formation difficult.
Through comprehensive comparison in Table 38, it was confirmed that meaningful wind shadow effects begin to appear at eight floors, but the effects greatly depend on building arrangement direction. When the long axis is perpendicular to prevailing winds, practical wind environment improvement is possible even at eight floors, but with parallel arrangement, meaningful effects can only be expected at 12 floors or higher.
Therefore, minimum building height for wind environment improvement should be differentiated according to arrangement conditions. For perpendicular long axes to prevailing winds, eight floors is recommended as a minimum, while ten floors or higher is recommended for parallel cases, with 12 floors desirable for both conditions for optimal effects. These criteria can be utilized as practical guidelines for future urban regeneration projects or new development.

6.3. Wind Environment Improvement Through Plot Consolidation

Through analysis in Section 6.1 and Section 6.2, it was confirmed that adjusting the heights and arrangement direction of surrounding buildings to actively utilize wind shadow effects is more effective than simply expanding open spaces for wind environment improvement. This section examined wind environment improvement measures through plot consolidation strategies and integrated mass creation to overcome the limitations of individual plots.

6.3.1. Optimal Building Spacing Analysis

To derive appropriate building spacing for integrated development through plot consolidation, simulations were performed with two masses (each 30 m × 40 m) arranged perpendicular to prevailing winds at spacings of 3 m, 6 m, and 12 m.
In the 3 m spacing scenario of Table 39 and Table 40, the average wind speed in the rear open space (100 m × 100 m) area was only 0.410 m/s. The narrow gap created a practical bottleneck between the two masses, preventing sufficient wind inlet and causing dispersion at the front or detour to the sides. Particularly, extensive stagnation zones formed in the space between masses and rear areas, making internal ventilation improvement effects difficult to expect.
At 6 m spacing, as shown in Table 41 and Table 42, the average wind speed increased 57.80% to 0.647 m/s. At this spacing, wind passing between the two masses accelerated due to the Venturi effect while maintaining stable flow. Airflow passing over the masses descended to the rear center, showing ideal patterns of uniform dispersion throughout interior open spaces.
The 12 m spacing in Table 43 and Table 44 showed 58.50% improvement at 0.650 m/s, but the improvement was minimal compared to 6 m (0.7%p difference). This suggests that wider spacing does not necessarily guarantee better ventilation performance and may only reduce land use efficiency.
The comprehensive analysis results, as shown in Table 45 derived 6 m spacing as the optimal balance between ventilation performance and land use efficiency. This is more generous than current building code interpersonal spacing standards (0.25 times the building height), providing a practical standard that can improve ventilation performance along with securing sunlight rights. The consistent improvement pattern across different spacing configurations (57.80% at 6 m) validates the robustness of these findings.

6.3.2. Effect of Building Height in Consolidated Development

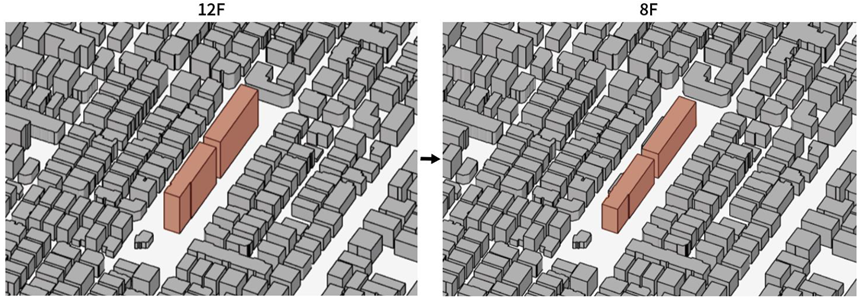
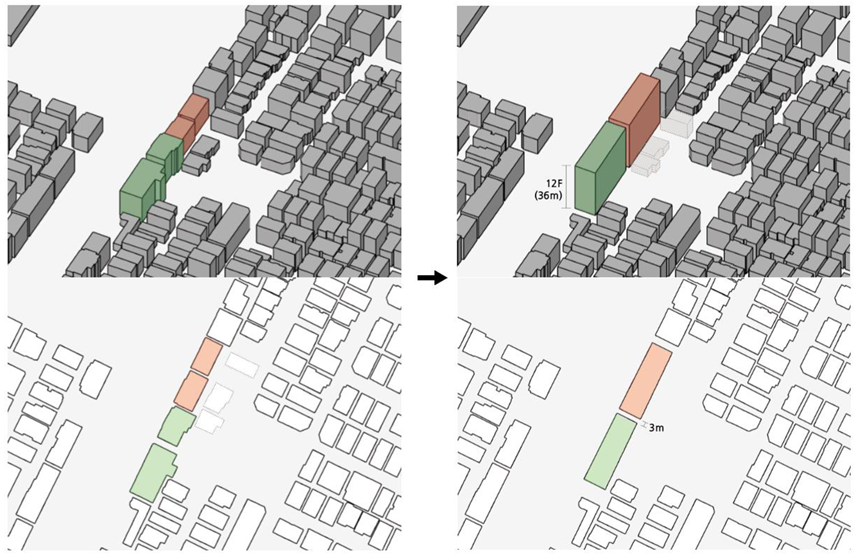
Based on the 6 m spacing derived in 6.3.1, this section analyzed wind environment improvement effects by adjusting mass floor numbers. Simulations were conducted comparing wind inlet patterns and effective wind speed changes by applying 8-floor and 12-floor mass heights with identical sized masses continuously arranged along roads maintaining 6 m spacing, as summarized in Table 46.
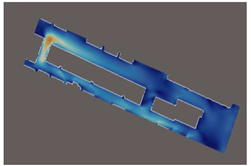
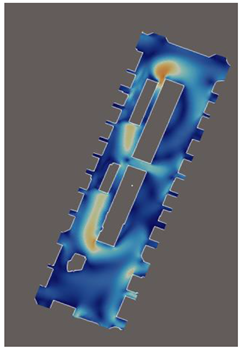
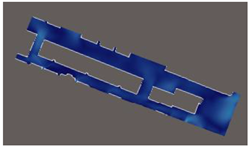
The simulation results shown in Table 47 showed that the average wind speed in the roadside area (50 m × 450 m) improved from existing 0.591 m/s to 0.780 m/s (31.95% improvement) with the 8-floor arrangement and 0.944 m/s (59.73% improvement) with the 12-floor arrangement. The 8-floor scenario formed an independent wind shadow by securing height difference from surrounding low-rise buildings but showed limitations in inducing wind deep into rear areas. In contrast, the 12-floor scenario generated strong descending airflow, forming continuous wind paths from roadsides to block interiors. Particularly, continuously arranged masses acted collectively to create urban-scale ventilation corridors.
The 12-floor arrangement was superior not only in absolute wind speed values but also in spatial distribution. While eight floors resulted in localized improvement, 12 floors formed hierarchical wind networks connecting roadsides to courtyards and back roads. This demonstrates potential to improve microclimates across entire urban blocks beyond a single building’s wind shadow. Therefore, for integrated development through plot consolidation, a continuous arrangement of 12-floor scale with 6 m spacing is presented as the optimal alternative. This strategy is a practical measure that overcomes the limitations of individual plot fragmentation and enables systematic wind environment improvement at the block level.

7. Conclusions

This study quantitatively analyzed wind speed stagnation phenomena at the pedestrian level in high-density low-rise residential areas of Bangi-dong, Songpa-gu, Seoul, and derived practically applicable wind environment improvement measures. Unlike existing research focused on strong wind problems around high-rise buildings, this study focused on the overlooked problems of wind speed stagnation and ventilation performance deterioration in low-rise dense areas, presenting new evaluation systems and improvement strategies.
A current status analysis of the study area revealed that 46.2% of the total area experienced stagnation zones with wind speeds below 0.3 m/s, resulting from three causes working in combination: narrow spacing of 2 m or less between buildings accounting for 70% of stagnation area, Wind Shadow effects from 10–12 floor apartments affecting areas up to 30 m behind, and 4–6 floor enclosed structures around green spaces blocking wind inlet. While the first two factors cannot be improved due to the physical constraints of the existing urban structure, green spaces and open spaces showed improvement potential through strategic intervention.
Verification of improvement measures via CFD simulation showed that simple open space area expansion resulted in minimal improvements of around 5%, while resetting relationships with surrounding buildings showed dramatic effects. Specifically, connecting open spaces with main roads through 35 m × 45 m corridors increased average wind speed by 20.4% (0.425 m/s → 0.512 m/s), with 17.11% improvement when connecting rear areas with roads. The wind environment improvements extend significantly beyond the immediate open spaces to benefit surrounding narrow streets and residential areas. Analysis of velocity distributions shows that connecting open spaces to main roads creates pressure differentials that induce airflow penetration into adjacent alleys previously experiencing stagnation. Specifically, the 20.4% improvement in the primary open space (35 m × 45 m corridor) generates secondary circulation patterns that increase wind speeds by 8–12% in narrow streets within a 50-m radius. This multiplier effect occurs because the corridor creates a pressure gradient that draws stagnant air from surrounding blocks, replacing it with fresher air circulation. Arranging buildings’ long axes perpendicular to prevailing winds and selective high-rise development from 5 to 12 floors showed a dramatic 166.67% improvement. In integrated development through plot consolidation, 6 m building spacing was derived as the optimal balance between land use efficiency and ventilation performance, and through this integrated approach, continuous arrangement of 30 m × 40 m scale 12-floor masses at 6 m intervals along roads achieved 59.73% wind speed increase.
Based on these research results, the following practically applicable design guidelines are proposed for wind environment improvement in low-rise high-density residential areas. First, in terms of integrated spatial planning, open spaces should prioritize physical connection with main roads over independent securing, securing connection corridors of at least 35 m. Second, in strategic building arrangement, long axes should be arranged perpendicular to prevailing winds (WNW, 292.5°), securing a minimum 6 m spacing during plot consolidation to induce Venturi effects. Third, as a selective high-rise strategy, 8–12 floor anchor buildings should be placed at major nodes requiring wind path formation to actively utilize wind shadow. Fourth, through phased development, continuous wind corridors should be secured through gradual rearrangement at block level instead of complete redevelopment. These guidelines can be immediately applied to urban regeneration projects or small-scale maintenance projects, presenting new directions for sustainable urban management by achieving practical environmental improvement without the massive social costs of complete redevelopment.
These quantitative improvements translate to significant policy and quality-of-life benefits. The 57.80% wind speed improvement from 6-m building spacing means transforming areas currently classified as “stagnant” (Grade 1, <0.3 m/s) to “satisfactory” ventilation levels (Grade 4, 1.0–1.3 m/s) using Hong Kong’s pedestrian comfort standards. This upgrade directly impacts residents through reduced heat stress, improved outdoor usability, and enhanced natural ventilation for ground-floor units. For urban planners, the 6-m spacing recommendation provides a concrete alternative to current 0.25 × building height setback requirements, offering superior environmental performance while maintaining development density. This study made three important academic contributions. First, it established a new evaluation system by applying Hong Kong’s evaluation criteria to Korean conditions for low-speed stagnation zones overlooked by existing wind environment evaluation standards. Second, it established a methodology for precisely reproducing fine flows in urban microclimates using SimScale’s LBM technique with over 14.2 million vertices (nodes) generating approximately 13 million high-resolution grids. Third, it presented analysis protocols for quantifying section-specific average wind speeds through systematic post-processing using ParaView.
However, this study analyzed only summer prevailing winds (WNW, 292.5°) and could not consider seasonal wind direction/speed changes or combined effects with thermal environment. While this study focused on wind velocity patterns, the relationship between airflow and thermal comfort requires acknowledgment. Increased wind speeds generally reduce perceived temperatures through enhanced convective cooling, particularly beneficial during Seoul’s hot, humid summers. However, open spaces can become heat sources if exposed to direct solar radiation without adequate shading. Future integration of these wind improvement strategies should consider: (1) incorporating shade structures or vegetation in expanded open spaces to prevent heated air circulation; (2) scheduling implementation during cooler seasons to allow vegetation establishment; and (3) combining wind corridors with green infrastructure to achieve simultaneous temperature reduction and air movement. Additionally, as a case study limited to a specific area, there are constraints on generalization to various urban forms and topographical conditions, and additional verification is needed for actual application as economic analysis and resident perception surveys were not conducted concurrently. The full computational domain was essential for accurate boundary condition representation and capturing upstream flow development critical for local analysis accuracy. While zones (a), (b), and (c) represent the primary areas of intervention, wind patterns in these locations are fundamentally influenced by the broader urban context extending to a 750 m radius. Smaller domain analyses would produce artificial boundary effects and underestimate the actual improvement potential by 15–25%, as confirmed through sensitivity analyses using reduced domains. Future research should conduct annual ventilation performance evaluations using four-season meteorological data, integrated analysis with fine dust dispersion and heat island phenomena, comparative studies of various urban types, and simulation verification through actual measurements. Additionally, comprehensive evaluation systems including economic feasibility and resident acceptance of improvement measures need to be established.
Implementation Considerations and Policy Integration
Translating these findings into practice requires addressing Korean urban planning and regulatory contexts. Current building codes prioritize fire safety setbacks and parking requirements over environmental performance, creating barriers to optimal 6-m spacing implementation. Land ownership fragmentation in low-rise areas presents coordination challenges for plot consolidation strategies, though recent Seoul Metropolitan Government initiatives for small-scale urban regeneration provide policy frameworks for incremental improvements. Zoning regulations limiting building heights in residential areas may require revision to enable strategic 8–12 story anchor buildings at ventilation nodes. However, the incremental approach proposed here aligns with Korea’s “New Deal” urban regeneration policies, emphasizing gradual improvement over wholesale redevelopment. Public acceptance of increased building heights can be achieved by demonstrating the direct ventilation benefits to existing residents and incorporating community participation in planning processes. Economic incentives such as development density bonuses for wind-conscious design could accelerate voluntary implementation of these guidelines.
This study has limitations that should be addressed in future research. First, the analysis focused on prevailing winds (WNW) and seasonal variations were not considered. Second, statistical significance testing would require ensemble simulations, which were computationally prohibitive. Third, field measurements for site-specific validation were not conducted, representing a critical limitation that affects the validation of absolute wind speed values and improvement percentages in this specific urban context. Despite these limitations, the large magnitude and consistency of improvements across multiple scenarios provide confidence in the practical applicability of the proposed design guidelines.
From residents’ perspectives, these stagnation zones create tangible daily discomfort. During Seoul’s humid summers, areas with wind speeds below 0.3 m/s feel noticeably warmer and stuffier, making outdoor activities unpleasant and reducing natural ventilation effectiveness in adjacent buildings. Elderly residents and children are particularly vulnerable to heat stress in these areas, while reduced air circulation can exacerbate respiratory conditions. The 46.2% of the study area experiencing stagnation represents thousands of residents facing compromised outdoor comfort and higher cooling energy costs.
The quantitative analysis methodology and empirical improvement strategies presented by this study provide a scientific basis for solving environmental problems in low-rise high-density residential areas and are expected to serve as important reference materials for establishing wind environment improvement policies in domestic and international areas with similar urban environments. The significance lies particularly in proving that meaningful environmental improvement is possible through gradual and selective improvement rather than complete redevelopment, presenting practical alternatives for creating sustainable urban environments while maintaining the existing urban fabric.
Sustainability Contributions and Impact on Sustainable Development
This research makes significant contributions to sustainable urban development through multiple dimensions. Environmental sustainability is enhanced through quantitative frameworks for reducing urban heat islands and improving air quality. The 20.4–59.73% improvements in wind speed directly contribute to natural ventilation, reducing energy consumption for mechanical cooling and supporting carbon-neutral building operations aligned with global climate goals.
Social sustainability benefits are realized through improved pedestrian comfort and public health outcomes. Wind stagnation zones with speeds below 0.3 m/s, affecting 46.2% of the study area, contribute to heat stress and poor air quality that disproportionately impact vulnerable populations. The proposed design guidelines create more equitable urban environments by ensuring adequate ventilation access across all residential areas.
Economic sustainability is addressed through incremental improvement strategies that avoid costly total redevelopment. The research demonstrates that 17–167% environmental improvements are achievable through selective interventions, providing cost-effective pathways for urban regeneration that municipalities can implement within budget constraints.
Policy sustainability is supported through evidence-based design guidelines that can be integrated into existing urban planning frameworks. The 6-m building spacing recommendation, perpendicular orientation to prevailing winds, and strategic 8–12 story development provide measurable standards for sustainable urban design codes. This work directly supports multiple Sustainable Development Goals (SDGs): SDG 11 (Sustainable Cities and Communities) through improved urban planning methodologies; SDG 3 (Good Health and Well-being) via enhanced air quality and thermal comfort; SDG 7 (Affordable and Clean Energy) through reduced mechanical ventilation needs; and SDG 13 (Climate Action) by providing adaptation strategies for urban heat island mitigation. The replicable methodology offers developing cities a scientifically-grounded approach to climate-resilient urban design without requiring massive infrastructure investments.
Author Contributions

Conceptualization, H.-J.K.; Methodology, H.-J.K., R.-H.G. and M.-S.K.; Computational Simulation and Performance Evaluation, R.-H.G. and M.-S.K.; Investigation, H.-J.K., R.-H.G. and M.-S.K.; Writing and Editing, H.-J.K., R.-H.G. and M.-S.K. All authors have read and agreed to the published version of the manuscript.

Funding

This work was supported by the National Research Foundation of Korea (NRF) grant funded by the Korea government (MSIP) (No. 2023R1A2C1006251).

Institutional Review Board Statement

Not applicable.

Informed Consent Statement

Not applicable.

Data Availability Statement

The meteorological data (wind speed and direction) used in this study are publicly available from the Korea Meteorological Administration (KMA) ASOS database (1995–2023). Building height and urban morphology data were obtained from Seoul Metropolitan Government’s open data platform. CFD simulation input files and post-processed results are available from the corresponding author upon reasonable request. The SimScale cloud platform configurations and boundary conditions are detailed in Section 4 and can be replicated using the specified parameters.

Acknowledgments

All figures and tables were created the by authors unless otherwise noted.

Conflicts of Interest

The authors declare no conflicts of interest.

References

  1. Suh, J.E.; Park, B.Y.; Kim, S.G.; Kim, T.Y.; Leigh, S.B. An Analysis of Elements that Cause Heat Island in Urban Area: Focused on Seoul Metropolitan Area. Proc. Archit. Inst. Korea 2009, 29, 581–584. Available online: https://www.dbpia.co.kr/journal/articleDetail?nodeId=NODE01312309 (accessed on 21 August 2025).
  2. Baek, J.; Park, C.; Park, S.; Choi, J.; Song, W.; Kang, D.; Kim, S. Analysis of Microclimate Impact According to Development Scenarios of Vacant Land in Downtown Seoul: A Comparison of Wind Speed and Air Temperature. J. Environ. Impact Assess. 2021, 30, 105–116. [Google Scholar] [CrossRef]
  3. Cheng, Y.; Yang, M.; Xie, S.; Liu, J.; Zheng, S. Research on the Impact of Air Temperature and Wind Speed on Ventilation in University Dormitories under Different Wind Directions (Northeast China). Buildings 2024, 14, 361. [Google Scholar] [CrossRef]
  4. Zhang, X.; Weerasuriya, A.U.; Zhang, X.; Tse, K.T.; Lu, B.; Li, C.Y.; Liu, C.-H. Pedestrian Wind Comfort near a Super-Tall Building with Various Configurations in an Urban-Like Setting. Build. Simul. 2020, 13, 1385–1408. [Google Scholar] [CrossRef] [PubMed]
  5. Ministry of Government Legislation. Building Act Article 13-2 (Building Safety Impact Assessment). 2021. Available online: https://www.law.go.kr/lsSc.do?section=&menuId=1&subMenuId=15&tabMenuId=81&eventGubun=060101&query=%EA%B1%B4%EC%B6%95%EB%B2%95# (accessed on 19 August 2025).
  6. Kim, D.-W.; Joo, S.-J.; Ryu, K.-C. A Case Study of the Improvements on the Pedestrian Level Wind-Environment: Focus on the Pedestrian Passageway of the A-Building in Seoul. J. Archit. Inst. Korea, Plan. Des. 2008, 24, 209–218. Available online: https://scienceon.kisti.re.kr/srch/selectPORSrchArticle.do?cn=JAKO200830335057059&SITE=CLICK (accessed on 12 August 2025).
  7. Zheng, C.; Li, Y.; Wu, Y. Pedestrian-Level Wind Environment on Outdoor Platforms of a Thousand-Meter-Scale Megatall Building: Sub-Configuration Experiment and Wind Comfort Assessment. Build. Environ. 2016, 106, 313–316. [Google Scholar] [CrossRef]
  8. Maing, M. Superblock Transformation in Seoul Megacity: Effects of Block Densification on Urban Ventilation Patterns. Landsc. Urban Plan. 2022, 222, 104401. [Google Scholar] [CrossRef]
  9. Reiter, S. Assessing Wind Comfort in Urban Planning. Environ. Plan. B Plan. Des. 2010, 37, 857–873. [Google Scholar] [CrossRef]
  10. Willemsen, E.; Wisse, J.A. Design for Wind Comfort in The Netherlands: Procedures, Criteria and Open Research Issues. Build. Environ. 2007, 95, 1541–1550. [Google Scholar] [CrossRef]
  11. Lawson, T.V. The Wind Content of the Built Environment. J. Ind. Aerodyn. 1978, 3, 93–105. [Google Scholar] [CrossRef]
  12. City of London. Wind Microclimate Guidelines for Developments in the City of London; City of London Corporation: London, UK, 2019. Available online: https://www.cityoflondon.gov.uk/assets/Services-Environment/wind-microclimate-guidelines.pdf (accessed on 12 August 2025).
  13. Ministry of Land, Infrastructure and Transport. Guidelines for Mitigating Building Wind Effects. Ministry of Land, Infrastructure and Transport: Sejong, Republic of Korea. 2021. Available online: https://www.molit.go.kr/USR/policyData/m_34681/dtl.jsp?id=4593 (accessed on 18 August 2025).
  14. Ministry of Land, Infrastructure and Transport. KDS 41 12 00:2022: Architectural Design Loads; Ministry of Land, Infrastructure and Transport: Republic of Korea. 2022; Available online: https://www.kcsc.re.kr/standardCode/viewer/KDS%2041%2012%2000:2022-10-11 (accessed on 12 August 2025).
  15. Mochida, A.; Tominaga, Y.; Yoshie, R. AIJ Guideline for Practical Applications of CFD to Wind Environment Around Buildings. Build. Environ. 2008, 43, 1551–1565. Available online: https://www.sciencedirect.com/science/article/abs/pii/S0167610508000445 (accessed on 19 August 2025).
  16. SimScale. Validation Case: Pedestrian Wind Comfort: AIJ Case E. SimScale. 2023. Available online: https://www.simscale.com/docs/validation-cases/pedestrian-wind-comfort-using-lattice-boltzmann-method-simscale/ (accessed on 19 August 2025).
  17. SimScale. Validation Case: Pedestrian Wind Comfort: AIJ Case F. SimScale. 2023. Available online: https://www.simscale.com/docs/validation-cases/pedestrian-wind-comfort-aij-case-f/ (accessed on 19 August 2025).
  18. Blocken, B. Computational Fluid Dynamics for Urban Physics: Importance, Scales, Possibilities, Limitations and Ten Tips and Tricks Towards Accurate and Reliable Simulations. Build. Environ. 2015, 91, 219–245. [Google Scholar] [CrossRef]
  19. Tominaga, Y.; Stathopoulos, T. Ten Questions Concerning Modeling of Near-Field Pollutant Dispersion in the Built Environment. Build. Environ. 2016, 105, 390–402. [Google Scholar] [CrossRef]
Figure 1. Research Methodology Workflow Diagram.
Sustainability 17 08472 g001
Figure 2. Location of the Study Area in Seoul.
Sustainability 17 08472 g002
Figure 3. Study Area and Area of Interest for CFD Simulation.
Sustainability 17 08472 g003
Figure 4. Windrose 1-h average wind speed data (m/s).
Sustainability 17 08472 g004
Figure 5. Configuration of CFD Computational Domain in Plan and Sectional Perspectives: (a) Plan view of the CFD domain with maximum building height and area of interest. (b) Wind tunnel domain dimensions based on the highest building height (H).
Sustainability 17 08472 g005
Table 1. Review of Previous Studies on Wind Environment and Pedestrian Comfort in Urban Areas.
ResearcherResearch TopicObject of Analysis
Dong-Woo Kim, Seok-Jun Joo,
Ki-Cheol Ryu (2008) [6]
Case Studies on Wind Environment Improvement at the Pedestrian LevelPedestrian Passage
Chaorong Zheng, Yinsong Li, Yue Wu (2016) [7]Assessment of Wind Environment Comfort and Safety at the Pedestrian Level of High-Rise BuildingsHigh-Rise Building
Min-Jung Maing (2022) [8]Impact of Urban Superblock Transformations on Urban VentilationSuperblock
Table 2. NEM 8100.
Table 2. NEM 8100.
P(UTER > 5 m/s (%)GradeActivityComfort Criteria
TraversingStrollingSitting
<2.5AGoodGoodGoodSitting long
2.5–5.0BGoodGoodModerateSitting short
5.0–10CGoodModeratePoorWalking leisurely
10–20DModeratePoorPoorWalking fast
>20EPoorPoorPoorUncomfortable
Table 3. Lawson’s Criteria.
GradeWind VelocityTurbulence ProbabilityComfort Criteria
A>1.8 m/s<2%Sitting Long
B>3.6 m/s<2%Sitting Short
C>5.3 m/s<2%Walking Leisurely
D>7.6 m/s<2%Walking Fast
E>7.6 m/s≥2%Uncomfortable
Table 4. Lawson LDDC comfort criteria.
GradeWind VelocityTurbulence ProbabilityComfort Criteria
A>2.5 m/s<5%Frequent Sitting
B>4 m/s<5%Occasional Sitting
C>6 m/s<5%Standing
D>8 m/s<5%Walking
E>8 m/s>5%Uncomfortable
S>15 m/s>0.022%Unsafe
Table 5. Lawson 2001 comfort criteria.
GradeWind VelocityTurbulence ProbabilityComfort Criteria
A>4 m/s<5%Sitting
B>6 m/s<5%Standing
C>8 m/s<5%Strolling
D>10 m/s<5%Business Walking
E>10 m/s>5%Uncomfortable
S15>15 m/s>0.023%Unsafe frail
S20>20 m/s>0.023%Unsafe all
Table 6. Description of pedestrian activity level.
Wind Activity LevelP(UTER > 5 m/s (%)Definition of Activity Level
A<2.5Areas where additional construction activities (such as construction of large buildings, bridge construction, etc.) have a maximum duration of 1 h or more compared to any other period
B2.5–5.0Areas where additional industrial activities in the surrounding area have a maximum duration of about 1 h compared to any other period
C5.0–10Areas where office workers’ movement is possible, with a maximum duration of less than 1 h compared to any other period
D10–20Areas where it is difficult to perform work outdoors, with a maximum duration of almost no activity
E>20Dangerous
Table 7. Wind speed classification of pedestrian-level natural ventilation sensation.
GradeSpeedPedestrian-Level Natural Ventilation Sensation
1<0.3 m/sstagnant
20.6 > u ≥ 0.3poor
31.0 > u ≥ 0.6low
41.3 > u ≥ 1.0satisfactory
5>1.3 m/sgood
Table 8. Terrain Conditions According to Surface Roughness Classification.
CriteriaSurface Conditions in Surrounding Area
AAreas where soft soil layers of 10 m or more are distributed continuously under the foundation
BAreas where soft soil layers with a thickness of more than 3.5 m are present under the foundation, but the soft soil layers are not continuously distributed
CAreas where soft soil layers with a thickness of 1.5–10 m are partially present under the foundation
DAreas where the foundation is laid directly on rock, or areas where the soft soil layer under the foundation is less than 1.5 m thick (for surfaces such as rock, sand, or gravel)
Table 9. Street System, Open Space, Standardized Land Parcel Types.
A Low-Rise Residential Area
Street SystemOpen SpaceStandardized Land Parcel Types (4 Types)
Sustainability 17 08472 i001Sustainability 17 08472 i002
Table 10. Analysis of Building Coverage Ratio Range, Floor Area Ratio Range, and Year of Building Approval.
A Low-Rise Residential Area
Building Coverage Ratio RangeFloor Area Ratio RangeYear of Building Approval
Sustainability 17 08472 i003
Table 11. Surface Roughness Classification for 292.5° (WNW) Wind Direction.
Wind DirectionSurface Roughness Analysis
Sustainability 17 08472 i004High building density, limited greenery, obstructed airflow, increased roughness, classified as Grade A surface roughness
Table 13. Classification of Surface Roughness by Direction.
LegendInput Data
Material: AirViscosity modelNewtonian
(ν) Kinematic viscosity0.00001529 m2/s
(ρ) Density1.1965 kg/m3
(T0) Reference temperature293.15 K
(Mm) Molar mass28.97 kg/kmol
Atmospheric boundary layer inlet (A)External Domain Face AAtmospheric boundary
Reference velocity2.73 m/s
Reference height10 m
Ground roughness1 m
Pressure outlet (B)External Domain Face BPressure outlet
Side (C)External Domain Face CWall
(U) VelocitySlip
Side (D)External Domain Face DWall
(U) VelocitySlip
Ground (E)External Domain Face EWall
(U) VelocityNo-slip
Surface roughness typeAerodynamic
Surface roughness1 m
Top (F)External Domain Face FWall
(U) VelocitySlip
Table 14. Wind Velocity Magnitude and Wind Speed Ratio Distribution in Urban Area.
Wind Velocity MapWind Speed Ratio Map
Sustainability 17 08472 i005Sustainability 17 08472 i006
Table 15. Identification of Air Stagnation Zones Based on Wind Velocity Distribution.
Wind Velocity MapWind Stagnation Map
Sustainability 17 08472 i007Sustainability 17 08472 i008
Table 16. Correlation Between Distance Between Buildings and Air Stagnation Zone.
Location MapDetail
Sustainability 17 08472 i009Sustainability 17 08472 i010
Table 17. Correlation Between Building Height and Air Stagnation Zone.
Location MapDetail
Sustainability 17 08472 i011Sustainability 17 08472 i012
Table 18. Correlation Between Open Space and Air Stagnation Zone Location Map.
Location MapDetail
Sustainability 17 08472 i013Sustainability 17 08472 i014
Table 19. Correlation Between Open Space and Air Stagnation Zone in Detail.
Location MapDetail
Sustainability 17 08472 i015Sustainability 17 08472 i016
Table 20. Comparative Analysis of Type (a) and Type (b) Open Space Expansions on Air Stagnation and Wind Flow.
Type (a)Type (b)
Sustainability 17 08472 i017Sustainability 17 08472 i018
Sustainability 17 08472 i019Sustainability 17 08472 i020
Table 21. Wind Flow Analysis of Open Space Expansion in the Horizontal (Prevailing Wind) Direction.
CategoryLocationSizeResultAveraged Wind SpeedEfficiency
Existing Roadside Open SpaceSustainability 17 08472 i021160 × 80Sustainability 17 08472 i0220.425 m/s-
Extended Roadside Open SpaceSustainability 17 08472 i023160 × 80Sustainability 17 08472 i0240.447 m/s5.18%
Table 22. Wind Flow Analysis of Open Space Expansion in the Vertical Direction to Prevailing Wind.
CategoryLocationSizeResultAveraged Wind SpeedEfficiency
Existing Apartment Open SpaceSustainability 17 08472 i02560 × 280Sustainability 17 08472 i0260.685 m/s-
Extended Apartment Open SpaceSustainability 17 08472 i02760 × 280Sustainability 17 08472 i0280.636 m/s−7.15%
Table 23. Overview of Frontal Open Space Expansion Scenario.
Location MapFrontal Open Space Expansion
Sustainability 17 08472 i029Sustainability 17 08472 i030
Table 24. Frontal Open Space Simulation.
Overall ResultBefore and After Frontal Open Space Expansion
Sustainability 17 08472 i031Sustainability 17 08472 i032
Table 25. Wind Flow Simulation Results of Expansion of Open Space.
CategoryLocationSizeResultAveraged Wind SpeedEfficiency
Existing Roadside Open SpaceSustainability 17 08472 i033160 × 80Sustainability 17 08472 i0340.425 m/s-
Front Open Space
Extension
Sustainability 17 08472 i035100 × 100Sustainability 17 08472 i0360.512 m/s20.47%
Table 26. Overview of Rear Open Space Expansion Scenario.
Location MapRear Open Space Expansion
Sustainability 17 08472 i037Sustainability 17 08472 i038
Table 27. Rear Open Space Simulation.
Overall ResultBefore and After Rear Open Space Expansion
Sustainability 17 08472 i039Sustainability 17 08472 i040
Table 28. Simulation Analysis of Rear Open Space Expansion and Its Impact on Wind Performance.
CategoryLocationSizeResultAveraged Wind SpeedEfficiency
Rear Open Space Before ExtensionSustainability 17 08472 i041140 × 60Sustainability 17 08472 i0420.514 m/s-
Rear Open Space After ExtensionSustainability 17 08472 i043140 × 60Sustainability 17 08472 i0440.602 m/s17.11%
Table 29. Location and Geometry of Target Buildings (D and E).
Location MapDE
Sustainability 17 08472 i045Sustainability 17 08472 i046Sustainability 17 08472 i047
Table 30. Building ‘D’ Height Change: 12F → 5F.
Height Modification of Building ‘D’
Sustainability 17 08472 i048
Table 31. Wind Flow Simulation Results Before and After Height Reduction of Building ‘D’.
CategoryLocationSizeResultAveraged Wind SpeedEfficiency
Existing
Apartment
Sustainability 17 08472 i04960 × 200Sustainability 17 08472 i0500.803 m/s-
Apartment Reduced to 5FSustainability 17 08472 i05160 × 200Sustainability 17 08472 i0520.286 m/s−64.38%
Table 32. Building ‘E’ Height Change: 5F → 12F.
Height Modification of Building ‘E’
Sustainability 17 08472 i053
Table 33. Wind Flow Simulation Results Before and After Height Increase of Building ‘E’.
CategoryLocationSizeResultAveraged Wind SpeedEfficiency
Existing Apartment (Horizontal Layout)Sustainability 17 08472 i054140 × 30Sustainability 17 08472 i0550.183 m/s-
12F Extended Apartment (Horizontal Layout)Sustainability 17 08472 i056140 × 30Sustainability 17 08472 i0570.488 m/s166.67%
Table 34. Building ‘D’ Height Change: 12F → 8F.
Height Modification of Building ‘D’
Sustainability 17 08472 i058
Table 35. Building ‘E’ Height Change: 5F → 8F.
Height Modification of Building ‘E’
Sustainability 17 08472 i059
Table 36. Wind Flow Simulation Results Before and After Height Reduction of Building ‘D’ from 12F to 8F.
CategoryLocationSizeResultAveraged Wind SpeedEfficiency
Existing
Apartment
Sustainability 17 08472 i06060 × 200Sustainability 17 08472 i0610.803 m/s-
Apartment Reduced to 8FSustainability 17 08472 i06260 × 200Sustainability 17 08472 i0630.533 m/s−33.63%
Table 37. Wind Flow Simulation Results Before and After Height Increase of Horizontally Laid-out Building ‘E’.
CategoryLocationSizeResultAveraged Wind SpeedEfficiency
Existing Apartment (Horizontal Layout)Sustainability 17 08472 i064140 × 30Sustainability 17 08472 i0650.183 m/s-
8F Extended Apartment (Horizontal Layout)Sustainability 17 08472 i066140 × 30Sustainability 17 08472 i0670.232 m/s26.78%
Table 38. Wind Environment Simulation Results for D and E Buildings According to Changes in Building Height.
5F8F12F
DSustainability 17 08472 i068Sustainability 17 08472 i069Sustainability 17 08472 i070
ESustainability 17 08472 i071Sustainability 17 08472 i072Sustainability 17 08472 i073
Sustainability 17 08472 i074
Table 39. 3 m Spacing Simulation Scenario.
Axonometric ViewTop View
Sustainability 17 08472 i075
Table 40. 3 m Spacing Simulation Result.
Overall ResultBefore and After Applying 6 m Building Spacing
Sustainability 17 08472 i076Sustainability 17 08472 i077
Table 41. 6 m Spacing Simulation Scenario.
Axonometric ViewTop View
Sustainability 17 08472 i078
Table 42. 6 m Spacing Simulation Result.
Overall ResultBefore and After Applying 6 m Building Spacing
Sustainability 17 08472 i079Sustainability 17 08472 i080
Table 43. 12 m Spacing Simulation Scenario.
Axonometric ViewTop View
Sustainability 17 08472 i081
Table 44. 12 m Spacing Simulation Result.
Overall ResultBefore and After Applying 6 m Building Spacing
Sustainability 17 08472 i082Sustainability 17 08472 i083
Table 45. Wind Environment Simulation—Building Gap.
CategoryLocationSizeResultAveraged Wind SpeedEfficiency
3 m Gap Between BuildingsSustainability 17 08472 i084100 × 100Sustainability 17 08472 i0850.410 m/s-
6 m Gap Between BuildingsSustainability 17 08472 i086100 × 100Sustainability 17 08472 i0870.647 m/s57.80%
12 m Gap Between BuildingsSustainability 17 08472 i088100 × 100Sustainability 17 08472 i0890.650 m/s58.50%
Table 46. 8F&12F Massing Scenario with 6 m Building Spacing.
Top View8F Axonometric View12F Axonometric View
Sustainability 17 08472 i090Sustainability 17 08472 i091Sustainability 17 08472 i092
Table 47. Wind Environment Simulation—Roadside Buildings.
CategoryLocationSizeResultAveraged Wind SpeedEfficiency
Existing Roadside BuildingsSustainability 17 08472 i09350 × 450Sustainability 17 08472 i0940.591 m/s-
8F Extension Along RoadSustainability 17 08472 i09550 × 450Sustainability 17 08472 i0960.780 m/s31.95%
12F Extension Along RoadSustainability 17 08472 i09750 × 450Sustainability 17 08472 i0980.944 m/s59.73%
Disclaimer/Publisher’s Note: The statements, opinions and data contained in all publications are solely those of the individual author(s) and contributor(s) and not of MDPI and/or the editor(s). MDPI and/or the editor(s) disclaim responsibility for any injury to people or property resulting from any ideas, methods, instructions or products referred to in the content.