Article

Climate Trends and Attribution Analysis of Runoff Changes in the Songhua River Basin from 1980 to 2022 Based on the Budyko Hypothesis

1
School of Hydraulic and Electric Power, Heilongjiang University, Harbin 150080, China
2
Institute of Groundwater Cold Region, Heilongjiang University, Harbin 150080, China
3
International Joint Laboratory of Hydrology and Hydraulic Engineering in Cold Regions of Heilongjiang Province, Harbin 150080, China
*
Author to whom correspondence should be addressed.
Sustainability 2025, 17(18), 8459; https://doi.org/10.3390/su17188459
Submission received: 29 July 2025 / Revised: 15 September 2025 / Accepted: 17 September 2025 / Published: 20 September 2025

Abstract

Understanding the spatiotemporal dynamics of runoff and its drivers is essential for water resources management in mid–high latitude basins. This study investigates runoff changes in the Songhua River Basin, Northeast China, during 1980–2022 using the Budyko framework, combined with Mann–Kendall trend analysis, Pettitt tests, Hurst index, and wavelet analysis. Results indicate significant climatic shifts, with basin-wide warming, heterogeneous precipitation changes, and declining relative humidity, leading to intensified cold-season drying. Temperature and evapotranspiration showed strong persistence, while precipitation exhibited high variability and periodicities linked to ENSO and East Asian monsoon anomalies. Runoff increased significantly in the mainstream Songhua and Nenjiang basins, especially in autumn, with abrupt changes clustered between 2009 and 2015. The Second Songhua Basin displayed weaker variability, largely influenced by reservoir regulation and land-use change. Attribution analysis confirmed precipitation as a primary driver, with elasticity coefficients exceeding 3 in the Nenjiang Basin during some summers, indicating extreme sensitivity. Evapotranspiration suppressed runoff under high temperatures, while freeze–thaw processes and human interventions became critical in spring and autumn. The aridity index revealed persistent winter deficits and rising spring–autumn drying trends after 2000, posing risks for snowmelt runoff and baseflow sustainability. Overall, runoff evolution reflects a shift from gradual to threshold-triggered regime changes driven by both climate variability and human regulation. These findings provide a basis for adaptive, basin-specific water management and climate resilience strategies in Northeast China.

1. Introduction

Understanding the dynamics of hydrological regimes under changing climatic and anthropogenic pressures is crucial for sustainable water resource management, particularly in ecologically fragile and socioeconomically significant basins like the Songhua River Basin (SRB) in Northeast China. This basin, encompassing diverse topographical and climatic zones, plays a pivotal role in supporting agricultural production, urban development, and ecological conservation. However, in recent decades, the SRB has experienced notable alterations in hydrological processes, primarily driven by shifts in precipitation patterns, temperature regimes, and intensified human activities such as land-use change, water abstraction, and infrastructure development [1,2]. Global warming and associated changes in hydroclimatic variables have intensified the challenges of understanding, predicting, and managing runoff variability. Numerous studies highlight that rising temperatures lead to increased evapotranspiration, altering the balance between water input and output, especially in snow-dominated and cold-temperate regions like the SRB [3,4]. Climate-induced runoff alterations are further compounded by anthropogenic factors, making it essential to disentangle their relative impacts for accurate attribution [5,6].To this end, a wide array of analytical tools and conceptual frameworks has been developed. Among them, the Budyko hypothesis has emerged as a cornerstone in hydrology, offering a parsimonious and theoretically sound method to describe the long-term balance between precipitation, potential evapotranspiration, and runoff [7,8]. The Budyko framework and its numerous adaptations allow for the separation of climate-driven and human-induced impacts on hydrological changes, enabling attribution analyses across diverse spatiotemporal scales [9,10,11].
The SRB, influenced by both monsoonal climate and intensive human activities, presents an ideal case to apply the Budyko hypothesis and its extensions. Previous research has demonstrated its applicability in comparable basins, including the Haihe River [11], Loess Plateau [12], and Yellow River tributaries [13]. However, most prior studies have focused either on limited time spans or narrow spatial extents, lacking a comprehensive long-term evaluation across the SRB’s three major sub-basins—the mainstream Songhua River, Second Songhua River, and Nenjiang River—over a period as extensive as 1980–2022. Hydroclimatic trend detection plays a crucial role in interpreting underlying processes. The Mann–Kendall (MK) test [14] and Pettitt test [15], as widely adopted non-parametric techniques, offer robust capabilities for detecting monotonic trends and abrupt changes in time series. These methods are especially useful in assessing the onset of significant hydrological regime shifts and linking them with known climatic or policy interventions. In parallel, the Hurst exponent derived from rescaled range (R/S) analysis informs on long-term persistence, providing insight into whether observed trends may continue or reverse in the future [16]. Wavelet analysis further enhances the temporal characterization by identifying dominant periodicities in hydrological signals and their evolution across scales [17,18,19]. Its extension, wavelet coherence analysis, allows the exploration of potential cause–effect relationships between climate indices (e.g., temperature, precipitation) and runoff series [20]. These multi-scale tools complement trend and change-point analyses by offering dynamic interpretations of cyclic and interannual variabilities. Moreover, the aridity index (AI), defined as the ratio of annual potential evapotranspiration to annual precipitation, has become a widely accepted indicator of climate dryness and is instrumental in assessing basin-scale wetting and drying trends under climate change [21,22]. Its changes over time not only reflect evolving climatic conditions but also help contextualize hydrological responses within the Budyko space. Despite the strength of the Budyko framework, several limitations warrant critical attention. The original formulation assumes equilibrium conditions and stationary climate forcing, which may not hold in rapidly changing environments. Incorporating time-varying parameters [5], vegetation dynamics [23], or baseflow components [24] into the Budyko model has been proposed to better capture the transient behaviors and storage dynamics often observed in real-world watersheds. Consequently, a modified Budyko method, accounting for temporal evolution and heterogeneity of basin characteristics, is essential for a realistic attribution of runoff changes [25,26,27]. The role of vegetation, soil water storage, and seasonal evapotranspiration must also be incorporated to improve runoff simulation accuracy. [23] Emphasized the importance of including vegetation dynamics in Budyko-based modeling, while [25] proposed an extended formulation that incorporates interannual variability in storage change. These improvements allow hydrologists to bridge the gap between conceptual simplicity and hydrological realism. Importantly, groundwater storage exerts substantial control on streamflow generation, especially during dry seasons or periods of reduced snowmelt [26]. Previous studies have successfully applied such enhanced Budyko-type models in regions with similar hydro-climatic settings. For example, Li et al. [12] performed a spatiotemporal attribution analysis in the Loess Plateau, revealing that anthropogenic activities contributed to over 50% of runoff reduction in several sub-catchments. Similarly, Ye et al. [6] and Xin et al. [28] utilized Budyko-based methods to disentangle the contributions of human activities and climate variability to runoff decline across multiple Chinese river systems. These findings underscore the potential of improved Budyko-based methods as a robust and parsimonious approach for quantifying runoff drivers across large heterogeneous basins. However, as highlighted by Fernandez and Sayama [29], balancing conceptual simplicity and process realism remains a challenge when scaling models for prediction under future climate scenarios. Climate projections for northeastern China indicate continued warming and intensifying seasonal precipitation variability, which will likely exacerbate hydrological extremes in the SRB [30,31]. Studies by Chen et al. [22] and Mohammed and Scholz [32] have shown that these changes will not be spatially uniform, leading to diverging runoff responses across sub-basins. Hence, a regionally tailored, fine-scale attribution approach is crucial for formulating effective adaptation strategies.
In this study, we aim to conduct a comprehensive assessment of climate trends and runoff changes in the Songhua River Basin from 1980 to 2022 by employing a combination of statistical, signal processing, and attribution tools grounded in the Budyko framework. The primary objectives are to:
  • Detect long-term trends, abrupt changes, persistence, and periodic features in key hydroclimatic variables using MK, Pettitt, R/S, and wavelet analyses;
  • Evaluate the evolution of aridity and its implications for hydrological regimes;
  • Quantify the relative contribution of climate change and anthropogenic impacts to runoff variations using a modified Budyko attribution method; and
  • Discuss the broader implications of runoff variability in the context of hydrological sustainability and methodological limitations.
This research is particularly relevant given China’s ongoing efforts in ecological protection and watershed management under the “Ecological Civilization” framework and the “Dual-Carbon” targets (carbon peaking and neutrality). Understanding the hydrological responses to historical climate variability and policy-induced land-use change is a prerequisite for anticipating future water security challenges in the Songhua River Basin and similar snowmelt-dominated catchments. The novelty of this study lies in its integrative framework combining multi-method hydrological time series analysis, climatic aridity assessment, and advanced Budyko attribution modeling over an extended 43-year period (1980–2022). Compared with earlier studies that either covered shorter periods or focused only on statistical trend detection, this work offers a comprehensive perspective by merging statistical, spectral, and process-based analyses. In addition, the division into three distinct sub-basins enables identification of spatial heterogeneity in runoff responses, reflecting the compound effects of geography, climate, and socio-economic development. Overall, this paper contributes to the broader field of hydroclimatology by advancing methodologies for runoff attribution, improving diagnostic tools for identifying change points and dominant frequencies, and refining understanding of how cold-region watersheds respond to multi-faceted environmental drivers. The results are expected to provide a theoretical foundation and empirical reference for regional policymakers and water managers in developing adaptive and sustainable water governance frameworks under future climate uncertainty.

2. Overview of the Study Area

The Songhua River Basin (41°42′–51°38′ N, 119°52′–132°31′ E), spanning an area of 557,000 km2 in northeastern China, is characterized by diverse topography, ranging from the Changbai Mountains (2000 m elevation) to the Songnen and Sanjiang Plains [33]. The northern source, the Nen River, originates from Yilehuli Mountain in the Greater Khingan Range at a source elevation of 1030 m; it flows southward for 1370 km and drains a basin area of 298,500 km2. The southern source, the Second Songhua River, rises from Paektu Mountain (Changbai Mountain) at a source elevation of 2744 m; it flows northwest for 958 km with a basin area of 73,400 km2. These rivers converge at Sanchahe in Zhaoyuan County, Heilongjiang Province. Downstream of this confluence, the river is termed the Songhua River main stream, turning northeastward; it flows for 939 km, drains a basin area of 561,200 km2, and empties into the Heilongjiang River (Amur River) at Tongjiang City [34]. This agriculturally vital basin supports over 60 million people while facing intensified hydrological extremes under climate change [35,36]. The temperate monsoon climate (Köppen Dwa) delivers 500–700 mm annual precipitation, with 70% concentrated in June-September. Extreme rainfall events have been increasing, with a rate of +0.12 days/year since 2000 [33,36]. Temperature gradients vary from 3 °C in the northern permafrost zones to 5 °C in the southern regions, contributing to a potential evapotranspiration rate of 800–1000 mm/year [33,35]. The river network features regulated flows through critical infrastructure like the Fengman Reservoir [33,37]. Historical records indicate strong runoff seasonality, with a wet/dry season ratio exceeding 3:1, and a baseline annual discharge of 76 billion m3. However, climate projections suggest a 9–15% reduction in snowmelt contributions by 2100 under SSP5-8.5 [33,38]. These multi-stressor conditions, coupled with projected temperature increases of 1.5–2.0 °C by 2050, necessitate advanced hydrological modeling to balance water demands across agriculture (70%), industry (20%), and municipal needs (10%) [35,38,39]. Figure 1 displays the geographical location and extent of the Songhua River basin, indicating its major river systems and topographic features, thereby providing a fundamental spatial framework for this study.

3. Data and Methods

3.1. Data Source and Processing

In this study, the data utilized can be categorized into two main types: meteorological and hydrological data. The meteorological data were obtained from the National Tibetan Plateau Data Center and the Copernicus Climate Data Store (CDS). The hydrological data consist of observed runoff records collected within the Songhua River Basin. Detailed information regarding the temporal resolution, time span, and spatial coverage of these datasets is presented in Table 1.

3.1.1. Meteorological Data

The datasets employed in this study include precipitation, mean temperature, relative humidity, evaporation, and sunshine duration. The high-resolution (0.1°) precipitation dataset was developed by Hu Jinlong and his team [40]. It is based on long-term daily precipitation observations from 3476 meteorological stations across China since 1960, incorporated 11 key precipitation-related covariates to enhance spatial correlation modeling: elevation, slope, aspect, longitude, latitude, distance to coast, atmospheric water vapor pressure, East Asian summer monsoon index, normalized difference vegetation index (NDVI), surface albedo, and land-use/land cover (LULC) type. The dataset was generated using an improved inverse distance weighting (IDW) method integrated with a machine learning-based Light Gradient Boosting Machine (LGBM) algorithm. The high-resolution (0.1°) air temperature dataset was developed by Fang Shu and his team [41], who constructed separate temperature reconstruction models under varying weather conditions. To enhance the accuracy of the dataset, regional correction equations were established. As a result, a daily temperature dataset for China, covering maximum, minimum, and average temperatures (Tmax, Tmin, and Tavg) from 1979 to 2018, was produced. Relative humidity, evaporation, and sunshine duration data were obtained from reanalysis sources, with relative humidity derived from near-surface dew point temperature conversions. These meteorological variables provide essential input for hydroclimatic analysis in the context of long-term runoff change assessment.
In this study, hourly meteorological data including 2 m air temperature, dew point temperature, surface evaporation, and surface solar radiation were obtained from the ERA5-Land reanalysis dataset provided by the European Centre for Medium-Range Weather Forecasts (ECMWF) [42]. ERA5-Land offers global land-only data at a spatial resolution of 0.1° (~9 km) and hourly temporal resolution, making it highly suitable for regional hydrometeorological analyses. Relative humidity was not directly available in the ERA5-Land dataset; instead, it was computed using the near-surface air temperature and dew point. All meteorological variables were processed to daily scale and spatially averaged over each sub-basin to ensure consistency with hydrological observations.

3.1.2. Hydrological Data

The runoff data used in this study were derived from observed records at 12 hydrological stations distributed across the Songhua River Basin, and the data were systematically categorized by season: spring (March–May), summer (June–August), autumn (September–November), and winter (December–February).

3.2. Methods

Time series analysis is essential for understanding long-term trends and variability in hydrological and climatic processes [43]. The Mann–Kendall (MK) test, recommended by the WMO, is a widely used non-parametric method for detecting monotonic trends in hydroclimatic data due to its robustness and minimal distributional assumptions [44]. The Hurst exponent is commonly applied to assess long-range dependence on variables such as streamflow and precipitation. Wavelet analysis enables the identification of periodicities and time-frequency structures in hydrological series, providing insights into the multi-scale behavior of runoff and its relationship with climatic drivers [17,18].
This study uses MATLAB (R2023b) to conduct trend tests, Budyko model, and wavelet analysis on various meteorological and hydrological elements in the study area and evaluates the relationship between watershed runoff and local environmental factors.

3.2.1. Climate Tendency Rate

The climate tendency rate is a widely used metric to quantify long-term temporal trends of climatic variables such as precipitation and temperature. It provides a linear estimate of the rate of change per unit time and has been extensively applied in climatological and hydrological studies to detect gradual changes in regional climate conditions. The detailed calculation methods and statistical considerations for estimating such trends are well documented in the World Meteorological Organization guidelines and related literature [45].

3.2.2. Mann–Kendall Abrupt Change Detection

s k = i = 1 k r i , k = 2,3 , , n
The value of r i is defined by:
r i = + 1 x i > x j + 0 x i x j
The count of sk at time i is greater than at time j, and under the assumption of random independence of the time series, the statistic is defined as:
U F k = s k E s k Var s k , k = 1,2 , , n
When the statistic U F 1 = 0 , E s k , E s k and Var s k represent the mean and variance of the cumulative s k when x1, x2 … are independent and identically distributed, as expressed in the following:
var S k = k k 1 2 k + 5 72 E S k = k k 1 4 k = 2,3 , , n
The U F and U B statistics are crucial for detecting monotonic trends in the Mann–Kendall (MK) test. Specifically, the U F statistic evaluates the balance between the number of ascending and descending values within the time series, thereby reflecting the direction of the trend. In contrast, the U B statistic is derived from the reverse sequence of the data and measures the cumulative deviation of ranks, providing a complementary perspective on the temporal distribution of extreme values. The statistics U F k and U B k are typically plotted together with their corresponding significance thresholds. If U F k fluctuates near the critical boundary, it indicates the absence of a significant trend; values of U F k > 0 suggests an upward trend, while U F k < 0 denotes a downward trend. The intersection point between U F k and U B k that occurs within the significance boundary is considered the change point, which marks a potential abrupt shift in the series. This approach has been widely applied in hydro-meteorological studies for detecting both gradual trends and abrupt regime shifts [44].

3.2.3. Pettitt Abrupt Change Detection

The Pettitt test is a non-parametric method for detecting mean shifts in a time series. It does not require the data to follow a specific probability distribution and is capable of identifying both the number and timing of change points. The null hypothesis H 0 of the Pettitt test states that no change point exists within the time series. For a given time series x t , the test statistic sequence U t , T is defined as follows:
U t , T = U t 1 , T + k = 1 T s g n ( x t x k )
s g n ( x t x k ) = 1 , x j > x i 0 , x j = x i 1 , x j < x i
The statistic K t is defined such that it is satisfied at time t.
K t = m a x U t , T
Then, time t is identified as the most probable change point. A statistic p is constructed to test the significance of this change point.
p = 2 e x p 6 ( K t 2 ) / ( n 3 + n 2 )
If p ≤ 0.05, the null hypothesis is rejected, indicating that the detected change point is statistically significant.

3.2.4. R/S Analysis

The Hurst exponent is an important statistical indicator used to assess the long-term persistence and memory characteristics of hydrological and climatic time series. This study applies the rescaled range (R/S) analysis method to estimate the Hurst exponent, which is effective for identifying whether a time series exhibits random, persistent, or anti-persistent behavior. Specifically, the procedure involves dividing the original series into subsequences of equal length, computing the mean of each subsequence, and then deriving the cumulative deviation of each value from the mean. The range of this cumulative deviation is calculated together with the corresponding standard deviation, from which the rescaled range (R/S) is obtained. By repeating this process for different subsequence lengths and plotting log ( R / S ) against log ( n ) , the slope of the fitted regression line provides the estimate of the Hurst exponent. The methodological framework and practical applications of R/S analysis have been extensively described in hydrological literature [46,47].

3.2.5. Wavelet Analysis

Wavelet transform has become a widely used technique for analyzing non-stationary hydrometeorological time series, as it allows the decomposition of signals into time-frequency space using a series of localized wavelet functions. This dual-domain approach is particularly effective in identifying transient features and periodic structures in runoff and climate variables. Continuous wavelet transform (CWT) is often preferred for feature extraction and periodicity analysis, while discrete wavelet transform (DWT) is typically used for denoising and data compression due to its orthogonality and computational efficiency. The selection of the mother wavelet function plays a crucial role; for hydrological applications, the complex Morlet wavelet is commonly used because of its ability to simultaneously extract amplitude and phase information from time series [18,20]. Furthermore, wavelet coherence analysis extends these capabilities by assessing the co-variability and phase relationships between paired climatic and hydrological signals across multiple time scales [18,48].

3.2.6. Wavelet Coherence Analysis

Wavelet coherence analysis offers a robust approach to explore the co-variability between two non-stationary hydro-climatic time series within the time–frequency domain. This method identifies regions of high coherence—indicating synchronized fluctuations—and analyzes the phase relationship to infer lead–lag behavior. Typically, the complex Morlet wavelet is employed as the mother wavelet, enabling effective extraction of both amplitude and phase information. The computational procedure and interpretative framework for wavelet coherence have been rigorously described in hydrological studies [48].

3.2.7. Aridity Index

The aridity index is a crucial indicator used to assess the wetness and dryness of a region’s climate. It has been widely adopted in disciplines such as climatology, hydrology, and vegetation studies. The index is commonly calculated using the ratio of annual potential evapotranspiration to annual precipitation [49], as follows:
A I = E T 0 P
In this formula, AI represents the aridity index, ET0 denotes the annual potential evapotranspiration (in mm), and P stands for the annual precipitation (in mm). A higher aridity index indicates a drier climate, whereas a lower value suggests a more humid climate. In China, regions with an aridity index (AI) < 1.0 are classified as humid areas. Those with AI values between 1.0 and 1.5 are semi-humid, regions with AI between 1.5 and 4.0 are semi-arid, and areas where AI > 4.0 are classified as arid.

3.2.8. A Modified Budyko Attribution Method

The Budyko framework provides a widely used conceptual model for describing the long-term water balance at the catchment scale, linking precipitation ( P ), potential evapotranspiration ( E T 0 ), and actual evapotranspiration ( E T ) to runoff ( R ) under the constraint of water–energy balance [7,49]. In this framework, the partitioning of precipitation into evapotranspiration and runoff is primarily determined by climatic factors (aridity index φ = E T 0 / P ) and catchment characteristics (represented by a surface parameter n ). Runoff sensitivity to variations in precipitation, potential evapotranspiration, and surface conditions can be evaluated through elasticity analysis, which quantifies the relative contribution of each driver to runoff changes. The modified Budyko attribution method applied in this study therefore enables decomposition of runoff variability into components driven by climate change (precipitation and E T 0 ) and by changes in underlying surface properties (parameter n ), providing a robust diagnostic framework for hydrological attribution.
R = P P × E T 0 P n + E T 0 n 1 / n
where R represents the watershed mean annual runoff depth, measured in millimeters (mm). The parameter n is the surface characteristic, while P is the mean annual precipitation within the watershed, measured in mm. Furthermore, E T 0 is the mean annual potential evapotranspiration within the watershed, also in mm.
Changes in watershed runoff, induced by climate change and alterations in surface conditions, are represented as follows:
d R = R E T 0 d E T 0 + R P d P + R n d n
The elasticity coefficient of runoff with respect to the selected variable xi is formulated into the following function:
ε x i = R x i × x i R
where xi denotes the potential evapotranspiration E T 0 , precipitation P, or underlying surface parameter n. By integrating Equations (14) and (15), we derive the following expressions:
R E T 0 = E T 0 n × P P × E T 0 n + P n P n + E T 0 n 1 n + 1
R P = P n + E T 0 n 1 n + 1 E T 0 n + 1 P n + E T 0 n 1 n + 1
R n = P × E T 0 n × P n + P 1 n ln P n + E T 0 n n 2 P n ln P + E T 0 n ln E T 0 n n P n + E T 0 n
E T 0 n R = E T 0 n × P n + E T 0 n 1 n P × P n + E T 0 n 1 n E T 0 × P
P R = P n + E T 0 n 1 n P n + E T 0 n 1 n E T 0
n R = n × P n + E T 0 n 1 n P × P n + E T 0 n 1 n E T 0 × P
Define the variable φ , where φ = E T 0 / P . Utilizing Equations (14)–(21), the runoff elasticity coefficient is derived as:
ε E T 0 = R E T 0 × E T 0 n R = 1 1 + φ n 1 1 + φ n 1 / n
ε P = R P × P R = 1 + φ n 1 / n + 1 φ n + 1 1 + φ n 1 + φ n 1 / n φ
ε n = R n × n R = ln 1 + φ n + φ n ln 1 + φ n n 1 + φ n 1 + φ n 1 / n + 1
The contribution of each factor to runoff variation can subsequently be quantified.
d x i = ε x i R x i d x i
C x i = d R x i d R × 100 %
where d x i represents the change in E T 0 , P , or n . C x i represents the contribution of E T 0 , P , or n to runoff changes.

4. Results

4.1. Time Trend and Abrupt Change

4.1.1. Trend Analysis

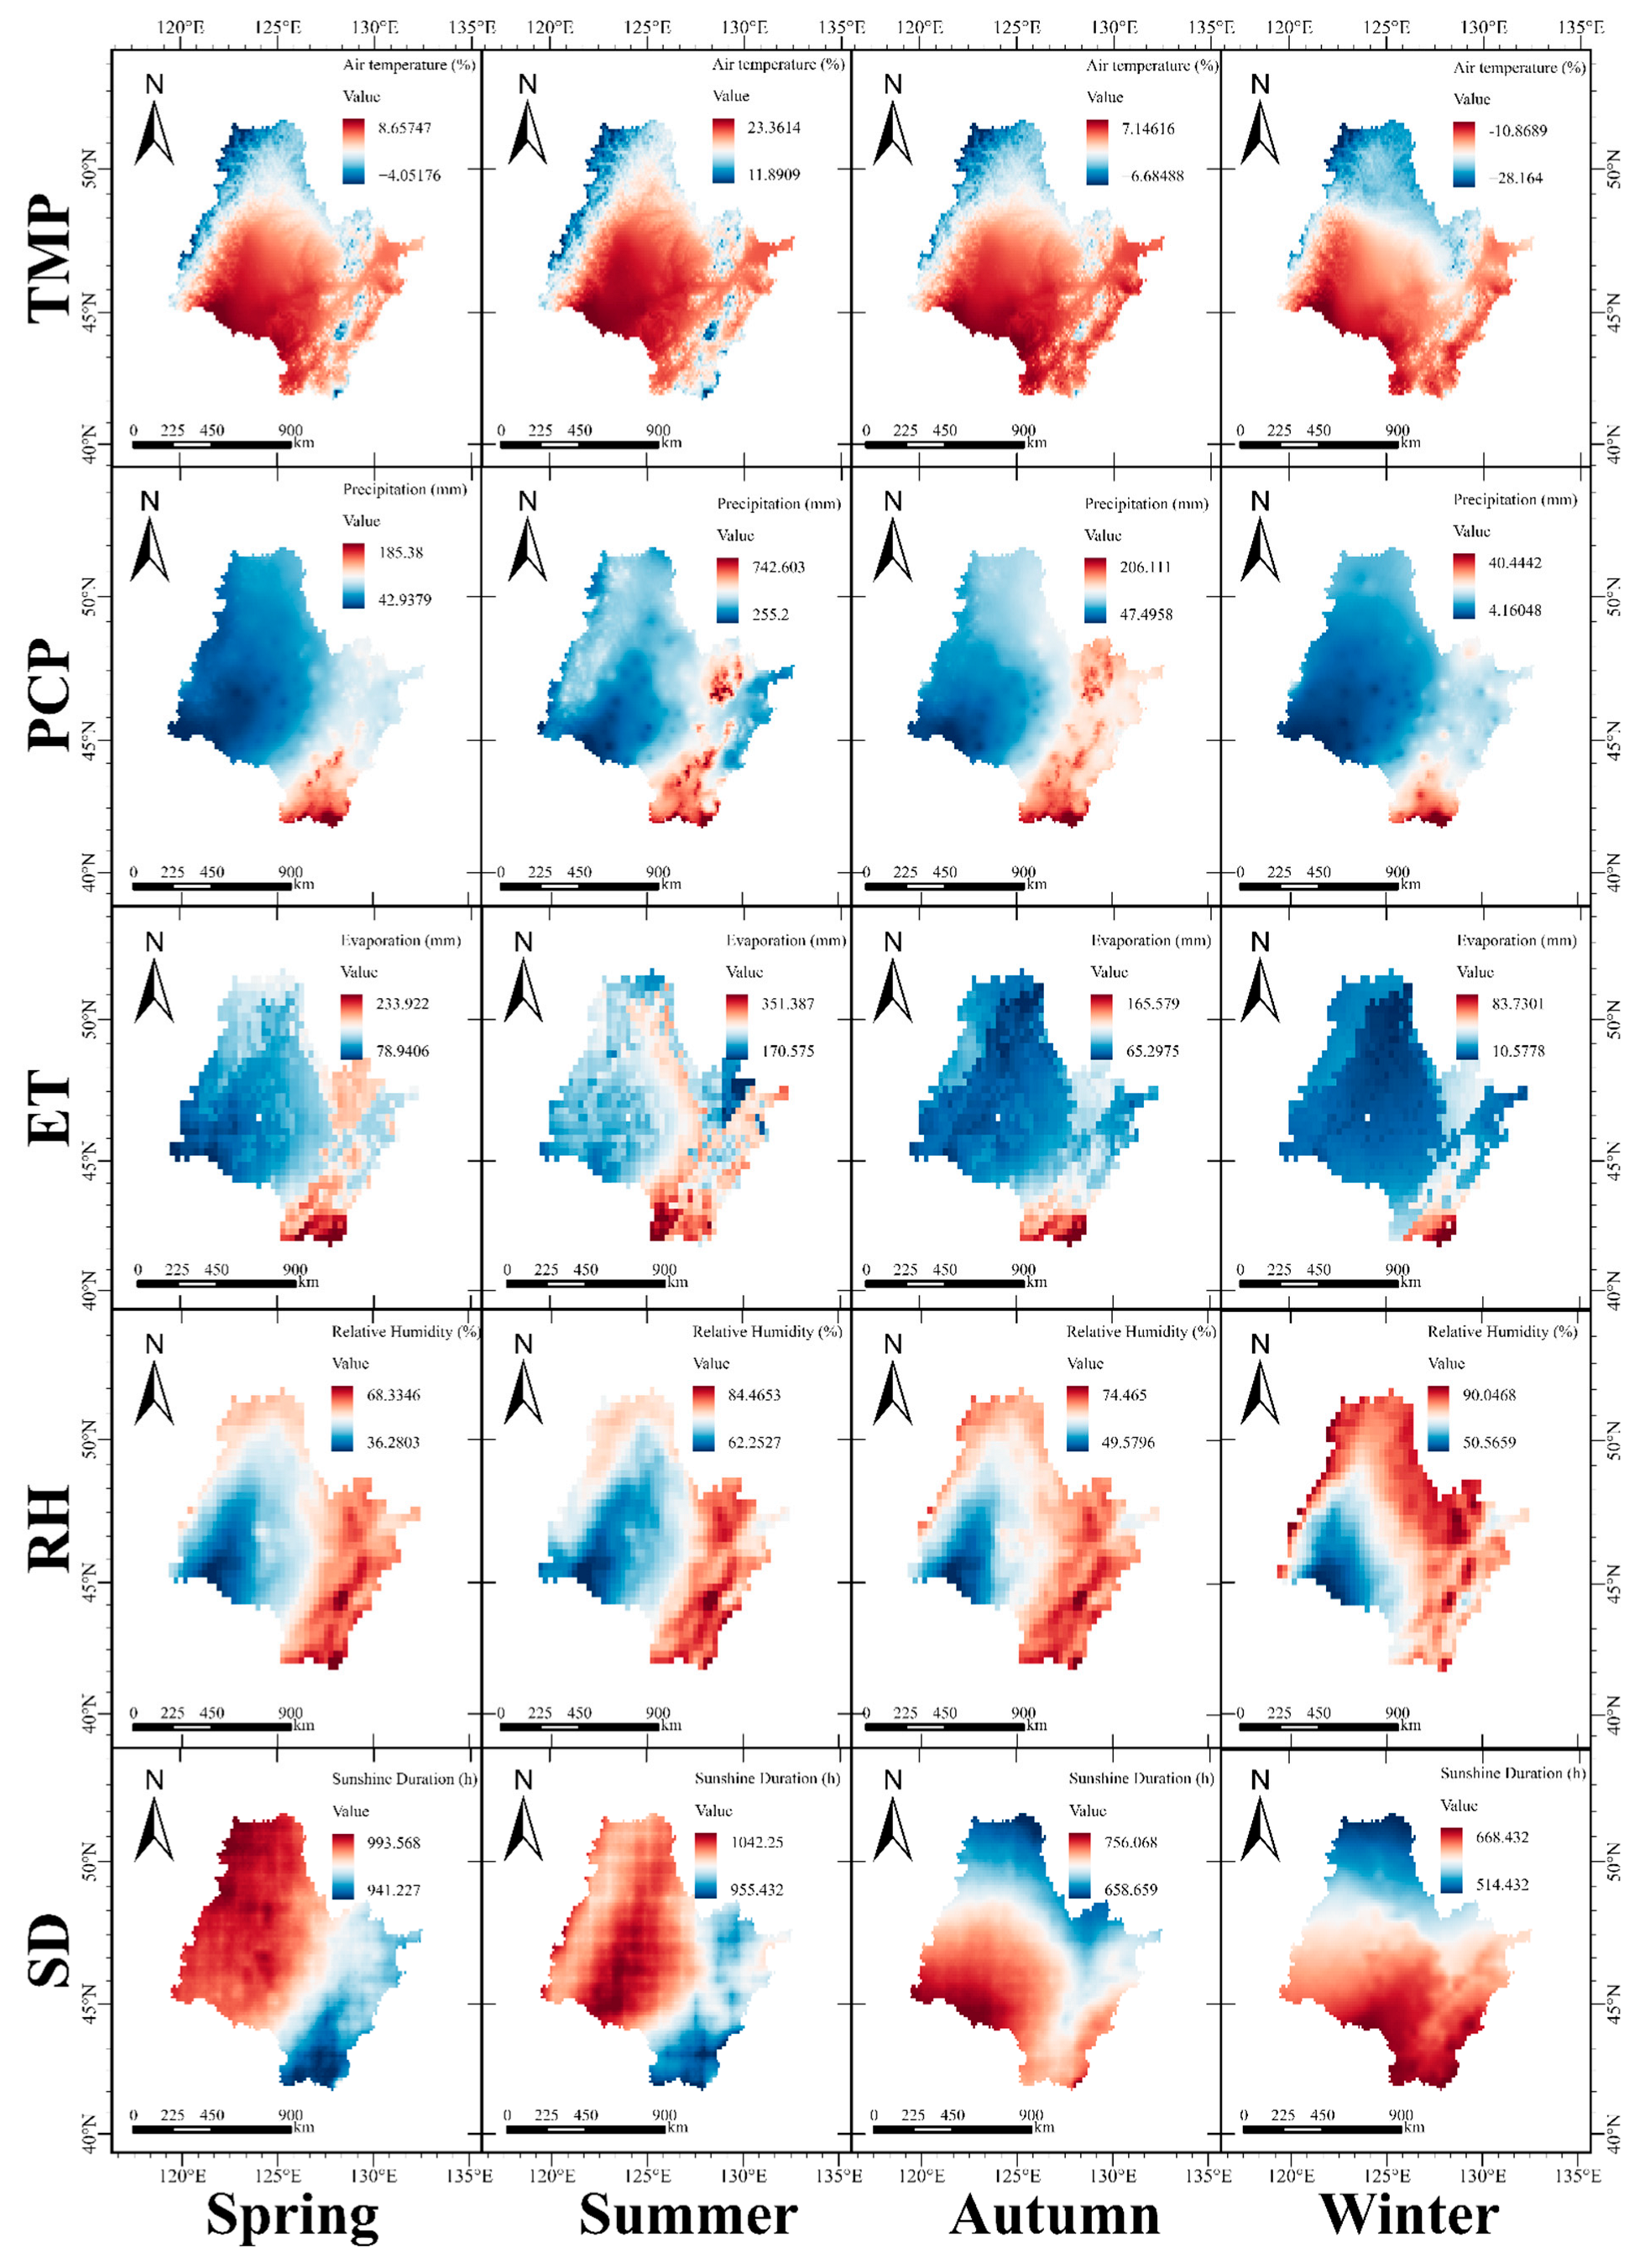
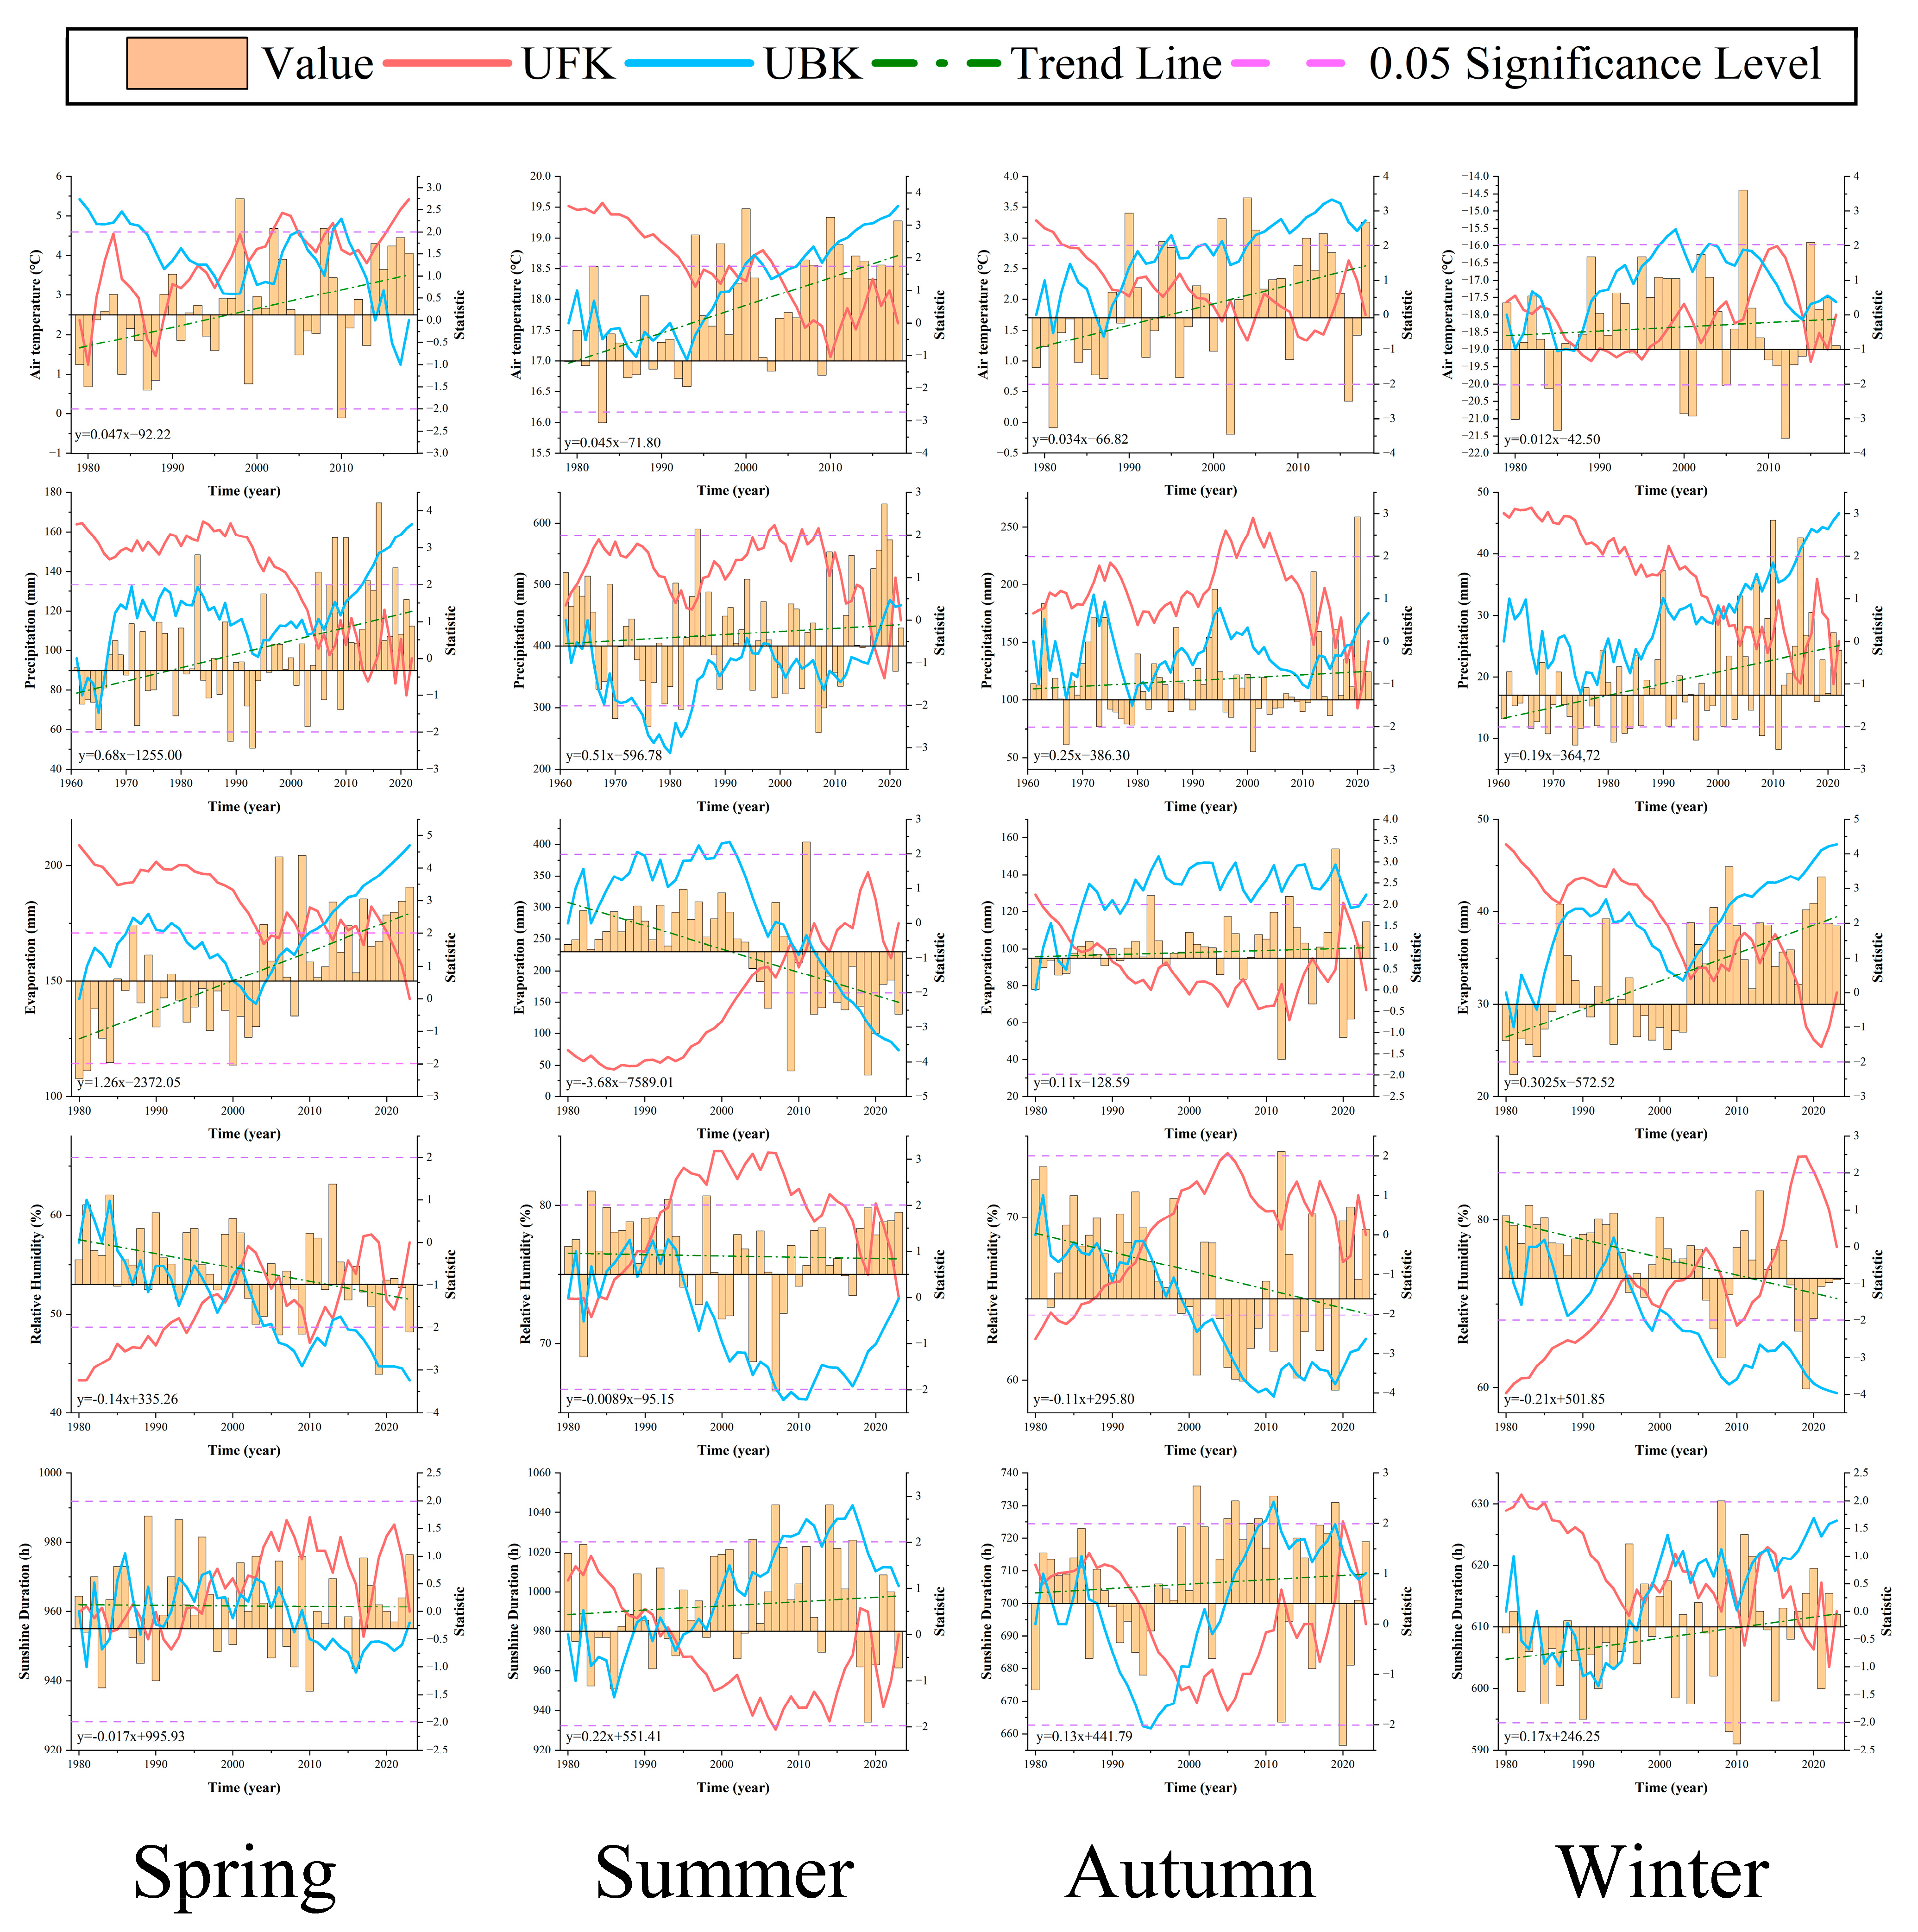
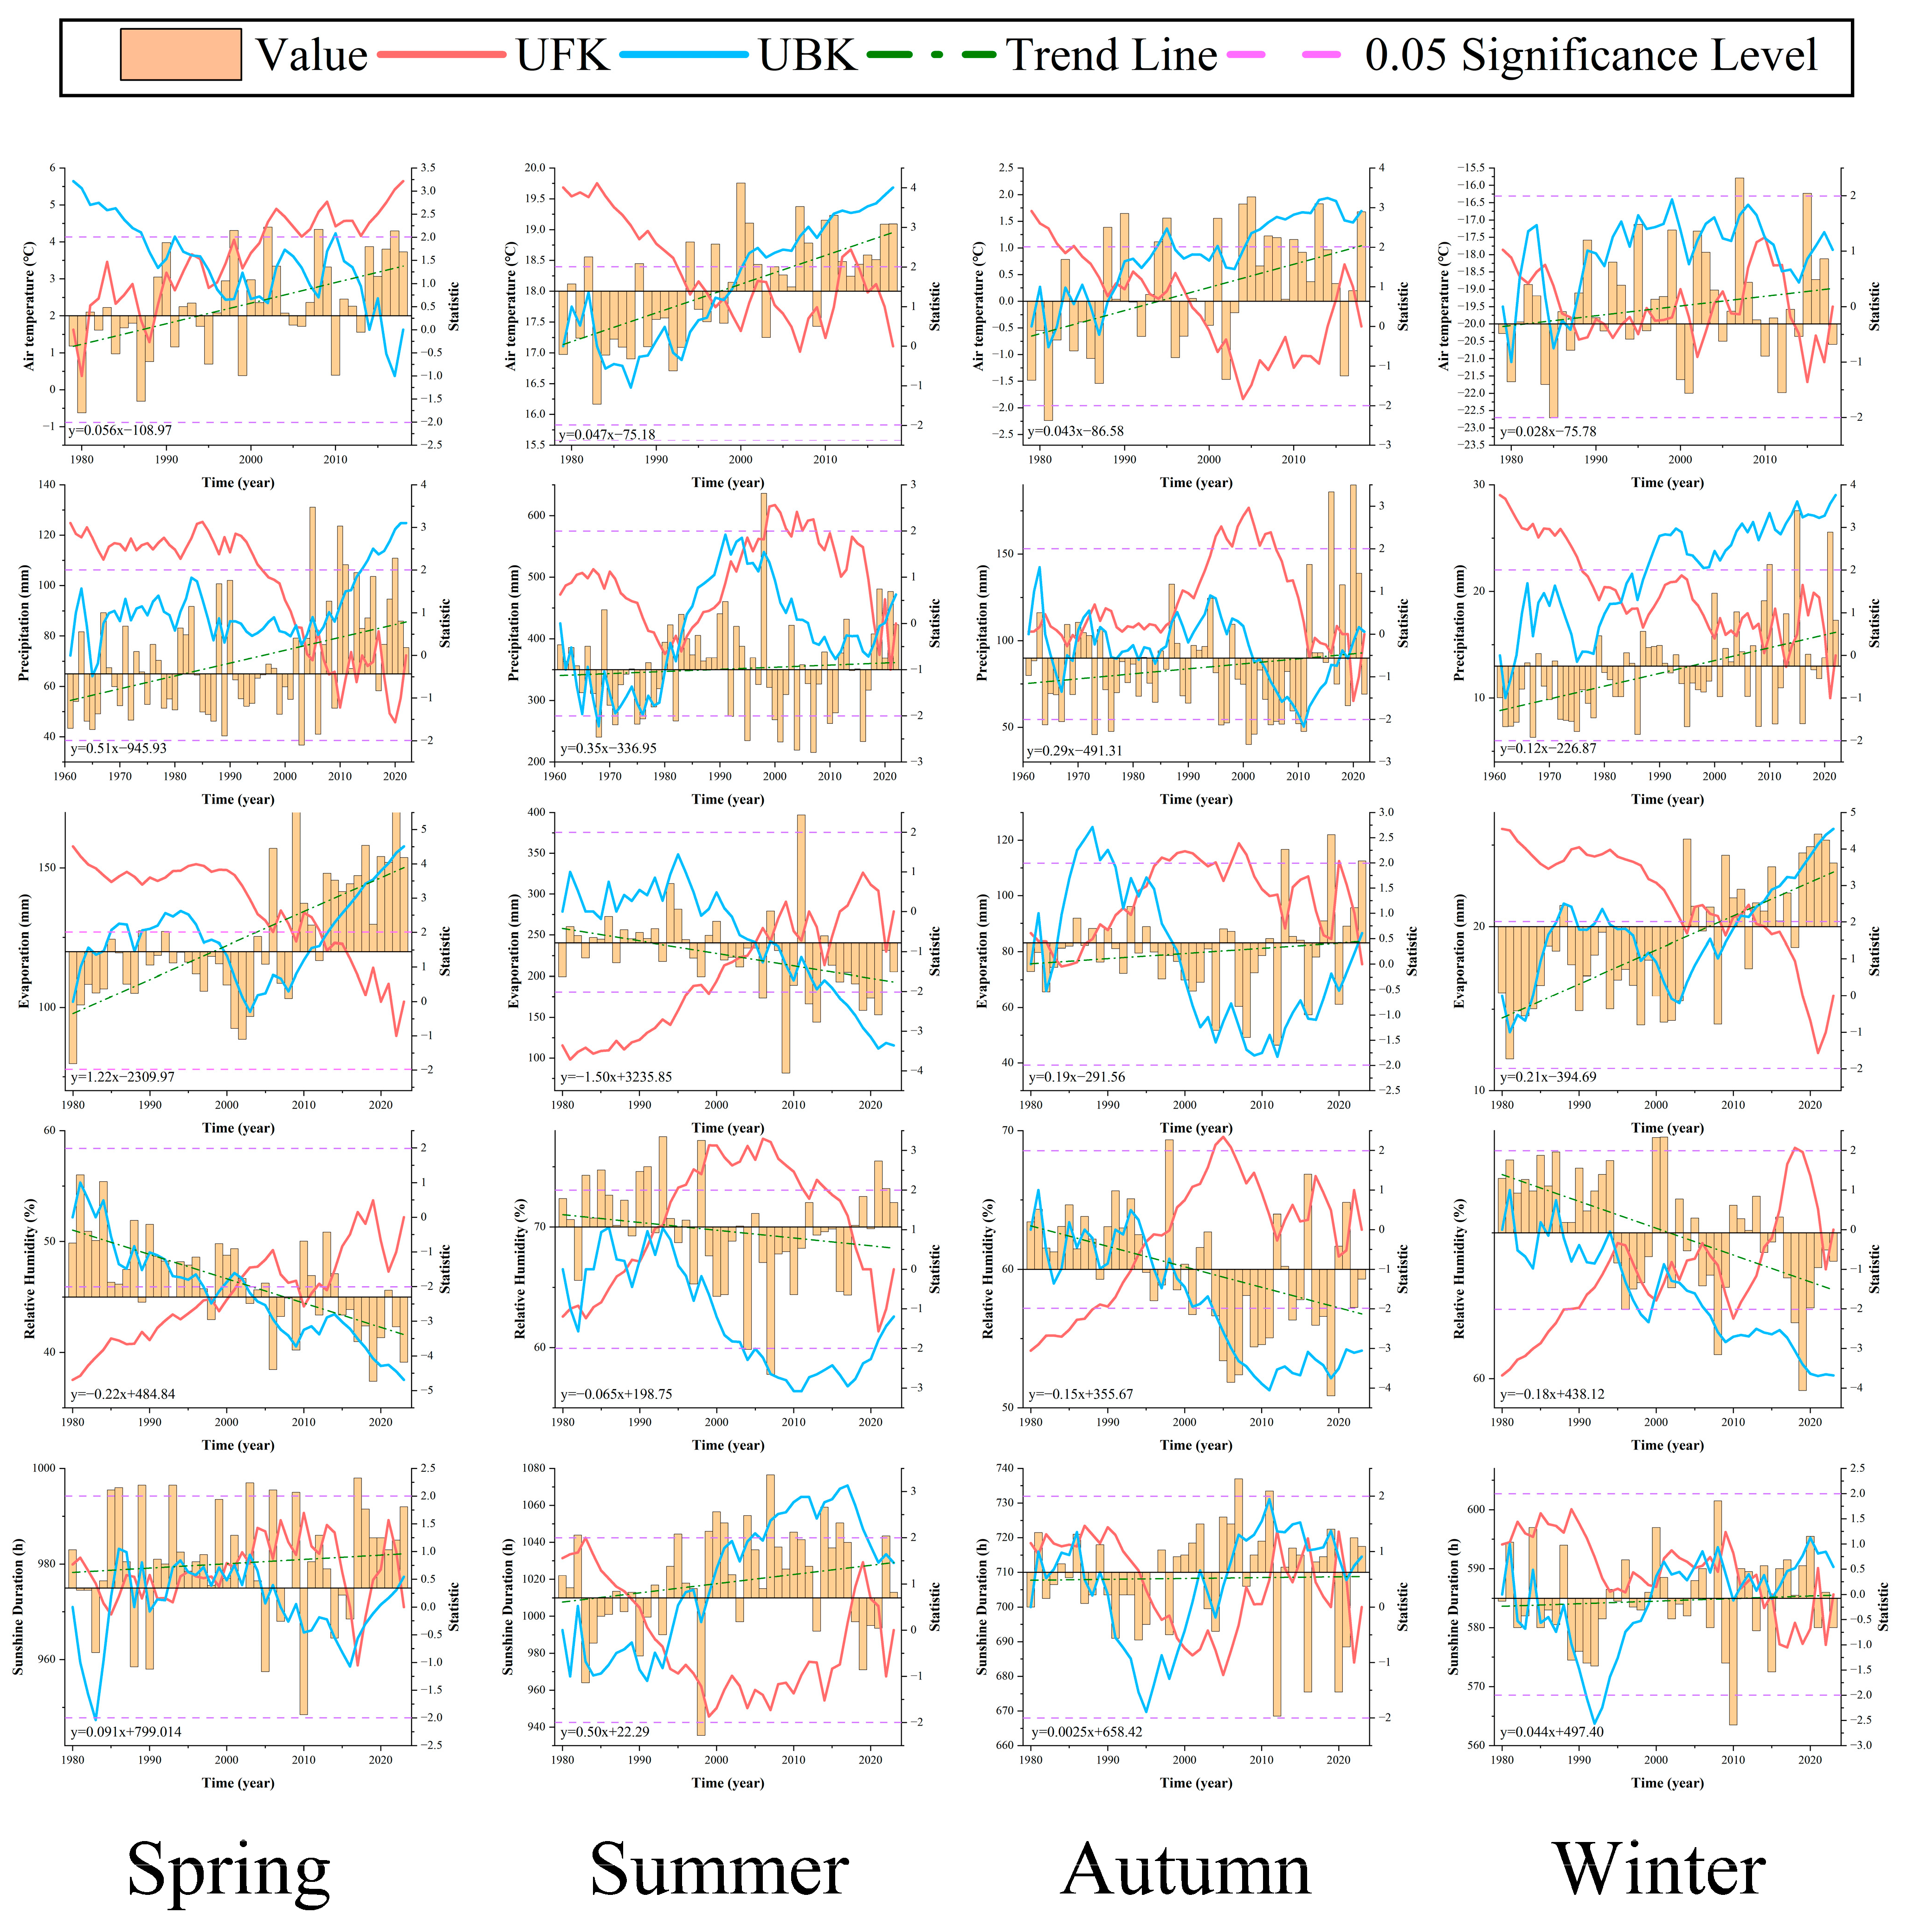
Spatial distribution of long-term seasonal mean of the meteorological elements considered in this study like: Figure A1 in Appendix A: Spatial distribution of long-term seasonal mean of temperature, precipitation, potential evapotranspiration, relative humidity, and sunshine duration in the Songhua River Basin. Figure 2, Figure 3 and Figure 4 further depict the temporal variations in these key meteorological variables in the main stream basin of the Songhua River, the Second Songhua River Basin, and the Nenjiang River Basin from 1980 to 2022.
Analysis of Figure 2 reveals that the main stream basin experienced a significant warming trend during 1980–2022, with mean temperature increasing at rates of 0.047 °C·year−1 in spring, 0.045 °C·year−1 in summer, 0.034 °C·year−1 in autumn, and 0.012 °C·year−1 in winter. The strongest warming occurred in spring, while winter exhibited a relatively weaker increase, which may be linked to earlier snowmelt and altered surface energy balance. Precipitation showed an increasing trend, particularly in spring (0.68 mm·year−1) and summer (0.51 mm·year−1), suggesting intensification of warm-season rainfall. Autumn and winter precipitation also increased, by 0.25 mm·year−1 and 0.19 mm·year−1, respectively. Evaporation generally increased, with the most pronounced rise in spring (1.26 mm·year−1), while summer exhibited a decline (−3.68 mm·year−1). Relative humidity showed a downward trend across all seasons, especially in winter (−0.21%·year−1), indicating increasing aridification. Sunshine duration displayed mixed signals, with decreases in spring (−0.017 h·year−1) and autumn (0.13 h·year−1), but increases in summer (0.22 h·year−1) and winter (0.17 h·year−1), reflecting seasonal differences in atmospheric turbidity and cloud cover.
Refer to Figure 3, in the Second Songhua River Basin, air temperature exhibited a consistent upward trend across all seasons, with rates of 0.046 °C·year−1 in spring, 0.019 °C·year−1 in summer, 0.012 °C·year−1 in autumn, and −0.013 °C·year−1 in winter. The most pronounced warming was observed in spring and summer, highlighting stronger sensitivity to climate change in the warm season, while a slight cooling signal appeared in winter. Precipitation increased slightly in spring (0.081 mm·year−1) and autumn (0.079 mm·year−1), while summer precipitation showed a negative rate (−0.55 mm·year−1), indicating reduced intensification of summer rainfall. Seasonal variations in evaporation were evident, with spring exhibiting a sharp increase (1.37 mm·year−1), summer a slight decline (−0.13 mm·year−1), autumn a modest rise (0.40 mm·year−1), and winter a pronounced increase (0.75 mm·year−1). Relative humidity generally declined, with rates of −0.15%·year−1 in spring, −0.12%·year−1 in autumn, and −0.19%·year−1 in winter, suggesting a drier atmospheric environment. Sunshine duration showed an upward trend, especially in summer (0.25 h·year−1) and winter (0.20 h·year−1), possibly reflecting reduced cloudiness or improved atmospheric transparency.
Refer to Figure 4, the Nenjiang River Basin exhibited the most pronounced warming among the three sub-basins, with temperature increases of 0.056 °C·year−1 in spring, 0.047 °C·year−1 in summer, 0.031 °C·year−1 in autumn, and 0.022 °C·year−1 in winter. Precipitation increased substantially, with summer and autumn rates of 0.35 mm·year−1 and 0.26 mm·year−1, respectively, indicating more frequent convective and frontal precipitation events. Evaporation also increased overall, particularly in spring (1.22 mm·year−1) and autumn (0.43 mm·year−1), which may exacerbate soil moisture deficits. Relative humidity showed a continuous decline, with the largest decrease in winter (−0.27%·year−1), reflecting drier cold-season atmospheric conditions. Sunshine duration increased in most seasons, notably in summer (0.50 h·year−1) and autumn (0.24 h·year−1), suggesting enhanced occurrence of clear-sky days.

4.1.2. Abrupt Change

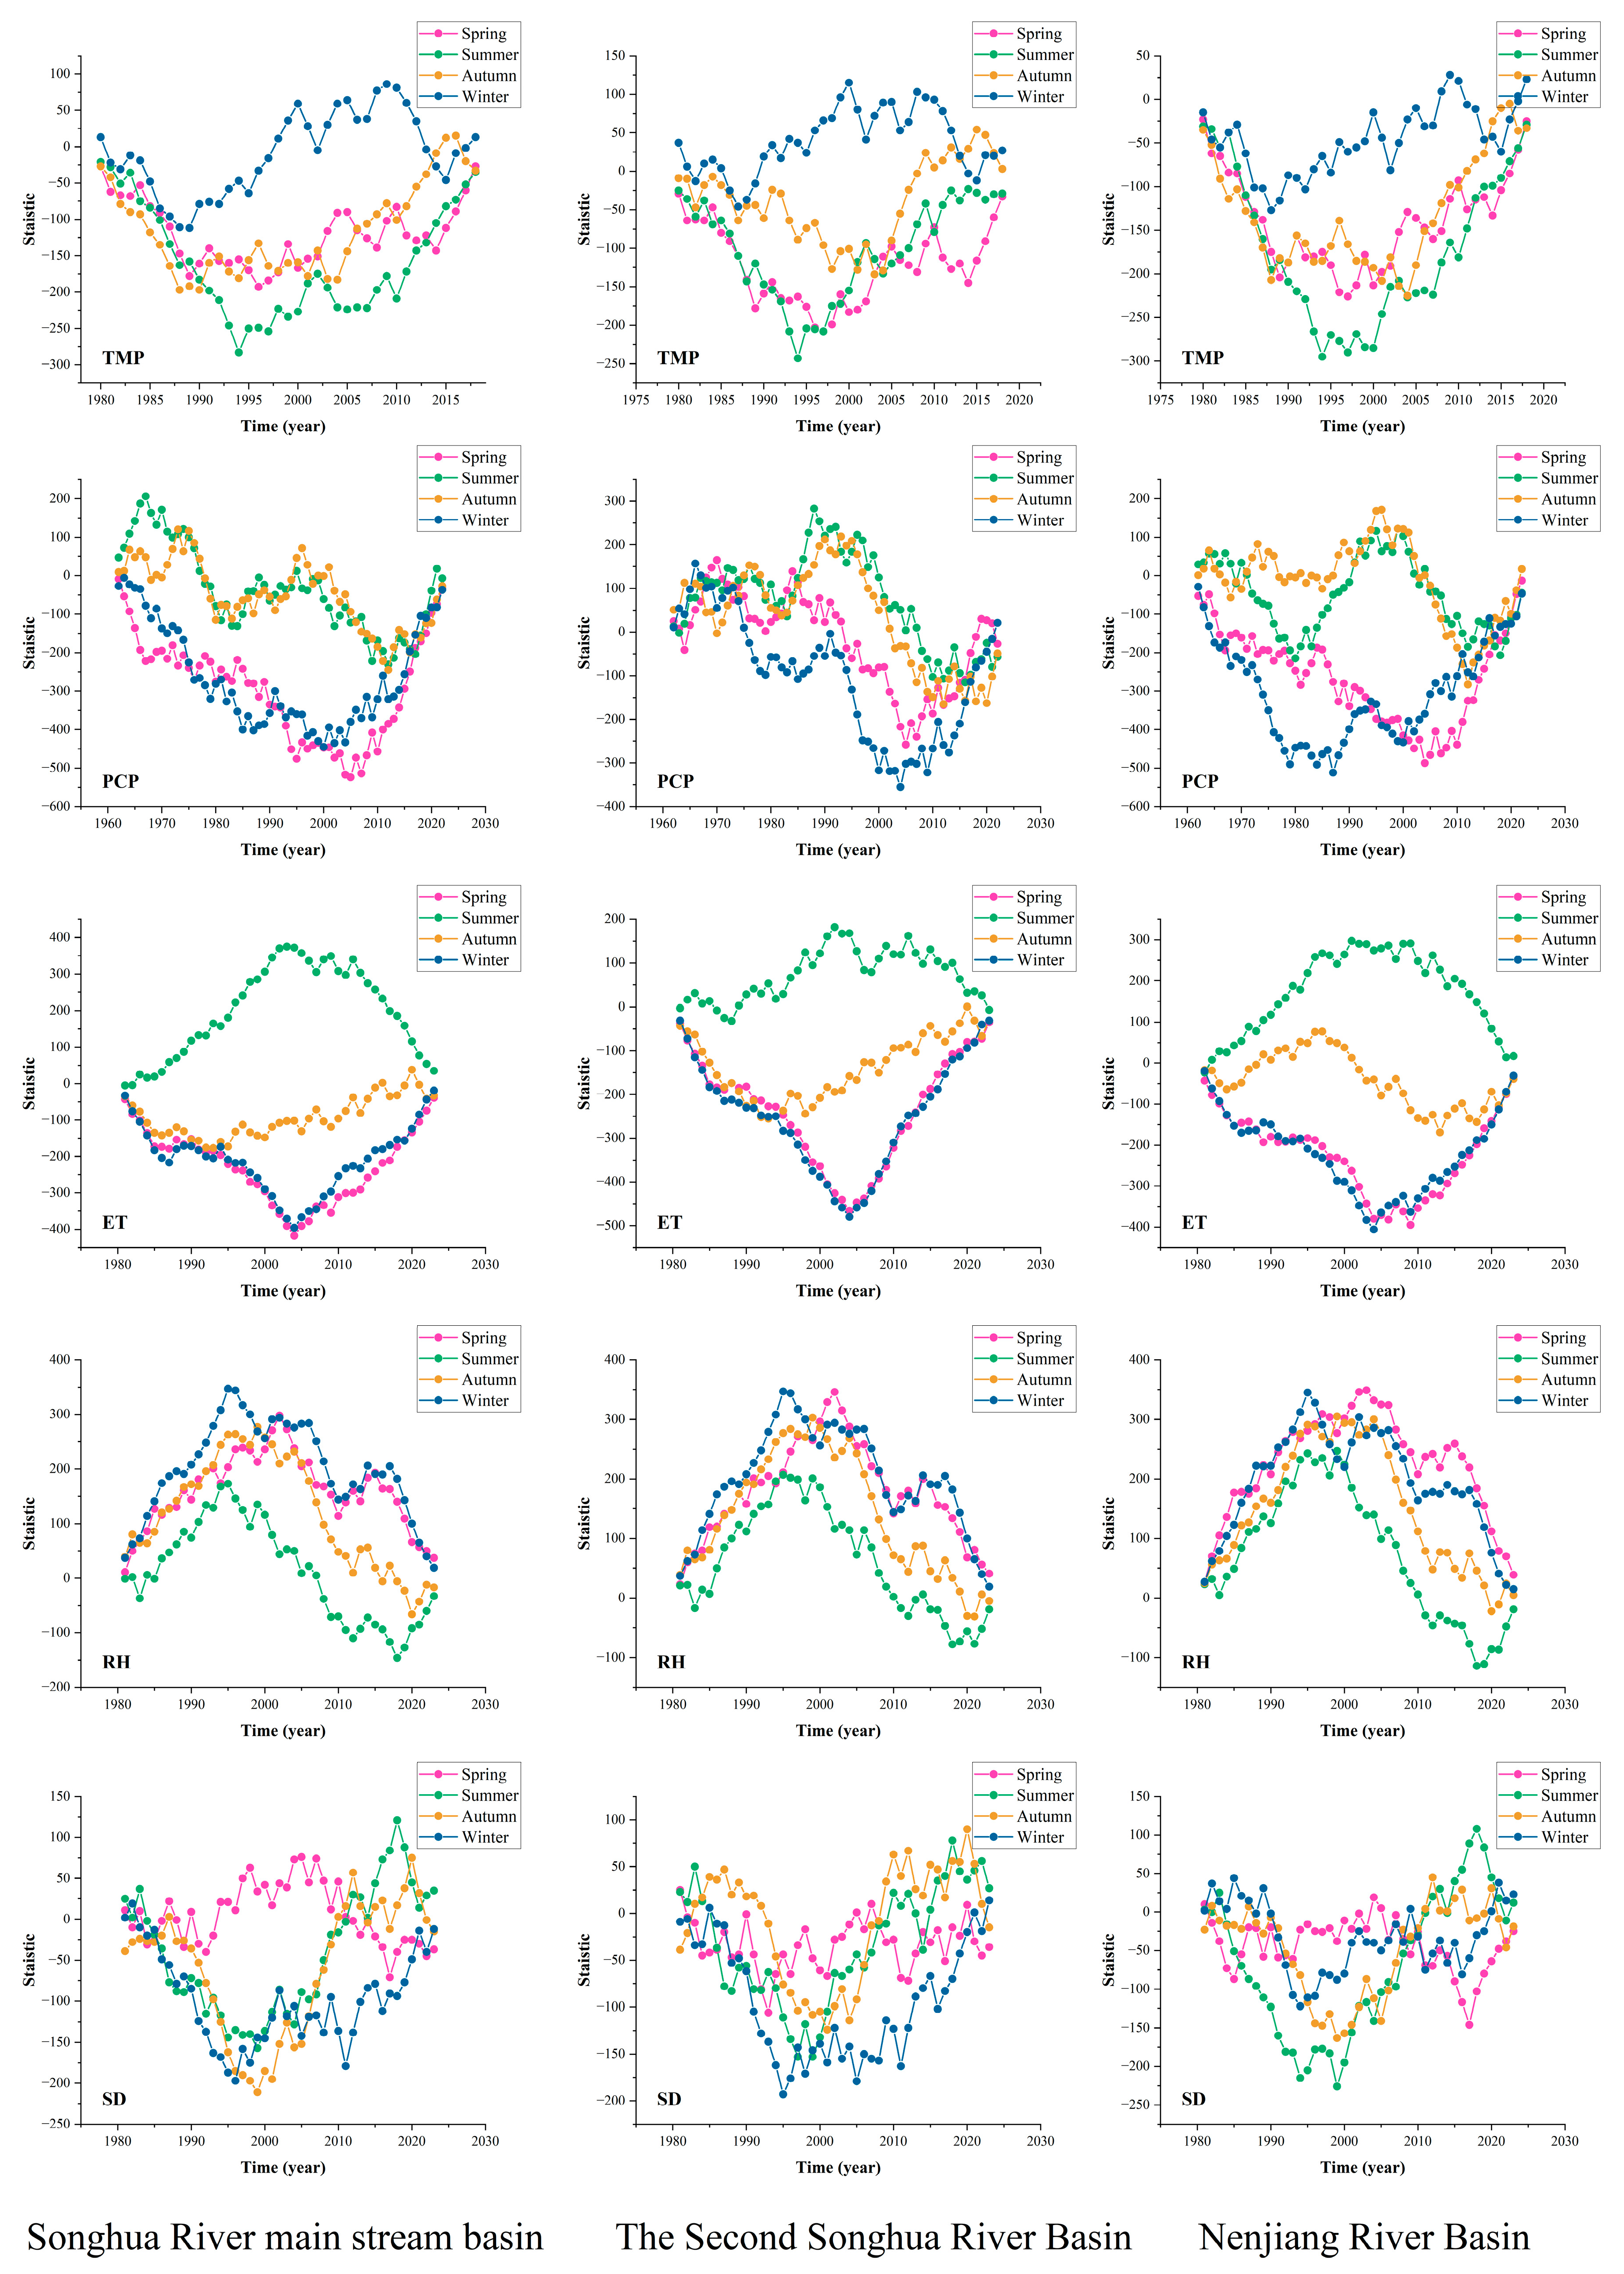
Based on the combined application of the Mann–Kendall test (MK) and the Pettitt test (Pettitt) for five categories of meteorological variables—air temperature, precipitation, evaporation, relative humidity, and sunshine duration—across different seasons from 1980 to 2022 in each sub-basin, we conducted an integrated assessment of both long-term trends and abrupt changes. To enhance the robustness of the analysis, the MK statistics (UFK and UBK curves) and Pettitt statistic (K) were jointly plotted on the same graphs (Figure 2, Figure 3, Figure 4 and Figure 5), allowing direct comparison of the periods with significant monotonic trends and the timing of abrupt shifts. The main mutation years detected by the Pettitt test are summarized in Table 2.
In the main stream basin of the Songhua River, multiple meteorological variables showed distinct seasonal patterns. Air temperature exhibited a significantly increasing and stable trend during spring, summer, and autumn, with abrupt shifts mainly in the mid to late 1990s, indicating persistent warming. Precipitation displayed increasingly fluctuating trends in summer and autumn, with notable change points concentrated around the late 1990s to early 2000s, reflecting enhanced variability in moisture transport processes. Evaporation decreased in stages during spring and summer, accompanied by shifts in the early 2000s, suggesting changes in the coupling between energy and water availability. Relative humidity markedly declined in winter, with breaks detected mainly in the late 1990s, indicating a gradual trend toward regional aridification. Sunshine duration remained relatively stable, except for a slight summer decrease since the early 2000s.
In the Second Songhua River Basin, meteorological variables also exhibited pronounced seasonal variability. Air temperature increases were evident across all seasons, with abrupt rises during the mid-1990s to early 2000s, reflecting sustained regional warming. Precipitation showed substantial fluctuations in autumn and winter, with shifts mostly occurring around the late 1990s and 2010s, indicating strong interseasonal variability. Evaporation slightly increased in spring but decreased in summer, with breaks in the early 2000s, suggesting seasonal differentiation in surface water loss mechanisms. Relative humidity varied considerably in spring and showed fluctuations in winter, with most change points occurring between the mid-1990s and late 2000s, implying adjustments in the regional wet-dry regime during non-growing seasons. Sunshine duration increased most prominently in summer and autumn, especially after change points in the early 2000s, indicating improved solar radiation conditions that may benefit crop development.
In the Nenjiang River Basin, meteorological trends showed high consistency and significance, with particularly prominent warming signals in high-latitude regions. Air temperature increases were clearly observed during spring, summer, and autumn, with shifts concentrated in the mid-1990s, indicating a coherent warming signal. Precipitation intensified primarily in summer, with abrupt increases occurring mostly after the early 2000s, suggesting a stronger hydrological response to extreme weather events. Evaporation showed a notable increasing trend in spring and autumn, with breaks in the early 2000s, indicating changes in surface energy redistribution mechanisms. Relative humidity exhibited a consistent decreasing trend in winter, with change points in the late 1990s, reflecting enhanced aridification during the cold season. Sunshine duration increased overall in summer and autumn, with marked rises after the early 2000s, suggesting reduced cloud cover and improved atmospheric transparency.

4.2. Sen’s Slope Trends

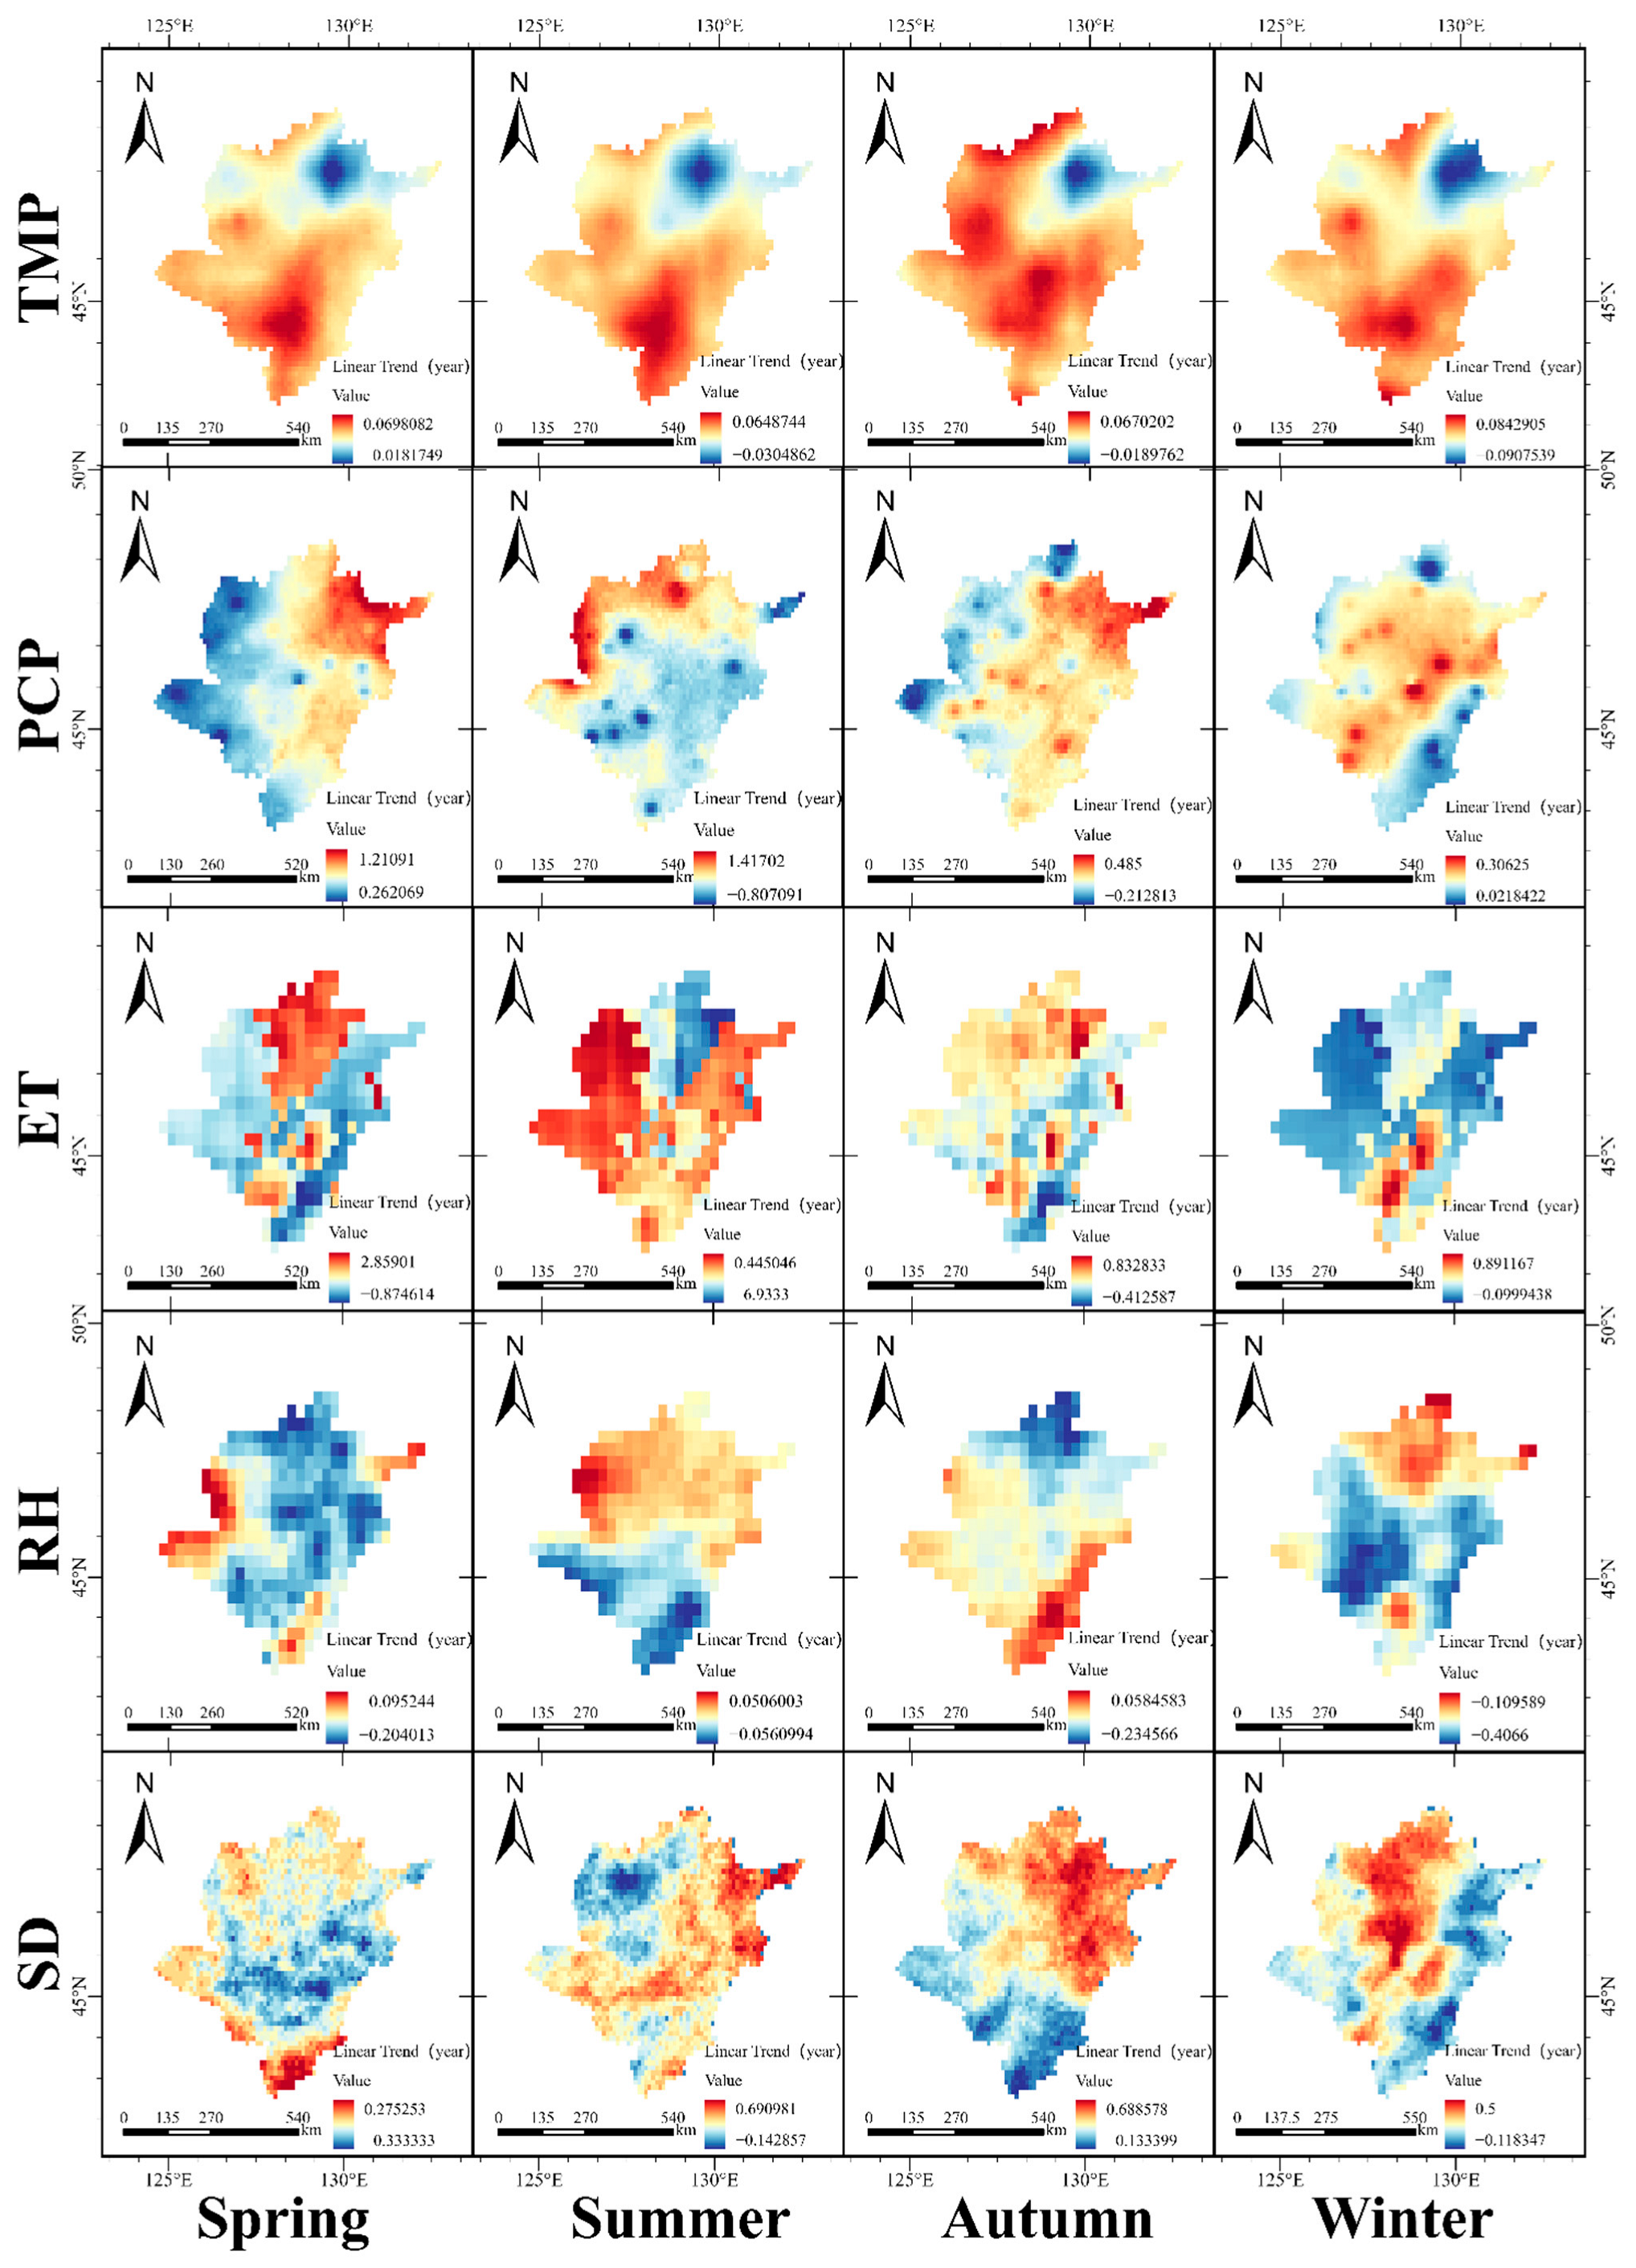
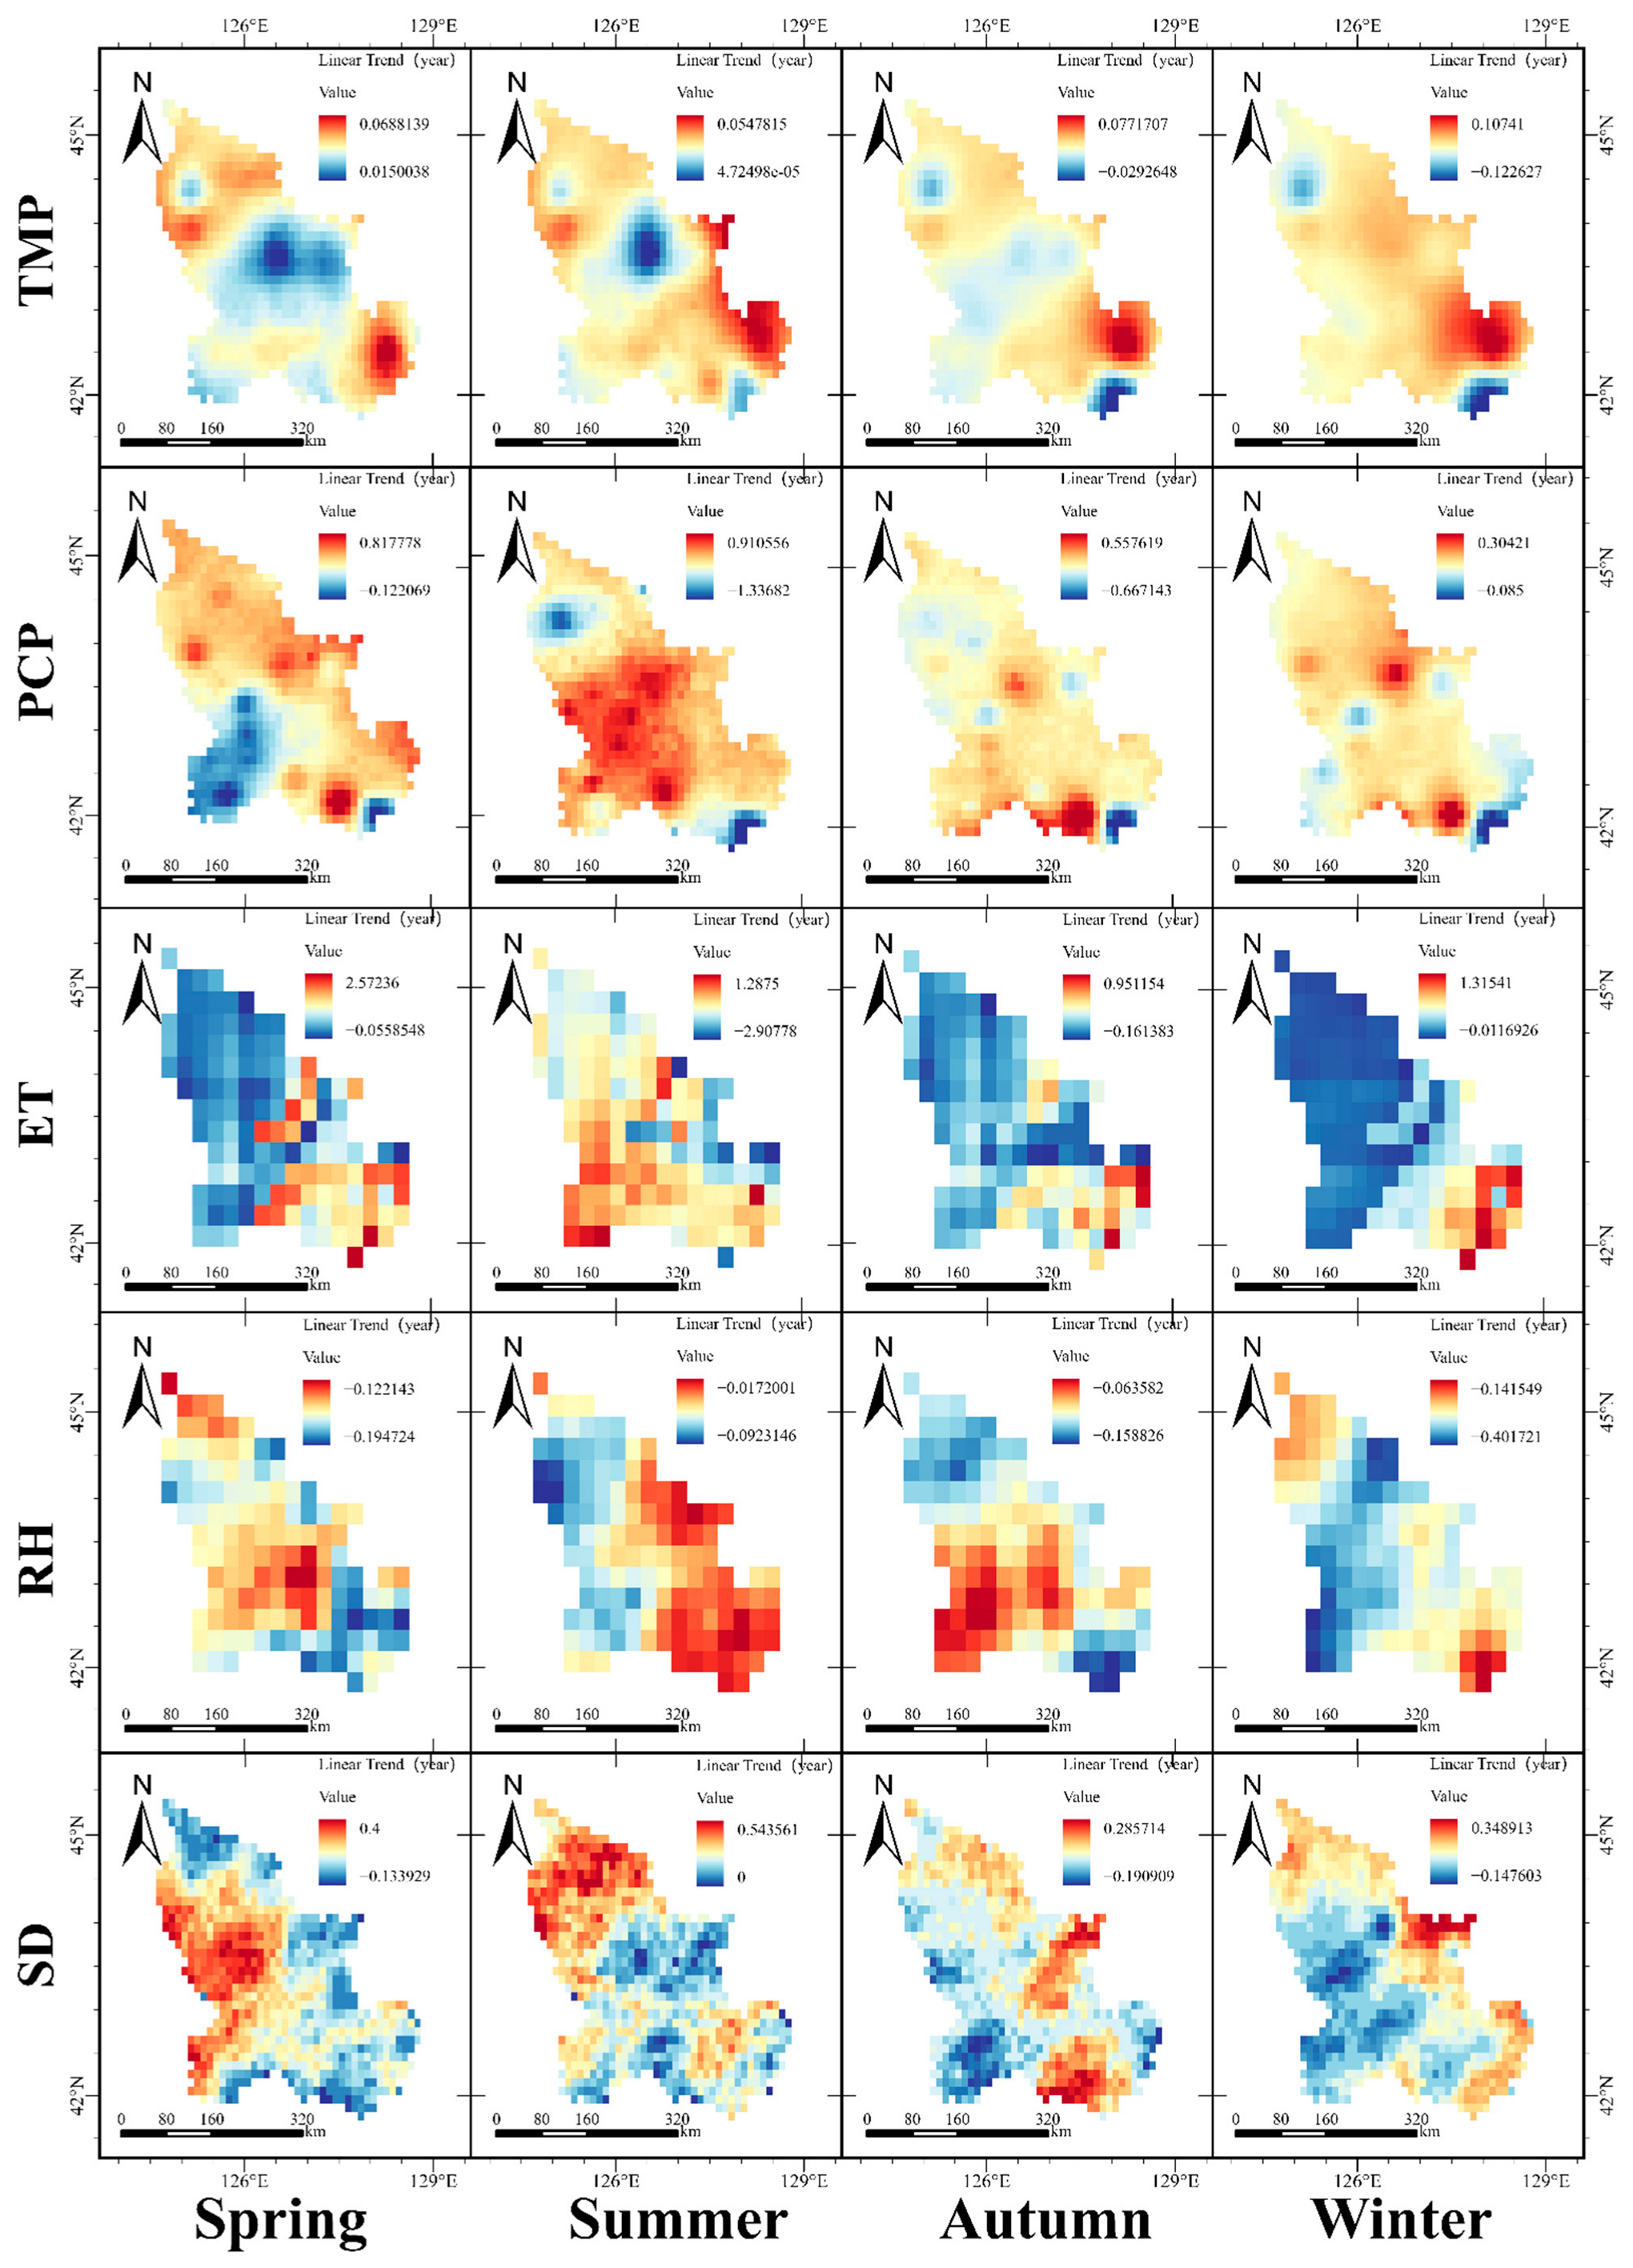
Figure 6, Figure 7 and Figure 8 illustrate the spatial distribution of Sen’s slope trends for meteorological variables in the main stream basin of the Songhua River, the Second Songhua River Basin, and the Nenjiang River Basin, respectively, during the period 1980–2022. In the mainstream Songhua River Basin (Figure 6), spring air temperature exhibited a general increasing trend, with the most pronounced warming (≥0.2 °C per decade) in the central and western regions, while slight cooling (≤−0.1 °C per decade) was observed locally in the northeast. Precipitation increased in the northeastern part of the basin but declined in the central and western areas, with a rate of change of up to ±5% per decade. Evapotranspiration increased notably in regions where warming and precipitation intensification coincided (≥0.5 mm per decade), whereas other areas generally showed a decreasing trend. Relative humidity increased in the southeastern region but showed a marked decrease (≤−0.2% per decade) in the central and northern parts. Sunshine duration increased across most areas, while a slight decline was observed (≤−0.3 h per decade) in the eastern regions. During summer, air temperature rose significantly (≥0.3 °C per decade) throughout the basin, with the most intense warming in the central and western parts. Precipitation exhibited a southeast-decreasing and northwest-increasing pattern, with significant spatial heterogeneity (±4% per decade). Evapotranspiration intensified markedly (≥0.5 mm per decade), particularly in the western region. Relative humidity showed a northward increasing and southward decreasing trend, in response to variations in temperature and precipitation. Sunshine duration increased significantly (≥0.5 h per decade) across the entire basin, especially in the river valleys of the central and eastern regions. In autumn, temperature increases were significant (≥0.3 °C per decade) in the central and western regions, with localized cooling (≤−0.1 °C per decade) in the east. Precipitation increased primarily in the southeastern portion, while it declined in central and western areas. Evapotranspiration exhibited a pattern of stronger intensification (≥0.4 mm per decade) in the north and east compared to the south and west. Relative humidity increased in the south but decreased in the north. Sunshine duration increased significantly (≥0.4 h per decade) in the northeast but declined in the southern part of the basin. In winter, mean air temperature increased markedly (≥0.4 °C per decade) across the basin. Precipitation increased in the northeastern region but decreased significantly (≤−5% per decade) in the southern areas. Evapotranspiration decreased in most regions, with slight increases (≤+0.1 mm per decade) in localized central-southern areas. Relative humidity declined throughout the basin, with the largest decreases occurring in the central and western regions. Sunshine duration increased across the majority of the area.

4.3. Hurst Value

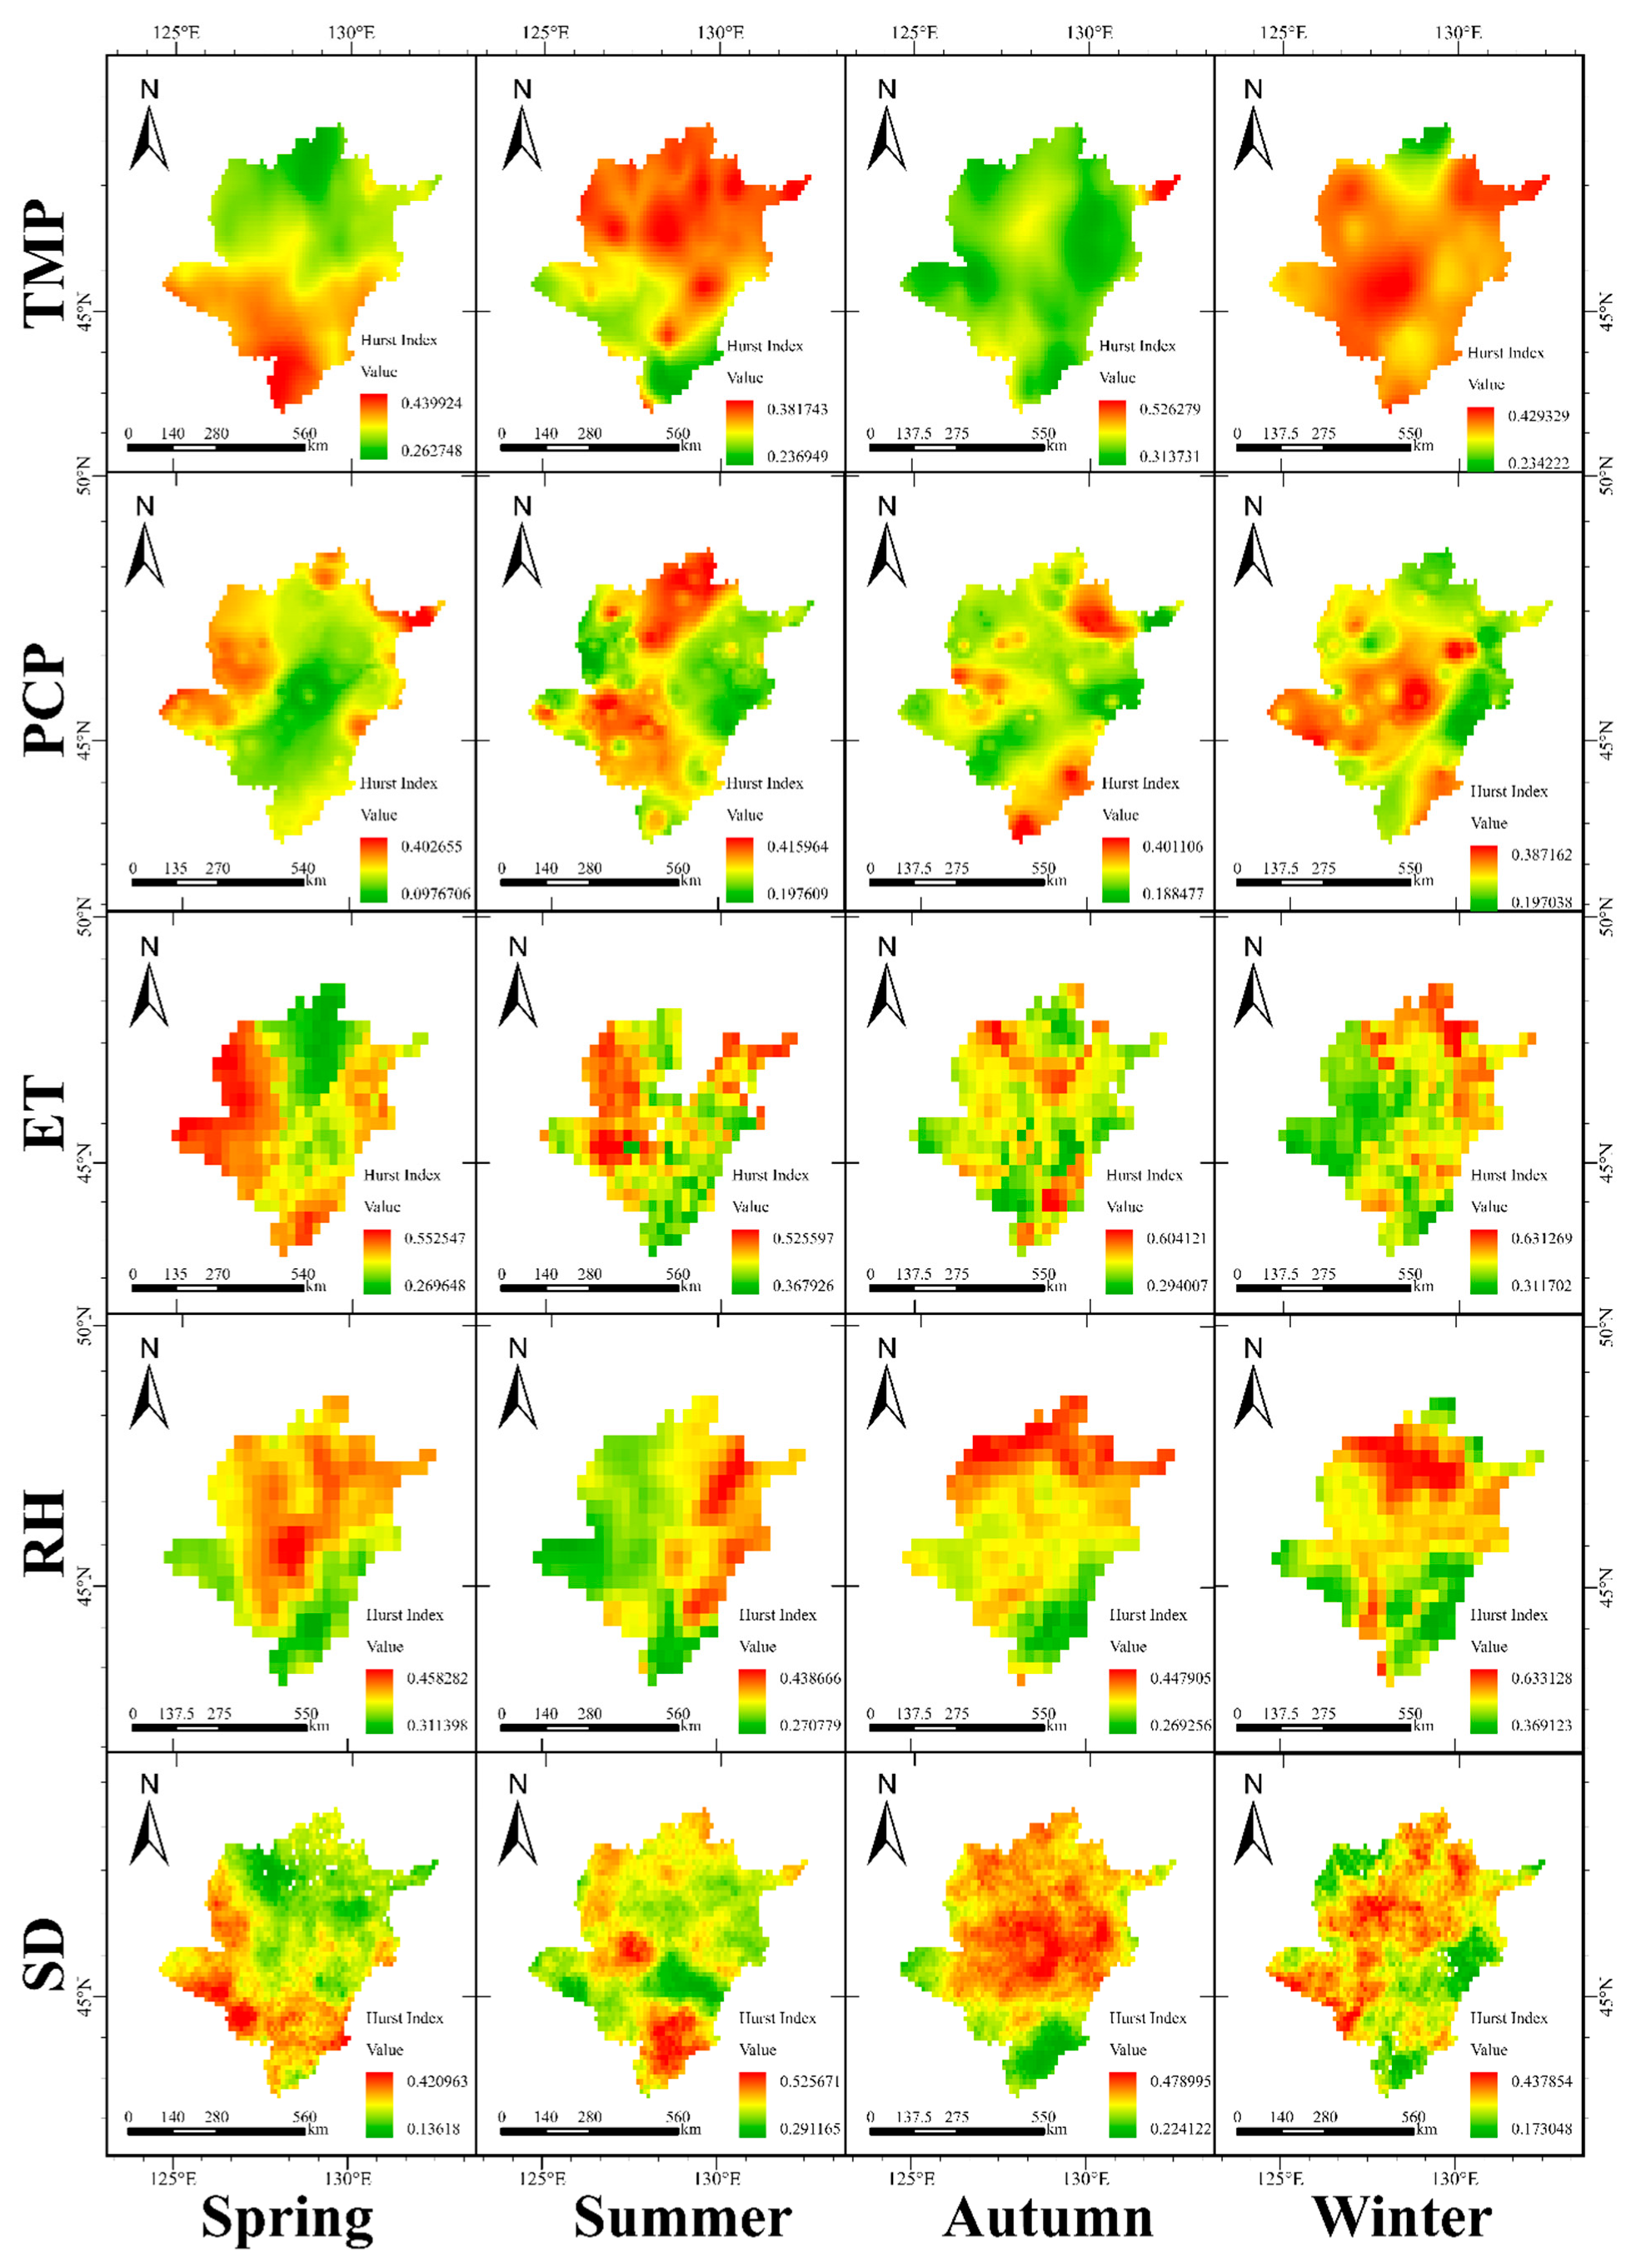
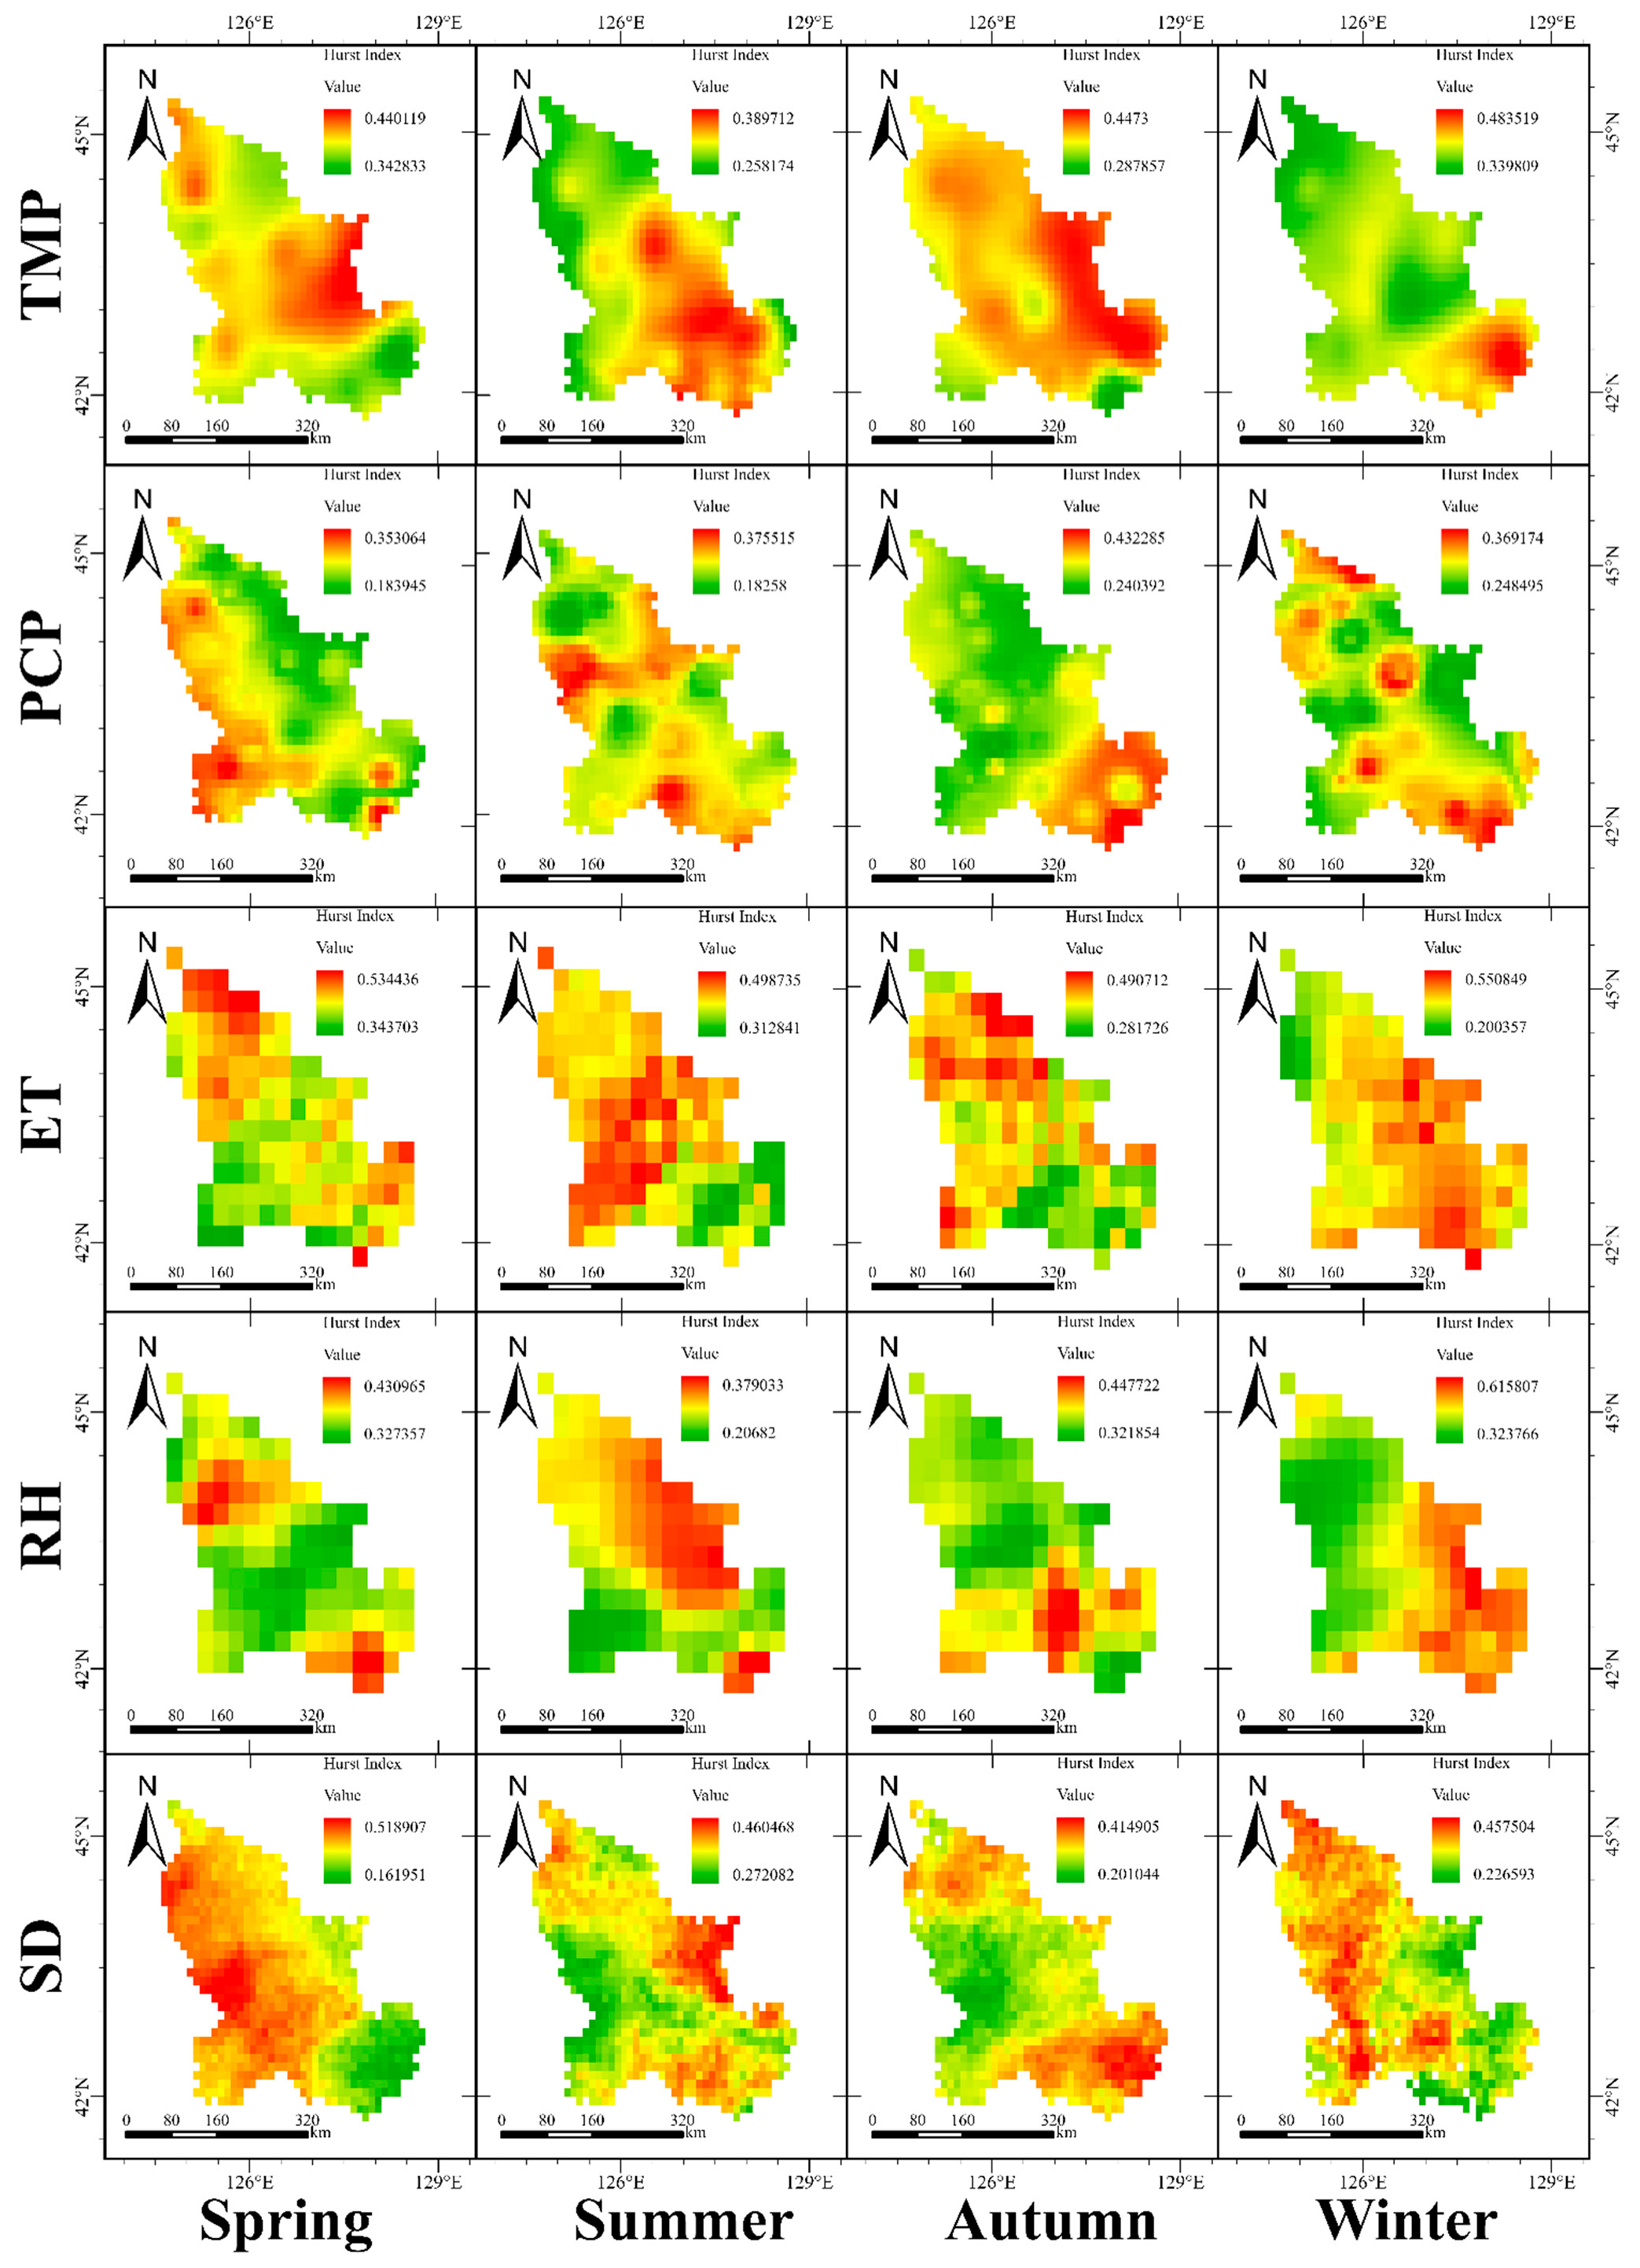
A persistence analysis of long-term trends in meteorological variables based on the Hurst exponent was conducted for the main stream basin of the Songhua River, the Second Songhua River Basin, and the Nenjiang River Basin. The analysis is structured by sub-basin and systematically elaborates on the five key meteorological factors—air temperature, precipitation, evaporation, relative humidity, and sunshine duration—across seasonal scales. Figure 9, Figure 10 and Figure 11 illustrate the spatial distribution of Hurst values for meteorological variables in the main stream basin of the Songhua River, the Second Songhua River Basin, and the Nenjiang River Basin, respectively, during the period 1980–2022.
In the main stream basin of the Songhua River, during spring, mean air temperature exhibited stronger persistence in the southern region, with Hurst values > 0.40, indicating a high degree of trend stability. The northern region showed greater variability with Hurst values around 0.26–0.36. Precipitation showed relatively high persistence (Hurst values > 0.40) in localized areas, while evaporation displayed high autocorrelation across most of the basin, suggesting a continued trend in the future (Hurst values > 0.50). Relative humidity demonstrated moderate variability, with Hurst values between 0.40 and 0.45, whereas sunshine duration showed strong trend stability (Hurst values > 0.50) in the southwestern areas. In summer, the Hurst exponent for temperature increased significantly in the central and northern regions, with values around 0.38, indicating an enhanced persistence of warming. Precipitation trends revealed pronounced spatial heterogeneity, with reduced stability in the eastern region (Hurst values < 0.30). Evaporation trends were stronger in the northeast and west, closely aligned spatially with temperature trends (Hurst values > 0.45). The persistence of relative humidity increased, particularly in the central and eastern regions (Hurst values > 0.45). Sunshine duration trends intensified in the south (Hurst values > 0.50), while weaker persistence was observed in the north (Hurst values < 0.40). During autumn, temperature exhibited weak persistence across the basin, with Hurst values around 0.35–0.40, and precipitation generally had low stability (Hurst values < 0.40). Evaporation showed a highly concentrated spatial distribution of high Hurst values (0.50–0.55) in the northern part of the basin, indicating strong trend persistence. Both relative humidity and sunshine duration had high Hurst values concentrated in the north (Hurst values > 0.50), suggesting sustained changes in dryness and radiation conditions during the autumn season. In winter, temperature showed a significant increase in trend stability across most of the basin, with high Hurst values (>0.50) indicating persistent warming. Precipitation variability decreased slightly, with regional spatial differences remaining. Evaporation persistence increased, especially in northern areas (Hurst values > 0.45). Relative humidity generally exhibited high Hurst values, suggesting a sustained drying trend (Hurst values > 0.50). Sunshine duration showed stronger persistence in the northern region (Hurst values > 0.45), with some localized areas exhibiting very strong trend stability (Hurst values > 0.55).
In the Second Songhua River Basin, temperature trends exhibited moderate to strong persistence in all seasons. During spring, the temperature showed strong trend persistence (Hurst values > 0.40), especially in the central region. Precipitation trends were spatially scattered with a west–east gradient (higher persistence in the west, Hurst values > 0.40). Evaporation displayed moderate to high trend stability over most of the basin (Hurst values > 0.40). Relative humidity trends had moderate to low persistence (Hurst values < 0.40), while sunshine duration showed high variability in the southern region (Hurst values < 0.40). In summer, temperature trends were more stable in the south (Hurst values > 0.50), with greater variability in the north (Hurst values < 0.40). Precipitation persistence increased in the central and southern parts (Hurst values > 0.40). Evaporation trends strengthened from south to north, indicating enhanced trend stability (Hurst values > 0.50). Relative humidity persistence was higher in the southern region (Hurst values > 0.40) but weaker in the north (Hurst values < 0.40). Sunshine duration trends exhibited high Hurst values (0.40–0.45) in the southeastern region. During autumn, temperature persistence varied significantly across the basin, with stronger trends in the south (Hurst values > 0.40). Precipitation exhibited low trend stability and high interannual variability (Hurst values < 0.40). Evaporation showed strong trend persistence in the central and southern parts of the basin (Hurst values > 0.50), with high spatial consistency. Relative humidity maintained a moderate level of persistence (Hurst values around 0.40), while sunshine duration exhibited high Hurst values (0.40–0.45) in the northwestern region. In winter, temperature trend stability was relatively weak (Hurst values < 0.40). Precipitation instability was concentrated in the central basin (Hurst values < 0.40). Evaporation persistence was higher in the southern region (Hurst values > 0.40). Relative humidity showed a southeast–northwest gradient, with higher persistence in the southeast (Hurst values > 0.40). Sunshine duration displayed moderate to high trend stability throughout the basin (Hurst values > 0.40). In the Nenjiang River Basin, spring temperature trends showed weak persistence overall, with higher stability only in the southern region (Hurst values > 0.40). Precipitation exhibited low trend stability, although some southern areas displayed certain persistence (Hurst values > 0.40). Evaporation trends were more persistent in the central and southern parts (Hurst values > 0.40). Relative humidity showed moderate trend persistence basin-wide (Hurst values around 0.40), while sunshine duration trends were significant only in a few southeastern regions (Hurst values > 0.40). During summer, temperature exhibited strong persistence in the central and northern areas (Hurst values > 0.40). Precipitation trends showed large spatial heterogeneity, with some degree of stability in the western part (Hurst values > 0.40). Evaporation trend persistence increased in the southern region (Hurst values > 0.40). Relative humidity showed enhanced trend stability in the north (Hurst values > 0.40), while sunshine duration followed a west-to-east strengthening pattern (Hurst values > 0.40). In autumn, temperature showed high persistence in the eastern region (Hurst values > 0.50). Precipitation persistence was generally high across the basin (Hurst values > 0.40). Evaporation trends were strongly persistent in most areas, particularly in the north (Hurst values > 0.50). Relative humidity and sunshine duration exhibited strong trend persistence in the central region (Hurst values > 0.50). In winter, temperature trends were consistently persistent throughout the basin (Hurst values > 0.40), with increased stability across most of the central and southern areas. Precipitation trends were spatially heterogeneous. Evaporation trends showed high Hurst values (0.40–0.50) in the northwest, indicating strong trend persistence. Relative humidity trends strengthened in the eastern and western regions (Hurst values > 0.40). Sunshine duration exhibited relatively consistent spatial trend stability across the basin (Hurst values > 0.40).

4.4. Periodic Changes

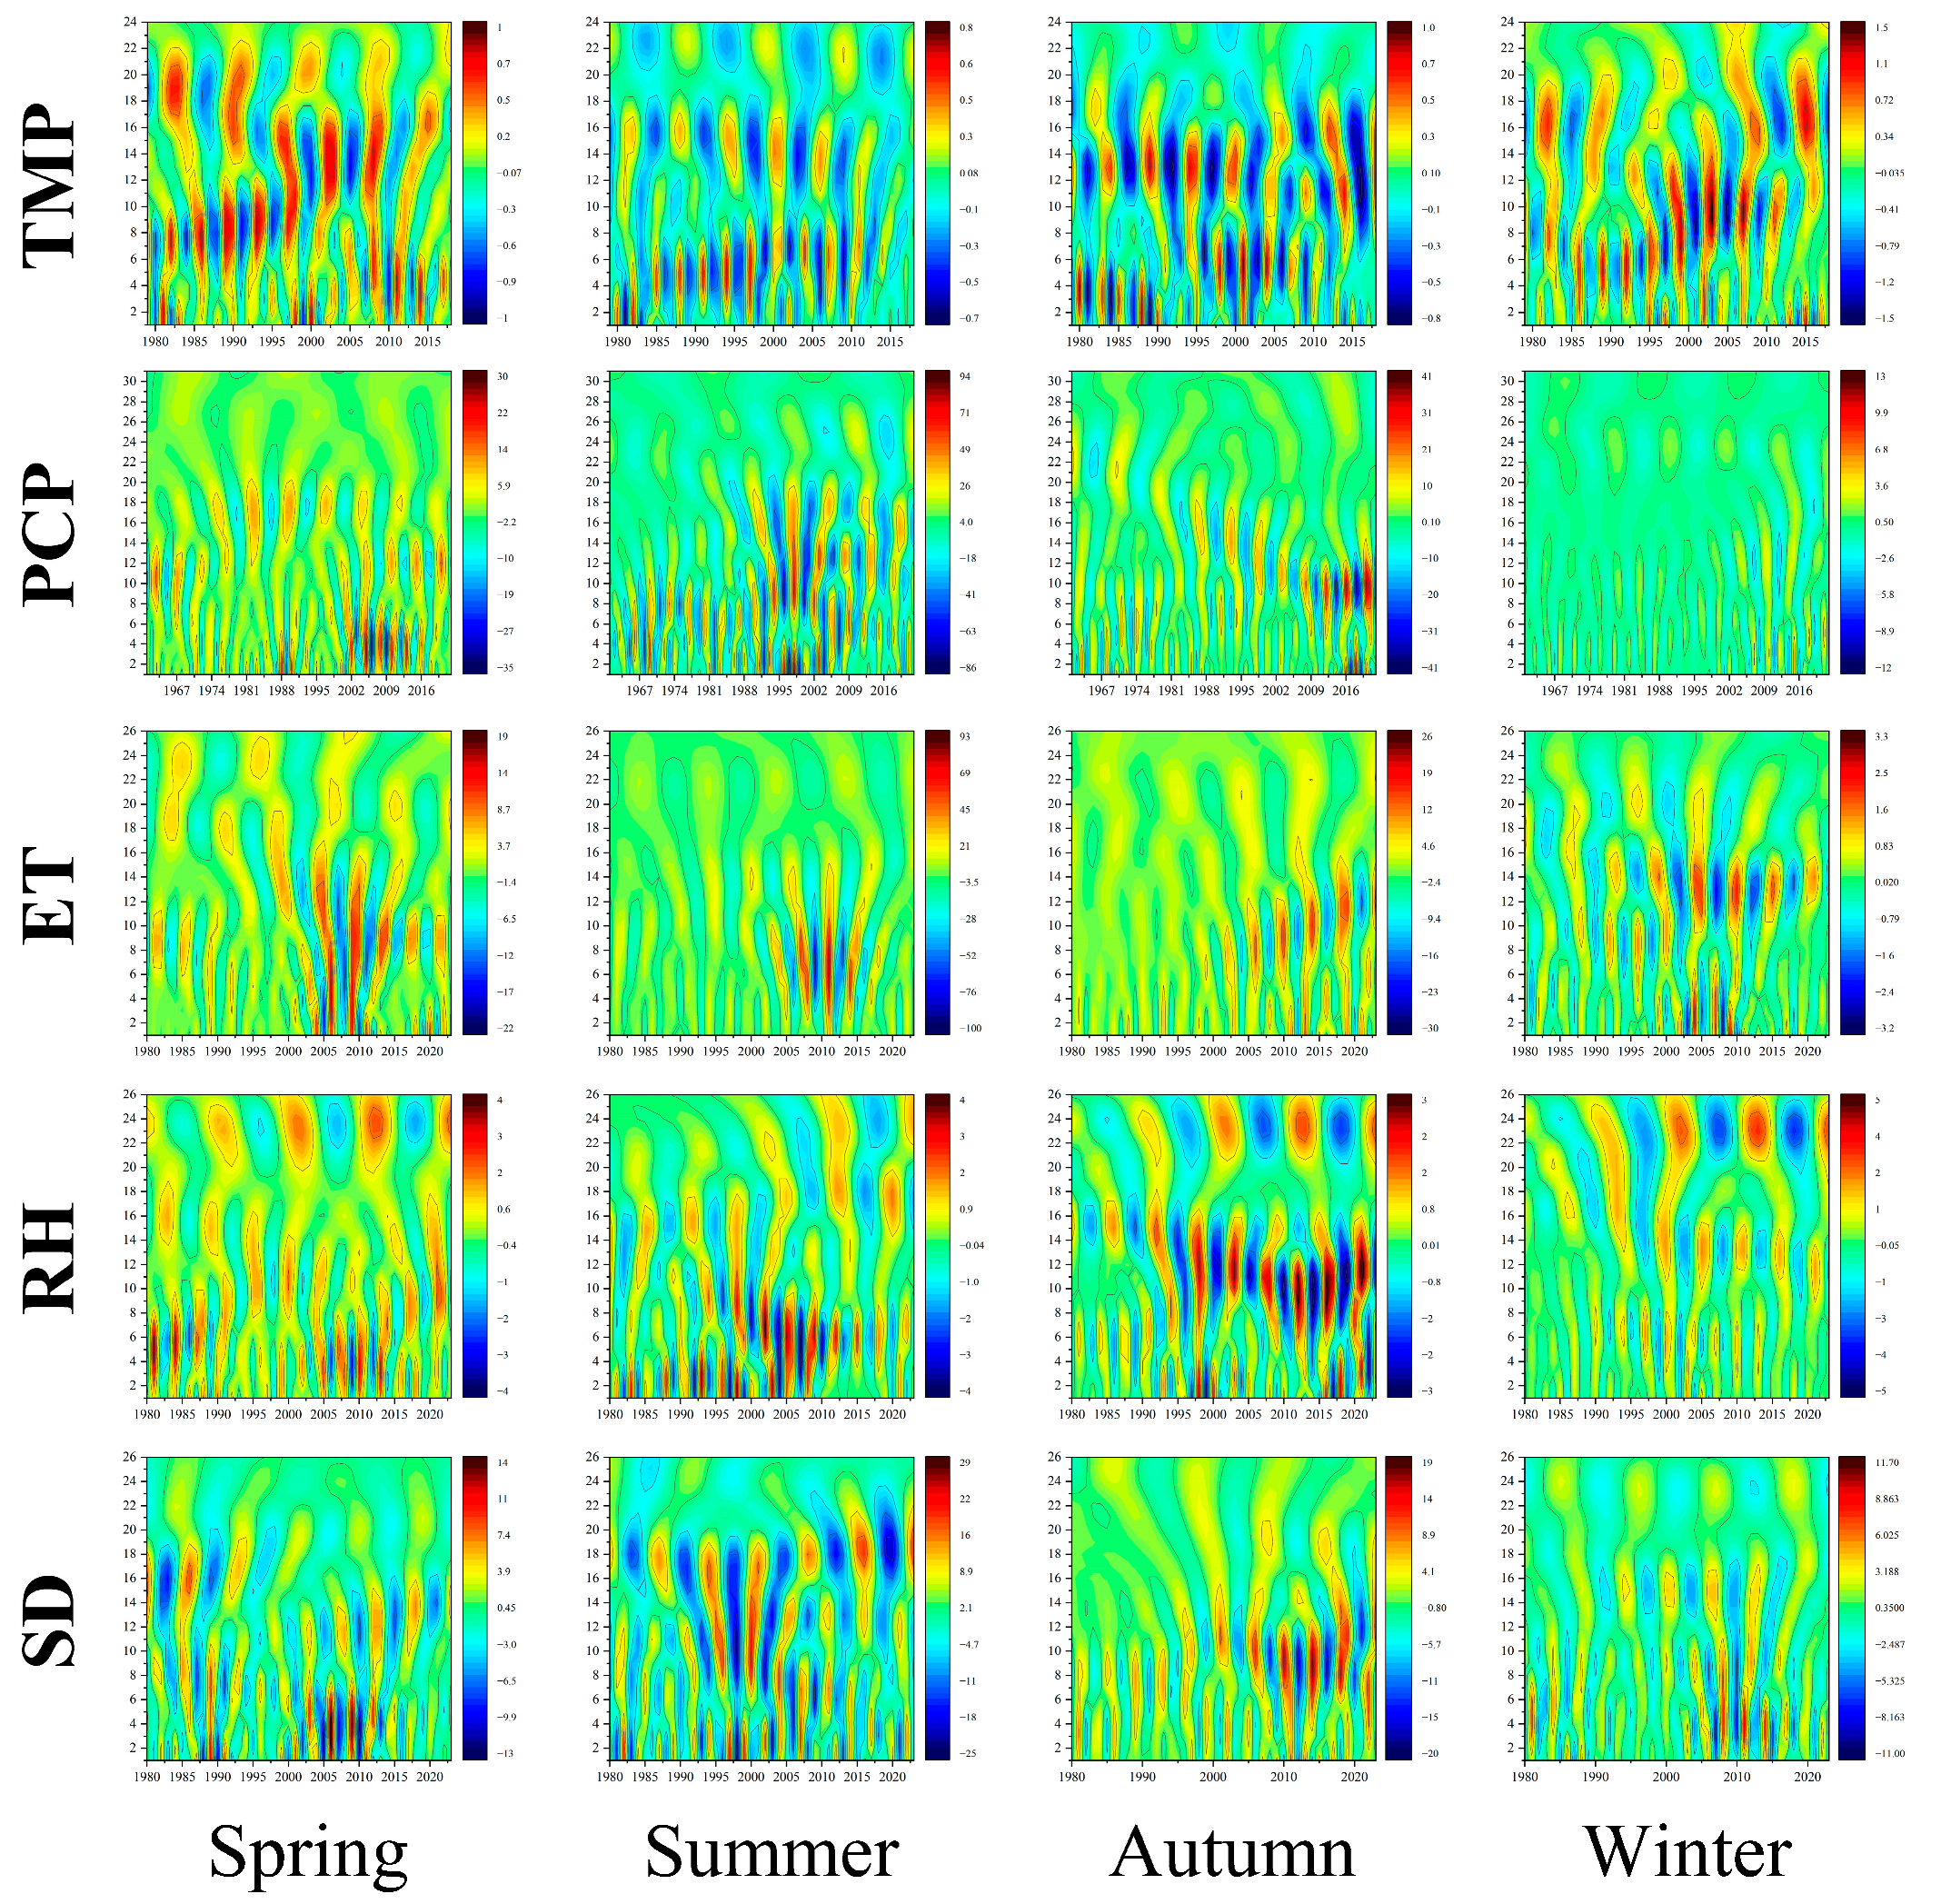
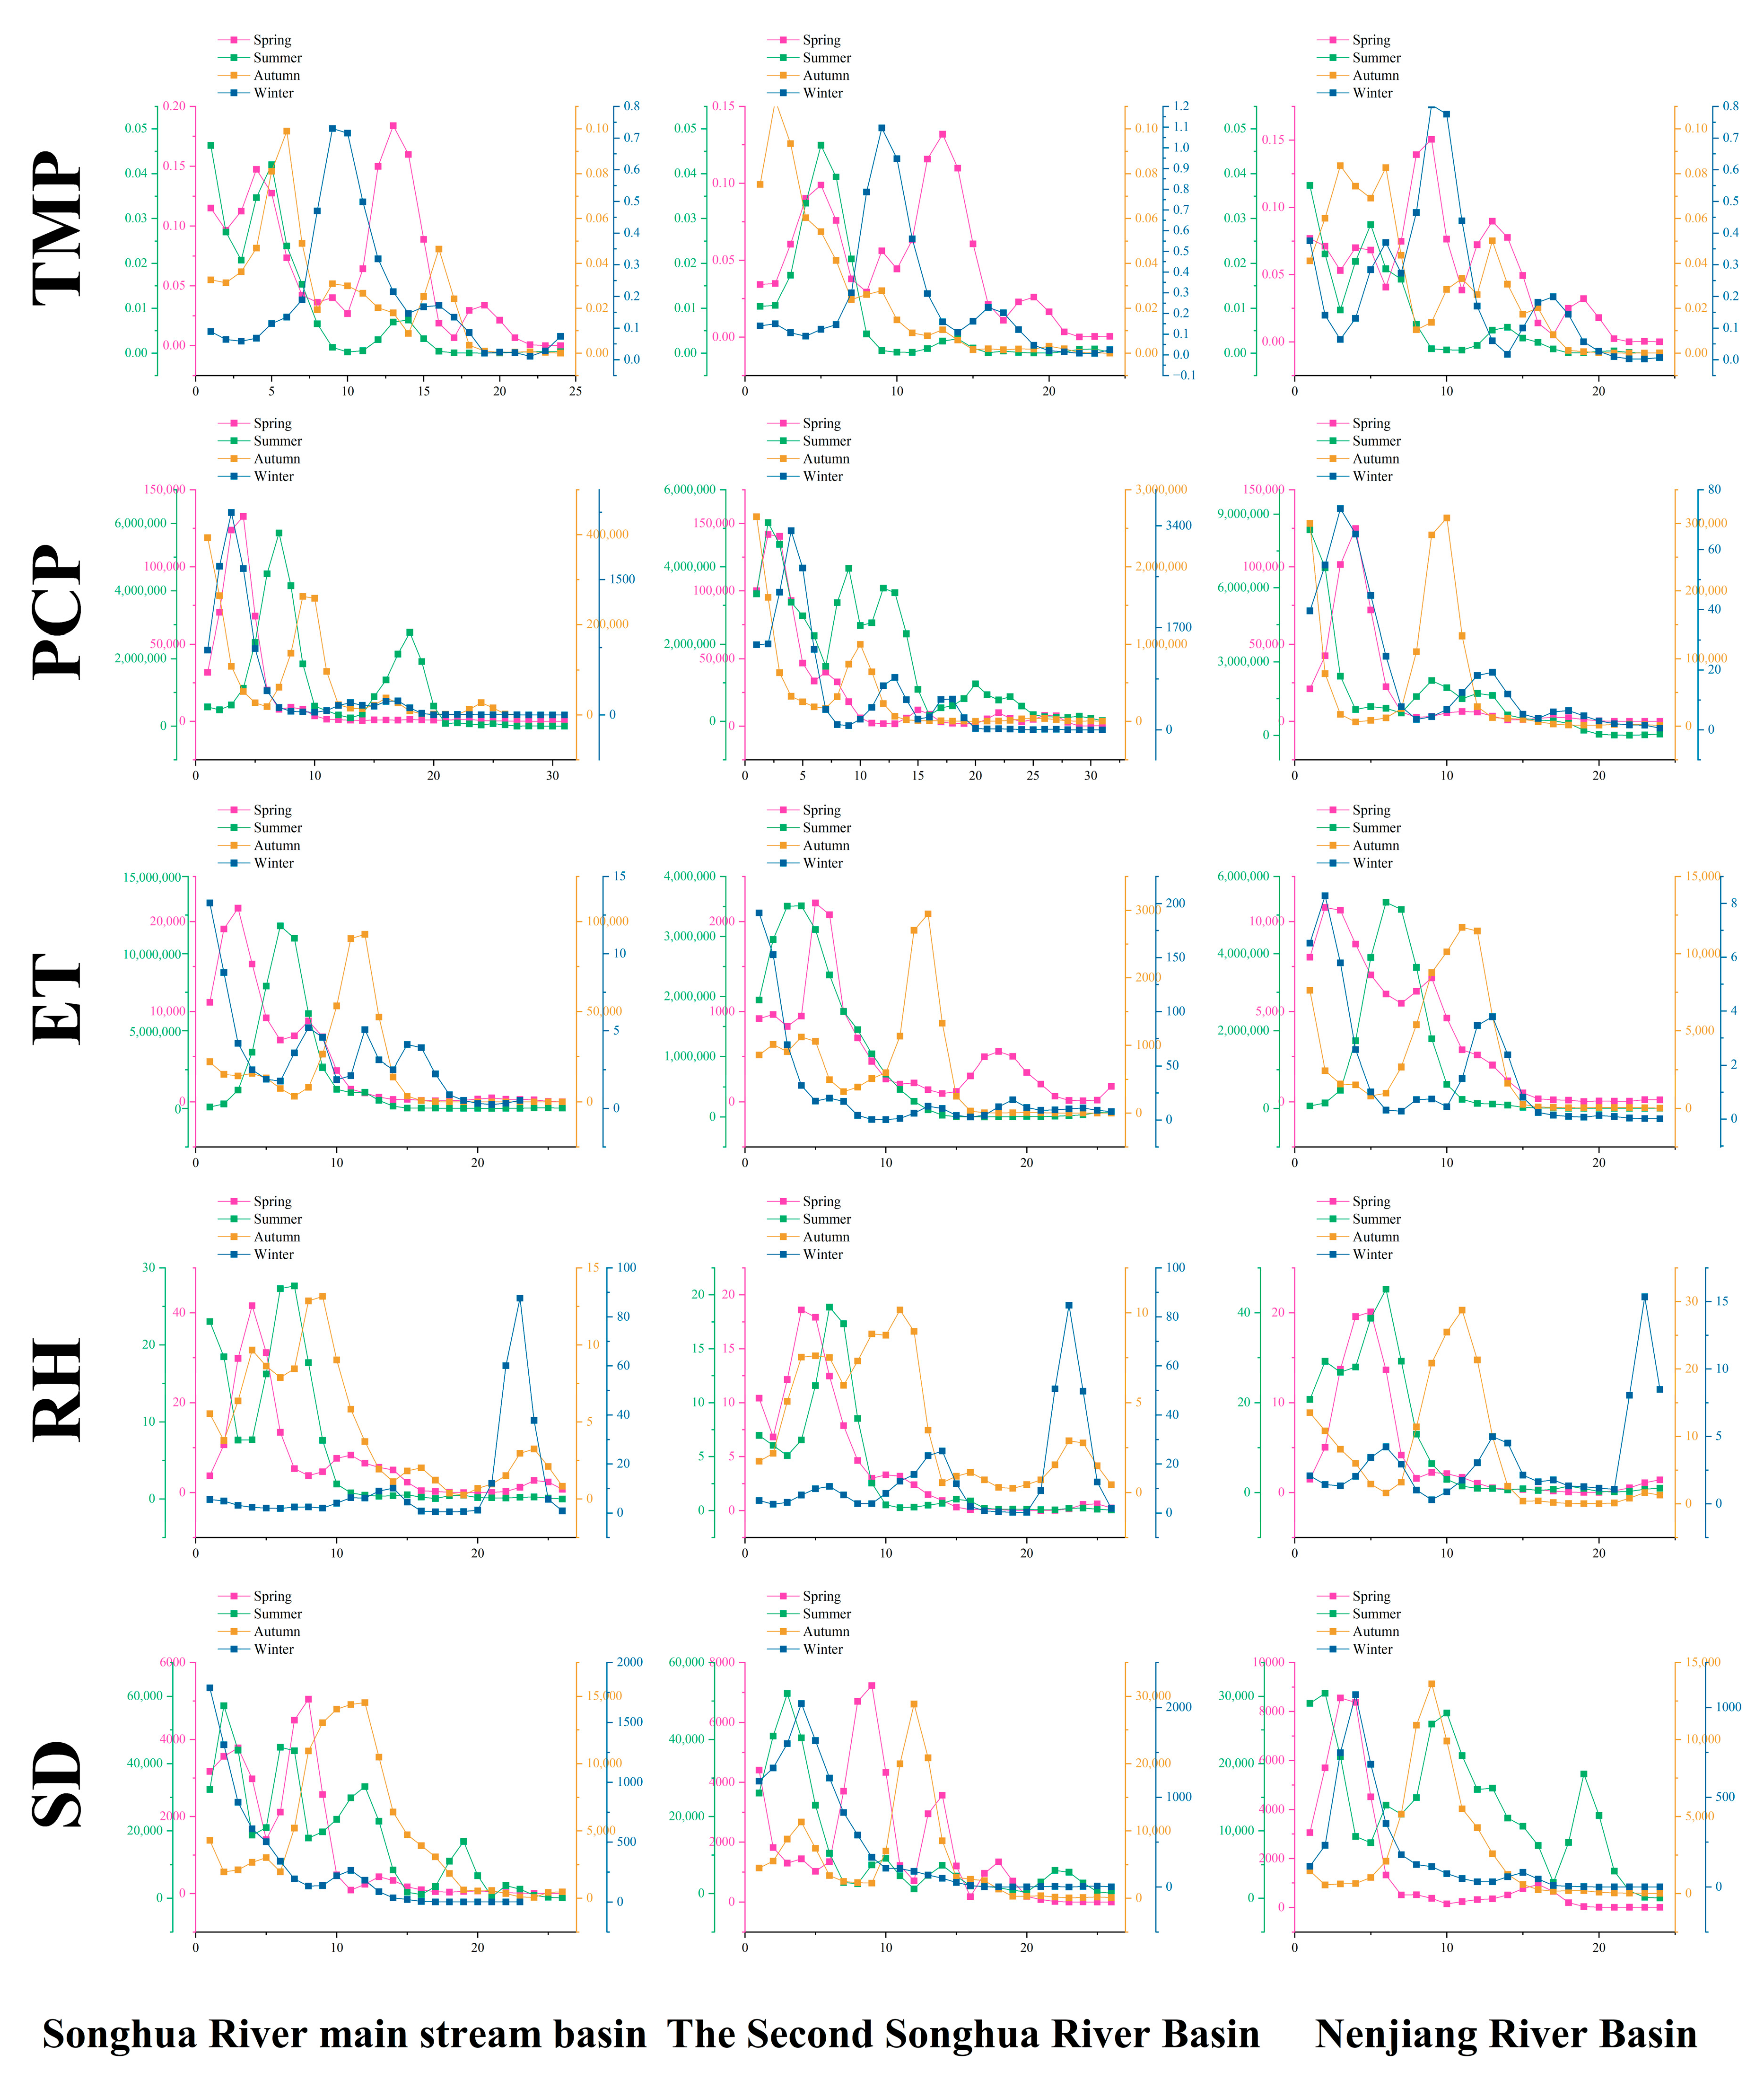
Figure 12, Figure 13 and Figure 14 present the contour maps of the real part of wavelet coefficients for meteorological variables in the mainstream Songhua River Basin, the Second Songhua River Basin, and the Nenjiang River Basin, respectively, during 1980–2022. Figure 15 shows the wavelet variance map of the Songhua River basin.
In the mainstream Songhua River Basin, air temperature exhibits periodicities of 2–8 years and 16–24 years across all seasons. These cycles are particularly prominent in spring and winter, where 2–4-year oscillations occur frequently, with notable intensification around the early 2000s and after 2010, indicating typical mesoscale periodic behavior. Precipitation primarily shows a coexistence of short cycles (2–6 years) and medium cycles (8–16 years), with the most pronounced periodicity in summer. Strong oscillatory structures are observed during the 1990s and mid-2010s. Evapotranspiration demonstrates both 2–4-year and 8–12-year cycles in spring and summer, with an evident enhancement of the medium cycle after 2000, especially in summer. In contrast, autumn and winter are characterized by less distinct fluctuations but persistent low-frequency disturbances. Relative humidity presents a 4–8-year periodicity in all seasons, with stronger mesoscale cycles in autumn and winter, particularly around 2000 when periodic activity significantly increased. Sunshine duration exhibits a consistent 2–4-year cycle throughout the seasons, with the strongest oscillations in summer and autumn, where multiple energy peaks are evident.
In the Second Songhua River Basin, air temperature shows 2–6-year cycles in all seasons. The frequency of 2–3-year cycles in spring and 4–6-year cycles in winter is particularly high, with a clear intensification after 2000. Precipitation is dominated by 2–8-year cycles, with the greatest variability in summer. Periodicity was especially strong in the late 1990s and around 2010. Evapotranspiration reveals distinct short- to medium-term cycles (2–4 years and ~8 years) in summer and autumn, while spring and winter are mainly characterized by low-frequency variations with relatively weaker amplitudes. Relative humidity shows the most significant mesoscale periodicity (8–16 years) in winter, accompanied by large oscillation amplitudes, whereas shorter cycles dominate in the other seasons. Sunshine duration is mainly controlled by 2–4-year cycles in all seasons, with the strongest amplitudes in spring. In summer, high-frequency but low-amplitude oscillations are particularly frequent.
In the Nenjiang River Basin, air temperature is predominantly influenced by short 2–4-year cycles, with stronger oscillations in summer and autumn. These cycles intensified markedly around the early 2000s and after 2015. Precipitation exhibits a distinct dual-cycle structure of 2–6 years and 8–12 years, with summer being the primary phase of cyclic activity, showing greater intensity than in the other basins, while winter displays relatively weak periodicity. Evapotranspiration demonstrates high-amplitude 2–4-year cycles in spring and summer, with an increase in mesoscale activity after 2000. In autumn and winter, fluctuations are weaker but occur with stable frequency. Relative humidity is mainly governed by 2–4-year and ~8-year cycles, with more pronounced fluctuations in spring and autumn, while winter maintains a relatively stable medium cycle. Sunshine duration shows consistent 2–4-year short-cycle oscillations across all seasons, with larger amplitudes in summer and autumn, whereas winter features fewer periodic disturbances but with longer persistence.

4.5. Characteristics of Runoff Variation

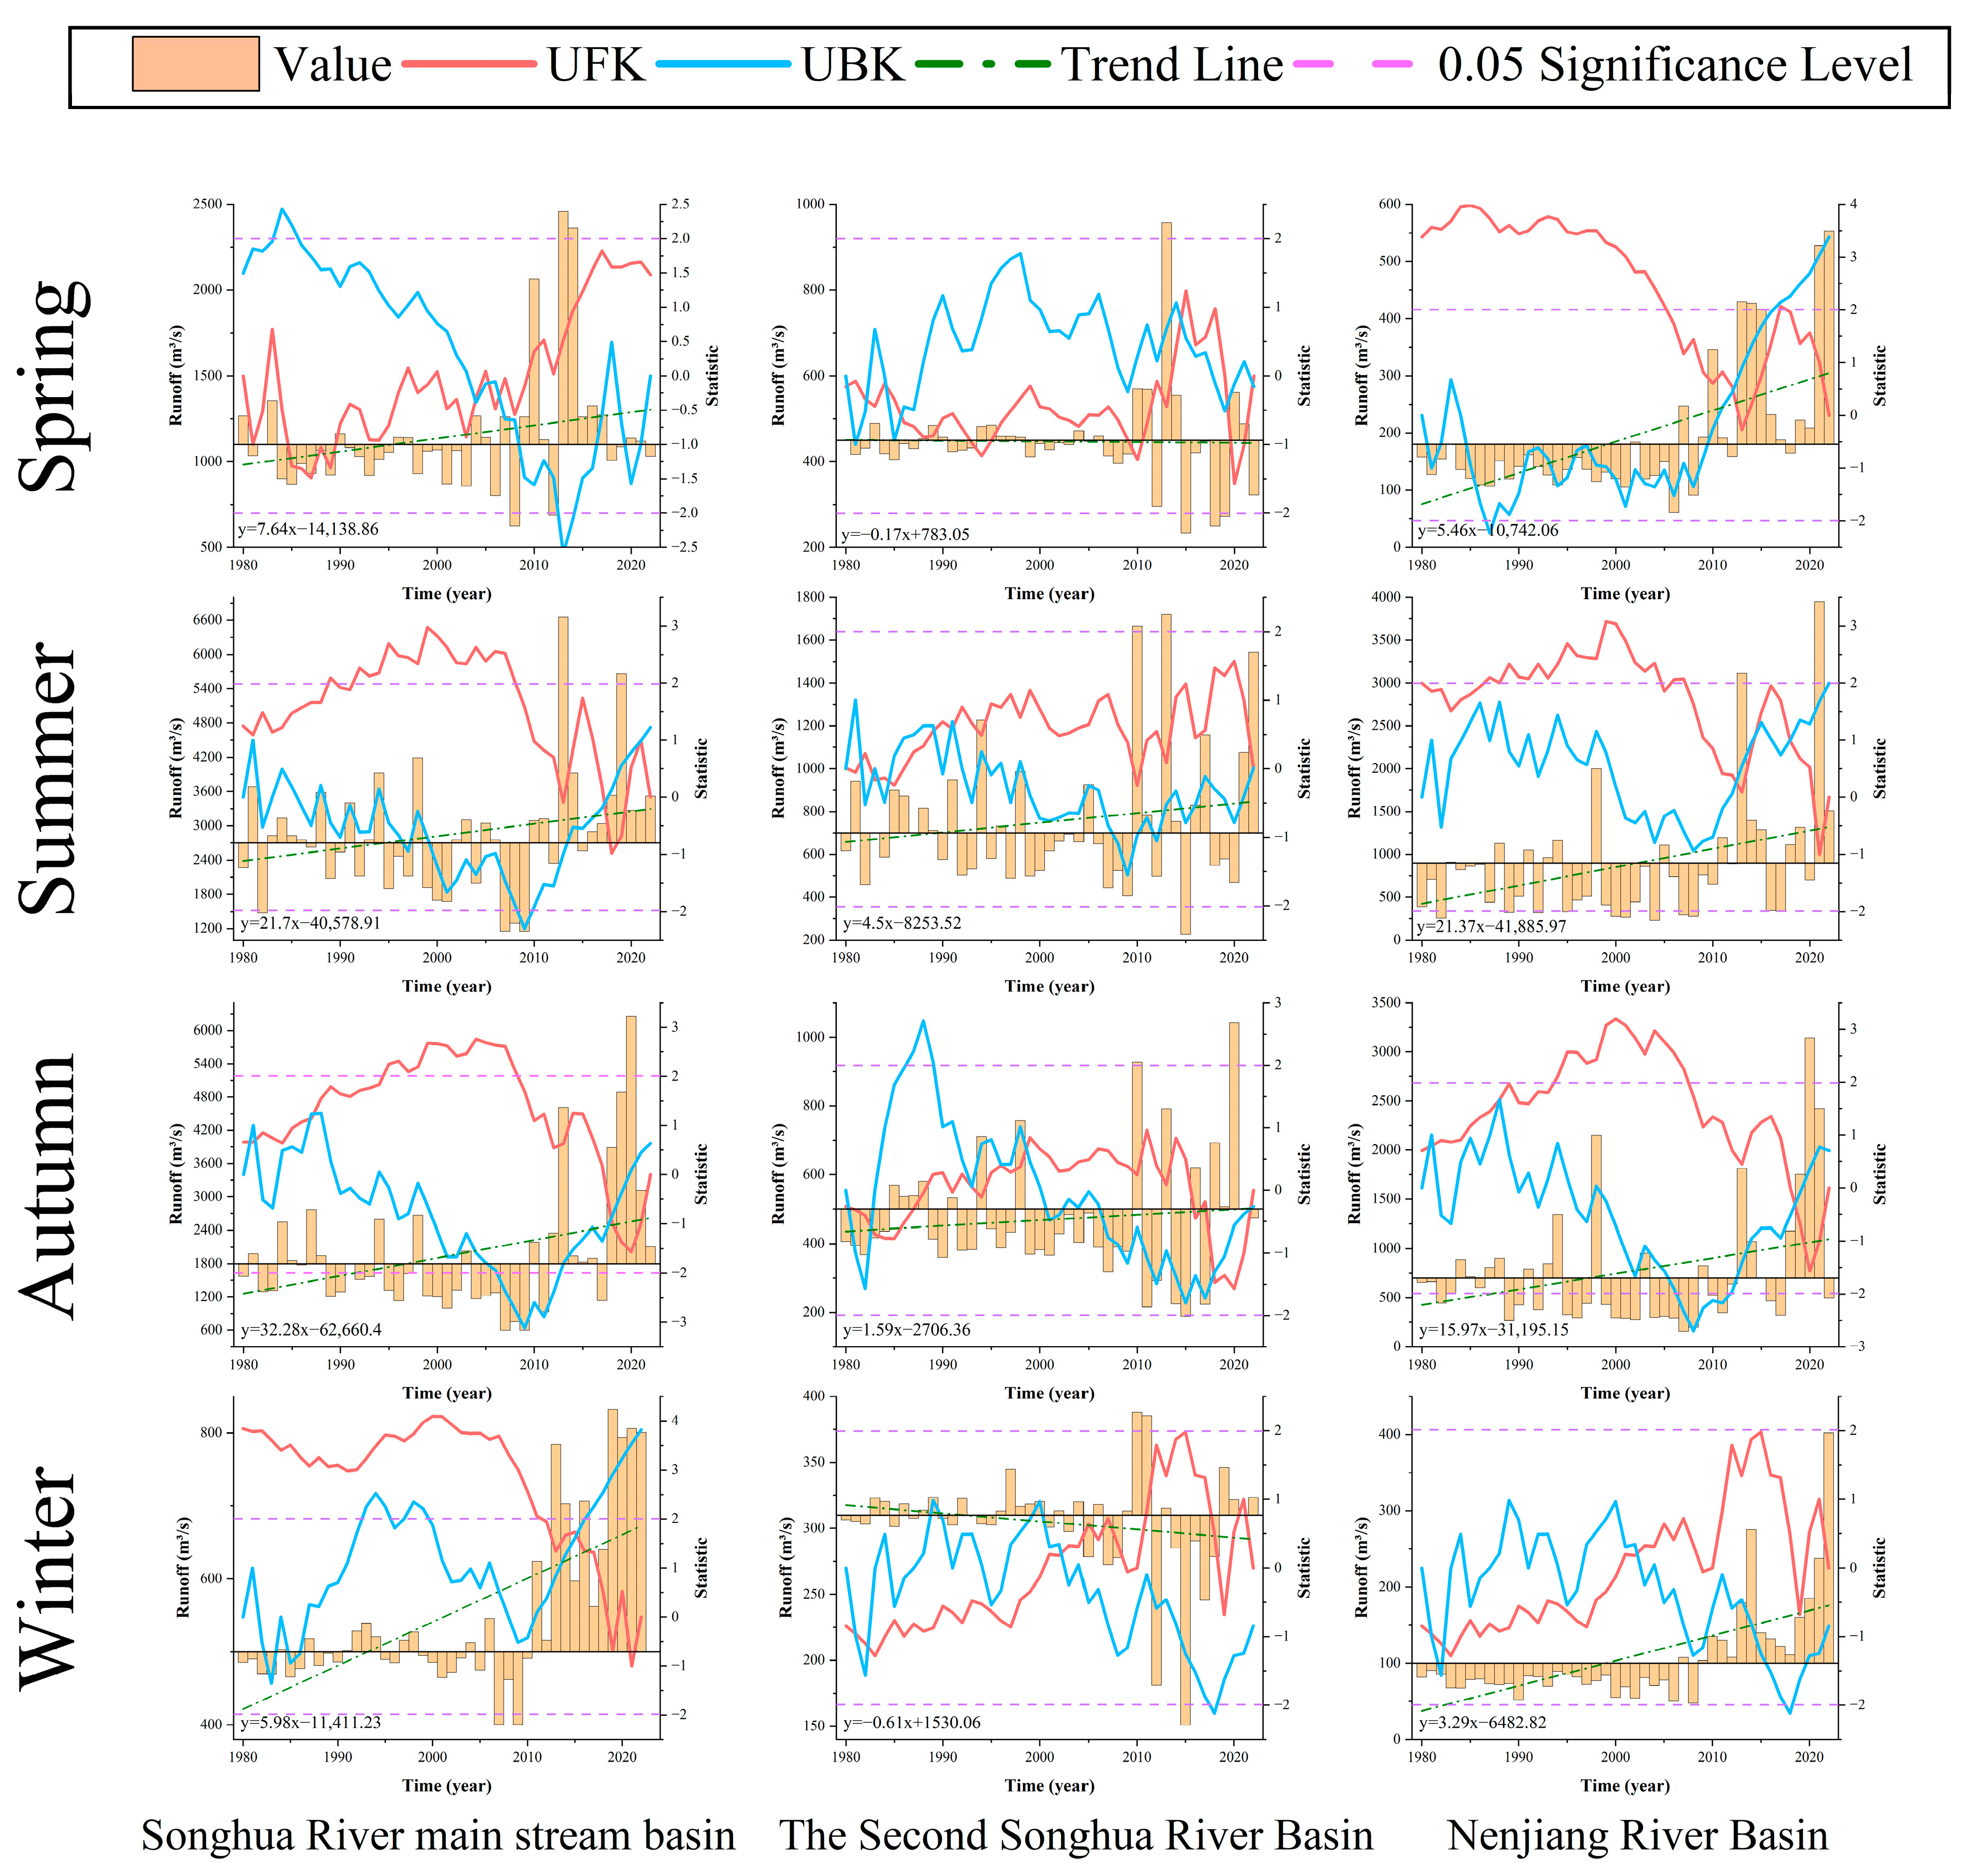
Figure 16 shows the Mann–Kendall test (MK) results and linear trend analysis of runoff in the Songhua River Basin. Figure 17 displays the contour map of the real part of the wavelet coefficients of runoff, and Figure 18 presents the wavelet variance of runoff, revealing its dominant periodicities. Table 3 lists the timing of abrupt changes in seasonal runoff across the three sub-basins. In addition, the Pettitt test results for runoff are provided in Figure A2 in Appendix A, which further identify the potential abrupt change points detected from the MK analysis. This supplementary figure supports the main findings by providing an independent nonparametric detection of change points.
Between 1980 and 2022, the Songhua River Basin exhibited a general trend of increasing runoff, with the main stream basin and the Nenjiang River Basin showing the most pronounced growth. In the main stream basin, runoff demonstrated stable and persistent increases in spring, summer, and autumn, with the autumn season showing the steepest slope, indicating a strong linear growth pattern. Similarly, the Nenjiang River Basin displayed significant positive trends in summer and autumn, with the autumn increase nearly matching that of the main stream basin. In contrast, the Second Songhua River Basin exhibited more moderate changes, including a slight decline in spring and negligible variation in winter, suggesting a weaker response to external drivers or the presence of additional regulating factors.
Runoff mutation characteristics showed strong temporal clustering across the sub-basins. In the main stream basin, abrupt changes occurred in spring, summer, and autumn around 2009, while the winter mutation occurred later, around 2015. The Nenjiang River Basin displayed a similar concentration of abrupt changes between 2009 and 2015, reflecting a high degree of consistency. In the Second Songhua River Basin, abrupt changes were primarily observed in summer, while other seasons showed little evidence of sudden shifts, indicating a stronger seasonal dependence of mutation responses. In terms of duration, the mutation periods in the main stream and Nenjiang River basins spanned longer intervals, suggesting complex and staged adjustments in runoff evolution, whereas the Second Songhua River Basin exhibited more concentrated and shorter mutation events, pointing to mechanisms that are more abrupt rather than cumulative.
Wavelet analysis revealed distinct periodic fluctuations in runoff across the three sub-basins. Both the main stream basin and the Nenjiang River Basin displayed significant 5–10 year periodic oscillations in multiple seasons, with more concentrated energy distributions and clearer periodic structures in autumn and winter. These mid- to short-term cycles indicate that runoff variability is driven by sustained dynamics at interannual to decadal scales. In contrast, the Second Songhua River Basin exhibited relatively diffuse wavelet energy distributions, with less concentrated structures and smaller seasonal differences, suggesting that its runoff variability is under stronger control or that external disturbances have not generated sufficiently strong periodic signals.
Seasonal differences in runoff trends were evident. Autumn emerged as the most responsive season, showing consistent and persistent increases across all three sub-basins and also exhibiting the most concentrated periodic fluctuations, highlighting its sensitivity to basin-scale changes. Summer, the season with the highest runoff volumes, also showed significant positive trends, but with higher variability and more frequent abrupt changes, particularly in the main stream and Nenjiang River basins, reflecting more complex hydrological dynamics. Winter demonstrated the weakest changes, with non-significant trends and low periodic energy, suggesting stable runoff likely controlled by ice cover and reservoir regulation. Spring exhibited strong spatial heterogeneity: while the main stream and Nenjiang basins showed positive trends, the Second Songhua River Basin displayed a slight decline, indicating differentiated responses to rising temperatures and snowmelt processes at the onset of the melt season.

4.6. Attribution Analysis of Changes in Runoff

Figure 19 illustrates the contributions of precipitation (PCP), evapotranspiration (ET), and underlying surface changes (Under Surface) to runoff variation across the three major sub-basins in different seasons. In the main stream basin of the Songhua River, summer emerges as the season with the greatest contribution to runoff change, with precipitation and underlying surface changes exerting strong positive impacts, while evapotranspiration shows a negative effect on runoff. In autumn, runoff is primarily driven by underlying surface changes, which provide the highest contribution, followed by precipitation. In winter, runoff exhibits low sensitivity to all three factors, with overall contribution changes remaining relatively small. In the Second Songhua River Basin, seasonal patterns are broadly similar to those in the main stream basin. However, precipitation contributes more significantly in spring and summer. Underlying surface changes provide consistent positive contributions throughout the year, reflecting the basin’s sensitivity to land-use change and freeze–thaw processes. Evapotranspiration demonstrates strong negative contributions in spring and autumn, indicating a suppressive effect on runoff generation during these seasons. The Nenjiang River Basin shows the most pronounced seasonal contrasts. In summer, precipitation contributes substantially to runoff increases, while evapotranspiration exerts a strong negative influence, highlighting the suppressive role of intense summer evapotranspiration under high temperatures. In spring and autumn, underlying surface changes dominate runoff contributions, playing a positive role in runoff variation. Winter shows relatively mild changes overall, but both precipitation and underlying surface changes maintain moderate positive contributions.
Figure 20 presents the interannual variations in runoff elasticity coefficients (Epsilon_P, Epsilon_E, Epsilon_n) and the aridity index in the three sub-basins from 1980 to 2022, with seasonal analysis as follows: Epsilon_P shows the strongest precipitation elasticity in summer across all basins, particularly in the Nenjiang River Basin, where values exceeded 3 in some years, indicating extremely high runoff sensitivity to precipitation. In spring and autumn, elasticity fluctuations are more pronounced, especially after 2000, when some years experienced abrupt increases, reflecting heightened climate variability. In winter, elasticity remains relatively stable and low. Epsilon_E is negative in most years, suggesting that evapotranspiration primarily reduces the available water for runoff. Summer is the main season of strong negative influence in all basins, with the effect most evident in the Nenjiang River Basin. In winter, elasticity approaches zero, indicating negligible influence of evapotranspiration on runoff. Epsilon_n exhibits strong seasonality, with the highest values in spring and autumn, underscoring the significant roles of snowmelt, permafrost changes, and human activities during these periods. In winter, coefficients approach zero, consistent with the slow pace of underlying surface changes in cold conditions. Notably, the main stream basin experienced a clear increase in elasticity around 2005, possibly linked to land-use adjustments or hydraulic engineering projects.
The aridity index shows significant seasonal variability. Winter consistently exhibits the largest fluctuations, with values often exceeding 1.5, indicating substantial water deficits. In contrast, summer values are generally lower, remaining below 0.8 due to concentrated precipitation. Specifically, the Songhua River main stream basin and the Nenjiang River Basin show a marked increase in the aridity index after 2000, with a clear upward trend in the aridity index that indicates an intensifying regional drying trend.
Based on the results of the abrupt change analysis (Table 4), it is evident that the main stream basin of the Songhua River, the Second Songhua River Basin, and the Nenjiang River Basin all experienced pronounced seasonal runoff regime shifts during 1980–2022. The abrupt change years were largely clustered around 1998, 2001, 2003, and 2015, indicating strong temporal consistency across the sub-basins. In terms of elasticity coefficient variations before and after the abrupt changes, precipitation elasticity generally reached its highest values in summer for all three basins. Notably, the Nenjiang River Basin exhibited the highest elasticity in spring, with values exceeding 3.5, highlighting the basin’s extreme sensitivity of runoff to precipitation anomalies. Evapotranspiration elasticity was predominantly negative, especially in summer, reflecting its role as a consumptive factor that suppressed runoff formation. This inhibitory effect was particularly pronounced in warmer seasons. Underlying surface elasticity was most significant in spring and autumn, especially in the main stream and Nenjiang basins, where large fluctuations suggest that land-surface processes such as permafrost dynamics and land-use changes played a critical role in shaping runoff regime shifts.
From a contribution perspective (Table 4), summer abrupt change periods were typically accompanied by substantial water fluctuations. In some years, the contribution of precipitation was even negative, indicating that anomalous precipitation distribution or altered basin response mechanisms may have counteracted effective runoff generation. Meanwhile, the positive contribution of underlying surface factors increased notably in summer and autumn, particularly in the main stream basin during summer and in the Second Songhua River Basin during autumn. This suggests that abrupt runoff changes were not solely climate-driven but were also strongly linked to basin-scale land-surface processes. Remarkably, in the Nenjiang River Basin, evapotranspiration contribution during summer abrupt change periods exceeded 650, becoming one of the dominant factors. This underscores the enhanced control of energy conditions on runoff processes under high-temperature, high-evapotranspiration regimes.
Although winter abrupt changes involved relatively small water volumes, precipitation and underlying surface contributions remained high. For example, in the main stream basin, the precipitation contribution reached 838 in winter, indicating that processes such as shifts in precipitation phase and earlier snowmelt onset may have intensified runoff responses. Overall, the common characteristics of runoff abrupt changes in the three sub-basins are as follows: (1) abrupt changes were concentrated in years of pronounced climate anomalies; (2) sharp differences in precipitation and evapotranspiration elasticity were observed before and after change points; and (3) the role of underlying surface factors strengthened across multiple seasons. These findings suggest that runoff regime shifts have evolved from being predominantly climate-driven to being the result of multi-factor integrated effects. This provides both empirical evidence and theoretical support for improving the timeliness and scientific basis of water resources management in the Songhua River Basin.

5. Discussion

5.1. Characteristics of Climate Change

5.1.1. Integrated Spatial Coherence, Drivers, and Regime Shifts

The Sen’s slope maps in Figure 2, Figure 3 and Figure 4 form a coherent spatial pattern across the three sub-basins rather than three independent, unrelated signals. Across the entire Songhua River Basin (SRB), the air temperature has increased basin-wide, with the largest positive Sen slopes in summer; the observed warming rate over the most recent 50–60 years is about 0.30 °C per decade, and the warming acceleration since the 1970s is evident [33].
Precipitation trends exhibit a clear spatial contrast between sub-basins: the Nenjiang River Basin (NRB) and the lower reaches of the SRB have sustained negative Sen slopes for annual and summer precipitation, while the upper/second Songhua sub-basins show neutral to slight positive precipitation trends. This spatial contrast in precipitation is reflected in modeled and observational studies, which report decreasing precipitation and projected reductions in streamflow for the NRB and SRB, and stable or increasing precipitation/runoff in the Upper Songhua/Second Songhua areas [50,51,52]. Evapotranspiration (ET) changes are governed by the hydro-thermal coupling between evaporative demand and water supply. Station and multi-dataset analyses demonstrate that actual evapotranspiration (ETa) has increased on average in northern China and in much of the SRB, with basin stations and reconstructions reporting a positive linear trend (annual ET increases on the order of a few mm per decade; for the SRB, persistent positive ET trends around ~4–5 mm decade−1 have been reported in the observational literature). Where temperature and net radiation have risen while precipitation either increased or did not decline proportionally, ET increases; where water supply is limiting (drier/water-limited subregions), ET trends are weaker or negative [53]. Relative humidity exhibits seasonally asymmetric declines across northeastern China, strongest in late winter and spring; these humidity declines are co-located with warming and precipitation decreases and therefore enforce an overall drying tendency in the cold seasons. Station homogenization and regional analyses document this seasonal RH decline for northeast China and the SRB specifically [33,54]. Sunshine-duration and radiation trends are spatially heterogeneous within the basin: observational trend studies report both decreasing sunshine duration for many stations (linked to cloud/aerosol and wind-speed changes) and localized increases in other subregions, so the net basin-scale trend is not uniform but shows clear spatial structure that aligns with local aerosol, cloud, and circulation changes [53,55].
The hydrometeorological picture that emerges from comparing Figure 2, Figure 3 and Figure 4 and from published analyses is mechanistic and internally consistent. First, increased air temperature raises atmospheric evaporative demand (PET) and reduces relative humidity; where water is available (upper/forested/near-wetland areas and during spring snowmelt), this leads to larger ET and enhanced spring flows from accelerated snowpack/snowmelt contributions, producing increased spring runoff signals in upstream gauges. In contrast, in the NRB and lower SRB, the combination of declining precipitation, rising PET, and intensified human water extraction/reservoir operations reduces summer/autumn runoff and produces the negative runoff trends observed there. These opposing upstream/downstream signatures demonstrate hydrological coupling between sub-basins through (a) shared large-scale climate forcing (temperature/precipitation changes and teleconnections), (b) seasonally shifted snowmelt timing, and (c) anthropogenic regulation (storage and withdrawals) that decouple precipitation–streamflow relationships in regulated downstream reaches [33,51,56].
Quantitative attribution studies for the Second Songhua River confirm that climatic forcing, rather than basin morphology changes alone, explains the majority of long-term annual runoff variability, while catchment characteristics (reservoir operation, land-use/water withdrawal) exert strong seasonal effects and alter the precipitation–runoff coupling. The non-steady Budyko attribution applied to the Second Songhua shows that climate explains most of the interannual to multi-decadal runoff changes, whereas altered catchment characteristics and human water use control intra-annual distribution and downstream deficits. These published attribution results reconcile the differing signals seen in Figure 2, Figure 3 and Figure 4: climate sets the background trend, and human interventions modulate seasonal amplitude and downstream expression [51,57].
Reservoirs and large storage features operate as flow modulators that blunt or invert the relationship between local precipitation trends and downstream streamflow trends. Case studies (e.g., the Nierji Reservoir on the Nenjiang River) demonstrate that reservoir operation reduces the magnitude of downstream streamflow decline under warming/drying scenarios during non-flood periods but also increases sensitivity to reservoir rule changes during droughts and floods; therefore reservoir presence explains part of the spatially varying Sen-slope signals in the lower basins and confirms that anthropogenic regulation is a first-order inter-basin linkage [56].
Taken together, the results in Figure 2, Figure 3 and Figure 4 are not independent per basin: they form a spatially coherent response to three coupled drivers—(i) large-scale climate change and variability (temperature increase, precipitation redistribution, teleconnections), (ii) hydro-thermal coupling that controls ETa and runoff partitioning, and (iii) human activities (reservoirs, water withdrawals, land-use change) that modify routing and seasonal storage. This integrated interpretation is consistent with basin-wide trend analyses, hydrological model projections, Budyko-based attributions, and reservoir-impact case studies published for the SRB [33,52,56].
The Mann–Kendall and Pettitt test results indicate that abrupt shifts in meteorological factors across the sub-basins predominantly occurred between the late 1990s and early 2000s, with significant temporal synchronicity and regional consistency. Most change points were concentrated between 1995 and 2005, implying a transition of the regional climate system from gradual change to rapid regime shifts under global warming. Temperature shifts mainly occurred in spring, summer, and autumn, peaking in the early 21st century, signifying a transition to a rapid warming phase. Precipitation abrupt changes were concentrated in summer and autumn, primarily during the late 1990s and early 2000s, reflecting structural adjustments in hydrological and precipitation processes. Evapotranspiration displayed a bimodal pattern, with spring shifts often synchronized with warming trends, while summer shifts tended toward declines. Relative humidity shifts were concentrated in winter, generally showing decreases, indicating that the cold-season drying trend has stabilized. Sunshine duration exhibited more scattered abrupt changes, especially in summer and autumn, often manifesting as increases, suggesting significant alterations in radiation conditions and atmospheric transparency [58,59]. Despite inter-basin differences, the overall response pattern was coherent, suggesting that the climate system of the Songhua River Basin has evolved from gradual accumulation to abrupt regime shifts.

5.1.2. Inter-Basin Comparison of Persistence, Cyclicity, and Hydroclimatic Mechanisms

In this study, we employed a wavelet-based estimation of the Hurst exponent together with wavelet power and coherence analysis to systematically assess the long-term memory and multi-scale variability of meteorological factors across the three sub-basins of the Songhua River Basin (mainstream Songhua River, Second Songhua River—SSR, and Nenjiang River). The Hurst exponent, derived from the wavelet scale relationship, quantifies the persistence of hydro-meteorological series, whereas the wavelet power spectrum and coherence analyses characterize the temporal localization of periodicities and the coupling between variables across scales [17,20,59].
(1)
Temperature: Persistent Warming and Multi-Scale Coupling
Temperature in all three sub-basins exhibits high Hurst values, particularly in summer and winter, accompanied by pronounced energy concentrations in the low-frequency bands (interannual to multi-decadal). This combination of high persistence and strong low-frequency power indicates that temperature variability is primarily controlled by sustained external thermal forcing and reinforced by land–atmosphere feedback that maintain memory effects in surface heat storage. These results are consistent with previous findings of persistent warming over northern China and with the modulation of interannual to decadal temperature variability by ENSO and PDO teleconnections [60,61].
(2)
Precipitation: Weak Persistence and Strong Spatiotemporal Nonstationarity
Precipitation shows marked spatial and seasonal heterogeneity across the three sub-basins, with generally low Hurst values approaching a random-walk behavior. Its wavelet power is fragmented and dominated by short to mid-term oscillations (2–8 years), particularly in summer, with little evidence of low-frequency accumulation. This pattern reflects the combined influence of planetary-scale circulation (ENSO, PDO, East Asian monsoon) and local orographic and convective processes, resulting in nonstationary and sometimes abrupt changes. Century-scale analyses further confirm that the teleconnection signals of ENSO/PDO on precipitation and runoff are spatially heterogeneous, which explains the weak long-term memory observed in this study [61,62].
(3)
Evapotranspiration: Joint Control by Warming and Vegetation Greening
Evapotranspiration (ET) displays significant persistence during summer and autumn, with strong spectral coherence with temperature in the 2–8-year band, indicating that the long-term increase in ET is driven by both rising temperatures and enhanced vegetation activity. Satellite and ground observations have documented widespread “greening” across northeastern China, which enhances potential evapotranspiration and reduces runoff generation. SWAT-based attribution studies in the SSR sub-basin have confirmed that temperature rise reduces runoff, whereas increases in precipitation partly offset this effect. Findings suggest that the regular and narrow-band spectral features observed for SSR reflect its strong eco-hydrological coupling and well-defined climate sensitivity [63,64].
(4)
Relative Humidity: Stable Cold-Season Drying and Snowpack Impacts
Relative humidity exhibits strong persistence and concentrated low-frequency power during winter, indicating a stabilized cold-season drying trend. This is consistent with observations of declining snowfall and snow cover and a shift in snowmelt timing, which alters winter–spring runoff generation. The Nenjiang River Basin in particular shows amplified low-frequency power for relative humidity, suggesting that snow and soil moisture processes play a dominant role in regulating moisture availability and hydrological responses [62,65].
(5)
Sunshine Duration: Radiation Recovery and Feedbacks
Sunshine duration shows stronger persistence in summer and autumn across all sub-basins, pointing to increasingly stable surface radiation conditions. This finding is consistent with the “surface brightening” trend observed in eastern and central China since the early 2000s, driven by reductions in aerosol loading and changes in land cover. Such radiative stabilization has been shown to affect evapotranspiration and surface energy balance, leaving a detectable signature in the wavelet spectrum [63,66].
(6)
Inter-basin Linkages and Differential Responses (Direct Response to Reviewer)
Our results indicate that the three sub-basins are not independent systems but share common external climatic drivers while exhibiting distinct internal responses: Shared Forcing with Local Modulation: The low-frequency components of temperature and ET are coherent across the basin system, reflecting the influence of large-scale climate forcing (ENSO, PDO). However, local topography, land cover, and water regulation projects introduce basin-specific modulation, producing differences in the amplitude and distribution of wavelet power and Hurst values [60,61]. Nenjiang River Basin: Displays the largest low-frequency amplitudes and strongest persistence for temperature and humidity, indicating high sensitivity to external climate forcing and a critical role of snow processes in hydrological regulation [61,65]. Second Songhua River Basin (SSR): Shows more concentrated and regular spectral peaks, consistent with modeling evidence that runoff in SSR responds more predictably to temperature-driven ET increases and is strongly controlled by coupled land–atmosphere processes [60,64]. Mainstream Songhua River: Represents an intermediate state, integrating signals from both tributaries and exhibiting additional high-frequency fluctuations linked to local water management and land-use impacts [62].
(7)
Linking Statistical Signals to Physical Mechanisms
The joint interpretation of Hurst exponents and wavelet power spectra provides a bridge between statistical characterization and physical causality. High Hurst values combined with persistent low-frequency wavelet power imply dominant external forcing and long-term feedback loops [59], whereas low Hurst values with fragmented high-frequency power indicate strong influence of stochastic atmospheric dynamics and limited predictability [17]. These signatures translate into distinct runoff generation regimes: warming-driven ET increase suppresses runoff efficiency, while precipitation variability governs flood and drought occurrences. The differential sensitivity of the three sub-basins highlights the need to explicitly consider climate–hydrology coupling in regional water resource planning [51,64].
(8)
Implications for Basin Management
Given the contrasting persistence and spectral characteristics among the three sub-basins, adaptive management strategies should be basin-specific. For the Second Songhua River Basin, emphasis should be placed on mitigating temperature-induced runoff reduction and accounting for long-term ET enhancement in water allocation planning. For the Nenjiang River Basin, enhanced monitoring and early warning of ENSO/PDO-related hydroclimatic anomalies and snowpack changes are essential [64,65]. More broadly, the combination of statistical diagnostics (Hurst, wavelet) with physically based models (SWAT, Budyko-type, cryo-hydrological models) is recommended for robust attribution and scenario-based prediction of hydrological responses under future climate change [20,59].

5.2. Characteristics of River Discharge Variations in a Watershed

Based on the MK test, linear trend estimation, and wavelet analysis for the period 1980–2022, the mainstream of the Songhua River and the Nenjiang River Basin demonstrate pronounced sensitivity of runoff to climatic and hydrological variability, characterized by robust increasing trends, temporally clustered abrupt changes, and distinct periodic fluctuations. In contrast, the Second Songhua River Basin exhibits comparatively weak variability and a more stable regime. In the mainstream and Nenjiang basins, spring, summer, and autumn runoff show significant positive trends, with the steepest slope observed in autumn, indicating a persistent and stable linear growth. Most abrupt changes occurred around 2009, whereas winter mutations were delayed until approximately 2015, reflecting a transition from gradual accumulation to abrupt hydrological adjustment. The Second Songhua River Basin, however, showed abrupt changes mainly in summer, with other seasons displaying negligible shifts, underscoring strong seasonal dependence and local regulation [67]. Wavelet analysis revealed significant 5–10-year oscillations in both the mainstream and Nenjiang basins, particularly in autumn and winter, where wavelet energy was more concentrated and periodic structures clearer. These mid-term cycles highlight the influence of sustained interannual-to-decadal drivers. Conversely, the Second Songhua River Basin exhibited more diffuse energy distributions and weaker seasonal contrasts, implying that anthropogenic interventions and reservoir regulation dampen natural climatic signals [57,58]. Seasonal contrasts were evident. Autumn emerged as the most responsive season across all three basins, with persistent increases and concentrated periodic fluctuations. Summer also showed significant positive trends but was characterized by higher variability and more frequent abrupt changes, especially in the mainstream and Nenjiang basins, reflecting complex hydrological dynamics during the high-flow season. Winter displayed minimal change, with non-significant trends and low periodic energy, likely due to the stabilizing effects of ice cover and intensive water regulation. Spring responses were spatially heterogeneous: positive trends were detected in the mainstream and Nenjiang basins, whereas the Second Songhua Basin showed slight declines, suggesting contrasting responses to earlier snowmelt and uneven spring warming [17,59].
These differential patterns can be attributed to multiple coupled drivers. First, rising temperatures and more frequent extreme precipitation events have advanced snowmelt and intensified summer–autumn rainfall, leading to enhanced runoff, particularly in snow-dominated highland regions such as the mainstream and Nenjiang basins [68]. Second, human interventions—including reservoir regulation, water resource exploitation, and urbanization in the Second Songhua Basin—significantly attenuate natural climate signals. Third, heterogeneity in slope, soil permeability, and land cover affects the efficiency of hydrological responses to precipitation and temperature, contributing to spatially diverse runoff dynamics. Overall, the Songhua River Basin exhibits marked seasonal and spatial differentiation in runoff evolution, driven by a complex interplay of climatic forcing and human regulation. These findings emphasize the need for watershed management and climate adaptation strategies that explicitly account for seasonal vulnerability—particularly the risks associated with increasing autumn and summer runoff—and integrate coupled drivers such as temperature, precipitation, topography, and reservoir operations into decision-making frameworks.

5.3. Impact of Meteorological Factors on Runoff and Basin-Scale Dry-Wet Transition Characteristics

In this study, runoff changes in the Songhua River Basin and its three major sub-basins during 1980–2022 were quantitatively attributed based on the elasticity-decomposition framework derived from the Budyko hypothesis. Under the Budyko framework, annual runoff Q can be expressed as a coupled response to precipitation P, potential evapotranspiration E 0 (or atmospheric water demand), and the catchment parameter n, which represents basin storage capacity, land surface properties, and anthropogenic regulation. The elasticity coefficient ε X is defined as the proportional change in Q relative to a proportional change in X: ε X = Q / Q X / X . This definition is analytically derived from the Budyko curve and allows direct quantification of the magnitude and sign of single-factor impacts [8,69,70,71].
The key findings are consistent with the physical interpretation of the Budyko framework and provide further insight at the seasonal scale:
Summer: Precipitation Dominance with High Precipitation Elasticity ( ε P ). Summer showed the strongest runoff response among the four seasons, with precipitation elasticity coefficients ( ε P ) markedly higher than in other seasons. In the Nenjiang river basin, ε P exceeded 3 in several years, meaning that a 1% change in precipitation corresponds to >3% change in runoff, indicating a highly precipitation-sensitive state with limited basin regulation capacity. The Budyko curve thus amplifies precipitation variability in summer [8,69,70,71]. Similar summer precipitation dominance has been reported by Budyko-based elasticity analyses in tributaries of the middle Yellow River and other cold-temperate monsoonal basins [57].
Summer: Evapotranspiration Suppression of Runoff (Negative ε E ). Under summer high-temperature conditions, potential evapotranspiration increase significantly suppressed runoff, as indicated by strongly negative ε E . Within the Budyko energy–water balance framework, this reflects the shift in available water toward evapotranspiration at the expense of runoff [69,70]. Similar patterns have been observed in the headwaters of the Yangtze River and other snow- and glacier-fed basins, where warming-induced evapotranspiration increase reduces runoff despite precipitation increases [72,73].
Spring and Autumn: Dominance of Underlying-Surface Processes ( ε n Large and Highly Variable). In non-flood seasons when precipitation is relatively scarce, the catchment parameter n elasticity ( ε n ) exhibited large fluctuations and became the dominant driver. This indicates that freeze–thaw processes, permafrost degradation, soil and land cover change strongly controlled runoff generation, exceeding the direct influence of climate variables. Similar results have been reported for high-elevation and snow-dominated basins where seasonal storage and cryospheric changes largely control non-flood season runoff [73,74].
Anthropogenic Regulation Signal: Post-2000 Increase of ε n . Both the mainstream and the Second Songhua River basin exhibited a marked increase in elasticity after 2000. Comparison with engineering and water-use records shows that reservoir construction, irrigation expansion, and urbanization during this period intensified human regulation, shifting the Budyko trajectory from a “natural” to a “human-regulated” water-partitioning path [51,57]. This finding is consistent with hybrid studies in heavily regulated catchments worldwide, where wet-season changes remain precipitation-dominated while dry-season changes are increasingly shaped by land-use and management signals [71,75].
Aridity Index and Seasonal Drought Risk. The PET/P-based aridity index remained >1 in winter over the study period, indicating a structural water deficit. In spring and autumn, aridity showed upward fluctuations in several years, particularly after 2000, indicating an increased risk of non-flood season drying and threats to spring snowmelt runoff and autumn baseflow security. This interpretation is consistent with the physical meaning of aridity in the Budyko framework [8,71].
Abrupt Change Years and Coupled Drivers. Mann–Kendall trend and Pettitt change-point tests confirmed significant regime shifts: in 2003 for the mainstream, 1998 for the Second Songhua River, and 2001 for the Nenjiang River. Following these shifts, ε n rose significantly, demonstrating strong coupling with changes in land cover, water infrastructure, and irrigation intensity [15,76,77]. These change years coincided with East Asian monsoon anomalies and ENSO events (e.g., the 1997–1998 ENSO), indicating that runoff regime shifts were jointly driven by large-scale climate variability and anthropogenic disturbances [78].
The Songhua Basin pattern—strong summer precipitation sensitivity (high ε P ), runoff suppression under warming (negative ε E ), and rising human-regulation elasticity ( ε n )—is consistent with Budyko/elasticity findings from the middle Yellow River tributaries, Yangtze headwaters, high-elevation and snow-dominated basins, and western U.S. snow-fed catchments [57,72,73,74,75,76]. By using the Budyko framework, climate drivers (P, PET) and catchment features (n) are expressed within a unified energy–water relationship, allowing seasonal attribution of runoff changes to be quantitatively comparable across regions. This refined, seasonally resolved attribution is crucial for guiding adaptive water-resources management strategies in the Songhua Basin [51,57,71].
Management Implications (Budyko-Based): Given the very high summer precipitation elasticity, early-warning systems and reservoir operation strategies should prioritize flood-season regulation. Because spring and autumn runoff are highly sensitive to n (surface and management factors), water allocation planning should strengthen irrigation efficiency and optimize reservoir operations to maintain spring snowmelt runoff and autumn baseflow security. Budyko-based elasticity analysis should be integrated into long-term scenario assessments and decision-support systems for basin management [51,57,71].

5.4. Limitations of Budyko Hypothesis

Although the Budyko framework is widely recognized for its generality and simplicity in runoff attribution at the catchment scale, its application in this study is subject to several critical limitations, which become particularly evident under non-stationary climatic conditions. To highlight methodological robustness and possible improvements, we also draw on comparative insights from international studies.
First, the Budyko model is founded on the assumption of climatic stationarity, where long-term water storage changes (ΔS\Delta SΔS) approach zero. This assumption may not hold under periods of rapid climate change or frequent extreme events, leading to considerable attribution bias. For instance, Mianabadi et al. (2020) demonstrated that the framework is valid only under equilibrium conditions and fails to capture disturbances such as permafrost degradation or abrupt climatic shifts [78]. The treatment of the shape parameter nnn or www is commonly assumed to be constant and transferable across regions. However, Reaver et al. (2022) provided empirical evidence that these parameters are not physical quantities and cannot be directly transferred between basins or across temporal scales; instead, they largely serve as proxies for aridity, thereby weakening the model’s predictive capacity [79]. In addition, the classical Budyko model indirectly reflects anthropogenic impacts (e.g., agricultural expansion, dam construction) through changes in the shape parameter, but it lacks explicit quantification of specific human activities. This limitation is particularly critical in highly regulated basins, where alternative attribution approaches such as the differential method and the complementary relationship method should be employed to more clearly disentangle climatic and anthropogenic influences.
On the other hand, incorporating vegetation and ecosystem dynamics has substantially enhanced the explanatory power of the Budyko framework at the global scale. Gan et al. (2021) found that including vegetation structure and rooting depth improved the explanatory power for ET spatial variability to more than 90%, with forest cover contributing 30.7% ± 22.5% to interannual runoff variation, especially in water-sensitive regions [80]. This highlights the feasibility of extending the Budyko framework to integrate coupled climate–ecosystem interactions. Moreover, different Budyko-derived attribution methods (e.g., differential, complementary, and extrapolation approaches) yield considerable differences in parameter interpretation and attribution results, as shown in comparative studies. For example, Mo et al. (2024) applied the elasticity method in the Chengbi River Basin and reported attribution results that diverged from those of the classical Budyko approach, underscoring the significant influence of methodological choice on attribution outcomes [81]. Uncertainty analyses also point to substantial biases in runoff projections derived from the Budyko framework. A recent study (2024) emphasized that runoff estimates from Budyko-based models require careful sensitivity testing and systematic error assessment, especially under long-term projections [82]. The theoretical basis of Budyko-type functions has also been questioned. Paz Pellat et al. (2022) argued that although certain Budyko-type functions satisfy limiting boundary conditions, they lack rigorous hydrological derivation and therefore require cautious application [83].
Finally, there is a growing body of work integrating the Budyko framework with distributed soil moisture or process-based hydrological models to capture nonlinear responses more accurately. For example, Chen et al. (2020) demonstrated that incorporating soil moisture mediation significantly improved the explanatory power of Budyko-based analysis, particularly for seasonal variability and water storage processes, bringing simulated results closer to observations [84].

6. Conclusions

This study applied the Budyko framework, in combination with Mann–Kendall trend tests, Pettitt mutation analysis, Hurst index evaluation, and wavelet analysis, to investigate the spatiotemporal dynamics and drivers of runoff in the Songhua River Basin from 1980 to 2022. The main conclusions are as follows:
1.
Climatic Trends and Hydrological Regime Shifts:
The Songhua River Basin experienced significant climatic changes over the past four decades, including consistent warming, spatially heterogeneous precipitation patterns, and marked declines in relative humidity. Temperature showed strong persistence, particularly in summer and winter, indicating enhanced warming in mid–high latitudes. Precipitation and evapotranspiration exhibited pronounced interannual and decadal cycles synchronized with ENSO and monsoon variability, driving hydrological regime adjustments from gradual changes to abrupt shifts.
2.
Runoff Variation and Change Points:
Runoff in the mainstream Songhua and Nenjiang basins showed significant increasing trends, with autumn displaying the most pronounced and stable growth. Abrupt change points were concentrated between 2009 and 2015, reflecting a transition from gradual hydrological evolution to step-like regime changes. In contrast, the Second Songhua Basin displayed weaker variability, with abrupt shifts largely confined to summer, consistent with stronger regulation by human activities.
3.
Budyko-Based Attribution of Runoff Changes:
Using the Budyko elasticity framework, precipitation elasticity ( ε P ) was identified as the dominant factor, especially in summer, where values exceeded 3 in the Nenjiang Basin, indicating extremely high runoff sensitivity to precipitation. Evapotranspiration elasticity ( ε E ) was strongly negative in summer, demonstrating the suppressive effect of enhanced atmospheric demand under warming conditions. The catchment parameter elasticity ( ε n ) played a key role in spring and autumn and increased significantly after 2000 in the mainstream and Second Songhua sub-basins, reflecting the growing impact of land-use change, reservoir operation, and irrigation expansion.
4.
Hydroclimatic Risks and Drying Trends:
The aridity index revealed persistent winter water deficits and a post-2000 increase in spring and autumn dryness, which threatens snowmelt-driven runoff and autumn baseflow stability. Mutation years were closely linked to both large-scale climate anomalies (e.g., ENSO, monsoon shifts) and intensified human activities, suggesting that runoff regime shifts were co-driven by climate forcing and anthropogenic regulation.
5.
Implications for Water Resources Management:
The Budyko-based attribution results highlight that future water management must account for the distinct roles of precipitation, evapotranspiration, and underlying surface regulation. Strategies should focus on flood-season reservoir operation to mitigate high precipitation elasticity, enhance irrigation efficiency to stabilize dry-season flows, and strengthen basin regulation to cope with the dual pressures of climate variability and increasing anthropogenic interventions.
In summary, the evolution of runoff in the Songhua River Basin is governed by a coupled climate–catchment system described by the Budyko framework, with a clear transition from climate-dominated gradual changes to a regime strongly influenced by human regulation. These findings provide a robust theoretical and quantitative basis for designing adaptive, basin-specific strategies to enhance water security and climate resilience in Northeast China.

Author Contributions

X.W.: Writing—original draft. C.D.: Review, editing. G.L.: Software, Methodology. X.M.: Validation, Resources. P.L.: Resources. B.P.: Resources. All authors have read and agreed to the published version of the manuscript.

Funding

This research is funded by: (1) [Research and analysis of Sino-Russian glacial flow measurement technology in Heilongjiang (Amur River) and suggestions on survey schemes]. (2) [Yunnan Key Laboratory of International Rivers and Transboundary Eco-Security] grant number [2022KF03]. The APC was funded by [2022KF03].

Institutional Review Board Statement

Not applicable.

Informed Consent Statement

Not applicable.

Data Availability Statement

Publicly available datasets were analyzed in this study. This data can be found here: (1) Institute of Tibetan Plateau Research Chinese Academy of Sciences (TPDC) (https://data.tpdc.ac.cn/zh-hans/data/e5c335d9-cbb9-48a6-ba35-d67dd614bb8c URL, accessed on 1 July 2025)/(https://data.tpdc.ac.cn/zh-hans/data/daa58689-a6d2-46cf-90fc-b73014ecef9d URL, accessed on 1 July 2025). (2) Copernicus Climate Data Store (https://cds.climate.copernicus.eu URL, accessed on 1 July 2025)/(https://cds.climate.copernicus.eu)/(https://cds.climate.copernicus.eu URL, accessed on 1 July 2025).

Acknowledgments

We are deeply indebted to all co-authors for their collaborative efforts and constructive contributions to this work.

Conflicts of Interest

The authors declare no conflicts of interest.

Appendix A

Figure A1. Long-term seasonal mean spatial distribution of temperature, precipitation, potential evapotranspiration, relative humidity, and sunshine duration in the Songhua River Basin (1980–2022).
Sustainability 17 08459 g0a1
Figure A2. Pettitt test results for runoff in the Songhua River basin.
Sustainability 17 08459 g0a2

References

  1. Montanari, A.; Young, G.; Savenije, H.H.G.; Hughes, D.; Wagener, T.; Ren, L.L.; Koutsoyiannis, D.; Cudennec, C.; Toth, E.; Grimaldi, S.; et al. “Panta Rhei—Everything Flows”: Change in Hydrology and Society—The IAHS Scientific Decade 2013–2022. Hydrol. Sci. J. 2013, 58, 1256–1275. [Google Scholar] [CrossRef]
  2. Gu, X.; Bai, W.; Li, J.; Kong, D.; Liu, J.; Wang, Y. Spatio-Temporal Changes and Their Relationship in Water Resources and Agricultural Disasters across China. Hydrol. Sci. J. 2019, 64, 490–505. [Google Scholar] [CrossRef]
  3. Piao, S.; Liu, Q.; Chen, A.; Janssens, I.A.; Fu, Y.; Dai, J.; Liu, L.; Lian, X.; Shen, M.; Zhu, X. Plant Phenology and Global Climate Change: Current Progresses and Challenges. Glob. Change Biol. 2019, 25, 1922–1940. [Google Scholar] [CrossRef] [PubMed]
  4. Huang, J.; Yu, H.; Dai, A.; Wei, Y.; Kang, L. Drylands Face Potential Threat under 2 °C Global Warming Target. Nat. Clim. Change 2017, 7, 417–422. [Google Scholar] [CrossRef]
  5. Jiang, C.; Xiong, L.; Wang, D.; Liu, P.; Guo, S.; Xu, C.-Y. Separating the Impacts of Climate Change and Human Activities on Runoff Using the Budyko-Type Equations with Time-Varying Parameters. J. Hydrol. 2015, 522, 326–338. [Google Scholar] [CrossRef]
  6. Ye, X.; Zhang, Q.; Liu, J.; Li, X.; Xu, C. Distinguishing the Relative Impacts of Climate Change and Human Activities on Variation of Streamflow in the Poyang Lake Catchment, China. J. Hydrol. 2013, 494, 83–95. [Google Scholar] [CrossRef]
  7. Budyko, M.I. Climate and Life; Academic Press: Cambridge, MA, USA, 1974. [Google Scholar]
  8. Zhang, L.; Hickel, K.; Dawes, W.R.; Chiew, F.H.S.; Western, A.W.; Briggs, P.R. A Rational Function Approach for Estimating Mean Annual Evapotranspiration. Water Resour. Res. 2004, 40, W02502. [Google Scholar] [CrossRef]
  9. Cong, Z.; Zhang, X.; Li, D.; Yang, H.; Yang, D. Understanding Hydrological Trends by Combining the Budyko Hypothesis and a Stochastic Soil Moisture Model. Hydrol. Sci. J. 2015, 60, 145–155. [Google Scholar] [CrossRef]
  10. Rouholahnejad Freund, E.; Kirchner, J.W. A Budyko Framework for Estimating How Spatial Heterogeneity and Lateral Moisture Redistribution Affect Average Evapotranspiration Rates as Seen from the Atmosphere. Hydrol. Earth Syst. Sci. 2017, 21, 217–233. [Google Scholar] [CrossRef]
  11. Xu, X.; Yang, D.; Yang, H.; Lei, H. Attribution Analysis Based on the Budyko Hypothesis for Detecting the Dominant Cause of Runoff Decline in Haihe Basin. J. Hydrol. 2014, 510, 530–540. [Google Scholar] [CrossRef]
  12. Li, Z.; Ning, T.; Li, J.; Yang, D. Spatiotemporal Variation in the Attribution of Streamflow Changes in a Catchment on China’s Loess Plateau. CATENA 2017, 158, 1–8. [Google Scholar] [CrossRef]
  13. Lv, X.; Zuo, Z.; Ni, Y.; Sun, J.; Wang, H. The Effects of Climate and Catchment Characteristic Change on Streamflow in a Typical Tributary of the Yellow River. Sci. Rep. 2019, 9, 14535. [Google Scholar] [CrossRef]
  14. Hamed, K.H.; Ramachandra Rao, A. A Modified Mann-Kendall Trend Test for Autocorrelated Data. J. Hydrol. 1998, 204, 182–196. [Google Scholar] [CrossRef]
  15. Pettitt, A.N. A Non-Parametric Approach to the Change-Point Problem. J. R. Stat. Soc. Ser. C Appl. Stat. 1979, 28, 126–135. [Google Scholar] [CrossRef]
  16. Stojković, M.; Ilić, A.; Prohaska, S.; Plavšić, J. Multi-Temporal Analysis of Mean Annual and Seasonal Stream Flow Trends, Including Periodicity and Multiple Non-Linear Regression. Water Resour. Manag. 2014, 28, 4319–4335. [Google Scholar] [CrossRef]
  17. Torrence, C.; Compo, G.P. A Practical Guide to Wavelet Analysis. Bull. Am. Meteorol. Soc. 1998, 79, 61–78. [Google Scholar] [CrossRef]
  18. Labat, D. Recent Advances in Wavelet Analyses: Part 1. A Review of Concepts. J. Hydrol. 2005, 314, 275–288. [Google Scholar] [CrossRef]
  19. Coulibaly, P.; Burn, D.H. Wavelet Analysis of Variability in Annual Canadian Streamflows. Water Resour. Res. 2004, 40, W03105. [Google Scholar] [CrossRef]
  20. Grinsted, A.; Moore, J.C.; Jevrejeva, S. Application of the Cross Wavelet Transform and Wavelet Coherence to Geophysical Time Series. Nonlinear Process. Geophys. 2004, 11, 561–566. [Google Scholar] [CrossRef]
  21. Trenberth, K.E.; Dai, A.; Van Der Schrier, G.; Jones, P.D.; Barichivich, J.; Briffa, K.R.; Sheffield, J. Global Warming and Changes in Drought. Nat. Clim. Change 2014, 4, 17–22. [Google Scholar] [CrossRef]
  22. Chen, Z.; Lei, H.; Yang, H.; Yang, D.; Cao, Y. Historical and Future Trends in Wetting and Drying in 291 Catchments across China. Hydrol. Earth Syst. Sci. 2017, 21, 2233–2248. [Google Scholar] [CrossRef]
  23. Donohue, R.J.; Roderick, M.L.; Mcvicar, T.R. On the Importance of Including Vegetation Dynamics in Budyko’s Hydrological Model. Hydrol. Earth Syst. Sci. 2007, 11, 983–995. [Google Scholar] [CrossRef]
  24. Gnann, S.J.; Woods, R.A.; Howden, N.J.K. Is There a Baseflow Budyko Curve? Water Resour. Res. 2019, 55, 2838–2855. [Google Scholar] [CrossRef]
  25. Chen, X.; Alimohammadi, N.; Wang, D. Modeling Interannual Variability of Seasonal Evaporation and Storage Change Based on the Extended Budyko Framework: Modeling Interannual Evaporation and Storage Change. Water Resour. Res. 2013, 49, 6067–6078. [Google Scholar] [CrossRef]
  26. Istanbulluoglu, E.; Wang, T.; Wright, O.M.; Lenters, J.D. Interpretation of Hydrologic Trends from a Water Balance Perspective: The Role of Groundwater Storage in the Budyko Hypothesis. Water Resour. Res. 2012, 48, W00H16. [Google Scholar] [CrossRef]
  27. Sposito, G. Incorporating the Vadose Zone into the Budyko Framework. Water 2017, 9, 698. [Google Scholar] [CrossRef]
  28. Xin, Z.; Li, Y.; Zhang, L.; Ding, W.; Ye, L.; Wu, J.; Zhang, C. Quantifying the Relative Contribution of Climate and Human Impacts on Seasonal Streamflow. J. Hydrol. 2019, 574, 936–945. [Google Scholar] [CrossRef]
  29. Fernandez, R.; Sayama, T. Comparison of Future Runoff Projections Using Budyko Framework and Global Hydrologic Model: Conceptual Simplicity vs Process Complexity. Hydrol. Res. Lett. 2015, 9, 75–83. [Google Scholar] [CrossRef]
  30. Ouyang, F.; Zhu, Y.; Fu, G.; Lu, H.; Zhang, A.; Yu, Z.; Chen, X. Impacts of Climate Change under CMIP5 RCP Scenarios on Streamflow in the Huangnizhuang Catchment. Stoch. Environ. Res. Risk Assess. 2015, 29, 1781–1795. [Google Scholar] [CrossRef]
  31. Zhang, X.; Xu, Y.; Hao, F.; Li, C.; Wang, X. Hydrological Components Variability under the Impact of Climate Change in a Semi-Arid River Basin. Water 2019, 11, 1122. [Google Scholar] [CrossRef]
  32. Mohammed, R.; Scholz, M. Climate Change and Anthropogenic Intervention Impact on the Hydrologic Anomalies in a Semi-Arid Area: Lower Zab River Basin, Iraq. Environ. Earth Sci. 2018, 77, 357. [Google Scholar] [CrossRef]
  33. Ma, C.; Pei, W.; Liu, J.; Fu, G. Long-Term Trends and Variability of Hydroclimate Variables and Their Linkages with Climate Indices in the Songhua River. Atmosphere 2024, 15, 174. [Google Scholar] [CrossRef]
  34. Liu, Z.; Hao, Z.; Xu, H.; Ju, Q.; Wu, G.; Xing, R. Climate Simulation and Estimation of Songhua River Basin Based on Model Integration. Water Power 2020, 46, 14–18. [Google Scholar]
  35. Li, G.; Chen, W.; Cui, Y.; Wang, H.; Chi, Y. The Adaptability and Irrigation Constraints Analysis of the WOFOST Model for Grain Production in the Songhua River Basin. J. Sci. Food Agric. 2024, 104, 7996–8007. [Google Scholar] [CrossRef]
  36. Shui, Y.; Xiaolong, Z.; Zhijuan, L.; Yan, W.; Yanjun, S. Spatial and temporal variations of extreme climate index in the Songhua River Basin during 1961–2020. Chin. J. Appl. Ecol. 2023, 34, 1091–1101. [Google Scholar] [CrossRef]
  37. Wang, G.; Yang, J.; Hu, Y.; Li, J.; Yin, Z. Application of a Novel Artificial Neural Network Model in Flood Forecasting. Environ. Monit. Assess. 2022, 194, 125. [Google Scholar] [CrossRef] [PubMed]
  38. Liu, S.; Zhou, Z.; Liu, J.; Li, J.; Jia, Y.; Wang, H.; Xu, C. Impact of Climate Change on Water Quality Evolution in Cold Regions Using a Water–Heat–Nitrogen Processes Coupled Model. Environ. Sci. Pollut. Res. 2024, 31, 22395–22409. [Google Scholar] [CrossRef]
  39. Yang, S.; Wang, H.; Tong, J.; Bai, Y.; Alatalo, J.M.; Liu, G.; Fang, Z.; Zhang, F. Impacts of Environment and Human Activity on Grid-Scale Land Cropping Suitability and Optimization of Planting Structure, Measured Based on the MaxEnt Model. Sci. Total Environ. 2022, 836, 155356. [Google Scholar] [CrossRef]
  40. Hu, J.; Miao, C.; Su, J.; Zhang, Q.; Gou, J.; Sun, Q. A New Upgraded High-Precision Gridded Precipitation Dataset Considering Spatiotemporal and Physical Correlations for Mainland China. Earth Syst. Sci. Data 2025, 17, 3987–4004. [Google Scholar] [CrossRef]
  41. Fang, S.; Mao, K.; Xia, X.; Wang, P.; Shi, J.; Bateni, S.M.; Xu, T.; Cao, M.; Heggy, E. A Daily Near-Surface Air Temperature Dataset for China from 1979–2018. Zenodo 2021. [Google Scholar] [CrossRef]
  42. ESSD—ERA5-Land: A State-of-the-Art Global Reanalysis Dataset for Land Applications. Available online: https://essd.copernicus.org/articles/13/4349/2021/ (accessed on 27 July 2025).
  43. Papalexiou, S.M.; Koutsoyiannis, D. Battle of Extreme Value Distributions: A Global Survey on Extreme Daily Rainfall. Water Resour. Res. 2013, 49, 187–201. [Google Scholar] [CrossRef]
  44. Yue, S.; Wang, C. The Mann-Kendall Test Modified by Effective Sample Size to Detect Trend in Serially Correlated Hydrological Series. Water Resour. Manag. 2004, 18, 201–218. [Google Scholar] [CrossRef]
  45. Sneyers, R. On the Statistical Analysis of Series of Observations; World Meteorological Organization: Geneva, Switzerland, 1990; ISBN 978-92-63-10415-1. [Google Scholar]
  46. Koutsoyiannis, D. Climate Change, the Hurst Phenomenon, and Hydrological Statistics. Hydrol. Sci. J. 2003, 48, 3–24. [Google Scholar] [CrossRef]
  47. Torrence, C.; Webster, P.J. Interdecadal Changes in the ENSO-Monsoon System. J. Clim. 1999, 12, 2775–2786. [Google Scholar] [CrossRef]
  48. Juez, C.; Garijo, N.; Nadal-Romero, E.; Vicente-Serrano, S.M. Wavelet Analysis of Hydro-Climatic Time-Series and Vegetation Trends of the Upper Aragón Catchment (Central Spanish Pyrenees). J. Hydrol. 2022, 614, 128584. [Google Scholar] [CrossRef]
  49. Jing, L. Long-Term Trends of Aridity Index and Its Sensitivity to Climate Factors in Northeast China:1971–2008. Geogr. Res. 2011, 30, 1765–1774. [Google Scholar]
  50. Zhang, L.; Dawes, W.R.; Walker, G.R. Response of Mean Annual Evapotranspiration to Vegetation Changes at Catchment Scale. Water Resour. Res. 2001, 37, 701–708. [Google Scholar] [CrossRef]
  51. Li, F.; Zhang, G.; Xu, Y.J. Separating the Impacts of Climate Variation and Human Activities on Runoff in the Songhua River Basin, Northeast China. Water 2014, 6, 3320–3338. [Google Scholar] [CrossRef]
  52. Li, F.; Zhang, G.; Xu, Y.J. Assessing Climate Change Impacts on Water Resources in the Songhua River Basin. Water 2016, 8, 420. [Google Scholar] [CrossRef]
  53. Shanshan, W.; Tong, J.; Xiucang, L.; Tengfei, W.; Yanjun, W.; Fischer, T. Changes of Actual Evapotranspiration over the Songhua River Basin from 1961 to 2010. Adv. Clim. Change Res. 2014, 10, 79. [Google Scholar] [CrossRef]
  54. Guo, J.; Chen, S. Long-Term Change in Relative Humidity across China from 1961–2018. Clim. Res. 2022, 87, 167–181. [Google Scholar] [CrossRef]
  55. Gao, G.; Chen, D.; Ren, G.; Chen, Y.; Liao, Y. Spatial and Temporal Variations and Controlling Factors of Potential Evapotranspiration in China: 1956–2000. J. Geogr. Sci. 2006, 16, 3–12. [Google Scholar] [CrossRef]
  56. Men, B.; Liu, H.; Tian, W.; Wu, Z.; Hui, J. The Impact of Reservoirs on Runoff under Climate Change: A Case of Nierji Reservoir in China. Water 2019, 11, 1005. [Google Scholar] [CrossRef]
  57. Li, Z.; Wu, Y.; Li, J.; Qi, P.; Sun, J.; Sun, Y. Attribution Analysis of Runoff Variation in the Second Songhua River Based on the Non-Steady Budyko Framework. Water 2023, 15, 451. [Google Scholar] [CrossRef]
  58. Xu, J.; Li, X.; Xue, J.; Dou, X.; Wu, W.; Wu, G.; Zhao, Q. Spatial-Temporal Characteristics of Meteorological Drought and Its Relationship with Circulation Indices over Songhua River Basin, China. J. Water Clim. Change 2024, 15, 2792–2808. [Google Scholar] [CrossRef]
  59. Simonsen, I.; Hansen, A.; Nes, O.M. Determination of the Hurst Exponent by Use of Wavelet Transforms. Phys. Rev. E 1998, 58, 2779–2787. [Google Scholar] [CrossRef]
  60. Su, L.; Miao, C.; Gou, J. Long-Term Trends in Songhua River Basin Streamflow and Its Multivariate Relationships with Meteorological Factors. Environ. Sci. Pollut. Res. Int. 2021, 28, 64206–64219. [Google Scholar] [CrossRef] [PubMed]
  61. Ouyang, R.; Liu, W.; Fu, G.; Liu, C.; Hu, L.; Wang, H. Linkages between ENSO/PDO Signals and Precipitation, Streamflow in China during the Last 100 Years. Hydrol. Earth Syst. Sci. 2014, 18, 3651–3661. [Google Scholar] [CrossRef]
  62. Ren, L.; Dong, X. Spatio-Temporal Characteristics of Drought and Its Relationship with El Niño-Southern Oscillation in the Songhua River Basin from 1960 to 2019. Water 2022, 14, 866. [Google Scholar] [CrossRef]
  63. Zhang, K.; Kimball, J.S.; Nemani, R.R.; Running, S.W.; Hong, Y.; Gourley, J.J.; Yu, Z. Vegetation Greening and Climate Change Promote Multidecadal Rises of Global Land Evapotranspiration. Sci. Rep. 2015, 5, 15956. [Google Scholar] [CrossRef]
  64. Liu, H.; Liu, J.; Chen, W. Effects of Climate and Land Use Change on Runoff of the Second Songhua River Basin Guided by SWAT Model. Water Supply 2025, 24, 707–722. [Google Scholar] [CrossRef]
  65. Feng, X.; Zhang, G.; Yin, X. Hydrological Responses to Climate Change in Nenjiang River Basin, Northeastern China. Water Resour. Manag. 2011, 25, 677–689. [Google Scholar] [CrossRef]
  66. Yang, S.; Wang, X.L.; Wild, M. Causes of Dimming and Brightening in China Inferred from Homogenized Daily Clear-Sky and All-Sky in Situ Surface Solar Radiation Records (1958–2016). J. Clim. 2019, 32, 5901–5913. [Google Scholar] [CrossRef]
  67. Wang, S.; Wang, Y.; Ran, L.; Su, T. Climatic and Anthropogenic Impacts on Runoff Changes in the Songhua River Basin over the Last 56 Years (1955–2010), Northeastern China. CATENA 2015, 127, 258–269. [Google Scholar] [CrossRef]
  68. Pei, W.; Liu, J.; Chen, Y.; Fu, G.; Ma, C.; Liu, Y. Quantifying Impacts of Human Activities and Climate Change on Runoff Variation: A Case Study of Songhua River Basin, China. Chin. Geogr. Sci. 2025, 35, 1153–1169. [Google Scholar] [CrossRef]
  69. Roderick, M.L.; Farquhar, G.D. A Simple Framework for Relating Variations in Runoff to Variations in Climatic Conditions and Catchment Properties. Water Resour. Res. 2011, 47, 2010WR009826. [Google Scholar] [CrossRef]
  70. Donohue, R.J.; Roderick, M.L.; McVicar, T.R. Assessing the Differences in Sensitivities of Runoff to Changes in Climatic Conditions across a Large Basin. J. Hydrol. 2011, 406, 234–244. [Google Scholar] [CrossRef]
  71. Berghuijs, W.R.; Larsen, J.R.; Van Emmerik, T.H.M.; Woods, R.A. A Global Assessment of Runoff Sensitivity to Changes in Precipitation, Potential Evaporation, and Other Factors. Water Resour. Res. 2017, 53, 8475–8486. [Google Scholar] [CrossRef]
  72. Liu, J.; Chen, J.; Xu, J.; Lin, Y.; Yuan, Z.; Zhou, M. Attribution of Runoff Variation in the Headwaters of the Yangtze River Based on the Budyko Hypothesis. Int. J. Environ. Res. Public Health 2019, 16, 2506. [Google Scholar] [CrossRef] [PubMed]
  73. Shi, G.; Gao, B. Attribution Analysis of Runoff Change in the Upper Reaches of the Kaidu River Basin Based on a Modified Budyko Framework. Atmosphere 2022, 13, 1385. [Google Scholar] [CrossRef]
  74. Musselman, K.N.; Addor, N.; Vano, J.A.; Molotch, N.P. Winter Melt Trends Portend Widespread Declines in Snow Water Resources. Nat. Clim. Change 2021, 11, 418–424. [Google Scholar] [CrossRef]
  75. Barnett, T.P.; Adam, J.C.; Lettenmaier, D.P. Potential Impacts of a Warming Climate on Water Availability in Snow-Dominated Regions. Nature 2005, 438, 303–309. [Google Scholar] [CrossRef]
  76. Mann, H.B. Nonparametric Tests against Trend. Econometrica 1945, 13, 245–259. [Google Scholar] [CrossRef]
  77. Sen, P.K. Estimates of the Regression Coefficient Based on Kendall’s Tau. J. Am. Stat. Assoc. 1968, 63, 1379–1389. [Google Scholar] [CrossRef]
  78. Mianabadi, A.; Davary, K.; Pourreza-Bilondi, M.; Coenders-Gerrits, A.M.J. Budyko Framework; towards Non-Steady State Conditions. J. Hydrol. 2020, 588, 125089. [Google Scholar] [CrossRef]
  79. Reaver, N.G.F.; Kaplan, D.A.; Klammler, H.; Jawitz, J.W. Theoretical and Empirical Evidence against the Budyko Catchment Trajectory Conjecture. Hydrol. Earth Syst. Sci. 2022, 26, 1507–1525. [Google Scholar] [CrossRef]
  80. Gan, G. Understanding Interactions among Climate, Water, and Vegetation with the Budyko Framework. Earth-Science Rev. 2021, 212, 103451. [Google Scholar] [CrossRef]
  81. Mo, C.; Huang, K.; Ruan, Y.; Lai, S.; Lei, X. Quantifying Uncertainty Sources in Runoff Change Attribution Based on the Budyko Framework. J. Hydrol. 2024, 630, 130790. [Google Scholar] [CrossRef]
  82. Melo, P.A.; Alvarenga, L.A.; Tomasella, J.; Santos, A.C.N. Uncertainty Analysis on Long-Term Runoff Projection from the Budyko Framework and a Conceptual Hydrological Model. J. Water Clim. Change 2024, 15, 3850–3866. [Google Scholar] [CrossRef]
  83. Paz Pellat, F.; Garatuza Payán, J.; Salas Aguilar, V.; Velázquez Rodríguez, A.S.; Bolaños González, M.A. Budyko-Type Models and the Proportionality Hypothesis in Long-Term Water and Energy Balances. Water 2022, 14, 3315. [Google Scholar] [CrossRef]
  84. Chen, X.; Sivapalan, M. Hydrological Basis of the Budyko Curve: Data-Guided Exploration of the Mediating Role of Soil Moisture. Water Resour. Res. 2020, 56, e2020WR028221. [Google Scholar] [CrossRef]
Figure 1. Map of the location and climate of the Songhua River basin.
Sustainability 17 08459 g001
Figure 2. Temporal evolution of seasonal means of five meteorological elements, along with Mann–Kendall test forward (UFK) and backward (UBK) statistics compared to the 0.05 significance thresholds, and their linear trends in the Songhua River main stream basin (1980–2022).
Sustainability 17 08459 g002
Figure 3. Temporal evolution of seasonal means of five meteorological elements, along with Mann–Kendall test forward (UFK) and backward (UBK) statistics compared to the 0.05 significance thresholds, and their linear trends in the Second Songhua River Basin (1980–2022).
Sustainability 17 08459 g003
Figure 4. Temporal evolution of seasonal means of five meteorological elements, along with Mann–Kendall test forward (UFK) and backward (UBK) statistics compared to the 0.05 significance thresholds, and their linear trends in the Nenjiang River Basin (1980–2022).
Sustainability 17 08459 g004
Figure 5. Pettitt test results of meteorological factors in Songhua River Basin.
Sustainability 17 08459 g005
Figure 6. Spatial distribution of linear trends in meteorological variables across the main stream basin of the Songhua River.
Sustainability 17 08459 g006
Figure 7. Spatial distribution of linear trends in meteorological variables across the Second Songhua River Basin.
Sustainability 17 08459 g007
Figure 8. Spatial distribution of linear trends in meteorological variables across the Nenjiang River Basin.
Sustainability 17 08459 g008
Figure 9. Spatial distribution of Hurst exponent values across the mainstream Songhua River Basin.
Sustainability 17 08459 g009
Figure 10. Spatial distribution of Hurst exponent values across the Second Songhua River Basin.
Sustainability 17 08459 g010
Figure 11. Spatial distribution of Hurst exponent values across the Nenjiang River Basin.
Sustainability 17 08459 g011
Figure 12. Contour map of the real part of wavelet coefficients for the mainstream Songhua River Basin (the horizontal axis represents time in years, and the vertical axis indicates the time scale in years.).
Sustainability 17 08459 g012
Figure 13. Contour map of the real part of wavelet coefficients for the Second Songhua River Basin (the horizontal axis represents time in years, and the vertical axis indicates the time scale in years.).
Sustainability 17 08459 g013
Figure 14. Contour map of the real part of wavelet coefficients for the Nenjiang River Basin (the horizontal axis represents time in years, and the vertical axis indicates the time scale in years.).
Sustainability 17 08459 g014
Figure 15. Wavelet variance plot for the Songhua River Basin (the horizontal axis represents the time scale in years, while the vertical axis denotes the wavelet variance).
Sustainability 17 08459 g015
Figure 16. Temporal evolution of seasonal mean runoff, along with Mann–Kendall test forward (UFK) and backward (UBK) statistics compared to the 0.05 significance thresholds, and its linear trend in the Songhua River Basin (1980–2022).
Sustainability 17 08459 g016
Figure 17. Contour map of the real part of wavelet coefficients for runoff in the Songhua River Basin.
Sustainability 17 08459 g017
Figure 18. Wavelet variance spectrum of runoff in the Songhua River Basin.
Sustainability 17 08459 g018
Figure 19. Contributions of climatic and underlying surface factors to runoff variation.
Sustainability 17 08459 g019
Figure 20. Sensitivity of seasonal runoff in the Songhua River Basin to underlying surface parameters, precipitation, potential evapotranspiration, and drought index variations.
Sustainability 17 08459 g020
Table 1. Time scale, spatial scale, and sources of data used in the research institute.
Data TypeData NameTime ScaleSpatial ScaleTime SpanSOURCE
Meteorological dataPrecipitationDaily0.1°1980–2022https://data.tpdc.ac.cn/zh-hans/data/e5c335d9-cbb9-48a6-ba35-d67dd614bb8c (accessed on 1 July 2025)
Average temperatureDaily0.1°1980–2018https://data.tpdc.ac.cn/zh-hans/data/daa58689-a6d2-46cf-90fc-b73014ecef9d (accessed on 1 July 2025)
Relative humidityDaily0.1°1980–2022https://cds.climate.copernicus.eu (accessed on 1 July 2025)
EvaporationDaily0.1°1980–2022https://cds.climate.copernicus.eu (accessed on 1 July 2025)
Sunshine hoursDaily0.1°1980–2022https://cds.climate.copernicus.eu (accessed on 1 July 2025)
Hydrological dataRun offDailystation data1980–2022Actual measurement data from 12 hydrological stations in the Songhua River Basin, including Harbin, Jiamusi, Lanxi, Jilin, Fuyu, Dalai, Jiangqiao, Liujiatun, Dedu, Guchengzi, Yanqiao, and Nianzishan
Table 2. Abrupt change times of climatic and hydrological elements by season in the Songhua River Basin.
BasinMeteorological FactorSeasonMk Test to Determine the Abrupt Change PeriodPettitt Abrupt Change Detection
Songhua River main stream basinAverage temperatureSpring1993/19991996
Summer1992–20041993
Autumn1989
Winter1982–20091988
PrecipitationSpring2004
Summer2010–20222011
Autumn2010–20192011
Winter1999–20011999
EvaporationSpring2009
Summer2000–20112002
Autumn1984
Winter2004
Relative HumiditySpring1997–20002001
Summer1980–19981994
Autumn1994
Winter1996
Sunshine HoursSpring1980–20072004
Summer1992–19991998
Autumn1999
Winter1998–20041995
The Second Songhua River BasinAverage temperatureSpring1996–20001996
Summer1993
Autumn1997–20172002
Winter1981–20051999
PrecipitationSpring2003–20132004
Summer1968–19881987
Autumn1975–20001992
Winter2001–20122003
EvaporationSpring2003
Summer2000–20152001
Autumn1989–19931992
Winter20032003
Relative HumiditySpring20012001
Summer1982–19941994
Autumn1994
Winter1990–19951994
Sunshine HoursSpring1990–19951992
Summer1993–19961996
Autumn2001
Winter1994–20011994
Nenjiang River BasinAverage temperatureSpring1993–19961996
Summer1992–19981993
Autumn1989
Winter1987
PrecipitationSpring2002–20062003
Summer1981–20201979
Autumn1988–20192011
Winter1983
EvaporationSpring2013
Summer2000–20072000
Autumn1996–20132012
Winter2002–20132003
Relative HumiditySpring1998–20022002
Summer1988–19981998
Autumn1995
Winter1994–20021994
Sunshine HoursSpring2003–20172016
Summer1996–19981998
Autumn1999
Winter1981–20001993
Table 3. Abrupt change time of runoff in the Songhua River Basin.
BasinFactorSeasonMk Test to Determine the Abrupt Change PeriodPettitt Abrupt Change Detection
Songhua River main stream basinRunoffSpring2004–20102009
Summer2010–20172010
Autumn2012–20182012
Winter2015
The Second Songhua River BasinRunoffSpring2014–20212015
Summer1980–20102010
Autumn1998–20182018
Winter2002
Nenjiang River BasinRunoffSpring2012
Summer2011–20182011
Autumn1988–20182012
Winter2002
Table 4. Causes of abrupt changes in seasonal runoff and contribution degree of each influencing factor in Songhua River Basin.
BasinSeasonMutation Year ε p ε E T 0 ε n C x p C x E C x n The Cause of the Mutation
Songhua River main stream basin Spring 20091.001 −0.001 −0.011 102.211 0.086 −2.297 Climate change
Summer20101.659−0.659−0.341−388.17473.284414.890Human activities
Autumn 20121.234−0.234087.32312.6780.000Climate change
Winter20151.1012 −0.1012 −0.3298 838.4204 −2.9048 −735.52 Climate change
The Second Songhua River Basin Spring 20151.10−0.10−0.42−0.041.4698.58Human activities
Summer20101.0000.000−0.00596.4780.0043.518Climate change
Autumn 20181.0000.000−0.006100.017−0.0170.000Climate change
Winter20021.00061−0.00061−0.0087100.105−0.1050Climate change
Nenjiang River Basin Spring 20121.70−0.70−1.1976.85−1.6294.77Human activities
Summer20111.29−0.29−0.71−253.80−192.38546.18Human activities
Autumn 20121.474 −0.474 0.000 83.707 16.350 −0.058 Climate change
Winter20021.000 0.000 −0.007 99.839 0.161 0.000 Climate change
Disclaimer/Publisher’s Note: The statements, opinions and data contained in all publications are solely those of the individual author(s) and contributor(s) and not of MDPI and/or the editor(s). MDPI and/or the editor(s) disclaim responsibility for any injury to people or property resulting from any ideas, methods, instructions or products referred to in the content.