Article

Fracture Process in Conceptual Numerical Geological Rock Mass System Model and Its Implications for Landslide Monitoring and Early Warning

1
School of Environment and Civil Engineering, Chengdu University of Technology, Chengdu 610059, China
2
State Key Laboratory of Geohazard Prevention and Geoenvironment Protection, Chengdu University of Technology, Chengdu 610059, China
3
School of Civil Engineering, Dalian University of Technology, Dalian 116024, China
*
Author to whom correspondence should be addressed.
Sustainability 2025, 17(18), 8408; https://doi.org/10.3390/su17188408
Submission received: 19 August 2025 / Revised: 9 September 2025 / Accepted: 12 September 2025 / Published: 19 September 2025
(This article belongs to the Special Issue Landslide Hazards and Soil Erosion)

Abstract

To determine whether rock landslides can be predicted early and accurately forecasted, a numerical simulation method is used. The geological rock mass system is simplified into 16 heterogeneous geological rock mass units. By subjecting this two-dimensional planar model to uniaxial compression loading, qualitative insights into the evolution of displacement, stress, and acoustic emission signals throughout the fracture process of the heterogeneous geological rock mass were obtained, leading to the following insights: (1) Before the fracture of the heterogeneous geological rock mass system model, a “differentiation” phenomenon occurred, characterized by varying magnitudes and directions of both displacement and stress increments, coupled with a sudden surge in the number of acoustic emission events and their clustering near macroscopic cracks. Such a phenomenon could serve as an early warning indicator for predicting rock landslides. (2) Although the phenomenon of “differentiation” has been observed, the lack of uniformity and regularity in these phenomena across different elements indicates that integrated monitoring methods such as displacement, stress, and acoustic monitoring are insufficient for the precise prediction of rock landslides. (3) Increasing the number and range of monitoring points, as well as diversifying and integrating monitoring methods, can significantly enhance the precision of rockslide early warning systems. The outcomes of this research provide a scientific tool and metric for quantifying precursory signals of slope instability, thereby contributing to the development of sustainable environmental monitoring frameworks and informed policymaking for disaster-resilient infrastructure in vulnerable regions.

1. Introduction

Landslides pose a multi-faceted threat to sustainability, causing loss of life, damaging critical infrastructure, disrupting economic stability, and exacerbating social vulnerability. Early warning of rock landslides is therefore not merely a technical challenge but a critical component in building resilient societies, protecting vital infrastructure, and ensuring the long-term, sustainable development of mountainous areas. The essence of a landslide is the instability of the earth’s crust, which constitutes a vast geological rock mass system. Geological rock masses are exceedingly complex structures characterized by significant heterogeneity and nonlinear mechanical properties [1,2,3,4,5]. Consequently, the development of early detection and warning technologies for rock landslides has been challenging to implement effectively. At present, there remains a skeptical attitude towards the potential for early warning of rock landslides. Clarifying whether early warning for rock landslides is possible and whether such warnings can be precise is of utmost importance.
Drawing from extensive engineering practices, Saito [6] advocates that landslides are predictable. He notes that the incubation process of a landslide is a creep process, typically undergoing three stages of deformation: decelerating (or primary) creep, steady-state (or secondary) creep, and accelerating (or tertiary) creep, which can be characterized by a displacement-time curve (see Figure 1) illustrating the general evolutionary features of a landslide. Incrementally, landslide forecasting methods using displacement and its derivatives (such as velocity and acceleration) are considered among the most reliable and commonly utilized [7]. In recent years, novel monitoring technologies have spurred the evolution of landslide early warning systems, with scholars making notable advances in this field. Techniques such as Interferometric Synthetic Aperture Radar (InSAR) [8,9,10] and Global Navigation Satellite System (GNSS) [11,12,13,14,15,16] have been employed, which, through comprehensive monitoring from space, air, and ground perspectives, significantly enhance the precision and stability of landslide displacement monitoring. The fundamental cause of landslides is the presence of destabilizing forces. Researchers like He et al. [17] and Tao et al. [18,19] have successfully forewarned several rock landslides by monitoring the changes in force between the slide mass and the sliding bed. As landslides incubate, the rock and soil on the slope release energy due to internal fractures; scholars have also successfully forewarned of certain rock landslides by monitoring microseismic or acoustic signals [20,21,22].
The geological rock mass system is not a fundamentally complete entity but rather a structural system composed of numerous geological rock units of varying sizes, each with different physical and mechanical properties [23]. While there have been some successful cases of rockslide early warning using various monitoring methods, the prediction and early warning of rockslides remain imprecise due to the brittleness and heterogeneity of the geological rock units that constitute the geological rock mass system. The monitoring and early warning for rockslides frequently involves false alarms, missed alarms, and erroneous alarms. The displacement of rock landslides is sudden and often difficult to predict [24,25]. For instance, step-like rockslides have stepped deformation characteristics, making their failure time challenging to forecast [26]. Some rockslides have long-lasting deformation during the creep phase and the severe deformation phase, with complex mechanisms that make early warning difficult [27]. The precursory signals of rockslides are hard to capture. For example, landslide warning signals induced by underground mining are difficult to detect [28]; the randomness of landslide locations makes it hard to acquire seismic signals triggered by landslides [29], and obtaining complete monitoring data during the acceleration phase of landslide deformation is challenging [30]. These issues remain unresolved in the monitoring and early warning of rockslides. Therefore, there has never been a consensus on whether rockslides can be predicted or whether such predictions can be made accurately. In addition, the meso-mechanical principles governing how multi-physical field signals (e.g., displacement, stress, acoustic emissions) evolve within heterogeneous rock masses before macroscopic failure and generate identifiable early-warning precursors remain unclear. This limits the interpretation of the physical significance of landslide early-warning indicators and the precise construction of early-warning models.
Numerical methods have provided new insights into issues in geotechnical engineering [31], but insights regarding early warning of landslides remain quite limited. Although real landslides often manifest as shear failure, the essence of rock mass instability is macro-fractures caused by the accumulation of internal damage. The uniaxial compression model, by simulating the tensile–shear combined failure of numerical elements, can effectively reveal the physical mechanisms leading to precursors of fracture. Feng et al. [23] used the finite element method to propose a numerical conceptual model, suggesting that early warning of landslides cannot be achieved through the absolute value changes at one or several points. Their method of proof is quite interesting. However, they did not further discuss the principles of early warning monitoring for landslides and particularly lacked adequate representation of the heterogeneous nature of geological rock mass numerical models.
In view of this, this paper simplifies the geological rock mass system and uses numerical method of Rock Fracture Process Analysis (RFPA) to obtain the stress, displacement, and acoustic emission evolution characteristics throughout the fracturing process of the heterogeneity geological rock mass system under uniaxial compression. Simulation results reveal the early-warning mechanism underlying global displacement monitoring and multi-point stress monitoring in landslide prediction. It qualitatively explores the feasibility and accuracy of monitoring and early warning for rockslides, deriving several insights into the feasibility and precision of monitoring and early warning for rockslides. This study provides a scientific toolkit for enhancing the sustainability of slope engineering practices and disaster mitigation policies.

2. Establishment of Heterogeneous Geological Rock Mass System Model and Experimental Process

2.1. Basic Principles of RFPA Numerical Method

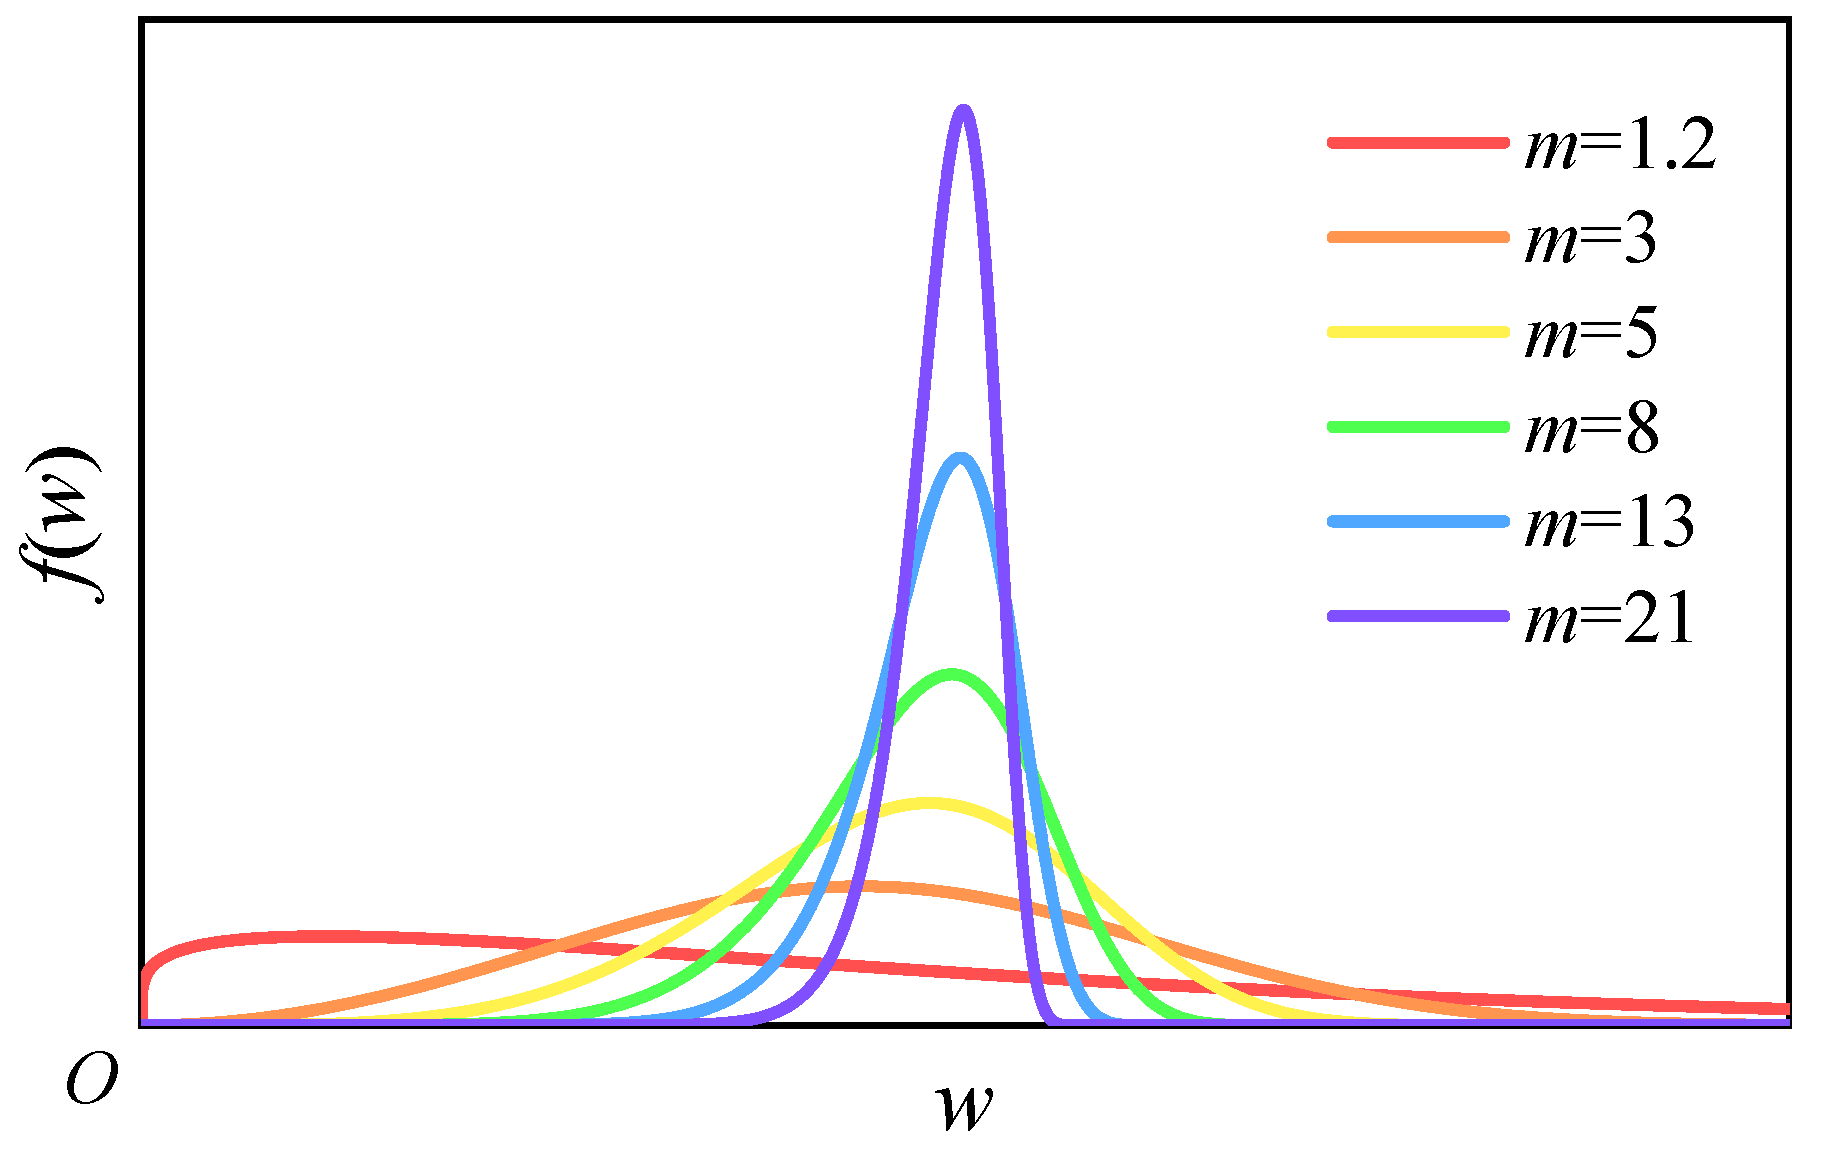
The inherent heterogeneity of geological rock masses is a crucial characteristic that cannot be overlooked. The RFPA method takes this key feature into full consideration. RFPA employs Weibull statistical distribution to describe the mechanical properties associated with the distribution of internal defects in materials and combines finite element stress analysis with statistical damage theory to model the fracture of numerical elements. This method has unique advantages in simulating the entire fracture process of heterogeneous brittle materials [32]. Different Weibull distribution parameters represent different heterogeneous materials. Equation (1) defines the Weibull distribution density function. Figure 2 shows the density function curve, where a higher homogeneity index m indicates that a greater proportion of elements are concentrated around the expected value; conversely, a lower homogeneity index m suggests a broader distribution of element properties. The RFPA software basic version has been applied in multiple fields, leading to the publication of several authoritative insights [33,34,35,36,37]. Xu et al. [37] noted that variations in the homogeneity index m significantly affect mechanical behavior during the fracture process. As the homogeneity index m decreases, the brittleness of the model decreases gradually, and nonlinear characteristics become increasingly pronounced.
f ( w ) = m w 0 w w 0 m 1 exp w w 0 m ,
where w represents a specified mechanical property (such as strength, elastic modulus, or Poisson’s ratio), w0 is a scaling parameter, and m is defined as the homogeneity index which determines the shape of the distribution function.
Damage mechanics can be used to define the fracture process of brittle material models under load, with the damage process described by the elastic modulus as shown in Equation (2), where the damage variable is denoted by ω:
E = ( 1 ω ) E 0 ,
where E and E0 represent the elastic modulus of the damaged and undamaged materials, respectively.
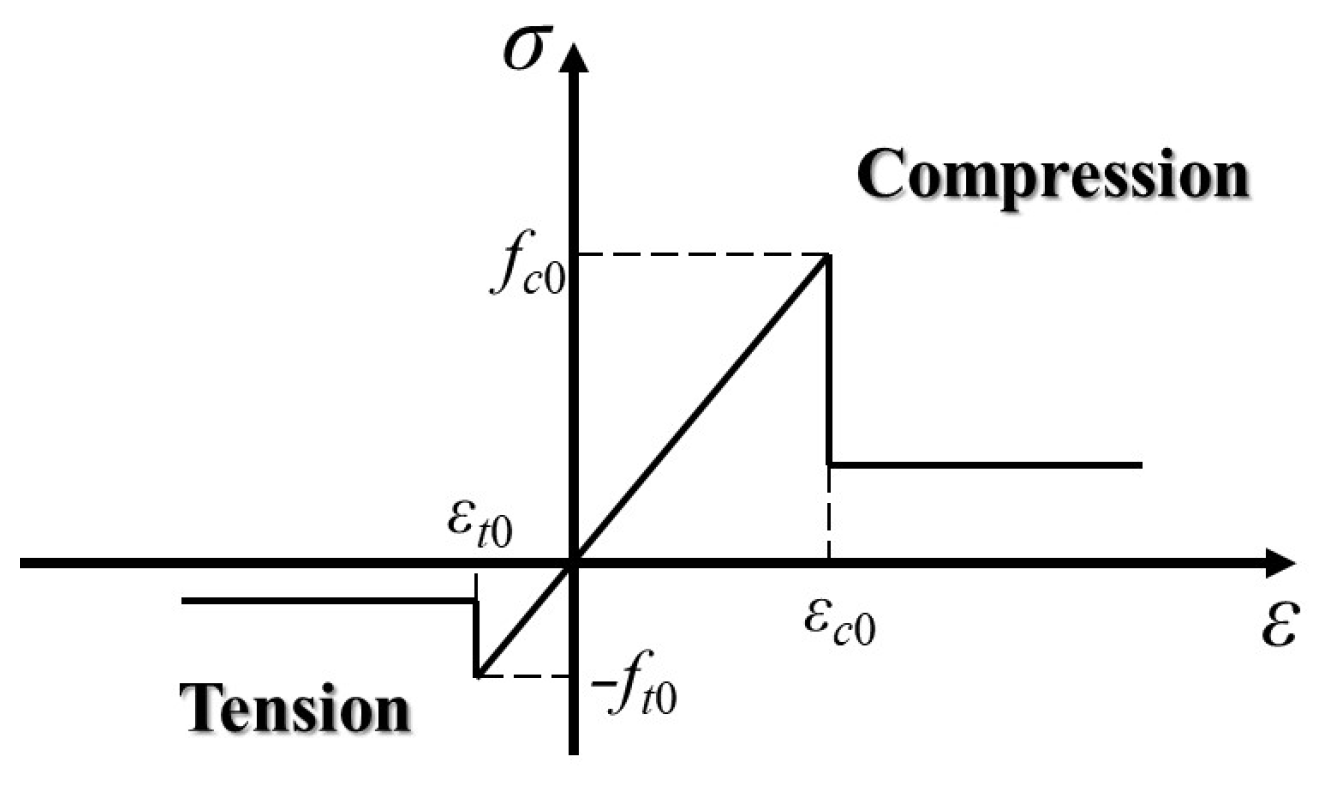
RFPA uses a modified Coulomb criterion as the strength criterion for element failure. Figure 3 illustrates the constitutive relationship of the elements within RFPA, where εc0 and εt0 represent the maximum compressive strain and maximum tensile strain of the element, respectively. The criterion for tensile failure of the element is based on the maximum tensile stress criterion (see Equation (3)), and the criterion for shear failure of the element is based on the Mohr-Coulomb criterion (see Equation (4)):
F t = σ 3 f t 0 = 0 ,
where Ft is the tensile stress of the element, σ3 is the minimum principal stress, compressive stress is positive, tensile stress is negative, the same below.
F c = σ 1 1 + sin φ 1 sin φ σ 3 f c 0 ,
where Fc is the compressive stress of the element, σ1 is the maximum principal stress, fc0 and φ are the compressive strength and internal friction angle of the element, respectively.
When the stress applied to a numerical element reaches the failure criterion, the element is considered to have failed. Rather than being removed, the failed numerical element undergoes a reduction in stiffness. This approach allows discontinuous medium problems to be addressed using continuous medium mechanics methods. The failed element becomes incapable of sustaining tensile loads but retains some compressive load-bearing capacity. This change in mechanical properties is irreversible.

2.2. Establishment of Heterogeneous Geological Rock Mass System Model and Test Scheme

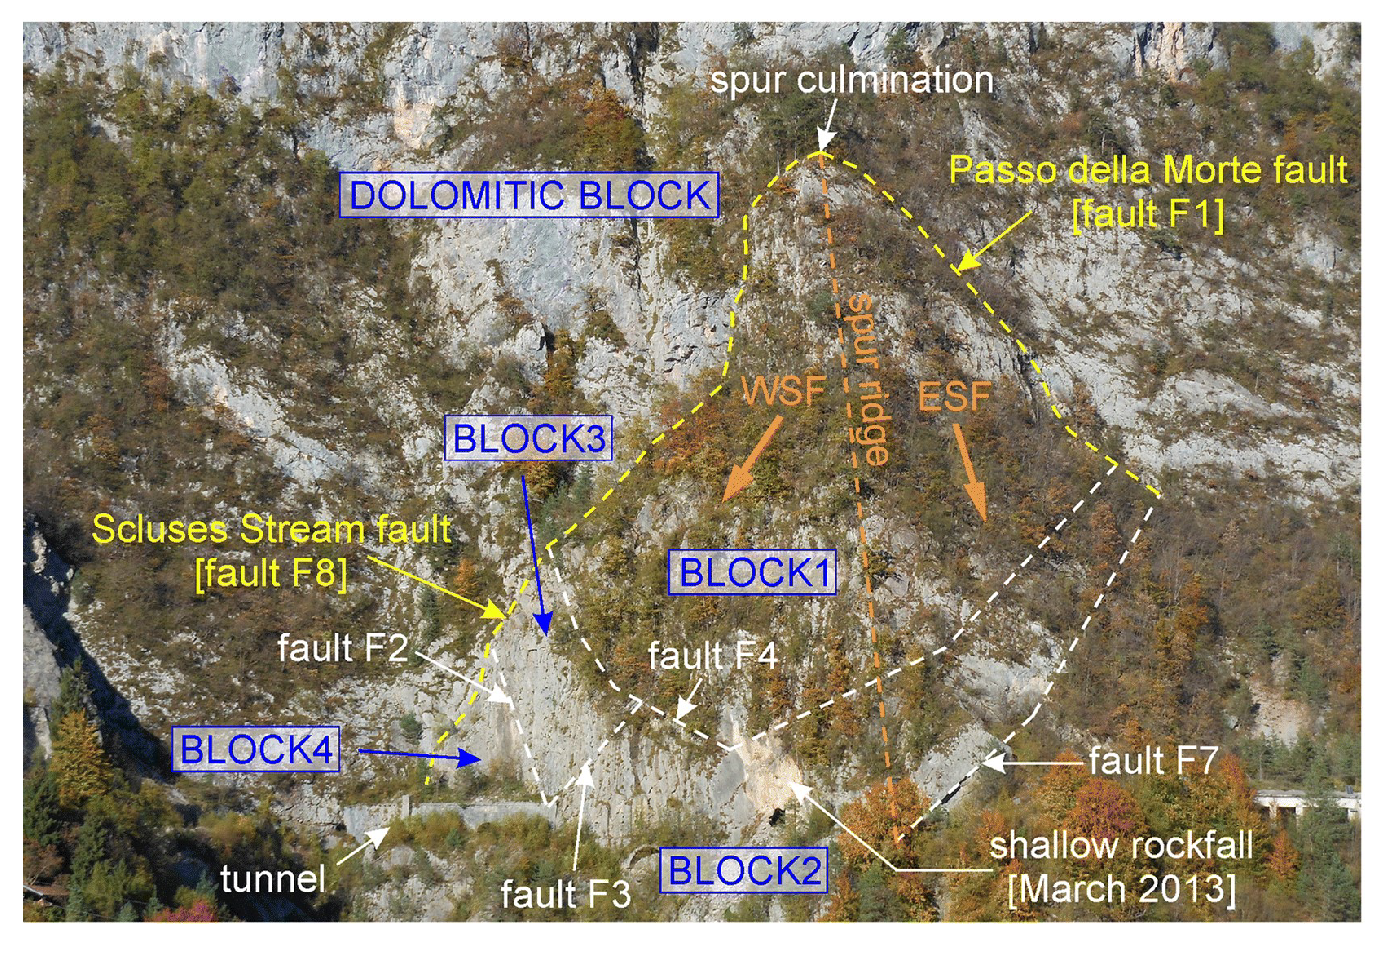
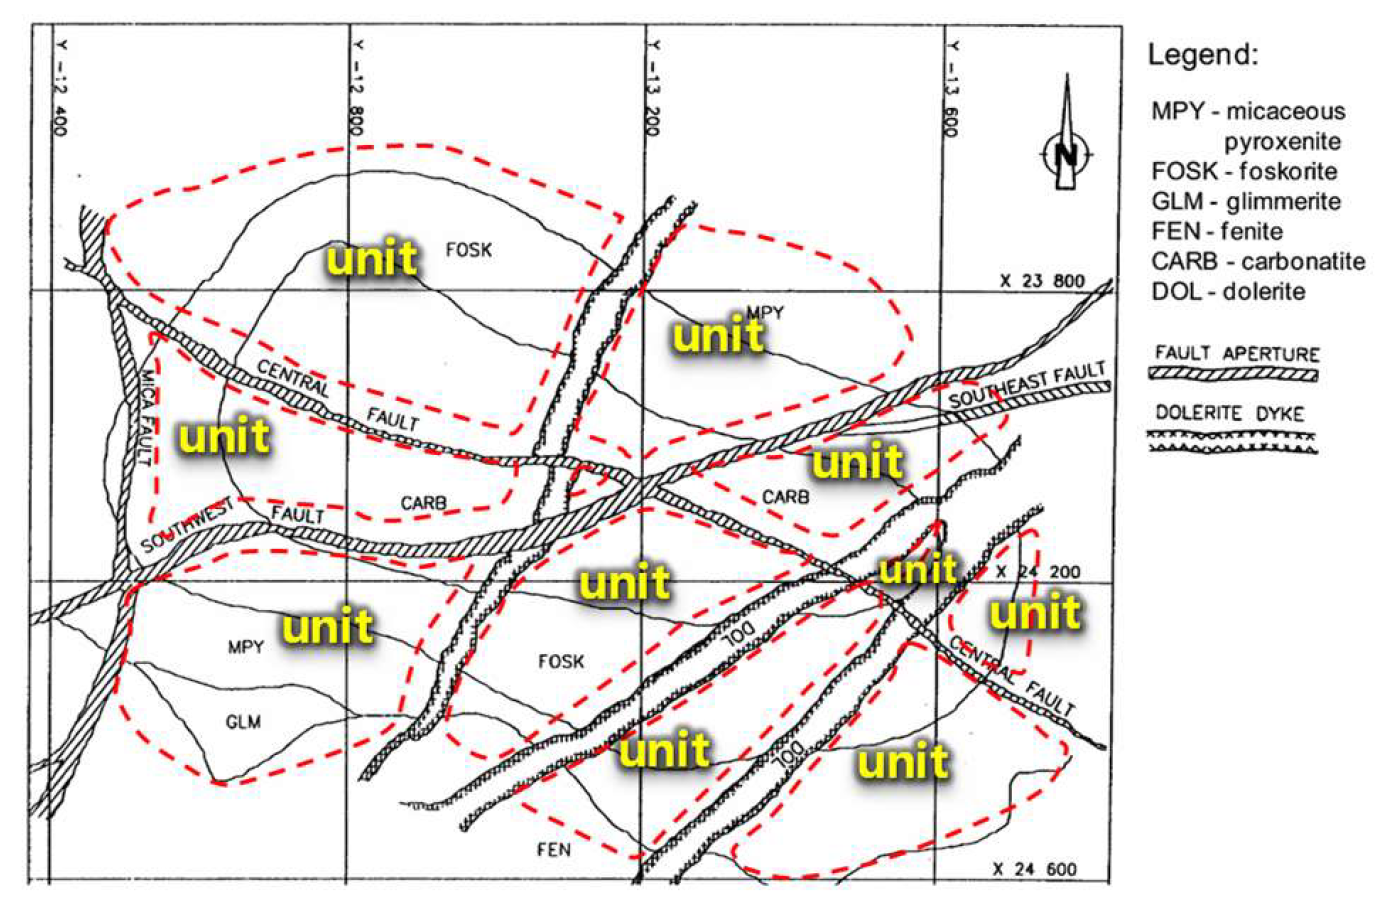
The geological rock mass system is not a complete entity but is instead divided into numerous geological rock mass units with various shapes, sizes, and mechanical properties by faults, weak zones, and similar discontinuities. For instance, Bolla and Paronuzzi [38] conducted an in-depth geological survey of an unstable rock slope in northeastern Italy, and their resulting geological structural map (Figure 4) shows that faults have subdivided the entire slope into several rock blocks with differing structural conditions. The structural geology of the open-pit slopes at the Palabora Mine in South Africa includes several northeast-extending sub-vertical dykes of diabase and four primary faults (Figure 5) [39]. These structures have segmented the entire slope into multiple geological rock mass units of varying shapes and sizes. When studying the mechanical properties of the geological rock mass system, it can be simplified as a structural model composed of multiple units with different mechanical properties [23]. Additionally, the stress state of a geological rock mass system is extremely complex and cannot be reconstructed in detail. Accordingly, this paper employs the RFPA to reduce the geological rock mass system to a square planar numerical model comprising 16 non-homogeneous geological rock mass units of identical size but different strengths, using the most ideal and simplistic uniaxial compressive stress state, to qualitatively discuss whether the instability of the model can be predicted in advance.
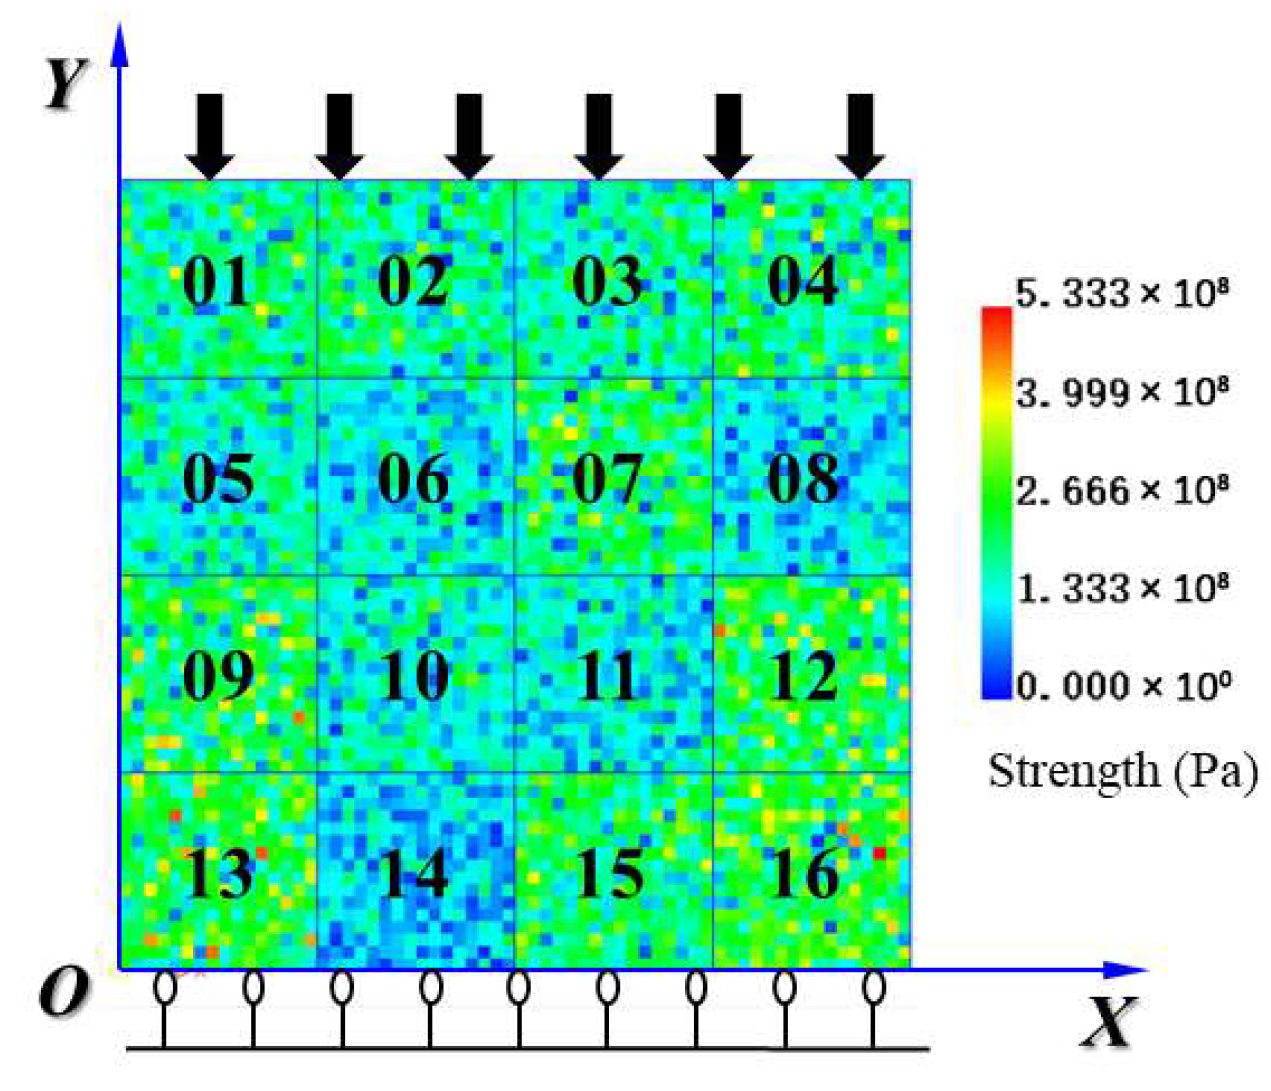
The numerical element average peak strengths of the 16 geologic rock mass units within the geological rock mass system model from 01 to 16 are 210, 200, 190, 220, 180, 150, 240, 140, 260, 170, 160, 250, 270, 130, 230, and 280, respectively. Lin et al. [32] suggested that when rock materials are simulated in RFPA, the homogeneity indexes for strength and elastic modulus of the numerical elements, denoted by ms and me, should ideally range from 1.2 and 5.0. Multiple studies [32,33,34,35,36,37] have confirmed that when the homogeneity index is 3, it can effectively reflect the stress–strain evolution stages of rock and the overall fracture behavior of the model. Consequently, in this study, both homogeneity indexes for the numerical element strength and elastic modulus are set to 3.0. The average elastic modulus Ee for all geological rock mass units is 50 GPa, with an average Poisson’s ratio of 0.25, and the Poisson’s ratio homogeneity index mv is 100, and the internal friction angle φ is 30°. The values of elastic modulus, Poisson’s ratio, and the internal friction angle were set with reference to typical values from conventional laboratory test results of sandstone, ensuring that the overall macroscopic deformation behavior of the model closely approximates that of real rock. Figure 6 illustrates the initial strength state of the geological rock mass system model, with the numbers 01 to 16 representing the identifiers for each heterogeneous geological rock mass unit. The whole model is discretized into 64 × 64 numerical elements, with each geological rock mass comprising 16 × 16 numerical elements. The size of the model is 100 mm × 100 mm. The bottom is constrained in Y-direction displacement, and the center point of the bottom is constrained in X-direction displacement, with free boundaries on the left and right sides, and a displacement boundary is applied on the top, with each loading step being 0.02 mm. The loading process continues until the model fractures.
It is important to note that real geological rock mass systems are certainly not two-dimensional, nor are they arranged in a regular pattern as depicted in this paper, nor are they composed of merely 16 geological rock mass units of the same size. This simplification here preserves the heterogeneous characteristics of the real geological rock mass system and highlights that it consists of geological rock mass units. This paper aims to derive some insights into rock landslide monitoring and early warning based on the fracture process of this simplified geological rock mass system numerical model. The discussion is qualitative in nature. Furthermore, considering that real geological rock mass systems are extremely vast and complex, this paper cannot fully represent their true and complete characteristics. It is believed that thoroughly capturing these characteristics is an exceedingly challenging task that far exceeds the scope of this discussion. We selected 16 geological rock mass units rather than more or fewer for specific reasons: using more units would result in overly complex computational results, while fewer units would be insufficient to adequately demonstrate that the geological rock mass system consists of multiple geological rock mass units. The uniform size of the geological rock mass units is intended to avoid errors in result analysis that could arise from changes in multiple factors. The variation in the strength of the geological rock mass units is meant to reflect the differences between them.

3. Evolutionary Characteristics of Fracture Process for Heterogeneous Geological Rock Mass System Model

3.1. Evolution Characteristics of Displacement in X Direction

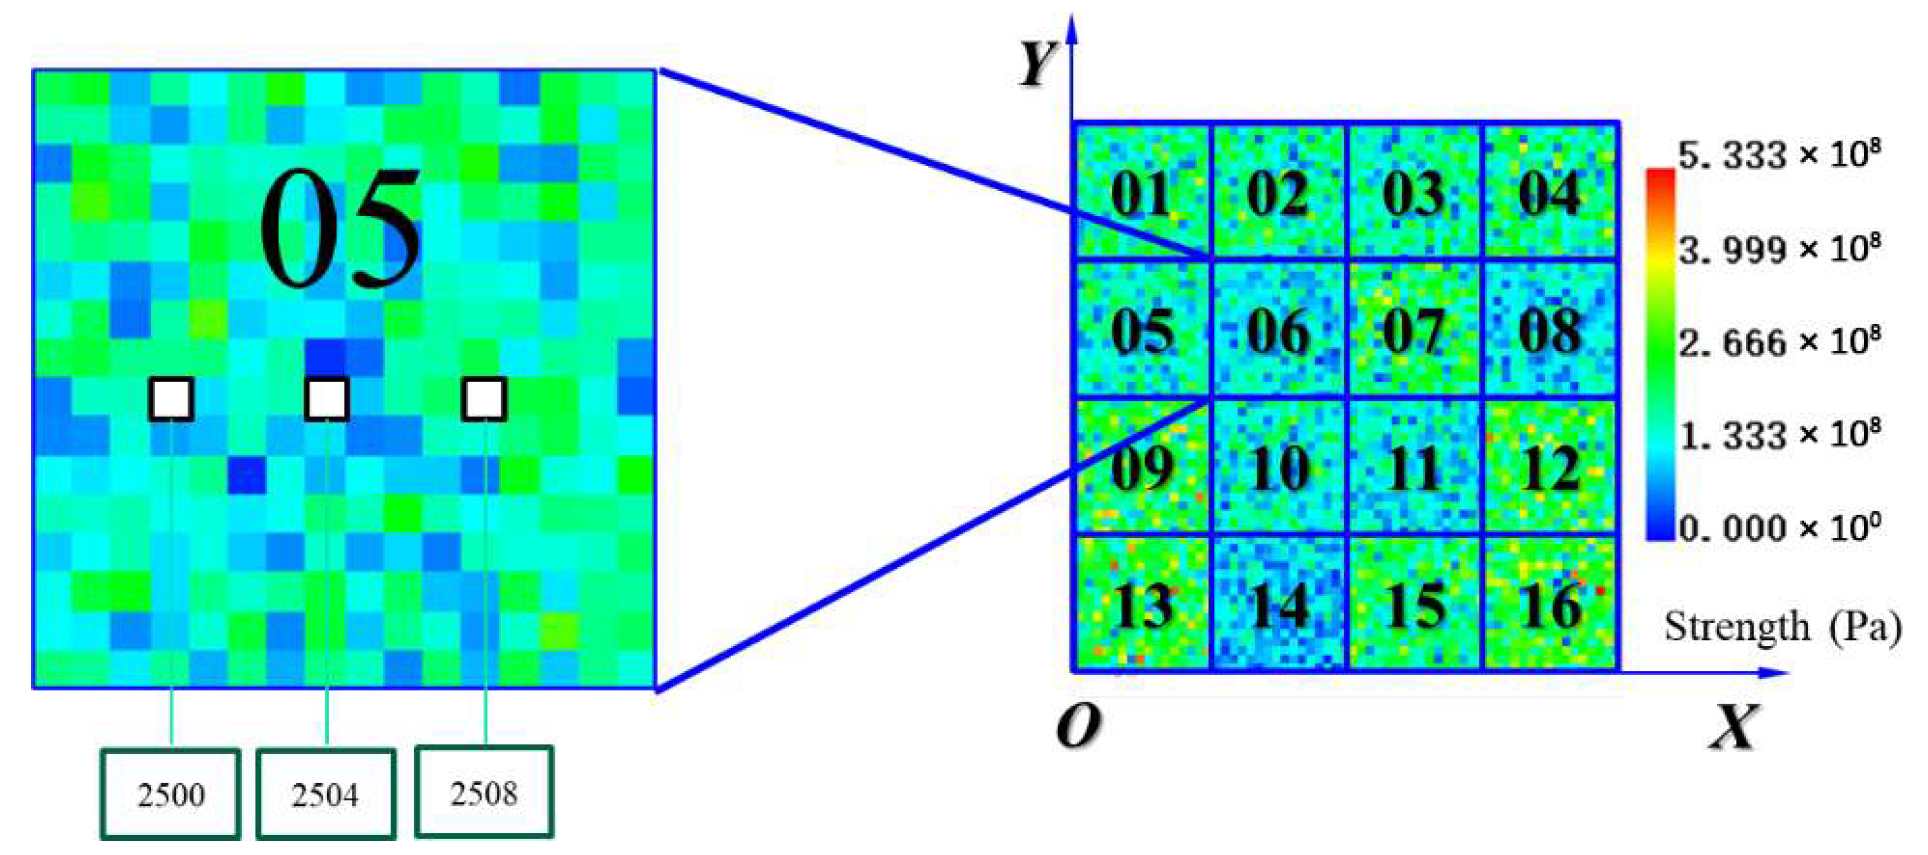
The X-direction displacement of the heterogeneous geological rock mass system model characterizes its lateral deformation behavior throughout the entire process of fracture and instability. By analyzing the evolutionary features of X-direction displacement, the mechanism and dynamic response of the model’s fracture instability can be systematically revealed. To elucidate the specific evolutionary characteristics of the X-direction displacement in the heterogeneous geological rock mass system model, the displacement data along the X-direction for three numerical elements from each of the 16 geological rock mass units were extracted throughout the entire fracture process. Each geological rock mass unit in the model comprises 256 (16 × 16) numerical elements. To avoid the influence of the boundaries, data from three numerical elements located in the 4th, 8th, and 12th columns of the 8th row of each geological rock mass unit were selected. The identification numbers of the numerical elements from which data were extracted are according to the naming convention of the entire model’s numerical elements, which increment sequentially from left to right and from bottom to top. Figure 7 illustrates the schematic diagram of the numerical element identification numbers for extracting data from the heterogeneous geological rock mass units.
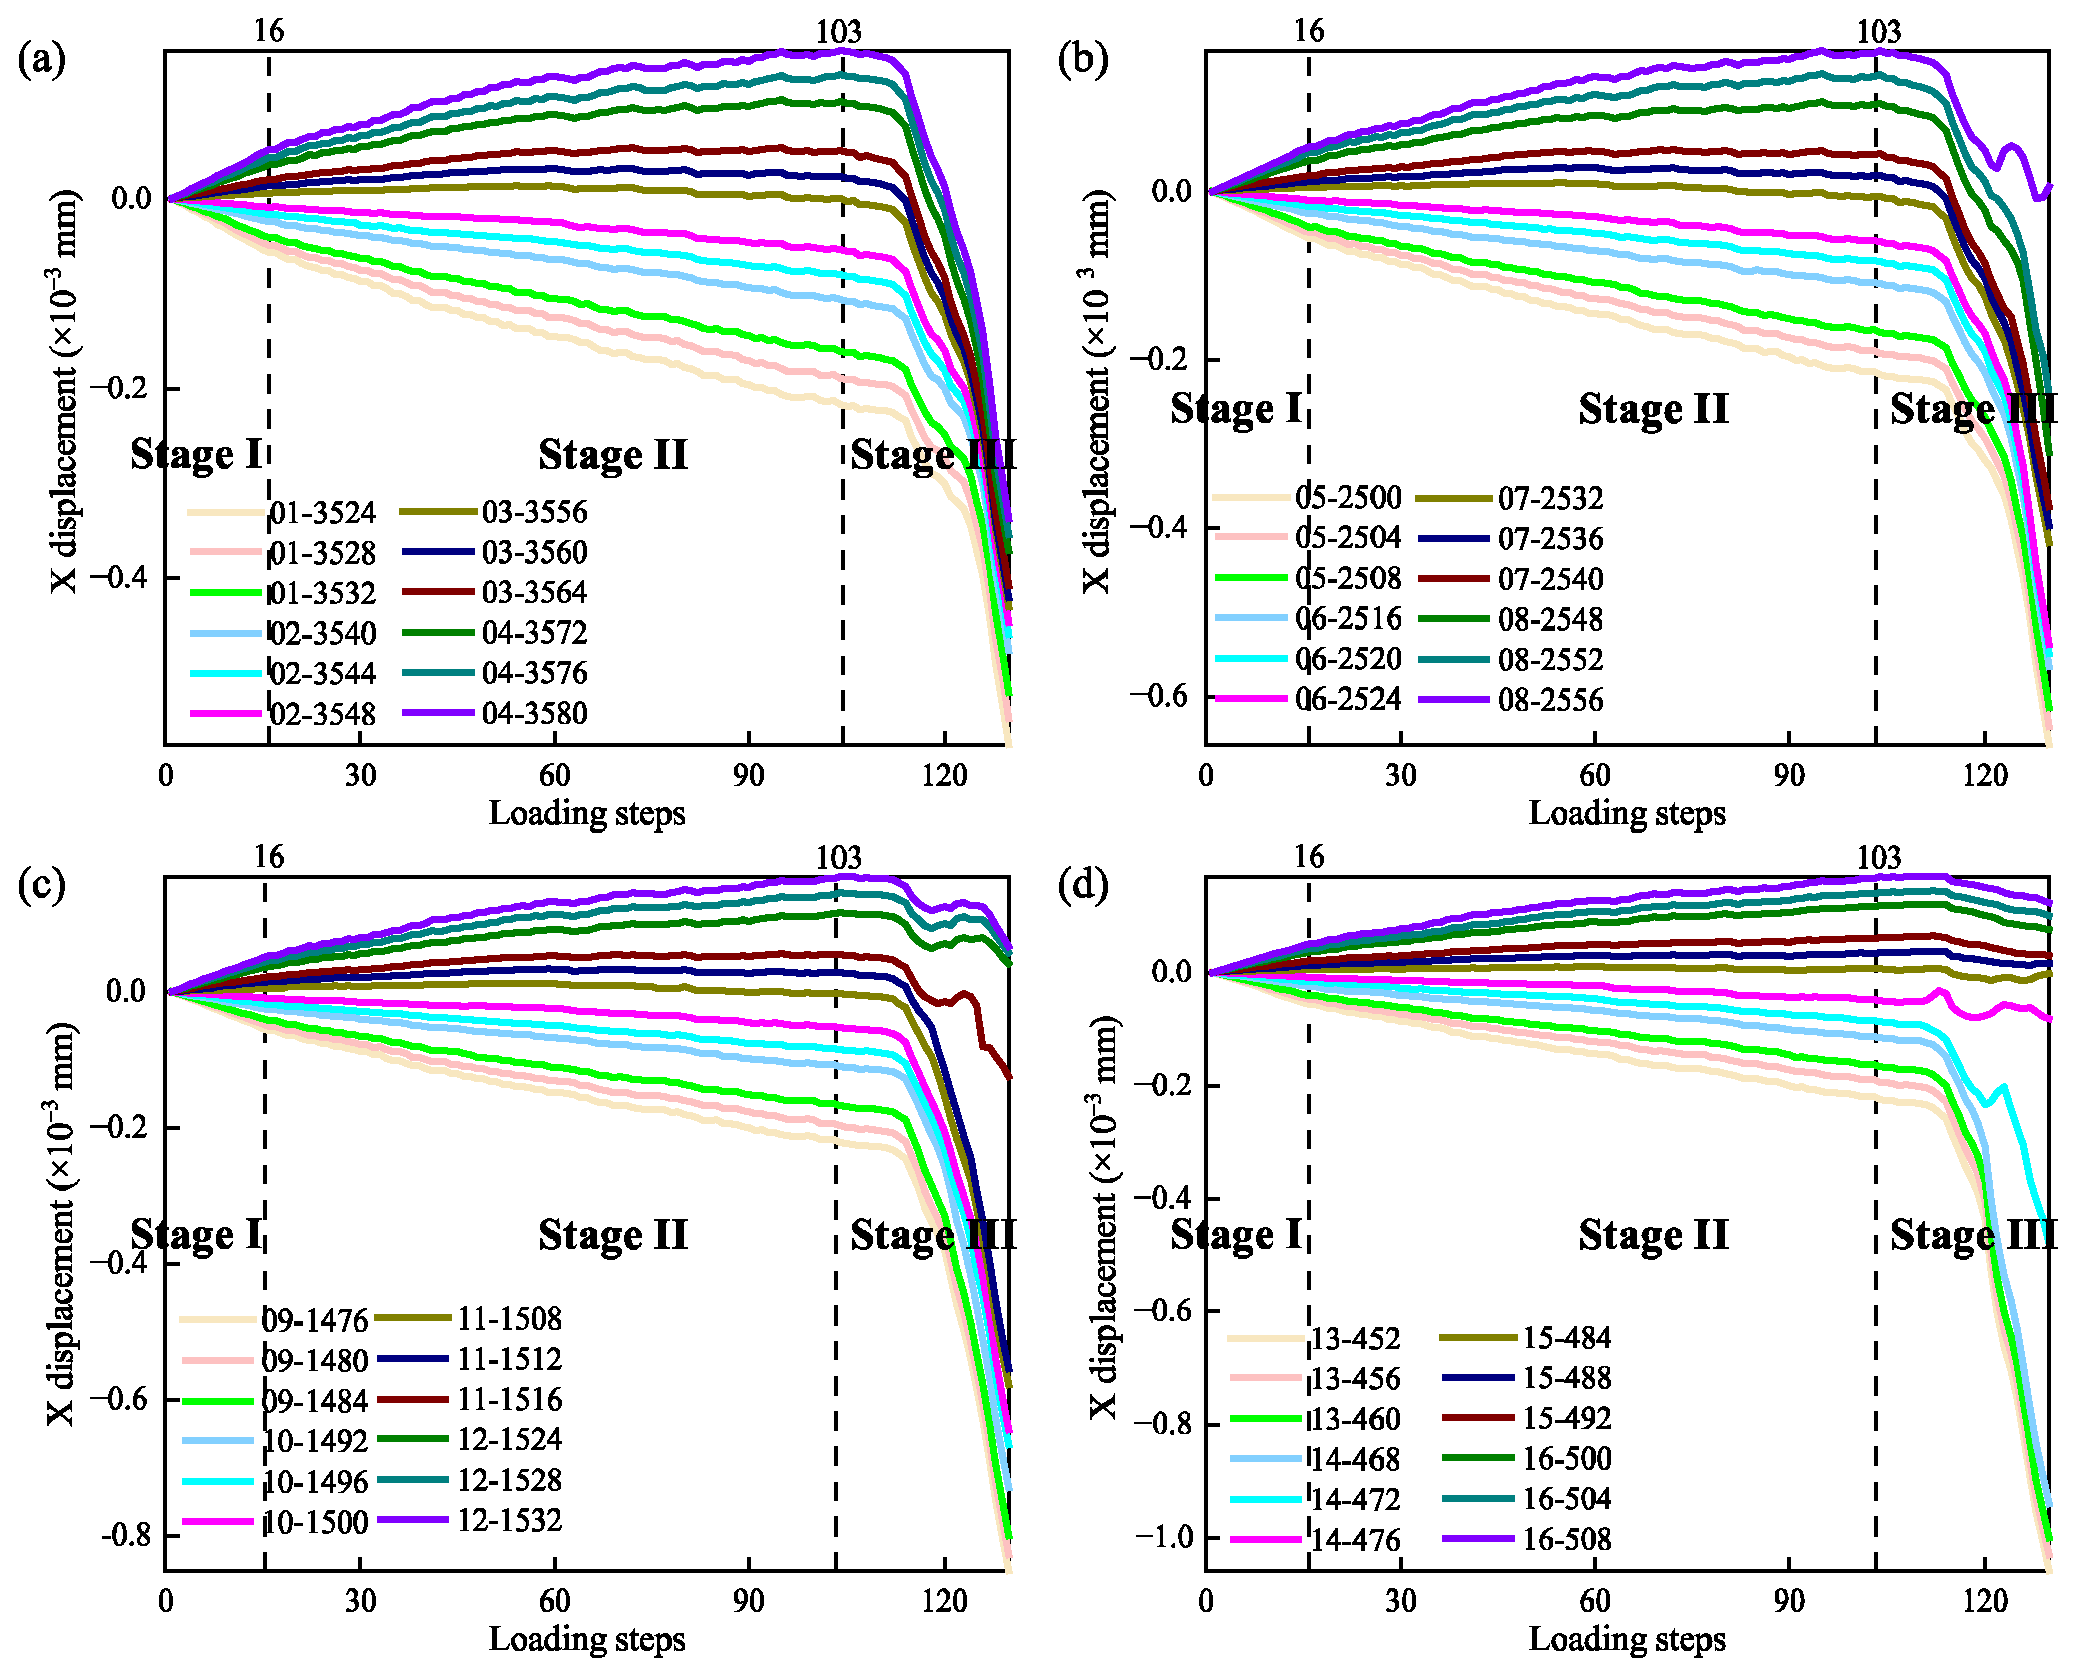
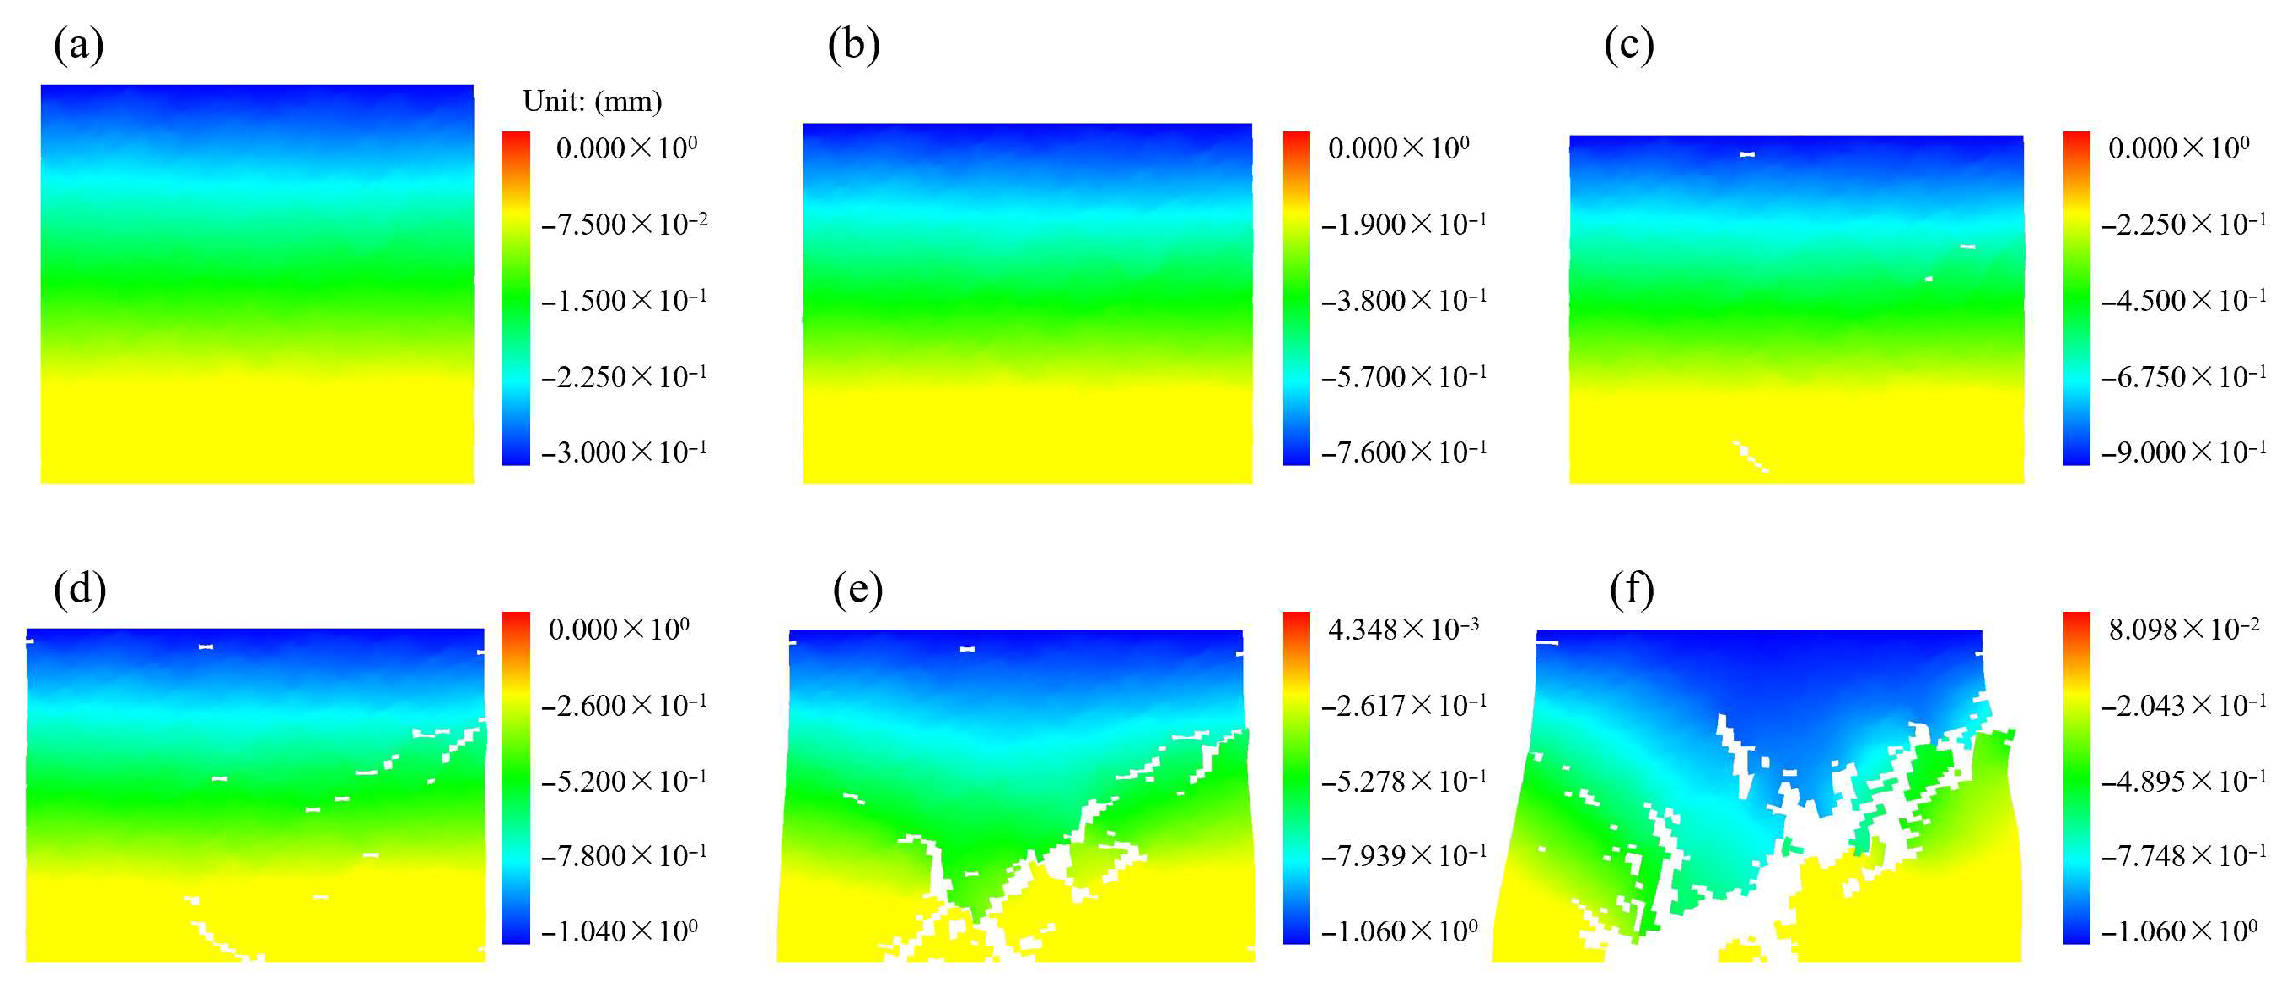
Figure 8 and Figure 9, respectively, show the X-direction displacement-load step curves and the evolution contour maps of the X-direction displacement field for representative numerical elements during the fracture process. The term “load step” denotes the sequence number of displacement loading in the negative Y-direction; where for instance, the 1st load step signifies that a compression displacement load of 0.02 mm was applied in the Y direction, and so forth. Figure 8 can be categorized into three distinct phases based on the varying displacement increment ΔX: from the 1st to the 16th load step is stage I, which is the linear elastic stage. During this phase, the increment of X-direction displacement ΔX for each numerical element at every load step remains constant, with a value in the range of approximately 1.2 to 3.8 × 10⁻³ mm for different numerical elements, which is notably minimal. At this stage, the contour map depicting the displacement field in the X direction of the model is uniform, suggesting that there are no evident fractures throughout the model (as shown in Figure 9a).
From Step 17 to Step 103 constitutes Phase II, the stable fracture stage. During this stage, ΔX is no longer a constant value but fluctuates, sometimes increasing and sometimes decreasing, with values for numerical elements at different positions ranging approximately from 1.2 to 4.2 × 10⁻³ mm. Overall, the numerical elements on the left side of the model move in the negative X-direction, while those on the right side move in the positive X-direction. This occurs because, under compressive loads in the Y-direction, the numerical elements experience significant extensional deformation in the X-direction, a phenomenon known as the Poisson effect. As the loading progresses, the model gradually displays distinct localized fractures (refer to Figure 9c,d).
From Step 104 to Step 130 marks Phase III, the unstable fracture stage. During this phase, ΔX is much larger than in the previous two stages, reaching a maximum of approximately 5.6 × 10⁻² mm. Notably, during the unstable fracture stage, the displacement in the X direction for numerical element 2556 (as shown in Figure 8b) and for elements 1524, 1528, 1532 (as shown in Figure 8c) exhibits a pattern of decreasing, then increasing, and then decreasing again, indicating that the displacement of these numerical elements in the X direction does not consistently move in the same direction, and the ΔX shows significant variation, exhibiting a certain degree of “uncertainty”. This occurs because during the unstable fracture stage, the model undergoes considerable deformation, and some numerical elements may be squeezed by other elements, causing their displacement to sometimes move in the positive X-direction and sometimes in the negative X-direction. Although this uncertainty can sometimes make it difficult to identify whether the model fractures, aside from the representative numerical elements of geological rock 12, 15, and 16 which exhibit this uncertainty during the unstable fracture stage, the majority of other representative numerical elements predominantly move in the negative X direction. This commonality suggests that the model is experiencing instability and gradually forming macroscopic cracks (as illustrated in Figure 9e,f). Based on the magnitude of the incremental displacement ΔX at each step, it is possible to issue an early warning for the geological rock mass system model. That is, when the incremental displacement ΔX of multiple numerical elements suddenly increases, an early warning can be issued for the instability of the model. However, since it is not possible to uniformly determine the representative numerical elements of the geological rock mass units when there is a sudden increase in ΔX, clearly, the early warning for model instability cannot be precise.

3.2. Evolution Characteristics of Displacement in Y Direction

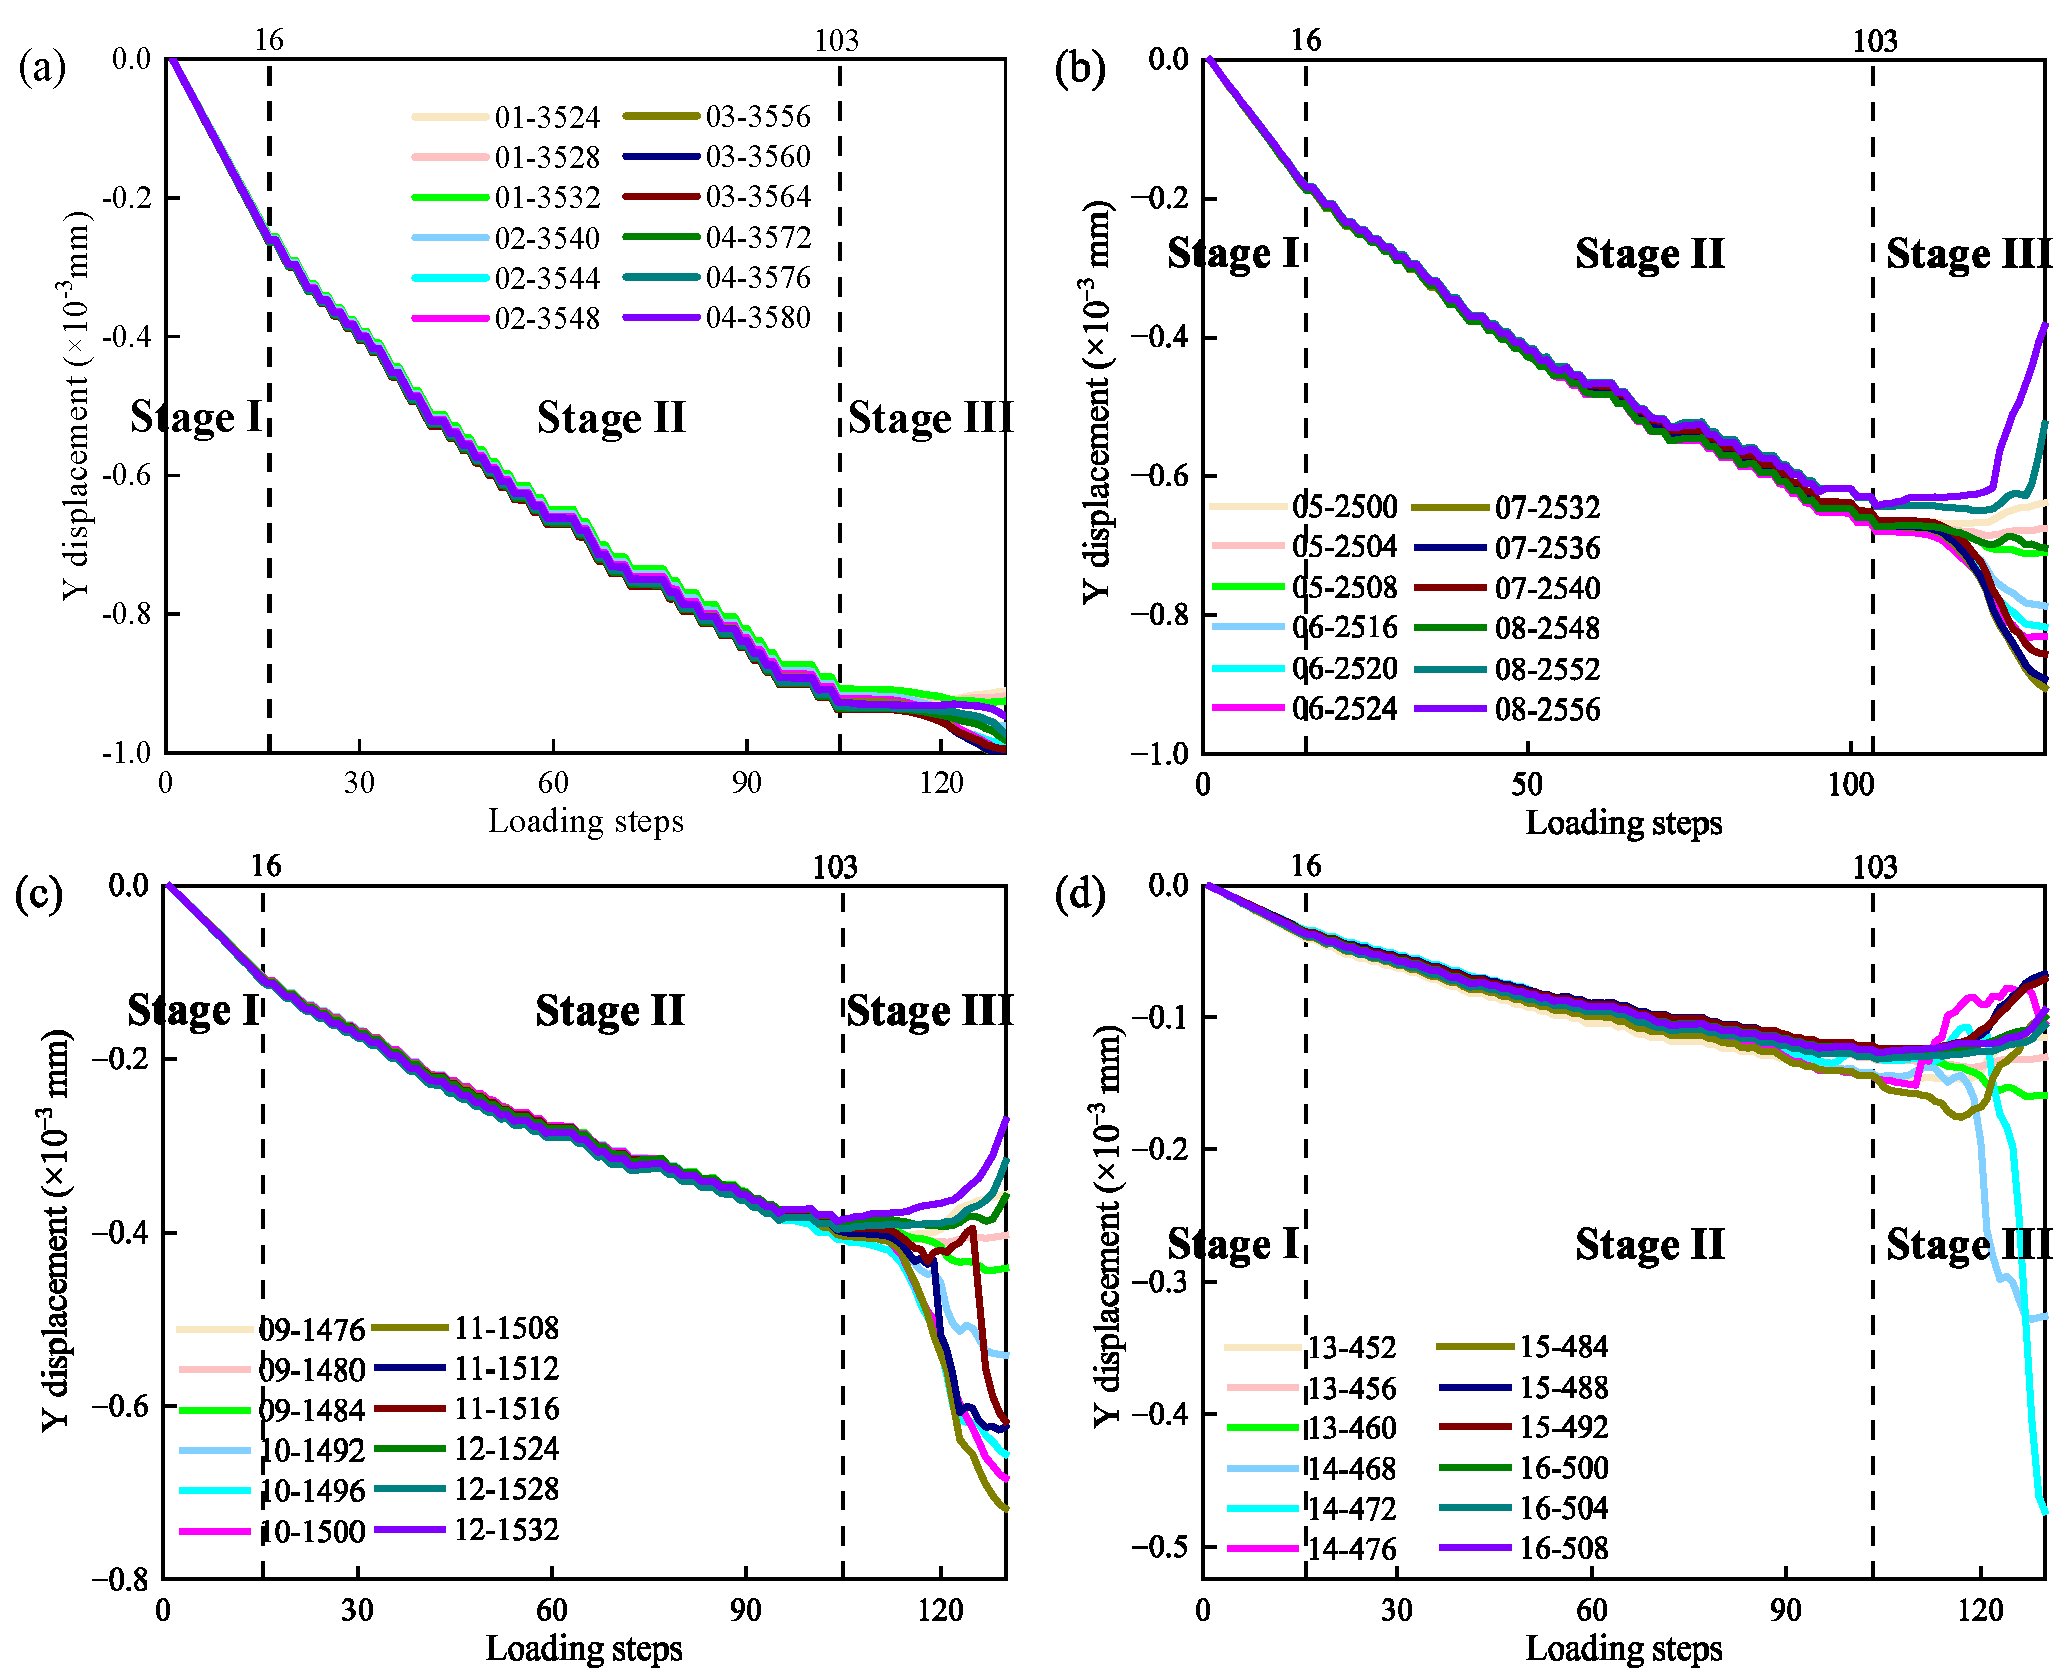
The Y-direction displacement of the heterogeneous geological rock mass system model characterizes its longitudinal deformation behavior (along the loading direction) throughout the entire fracture and instability process. By analyzing the evolutionary features of Y-direction displacement, the mechanism and dynamic response of the model’s rupture instability can be systematically revealed. Figure 10 and Figure 11, respectively, demonstrate the Y-direction displacement versus loading step curves and the evolution of the Y-direction displacement field contour maps for representative numerical elements during the fracture process. Figure 10 is categorized into three phases based on the variations in the Y-direction displacement increments ΔY, which are consistent with Figure 8 and will not be reiterated here. As indicated in Figure 10, during the elastic stage, due to the model being subjected to displacement loading in the Y-direction, the Y-direction displacement increments ΔY for different representative numerical elements are approximately equal, with values ranging from 1.7 to 1.8 × 10⁻² mm. The displacement field in the Y-direction of the model is highly uniform (Figure 11a), and no fractures are observed at this stage. During the stable fracture stage, the Y-direction displacement increments ΔY for different representative numerical elements show fluctuations, with an overall trend of decreasing magnitude, from approximately 0.2 to 1.7 × 10⁻² mm. The displacement field in the Y direction of the model remains relatively uniform (Figure 11b–d), with a few local fractures occurring (Figure 11c,d).
During the unstable fracture stage, numerical elements within geological rock units numbered 01, 08, 09, 12, 15, and 16 displace in the positive Y direction. This occurs as a result of the emergence of macroscopic cracks (Figure 11e), where numerical elements with higher compressive strength continue to bear the load. The interaction between the elements, as they compress and deform against each other, leads to movement in the opposite direction of the loading for these elements. Consequently, the displacement field contour map in the Y direction of the model becomes highly irregular (Figure 11e,f). When the model is compressed under uniaxial load, the overall displacement in the Y direction is deterministically downward, this “determinacy” results in high consistency in both the Y-direction displacement increment ΔY and the direction of displacement for the representative numerical elements of the geological rock mass system model during both the elastic stage and the stable fracture stage (Figure 10). However, during the unstable fracture stage, some elements displace in the positive Y-direction (elements numbered 1524, 1528, and 1532 in Figure 10c), while others displace in the negative Y-direction (elements numbered 1492, 1496, and 1500 in Figure 10c), and the magnitude of the Y-direction displacement increments ΔY varies. This phenomenon, called “displacement differentiation”, can be used as an early warning sign for model instability. Yet, there is no clear pattern regarding whether the numerical elements displace in the positive or negative Y-direction during the unstable fracture stage, nor is there a discernible regularity in the magnitude of the Y-direction displacement increment ΔY, making it challenging to predict fracture instability with precision.

3.3. Evolution Characteristics of the Maximum Principal Stress

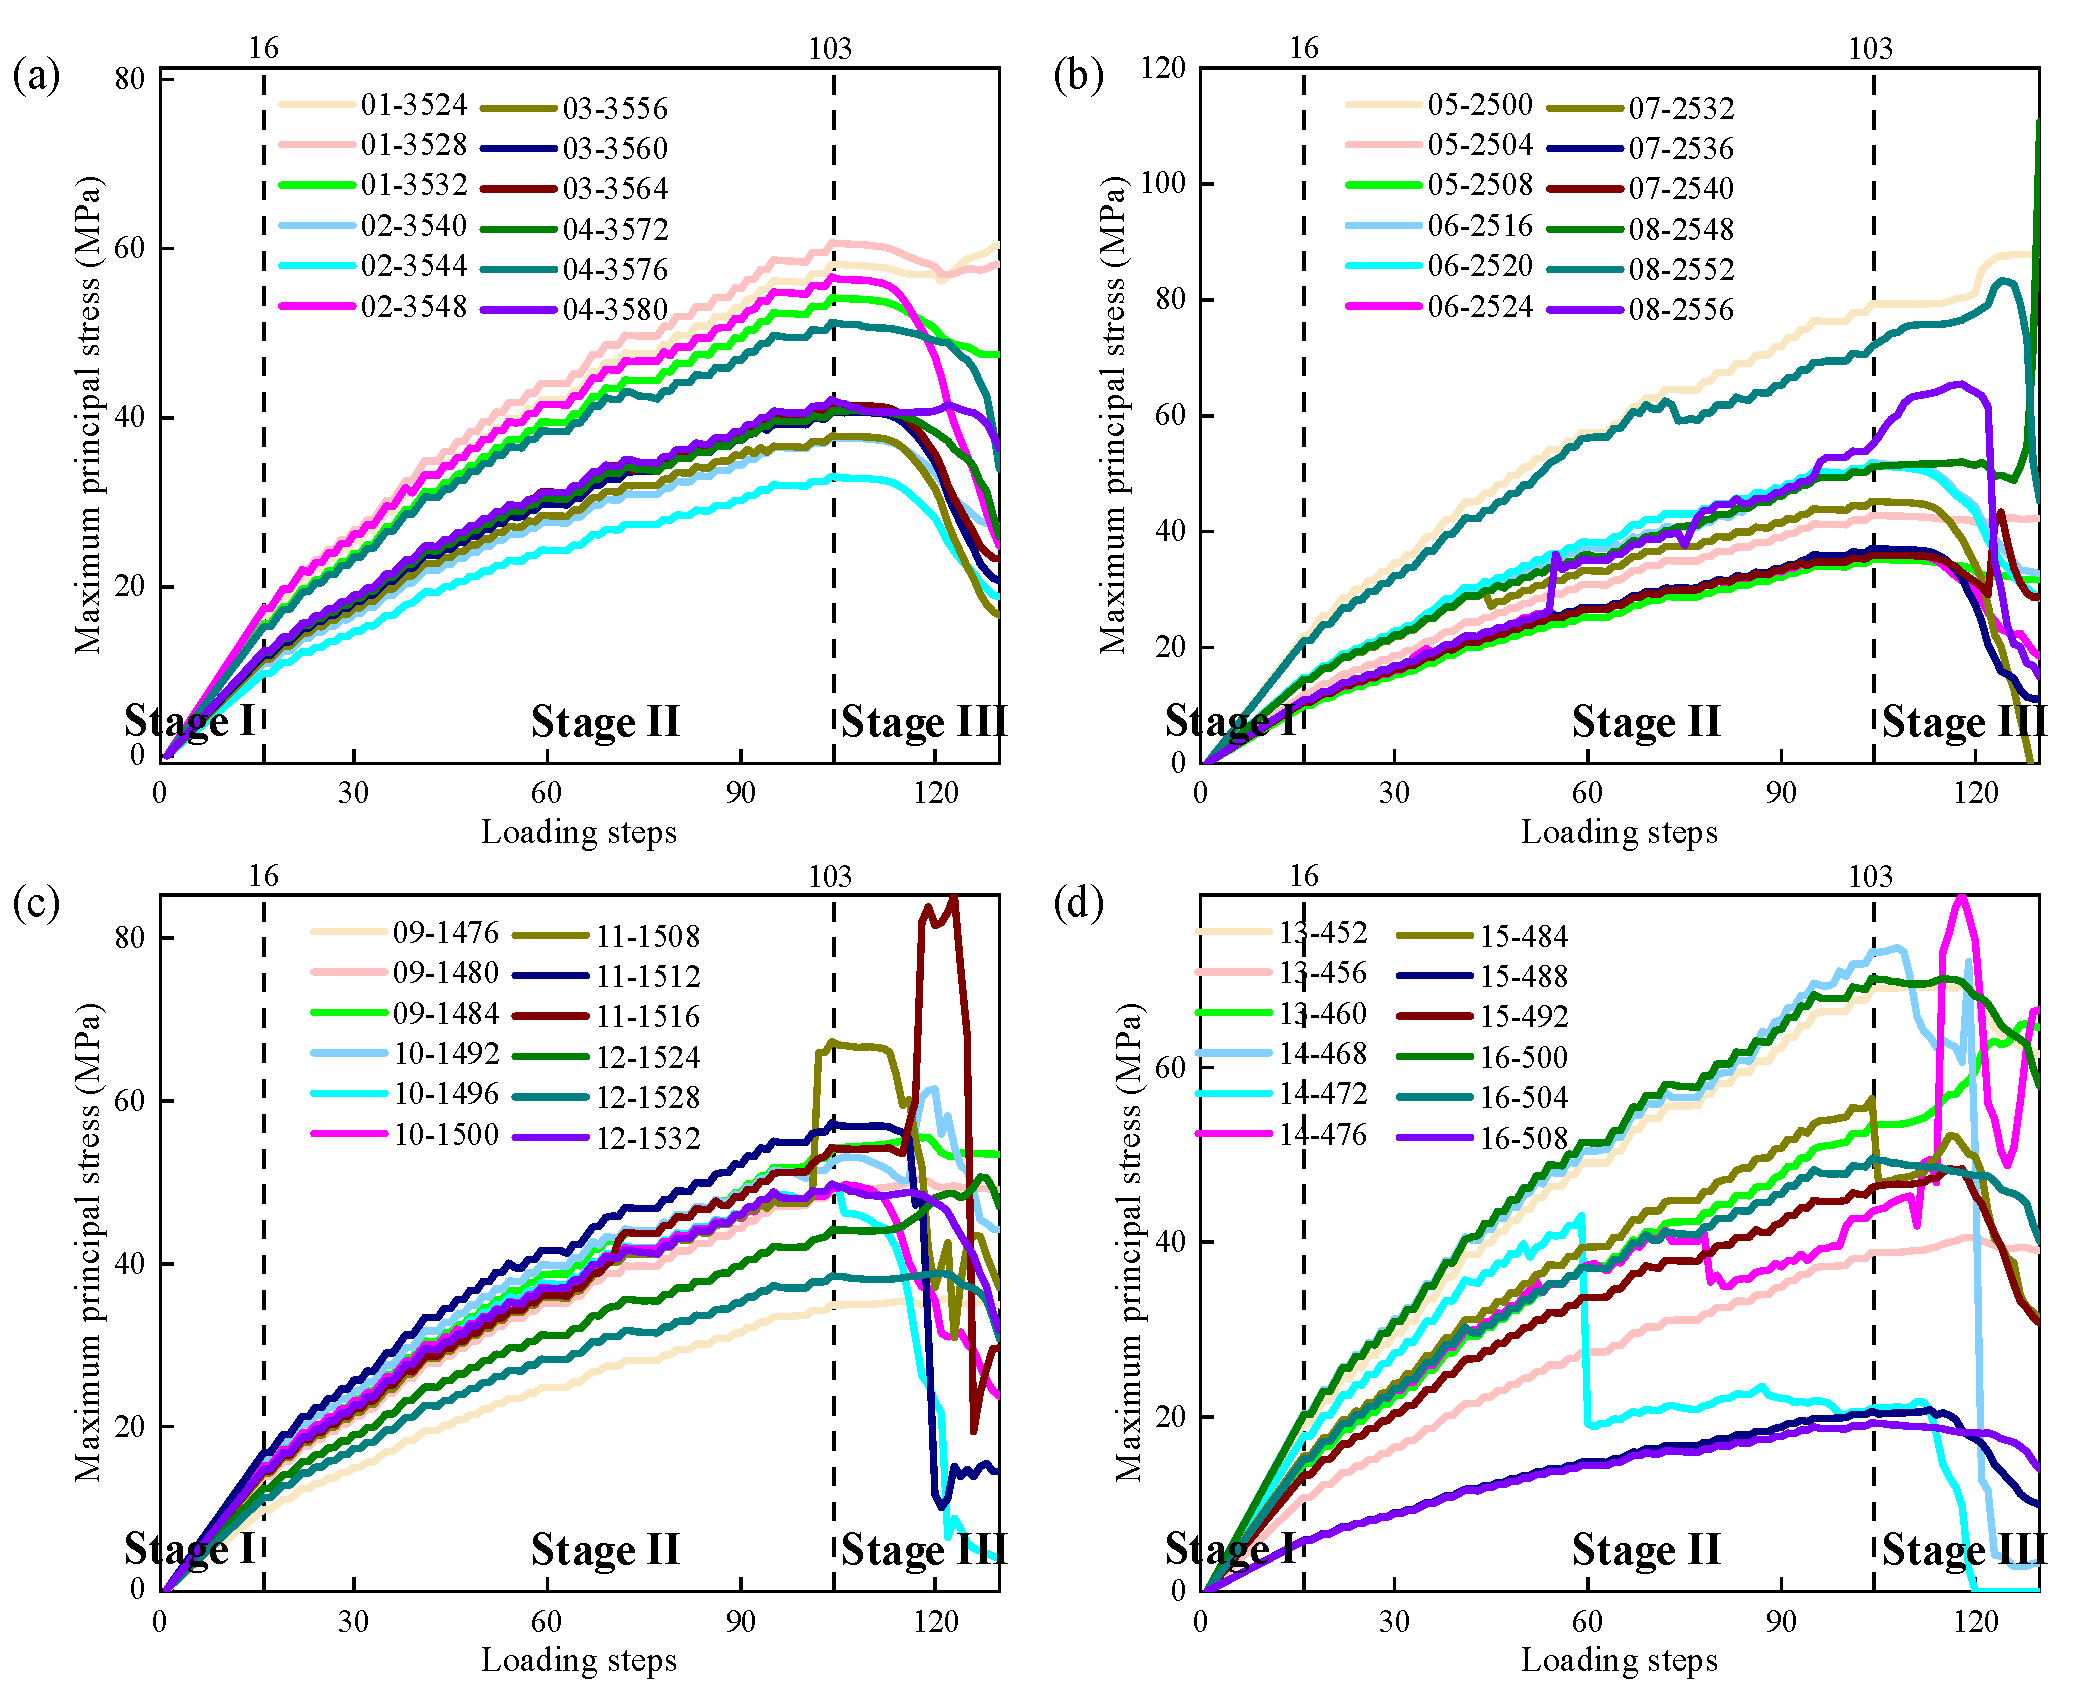
The maximum principal stress of the heterogeneous geological rock mass system model characterizes its stress behavior throughout the entire rupture and instability process. By analyzing the evolutionary features of the maximum principal stress, the mechanism and dynamic response of the model’s rupture instability can be systematically revealed. Figure 12 and Figure 13, respectively, present the maximum principal stress versus loading step curves and the evolution of the maximum principal stress field contour maps for representative numerical elements during the model fracture process. The variation curve of the maximum principal stress for representative numerical elements is divided into three phases based on the difference in the stress increment ΔS, consistent with the previous description. As shown in Figure 12, during the elastic stage, the stress increases linearly, and the stress increment ΔS per step remains consistent across numerical elements at different positions. There are no fractures in the model at this stage, and the contour map of the maximum principal stress field exhibits no evidence of stress concentration (Figure 13a). During the stable fracture stage, the stress versus loading step curves for each representative numerical element exhibit fluctuations characterized by alternating increases and decreases. This is due to the initiation of local fractures during the stable fracture stage, where numerical elements with lower strength in the model start to fail in succession, leading to localized stress concentrations (Figure 13c,d). The degradation in stiffness of the fractured elements results in a stress redistribution and reduction in elements that have not yet fractured. As the loading continues, the stress of the unfractured numerical elements rises again, resulting in stress-load step curves that fluctuate between increasing and decreasing trends.
During the unstable fracture stage, the increments of the maximum principal stress of numerical elements vary in magnitude and differ in direction, showing “stress differentiation” with significant “uncertainty” and high stress concentration (Figure 13e). Taking Figure 12d as an example, the stress in numerical element numbered 460 continues to rise, while the stress in element numbered 484 drops rapidly, the stress in element numbered 500 falls, then rises, and falls again. This is due to the random fracturing of numerous mesoscale elements, which gradually results in crack nucleation and, starting from the crack nucleus, leads to more elements fracturing. The stress of the elements that have not fractured yet continues to rise, whereas the stress in the fractured elements drops quickly. The stress of the unfractured elements that reach the yielding stage decreases slowly, increases again due to compression, and finally drops due to fracturing. A large number of element fractures form macroscopic cracks (Figure 13e), eventually leading to the formation of a fracture surface and model instability (Figure 13f). In the unstable fracture stage, identifying the phenomenon of stress differentiation in numerical elements can serve as an early warning for model instability. Furthermore, the loading steps at which all numerical elements exhibit stress differentiation are inconsistent and lack regularity, rendering it impossible to precisely predict the instability of the model.

3.4. Evolution Characteristics of Acoustic Emission Signals

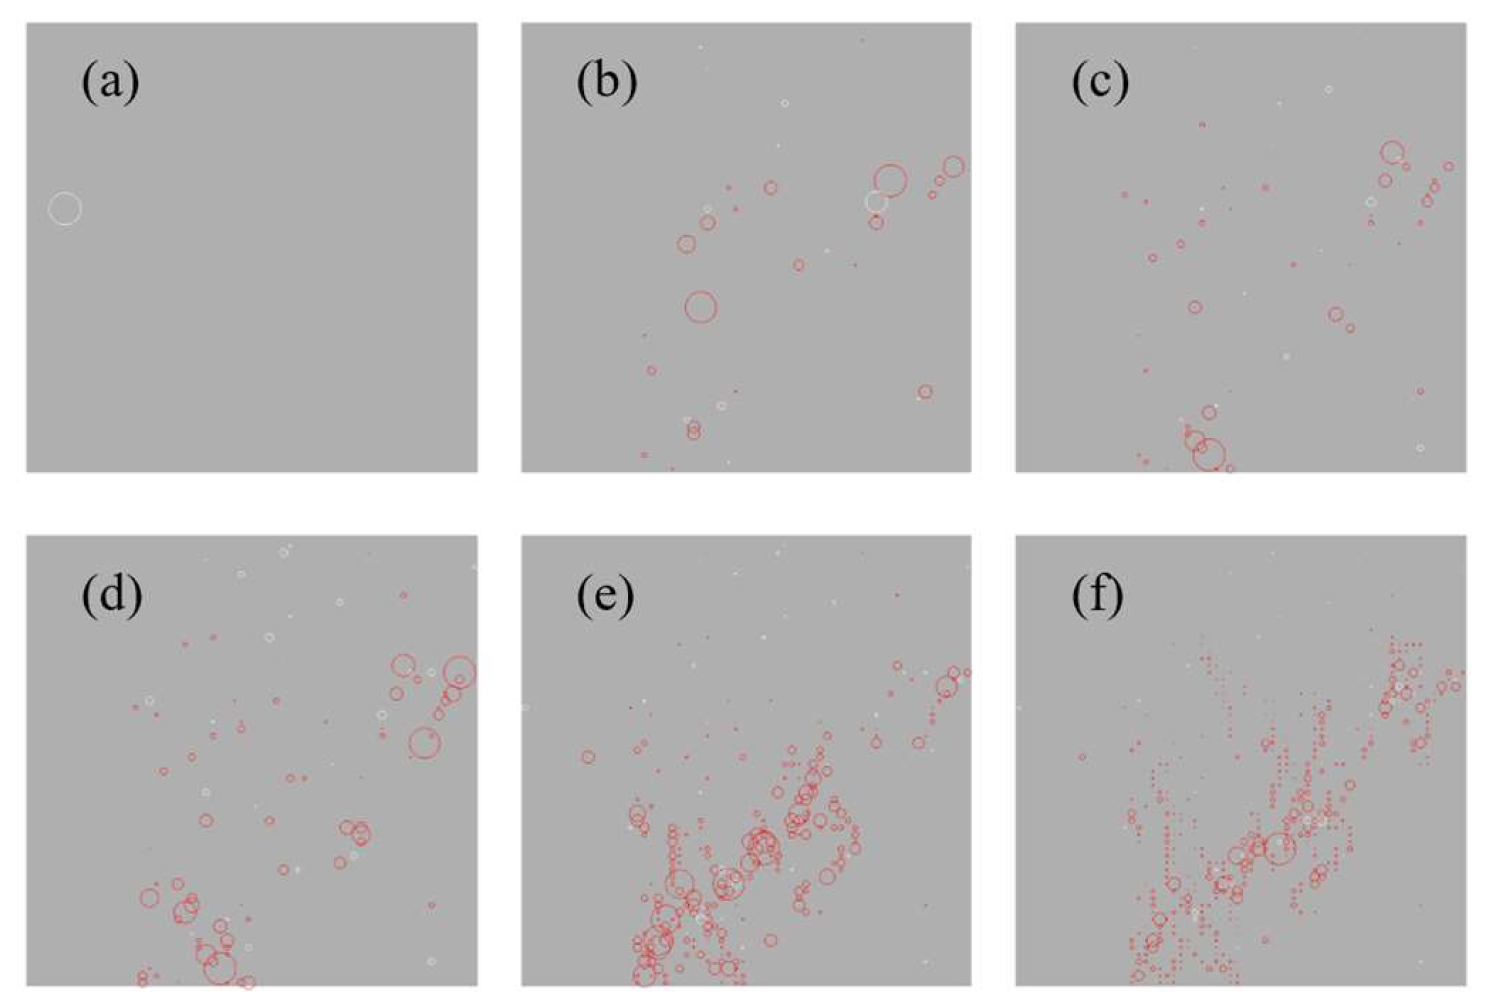
The acoustic emission signals of the heterogeneous geological rock mass system model characterize the spatial distribution and failure patterns during the entire rupture and instability process. By analyzing the evolutionary characteristics of the acoustic emission signals, the complete failure process of the model can be revealed. Figure 14 presents the cumulative cloud maps of acoustic emission signals throughout the fracture process of the model. By combining Figure 13 and Figure 14, the evolution characteristics of acoustic emissions can be observed. During the elastic stage (from the 1st to the 16th loading steps), virtually no element failure occurs, and thus almost no acoustic emission signals are present (Figure 14a). During the stable fracture stage (from the 17th to the 103rd loading steps), there are a small number of element failures (Figure 14b–d), and the locations of these element failures are highly random. At this stage, it is impossible to determine the location of the macroscopic fracture plane of the model. In the unstable fracture stage (from the 104th to the 130th loading steps), there is a sudden surge in the number of acoustic emission signals, with a high concentration of signals at the bottom of the model (Figure 14e,f), indicating crack formation at the bottom of the model, which corresponds to Figure 13e. Since the generation of acoustic emission signals is a manifestation of numerical element failure, it is inevitable that the number of signals will surge before the failure and instability of the model, and they will cluster near the macroscopic crack. At this point, the model has already developed significant fracture surfaces or even macroscopic fracture planes (Figure 13e), signaling impending failure and instability. The occurrence of numerous acoustic emission events prior to instability, with the signals exhibiting nucleation characteristics, allows for analysis of these precursors to provide early warning of the model’s instability. Additionally, the specific clustering degree required to determine model instability remains uncertain, leading to imprecise early warnings for the geological rock mass model’s instability.

4. Discussion

4.1. Implications of the Evolution Characteristics of Heterogeneous Geological Rock Mass Model Fracture Processes for Rockslide Monitoring and Early Warning

The model instability can be predicted based on the precursor signal of the “differentiation” phenomenon, where the increment in the Y-direction displacement of most numerical units varies in magnitude and direction. However, monitoring the displacement of certain points for early warning often leads to false alarms or missed detections. The real-time monitoring system for rock slopes by Fan et al. [11,12] includes 16 displacement sensors based on the Global Navigation Satellite System (GNSS), 16 crack gauges, and one rain gauge. The successful prediction of the landslide was achieved precisely through the combination of well-distributed displacement monitoring points and comprehensive monitoring methods. Meanwhile, according to the GNSS-measured displacement data obtained by Fan et al. [12] in field tests, the displacement variations at different monitoring points exhibit significant inconsistency (see Figure 15), all demonstrating irregular characteristics with alternating increases and decreases. This observation confirms the occurrence of displacement divergence phenomena in actual monitoring scenarios.
Force is the intrinsic cause and fundamental driving force for slope deformation and failure [40]. However, access to the interior of the geological rock mass is not possible, severely limiting the means of monitoring force, hence making force-based monitoring and warning methods uncommon [17,18,19]. He et al. [17] and Tao et al. [18,19] embedded a self-developed constant-resistance large-deformation anchor cable with a negative Poisson’s ratio effect into the geological rock mass to monitor the interaction forces between the geotechnical body and external structures. They used a rapid decline in these forces as an early warning sign, successfully predicting multiple landslides. It should be noted that force monitoring cannot rely solely on single-point measurements, as this approach is susceptible to false alarms and missed alarms. For instance, in Figure 12d, if the force monitoring point of the geological rock mass system is located at element numbered 484, an early warning could be successfully issued based on the rapid decline in stress. However, if element numbered 472 is chosen as a force monitoring point, where a rapid decline in stress occurs during the stable fracture phase, issuing a warning at this point would result in a false alarm. Conversely, selecting element numbered 460 as the force monitoring point would lead to a missed warning since no rapid decline in stress is observed even after model instability. This is why in successful force monitoring cases, multiple force monitoring points are arranged along the slope. For example, He et al. [17] monitored the Luoshan mine slope with 53 force monitoring points, and Tao et al. [19] set up 28 force monitoring points in the Nanfen open-pit mine slope. Moreover, in terms of the fracture process for the model, the locations of those weak numerical units are the first to fracture, which means that monitoring these points is more important.
The simulation results demonstrate that the ‘differentiation’ phenomenon before rock mass instability reveals its intrinsic early-warning mechanism. The essence of landslide early warning lies in identifying the critical point at which the internal deformation of a rock mass transitions from continuous to discontinuous rupture. The precursors to this critical point originate from the stress redistribution and deformation localization processes triggered by the preferential failure of weaker units within the heterogeneous rock mass. Thus, the ‘differentiation’ phenomenon is a comprehensive multi-physical field manifestation of this pre-failure critical state. However, due to the highly stochastic nature of rock mass heterogeneity, these precursor signals lack absolute uniformity and regularity in their manifestation. This fundamentally explains why single monitoring indicators or limited monitoring points often lack reliability.
Given that clear precursors are manifested in displacement, force, and acoustic emission signals prior to model instability, monitoring these three types of precursor information simultaneously will undoubtedly enhance the precision of early warnings for model instability. However, due to the non-uniformity and lack of regular patterns in the “differentiation” of displacement and stress among numerical elements at different locations, as well as the nucleation of acoustic emissions, the combination of these three monitoring methods still cannot provide an accurate early warning for model instability. In practical monitoring and early warning of rockslides, a comprehensive approach typically includes the monitoring of displacement, force, and other auxiliary methods. While these methods can capture certain precursors to slope movements, the scale of the geological rock mass system is immense, making it impractical to deploy an unlimited number of monitoring points to observe the instability of the geological rock mass system [23]. Furthermore, it is impossible to monitor the interior of a geological rock mass comprehensively, and the current theories on early warning for rockslides may not be entirely scientifically sound [41]. The inherently complex dynamic evolution of rockslides [40] further complicates accurate early warning efforts. For these reasons, the ability to accurately predict rockslides has not been achieved to date.

4.2. Effects of Rock Mass Homogeneity Index ms on Fracturing Process and Its Implications for Landslide Early Warning

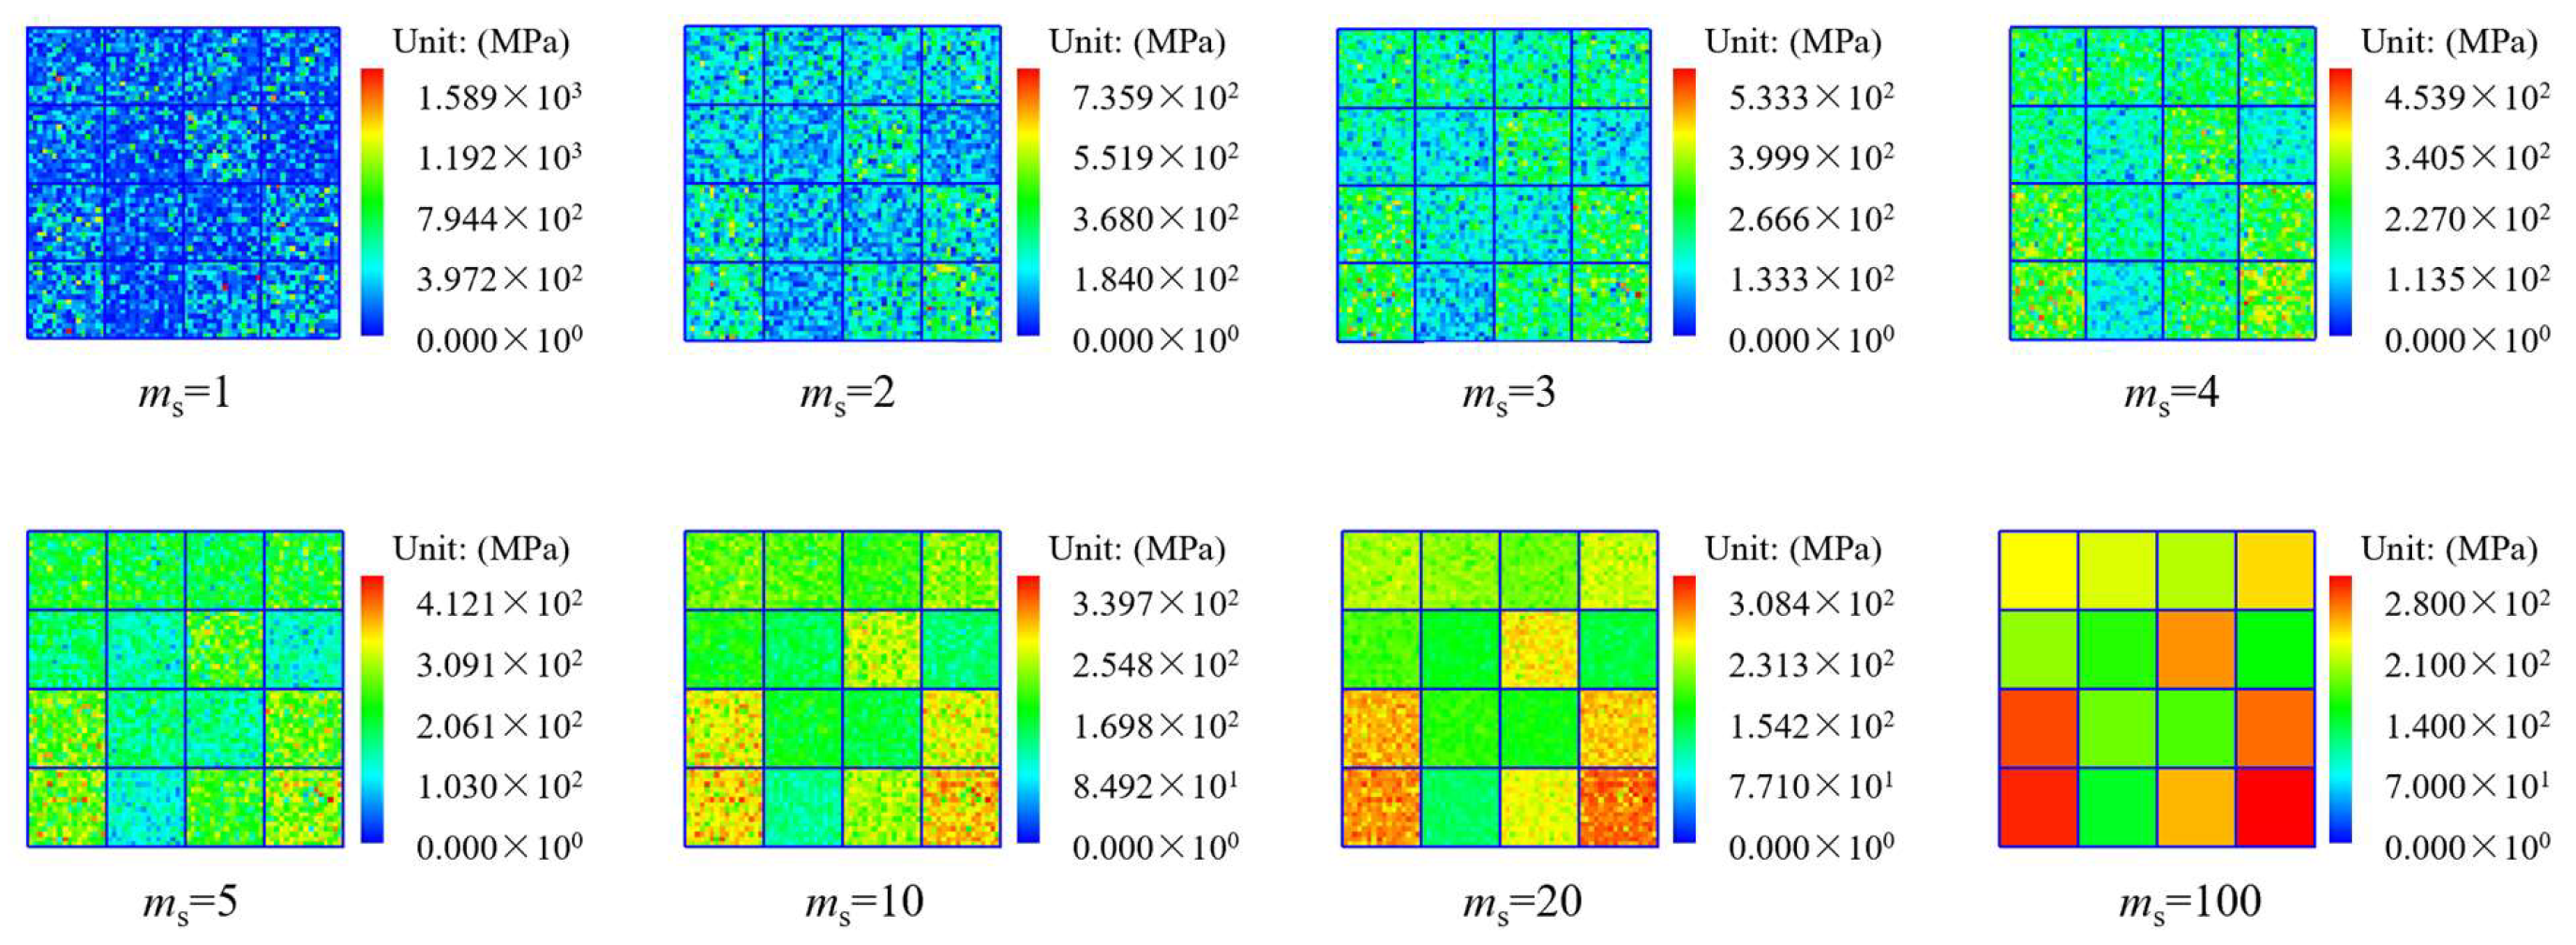
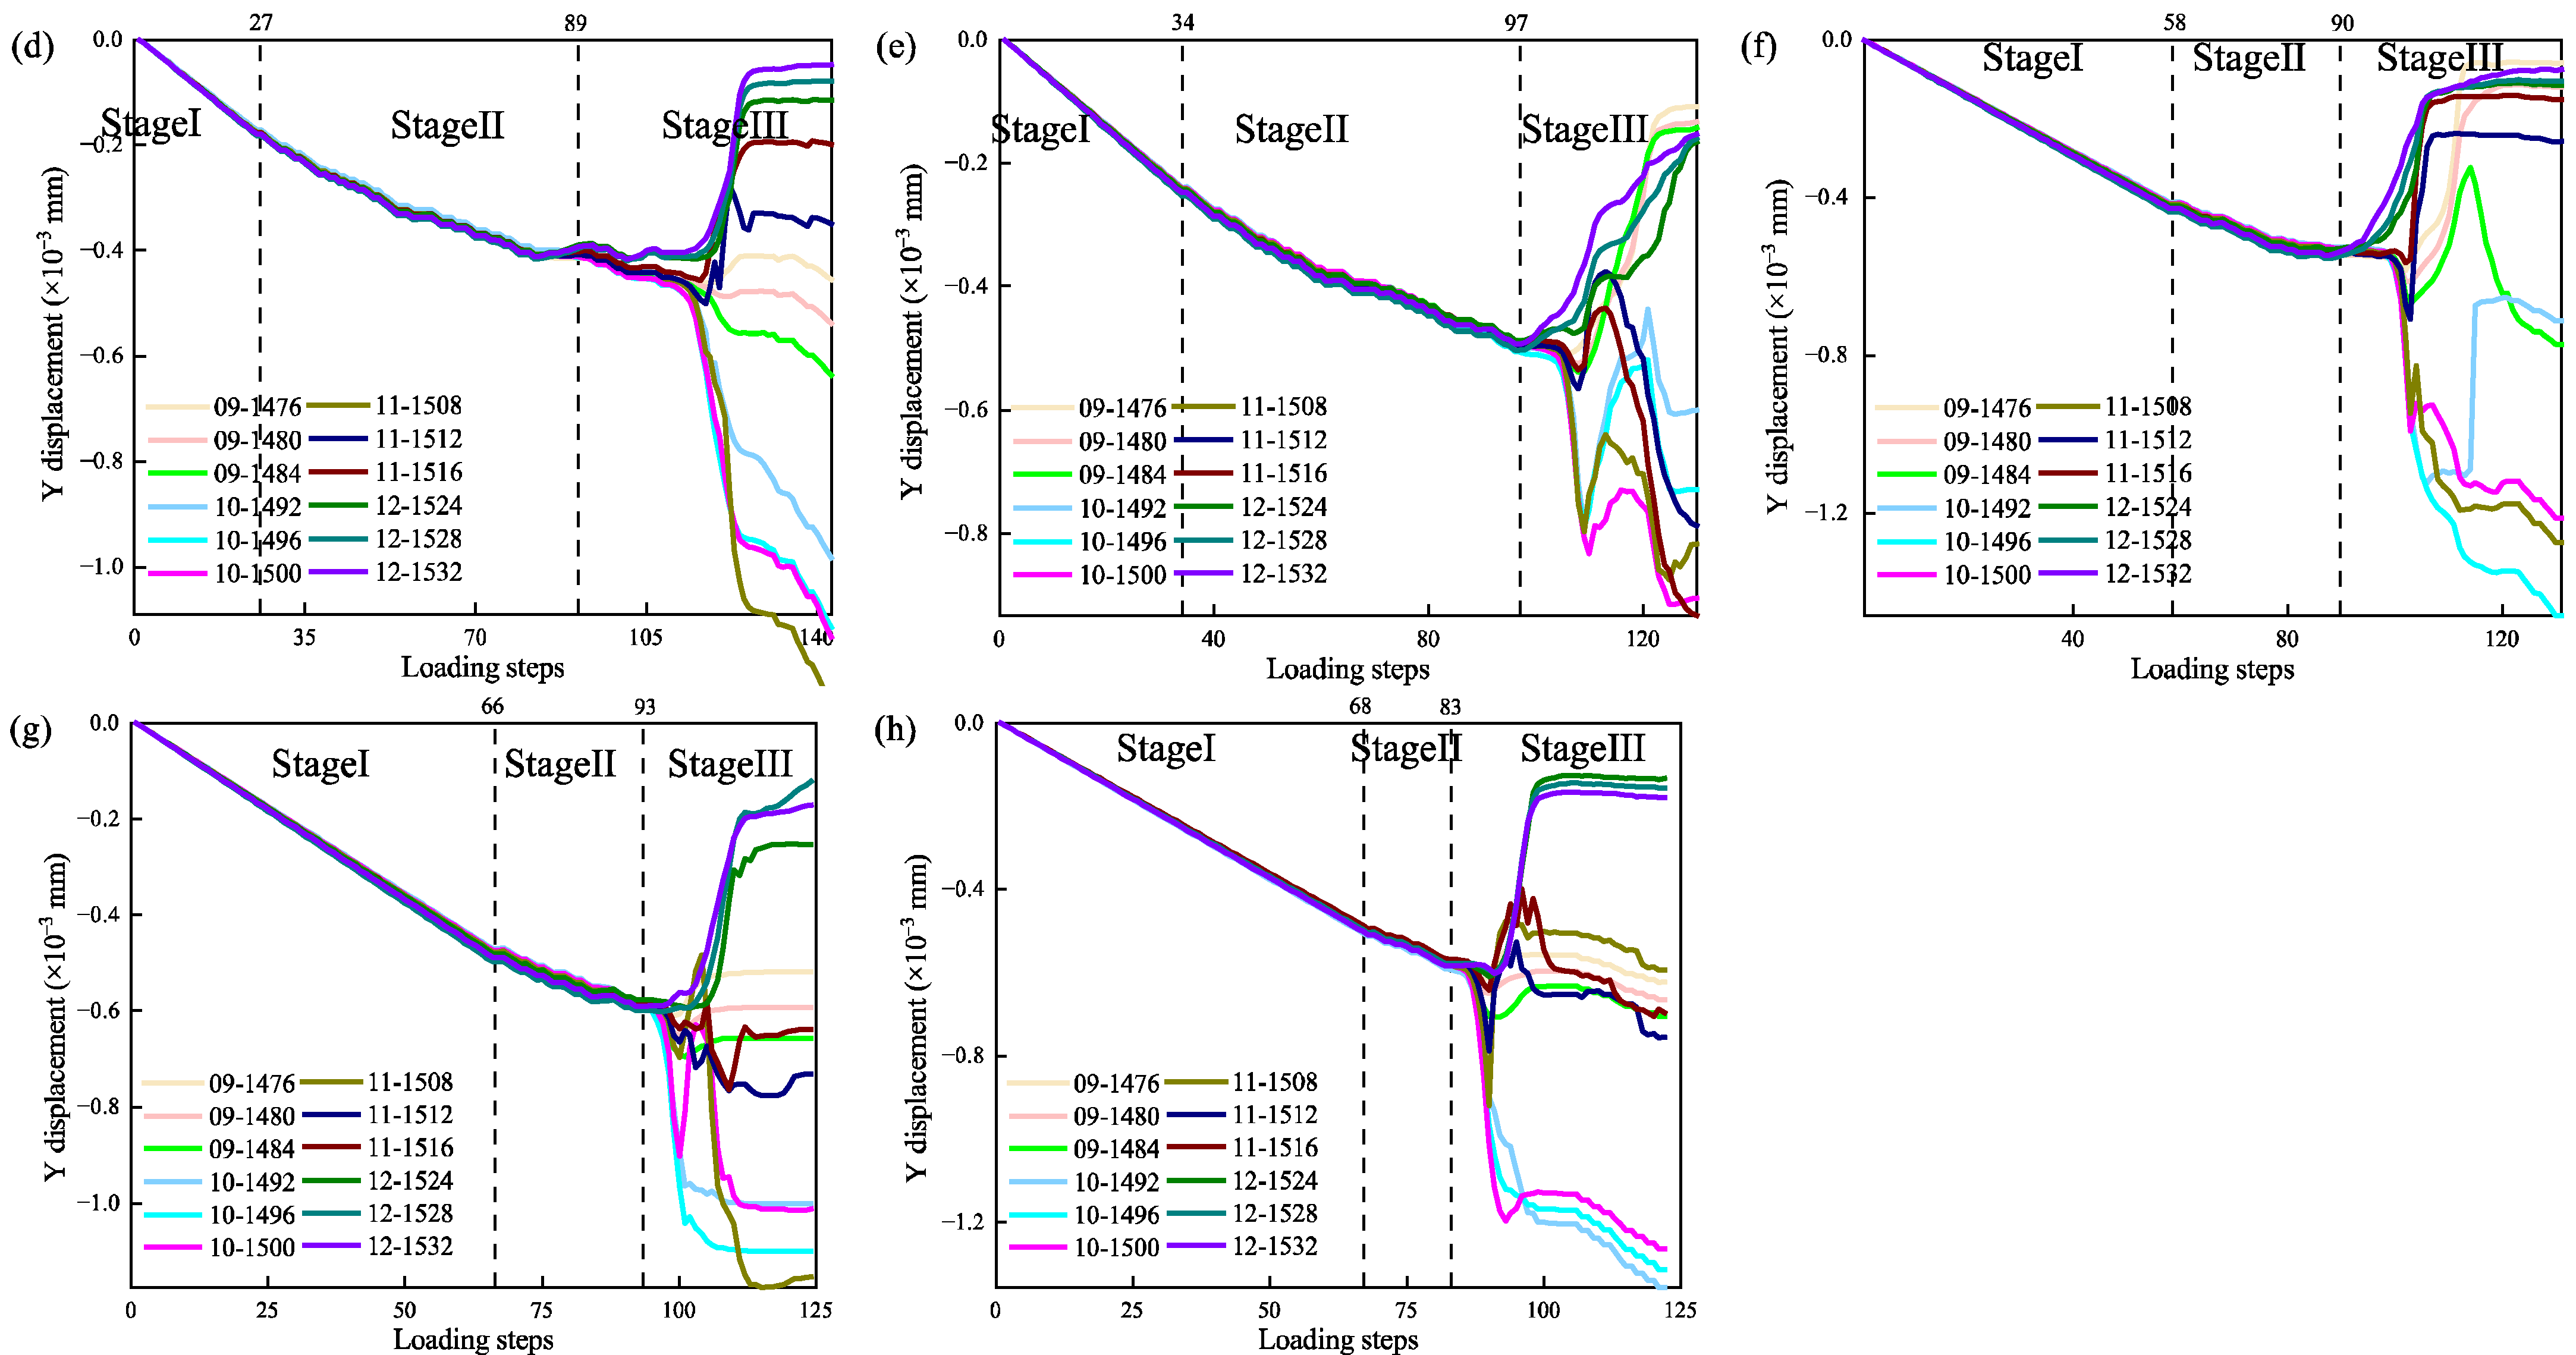
The previous geological rock mass system model considered only one strength homogeneity index ms, lacking further analysis of this parameter. The strength homogeneity indexes ms represent different heterogeneous materials, which may refer to different rock types. This paper further considers the differences in the fracture processes of geological rock mass system models under eight homogeneity indexes (ms = 1, 2, 3, 4, 5, 10, 20, and 100) of uniaxial compressive strength (initial strength state see Figure 16), with other material parameters held constant. From the initial state diagram of the model (Figure 16), it can be observed that the numerical units in the 16 geological rock mass units gradually transitioned from an uneven distribution to a uniform distribution.
Figure 17 shows the Y-direction displacement-loading step curves of representative numerical units (from rock mass unit 09–12) for eight different strength homogeneity indexes ms. As seen in Figure 17, although the strength homogeneity indexes ms vary, the representative numerical elements of all models clearly exhibit three distinct stages during the entire fracture and instability process: the elastic stage, stable fracture stage, and unstable fracture stage. Moreover, all models show significant divergence during the unstable rupture stage. The difference lies in the computational step lengths during the elastic and unstable stages.
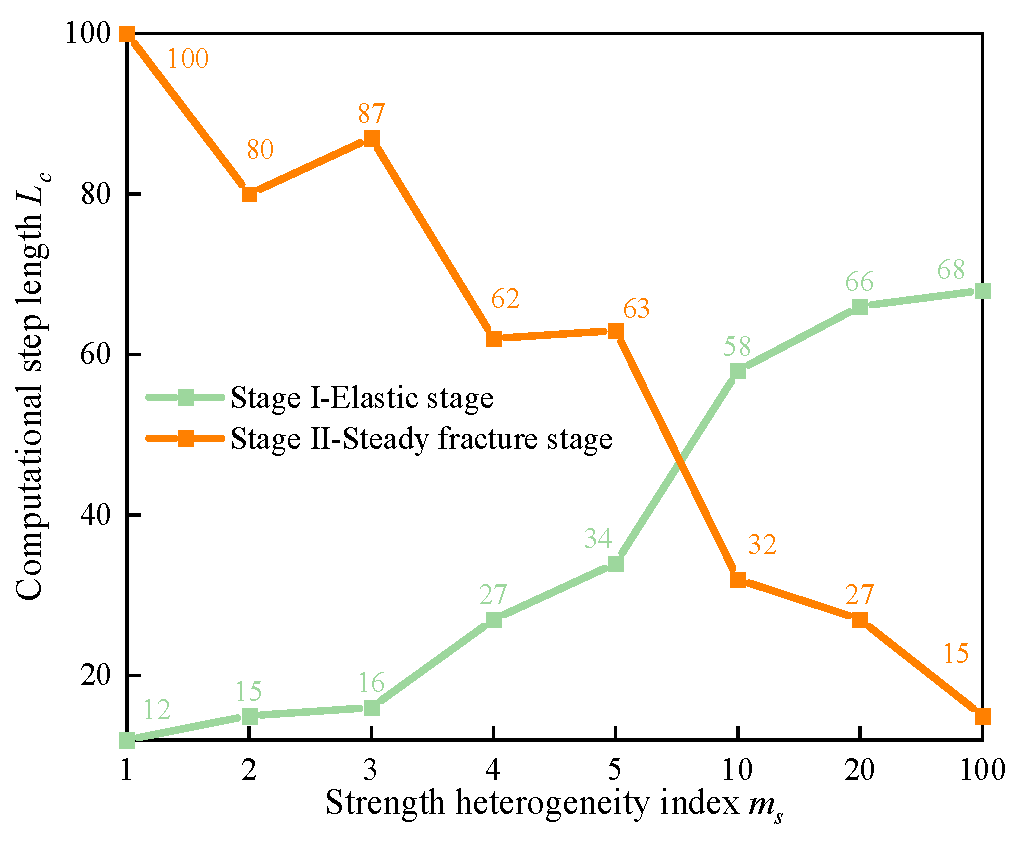
Figure 18 shows the calculation step lengths of the elastic and stable fracture stages of models under different homogeneity indexes of uniaxial compressive strength. According to Figure 18, as the homogeneity indexes increases, the representative numerical element of inhomogeneous geological rock masses gradually requires more calculation steps in the elastic stage, while the stable fracture stage step length decreases. An increase in the homogeneity indexes of uniaxial compressive strength leads to a shorter stable fracture stage, shortening the phase for capturing precursor information, which implies that the greater the homogeneity indexes of the geological rock mass, the more difficult it becomes to issue an early warning. Tang et al. [35] and Guo et al. [42] also arrived at the same conclusion as ours.
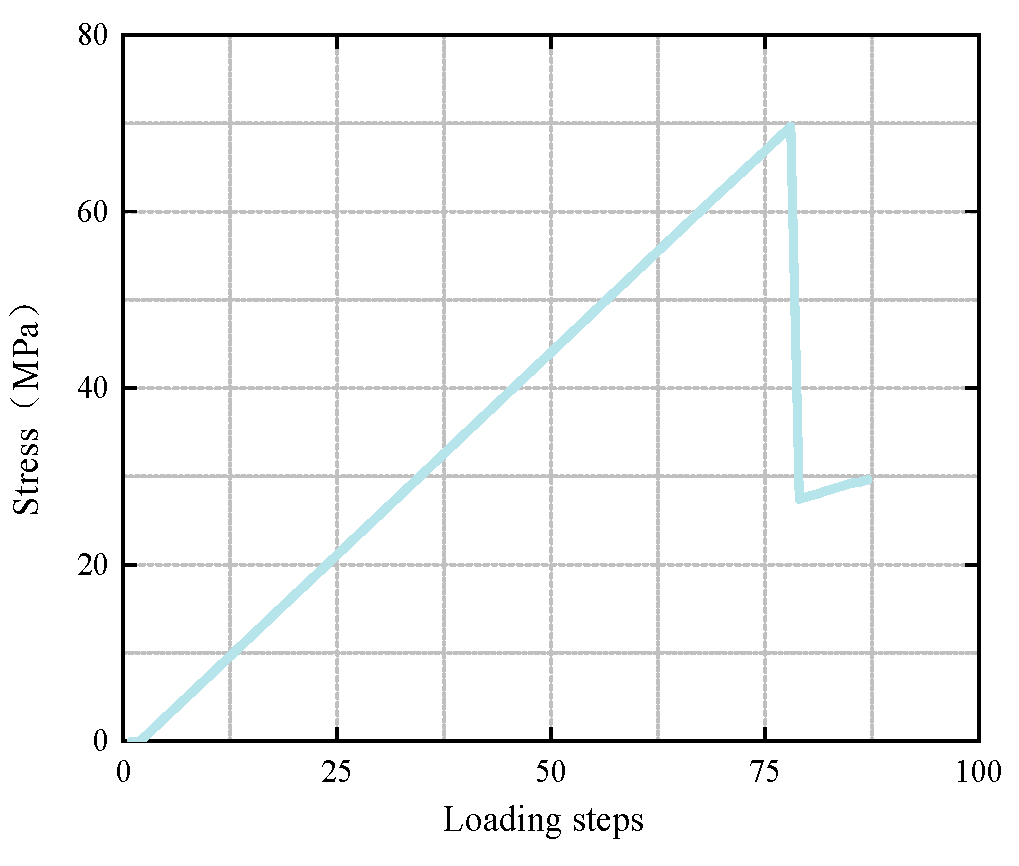
Figure 19 shows the stress-loading step curve of the geological rock mass system model when the homogeneity index ms = 100. From Figure 19, the stress-loading step curve of the geological rock mass system model with the homogeneity index ms = 100 has almost no yield stage and shows strong linear characteristics. This is because if every numerical element within a single geological rock mass has the same strength, the stress–strain curve of this rock mass will inevitably be linear with almost no yielding stage. When homogeneity index ms = 100, such material cannot be called rock mass material, and there is almost no precursor information for its failure and instability, so it is exceedingly difficult to issue early warnings for its failure and instability. This indirectly proves that it is precisely because of the heterogeneous characteristics of rock masses that there are many precursor signs before the main fracture occurs. Effectively capturing these precursor signs enables monitoring and early warning of rock landslides.

4.3. Limitations and Prospects of Geological Rock Mass System Models

It should be emphasized that this paper attempts to represent the fracture and instability of a non-homogeneous geological rock mass system through an idealized method. While the simulation here is two-dimensional and not a quantitative method, it employs a phenomenological approach to show in great detail the evolution of displacement, stress, and acoustic emission signals during the fracture process of the geological rock mass system model. The 2D simplified model in this study has inherent limitations in physical representation: the plane strain assumption cannot fully capture the 3D shear band propagation process in real landslides, particularly neglecting energy dissipation differences caused by lateral dilatancy effects, while uniaxial compression loading fails to equivalently represent the multidirectional stress history of natural slopes. These limitations indicate the model is primarily suitable for revealing the generation logic and co-evolution mechanisms of precursor signals, rather than precisely predicting specific landslide failure timing or slip surface geometry.
Despite geometric simplification, the 2D model demonstrates clear applicability in qualitatively revealing precursor patterns of rock mass failure. Through heterogeneous element properties (Figure 6) and uniaxial compression loading, it successfully reproduces key precursor phenomena including displacement/stress increment divergence (Figure 8, Figure 9, Figure 10 and Figure 12) and acoustic emission surge with clustering (Figure 14), which exhibit physical mechanisms consistent with monitoring characteristics observed during actual landslide acceleration phases (e.g., GNSS displacement jumps and microseismic signal clustering). Compared to 3D models, the 2D simplification significantly improves computational efficiency while maintaining heterogeneity representation, allowing greater focus on revealing system-level rupture evolution laws (e.g., spatiotemporal uncertainty in divergence phenomena) that provide theoretical foundations for early warning principles. Field validations (e.g., Fan et al.’s successful early warning using 16 GNSS sensors) confirm that the patterns revealed by the 2D model can guide 3D engineering practices. The model’s conclusions maintain engineering significance as the nonlinear acceleration characteristics of displacement jumps (Figure 10) and microseismic activity (Figure 14) show strong consistency with 3D landslide monitoring data (e.g., GNSS step-like displacements documented by Fan et al.), demonstrating that 2D systems can reproduce critical multiscale rupture behaviors. The derived monitoring principle combining global displacement surveillance with localized stress anomaly detection has been successfully implemented in practical 3D engineering through coordinated deployment of 16 GNSS sensors, verifying the fundamental nature of these precursor patterns.
The conclusions of this study are derived under uniaxial compression loading conditions. The multiaxial stress state in real slopes (e.g., lateral tectonic stress, pore water pressure) significantly alters the stress levels and failure modes of rock masses. Therefore, when applying the qualitative precursor patterns described herein to practical early warning, the specificity of the local stress field and hydrogeological conditions must be taken into account. The reliability of the model presented in this study and the universality of the precursor phenomena discovered in practical scenarios require further testing and calibration through future field observation data. This study primarily reveals the fracture precursor patterns in massive heterogeneous rock masses. For rock masses controlled by significant structural planes (e.g., bedding, faults, or dense joint networks), further analysis tailored to specific geological structures is required. This study primarily focuses on the response of rock masses under mechanical loading and does not account for key environmental triggering factors such as rainfall infiltration or seismic activity. Therefore, when applying the preliminary conclusions of this study to practical scenarios, the comprehensive influence of these external factors must be thoroughly considered. The monotonic loading approach adopted in this study does not account for complex loading-unloading stress paths (e.g., cyclic unloading) that may occur in real landslides. The applicability of the conclusions of this study beyond the adopted parameter ranges or under differing geological conditions requires further verification.

5. Conclusions

Based on the nature characteristics of heterogeneity and brittleness of geological rock mass, the numerical method of RFPA is used to simplify the geological rock mass system into 16 heterogeneous geological rock mass units with different strengths. Taking the optimal and simplest uniaxial compression state as an example, the evolution characteristics of stress, displacement, and acoustic emission of the heterogeneous geological rock mass system during the fracture process are obtained. The conceptualized numerical model in this study employs a two-dimensional plane model and involves idealized simplifications regarding mesoscopic parameters, loading conditions, loading history, and environmental factors. Simulation results reveal the early-warning mechanism underlying global displacement monitoring and multi-point stress monitoring in landslide prediction. These findings provide a novel theoretical foundation for improving the accuracy and feasibility of landslide early warning systems, while also offering contributions to sustainability across scientific, socio-economic, and policy dimensions. The following are implications for the early warning of rock landslides:
(1)
Before the fracture and instability of the heterogeneous geological rock mass system model, there is evident “differentiation” in the magnitude and direction of both displacement and stress increments. Additionally, a sudden increase in the number of acoustic emission events occurs, with their concentration near macroscopic cracks. Such a phenomenon could serve as an early warning indicator for predicting rock landslides.
(2)
Although displacement differentiation, stress differentiation, and acoustic emission (AE) nucleation appear in the heterogeneous geological rock mass system model before its fracture, the lack of uniformity and regular patterns of these phenomena across elements at different locations suggests that an integrated approach involving displacement monitoring, stress monitoring, and acoustic monitoring is insufficient for the accurate prediction of rock landslides.
(3)
Expanding the quantity and spatial distribution of monitoring points, along with diversifying and integrating monitoring techniques, can substantially improve the accuracy of early warning for landslides.
(4)
It is precisely because of the heterogeneous characteristics of rock masses that many precursor signals appear before the main fracture occurs. Effectively capturing these precursor signals enables monitoring and obtaining early warning of rock landslides.

Author Contributions

Conceptualization, X.C. methodology, C.T.; writing—original draft preparation, L.T.; writing—review and editing, L.T., X.C. and C.H. All authors have read and agreed to the published version of the manuscript.

Funding

This research was funded by the Natural Science Foundation of Sichuan Province (No. 2024NSFSC0099), and the State Key Laboratory of Geohazard Prevention and Geoenvironment Protection Independent Research Project (No. SKLGP2023Z014), and are gratefully acknowledged. The financial support is greatly appreciated.

Data Availability Statement

The data presented are available on request.

Conflicts of Interest

The authors declare no conflicts of interest.

References

  1. Zhao, Y.; Zhang, C.; Wang, Y.; Lin, H. Shear-related roughness classification and strength model of natural rock joint based on fuzzy comprehensive evaluation. Int. J. Rock Mech. Min. Sci. 2021, 137, 104550. [Google Scholar] [CrossRef]
  2. Lian, S.; Zhang, L.; Zhao, Y.; Wu, Q.; Du, C.; Wan, W. Evolution characteristics of unfrozen water content and damage for saturated sandstone during freezing–thawing cycle process based on the in-situ nuclear magnetic resonance. Bull. Eng. Geol. Environ. 2025, 84, 296. [Google Scholar] [CrossRef]
  3. Ma, Z.Y.; Zuo, J.P.; Zhu, F.; Liu, H.Y.; Xu, C.Y. Non-orthogonal Failure Behavior of Roadway Surrounding Rock Subjected to Deep Complicated Stress. Rock Mech. Rock Eng. 2023, 56, 6261–6283. [Google Scholar] [CrossRef]
  4. Zhao, Y.; Wang, Y.; Wang, W.; Wan, W.; Tang, J. Modeling of non-linear rheological behavior of hard rock using triaxial rheological experiment. Int. J. Rock Mech. Min. Sci. 2017, 93, 66–75. [Google Scholar] [CrossRef]
  5. Yu, W.; Guo, H.; Li, K.; Pan, B. Experimental Study on Uniaxial Compression Mechanics and Failure Characteristics of Non-Through Fractured Rock. Sustainability 2023, 15, 4968. [Google Scholar] [CrossRef]
  6. Saito, M. Forecasting Time of Slope Failure by Tertiary Creep. In Proceedings of the 7th International Conference on Soil Mechanics and Foundations Engineering, Montreal, QC, Canada, 17–23 August 1969; Pergamon Press: Oxford, UK, 1969; pp. 667–683. [Google Scholar]
  7. Intrieri, E.; Carlà, T.; Gigli, G. Forecasting the time of failure of landslides at slope-scale: A literature review. Earth-Sci. Rev. 2019, 193, 333–349. [Google Scholar] [CrossRef]
  8. Solari, L.; Del Soldato, M.; Raspini, F.; Barra, A.; Bianchini, S.; Confuorto, P.; Casagli, N.; Crosetto, M. Review of Satellite Interferometry for Landslide Detection in Italy. Remote Sens. 2020, 12, 1351. [Google Scholar] [CrossRef]
  9. Song, J.; Leng, J.; Li, J.; Wei, H.; Li, S.; Wang, F. Application of Acoustic Emission Technique in Landslide Monitoring and Early Warning: A Review. Appl. Sci. 2025, 15, 1663. [Google Scholar] [CrossRef]
  10. Yin, Y.; Zheng, W.; Liu, Y.; Zhang, J.; Li, X. Integration of GPS with InSAR to monitoring of the Jiaju landslide in Sichuan, China. Landslides 2010, 7, 359–365. [Google Scholar] [CrossRef]
  11. Fan, X.; Xu, Q.; Alonso-Rodriguez, A.; Subramanian, S.S.; Li, W.; Zheng, G.; Dong, X.; Huang, R. Successive landsliding and damming of the Jinsha River in eastern Tibet, China: Prime investigation, early warning, and emergency response. Landslides 2019, 16, 1003–1020. [Google Scholar] [CrossRef]
  12. Fan, X.; Xu, Q.; Liu, J.; Subramanian, S.S.; He, C.; Zhu, X.; Zhou, L. Successful early warning and emergency response of a disastrous rockslide in Guizhou province, China. Landslides 2019, 16, 2445–2457. [Google Scholar] [CrossRef]
  13. Guo, F.; Meng, X.; Qi, T.; Dijkstra, T.; Thorkildsen, J.K.; Yue, D.; Chen, G.; Zhang, Y.; Dou, X.; Shi, P. Rapid onset hazards, fault-controlled landslides and multi-method emergency decision-making. J. Mountain Sci. 2022, 19, 1357–1369. [Google Scholar] [CrossRef]
  14. Huang, G.; Du, S.; Wang, D. GNSS techniques for real-time monitoring of landslides: A review. Satell. Navig. 2023, 4, 5. [Google Scholar] [CrossRef]
  15. Wang, G.; Kearns, T.J.; Yu, J.; Saenz, G. A stable reference frame for landslide monitoring using GPS in the Puerto Rico and Virgin Islands region. Landslides 2013, 11, 119–129. [Google Scholar] [CrossRef]
  16. Shu, B.; He, Y.; Wang, L.; Zhang, Q.; Li, X.; Qu, X.; Huang, G.; Qu, W. Real-time high-precision landslide displacement monitoring based on a GNSS CORS network. Measurement 2023, 217, 113056. [Google Scholar] [CrossRef]
  17. He, M.; Tao, Z.; Zhang, B. Application of remote monitoring technology in landslides in the Luoshan mining area. Min. Sci. Technol. 2009, 19, 609–614. [Google Scholar] [CrossRef]
  18. Tao, Z.; Zhu, C.; Zheng, X.; He, M. Slope stability evaluation and monitoring of Tonglushan ancient copper mine relics. Adv. Mech. Eng. 2018, 10, 1–16. [Google Scholar] [CrossRef]
  19. Tao, Z.; Wang, Y.; Zhu, C.; Xu, H.; Li, G.; He, M. Mechanical evolution of constant resistance and large deformation anchor cables and their application in landslide monitoring. Bull. Eng. Geol. Environ. 2019, 78, 4787–4803. [Google Scholar] [CrossRef]
  20. Chae, B.-G.; Park, H.-J.; Catani, F.; Simoni, A.; Berti, M. Landslide prediction, monitoring and early warning: A concise review of state-of-the-art. Geosci. J. 2017, 21, 1033–1070. [Google Scholar] [CrossRef]
  21. Liu, F.; Yang, Z.; Deng, W.; Yang, T.; Zhou, J.; Yu, Q.; Mao, Y. Rock landslide early warning system combining slope stability analysis, two-stage monitoring, and case-based reasoning: A case study. Bull. Eng. Geol. Environ. 2021, 80, 8433–8451. [Google Scholar] [CrossRef]
  22. Uhlemann, S.; Smith, A.; Chambers, J.; Dixon, N.; Dijkstra, T.; Haslam, E.; Meldrum, P.; Merritt, A.; Gunn, D.; Mackay, J. Assessment of ground-based monitoring techniques applied to landslide investigations. Geomorphology 2016, 253, 438–451. [Google Scholar] [CrossRef]
  23. Feng, Z.; Zhao, Y.; Feng, Z. Indeterminacy of displacement and stress of geologic rock mass system in the critically non-stationary state: Implication on prediction of geo-hazards. Nat. Hazards 2021, 107, 1105–1124. [Google Scholar] [CrossRef]
  24. Carlà, T.; Farina, P.; Intrieri, E.; Botsialas, K.; Casagli, N. On the monitoring and early-warning of brittle slope failures in hard rock masses: Examples from an open-pit mine. Eng. Geol. 2017, 228, 71–81. [Google Scholar] [CrossRef]
  25. Paronuzzi, P.; Bolla, A.; Rigo, E. Brittle and Ductile Behavior in Deep-Seated Landslides: Learning from the Vajont Experience. Rock Mech. Rock Eng. 2015, 49, 2389–2411. [Google Scholar] [CrossRef]
  26. Zhang, X.; Zhu, C.; He, M.; Dong, M.; Zhang, G.; Zhang, F. Failure Mechanism and Long Short-Term Memory Neural Network Model for Landslide Risk Prediction. Remote Sens. 2021, 14, 166. [Google Scholar] [CrossRef]
  27. Xu, Q.; Peng, D.; Zhang, S.; Zhu, X.; He, C.; Qi, X.; Zhao, K.; Xiu, D.; Ju, N. Successful implementations of a real-time and intelligent early warning system for loess landslides on the Heifangtai terrace, China. Eng. Geol. 2020, 278, 105817. [Google Scholar] [CrossRef]
  28. Feng, Z.; Lo, C.; Lin, Q. The characteristics of the seismic signals induced by landslides using a coupling of discrete element and finite difference methods. Landslides 2016, 14, 661–674. [Google Scholar] [CrossRef]
  29. Ye, B.; Qiu, H.; Tang, B.; Liu, Y.; Liu, Z.; Jiang, X.; Yang, D.; Ullah, M.; Zhu, Y.; Kamp, U. Creep deformation monitoring of landslides in a reservoir area. J. Hydrol. 2024, 632, 12. [Google Scholar] [CrossRef]
  30. Wu, Y.; Niu, R.; Wang, Y.; Chen, T. A Fast Deploying Monitoring and Real-Time Early Warning System for the Baige Landslide in Tibet, China. Sensors 2020, 20, 6619. [Google Scholar] [CrossRef]
  31. Tang, J.; Yang, S.; Yang, K.; Tian, W.; Liu, G.; Duan, M. Discrete Element Modeling of Thermally Damaged Sandstone Containing Two Pre-Existing Flaws at High Confining Pressure. Sustainability 2023, 15, 6318. [Google Scholar] [CrossRef]
  32. Lin, P.; Wong, R.H.C.; Tang, C.A. Experimental study of coalescence mechanisms and failure under uniaxial compression of granite containing multiple holes. Int. J. Rock Mech. Min. Sci. 2015, 77, 313–327. [Google Scholar] [CrossRef]
  33. Wang, T.; Li, P.; Tang, C.a.; Zhang, B.; Yu, J. Finite Element Analysis for the Mechanism of Stress Wave Propagation and Crack Extension Due to Blasting of a Frozen Rock Mass. Sustainability 2023, 15, 4616. [Google Scholar] [CrossRef]
  34. Tang, C.; Tang, S.; Gong, B.; Bai, H. Discontinuous deformation and displacement analysis: From continuous to discontinuous. Sci. China Technol. Sci. 2015, 58, 1567–1574. [Google Scholar] [CrossRef]
  35. Tang, C.A.; Tham, L.G.; Wang, S.H.; Liu, H.; Li, W.H. A numerical study of the influence of heterogeneity on the strength characterization of rock under uniaxial tension. Mech. Mater. 2007, 39, 326–339. [Google Scholar] [CrossRef]
  36. Tang, C.; Webb, A.A.G.; Moore, W.; Wang, Y.; Ma, T.; Chen, T. Breaking Earth’s shell into a global plate network. Nat. Commun. 2020, 11, 3621. [Google Scholar] [CrossRef] [PubMed]
  37. Xu, Y.; Yao, W.; Xia, K. Numerical study on tensile failures of heterogeneous rocks. J. Rock Mech. Geotech. Eng. 2020, 12, 50–58. [Google Scholar] [CrossRef]
  38. Bolla, A.; Paronuzzi, P. Numerical Investigation of the Pre-collapse Behavior and Internal Damage of an Unstable Rock Slope. Rock Mech. Rock Eng. 2019, 53, 2279–2300. [Google Scholar] [CrossRef]
  39. Vyazmensky, A.; Stead, D.; Elmo, D.; Moss, A. Numerical Analysis of Block Caving-Induced Instability in Large Open Pit Slopes: A Finite Element/Discrete Element Approach. Rock Mech. Rock Eng. 2009, 43, 21–39. [Google Scholar] [CrossRef]
  40. Xu, Q. Understanding the landslide monitoring and early warning: Consideration to practical issues. J. Eng. Geol. 2020, 28, 360–374. (In Chinese) [Google Scholar] [CrossRef]
  41. Zhao, Y. Retrospection on the development of rock mass mechanics and the summary of some unsolved centennial problems. Chin. J. Rock Mech. Eng. 2021, 40, 1297–1336. (In Chinese) [Google Scholar] [CrossRef]
  42. Guo, Q.; Hong, W.; Xi, X.; Pan, J.; Zhang, Y.; Wang, S. Effect of Heterogeneity on the Failure of Rock with an Initial Crack under Uniaxial Compressions: A Numerical Study. Lithosphere 2022, 2022, 6518010. [Google Scholar] [CrossRef]
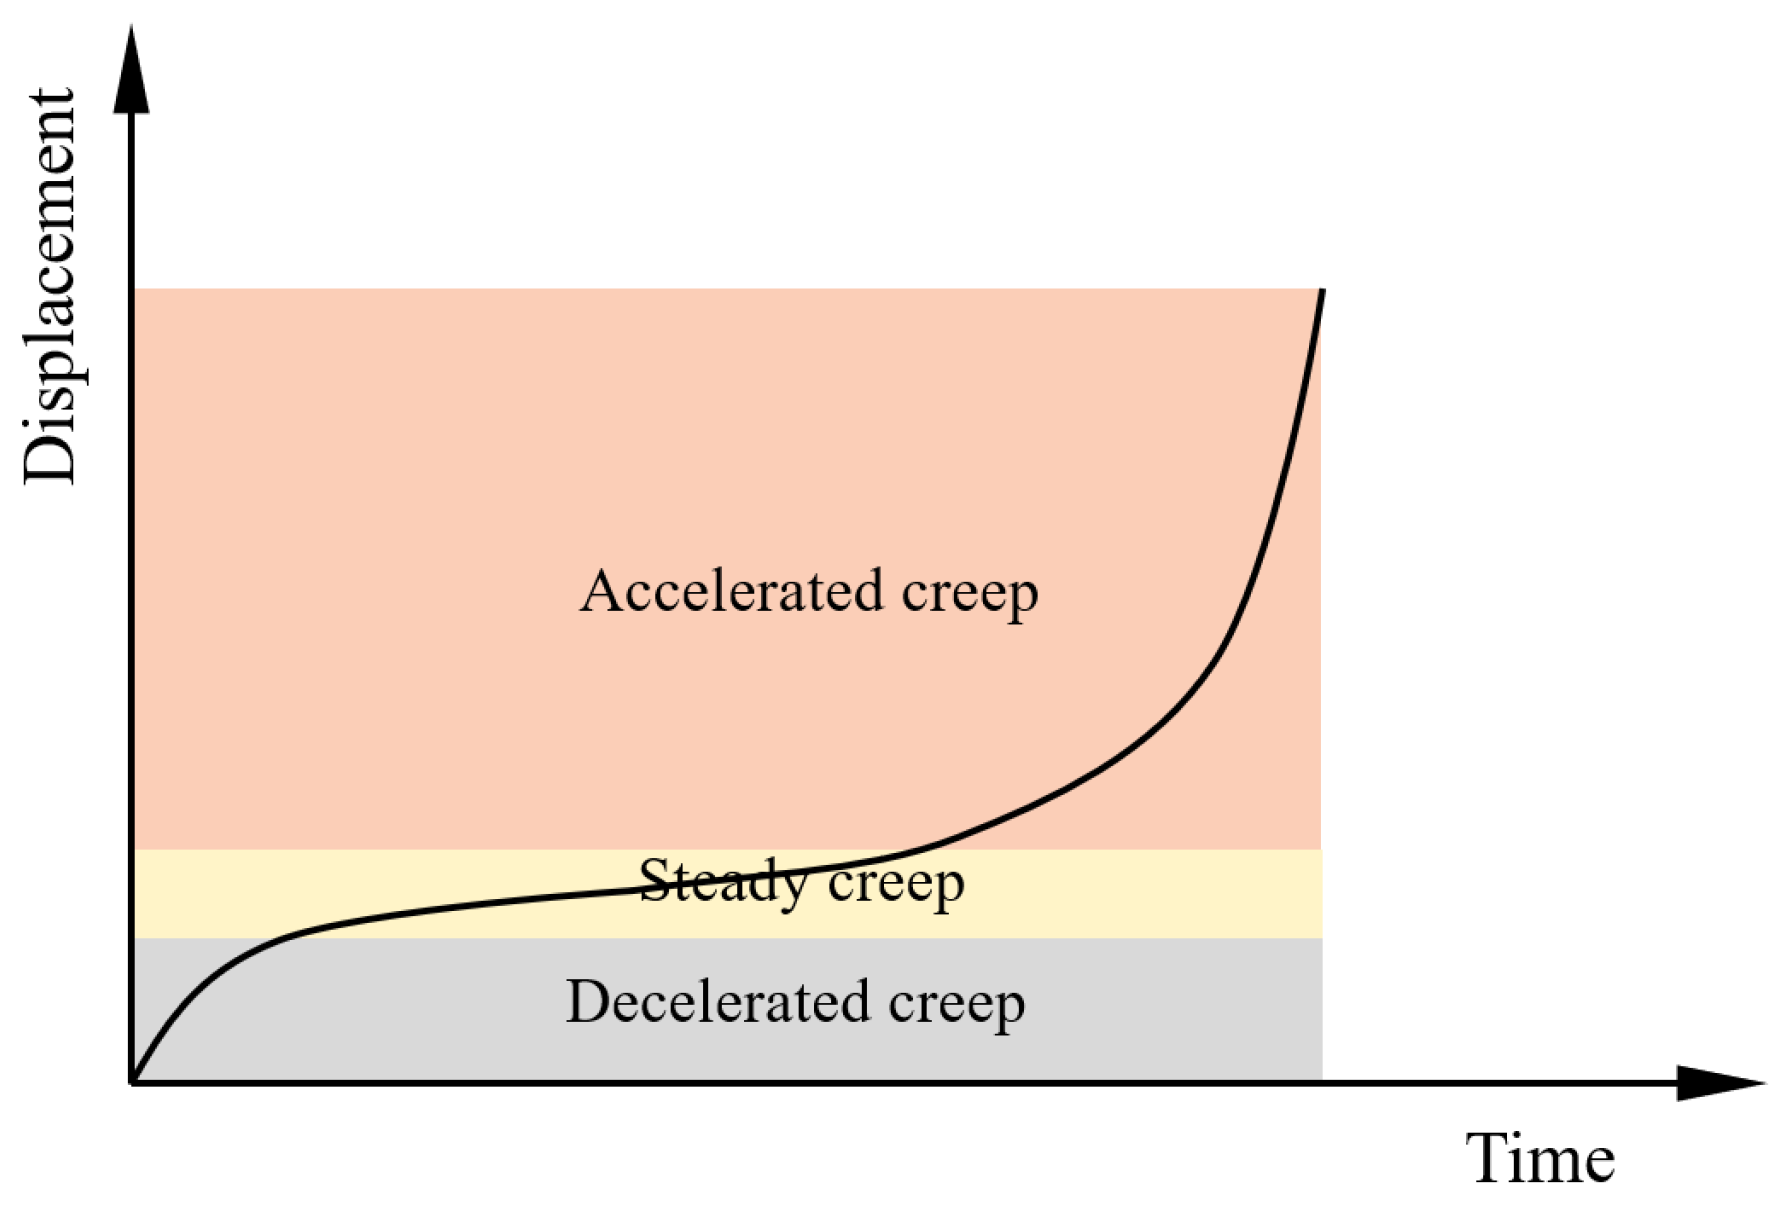
Figure 1. Schematic diagram of Landslide displacement-time curve.
Sustainability 17 08408 g001
Figure 2. Distribution density function curve of the homogeneity index m.
Sustainability 17 08408 g002
Figure 3. Constitutive law of numerical elements under uniaxial compression and tension (Modified according to [34]).
Sustainability 17 08408 g003
Figure 4. Geological structure of a slope in Italy (Modified according to [38]).
Sustainability 17 08408 g004
Figure 5. The main geological structures of the Palabora Mine slope (Modified according to [39]).
Sustainability 17 08408 g005
Figure 6. Heterogeneous geological rock mass system model.
Sustainability 17 08408 g006
Figure 7. Schematic diagram of numerical element data extraction from the geological rock mass unit (taking geological rock mass unit No. 05 as an example).
Sustainability 17 08408 g007
Figure 8. The curves of X direction displacement versus loading steps for representative numerical elements during the fracturing process of the heterogeneous geological rock mass system model: (a) geological rock mass units No. 01–04, (b) geological rock mass units No. 05–08, (c) geological rock mass units No. 09–12, (d) geological rock mass units No. 13–16.
Sustainability 17 08408 g008
Figure 9. Contour maps of displacement field in the X direction during the fracturing process of the heterogeneous geological rock mass system model, (a) Step 16, (b) Step 60, (c) Step 81, (d) Step 103, (e) Step 120 and (f) Step 130.
Sustainability 17 08408 g009
Figure 10. The curves of Y direction displacement versus loading steps for representative numerical elements during the fracturing process of the heterogeneous geological rock mass system model: (a) geological rock mass units No. 01–04, (b) geological rock mass units No. 05–08, (c) geological rock mass units No. 09–12, (d) geological rock mass units No. 13–16.
Sustainability 17 08408 g010
Figure 11. Contour maps of displacement field in the Y direction during the fracturing process of the heterogeneous geological rock mass system model, (a) Step 16, (b) Step 60, (c) Step 81, (d) Step 103, (e) Step 120 and (f) Step 130.
Sustainability 17 08408 g011
Figure 12. The curves of maximum principal stress versus loading steps for representative numerical elements during the fracturing process of the heterogeneous geological rock mass system model: (a) geological rock mass units No. 01–04, (b) geological rock mass units No. 05–08, (c) geological rock mass units No. 09–12, (d) geological rock mass units No. 13–16.
Sustainability 17 08408 g012
Figure 13. Contour maps of maximum principal stress during the fracturing process of the heterogeneous geological rock mass system model, (a) Step 16, (b) Step 60, (c) Step 81, (d) Step 103, (e) Step 120 and (f) Step 130. (The positions marked with red circles in the figure indicate stress concentrations).
Sustainability 17 08408 g013
Figure 14. Cumulative cloud maps of acoustic emission signals during the fracture process of the heterogeneous geological rock mass system model. (a) step 16, (b) step 60, (c) step 81, (d) step 103, (e) step 120, and (f) step 130. (The white circles represent the acoustic emission signals generated by compressive-shear failures, and the red circles correspond to the signals generated by tensile failures. A circle represents an acoustic emission event).
Sustainability 17 08408 g014
Figure 15. GNSS data of a certain slope (From Fan et al. [12]).
Sustainability 17 08408 g015
Figure 16. Initial strength state of geological rock mass system models under different strength homogeneity indexes.
Sustainability 17 08408 g016
Figure 17. Y-direction displacement-loading step curves of representative numerical units (from rock mass unit 09–12) for eight different strength homogeneity indexes ms. (a) ms = 1, (b) ms = 2, (c) ms = 3, (d) ms = 4, (e) ms = 5, (f) ms = 10, (g) ms = 20, and (h) ms = 100.
Sustainability 17 08408 g017aSustainability 17 08408 g017b
Figure 18. Computational step lengths for the elastic stage and stable fracture stage of the representative numerical element of heterogeneous geological rock mass unit.
Sustainability 17 08408 g018
Figure 19. Stress-loading steps curve for heterogeneous geological rock mass system model when ms = 100.
Sustainability 17 08408 g019
Disclaimer/Publisher’s Note: The statements, opinions and data contained in all publications are solely those of the individual author(s) and contributor(s) and not of MDPI and/or the editor(s). MDPI and/or the editor(s) disclaim responsibility for any injury to people or property resulting from any ideas, methods, instructions or products referred to in the content.