Article

Towards Corporate Sustainability: Can the Cultural and Tourism Consumption Promotion Policy Enhance Corporate ESG Performance?

1
School of Landscape Architecture, Beijing Forestry University, Beijing 100083, China
2
Industrial Economics Research Institute, Research Institute of Machinery Industry Economic & Management, Beijing 100055, China
3
The School of Finance, Hunan University of Technology and Business, Changsha 410205, China
4
The Business School, Hunan First Normal University, Changsha 410205, China
*
Authors to whom correspondence should be addressed.
Sustainability 2025, 17(18), 8402; https://doi.org/10.3390/su17188402
Submission received: 6 August 2025 / Revised: 13 September 2025 / Accepted: 17 September 2025 / Published: 19 September 2025

Abstract

Environmental, Social, and Governance (ESG) performance is increasingly recognized as a pivotal metric for assessing corporate sustainability. Hence, this study investigates the effect of the Cultural and Tourism Consumption Promotion (CTCP) policy on corporate ESG performance. By treating the designation of demonstration cities as a quasi-exogenous policy event, a difference-in-differences (DID) methodology is adopted for a sample of Chinese A-share-listed culture and tourism companies from 2011 to 2024. The results indicate that the CTCP policy substantially improves culture and tourism firms’ ESG outcomes. Analysis of the underlying mechanisms identified three primary transmission channels: contributing to corporate revenue growth, encouraging green innovation, and alleviating financing constraints. Heterogeneity analysis revealed that the improvement effect of the policy on ESG performance is more significant in state-owned firms, those with sound governance structures, and labor-intensive culture and tourism firms. In addition, the policy may trigger strategic ESG disclosures, particularly among small-scale firms, leading to a greater divergence between their ESG reporting and their actual performance. Our findings illuminate the micro-level governance impacts of special policies for cultural and tourism consumption, providing a theoretical basis and empirical reference for improving culture and tourism industry policies and guiding firms’ sustainable development.

1. Introduction

With the integration of the “dual-carbon” goals into the overall national development strategy, Environmental, Social, and Governance (ESG) performance has become a key criterion for measuring firms’ sustainable development capabilities [1,2]. As a resource-dependent and livelihood-relevant industry, culture and tourism’s ESG practices matter for ecological protection and cultural inheritance. They also hold strategic significance for advancing the low-carbon transformation of the economy and society. Strong ESG performance helps culture and tourism firms to mitigate operational risks and enhance their brand reputation [3]. It also matches tourists’ growing demands for “green cultural tourism” and “responsible consumption,” securing market advantages.
Nevertheless, the advancement of ESG practices within China’s culture and tourism sector is still nascent. As illustrated in Figure 1, the composite ESG scores for the listed culture and tourism firms followed a mildly volatile but generally upward trend from 2011 to 2019. During this period, the environmental performance (E) and social responsibility (S) scores increased gradually, while the corporate governance (G) scores exhibited a slight downward trend. Post-2020, this pattern shifted markedly: the upward momentum of the composite score intensified significantly, with the E and S scores experiencing accelerated growth; however, the downward trend in G scores failed to reverse. This discrepancy may stem from a multifaceted “governance lag” phenomenon catalyzed by the policy. The Cultural and Tourism Consumption Promotion (CTCP) policy’s initial emphasis on boosting consumption and fulfilling ecological obligations—such as improving facilities and reducing pollution—led firms to prioritize more visible E and S investments that align directly with short-term policy metrics. In contrast, improving corporate governance is an inherently long-term and complex process, involving structural changes such as board restructuring and internal control reforms, the benefits of which are not immediately evident. Moreover, strong organizational inertia and the pressure to demonstrate quick wins may have further discouraged firms from undertaking costly governance reforms. Thus, while the policy successfully accelerated environmental and social improvements, its insufficient impetus on internal governance mechanisms has resulted in the persistent stagnation of the G scores.
To harness the growth potential of cultural and tourism consumption and steer the industry toward high-quality development, three ministries—including the Ministry of Culture and Tourism—jointly launched an initiative to build cultural and tourism consumption demonstration cities in 2020. Fifteen cities were named in the first batch, with policy inclinations and resource integration deployed to optimize the cultural and tourism consumption landscape. This policy directly influences the operational context of culture and tourism firms; moreover, it may prompt firms to emphasize ESG practices through approaches such as steering market demand and enhancing resource allocation. However, the extant literature leaves several key questions unanswered: Does the CTCP policy truly elevate ESG performance in these firms? What constitutes its intrinsic operational mechanisms? Addressing these questions is crucial for enhancing culture and tourism industry policies and promoting sustainable firm development.
In the existing literature, scholars have explored the influencing factors of corporate ESG performance from multiple perspectives. In internal corporate governance, researchers have focused on board structure and executive characteristics, analyzing how these elements influence ESG practices via decision-making mechanisms and strategic orientation [4,5,6,7]. At the external environment level, studies have explored how factors such as environmental regulations and stakeholder pressure affect corporate ESG performance, revealing that external constraints and incentives drive firms to prioritize sustainability [8,9,10]. In policy effect research, existing findings have focused on how the optimization of the business environment and green fiscal policies boost ESG practices via resource allocation and institutional cost reduction [11,12,13]. While culture and tourism research has explored operational efficiency and innovation, it has primarily focused on operational performance, laying a foundation for understanding the industry’s development patterns.
Against this backdrop, this study employs the policy of cultural and tourism consumption demonstration cities as a policy shock, selecting A-share-listed culture and tourism companies in China’s Shanghai and Shenzhen stock exchanges from 2011 to 2024 as samples to examine the influence of the CTCP policy on corporate ESG performance and their underlying mechanisms. The contributions of this study include three aspects:
First, this study expands the research dimension of factors influencing corporate ESG performance from the perspective of specialized cultural and tourism consumption policies. Existing studies have mostly focused on the roles of general policies, such as business environment innovation pilots and green fiscal policies, in shaping ESG performance. This research incorporates the CTCP policy into its analytical framework. We examine the policy–ESG link in the context of the tourism industry, providing a fresh perspective on policy incentives and corporate sustainability.
Second, this study reveals the unique mechanism by which the CTCP policy affects corporate ESG performance. Unlike business environment policies acting via resource mechanisms, this research focuses on cultural and tourism consumption policies’ core traits: activating market demand and optimizing resource supply. It clarifies their ESG influence via revenue growth, green innovation, and financing constraints, opening the “black box” of such policies’ role in corporate sustainability.
Third, this study enriches the practical implications of ESG research on culture and tourism firms. While existing studies have largely focused on operational efficiency and innovation capacity, this research is situated within the context of cultural and tourism consumption policies. We examine both the policy’s overall impact on ESG performance and the moderating effects of ownership type and governance structure. This provides micro-level empirical evidence for targeted ESG policy-making in the cultural and tourism industry.
The subsequent structure of this paper is as follows: Section 2 provides a review of the related literature; Section 3 presents the policy background and theoretical analysis; Section 4 outlines the methodology and data; Section 5 presents the empirical results; Section 6 provides further analysis; Section 7 discusses the findings; and the Section 8 concludes this study.

2. Literature Review

2.1. ESG Measurement and Economic and Social Impact

The measurement and impacts of ESG performance constitute a rapidly expanding field of research. The theoretical underpinnings of ESG are rooted in stakeholder theory, which posits that firms should create value for a broad range of constituents beyond just shareholders [14], and institutional theory, which suggests organizations conform to external pressures to gain legitimacy [15]. These frameworks provide a foundation for understanding why firms engage in ESG activities.
Academic research frequently employs ESG ratings from agencies such as MSCI, Bloomberg, and Refinitiv to evaluate corporate sustainability performance. A significant challenge in this area is the substantial divergence often observed across different providers’ scores. Berg et al. [16] systematically investigated this issue, analyzing data from six prominent agencies. They decomposed the rating divergence into contributions from scope (38%), measurement (56%), and weight (6%), highlighting that differences in how categories are measured constitute the most significant source of disagreement. This underscores the importance of critical engagement with ESG data sources. Recent methodological advances seek to improve ESG measurement. For instance, Sariyer et al. [17] proposed a multi-stage AI-based system for ESG performance prediction, incorporating clustering, association rule mining, and deep learning, demonstrating the potential of advanced analytics to generate insights from ESG data. Furthermore, studies such as that of Eccles et al. [18], through historical analysis of early data vendors, have shown how the very construction of ESG measures is a social process, influenced by the originating organization’s philosophy and purpose. Schimanski et al. [19] contributed by using Natural Language Processing on millions of texts to develop models that quantify corporate E, S, and G communication, offering a novel approach to bridge the measurement gaps.
A robust body of evidence demonstrates the economic benefits of superior ESG performance. Gillan et al. [20] provided a comprehensive review of the corporate finance literature on ESG and CSR, noting the complex and sometimes conflicting relationships between ESG profiles and firm characteristics, risk, and value, concluding that significant questions remain unresolved. At the firm level, studies link strong ESG performance to lower systematic risk, as theorized and shown by Albuquerque et al. [21], who modeled CSR as an investment that enhances product differentiation and reduces risk. Ding and Lee [22] showed the positive impact of ESG ratings on the financial performance of Chinese manufacturing firms, identifying export share as a mediator and carbon intensity as a positive moderator. Syntheses of multiple studies confirm that the long-term financial benefits of ESG investments tend to outweigh their initial costs, thereby potentially enhancing risk-adjusted returns [23]. Beyond financial metrics, corporate ESG practices yield significant social benefits and enhance resilience. Wang et al. [24] showed that better ESG responsibility performance enhances corporate resilience by increasing the economic value-added rate of total assets and reducing the risk of corporate bankruptcy. Shi and Zhang [25] further demonstrated that ESG acts as a form of intangible capital within a production function framework, promoting enterprise performance, with digital finance strengthening this positive impact. This body of evidence underscores the growing importance of ESG factors for long-term corporate value creation, aligning with global sustainability initiatives and national strategies such as China’s dual carbon goals [2]. Furthermore, superior ESG performance is increasingly shown to attract investment; Hasnaoui [26] found that tech-heavy mutual funds with higher ESG ratings consistently outperform their lower-rated peers in both absolute and risk-adjusted returns. The role of ESG as a signal of credit quality and managerial competence is particularly important in emerging markets where information asymmetry is more pronounced [27].

2.2. Research on the Effect of the CTCP Policy

Research on the economic effects of culture and tourism policies has primarily focused on macro-level outcomes. Studies have examined how initiatives such as the National Cultural Consumption Pilot Cities program stimulate local consumption, boost tourism revenue, and drive regional economic growth. For example, Lin et al. [28] used a multi-period DID model to show that this policy significantly promoted sustainable development within the agritourism economy, with pronounced effects in eastern and central regions. Yu and Liu [29] also employed a multi-period DID approach, finding that the cultural and tourism consumption promotion policy improves the total factor productivity of regional enterprises, primarily by alleviating financing constraints. Another stream of literature investigates consumer behavior and policy implementation. Sun and Guo [30] used qualitative comparative analysis (csQCA) to explore configurations leading to urban tourism policy change in Suzhou, finding national policy to be a necessary condition. Lv [31] delved into the implementation differences of public culture service policies, highlighting how local governments play different roles under resource constraints, which affects policy outcomes. However, a notable void persists in understanding the micro-level implications of how such targeted consumption policies influence corporate strategic behavior, particularly in the realm of non-financial performance such as ESG. This is a significant omission, given that the ultimate executors of policy intentions are often the firms within the industry.
Research on analogous place-based policies offers valuable insights for understanding potential mechanisms. Studies on special economic zones and regional development initiatives demonstrate that such policies can generate significant spillover effects on local business practices and regulatory environments. Zhang et al. [32] determined that pilot free trade zones promote digital industry innovation through channels such as accelerating knowledge accumulation and optimizing the business environment. The implementation of targeted policies often catalyzes improvements in local infrastructure, enhances regulatory frameworks, and elevates stakeholder expectations regarding corporate behavior. Cheng and Wang [33] analyzed sustainable development innovation demonstration zones, showing how such targeted policies can promote corporate green innovation, albeit sometimes leading to innovation distortion (“quantity increase but quality decrease”) in certain contexts. These changes can create powerful incentives for firms to improve their ESG performance through channels such as resource allocation, regulatory compliance, and stakeholder engagement. For example, policies that enhance a region’s reputation for sustainability can create market-based incentives for firms to differentiate themselves through superior ESG performance. Zhang and Jin [34] empirically verified that ESG performance promotes corporate green technology innovation, an effect stronger in state-owned enterprises and firms with high technology levels.
While some studies have begun to explore the impact of broader industrial policies on corporate environmental behavior, such as how energy-saving policies affect firm energy consumption [35] or how innovative industrial chain policies aim for an economy–environment win–win [36], the specific mechanisms linking cultural and tourism consumption policies to corporate ESG practices remain markedly underexplored. This is a critical gap, given that the culture and tourism industry possesses distinct characteristics including high visibility, a fundamental reliance on natural and cultural capital, and an inherent sensitivity to reputation, all of which may render them especially responsive to consumption-oriented policy signals.

2.3. DID Model Application Research

The difference-in-differences (DID) model stands as a cornerstone methodology for causal inference in policy evaluation, widely applied across diverse fields including public health [37], education [38], and increasingly, environmental and resource economics [39]. Its application leverages natural experiments created by policies implemented at different times or across different groups.
In the context of China’s policy experiments, the DID approach has been effectively employed to assess the impact of various initiatives. Studies frequently leverage the phased rollout of policies across cities or regions, creating natural treatment and control groups. For instance, research on the Low-Carbon City Pilot policy has utilized DID to analyze its effects on corporate green innovation [40] and overall ESG practices [41], demonstrating the model’s utility in capturing the micro-level impacts of broad environmental policies. Similarly, the method has been applied to examine how environmental regulations influence corporate green technology adoption [42], highlighting its strength in isolating policy effects from confounding factors.
The robustness of the DID method fundamentally hinges on satisfying the parallel trends assumption. This assumption is typically verified through pre-trend tests, event studies, and placebo tests, which help to establish a credible counterfactual for the scenario without the policy intervention [43,44]. Recent econometric advancements have focused on addressing challenges inherent in modern applications, particularly staggered policy adoption where treatment timing varies across units. Studies such as that of Baker et al. [45] have critically examined potential biases in staggered DID estimators and summarize robust alternative estimators developed to address these issues, emphasizing the importance of method selection for credible impact estimates. Furthermore, Marx et al. [46] explored the relationship between the parallel trends assumption and models of dynamic economic choice, clarifying when dynamic selection motives might lead to violations of this key assumption.
Beyond the basic two-way fixed effects model, applications have evolved to incorporate matching techniques to enhance comparability between groups. The Propensity Score Matching-DID (PSM-DID) model, for example, is used to mitigate selection bias concerns. Yuan [42] employed PSM-DID to investigate the nexus between environmental information disclosure and green development efficiency, showcasing how combining matching with DID can strengthen causal claims in settings where random assignment is absent. A critical best practice involves not only rigorously testing the parallel trends assumption, but also accounting for potential spillover effects between the treatment and control groups [46]. These methodological refinements are essential for producing reliable estimates of the policy impact.
When applying DID to evaluate the CTCP policy, it is crucial to consider the potential for heterogeneous treatment effects across different types of culture and tourism firms, as well as the possibility of anticipation effects in the periods leading up to the official policy announcement. The method’s strength lies in its ability to control for time-invariant unobserved characteristics and common temporal shocks, provided the parallel trends assumption holds [47]. The applicability of the DID framework in these analogous policy contexts demonstrates its efficacy for identifying the causal effect of the CTCP policy on corporate ESG performance, providing a robust methodological foundation for this study.

2.4. Research Gaps

A review of the existing literature reveals two primary gaps. First, while studies on the determinants of ESG are plentiful, often focusing on internal governance or broad regulatory pressures, there is limited research on the role of industry-specific demand-side policies, such as those promoting cultural consumption. Most existing work has examined supply-side regulations or financial incentives rather than policies aimed at stimulating sustainable consumption patterns [48]. Second, despite the prevalence of DID applications in policy analysis, few studies have leveraged this method to examine the micro-governance effects of tourism and culture policies on corporate sustainability performance. The existing literature provides a multi-layered foundation but leaves a clear gap. The specific impact of cultural and tourism consumption-driven policies on micro-level corporate ESG performance is not well understood. This gap is characterized by a lack of analysis concerning the underlying mechanisms and the heterogeneous effects across different types of firms. By integrating insights from institutional theory, stakeholder theory, and policy evaluation methodology, this research seeks to provide a comprehensive framework for understanding the micro-level impacts of consumption-oriented sustainability policies in the unique context of China’s culture and tourism industry.

3. Policy Background and Theoretical Analysis

3.1. Policy Background

The integrated development of culture and tourism represents a significant national strategy in China, deeply aligned with the objectives of economic transformation and consumer market upgrading [49]. Against the backdrop of post-pandemic recovery and the national dual-carbon goals, promoting high-quality cultural and tourism consumption has emerged as a crucial driver for sustainable economic growth.
To this end, in 2020, the Ministry of Culture and Tourism, together with the National Development and Reform Commission and the Ministry of Finance, launched a pivotal initiative to establish national cultural and tourism consumption demonstration cities. This policy aims to optimize the consumption environment, enrich the product supply, and stimulate market vitality through targeted support to selected cities. Crucially, it explicitly incorporates sustainability objectives, encouraging the development of green consumption practices, low-carbon tourism models such as eco-tourism and heritage protection tours, and the construction of energy-efficient facilities. Furthermore, it urges enterprises to strengthen their environmental management, fulfill their social responsibilities such as enhancing employee welfare and community engagement, and improve their internal governance standards. These directives create a direct and intentional link between policy incentives and the ESG dimensions of corporate performance.
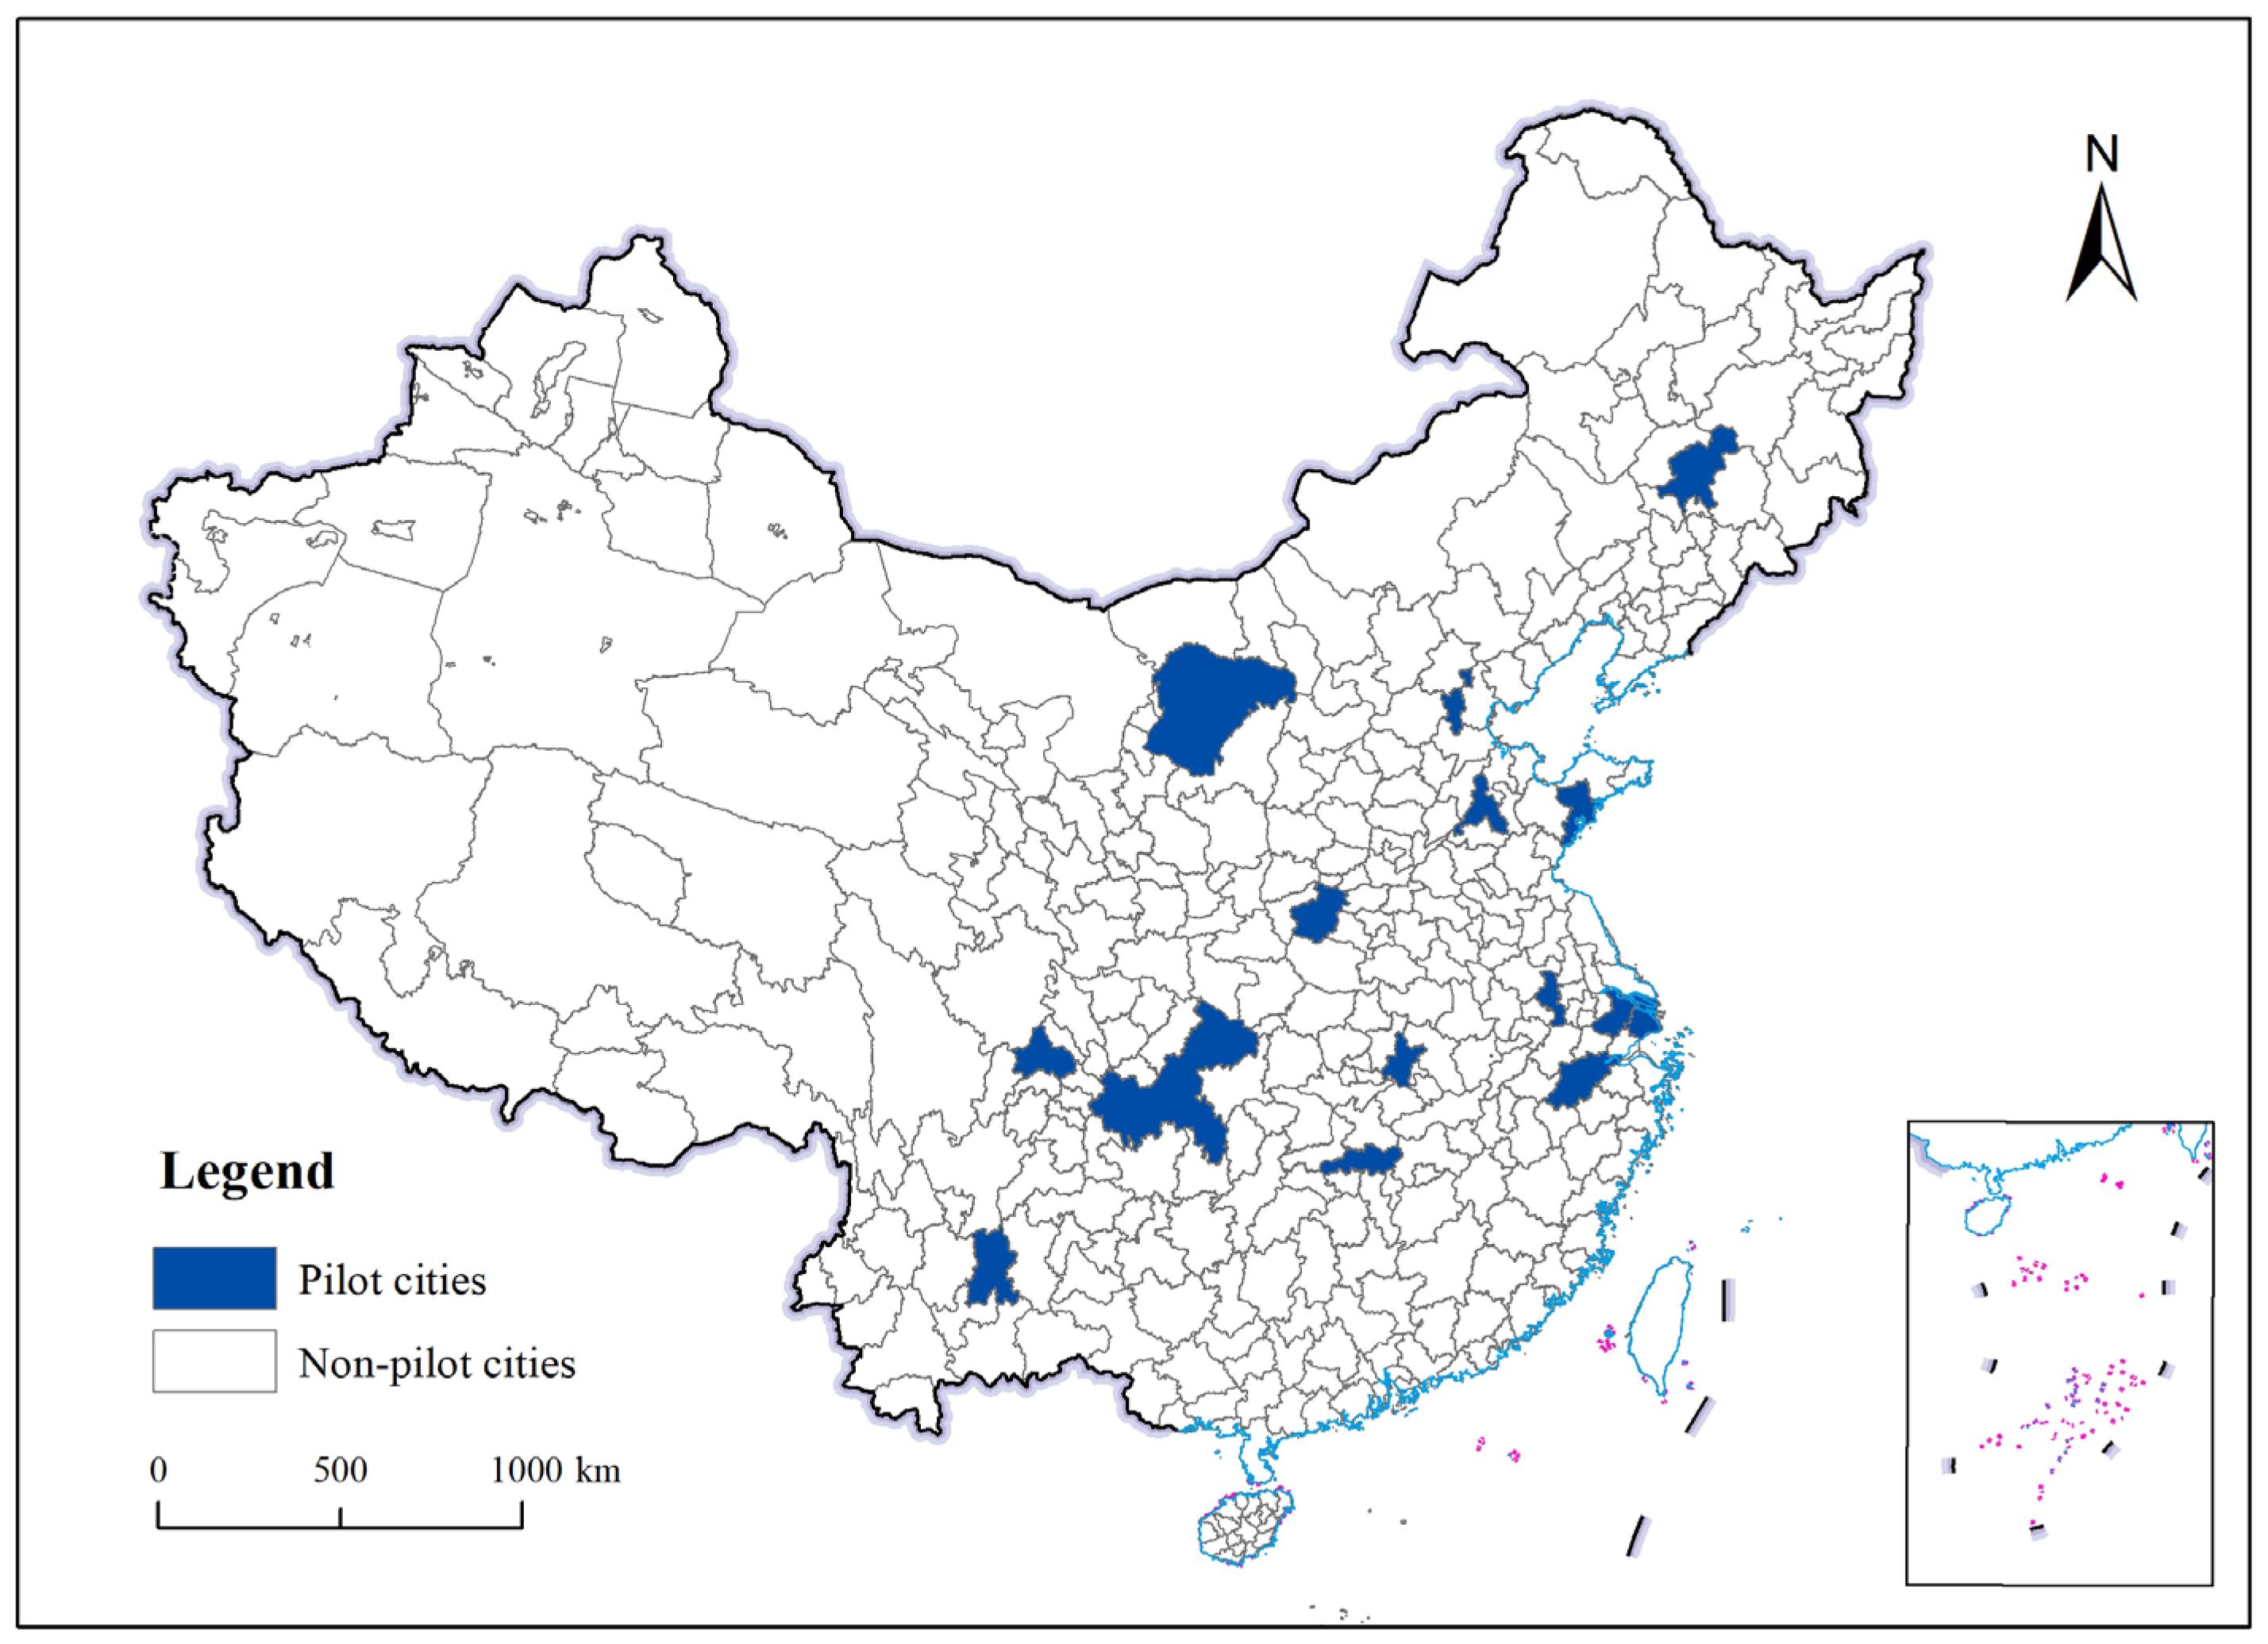
The first batch of 15 demonstration cities exhibits a broad geographical distribution, as illustrated in Figure 2. The selected cities span the eastern, central, and western regions of China, representing diverse economic development levels and tourism resource endowments. This spatial arrangement is not arbitrary; it helps to mitigate concerns about regional selection bias and enhances the external validity of our empirical findings. The variation in geographical coverage supports the key identification assumption in the DID approach.

3.2. Theoretical Analysis

3.2.1. Direct Effect

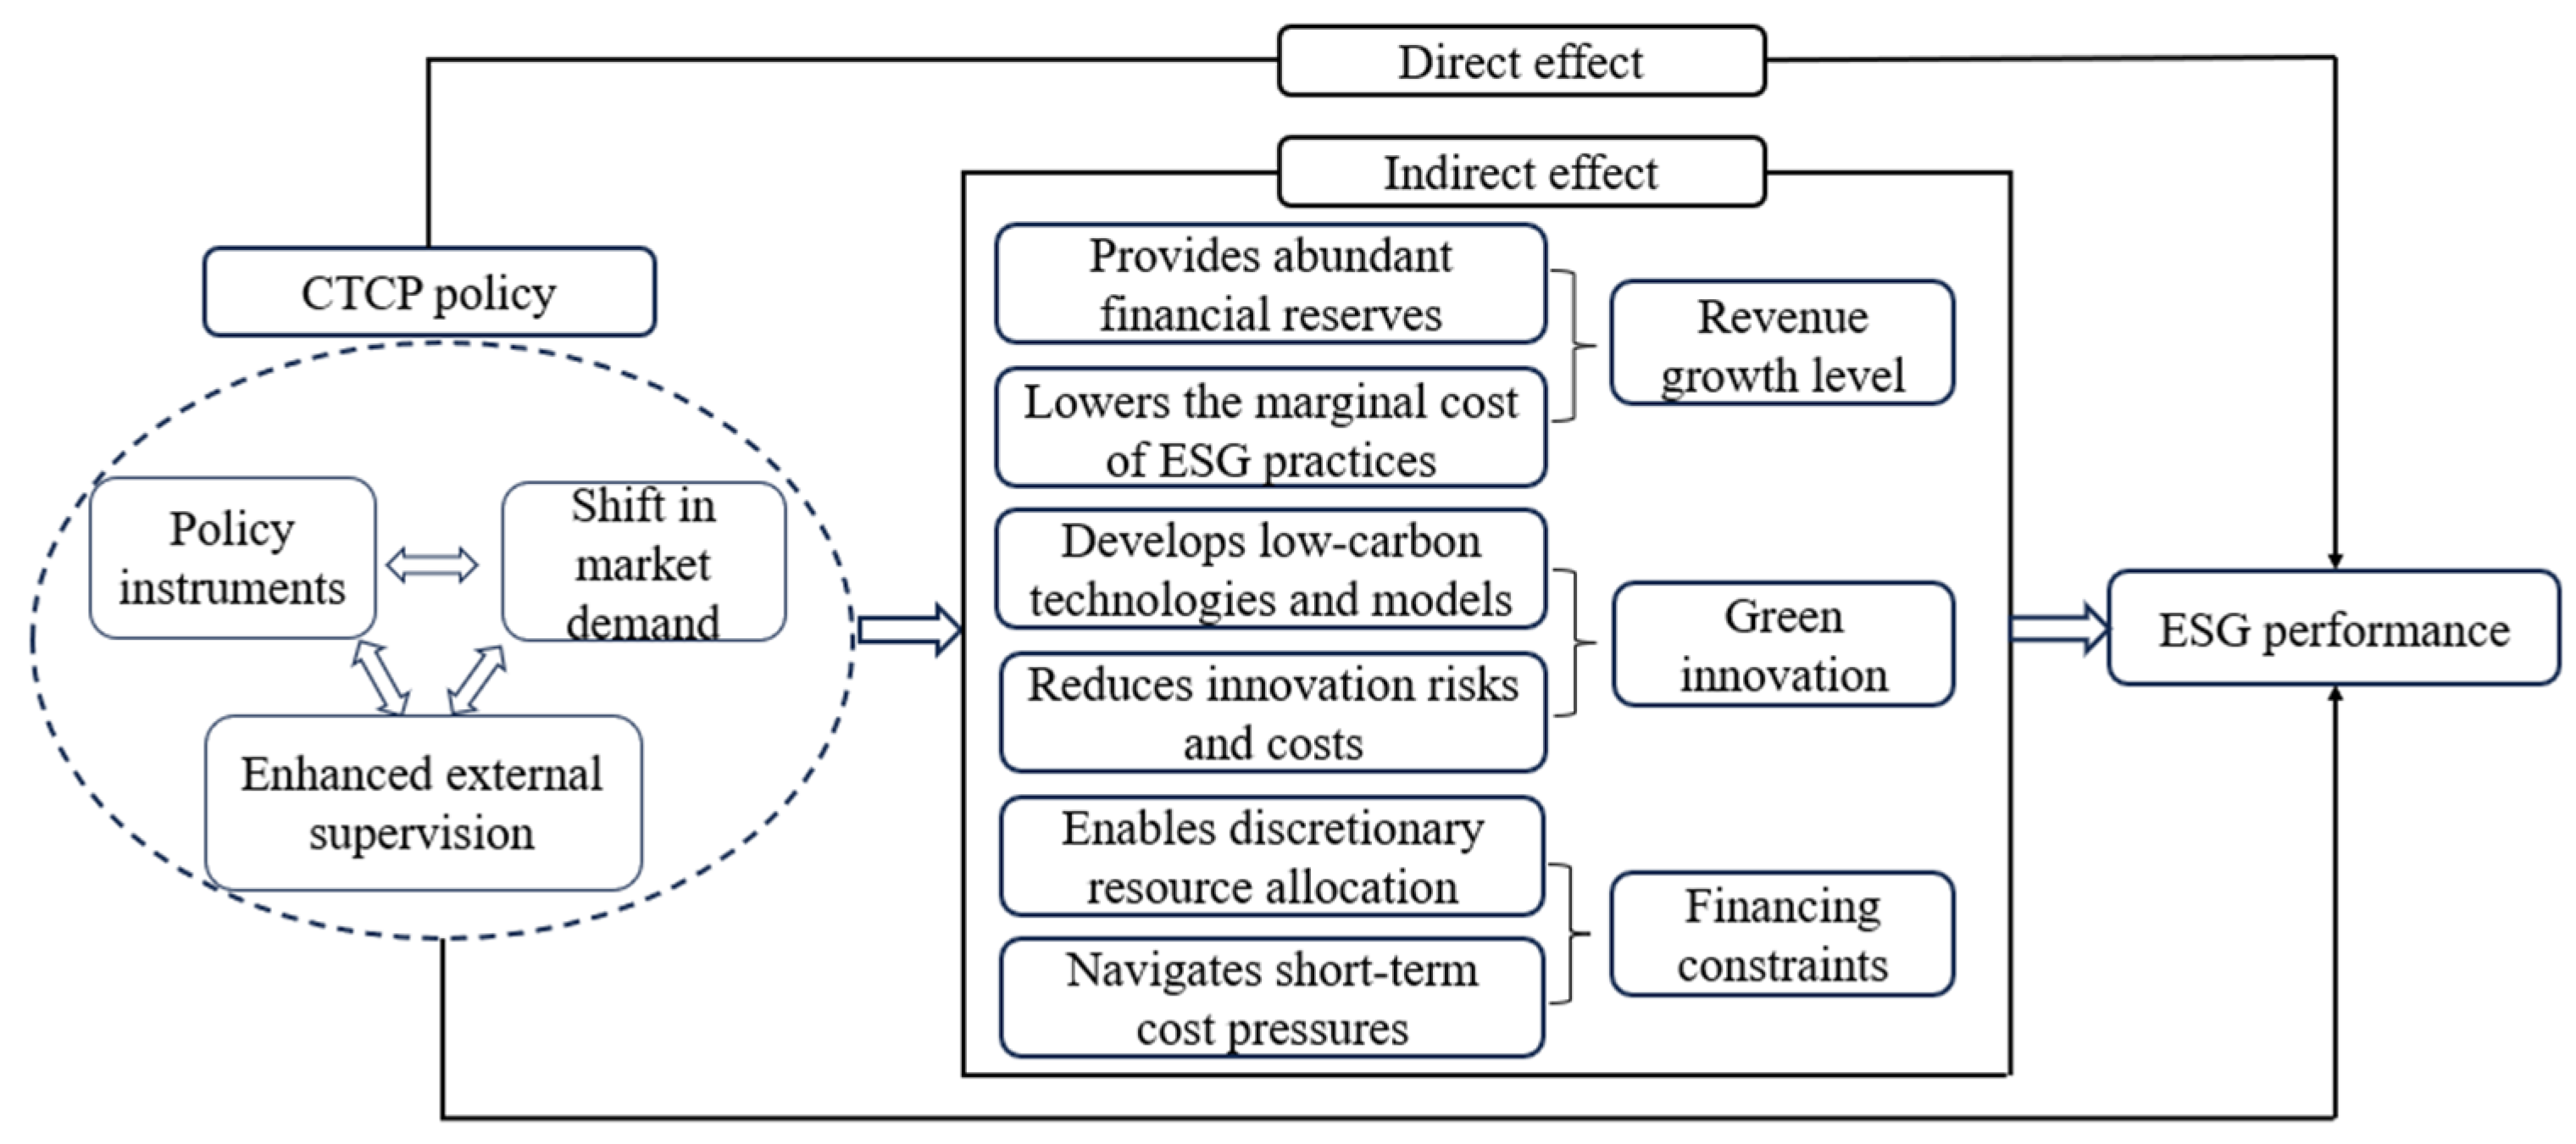
The CTCP policy likely shapes corporate ESG performance through a framework encompassing both direct and indirect channels, with varying effects anticipated across the E, S, and G dimensions. The direct influence of the policy arises from structured policy instruments and shifting market expectations. Cities awarded demonstration status typically receive concrete support measures, including financial incentives linked to environmental upgrades and service standardization, which reduce the cost for firms to allocate resources toward ESG-related areas [50]. Policy-driven incentives for fulfilling social responsibilities, along with guidance on standardized corporate governance, encourage firms to enhance their environmental management systems, improve their stakeholder relations, and optimize their internal decision-making processes.
From the perspective of the market environment, the policy’s activation of the cultural and tourism consumption market has elevated consumer awareness and the demand for high quality and sustainable experiences. In this context, a firm’s environmental friendliness and its fulfillment of social responsibilities have become increasingly critical factors influencing consumer choice [51]. Faced with this shifting competitive landscape, enterprises are motivated to proactively refine their ESG practices to attract discerning customers and to enhance their brand reputation. This confluence of market and policy pressures compels firms to integrate ESG concepts into their core operational strategies [52], fostering a more intrinsic motivation for improving ESG performance.
Furthermore, the increased visibility and positive branding ensuing from demonstration city status grant culture and tourism enterprises greater exposure. This increased visibility makes their ESG performance subject to intensified scrutiny from media, non-governmental organizations, and the public. To safeguard their corporate reputation and ensure long-term viability, enterprises are compelled to pay greater attention to the standardization of ESG information disclosure and the substance of their practices [53], thereby striving to avoid market trust crises triggered by ESG deficiencies. This external supervisory pressure acts as a reinforcing mechanism, solidifying the policy’s direct role in promoting corporate ESG performance. However, the policy’s direct impact is likely to be most immediate and pronounced on social performance. The policy’s emphasis on service standardization, consumer rights protection, and community engagement creates explicit and measurable benchmarks for firms to use to improve their social responsibilities. In contrast, improvements in environmental performance often require heavier capital investments in long-term infrastructure upgrades, while governance enhancements involve complex internal restructuring. These latter two dimensions may therefore exhibit a more delayed response or be contingent on additional firm-specific resources and capabilities. Based on this analysis, we propose the following hypothesis:
H1. 
The CTCP policy exerts a direct upgrading effect on corporate ESG performance.

3.2.2. Indirect Effect

Beyond the direct channels, the policy indirectly fosters ESG improvements through three core mediating mechanisms: revenue growth, green innovation, and the alleviation of financing constraints.
Corporate revenue growth. The CTCP policy primarily functions by activating consumption markets and expanding the overall scale of tourism and culture spending. This directly drives revenue growth for enterprises within these sectors. The increased revenue provides firms with more abundant financial reserves, which enables targeted investments across all ESG dimensions. Financially robust firms can allocate more resources to environmental protection facilities, enhance employee welfare and community engagement initiatives, and invest in better internal control systems and governance oversight mechanisms. The economies of scale derived from the revenue growth effectively lower the marginal cost of making such sustainable investments. With greater financial flexibility, enterprises can bolster investments in environmental protection facilities, advance the adoption of energy-saving technologies, enhance employee welfare programs, increase community engagement initiatives, and invest in better internal control systems and governance oversight. The economies of scale can also enable enterprises to distribute the fixed costs of ESG investments across a larger revenue base, effectively reducing the marginal cost of engaging in sustainable practices and encouraging further ESG development. Thus, the following is proposed:
H2a. 
CTCP policy can enhance corporate ESG performance by boosting corporate revenue growth.
Corporate green innovation. The CTCP policy guides market demand toward greener and more sustainable tourism products and experiences. This market shift pushes enterprises to innovate in response. New policy-supported consumption models such as eco-tourism and cultural heritage preservation tours necessitate environmentally friendly service technologies and operational models [54]. Green innovation in this sector is highly relevant and extends beyond manufacturing patents. It encompasses practical innovations in resource recycling, developing digital solutions to reduce physical resource use, implementing energy management systems for hotels and attractions, and creating sustainable supply chains. Applying these green innovations reduces the operational environmental footprint, directly boosting the environmental performance. Moreover, it enhances market appeal through differentiated sustainable offerings. The development and application of these green technologies and models constitute a direct improvement to the firm’s environmental performance. Successfully marketing these sustainable offerings enhances the brand reputation and fulfills the social expectation for responsible business conduct, thereby elevating the social performance. Furthermore, the process of managing innovation often necessitates improved R&D governance and cross-departmental collaboration, which can lead to positive spillover effects on the firm’s overall governance structure. Policy subsidies and incentives for green technology research and development further reduce the risks and costs associated with such corporate innovation endeavors [55], making firms more willing to allocate resources to these ESG-related fields. This synergistic effect between government policy and market mechanisms [56] fosters a positive cycle where innovation improves performance, which in turn strengthens the market position. Thus, the following is proposed:
H2b. 
CTCP policy can elevate corporate ESG performance by incentivizing corporate green innovation.
Corporate financing constraints. The implementation of the CTCP policy signals government endorsement and enhances the perceived market stability and growth potential of culture and tourism enterprises within demonstration cities. This reduces the perceived risks for investors and creditors. The policy’s endorsement effect can make it easier for these firms to secure financing support. Eased financing constraints allow enterprises greater discretion in resource allocation [57]. This financial flexibility enables managers to channel funds towards ESG-related projects that might have longer payback periods, such as environmental upgrades, socially responsible programs, and governance structure improvements. Consequently, eased financing constraints empower firms to undertake substantive actions that improve all three pillars of ESG. They can invest in pollution control and energy efficiency, launch long-term employee and community welfare programs, and fund governance enhancements such as independent director training and sustainability management systems. This financial support is crucial for navigating the high upfront costs associated with a comprehensive ESG transformation. Sufficient financial support also helps firms navigate the short-term cost pressures associated with ESG investments [58], preventing these initiatives from being halted due to liquidity shortages and ensuring their continuity. Thus, the following is proposed:
H2c. 
CTCP policy can improve corporate ESG performance by easing corporate financing constraints.
Based on the above analysis, this study presents a path diagram illustrating the impact of the CTCP policy on corporate ESG performance (Figure 3).

4. Methodology

4.1. Model Setting

To examine the impact of the CTCP policy on corporate ESG performance, this paper draws on the research design of [59] to construct the following Equation (1):
e s g i t = α 0 + α 1 p o l i c y i t + j = 2 J α j C o n t r o l i t j + ω i + ω c + ω t + ε i t
In this equation, e s g i t serves as the dependent variable, representing the ESG performance level of a firm i in year t ; p o l i c y i t is the core independent variable, taking a value of 1 if the city where the firm i is located was designated as a cultural and tourism consumption demonstration city in year t , and 0 otherwise. α 1 denotes the core coefficient, which measures the actual effect of the CTCP policy on corporate ESG performance. C o n t r o l i t j denotes the control variables, which are included to account for other factors that may influence corporate ESG performance. ω i stands for firm fixed effects; ω c represents city fixed effects; ω t denotes year fixed effects. ε i t is the random error term.
Furthermore, to verify the mechanism through which the CTCP policy influences corporate ESG performance, this paper follows the approaches of [60,61] to develop the following mediating effect model based on Equation (1):
c h a n n e l i t = β 0 + β 1 p o l i c y i t + j = 2 J β j X i t j + μ i + μ c + μ t + ε i t
e s g i t = ϑ 0 + ϑ 1 c h a n n e l i t ^ + j = 2 J ϑ j X i t j + σ i + σ c + σ t + ε i t
In this context, c h a n n e l i t represents mediating variables, specifically including corporate revenue growth, green innovation, and financing constraints. c h a n n e l i t ^ denotes the predicted values of the mediating variables generated from the regression of Equation (2). The meanings of other variables remain consistent with those in Equation (1). Equation (3) presents the regression of the dependent variable e s g i t on c h a n n e l i t ^ . When both coefficient β 1 and coefficient ϑ 1 are statistically significant, it indicates that this channel is valid.

4.2. Variable Selection

4.2.1. Explained Variable

ESG performance of culture and tourism firms ( e s g ). Drawing on the methods of [62,63], and considering the characteristics of the culture and tourism industries as well as data availability, this paper selects Huazheng ESG ratings as the core indicator to measure the ESG performance of culture and tourism firms. A key strength of the Huazheng ESG rating system is its “industry importance matrix” for dynamic indicator weight adjustment. It differentiates key cultural and tourism issues like ecological impact and cultural resource utilization, aligning better with the sector’s ESG realities. This rating system categorizes corporate ESG performance into nine levels from low to high: C, CC, CCC, B, BB, BBB, A, AA, and AAA. In this paper, these nine levels are assigned scores from 1 to 9, respectively, to derive the corporate ESG performance score, where a higher score indicates better ESG performance of culture and tourism firms. To ensure the reliability of research conclusions, this paper also utilizes Huazheng ESG scores in the robustness test section to replace the aforementioned ratings as the dependent variable for re-estimation.

4.2.2. Core Explanatory Variable

The CTCP policy ( p o l i c y ). In this paper, the core explanatory variable refers to the implementation of the CTCP policy, specifically reflected in the establishment of national cultural and tourism consumption demonstration cities. In 2020, the Ministry of Culture and Tourism and two other departments jointly issued the Notice on Carrying Out Pilot Demonstration Work for Cultural and Tourism Consumption, designating 15 cities as the first batch of cultural and tourism consumption demonstration cities. The variable p o l i c y takes a value of 1 if a firm is located in a demonstration city and the observation year is 2020 or later; otherwise, it takes a value of 0.

4.2.3. Control Variables

To avoid endogeneity bias caused by omitted variables, this paper draws on the studies of [64,65,66] to select the following control variables: firm size ( s i z e ): measured by the natural logarithm of total assets at the end of the year. Firm age ( a g e ): calculated as the natural logarithm of (current year minus listing year plus 1). Financial leverage ( l e v ): expressed as total liabilities divided by total assets. Cash flow level ( c a s h ): gauged by net cash flow from operating activities divided by total assets. Growth capability ( t o b i n ): characterized by Tobin’s Q to reflect market expectations and development potential. Capital intensity ( c a p ): computed as the ratio of total assets to operating income. Ownership concentration ( t o p 1 ): measured by the shareholding ratio of the largest shareholder. Independent director supervision ( i n d e p ): determined by the proportion of independent directors in the total number of board members.

4.2.4. Mediating Variables

Based on the analysis of channels through which the CTCP policy affect corporate ESG performance, this paper selects three mediating variables: revenue growth ( g r o w ), green innovation ( g i n n ), and financing constraints ( f c o n ).
Revenue growth is measured as (current year’s operating income/previous year’s operating income) −1, reflecting changes in corporate operating performance through the relative growth rate of current operating income compared to the previous period.
Green innovation is measured by the green transformation index, which is constructed based on the frequency of green-related keywords appearing in corporate annual reports. Following the method of [67], we identify 113 keywords related to green initiatives, strategic concepts, technological innovation, pollution control, and monitoring management. The index is calculated as the natural logarithm of the total keyword frequency plus one.
Following the methodology of [68], corporate financing constraints are measured using the W W index. This choice is motivated by recent empirical evidence suggesting that the WW index demonstrates superior performance in characterizing the financing constraints of Chinese listed firms compared to alternative measures such as the KZ or SA indices [69]. The WW index is theoretically grounded in a structural model of investment and captures a broader set of financial dynamics, including cash flow, dividend policies, leverage, and growth opportunities.

4.3. Data Description

This paper selects A-share-listed culture and tourism firms in China’s Shanghai and Shenzhen stock exchanges from 2011 to 2024 as the research sample. To ensure the validity and representativeness of sample data, screening is conducted based on the following criteria: (1) According to the National Bureau of Statistics’ Classification of Cultural and Related Industries (2018) and National Classification of Tourism and Related Industries (2018), culture and tourism firms engaged in integrated tourism services, cultural and artistic services, and tourism and entertainment are selected; (2) Samples of listed companies with abnormal financial conditions, such as those labeled ST or *ST, are excluded; (3) Samples with missing key financial data or ESG rating data are eliminated. After the above screening, a balanced panel dataset of 153 listed culture and tourism firms is finally determined. Data used in this paper are sourced from the Wind Financial Terminal, China Stock Market & Accounting Research Database (CSMAR), EPS Data Terminal, and CNPD database. To mitigate the impact of extreme values, all continuous variables are winsorized at the 1% and 99% quantiles. Descriptive statistics of key variables are presented in Table 1.

4.4. Correlation Matrix

Prior to the benchmark regression, we conducted preliminary statistical analyses to ensure the robustness of our data and mitigate potential econometric issues. First, we assessed potential multicollinearity among the independent variables. As presented in the correlation matrix (Table 2), the pairwise correlation coefficients are generally low. To more rigorously diagnose multicollinearity, we computed the Variance Inflation Factor (VIF) for all variables. The results show that the maximum VIF is 1.65 and the mean VIF is 1.23, both well below the common threshold of 10. This indicates that severe multicollinearity is not a concern in our model specification. Second, regarding stationarity, our dataset is a balanced short panel with a limited time dimension (T = 14) and a larger cross-sectional dimension (N = 153). In such micro-econometric settings, the inclusion of firm fixed effects ( ω i ) accounts for time-invariant firm-specific characteristics, while city fixed effects ( ω c ) control for time-constant city-level attributes. Year fixed effects ( ω t ), meanwhile, capture common temporal shocks and aggregate trends across all observations. This specification of the three-way fixed effects model further strengthens the robustness of our estimation by addressing unobserved heterogeneity at multiple levels, thereby effectively mitigating concerns related to non-stationarity that are more prevalent in macroeconomic time series analysis.

5. Empirical Results

5.1. Benchmark Regression

Table 3 displays the estimation results derived from Equation (1), aiming to test the actual impact of the CTCP policy on corporate ESG performance. Column (1) presents the regression results without the control variables or fixed effects; Column (2) incorporates the firm, city, and year fixed effects; Column (3) includes the control variables but omits the fixed effects; and Column (4) simultaneously controls for both the control variables and fixed effects to comprehensively rule out interference from other factors. The estimated coefficient for the core explanatory variable p o l i c y is positive and achieves statistical significance across all models. This indicates that the CTCP policy boosts the ESG performance of culture and tourism firms, consistent with [70]. Specifically, the implementation of this policy has increased the ESG performance of culture and tourism firms by approximately 18.1%. Following the establishment of a positive average treatment effect, we conducted a battery of robustness checks to ensure the reliability of this finding.
Table 4 reveals the heterogeneous effects of the CTCP policy across different ESG dimensions. It induces a statistically significant enhancement in social performance, while its effects on the environmental and governance dimensions, though positive, are not substantial. This heterogeneity in outcomes appears unlikely to arise from model misspecification or measurement error. Instead, it aligns logically with the policy’s inherent mechanisms and the nature of corporate responses. The core objectives of the CTCP policy revolve around stimulating consumption markets, enhancing service quality, and optimizing the tourism environment. These goals are directly and immediately linked to social performance aspects such as employee welfare, community engagement, and consumer protection. Consequently, the policy’s effect manifests most pronouncedly in the S dimension. In contrast, improvements in environmental performance are often contingent upon long-term investments in facility upgrades and technological innovation, which involve longer gestation periods and higher costs. Similarly, enhancing governance performance necessitates deep-seated structural changes in board composition and internal control mechanisms. These areas are subject to stronger organizational inertia and are inherently less responsive to short-term external policy shocks.
Therefore, this policy primarily promotes social performance without immediately translating into significant environmental or governance benefits, highlighting the complexity of corporate ESG behavior and strengthening the validity of our empirical conclusions.

5.2. Robustness Tests

5.2.1. Parallel Trend Test

A critical prerequisite for the validity of the DID model is satisfying the parallel trend assumption, which requires that the ESG performance of the treatment and control groups should exhibit similar changing trends before policy implementation [71]. This paper employs event study methodology to test the parallel trend, constructing the following Equation (4):
e s g i t = α 0 + k = 9 3 β k p o l i c y i t k + j = 1 J β j X i t j + ω i + ω c + ω t + ε i t
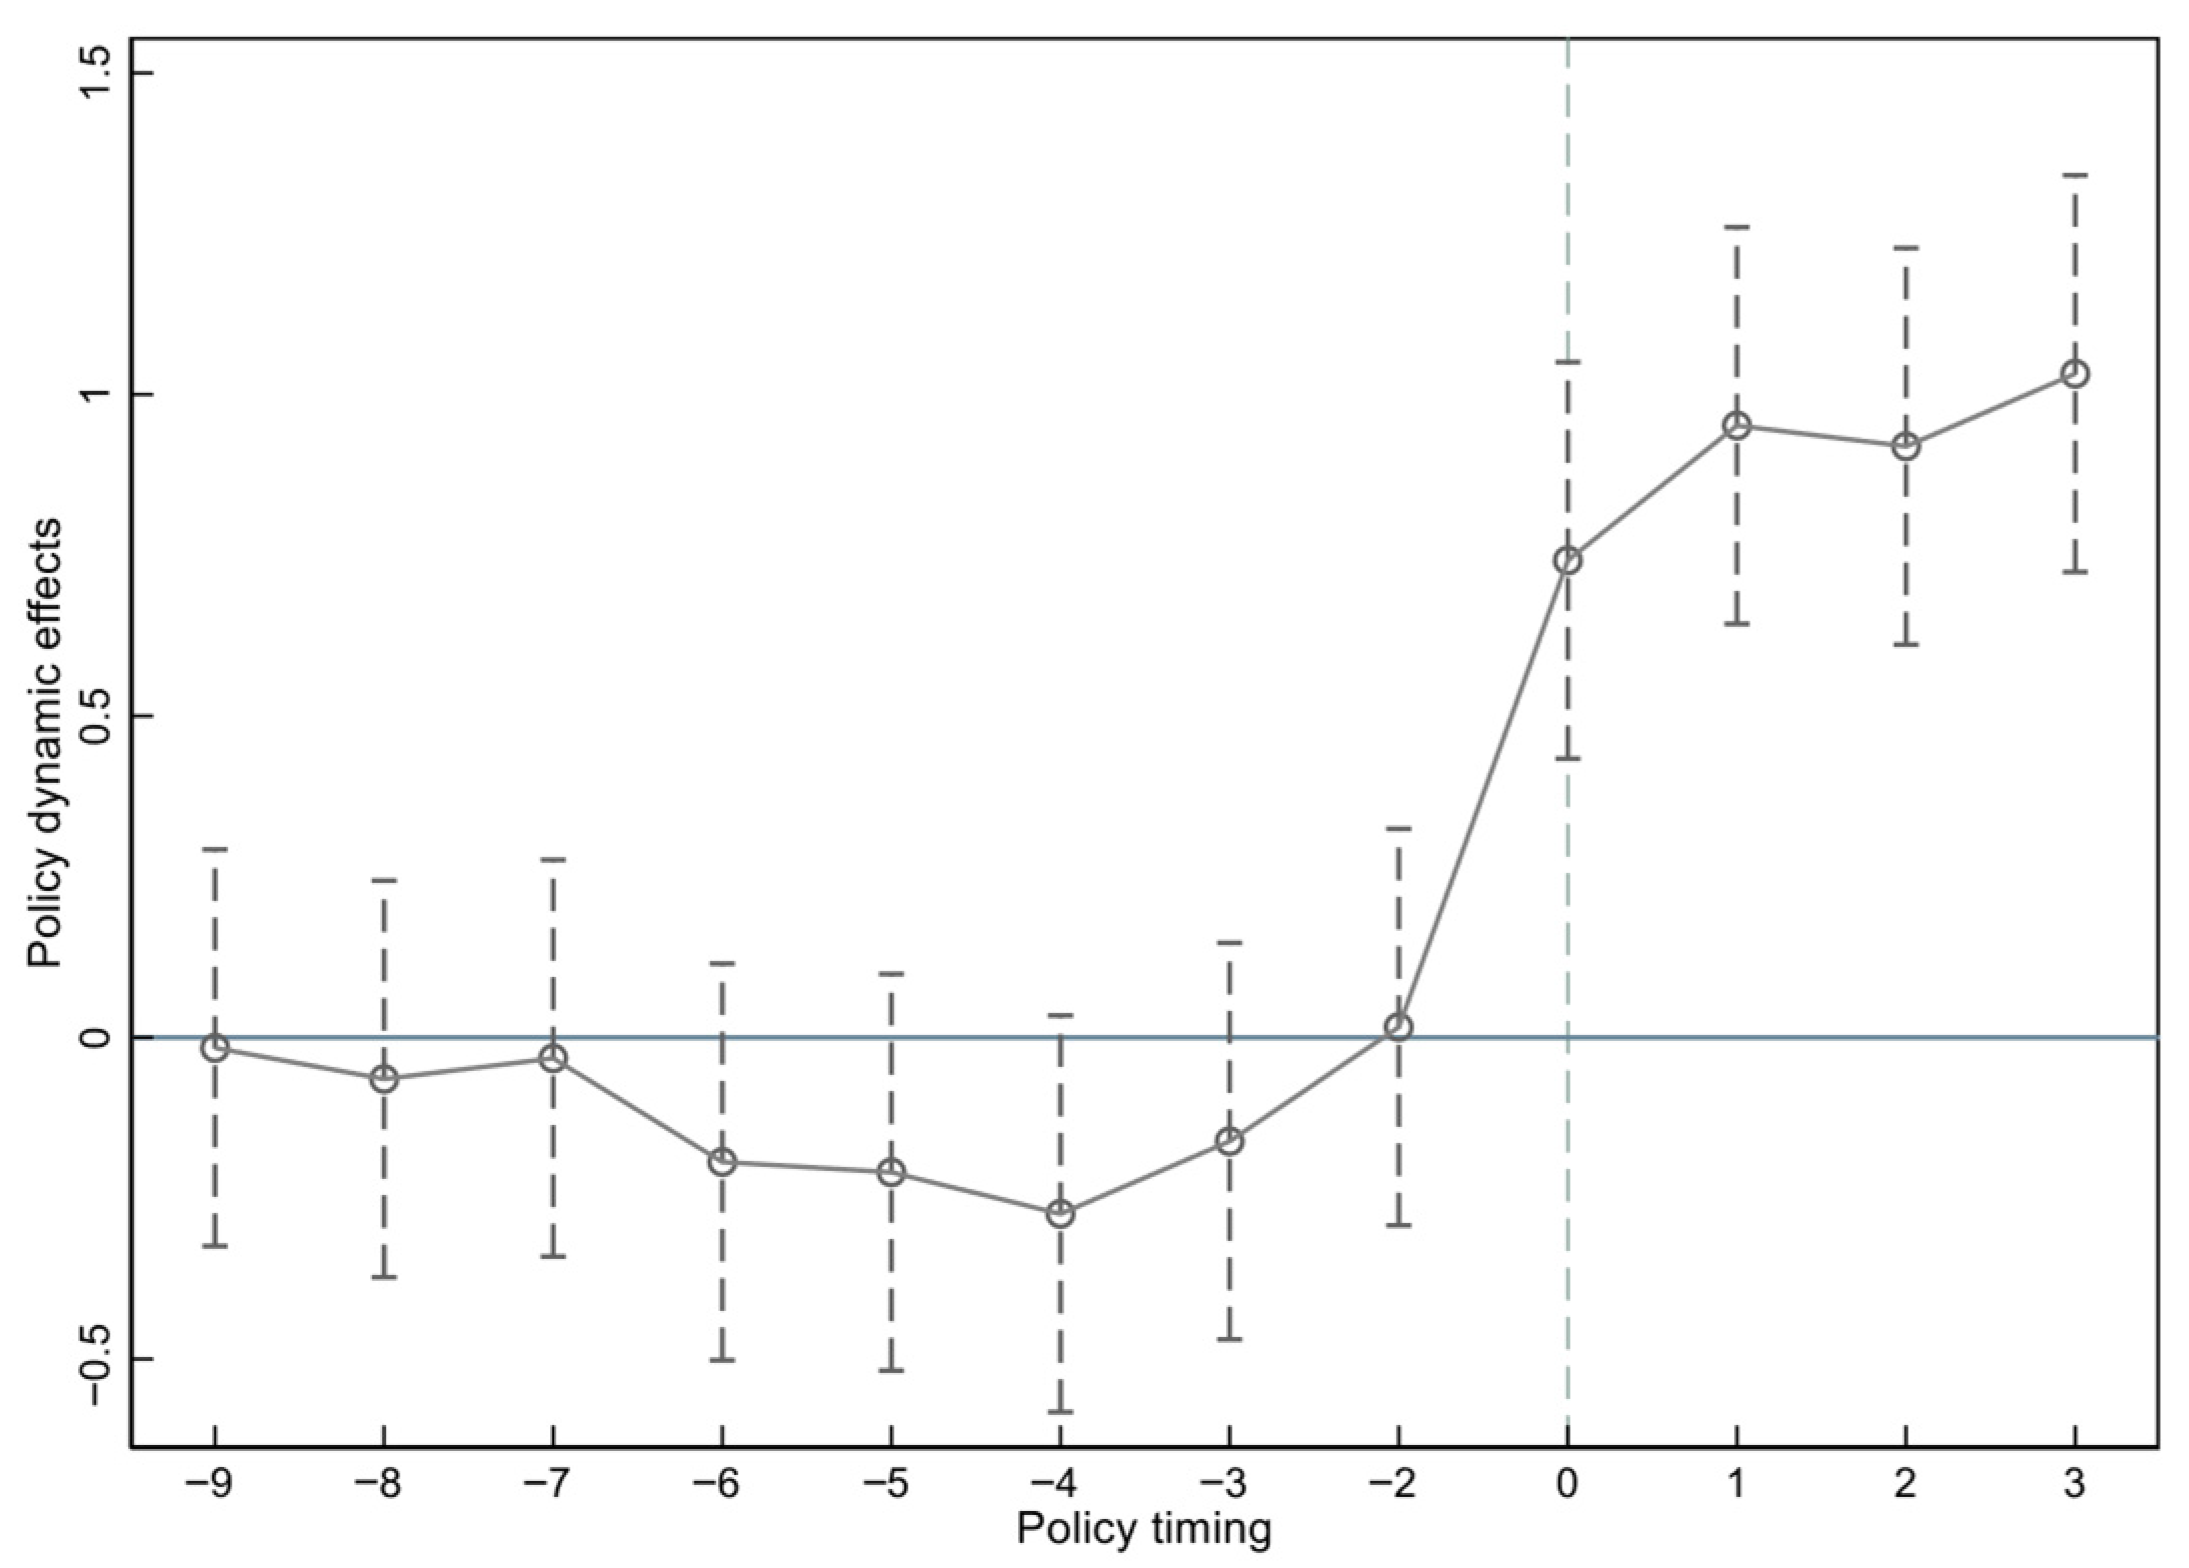
Here, p o l i c y i t k is a dummy variable, which takes a value of 1 if firm i is in the | k | th year before or the k th year after the policy implementation, and 0 otherwise. Specifically, k   <   0 denotes the | k | th year before the policy implementation, while k   >   0 denotes the k th year after the policy implementation. The 1st year before the policy implementation ( k   =   1 ) is set as the base period and thus omitted from the model.
Figure 4 illustrates the difference in coefficients in ESG performance between the treatment group and the control group for each period before and after the policy’s implementation, as well as their 95% confidence intervals. The horizontal axis represents the years relative to the policy’s implementation (where   k   =   9 ,   8 ,   , + 2 ,   + 3 ), with k   =   1 serving as the omitted reference period. Prior to the policy’s enactment, the coefficients for relative time dummies are statistically indistinguishable from zero. Their 95% confidence intervals cross the zero axis, indicating statistical insignificance. This implies that the performance in the treatment and control groups was consistent before the implementation of the CTCP policy, satisfying the parallel trend assumption. In the year of policy implementation and all subsequent periods, the estimated coefficients are significantly positive and exhibit a gradual increasing trend, with 95% confidence intervals that do not cross zero. This demonstrates that, after the policy’s implementation, the ESG performance of firms in demonstration cities improved significantly compared to those in non-demonstration cities and the policy effect exhibits a characteristic of continuous enhancement. This result provides robust trend-based evidence for the positive impact of the CTCP policy on corporate ESG performance.
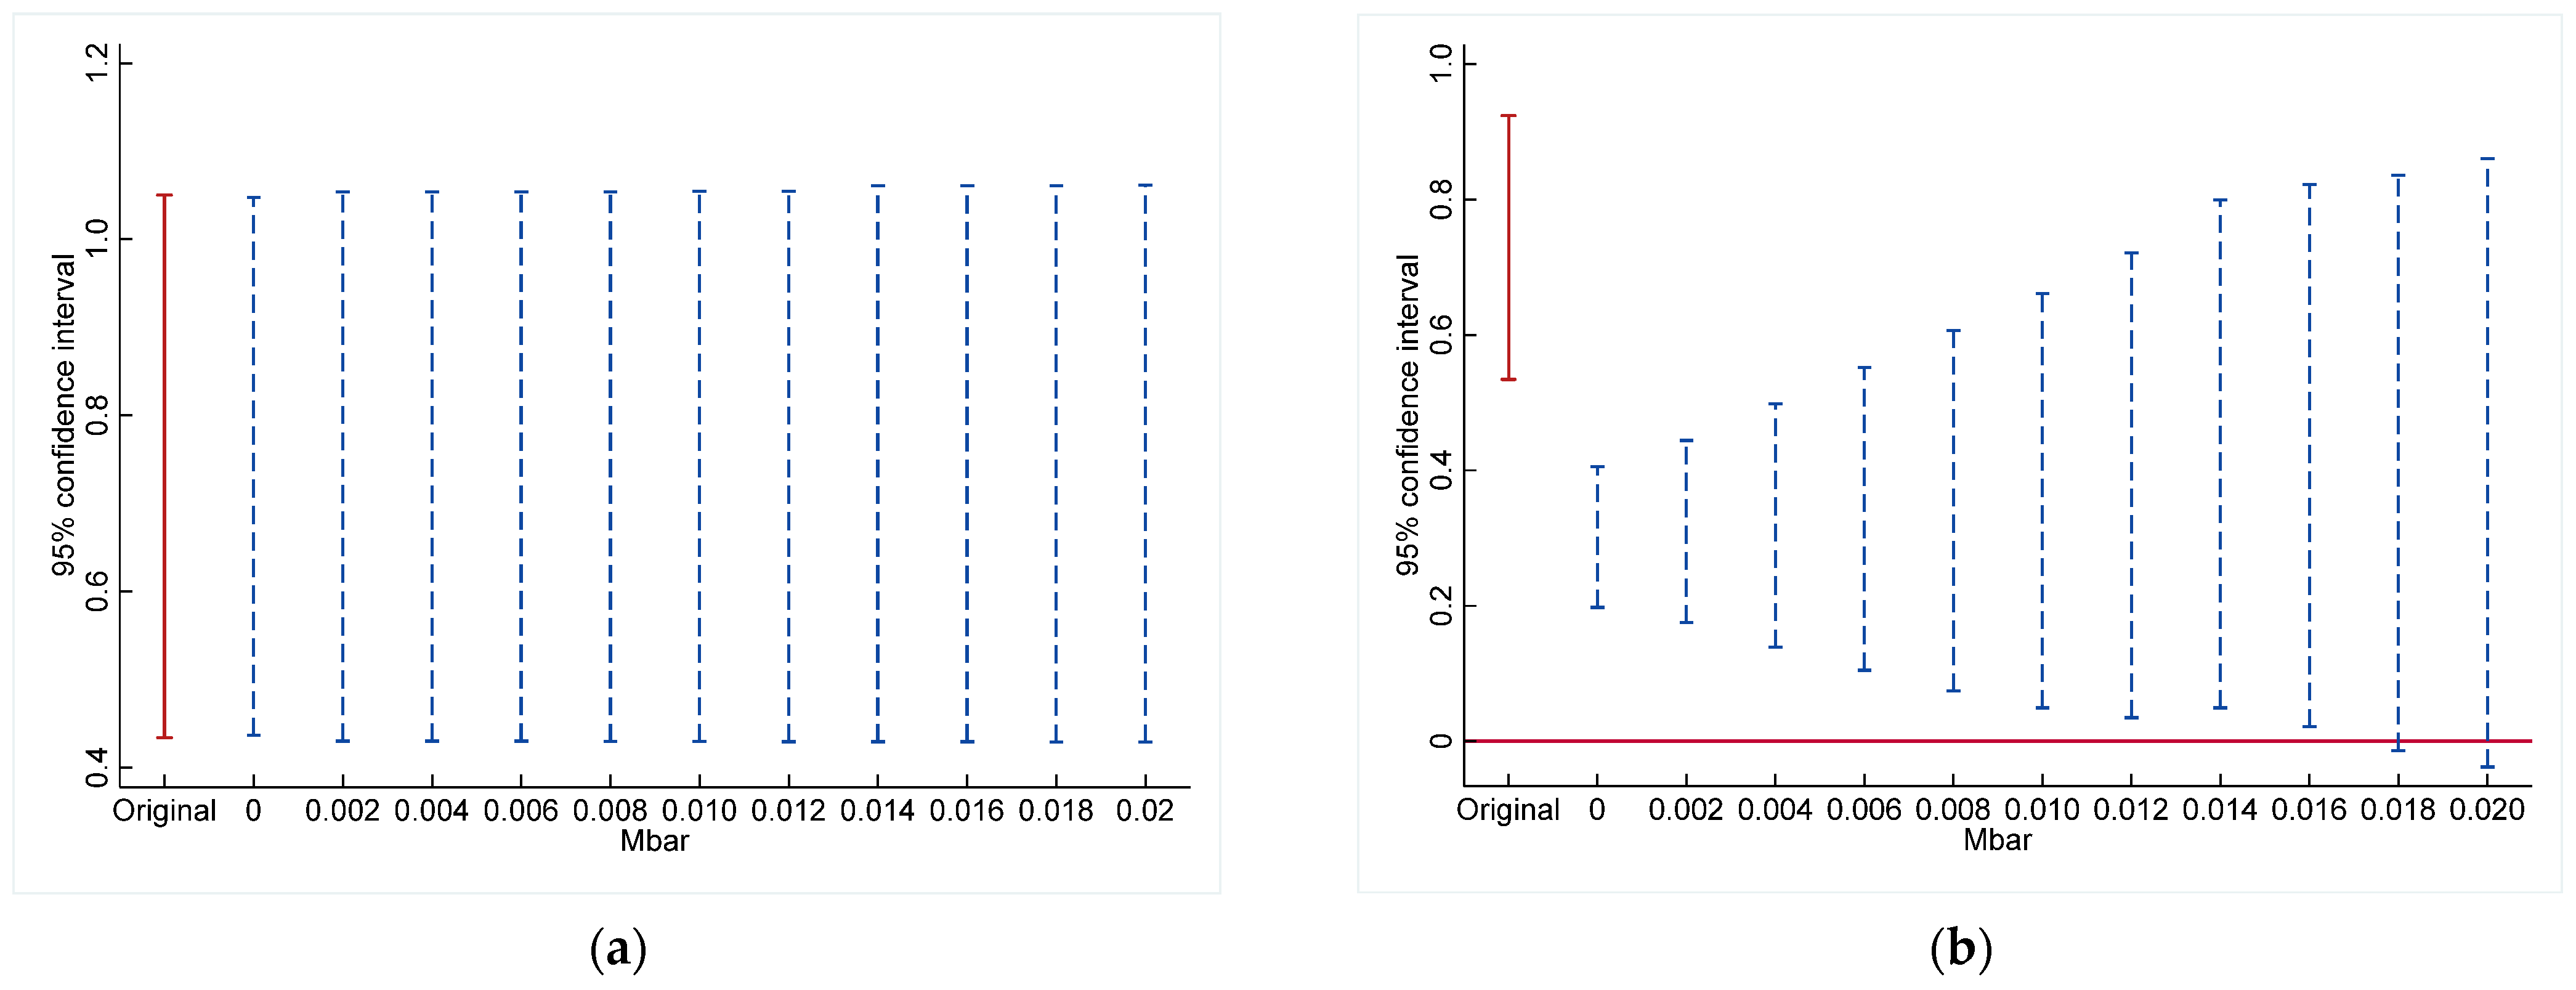
The parallel trend test in the traditional DID model may have insufficient statistical power [72]; therefore, this study further adopted the method proposed by [73] to conduct a sensitivity analysis, thereby enhancing the robustness of the research conclusions. Figure 5 shows the sensitivity test results for the confidence interval of the post-policy treatment effect estimates, which vary with the degree of deviation from the parallel trend assumption. The analysis indicates that, within the allowable range of deviation, the estimated treatment effects after policy implementation remain statistically significant. Under the relative deviation limit, the promoting effect of the CTCP policy on the ESG performance of culture and tourism enterprises remains robust. Moreover, under the smoothing limit, even if the pre-trend deviates downward by 0.016, the parallel trends result remains relatively stable. This demonstrates that even if there is some degree of deviation from the parallel trend, the promoting effect of the CTCP policy on the ESG performance of culture and tourism firms remains robust.

5.2.2. Placebo Test

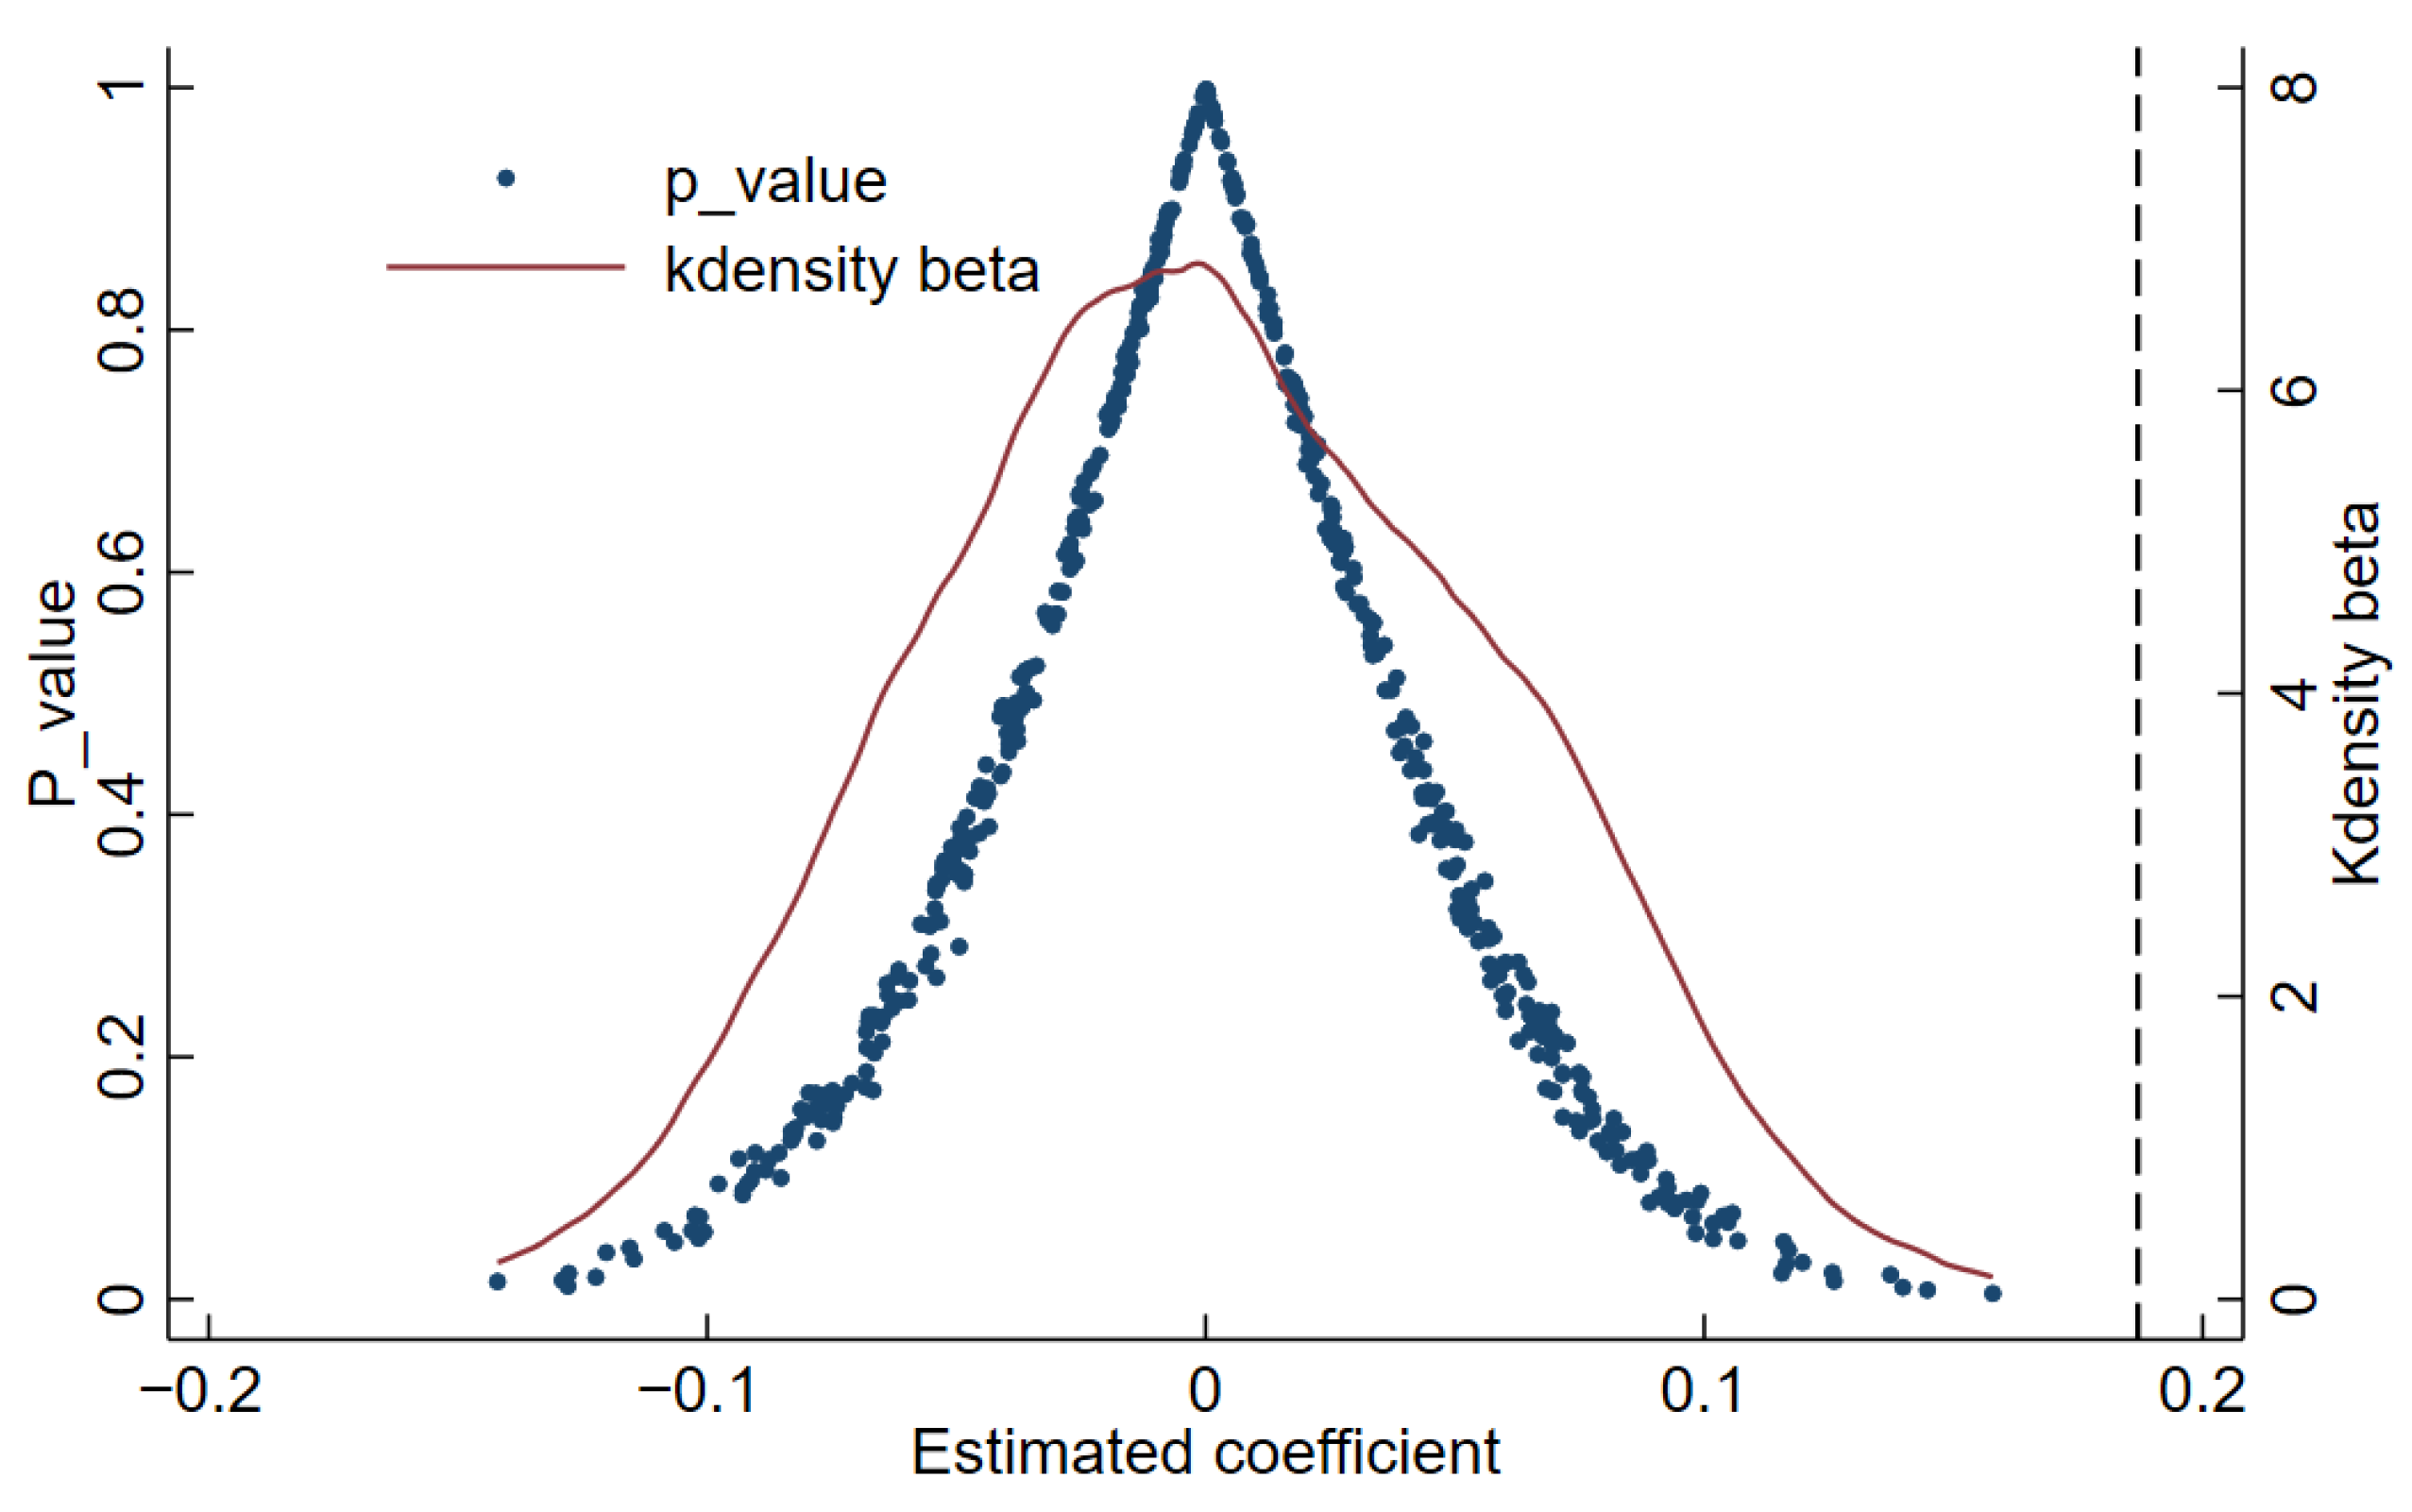
To rule out interference from unobservable factors or random perturbations on the estimation results, we conducted a placebo test using the permutation method, a common approach for individual-level placebo tests in the DID literature [74]. The procedure involves randomly reassigning the treatment status, specifically the binary indicator of whether a city is designated as a demonstration city, among all the sample cities while preserving the actual number of treated cities. This creates a pseudo-policy variable that, by construction, should have no actual causal effect. This process of randomization and estimation was replicated 500 times, with regressions performed based on Equation (1) each time, ultimately obtaining 500 sets of placebo coefficients and their corresponding p-values. The placebo test results are presented in Figure 6. The estimated coefficients from 500 random simulations exhibit an overall approximately normal distribution around zero, with most corresponding p-values clustering above 0.1. This suggests that under randomly assigned policy shocks, it is challenging to detect significant positive effects comparable to those observed in the baseline regression. Meanwhile, the actual regression’s core explanatory variable and its t-value lie to the right of the simulated coefficient distribution. This confirms that the CTCP policy’s positive ESG impact is not driven by random or unobservable factors, verifying the robustness of the baseline conclusion.

5.2.3. Endogeneity Issues

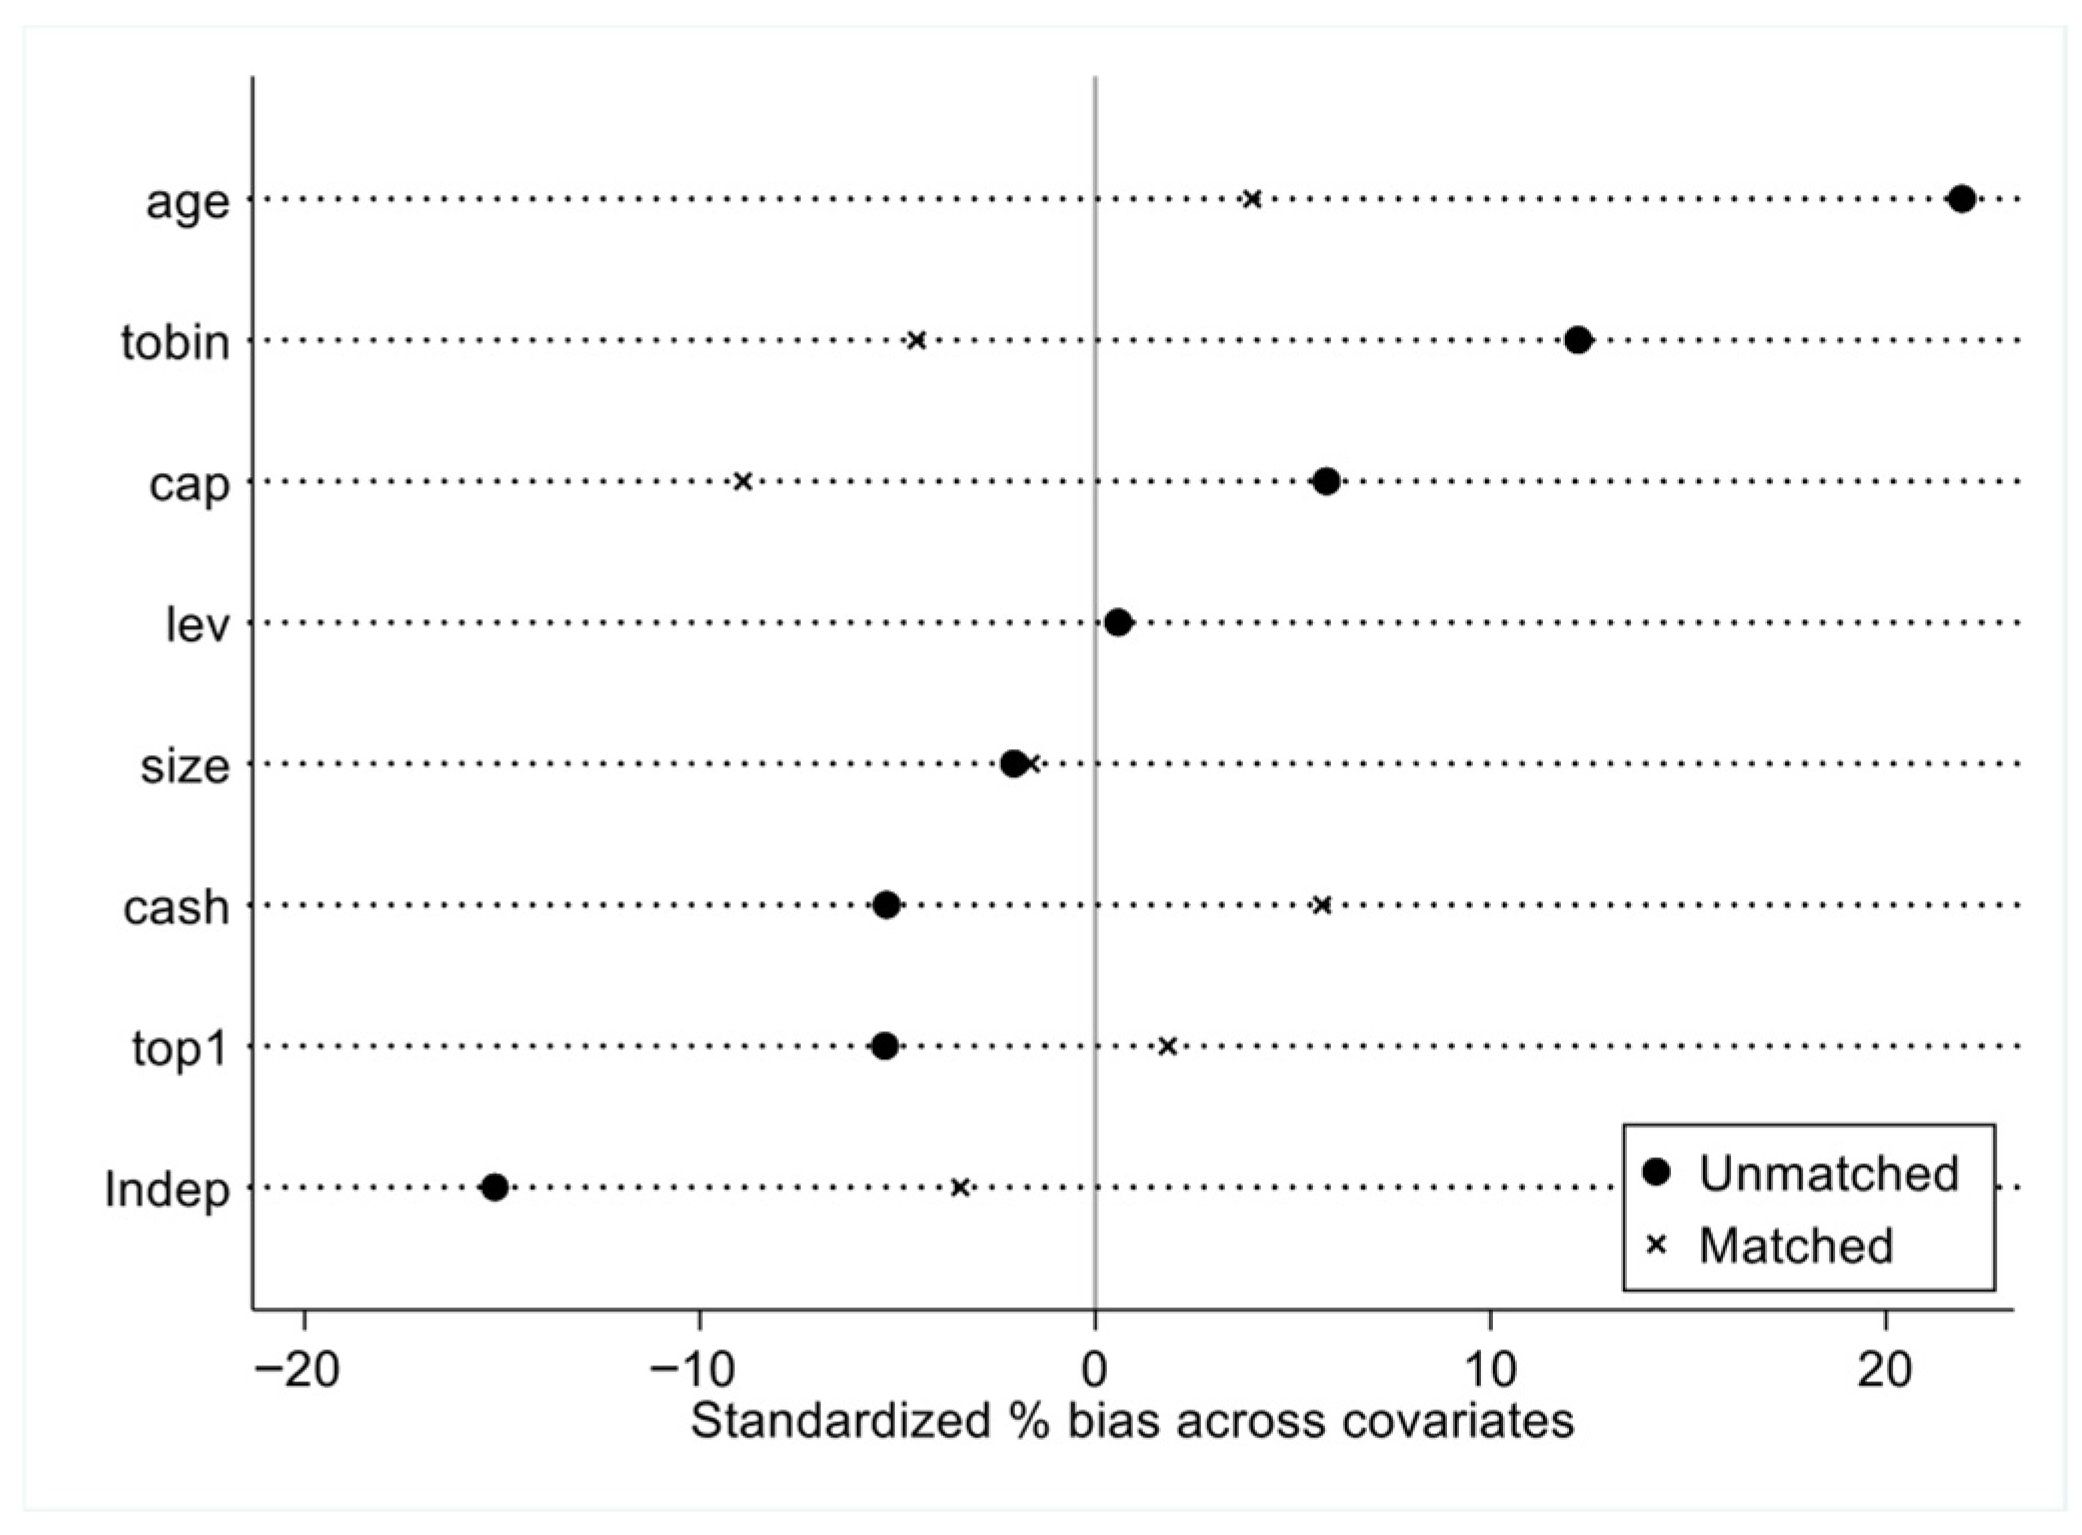
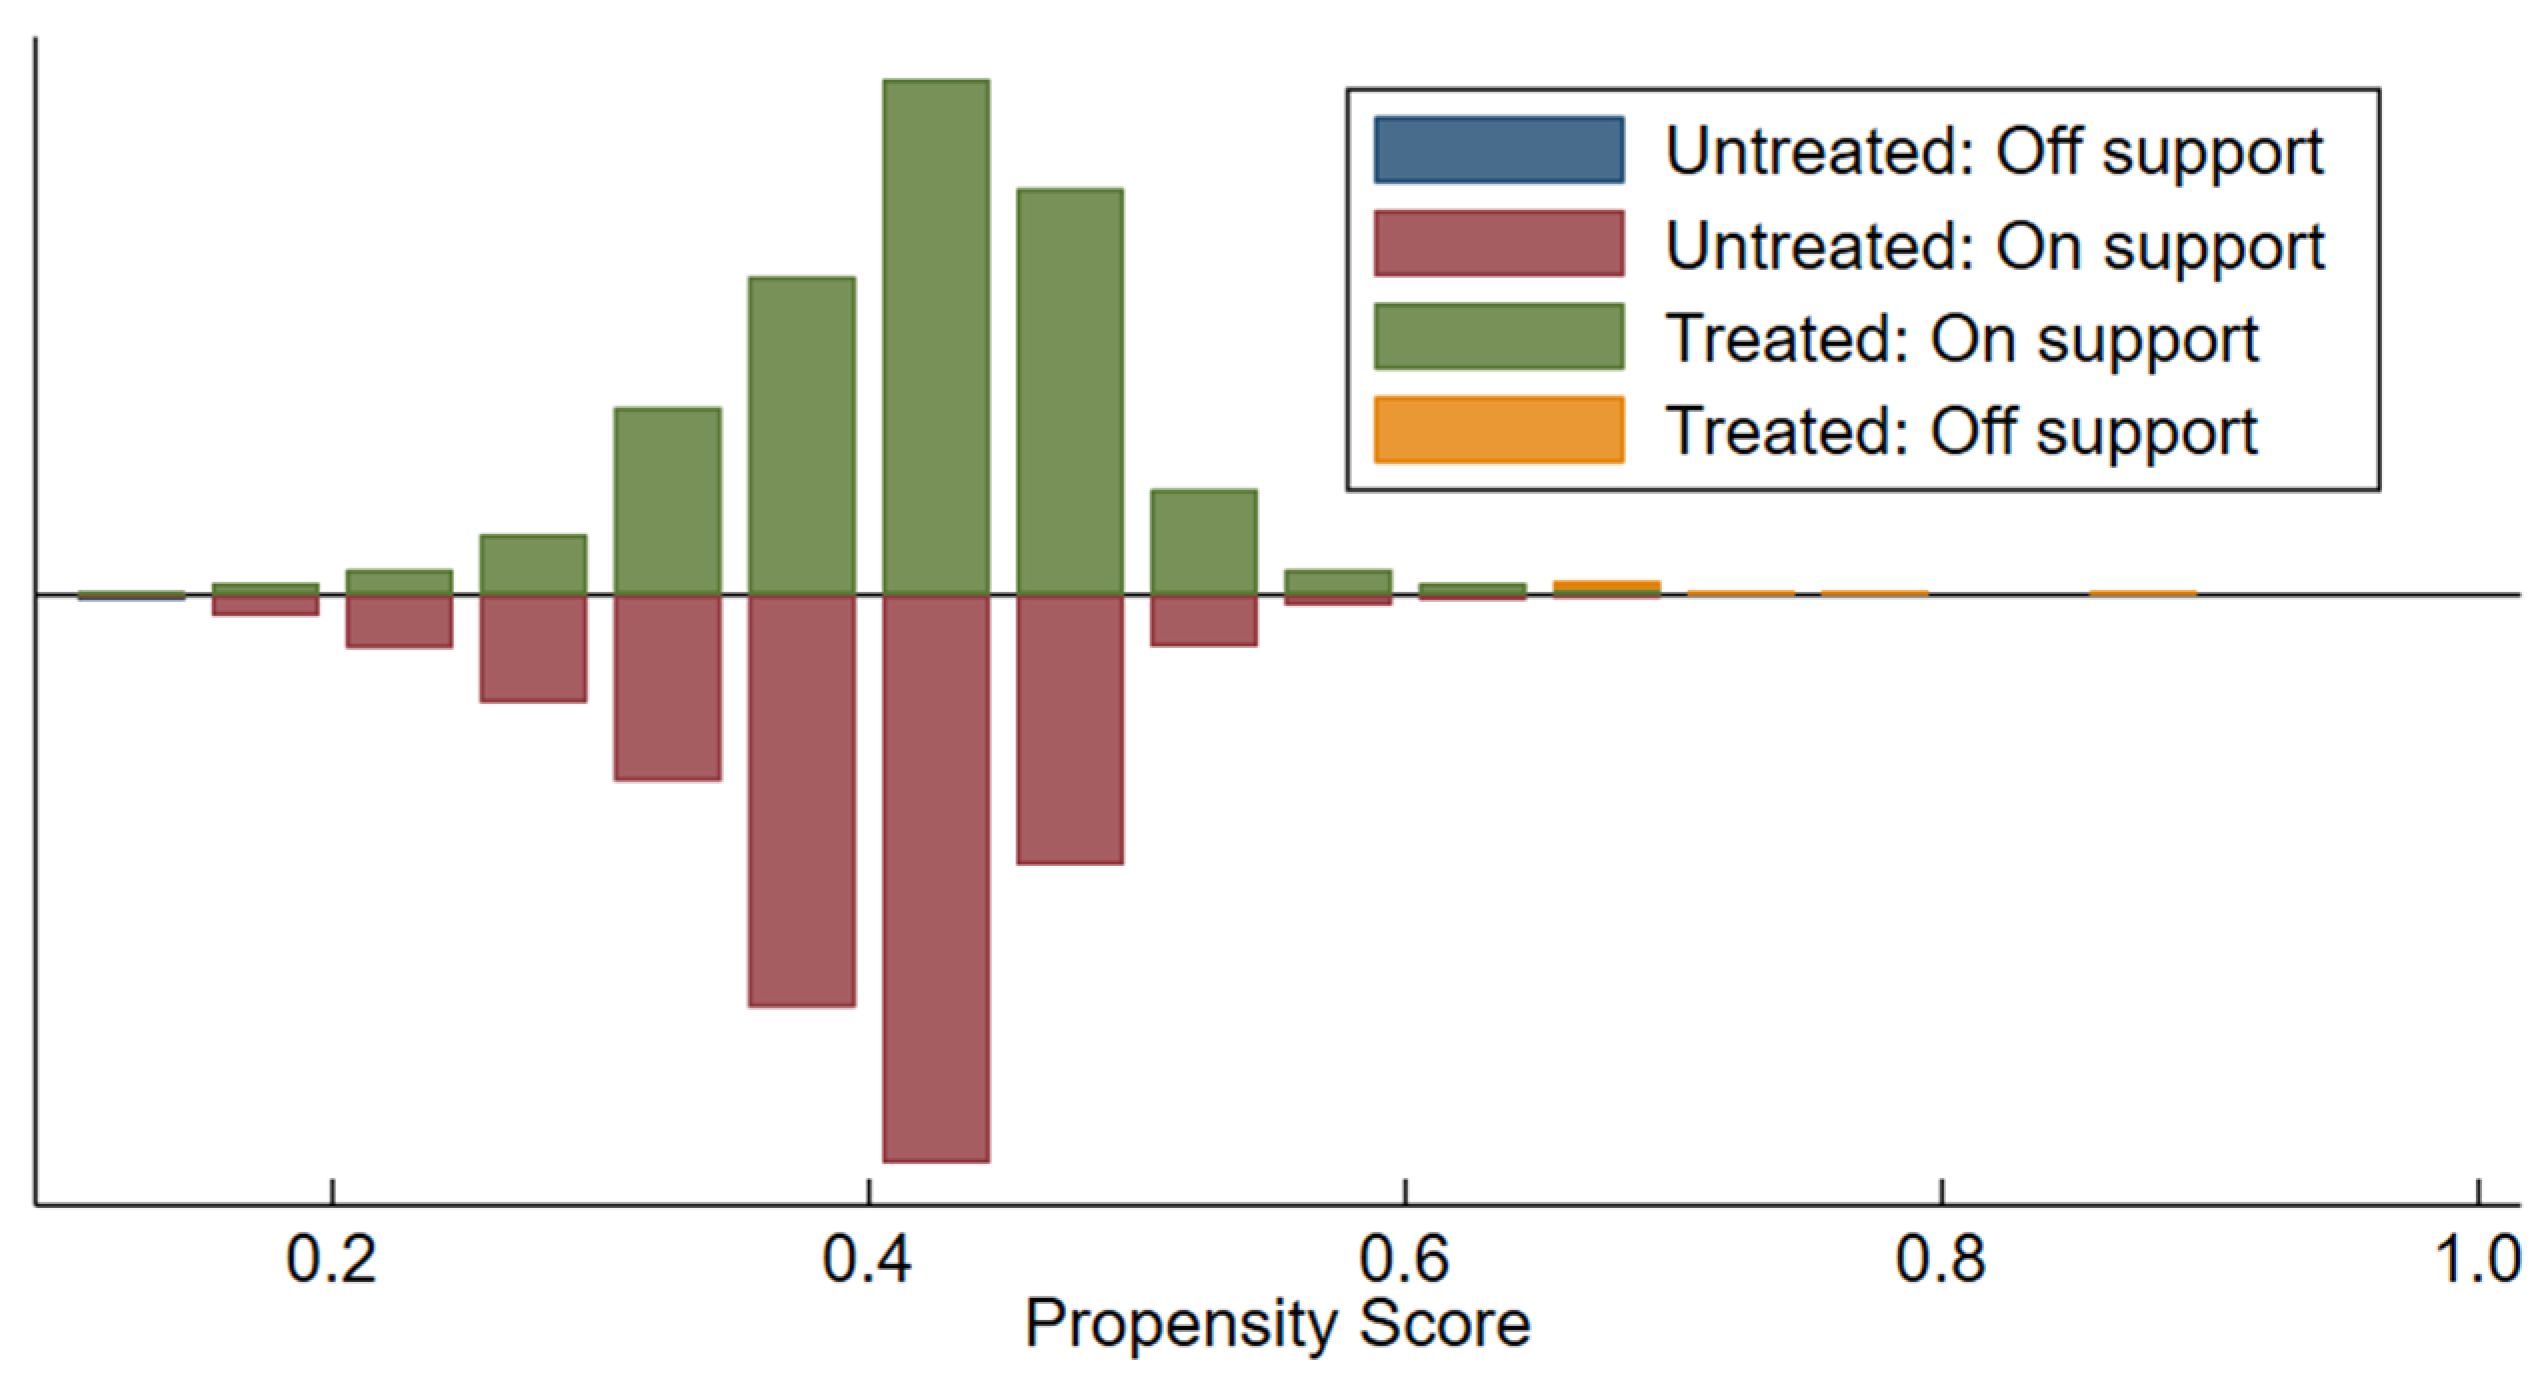
(1) Selective bias of samples. The non-random selection of pilot cities for the Cultural and Tourism Consumption Demonstration City policy may introduce sample selection bias and concerns about endogeneity. Drawing on the research approach of [75], we employed the PSM-DID model to alleviate endogeneity and further verify the robustness of conclusions. To ensure matching validity, Figure 7 and Figure 8 present the results of the balance test and common support assumption test after PSM, respectively. The regression results of PSM-DID are shown in Column (1) of Table 5. The estimated coefficient of p o l i c y is significantly positive at the 1% level, verifying the robustness of the baseline conclusion.
(2) Instrumental variable approach. To mitigate potential endogeneity issues arising from reverse causality, referring to the research of [76], we selected the number of museums per capita as an instrumental variable for the policy variable and employed a two-stage least squares (2SLS) estimation approach. The validity of this instrumental variable is justified on two grounds: First, the richness of cultural infrastructure is a key consideration in the selection of cultural and tourism consumption pilot cities, and cities with a higher number of museums per capita are more likely to be designated as pilot cities. The first-stage regression results show that the instrumental variable is significantly positively correlated with the policy variable at the 1% level, with an F-statistic of 73.10, far exceeding the critical value of 16.38 at the 10% maximal IV bias level, thus ruling out concerns regarding weak instruments. Second, the number of museums per capita in a city is the result of its long-term historical culture and public resource allocation and is not directly related to the current ESG performance of individual firms, satisfying the exogeneity condition. The second-stage estimation result is reported in Table 5, Column (2). The estimated coefficient of policy is significantly positive at the 5% level. This indicates that after controlling for endogeneity, the enhancing effect of the CTCP policy on corporate ESG performance remains robust, further strengthening the baseline conclusion of this research.
(3) Double machine learning method. We further addressed endogeneity concerns using the double machine learning (DML) method proposed by [77]. This approach allows us to control for a high-dimensional set of covariates and their nonlinear transformations, reducing the bias from functional form misspecification. We incorporated quadratic terms of all control variables and used both random forest and Lasso algorithms to estimate the treatment effect. The results, presented in Columns (3) and (4) of Table 5, demonstrate that the policy effect remains positive and statistically significant, further corroborating the baseline results.

5.2.4. Other Robustness Tests

(1) Replace the dependent variable. We used Huazheng ESG scores as an alternative indicator for corporate ESG performance to re-conduct the regressions, and the results are displayed in Column (1) of Table 6. The estimated coefficient of the core explanatory variable p o l i c y is 0.669, which is significantly positive at the 10% level. This indicates that even when altering the measurement method of corporate ESG performance, the positive impact of the CTCP policy on corporate ESG performance remains significant, further confirming the robustness of the baseline regression conclusion.
(2) Adjust the window period. Considering that different time cycles may affect the results, we re-estimated the model by setting the sample window periods to 2014–2024 and 2015–2024, respectively. The regression results are presented in Columns (2) and (3) of Table 6. It can be observed that the regression coefficients of p o l i c y are all significantly positive, with signs and significance levels consistent with the baseline regression. Their absolute values also show an increasing trend. This finding supports the reliability of the baseline conclusion.
(3) Doubly robust (CIC) model. To further verify the heterogeneous impact of the CTCP policy on corporate ESG performance, we conducted supplementary tests using the doubly robust (CIC) model proposed by [78]. Estimations were performed using both continuous and discrete treatment variables, and the results are shown in Columns (4) and (5) of Table 6. Regardless of the estimator used, the estimated results of p o l i c y are significantly positive, further corroborating the robustness of the baseline regression results.
(4) Exclude interference from other policies. To rule out interference from other policies during the sample period, following the approach of [79], a dummy variable for the National Cultural Consumption Pilot City Policy implemented in 2016 and 2017 within the research period was added to the baseline model for re-regression. The results are presented in Column (6) of Table 6. The estimated coefficient of p o l i c y is significantly positive, indicating that the conclusion remains robust after excluding potential interference from the policies above.

5.3. Mechanism Verification

The baseline regression confirmed the positive impact of the CTCP policy on corporate ESG performance. To delve into the underlying transmission paths, we sequentially examined the roles of three potential channels: corporate revenue growth ( g r o w ), green innovation ( g i n n ), and financing constraints ( f c o n ), based on the mediating effect model. The detailed mechanism test results are presented in Table 7.
Regarding corporate revenue growth (Columns (1) and (2)), the CTCP policy notably enhanced the revenue growth of culture and tourism firms. The predicted value of revenue growth ( g r o w ^ ) exhibits a significant positive driving effect on corporate ESG performance. This indicates that by activating consumption markets and expanding company revenue scales, the policy provides more ample financial support and more substantial economic incentives for firms to practice ESG. Improved operational efficiency enables firms to allocate more resources to environmental governance, employee welfare enhancement, and governance structure optimization, thereby fostering improvements in ESG performance [80]. Thus, revenue growth stands as a key channel through which the CTCP policy elevates corporate ESG performance.
In terms of corporate green innovation (Columns (3) and (4)), the CTCP policy effectively incentivized green technology innovation activities among culture and tourism firms. The predicted value of green innovation ( g i n n ^ ) also exerts a significant positive influence on corporate ESG performance. This result corroborates that the policy, by steering market demand toward green and low-carbon products and services, drives firms to increase investment in green technology research, development, and application. By developing low-carbon operational technologies and promoting eco-friendly service models, firms create a positive cycle between environmental performance and market competitiveness, thereby enhancing overall ESG performance [81].
For financing constraint alleviation (Columns (5) and (6)), the CTCP policy significantly reduced such constraints for culture and tourism firms. This suggests that the policy may have improved their external financing environment by boosting market confidence, enhancing their reputation, or increasing government subsidies. The predicted value of alleviated financing constraints ( f c o n ^ ) shows a significant negative correlation with corporate ESG performance. This means firms can allocate resources more freely to areas such as environmental protection investment, employee welfare improvement, and refinement of governance mechanisms, ultimately driving upgrades in ESG performance.

5.4. Heterogeneity Analysis

5.4.1. Heterogeneity in Terms of the Nature of Property Rights

The response to policy incentives may vary significantly between state-owned enterprises (SOEs) and non-SOEs due to differences in their resource endowments, operational objectives, and political connections. To test this, we split the sample based on the nature of the property rights. The regression results are presented in Columns (1) and (2) of Table 8. The estimated coefficient of the policy variable is significantly positive for SOEs, while it is statistically insignificant for non-SOEs.

5.4.2. Heterogeneity of the Governance Structure

The corporate governance structure, particularly the concentration of leadership power, is a key factor influencing strategic decision-making and resource allocation. CEO duality, where the CEO also serves as the chairman of the board, may affect how a firm responds to external policy shocks. Therefore, we examined the policy effect across firms with and without CEO duality. The results are shown in Columns (3) and (4) of Table 8. The policy implementation shows a significant positive effect on ESG performance in firms without CEO duality, but no significant impact is found in firms where the CEO and chairman roles are combined.

5.4.3. Labor-Intensive Heterogeneity

The culture and tourism industry comprises firms with varying production models, from highly labor-intensive services to more capital-intensive operations. The primary channel of policy impact might differ across these firms. We classified firms based on their labor intensity and report the results in Columns (5) and (6) of Table 8. The policy exerts a significantly positive impact on the ESG performance of labor-intensive culture and tourism enterprises. In contrast, the effect on non-labor-intensive enterprises is positive but fails to reach statistical significance.

6. Further Analysis: ESG Rating Divergence and Strategic Disclosure

Both the baseline regression and mechanism tests confirmed that the CTCP policy significantly enhances the ESG performance of culture and tourism firms in demonstration cities. However, an important question remains: does the policy also incentivize firms to engage in strategic disclosure behaviors, such as emphasizing ESG communication without corresponding substantive actions? To explore this possibility, we constructed a measure of ESG rating divergence between Bloomberg’s ESG disclosure score ( E S G _ D i s c ) and Huazheng’s ESG performance rating ( E S G _ P e r f ).
We acknowledge that differences between these ratings may arise from methodological variations, geographic focus, or inherent biases in rating criteria—Bloomberg emphasizes disclosure comprehensiveness and global comparability, while Huazheng incorporates industry-specific materiality and is more attuned to the Chinese context [82]. However, a persistent and systematic gap between disclosure prominence and realized performance may also reflect strategic corporate behavior aimed at managing external perceptions without implementing substantive changes—a phenomenon often referred to as “greenwashing” in the literature [83].
To isolate the potential strategic component of this gap, we followed the approach of [84] and standardized both E S G _ D i s c and E S G _ P e r f by industry j and year t . We then defined the divergence index as follows:
D I V i t = E S G _ D i s c i t E S G _ D i s c j t ¯ σ ( E S G _ D i s c j t ) E S G _ P e r f i t E S G _ P e r f j t ¯ σ ( E S G _ P e r f j t )
A higher D I V i t value indicates a greater discrepancy between a firm’s ESG disclosure prominence and its actual performance, which could be indicative of strategic disclosure practices. We caution that this measure is not a direct proxy for greenwashing but rather a proxy for potential impression management behavior that warrants further scrutiny. As shown in Table 9, the CTCP policy is associated with a significant increase in D I V i t among small-scale firms, suggesting that these firms may be more likely to engage in strategic disclosure in response to policy incentives.

7. Discussion

The empirical results demonstrate that the CTCP policy functions as a potent instrument for enhancing corporate ESG performance. This outcome aligns with the emerging scholarship examining demand-driven policy impacts, suggesting that policies aimed at stimulating sustainable consumption can effectively translate into improved corporate sustainability practices [29]. The positive impact underscores the role of market incentives, alongside traditional regulatory pressures, in driving firms towards environmental and social governance.
The effectiveness of the policy can be logically situated within the operational dynamics of the culture and tourism industry. The core competitiveness of firms in this sector is increasingly tied to their green credentials and social responsibility, which are key determinants of consumer choice in a modern market [85]. The CTCP policy, by boosting market demand for high-quality and sustainable experiences, effectively makes superior ESG performance a strategic asset for firms seeking to attract discerning customers and enhance their brand reputation [86].
Our analysis of the transmission mechanisms reveals that the policy operates through multiple channels. The significance of revenue growth highlights the importance of financial capacity, providing firms with the necessary resources to allocate towards ESG investments, a finding consistent with the resource-based view of the firm [58]. The role of green innovation indicates that firms are not only responding to financial incentives but are also engaging in substantive technological and operational changes to align with policy-induced market trends, particularly in developing low-carbon service models [54]. Furthermore, the alleviation of financing constraints suggests that the policy’s endorsement reduces perceived risks for external investors, enabling firms to undertake long-term ESG projects that might otherwise be constrained by capital availability [22].
The heterogeneity tests reveal divergent policy effects across firm types. The stronger impact observed in SOEs likely stems from their superior access to policy-supported resources and a greater alignment with governmental objectives, allowing them to more readily absorb and implement ESG-related directives [87]. The finding that firms with sound governance structures exhibit a more pronounced response underscores the critical role of internal monitoring mechanisms. A separated CEO and chairman structure appears to facilitate more strategic decision-making, enabling management to prioritize long-term ESG goals over short-term financial pressures [88]. The significant effect on labor-intensive firms is particularly telling, as it aligns with the social core of the tourism industry. The policy likely drives these firms to enhance employee welfare and stability, directly improving their social performance metrics.
A critical and nuanced extension of our analysis reveals a potential policy side-effect; namely, an increased divergence between ESG disclosure prominence and actual performance, particularly among small-scale firms. While this gap may come from methodological differences between rating agencies, it also aligns with the idea of strategic disclosure or “greenwashing,” a practice where firms might prioritize managing external perceptions over implementing costly substantive changes [89]. This makes particular sense for resource-constrained smaller firms as they may find it more manageable to enhance reporting than to undertake immediate large-scale operational improvements. This observed divergence points to a critical challenge for policymakers: they need to design incentives that not only encourage transparent ESG reporting, but also rigorously verify and reward genuine substantive performance improvements.
These findings offer several actionable insights for policymakers. Firstly, policy support should be channeled to strengthen the identified mechanisms, such as fostering platforms for green technology sharing in tourism and developing financial products that offer favorable terms for firms with verified ESG performance. Secondly, policy design must account for firm heterogeneity. Tailored programs are needed: leveraging SOEs for leading long-term ESG investments, rewarding well-governed firms for strategic ESG integration, and providing capacity-building support and technical assistance to small- and medium-sized enterprises to enable substantive ESG actions rather than symbolic reporting. Finally, the policy framework must incorporate robust monitoring and third-party verification mechanisms to mitigate the risk of a disclosure–performance decoupling, ensuring that the pursuit of ESG reporting transparency is aligned with and supported by genuine performance improvement.
This study has several limitations that also present opportunities for future research. First, the reliance on ESG ratings, though valuable, may not fully capture the depth of corporate sustainability practices. Future studies could incorporate more granular primary data or objective environmental and social metrics. Second, the focus on listed companies limits the generalizability of the findings to the broader population of small and private firms in the culture and tourism sector. Research including these entities is essential for a more comprehensive understanding. Finally, the long-term effects of the CTCP policy remain an open empirical question, warranting longitudinal studies to examine the sustainability and evolution of its impact on corporate behavior.

8. Conclusions

This research examined how the CTCP policy influences firms’ ESG outcomes by exploiting its implementation as an exogenous shock. The analysis demonstrated a significant positive effect of the policy on the ESG performance of firms in the culture and tourism sector. This effect operates primarily through three mechanisms: bolstered revenue, stimulated green innovation, and relaxed financing constraints. The policy’s influence varies across firm types, exhibiting greater strength among state-owned enterprises, firms with sound governance structures, and labor-intensive firms. Additionally, this study uncovered a potential unintended consequence, noting that the policy may encourage strategic ESG disclosure among small-scale firms. Collectively, these findings advance the understanding of industrial policy micro-effects and provide empirical evidence on how demand-side policies can be leveraged to promote corporate sustainable development.

Author Contributions

Conceptualization, X.C. and T.Z.; methodology, K.B. and C.G.; software, K.B.; formal analysis, X.C. and Y.W.; investigation, Y.W.; resources, C.G.; data curation, C.G.; writing—original draft preparation, X.C., Y.W. and C.G.; writing—review and editing, K.B.; visualization, T.Z.; supervision, Y.W.; funding acquisition, C.G. All authors have read and agreed to the published version of the manuscript.

Funding

This work was supported by the Excellent Youth funding of the Hunan Provincial Education Department (23B0600).

Institutional Review Board Statement

Not applicable.

Informed Consent Statement

Not applicable.

Data Availability Statement

Data will be made available on request.

Conflicts of Interest

The authors declare no conflicts of interest.

Abbreviations

The following abbreviations are used in this manuscript:
ESGEnvironmental, Social and Governance
CTCPCultural and tourism consumption promotion
DIDDifference-in-differences
PSMPropensity Score Matching

References

  1. Niesten, E.; Jolink, A.; Bacha, E. Sustainable development in turbulent environments: The impact of ESG capabilities on responses to turbulence. Bus. Strateg. Environ. 2024, 33, 6468–6490. [Google Scholar] [CrossRef]
  2. Gidage, M.; Bhide, S. ESG and economic growth: Catalysts for achieving sustainable development goals in developing economies. Sustain. Dev. 2025, 33, 2060–2077. [Google Scholar] [CrossRef]
  3. Lin, M.S.; Zhang, H.; Luo, Y.; Li, Y. Environmental, social, and governance (ESG) measurement in the tourism and hospitality industry: Views from a developing country. J. Travel Tour. Mark. 2024, 41, 154–168. [Google Scholar] [CrossRef]
  4. Aliani, K.; Hamza, F.; Alessa, N.; Borgi, H.; Albitar, K. ESG disclosure in G7 countries: Do board cultural diversity and structure policy matter? Corp. Soc. Responsib. Environ. Manag. 2024, 31, 3031–3042. [Google Scholar] [CrossRef]
  5. Abdullah Zhu, N.; Hashmi, M.A.; Shah, M.H. CEO power, board features and ESG performance: An extensive novel moderation analysis. Corp. Soc. Responsib. Environ. Manag. 2024, 31, 5627–5655. [Google Scholar] [CrossRef]
  6. Jeyhunov, A.; Kim, J.D.; Bae, S.M. The effects of board diversity on Korean Companies’ ESG performance. Sustainability 2025, 17, 787. [Google Scholar] [CrossRef]
  7. Wang, J.; Xing, Y.; Xiao, D. An empirical study on the relationship between executives’ financial background and corporate ESG performance. Int. Rev. Financ. Anal. 2025, 102, 104141. [Google Scholar] [CrossRef]
  8. Cao, Y.; Mi, W.; Zhang, R. Provincial ESG performance in China: Evolution trends and the role of environmental regulation. Environ. Impact Assess. Rev. 2024, 107, 107570. [Google Scholar] [CrossRef]
  9. Hong, X.; Ning, M.; Chen, Q.; Shi, C.; Wang, N. How does command-and-control environmental regulation impact firm value? A study based on ESG perspective. Environ. Dev. Sustain. 2025, 27, 11477–11508. [Google Scholar] [CrossRef]
  10. Bolognesi, E.; Burchi, A.; Goodell, J.W.; Paltrinieri, A. Stakeholders and regulatory pressure on ESG disclosure. Int. Rev. Financ. Anal. 2025, 103, 104145. [Google Scholar] [CrossRef]
  11. Liu, G.Q.; Kong, L.Y. Business environment innovation pilot and corporate ESG performance. Financ. Econ. Collect. 2025, 5, 1–13. [Google Scholar] [CrossRef]
  12. Sun, X.; Zhou, C.; Gan, Z. Green finance policy and ESG performance: Evidence from Chinese manufacturing firms. Sustainability 2023, 15, 6781. [Google Scholar] [CrossRef]
  13. Lei, X.; Yu, J. Striving for sustainable development: Green financial policy, institutional investors, and corporate ESG performance. Corp. Soc. Responsib. Environ. Manag. 2024, 31, 1177–1202. [Google Scholar] [CrossRef]
  14. Freeman, R.E.; Harrison, J.S.; Wicks, A.C.; Parmar, L.; de Colle, S. Stakeholder Theory: The State of the Art; Cambridge University Press: Cambridge, UK, 2010. [Google Scholar]
  15. Scott, W.R. Institutions and Organizations: Ideas, Interests and Identities; Sage Publications: London, UK, 1995. [Google Scholar]
  16. Berg, F.; Kölbel, J.F.; Rigobon, R. Aggregate confusion: The divergence of ESG ratings. Rev. Financ. 2022, 26, 1315–1344. [Google Scholar] [CrossRef]
  17. Sariyer, G.; Mangla, S.K.; Chowdhury, S.; Sozen, M.E.; Kazancoglu, Y. Predictive and prescriptive analytics for ESG performance evaluation: A case of fortune 500 companies. J. Bus. Res. 2024, 181, 114742. [Google Scholar] [CrossRef]
  18. Eccles, R.G.; Lee, L.E.; Stroehle, J.C. The social origins of ESG: An analysis of Innovest and KLD. Org. Environ. 2020, 33, 575–596. [Google Scholar] [CrossRef]
  19. Schimanski, T.; Reding, A.; Reding, N.; Bingler, J.; Kraus, M.; Leippold, M. Bridging the gap in ESG measurement: Using NLP to quantify environmental, social, and governance communication. Financ. Res. Lett. 2024, 61, 104979. [Google Scholar] [CrossRef]
  20. Gillan, S.L.; Koch, A.; Starks, L.T. Firms and social responsibility: A review of ESG and CSR research in corporate finance. J. Corp. Financ. 2021, 66, 101889. [Google Scholar] [CrossRef]
  21. Albuquerque, R.; Koskinen, Y.; Zhang, C. Corporate social responsibility and firm risk: Theory and empirical evidence. Manag. Sci. 2019, 65, 4451–4469. [Google Scholar] [CrossRef]
  22. Ding, H.; Lee, W. ESG and financial performance of China firms: The mediating role of export share and moderating role of carbon intensity. Sustainability 2024, 16, 5042. [Google Scholar] [CrossRef]
  23. Hornuf, L.; Yüksel, G. The performance of socially responsible investments: A meta-analysis. Eur. Financ. Manag. 2024, 30, 1012–1061. [Google Scholar] [CrossRef]
  24. Wang, H.; Jiao, S.; Ma, C. The impact of ESG responsibility performance on corporate resilience. Int. Rev. Econ. Financ. 2024, 93, 1115–1129. [Google Scholar] [CrossRef]
  25. Shi, X.K.; Zhang, Q.M. Understanding the mechanism of environmental, social, and governance impact on enterprise performance in the context of sustainable development. Corp. Soc. Responsib. Environ. Manag. 2024, 31, 784–800. [Google Scholar] [CrossRef]
  26. Hasnaoui, A. ESG ratings and investment performance: Evidence from tech-heavy mutual funds. Rev. Account. Financ. 2025, 24, 59–70. [Google Scholar] [CrossRef]
  27. Rahat, B.; Nguyen, P. Does ESG performance impact credit portfolios? Evidence from lending to mineral resource firms in emerging markets. Resour. Policy 2023, 85, 104052. [Google Scholar] [CrossRef]
  28. Lin, H.; Chen, H.; Tang, H.; Chen, M. Can the Chinese cultural consumption pilot policy facilitate sustainable development in the agritourism economy? Agriculture 2025, 15, 1117. [Google Scholar] [CrossRef]
  29. Yu, Q.Y.; Liu, X.Z. The impact and mechanism of cultural and tourism consumption promotion policy under the background of the integration of culture and tourism: Empirical evidence from pilot demonstration cities. J. East China Norm. Univ. 2025, 57, 162–175+180. [Google Scholar] [CrossRef]
  30. Sun, J.J.; Guo, Y.Z. Multiple paths of urban tourism policy change: A clear set qualitative comparative (csQCA) analysis based on Suzhou. Econ. Geogr. 2021, 41, 166–173. [Google Scholar] [CrossRef]
  31. Lv, F. Resource constraints, differentiation of government roles and policy implementation by local governments: A case study based on public culture service demonstration areas. Manag. World 2023, 39, 113–124. [Google Scholar] [CrossRef]
  32. Zhang, S.S.; Chen, K.X.; Li, Y.T. Can institutional innovation promote digital industry innovation: Evidence from pilot free trade zones. Int. Econ. Trade Res. 2025, 41, 58–75. [Google Scholar] [CrossRef]
  33. Cheng, S.T.; Wang, D. Targeted sustainable development policy and corporate green innovation: An analysis on the first batch of national sustainable development agenda innovation demonstration zones. Foreign Econ. Manag. 2025, 47, 103–119. [Google Scholar] [CrossRef]
  34. Zhang, C.; Jin, S.Y. What drives sustainable development of enterprises? Focusing on ESG management and green technology innovation. Sustainability 2022, 14, 11695. [Google Scholar] [CrossRef]
  35. Dong, Z.; Wang, S.; Zhang, W.; Shen, H. The dynamic effect of environmental regulation on firms’ energy consumption behavior—Evidence from China’s industrial firms. Renew. Sustain. Energy Rev. 2022, 156, 111966. [Google Scholar] [CrossRef]
  36. Zeng, H.X.; Liu, C.Y.; Zhou, Q.; Jin, Y.L.; Gong, F.Y. Will the innovation of local industrial chain policy achieve a win-win situation of “economy-environment”? A quasi-natural experiment based on the “industrial chain leader institution”. J. Financ. Econ. 2024, 3, 1–14. [Google Scholar] [CrossRef]
  37. Rothbard, S.; Etheridge, J.C.; Murray, E.J. A tutorial on applying the difference-in-differences method to health data. Curr. Epidemiol. Rep. 2024, 11, 85–95. [Google Scholar] [CrossRef]
  38. Holtmann, M.; Rjosk, C.; Jansen, M.; Lüdtke, O. The double-edged sword of de-tracking reforms in germany: Using a difference-in-differences approach to estimate effects on students’ educational aspirations and their association with students’ socioeconomic backgrounds. Stud. Educ. Eval. 2024, 81, 101350. [Google Scholar] [CrossRef]
  39. Liu, J.; Shen, H.; Li, Y.; Yin, T. Impact of industrial symbiotic agglomeration on energy efficiency: Analysis using time-varying difference-in-difference model. Sustainability 2025, 17, 1870. [Google Scholar] [CrossRef]
  40. Shi, L.; Wang, Y.; Jing, L. Low-carbon city pilot, external governance, and green innovation. Financ. Res. Lett. 2024, 67, 105768. [Google Scholar] [CrossRef]
  41. Wan, G.; Zhang, W.; Li, C. How does low-carbon city pilot policy catalyze companies toward ESG practices? Evidence from China. Econ. Anal. Policy 2024, 81, 1593–1607. [Google Scholar] [CrossRef]
  42. Yuan, H. Investigating the nexus between environmental information disclosure and green development efficiency: The intermediary role of green technology innovation: A PSM-DID analysis. J. Knowl. Econ. 2024, 15, 11653–11683. [Google Scholar] [CrossRef]
  43. Xu, Y.; Wang, Z.C.; Tao, C.Q. Can innovative pilot city policies improve the allocation level of innovation factors? Evidence from China. Technol. Forecast. Soc. Change 2024, 200, 123135. [Google Scholar] [CrossRef]
  44. Zhang, X.; Han, Y.; Jiao, H.; Feng, Y. Re-evaluating the effectiveness of regional energy saving targets: Empirical evidence from the Eleventh Five-year plan in China. Energy 2025, 318, 134769. [Google Scholar] [CrossRef]
  45. Baker, A.C.; Larcker, D.F.; Wang, C.C. How much should we trust staggered difference-in-differences estimates? J. Financ. Econ. 2022, 144, 370–395. [Google Scholar] [CrossRef]
  46. Marx, P.; Tamer, E.; Tang, X. Parallel trends and dynamic choices. J. Polit. Econ. Microecon. 2024, 2, 129–171. [Google Scholar] [CrossRef]
  47. Xia, T.; Li, S.; Choi, Y. Has the belt and road initiative enhanced economic resilience in cities along its route? Land 2025, 14, 1646. [Google Scholar] [CrossRef]
  48. Braunerhjelm, P. Rethinking stabilization policies: Including supply-side measures and entrepreneurial processes. Small Bus. Econ. 2022, 58, 963–983. [Google Scholar] [CrossRef]
  49. He, H.; Tuo, S.; Lei, K.; Gao, A. Assessing quality tourism development in China: An analysis based on the degree of mismatch and its influencing factors. Environ. Dev. Sustain. 2024, 26, 9525–9552. [Google Scholar] [CrossRef]
  50. Arvidsson, S.; Dumay, J. Corporate ESG reporting quantity, quality and performance: Where to now for environmental policy and practice? Bus. Strateg. Environ. 2022, 31, 1091–1110. [Google Scholar] [CrossRef]
  51. Jia, T.; Iqbal, S.; Ayub, A.; Fatima, T.; Rasool, Z. Promoting responsible sustainable consumer behavior through sustainability marketing: The boundary effects of corporate social responsibility and brand image. Sustainability 2023, 15, 6092. [Google Scholar] [CrossRef]
  52. Chen, Y.; Lu, S.; Shahab, Y. State-led supply chains and ESG outcomes: Evidence from China’s industrial policy. Appl. Econ. 2025, 7, 1–20. [Google Scholar] [CrossRef]
  53. Xu, H.; Li, Y.; Lin, W.; Wang, H. ESG and customer stability: A perspective based on external and internal supervision and reputation mechanisms. Humanit. Soc. Sci. Commun. 2024, 11, 981. [Google Scholar] [CrossRef]
  54. Chen, T.; Liu, G. Global perspectives on environmental policy innovations: Driving green tourism and consumer behavior in circular economy. J. Environ. Manag. 2025, 374, 124138. [Google Scholar] [CrossRef]
  55. Shao, Y.; Chen, Z. Can government subsidies promote the green technology innovation transformation? Evidence from Chinese listed companies. Econ. Anal. Policy 2022, 74, 716–727. [Google Scholar] [CrossRef]
  56. Fu, S.; Liu, D.; Huang, F. Synergistic effect of government policy and market mechanism on the innovation of new energy vehicle enterprises. Energy 2024, 295, 130998. [Google Scholar] [CrossRef]
  57. Wang, C.; Deng, X.; Wang, D.; Pan, X. Financial regulation, financing constraints, and enterprise innovation performance. Int. Rev. Financ. Anal. 2024, 95, 103387. [Google Scholar] [CrossRef]
  58. Algeri, C.; Brighi, P.; Venturelli, V. Integrating ESG factors into cost-efficiency frontier: Evidence from the European listed banks. Bus. Strateg. Environ. 2025, 34, 3242–3270. [Google Scholar] [CrossRef]
  59. Li, G.; Branstetter, L.G. Does “Made in China 2025” work for China? Evidence from Chinese listed firms. Res. Policy 2024, 53, 105009. [Google Scholar] [CrossRef]
  60. Griffin, D.; Guedhami, O.; Li, K.; Lu, G. National culture and the value implications of corporate environmental and social performance. J. Corp. Financ. 2021, 71, 102123. [Google Scholar] [CrossRef]
  61. Zhou, M.; Bao, K.; Hu, X.; Gao, C.; Wen, Y.; Zhang, T. Climate-Resilient City Construction and Firms’ ESG Performance: Mechanism Analysis and Empirical Tests. Sustainability 2025, 17, 6252. [Google Scholar] [CrossRef]
  62. Chen, H.; Wang, Z. Does ESG rating disagreement affect management tone manipulation? Int. Rev. Financ. Anal. 2025, 101, 104039. [Google Scholar] [CrossRef]
  63. Wu, H.; Deng, H.; Gao, X. Corporate coupling coordination between ESG and financial performance: Evidence from China’s listed companies. Environ. Impact Assess. Rev. 2024, 107, 107546. [Google Scholar] [CrossRef]
  64. Li, Y.; Zhu, C. Regional digitalization and corporate ESG performance. J. Clean. Prod. 2024, 473, 143503. [Google Scholar] [CrossRef]
  65. Liu, X.; Huang, N.; Su, W.; Zhou, H. Green innovation and corporate ESG performance: Evidence from Chinese listed companies. Int. Rev. Econ. Financ. 2024, 95, 103461. [Google Scholar] [CrossRef]
  66. Shi, D.; Tan, H.; Ling, Y.; Liu, Y.; Liu, B.; Tu, Y. Impact of environmental information uncertainty and market competition on corporate ESG performance. Int. Rev. Financ. Anal. 2025, 99, 103935. [Google Scholar] [CrossRef]
  67. Xie, X.M.; Zhu, Q.W. How can green innovation solve the dilemmas of “harmonious coexistence”? Manag. World 2021, 37, 128–149. [Google Scholar] [CrossRef]
  68. Dai, Y.; He, R. The impact of carbon emissions trading policy on the ESG performance of heavy-polluting enterprises: The mediating role of green technological innovation and financing constraints. Sustainability 2025, 17, 1365. [Google Scholar] [CrossRef]
  69. Li, C.; Wang, Y.; Zhou, Z.; Wang, Z.; Mardani, A. Digital finance and enterprise financing constraints: Structural characteristics and mechanism identification. J. Bus. Res. 2023, 165, 114074. [Google Scholar] [CrossRef]
  70. Lin, Y.; Zhao, M.F.; Hu, Y.; Wang, L.J. Study on the impact of culture and tourism integration on the ESG performance of tourism listed enterprises. Tour. Sci. 2025, 5, 1–27. [Google Scholar] [CrossRef]
  71. Zhang, Y.; Deng, Y.; Yang, O.; Xia, D.; Liu, H. Substantive or symbolic? The strategic choice of sustainable environmental strategy for enterprises induced by the new environmental protection law. Sustain. Dev. 2024, 32, 7461–7481. [Google Scholar] [CrossRef]
  72. Roth, J.; Sant’Anna, P.H.; Bilinski, A.; Poe, J. What’s trending in difference-in-differences? A synthesis of the recent econometrics literature. J. Econom. 2023, 235, 2218–2244. [Google Scholar] [CrossRef]
  73. Rambachan, A.; Roth, J. A more credible approach to parallel trends. Rev. Econ. Stud. 2023, 90, 2555–2591. [Google Scholar] [CrossRef]
  74. Lin, B.; Zhu, Y. Does AI elevate corporate ESG performance? A supply chain perspective. Bus. Strateg. Environ. 2025, 34, 586–597. [Google Scholar] [CrossRef]
  75. Ali, S.; Ghimire, A.; Long, X.; Chen, L. Will more multinational corporations inflow approach closer toward carbon neutrality? Novel propensity score matching-difference-in-difference evidence across 35 developing countries. Bus. Strateg. Environ. 2025, 34, 1625–1642. [Google Scholar] [CrossRef]
  76. Zhou, D.; Jiao, S.T. Cracking the innovation dilemma with culture: The case of museums. Rev. Ind. Econ. 2025, 25, 167–179. [Google Scholar] [CrossRef]
  77. Bodory, H.; Huber, M.; Lafférs, L. Evaluating (weighted) dynamic treatment effects by double machine learning. Econometr. J. 2022, 25, 628–648. [Google Scholar] [CrossRef]
  78. Athey, S.; Imbens, G.W. Identification and inference in nonlinear difference-in-differences models. Econometrica 2006, 74, 431–497. [Google Scholar] [CrossRef]
  79. Yang, L.; Song, S.; Liu, C. Green signals: The impact of environmental protection support policies on firms’ green innovation. Bus. Strateg. Environ. 2024, 33, 3258–3278. [Google Scholar] [CrossRef]
  80. Yang, J.; Zuo, Z.; Li, Y.; Guo, H. Manufacturing enterprises move towards sustainable development: ESG performance, market-based environmental regulation, and green technological innovation. J. Environ. Manag. 2024, 372, 123244. [Google Scholar] [CrossRef]
  81. Ying, H.; Yang, H.; Cifuentes-Faura, J.; Rauf, A. The role of carbon trading in enhancing enterprise green productivity and ESG performance: A quasi-natural evidence from China. Bus. Strateg. Environ. 2025, 34, 1691–1707. [Google Scholar] [CrossRef]
  82. Long, L.; Wang, C.; Zhang, M. Does social media pressure induce corporate hypocrisy? Evidence of ESG greenwashing from China. J. Bus. Ethics 2025, 197, 311–338. [Google Scholar] [CrossRef]
  83. Silkoset, R.; Nygaard, A. Leveraging blockchain and smart contracts to combat greenwashing in sustainable development. Sustain. Dev. 2025, 33, 5874–5889. [Google Scholar] [CrossRef]
  84. Lin, X.; Zhu, H.; Meng, Y. ESG greenwashing and equity mispricing: Evidence from China. Financ. Res. Lett. 2023, 58, 104606. [Google Scholar] [CrossRef]
  85. Vilkaite-Vaitone, N.; Tamuliene, V. Unveiling the untapped potential of green consumption in tourism. Sustainability 2024, 16, 230. [Google Scholar] [CrossRef]
  86. Lee, M.T.; Raschke, R.L.; Krishen, A.S. Signaling green! firm ESG signals in an interconnected environment that promote brand valuation. J. Bus. Res. 2022, 138, 1–11. [Google Scholar] [CrossRef]
  87. Hussain, M.; Yang, S.; Maqsood, U.S.; Zahid, R.A. Tapping into the green potential: The power of artificial intelligence adoption in corporate green innovation drive. Bus. Strateg. Environ. 2024, 33, 4375–4396. [Google Scholar] [CrossRef]
  88. Zhu, G.L.; Chen, Z.L.; Ouyang, F. Research on the impact of enterprise digitalization on capacity utilization from the perspective of investment efficiency. Bus. Rev. 2025, 37, 15–28. [Google Scholar] [CrossRef]
  89. Keresztúri, J.L.; Berlinger, E.; Lublóy, Á. Environmental policy and stakeholder engagement: Incident-based, cross-country analysis of firm-level greenwashing practices. Corp. Soc. Responsib. Environ. Manag. 2025, 32, 192–211. [Google Scholar] [CrossRef]
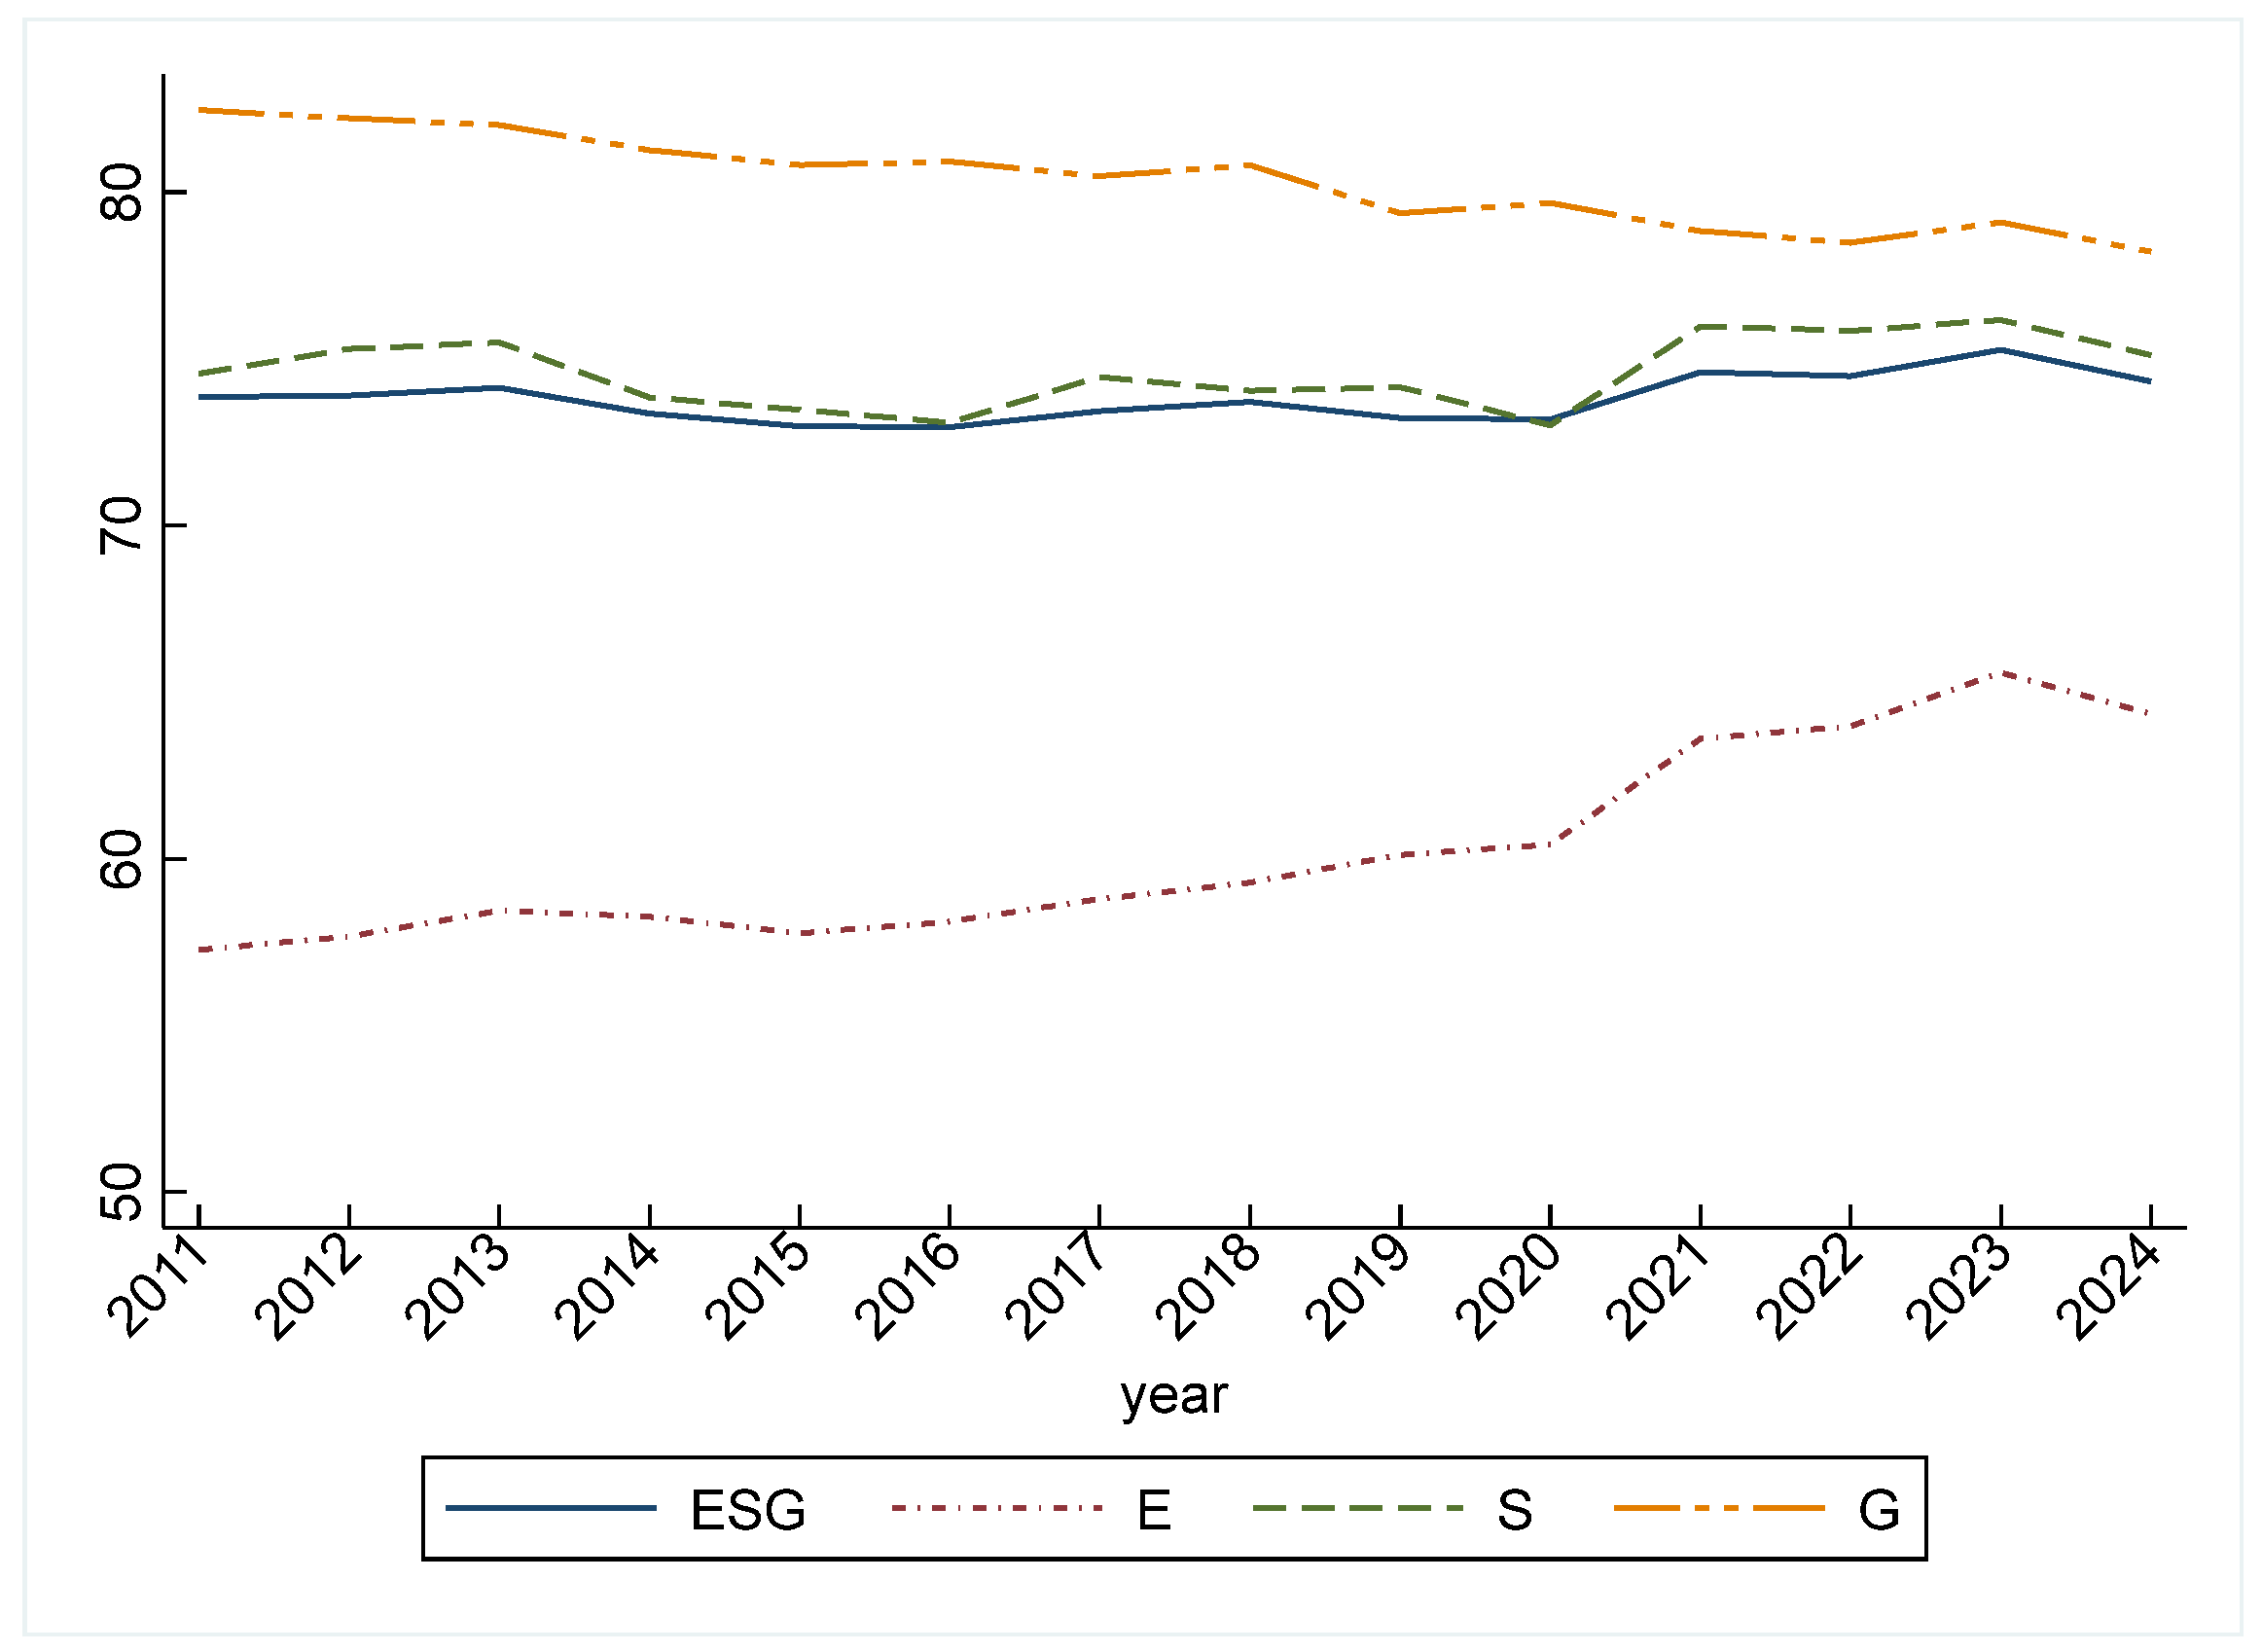
Figure 1. Trend of ESG score values.
Sustainability 17 08402 g001
Figure 2. Geographical distribution of cultural and tourism consumption demonstration cities. Note: The legend indicates the geographical distribution of the first batch of National Cultural and Tourism Consumption Demonstration Cities (pilot cities) and non-pilot cities. Among the 15 officially designated pilot cities, Ordos and Langfang are not represented in the sample due to the absence of eligible listed culture and tourism companies in these cities.
Sustainability 17 08402 g002
Figure 3. The impact path of the CTCP policy on corporate ESG performance.
Sustainability 17 08402 g003
Figure 4. Parallel trend test.
Sustainability 17 08402 g004
Figure 5. Sensitivity analysis. (a) Relative deviation degree limit. (b) Smoothing limits.
Sustainability 17 08402 g005
Figure 6. Placebo test.
Sustainability 17 08402 g006
Figure 7. Balance test.
Sustainability 17 08402 g007
Figure 8. Common supporting hypothesis test.
Sustainability 17 08402 g008
Table 1. Descriptive Statistics.
VariablesNMeanStd. Dev.MinMax
e s g 21424.1931.0971.0008.000
p o l i c y 21420.1450.3520.0001.000
s i z e 214222.7861.28419.56326.452
a g e 21422.7310.5960.0003.466
l e v 21420.4390.1980.0420.935
c a s h 21420.0560.063−0.1990.266
t o b i n 21421.7121.2020.78916.647
c a p 21423.2022.8260.37919.481
t o p 1 21420.3740.1510.0740.758
i n d e p 214237.3895.84230.00060.000
g r o w 21420.1070.386−0.6543.808
g i n n 21423.1500.9140.0005.473
f c o n 2142−1.0420.099−3.832−0.487
Note: This table reports the number of observations, mean, standard deviation, minimum, and maximum.
Table 2. Correlation matrix.
VariablesEsgSizeAgeLevCashTobinTop1IndepCap
esg1
size0.1771
age−0.0800.2631
lev−0.0680.4060.2311
cash0.1020.139−0.043−0.1401
tobin−0.059−0.421−0.150−0.300−0.0011
top10.0730.173−0.065−0.1240.094−0.0981
indep0.1340.131−0.0260.0590.0410.100−0.0961
cap−0.1270.1060.131−0.163−0.090−0.0620.070−0.02401
Note: This table reports Pearson correlation coefficients.
Table 3. Benchmark regression results.
Variables(1)(2)(3)(4)
p o l i c y 0.136 **0.187 **0.212 ***0.181 **
(2.02)(2.26)(3.24)(2.21)
s i z e 0.220 ***0.499 ***
(9.64)(8.19)
a g e −0.180 ***−0.425 ***
(−4.88)(−3.71)
l e v −1.081 ***−1.422 ***
(−7.51)(−6.10)
c a s h 0.262−0.033
(0.72)(−0.09)
t o b i n −0.037 *−0.004
(−1.94)(−0.18)
c a p −0.070 ***−0.048 ***
(−8.79)(−3.59)
t o p 1 0.1160.229
(0.73)(0.68)
i n d e p 0.021 ***0.016 ***
(5.51)(3.03)
C o n s t a n t 4.174 ***4.166 ***−0.432−5.943 ***
(163.06)(184.20)(−0.95)(−4.42)
f i r m   F E NOYESNOYES
c i t y   F E YESYESYESYES
y e a r   F E NOYESNOYES
N2142214221422142
R20.00190.43720.11250.4752
Note: t statistics in parentheses. * p < 0.1, ** p < 0.05, *** p < 0.01.
Table 4. Analysis of the CTCP policy effects on ESG components.
VariablesESG
p o l i c y 0.5621.593 *0.046
(1.08)(1.83)(0.11)
C o n t r o l  
v a r i a b l e s
YESYESYES
f i r m   F E YESYESYES
c i t y   F E YESYESYES
y e a r   F E YESYESYES
N214221422142
R20.59400.55070.5420
Note: t statistics in parentheses. * p < 0.1.
Table 5. Endogeneity tests.
VariablesPSM-DIDInstrumental
Variable
Approach
Double Machine Learning Method
(1)(2)(3)(4)
p o l i c y 0.175 **0.898 **1.225 *1.011 **
(2.13)(2.14)(1.75)(2.46)
C o n t r o l  
v a r i a b l e s
YESYESYESYES
f i r m   F E YESYESYESYES
c i t y   F E YESYESYESYES
y e a r   F E YESYESYESYES
N2129214221422142
R20.47590.4520
Note: t statistics in parentheses. * p < 0.1, ** p < 0.05.
Table 6. Robustness test.
VariablesReplace the
Dependent
Variable
Adjust the Window
Period
CIC ModelExclude
Interference from Other Policies
(1)(2)(3)(4)(5)(6)
p o l i c y 0.694 *0.176 **0.163 *0.195 *0.195 **0.175 **
(1.75)(2.05)(1.85)(1.94)(2.06)(2.11)
p o l i c y 1 0.031
(0.40)
C o n t r o l  
v a r i a b l e s
YESYESYESYESYESYES
f i r m   F E YESYESYESYESYESYES
c i t y   F E YESYESYESYESYESYES
y e a r   F E YESYESYESYESYESYES
N214216831530214221422142
R20.50360.50470.5175 0.4752
Note: t statistics in parentheses. * p < 0.1, ** p < 0.05. p o l i c y 1 refers to the National Cultural Consumption Pilot City Policy.
Table 7. Mechanism inspection results.
VariablesGrowEsgGinnEsgFconEsg
(1)(2)(3)(4)(5)(6)
p o l i c y 0.064 ** 0.101 * −0.005 *
(1.99) (1.82) (−2.35)
g r o w ^ 2.809 **
(2.21)
g i n n ^ 1.787 **
(2.21)
f c o n ^ −12.751 **
(−2.37)
C o n t r o l  
v a r i a b l e s
YESYESYESYESYESYES
f i r m   F E YESYESYESYESYESYES
c i t y   F E YESYESYESYESYESYES
y e a r   F E YESYESYESYESYESYES
N 214221422142214221422142
R 2 0.21670.47520.68340.47520.85420.4403
Note: t statistics in parentheses. * p < 0.1, ** p < 0.05.
Table 8. Heterogeneity test results.
VariablesState-Owned CEO DualityLabor-Intensive
YesNoYesNoYesNo
(1)(2)(3)(4)(5)(6)
p o l i c y 0.220 **0.1510.3070.236 **0.173 *0.206
(2.28)(0.98)(1.32)(2.55)(1.92)(1.09)
C o n t r o l
v a r i a b l e s
YESYESYESYESYESYES
f i r m   F E YESYESYESYESYESYES
c i t y   F E YESYESYESYESYESYES
y e a r   F E YESYESYESYESYESYES
N 144270035017691598519
R 2 0.50980.44760.55740.49340.50730.4944
Note: t statistics in parentheses. * p < 0.1, ** p < 0.05.
Table 9. The impact of the CTCP policy on ESG rating divergence.
VariablesESG Rating Divergence
All FirmsLarge-Scale FirmsSmall-Scale Firms
(1)(2)(3)
p o l i c y 0.258 **0.1640.582 ***
(2.03)(0.91)(2.92)
C o n t r o l
v a r i a b l e s
YESYESYES
f i r m   F E YESYESYES
c i t y   F E YESYESYES
y e a r   F E YESYESYES
N 989489490
R 2 0.48670.56330.4947
Note: t statistics in parentheses. ** p < 0.05, *** p < 0.01.
Disclaimer/Publisher’s Note: The statements, opinions and data contained in all publications are solely those of the individual author(s) and contributor(s) and not of MDPI and/or the editor(s). MDPI and/or the editor(s) disclaim responsibility for any injury to people or property resulting from any ideas, methods, instructions or products referred to in the content.