Article

Evaluating and Optimizing Water Resources Carrying Capacity in Anji County, China

1
School of Hydraulic Engineering, Zhejiang University of Water Resources and Electric Power, Hangzhou 310018, China
2
International Science and Technology Cooperation Base for Utilization and Sustainable Development of Water Resources, Zhejiang University of Water Resources and Electric Power, Hangzhou 310018, China
3
Estuarine and Coastal Disaster Prevention and Mitigation and Ecological Governance Institute, Zhejiang University of Water Resources and Electric Power, Hangzhou 310018, China
4
Huzhou Hydrological Center, Huzhou 313000, China
*
Author to whom correspondence should be addressed.
Sustainability 2025, 17(18), 8383; https://doi.org/10.3390/su17188383
Submission received: 9 August 2025 / Revised: 15 September 2025 / Accepted: 16 September 2025 / Published: 18 September 2025

Abstract

Water resources’ carrying capacity (WRCC) is crucial for sustainable development, linking natural resources with social and economic systems. Although Anji County in China has relatively abundant water, uneven distribution, strong seasonality, and rising demand from industrialization and population growth have kept the system close to overload. Using a comprehensive evaluation and optimization framework, this study assessed WRCC from 2015 to 2023. Results show the county has long operated near its threshold, with water shortages projected to reach 23% by 2025, though pressures may ease by 2030. Key constraints include high industrial water use, limited reuse of treated wastewater, and low per capita availability. Model simulations suggest that optimized allocation of surface water, groundwater, and reclaimed water could improve carrying capacity by up to 30%. These findings highlight the need for industrial upgrading, water-saving measures, and expanded wastewater reuse, providing practical guidance for resource management in Anji County and a useful reference for other regions facing similar challenges.

1. Introduction

Water resource evaluation is fundamental for sustainable regional economic and social development [1,2,3]. As a vital natural resource, water is central to sustaining human life, ecological balance, and economic prosperity. Its quantity, quality, and spatiotemporal distribution directly constrain urbanization, industrial layout, and ecosystem stability [4,5,6,7]. A scientific evaluation of WRCC can identify relationships among water quantity, quality, ecology, and socioeconomic factors. It also reveals the evolution of supply–demand conflicts and key limiting factors. These insights provide a quantitative basis for resource allocation, development planning, and ecological protection [8,9,10]. Against the backdrop of increasing water scarcity and environmental pressures, conducting precise and dynamic water resource evaluation has become a core technical support for guiding watershed management, urban–rural development, and resource regulation.
Current methods for evaluating WRCC primarily include the TOPSIS ranking model, System Dynamics (SD) simulation, fuzzy comprehensive evaluation, intelligent optimization algorithms, and spatial regression techniques. The TOPSIS model is widely used due to its simple structure, computational efficiency, and suitability for multi-criteria ranking. However, it is highly sensitive to the directionality of indicators and struggles to handle nonlinear relationships among variables [11,12]. The System Dynamics (SD) model can simulate complex internal feedback and multi-scenario changes within a system, making it suitable for long-term dynamic forecasting. Yet, it relies heavily on expert knowledge, demands large datasets, and has lower accuracy in short-term predictions [13,14,15]. Fuzzy comprehensive evaluation excels at handling uncertainty and subjectivity, and its integration with AHP enhances hierarchical clarity. However, weight assignment and membership function design can be influenced by subjective judgment [16,17]. Intelligent optimization algorithms such as RAGA and PSO can avoid local optima and are suitable for complex nonlinear problems, but they require high computational resources and often lack interpretability in their results [18]. The spatial regression model (GTWR) can reveal the spatial heterogeneity of WRCC and effectively captures local variations, but it demands high-quality data and is not well-suited for dynamic prediction tasks [4,19].
As the conflict between water supply and demand has intensified in recent years, the optimal allocation has become a key focus in water resource research. Its core is achieving efficient and sustainable water use under multi-objective and multi-constraint conditions. Research methods have evolved from traditional optimization techniques such as linear programming (LP) and dynamic programming (DP) [20] to multi-objective programming (MOP), coupled simulation–optimization approaches, and intelligent algorithms. Multi-objective optimization is widely applied in regional water resource allocation because it balances social, economic, and ecological benefits [21]. In model development, tools like WEAP and GWAS are commonly used to construct multi-scenario models for simulating and optimizing regional water supply–demand dynamics and optimal use strategies [22,23,24]. To overcome the tendency of traditional algorithms to fall into local optima, various intelligent algorithms, such as the SA-PSO algorithm and improved MOHUS hunting search, have been introduced, significantly enhancing solution quality and computational efficiency [25,26]. Additionally, some studies have incorporated prospect theory [27], ecological water quality constraints [28], and water security indicators [29] to improve model adaptability to real-world decision-making and region-specific issues.
Anji County in southeastern China has relatively abundant water resources, with per capita availability above the provincial average. However, distribution is uneven: the southwestern mountains are water-rich, while the northeastern plains often face shortages, and some areas are also exposed to risks of water quality degradation. Beyond these physical conditions, Anji holds a distinctive position as China’s first National Ecological County and the birthplace of the “Lucid waters and lush mountains are invaluable assets” concept, which has made it a national model for green development. Its economy features both eco-friendly industries, such as bamboo, tourism, and ecological agriculture, and rapidly growing manufacturing sectors that create rising water demand. This dual structure distinguishes Anji from water-scarce regions in Northwest China, where absolute shortage is the main issue; here, the challenge lies in seasonal variability, spatial imbalances, and sectoral competition. Against the backdrop of Zhejiang Province’s “14th Five-Year Plan” and strong local ecological policies, Anji provides a representative case for examining how relatively water-abundant but structurally imbalanced regions can achieve sustainable allocation. To address these challenges, this study develops a comprehensive evaluation framework encompassing natural, economic, and ecological dimensions. It applies multiple weighting and optimization methods to reduce subjectivity and improve accuracy. By linking WRCC assessment with allocation optimization, the study establishes a systematic pathway from diagnosis to adjustment, offering scientific evidence and practical guidance for long-term water resource management in Anji and comparable regions.

2. Materials and Methods

2.1. Overview of the Study Area

Anji County is located in the central region of the Yangtze River Delta in China, with coordinates ranging from 119°14′ to 119°53′ E and 30°23′ to 30°53′ N. The area experiences a subtropical monsoon climate (Figure 1). As a key gateway in the northwest of Hangzhou’s metropolitan economic circle in Zhejiang Province, Anji holds a strategic position within the Yangtze River Delta economic zone. The county’s economy is characterized by rapid growth, structural improvement, and strong development momentum. Annual precipitation is relatively abundant, with a multi-year average ranging from 1400 to 1900 mm. While the total volume of water resources and per capita availability are sufficient, their spatial and temporal distribution is uneven, with significant seasonal variations in water supply.

2.2. Data Source

Based on the principles of scientific rigor, hierarchical structure, operability, and sustainable development, and considering the coupling relationships among water resources, geography, population, and ecology, this study selects twelve key indicators to evaluate the WRCC of Anji County. The corresponding data covering the years 2015–2023 were obtained from statistical yearbooks, government bulletins, and planning documents. Detailed sources and time spans are summarized in Table 1.
To ensure data quality and reliability, all raw data underwent integrity and consistency checks prior to analysis. For years with missing or incomplete records, linear interpolation and adjacent-year averaging were applied to fill gaps, while anomalous values were cross-validated against official statistical yearbooks and hydrological bulletins before correction. In addition, all datasets were standardized to eliminate unit inconsistencies and to improve comparability across indicators. These preprocessing procedures guaranteed that the evaluation and modeling results were based on coherent and robust data.

2.3. Research Methods

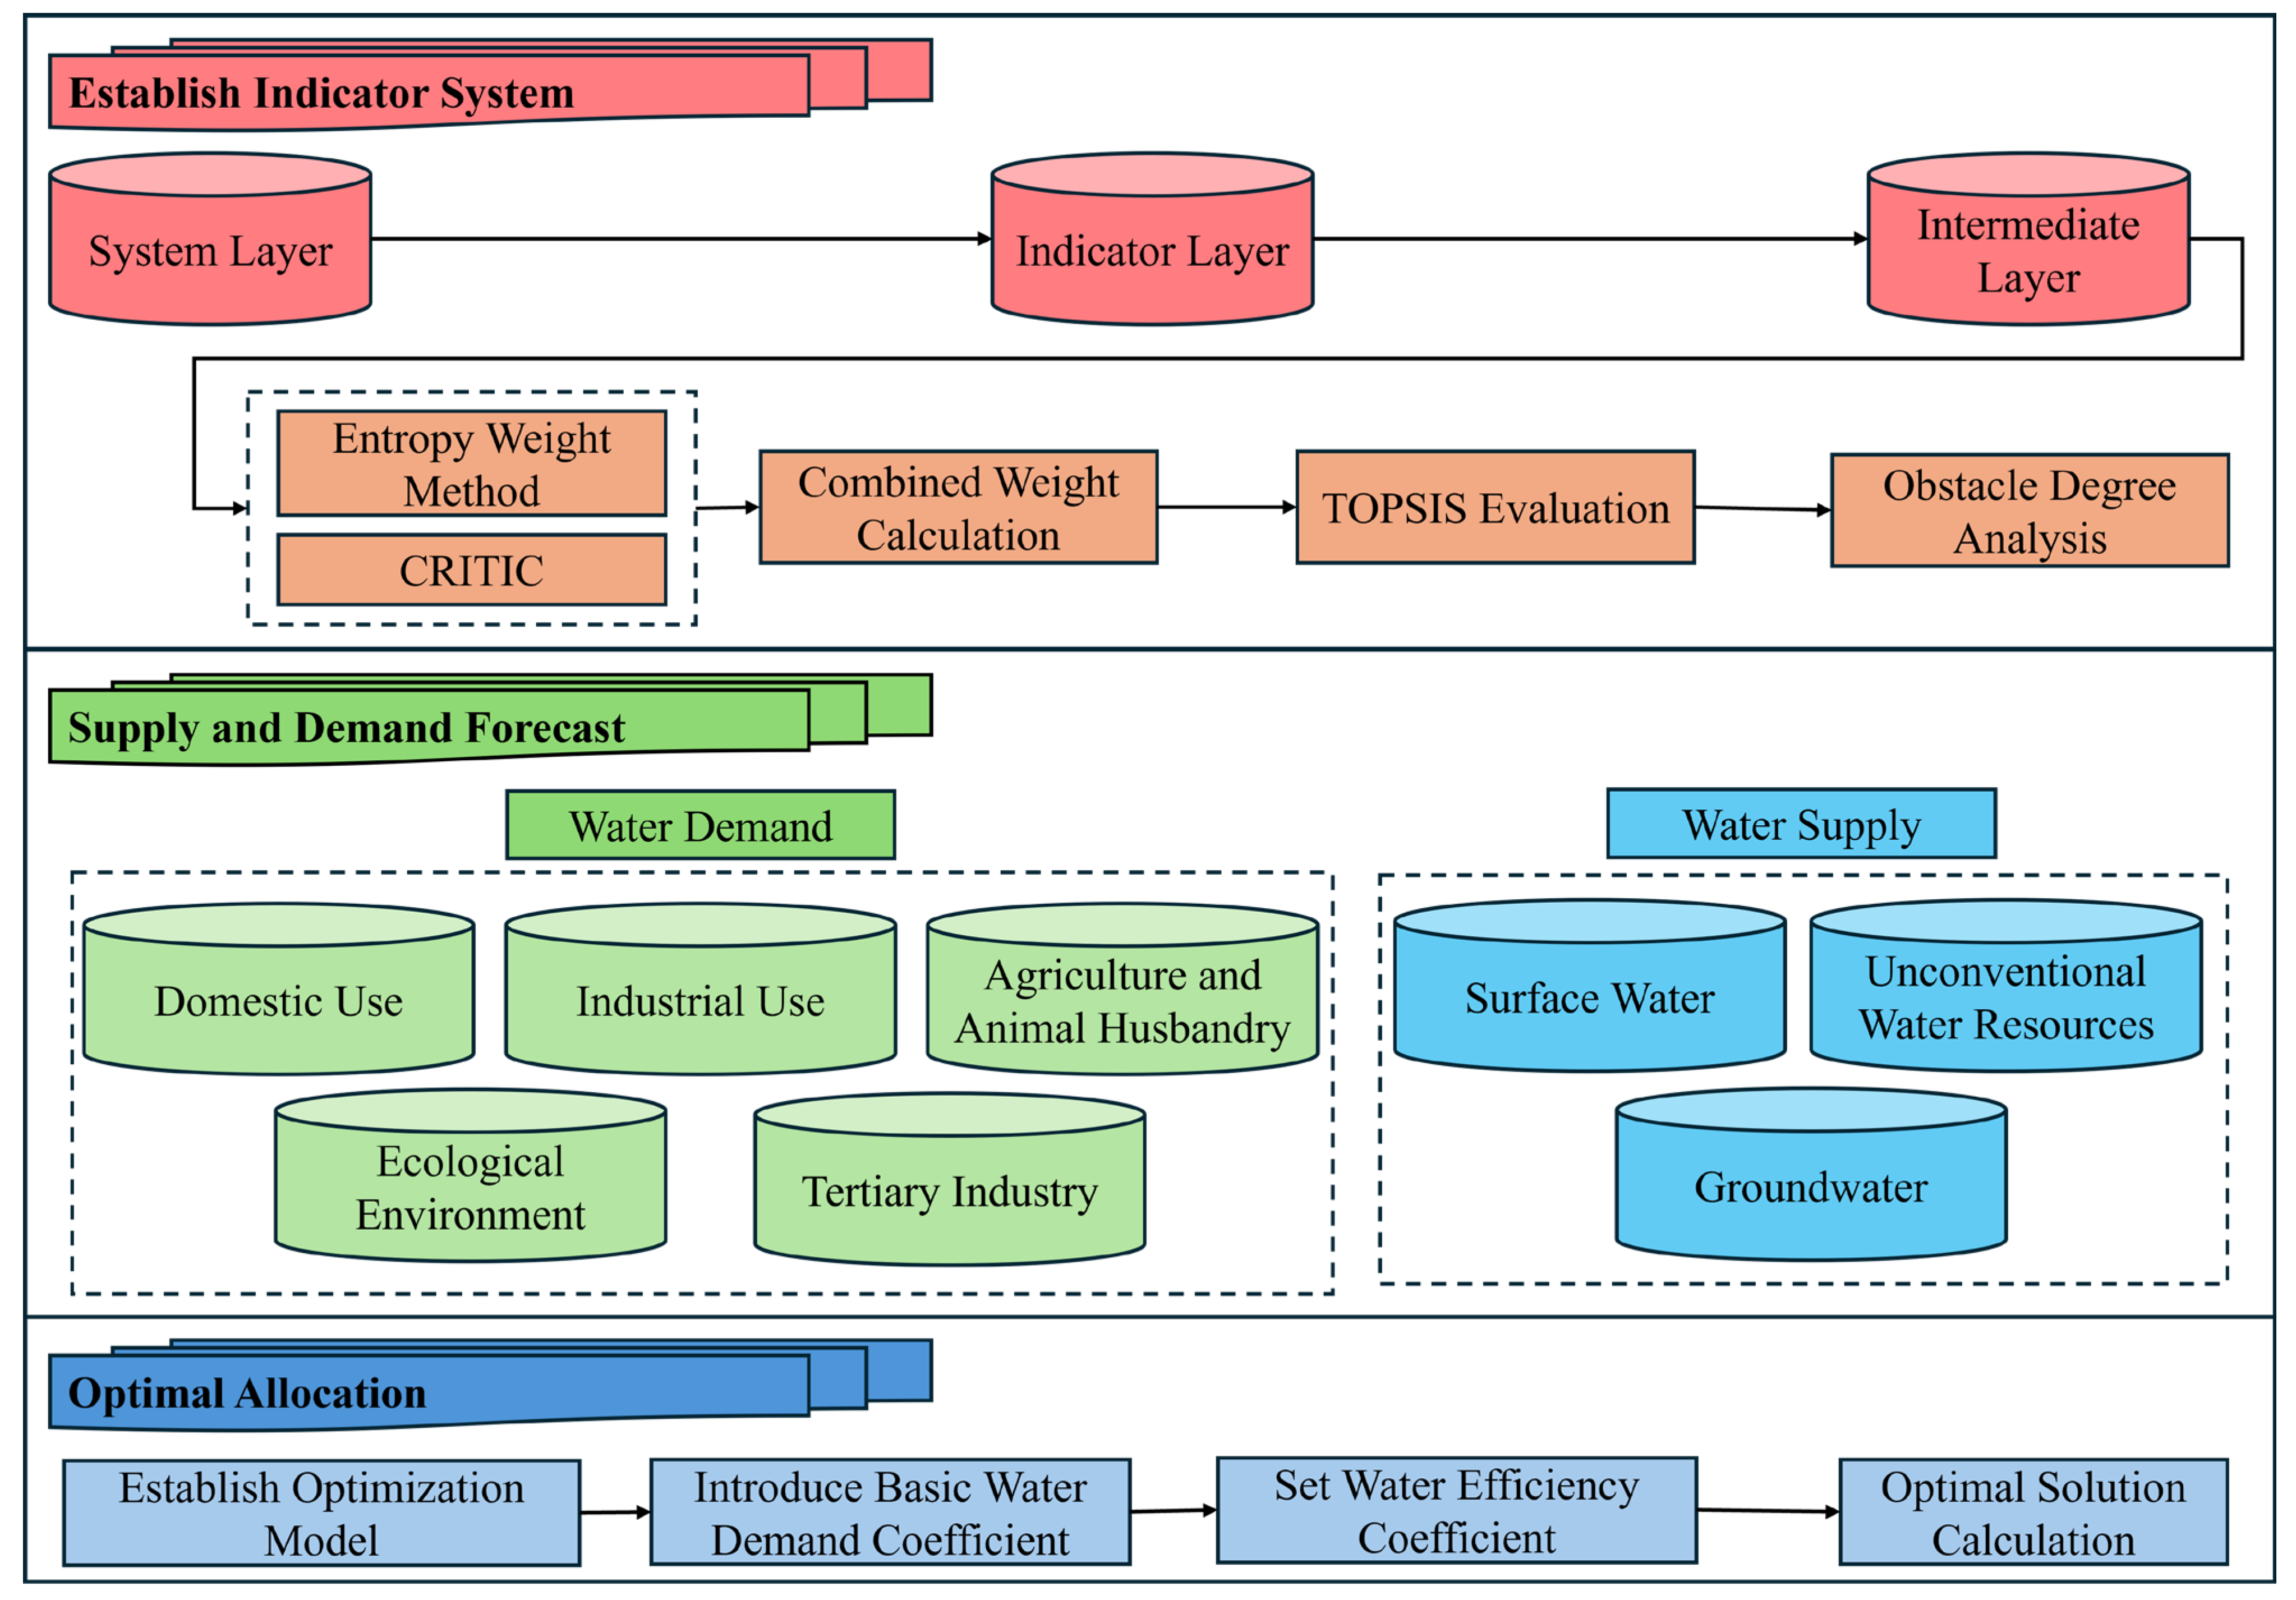
This study proposes a tripartite framework designed to assess the carrying capacity, forecast supply–demand dynamics, and optimize the allocation of water resources in Anji, in accordance with the specific attributes and developmental needs of its local water resource system. The framework is structured hierarchically around three levels: objectives, systems, and indicators (Figure 2). Weights are assigned to indicators using a combined entropy-CRITIC approach, and system evaluation is performed via the TOPSIS model. Based on this, combined with socioeconomic development trends and spatial planning, the quota method and replenishment model are used to forecast future water supply and demand patterns, clarifying the supply capabilities of various water sources and the water demand across different industries. A linear programming optimization model to maximize net benefits is constructed to address potential supply–demand imbalances. This model coordinates the allocation relationships of surface water, groundwater, and unconventional water resources across five major water use sectors, achieving efficient utilization and scientific regulation of water resources.

2.3.1. WRCC Evaluation Method

Indicator System Construction
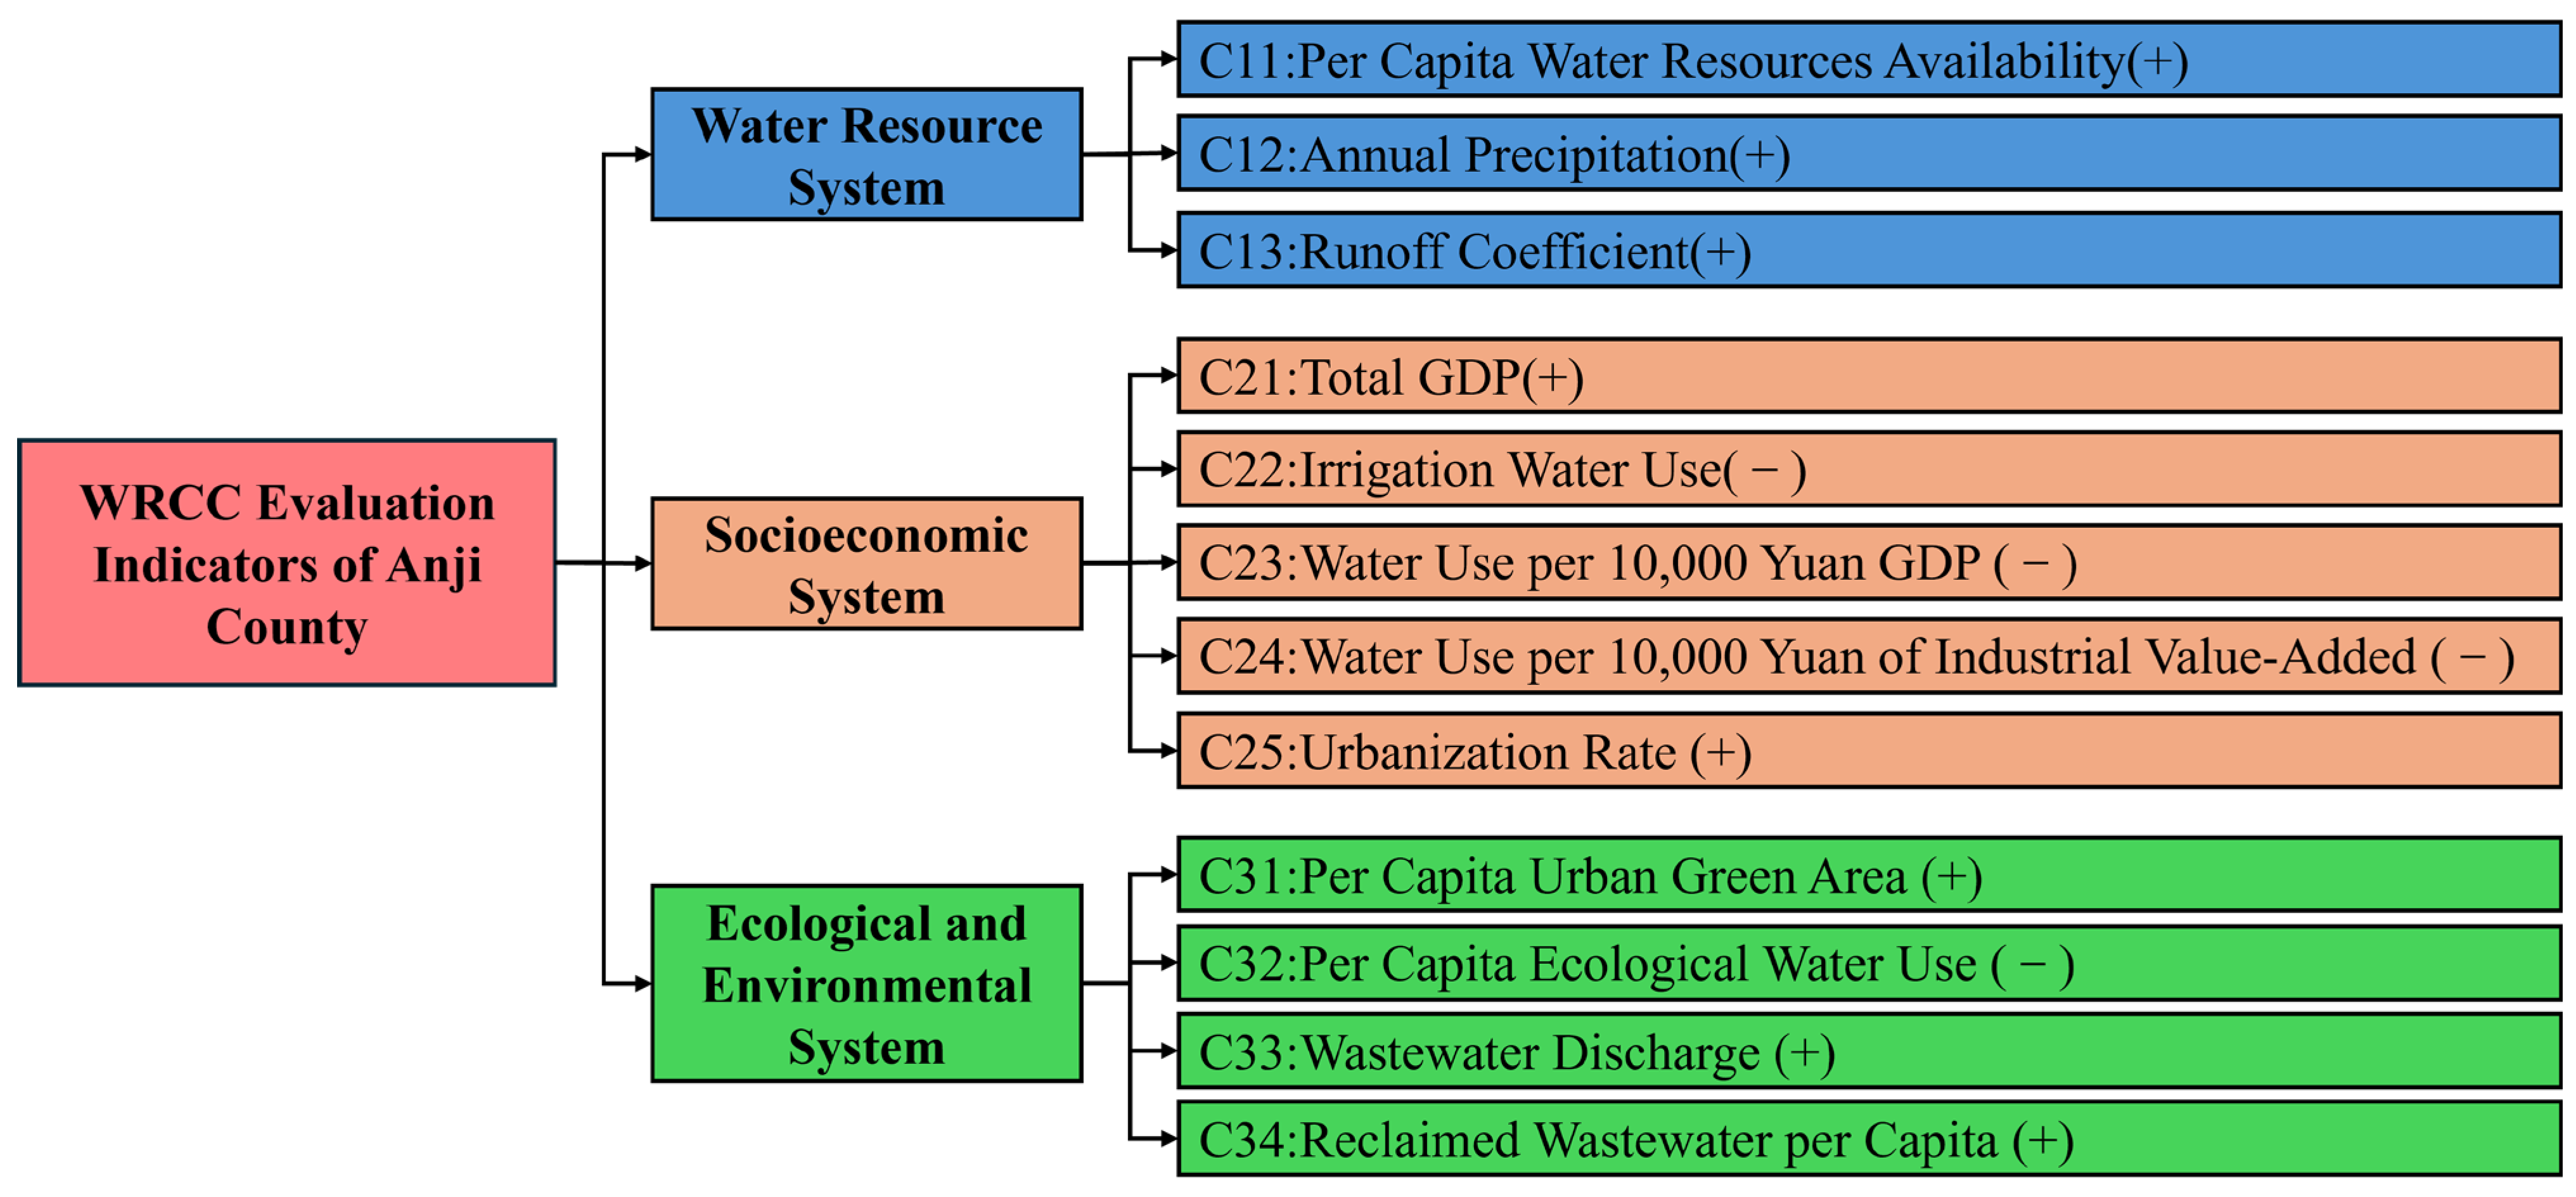
The WRCC evaluation indicator system is a core tool for measuring regional resource utilization and coordinating with social, economic, and ecological systems [30]. Scientifically constructing the indicator system is the foundation for ensuring objective and effective evaluation results. This study, based on the resource endowment and current development status of Anji County, follows four basic principles: scientific validity, hierarchical structure, operability, and sustainability. The indicator design also draws on established references, including the UN-Water framework for water resource sustainability assessment and the guidelines issued by the Ministry of Water Resources of China for WRCC evaluation, ensuring both international comparability and local applicability. A three-level structure was adopted, consisting of the target, system, and indicator layers. The system layer includes the water resources, socioeconomic, and ecological environment subsystems. The indicator layer comprises 12 core indicators (Figure 3), which capture the current carrying status while also supporting dynamic forecasting. Furthermore, the polarity (positive or negative) of each indicator was determined in accordance with the entropy weight method. Indicators were classified as positive when higher values imply stronger water supply capacity, higher resource use efficiency, or improved ecological sustainability (e.g., per capita water resources, precipitation, reclaimed water). Conversely, indicators were defined as negative when higher values represent greater stress on water resources or lower efficiency of utilization (e.g., irrigation water use, water consumption per GDP).
Entropy Weight Method
The entropy weight method is an objective weighting approach based on information entropy. It evaluates each indicator’s degree of order and relative importance by quantitatively analyzing the frequency of variation in the data [31]. This method serves as a crucial step in the data preprocessing stage, with its core objective being to eliminate the influence of differing units or magnitudes among raw data through standardization. This ensures fairness and accuracy in the subsequent analytical processes. According to the entropy method, the greater the fluctuation of an indicator, the more information it conveys and the higher the weight it should be assigned. Therefore, it enables a rational allocation of weights in the comprehensive evaluation based on the informational disparity among indicators [20].
CRITIC Method
The CRITIC method integrates indicator variability and inter-indicator correlations. It constructs a unified evaluation matrix to quantify information and derive final weights. Compared to weighting methods that consider only a single dimension, the CRITIC method emphasizes comprehensiveness and rationality in weight distribution. It effectively captures each indicator’s discriminative power and independence in the comprehensive evaluation [32].
Calculation of Combined Weights
Given that the entropy weight method emphasizes the dispersion of indicators, while the CRITIC method considers variability and inter-indicator correlation, each method has its strengths. To balance the information utilization efficiency and the comprehensiveness of the evaluation, this study adopts the multiplicative composite method to integrate the results of the entropy method and the CRITIC method [33,34,35,36,37], and compares with the additive composite method, thereby obtaining the final combined weights. The calculation formula is as follows (Equation (1)):
w i = w 1 i w 2 i i = 1 n w 1 i w 2 i
The w1i represents the weight of the i-th indicator obtained by the entropy weight method, while w2i corresponds to the same indicator calculated by the CRITIC method. This composite method introduces a multiplicative relationship between the two approaches in its structure to enhance the synergistic impact of high-weighted indicators. At the same time, normalization is applied to ensure that the sum of all weights equals 1, thus improving the stability and rationality of the final evaluation.
TOPSIS Model Evaluation and Calculation
After determining the combined weights of all indicators, this study further employs the TOPSIS model to comprehensively evaluate the WRCC in Anji County from 2015 to 2023. Based on the principle of “closest to the positive ideal solution and farthest from the negative ideal solution,” the TOPSIS model enables the scientific ranking of evaluation objects across multiple indicators [38,39].
Specifically, the TOPSIS model first constructs a weighted normalized matrix and then calculates the Euclidean distance of each evaluation unit (e.g., each year) from the positive and negative ideal solutions, respectively [40]. Based on these distances, the closeness coefficient for each unit is derived. A closeness value closer to 1 indicates a more favorable water resources carrying status for that year, whereas a lower value suggests higher pressure on water resources and the need for greater attention. This model is characterized by its computational simplicity, intuitive results, and clear logic, making it well-suited for comprehensive evaluations in regional development contexts.
This study adopts the equal-interval classification method based on the closeness coefficient values to clarify the interannual distribution of WRCC. To ensure the scientific validity of the grading, the division into five levels refers to the national and provincial water scarcity and carrying capacity warning thresholds (e.g., China Water Resources Bulletin). Furthermore, a consistency test was conducted to verify that the equal-interval classification aligns with the threshold-based categories. The resulting five-level classification for Anji County is presented in Table 2.
Obstacle Factor Analysis of WRCC
The obstacle degree model adopts a quantitative approach to assess the hindering effect of each indicator on the overall process. Ranking the results, it identifies the key bottlenecks that impede development and accurately measures the impact of these critical limiting factors [41].
First, data are standardized, and indicator weights are determined.
The standardized matrix is identical to that obtained through the entropy-based standardization process, and the weights used are the combined weights previously calculated by integrating the entropy method and the CRITIC method.
Next, the degree I of each indicator is calculated.
I = 1 X
Third, the obstacle degree Qij is calculated for each indicator.
Q i j = W i I i j j = 1 n W j I i j
In Step 2, X represents the standardized matrix data. In Step 3, the calculation formula involves the combined weight of the indicator and its deviation degree.

2.3.2. Methods for Forecasting Water Supply and Demand

Water Demand Forecasting
Water demand forecasting is fundamental in analyzing regional water resources’ carrying capacity [42]. It aims to estimate the total water demand for future planning years by integrating socioeconomic development trends and spatial planning strategies. The forecasting method is based on key indicators of the national economy. Sectoral water quotas are established by reviewing and analyzing historical water use patterns. These are combined with population projections, industrial structure evolution, and ecological water requirements to calculate the total projected water demand for the planning period.
In the case of Anji County, domestic water demand is estimated based on the urban and rural population size P and the per capita domestic water quota Q. Industrial water demand is calculated using the industrial added value Z and the industrial water quota μ. Agricultural and livestock water demand is comprehensively estimated by combining the irrigated area A, the planned irrigation water quota Qn, and the utilization coefficient η. Ecological and environmental water demand is calculated based on urban green area Pm, road sprinkling area Pn, and the corresponding quotas Qm and Qn. Tertiary industry water demand is derived from the sector’s added value Z and the corresponding water use quota Qt.
The water demand forecasting results for 2025 and 2030 under two assurance levels, P = 50% and P = 75% are presented in Table 3.
The calculation processes for the relevant water demand components are as follows:
W s h = 0 . 365 ( P c Q c + P g Q g )
W g y = Z × μ
W n t = A Q n η
W s c = 0.365 i = 1 2 n i Q a
W s t = ( P m × Q m + P n × Q n ) × 0.365
W d s = Z Q t 10 4
Water Supply Forecast
Water supply forecasting estimates the total volume of water resources that can be made available for various regional sectors during future planning years [42], based on current water resource conditions and future water supply plans. The main water sources in Anji County include surface water, groundwater, and non-conventional water resources. Surface water mainly comes from storage projects (Qx) and diversion projects (Qy), and its supply capacity is estimated using the re-storage method and water diversion quota model, incorporating parameters such as the re-storage coefficient (β), effective reservoir capacity in the planning year (Vs), irrigation guarantee coefficient (C), effective irrigated area (A), irrigation quota (M), and the irrigation water utilization coefficient (η), to determine the supply capacity under different assurance levels. Groundwater supply is projected according to the 14th Five-Year Plan for Water Resources Development in Anji County, which estimates an available groundwater supply of 8 million m3 in 2025 and 10 million m3 in 2030. The non-conventional water supply, such as reclaimed wastewater (Qc), is expected to provide 21.9 million m3 in 2025 and 36.5 million m3 in 2030.
Based on the above data, the forecasted water supply volumes for 2025 and 2030 under different assurance levels are summarized in Table 4.
The calculation processes for the relevant components of water supply are as follows:
Q x = β V s
W y = C A M η
Q c = Q d × c

2.3.3. Water Resource Optimization Allocation Method

To achieve sustainable utilization and efficient allocation of water resources, it is essential to establish a scientifically sound water resources optimization allocation model. This model aims to reasonably allocate water among domestic, industrial, agricultural, ecological, and tertiary sectors while meeting the demands of socioeconomic development. It also seeks to coordinate the distribution among various water sources, minimize the supply–demand gap, improve resource use efficiency, and alleviate potential supply–demand imbalances that Anji County may face in the planning years.
The model is designed to maximize net benefits by formulating an objective function that accounts for the allocation benefits and associated costs of three water sources—surface water, groundwater, and reclaimed wastewater—across five major water-use sectors: domestic, industrial, agricultural, ecological, and tertiary industries. A set of constraints is incorporated into the model, including supply–demand balance constraints, water source capacity constraints, upper and lower bounds on water demand, and non-negativity constraints, to ensure that the allocation results are consistent with both resource endowments and practical needs. In defining the upper and lower bounds of water demand, a “basic water use coefficient” (α) is introduced to reflect the priority level assigned to each sector. By adjusting the value of α, the model emphasizes the guarantee hierarchy across sectors, in which domestic water use holds the highest priority, followed by tertiary and ecological water use, with industrial and agricultural uses ranked lower.
The supply capacity parameters and maximum allowable supply volumes for each type of water source are determined based on the aforementioned water supply forecasts, in conjunction with the total annual runoff, reclaimed water availability, and the groundwater exploitation limit in the planning years. The water-use benefit coefficients are defined according to the economic output generated per unit of water resource, as shown in Table 5.
In terms of solution methodology, the proposed model is transformed into a multi-source, multi-object linear programming problem, which is then solved to obtain the optimal allocation. This method offers good applicability and operational simplicity for small- to medium-scale regional water resource systems, enabling effective quantification and optimal allocation of resource distribution schemes.
The objective function of the water resources optimization allocation model is expressed as follows (Equation (13)):
N = max j = 1 5 ( p 1 i j d 1 i j ) ω 1 i j + j = 1 5 ( p 2 i j d 2 i j ) ω 2 i j + j = 1 5 ( p j i j d j i j ) ω 3 i j
where pkij and dkij represent the unit benefit and unit cost of allocating water from source type k to user category j, while ωkij denotes the corresponding allocated water volume.
To ensure the rationality and feasibility of water resources allocation, the following constraints are formulated:
(1) Supply–Demand Balance Constraint
W g = W B g + W D g + W I g , D W g
where WBg denotes surface water supply, WDg denotes groundwater supply, WIg denotes reclaimed water supply, Wg is the total available water, and D is the total demand. This constraint ensures that the total supply is not less than the total demand.
(2) Water Source Capacity Constraints
j = 1 5 ω 1 j Q s u r f a c e ,   j = 1 5 ω 2 j Q g r o u n d ,   j = 1 5 ω 3 j Q r e u s e
where Qsurface, Qground, and Qreuse represent the maximum capacities of surface water, groundwater, and reclaimed water, respectively. This constraint ensures that withdrawals from each water source do not exceed its allowable capacity.
(3) Demand Constraints
D min ω 1 j + ω 2 j + ω 3 j D max
where Dmax is the forecasted demand of user j, and Dmin = αDmax, the user categories are defined as j = 1 domestic, j = 2 industrial, j = 3 agricultural, j = 4 ecological, and j = 5 tertiary-sector use.
The basic water-use coefficient α reflects sectoral priorities: α = 1.0 ensures a full guarantee of domestic demand, α = 0.85 moderately guarantees tertiary-sector use, α = 0.80 prioritizes ecological use, and α = 0.78 allows for appropriate reduction in industrial and agricultural use. Accordingly, the order of priority is: domestic > tertiary sector > ecology > industry and agriculture, consistent with the principle of rational and efficient water utilization.
(4) Non-negativity Constraints
ω 1 j 0 , ω 2 j 0 , ω 3 j 0
These constraints require that allocations from surface water, groundwater, and reclaimed water are non-negative.
The net benefit coefficients reflect both sectoral priority and economic efficiency. Domestic water use is assigned a baseline coefficient of 1.0, as it is fundamental and irreplaceable. The industrial coefficient was derived from the ratio of industrial added value to water consumption, with cost deductions, based on data from the Huzhou Statistical Yearbook (2015–2023). The agricultural coefficient was calculated as the reciprocal of irrigation water use per unit output, following the Zhejiang Provincial Agricultural Water Quota Standard and local crop water-use data (tea and bamboo). The ecological coefficient was determined using the opportunity cost method, referring to ecological compensation values in the Anji County “14th Five-Year” Water Resources Development Plan. The tertiary-sector coefficient was also estimated via the opportunity cost approach, drawing on sectoral added value statistics and prior studies [43]. These sources and calculations ensure both the local applicability of the coefficients and comparability with existing WRCC optimization studies.

3. Results

3.1. Evaluation of WRCC

3.1.1. Analysis of Indicator Influence in the Evaluation

The standardized data were used to calculate the weights of each indicator, revealing their varying impacts on the WRCC of Anji County, as shown in Table 6. A comparison of the multiplicative and additive methods revealed that their outcomes were largely consistent, thereby establishing the feasibility of the multiplicative method for this application. The comprehensive evaluation results show that per capita water resources (C11), annual precipitation (C12), and water yield coefficient (C13) have the highest weights within the water resource system, all being positive indicators that play a key role in measuring regional water supply capacity. Per capita water resources directly reflect the level of freshwater available to residents and are a key metric for assessing water abundance. In the production and living systems, GDP (C21) weight is 0.0778, indicating that economic development provides financial and technical support for water resource development, utilization, and protection. As an important indicator of post-use discharge, return water volume is a valuable reference for evaluating water use efficiency and environmental impact. In the ecological environment system, per capita public green space area (weight 0.0629) is also a positive indicator, reflecting its beneficial role in water conservation and ecological improvement, though its influence is comparatively lower. Overall, high-weight positive indicators across all systems form the primary influencing factors of regional WRCC, reflecting an integrated mechanism that balances resource supply, economic development, and ecological security.

3.1.2. Analysis of Evaluation Results

Based on a comprehensive evaluation using the TOPSIS model, the annual water resource utilization scores for Anji County from 2015 to 2023 exhibited considerable fluctuations(Table 7). The mean score during this period was 0.5135, indicating that the region’s water resource utilization consistently approached saturation levels. The score dropped to 0.4067 in 2017, nearing the “slightly overloaded” threshold, and subsequently rose to 0.6595 in 2020, denoting a more favorable status. These variations cannot be attributed solely to precipitation and aggregate economic output. Structural and institutional factors also played a critical role. For example, the persistent influence of water consumption per unit of industrial output (C24) reflects the effects of industrial restructuring, where the gradual transition from resource-intensive manufacturing toward green industries and tourism has alleviated part of the pressure in recent years. Likewise, fluctuations in the urbanization rate (C25) highlight demographic and spatial dynamics that altered domestic and ecological water demand. Moreover, the post-2020 improvement was also driven by local and provincial policies aimed at enhancing water efficiency and expanding unconventional water sources, such as those outlined in Zhejiang’s “14th Five-Year Plan” for water resource utilization and initiatives promoting reclaimed wastewater use. The temporal volatility in the WRCC of Anji is primarily driven by the complex interplay of climatic variability, industrial transformation, socioeconomic dynamics, and institutional interventions.

3.1.3. Analysis of Obstacle Degree Results

For the 12 evaluation indicators of WRCC in Anji County from 2015 to 2023, we conducted a quantitative analysis of obstacle degrees for each indicator. Annual rankings were compiled to identify the top five key obstacle factors each year, as shown in Table 8. Based on the table, the primary constraints on the water resource carrying capacity in Anji include the efficiency of wastewater reuse, water consumption per unit of industrial output, and the utilization rate of water yield. From 2015 to 2020, the reuse rate of treated wastewater was the most significant obstacle. A notable shift occurred in 2021, with the dominant limiting factor becoming the per capita water availability. Given the complexity of the tabular data, this study further illustrates the trends of obstacle factors by plotting line charts for the three criterion layers—water resource system, production–living system, and ecological–environmental system—across all years to provide a more intuitive understanding of their variations.
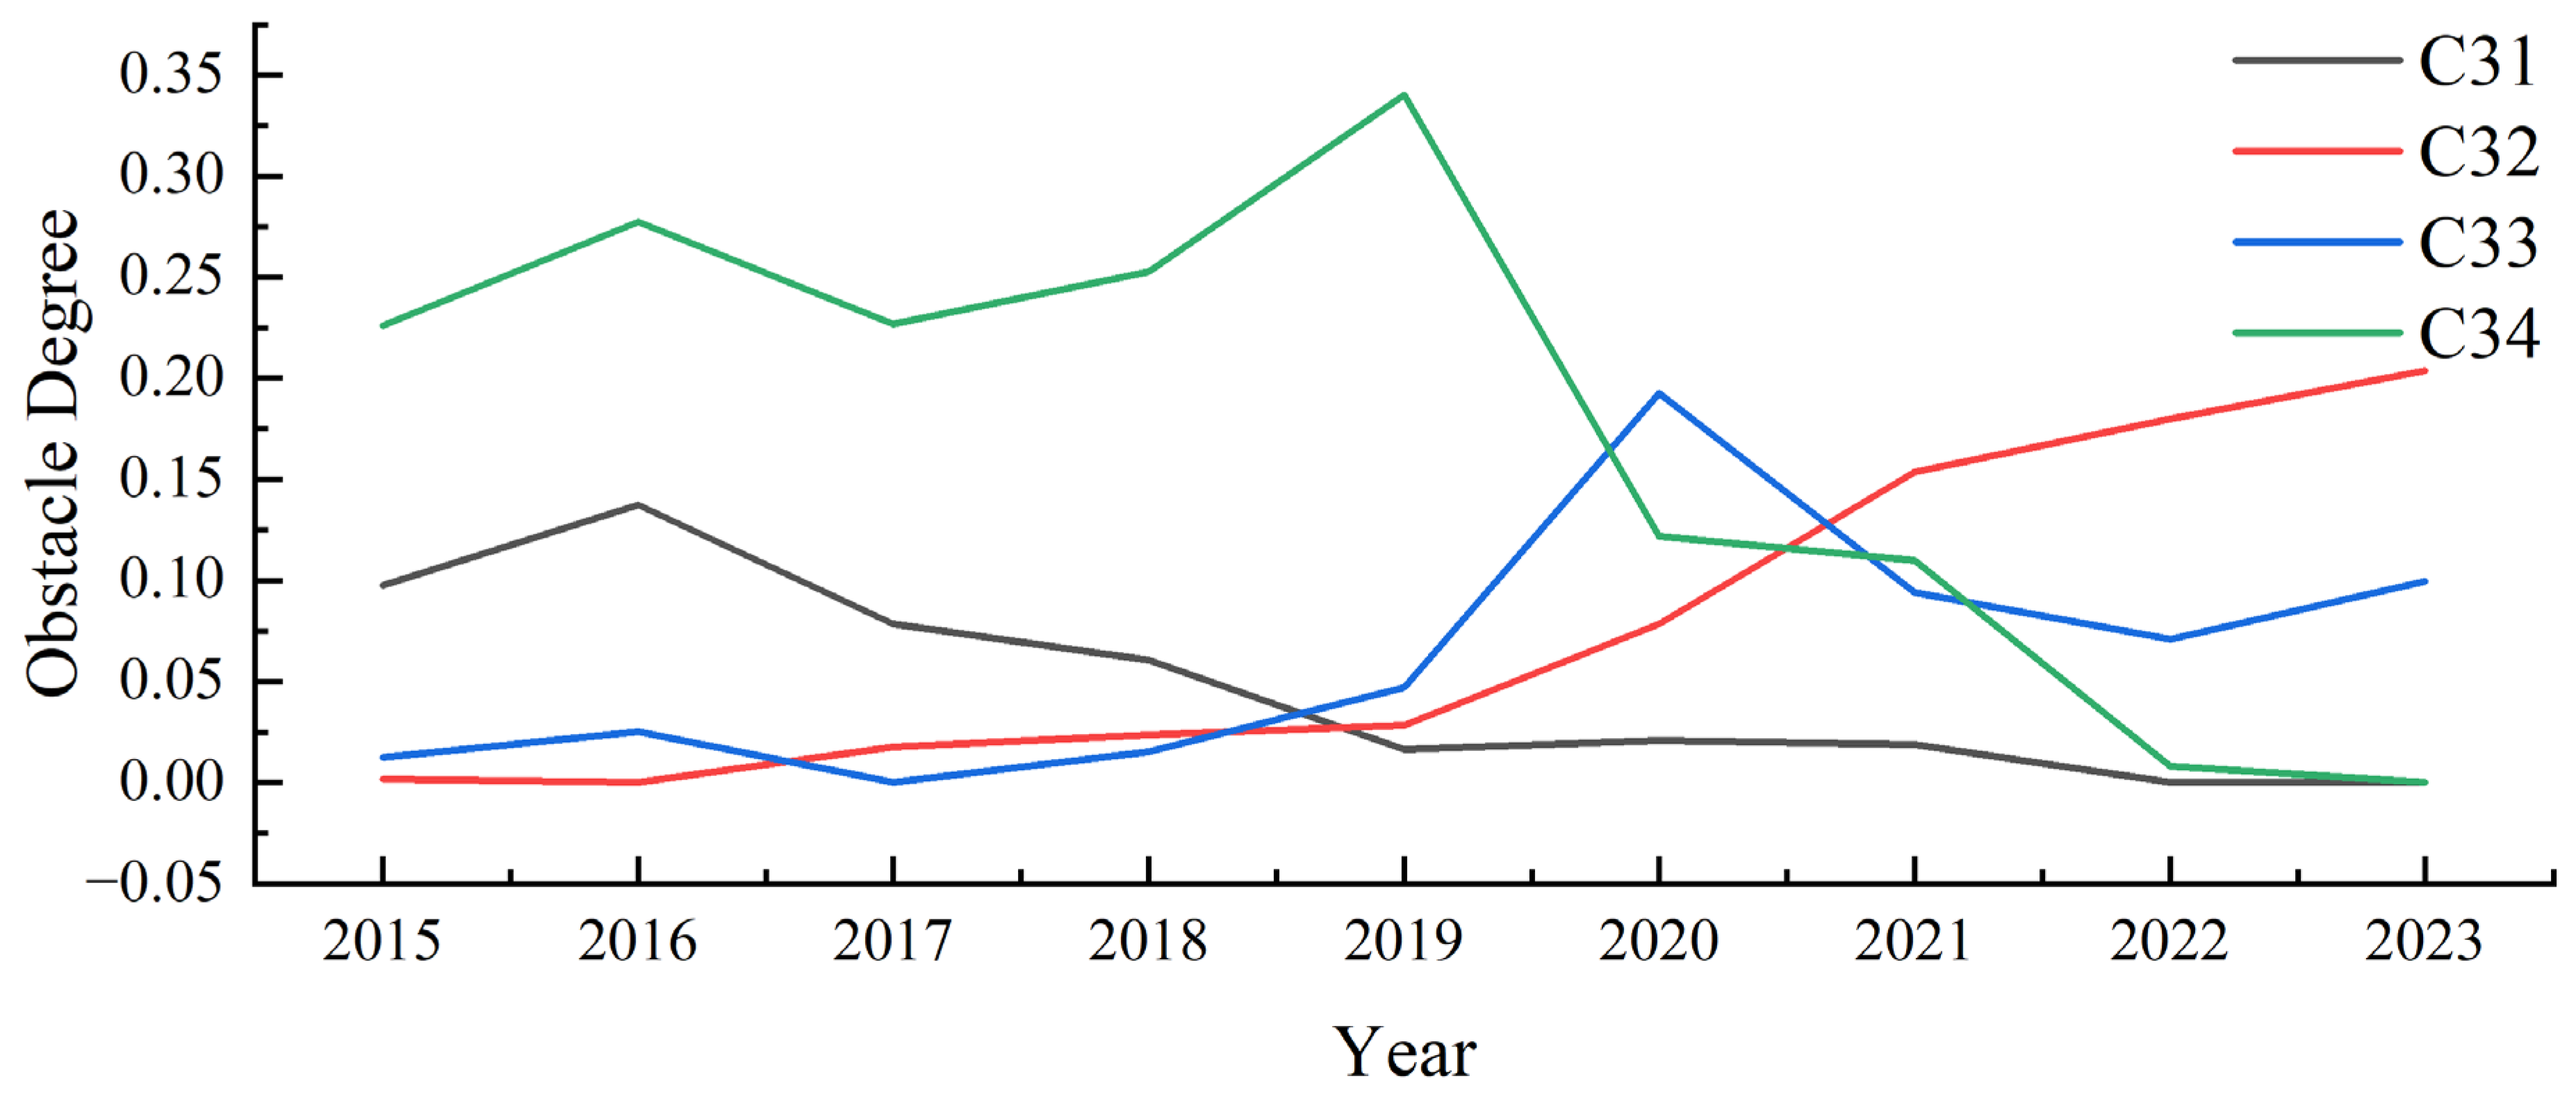
As shown in Figure 4, the obstacle degree trends of the Ecological and Environmental System indicate that three key indicators within Anji County’s water resource system exhibited an overall upward trajectory. Among them, the availability of per capita water resources showed a significant decline between 2021 and 2022, emerging as a major obstacle. In the production and living system, the obstacle degrees of the five indicators generally declined, with the urbanization rate displaying considerable fluctuations and lacking sustained impact. In the ecological and environmental system, the trends of individual indicators varied. The reuse rate of treated wastewater was a major limiting factor during the first five years due to its high degree of obstacles, but its influence has weakened in recent years.

3.2. Analysis of Water Supply–Demand Balance

The water demand for both the near-term and long-term planning years is projected by analyzing water consumption across various sectors and incorporating relevant coefficients. Correspondingly, the water supply for these planning periods is estimated based on surface water, groundwater, and other alternative sources. A comparative analysis is then conducted to identify potential water shortages under different levels of supply reliability. Table 9 presents the water supply–demand balance forecasts for Anji County in 2025 and 2030, under two water supply assurance rates (P = 50% and P = 75%). The results indicate a notable water shortage in 2025 under both normal and dry year scenarios, with respective deficits of 42.6642 million m3 and 69.7698 million m3, and water shortage rates of 17.3% and 23.0%. These findings suggest significant pressure on the regional water supply during this period. The imbalance in 2025 may be attributed to abnormal climatic conditions resulting in insufficient precipitation and surging water demand driven by rapid economic development.
In contrast, the forecast for 2030 shows a notable improvement. Under a 50% water supply assurance rate, the water supply exceeds demand, resulting in a surplus of 5.2678 million m3, indicating a favorable water supply situation. Although a water shortage still exists under the 75% assurance rate scenario, the shortage rate decreases to 6.1%, significantly lower than in 2025. This enhanced capacity for water resource allocation at this stage can be attributed to improved ecological civilization driven by the common prosperity policy objectives and ongoing advancements in water-saving initiatives and water resource utilization technologies.
The overall forecast results indicate that under normal hydrological (average water) year conditions, Anji County is unlikely to experience extreme water shortages, reflecting the effectiveness of recent water-saving policies and water resource management technologies. However, under dry-year scenarios, localized supply–demand imbalances may still arise due to reduced precipitation and limited flexibility in water source allocation. Therefore, it is necessary to strengthen the use of unconventional water sources and the construction of water storage and regulation infrastructure in future water resource management. Additionally, formulating dynamic and optimized allocation strategies for drought years will be essential to enhancing the resilience and adaptability of the regional water resource system.

3.3. Optimal Allocation of Water Resources

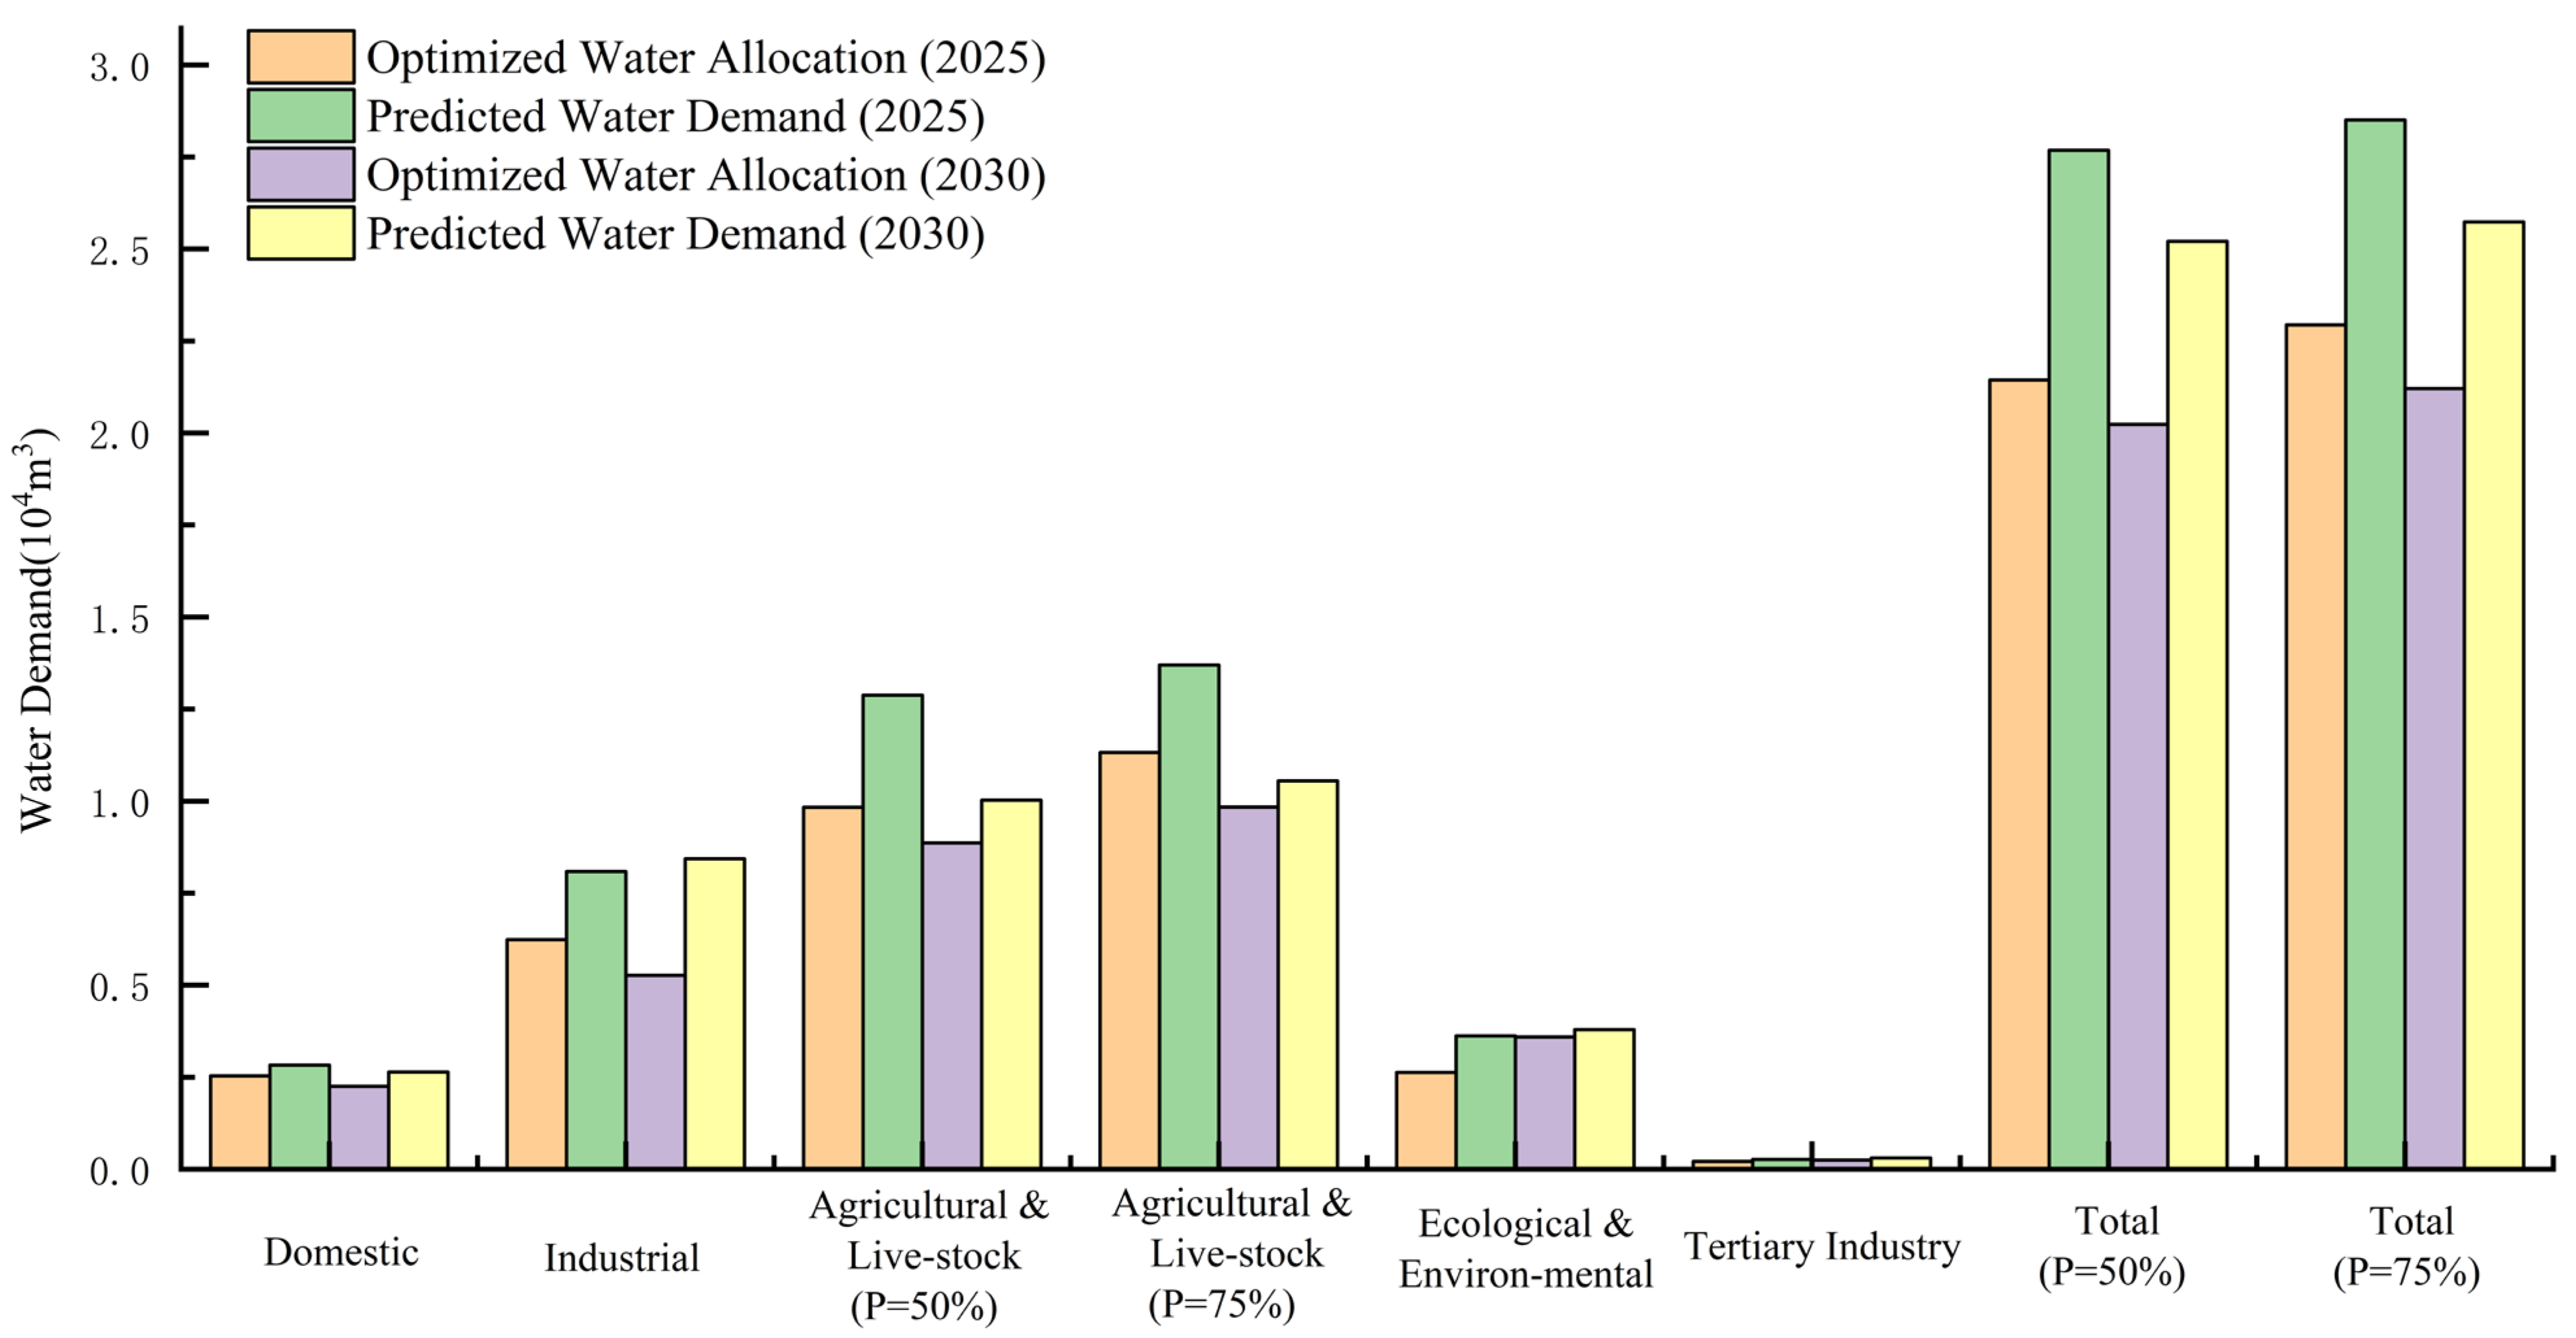
An Excel-based model was developed, incorporating constraint conditions related to production, domestic use, ecological needs, and the tertiary sector by establishing an objective function for water resource allocation. These constraints include supply–demand balance, limitations on water supply capacity, prioritization principles for water demand, and the non-negativity requirement for allocated water volumes. The model was applied to analyze and evaluate the supply–demand balance for the planning years 2025 and 2030. Through model construction and a series of calculations, an optimized water allocation scheme for Anji County has been determined (Table 10). A comparative analysis of the projected water demand and the optimized allocation for 2025 and 2030 is presented in Figure 5, which facilitates an evaluation of the regulatory efficacy while identifying inherent limitations in the optimization methodology. The differences between optimized allocations and projected demands are further detailed in Table 11 for clarity.
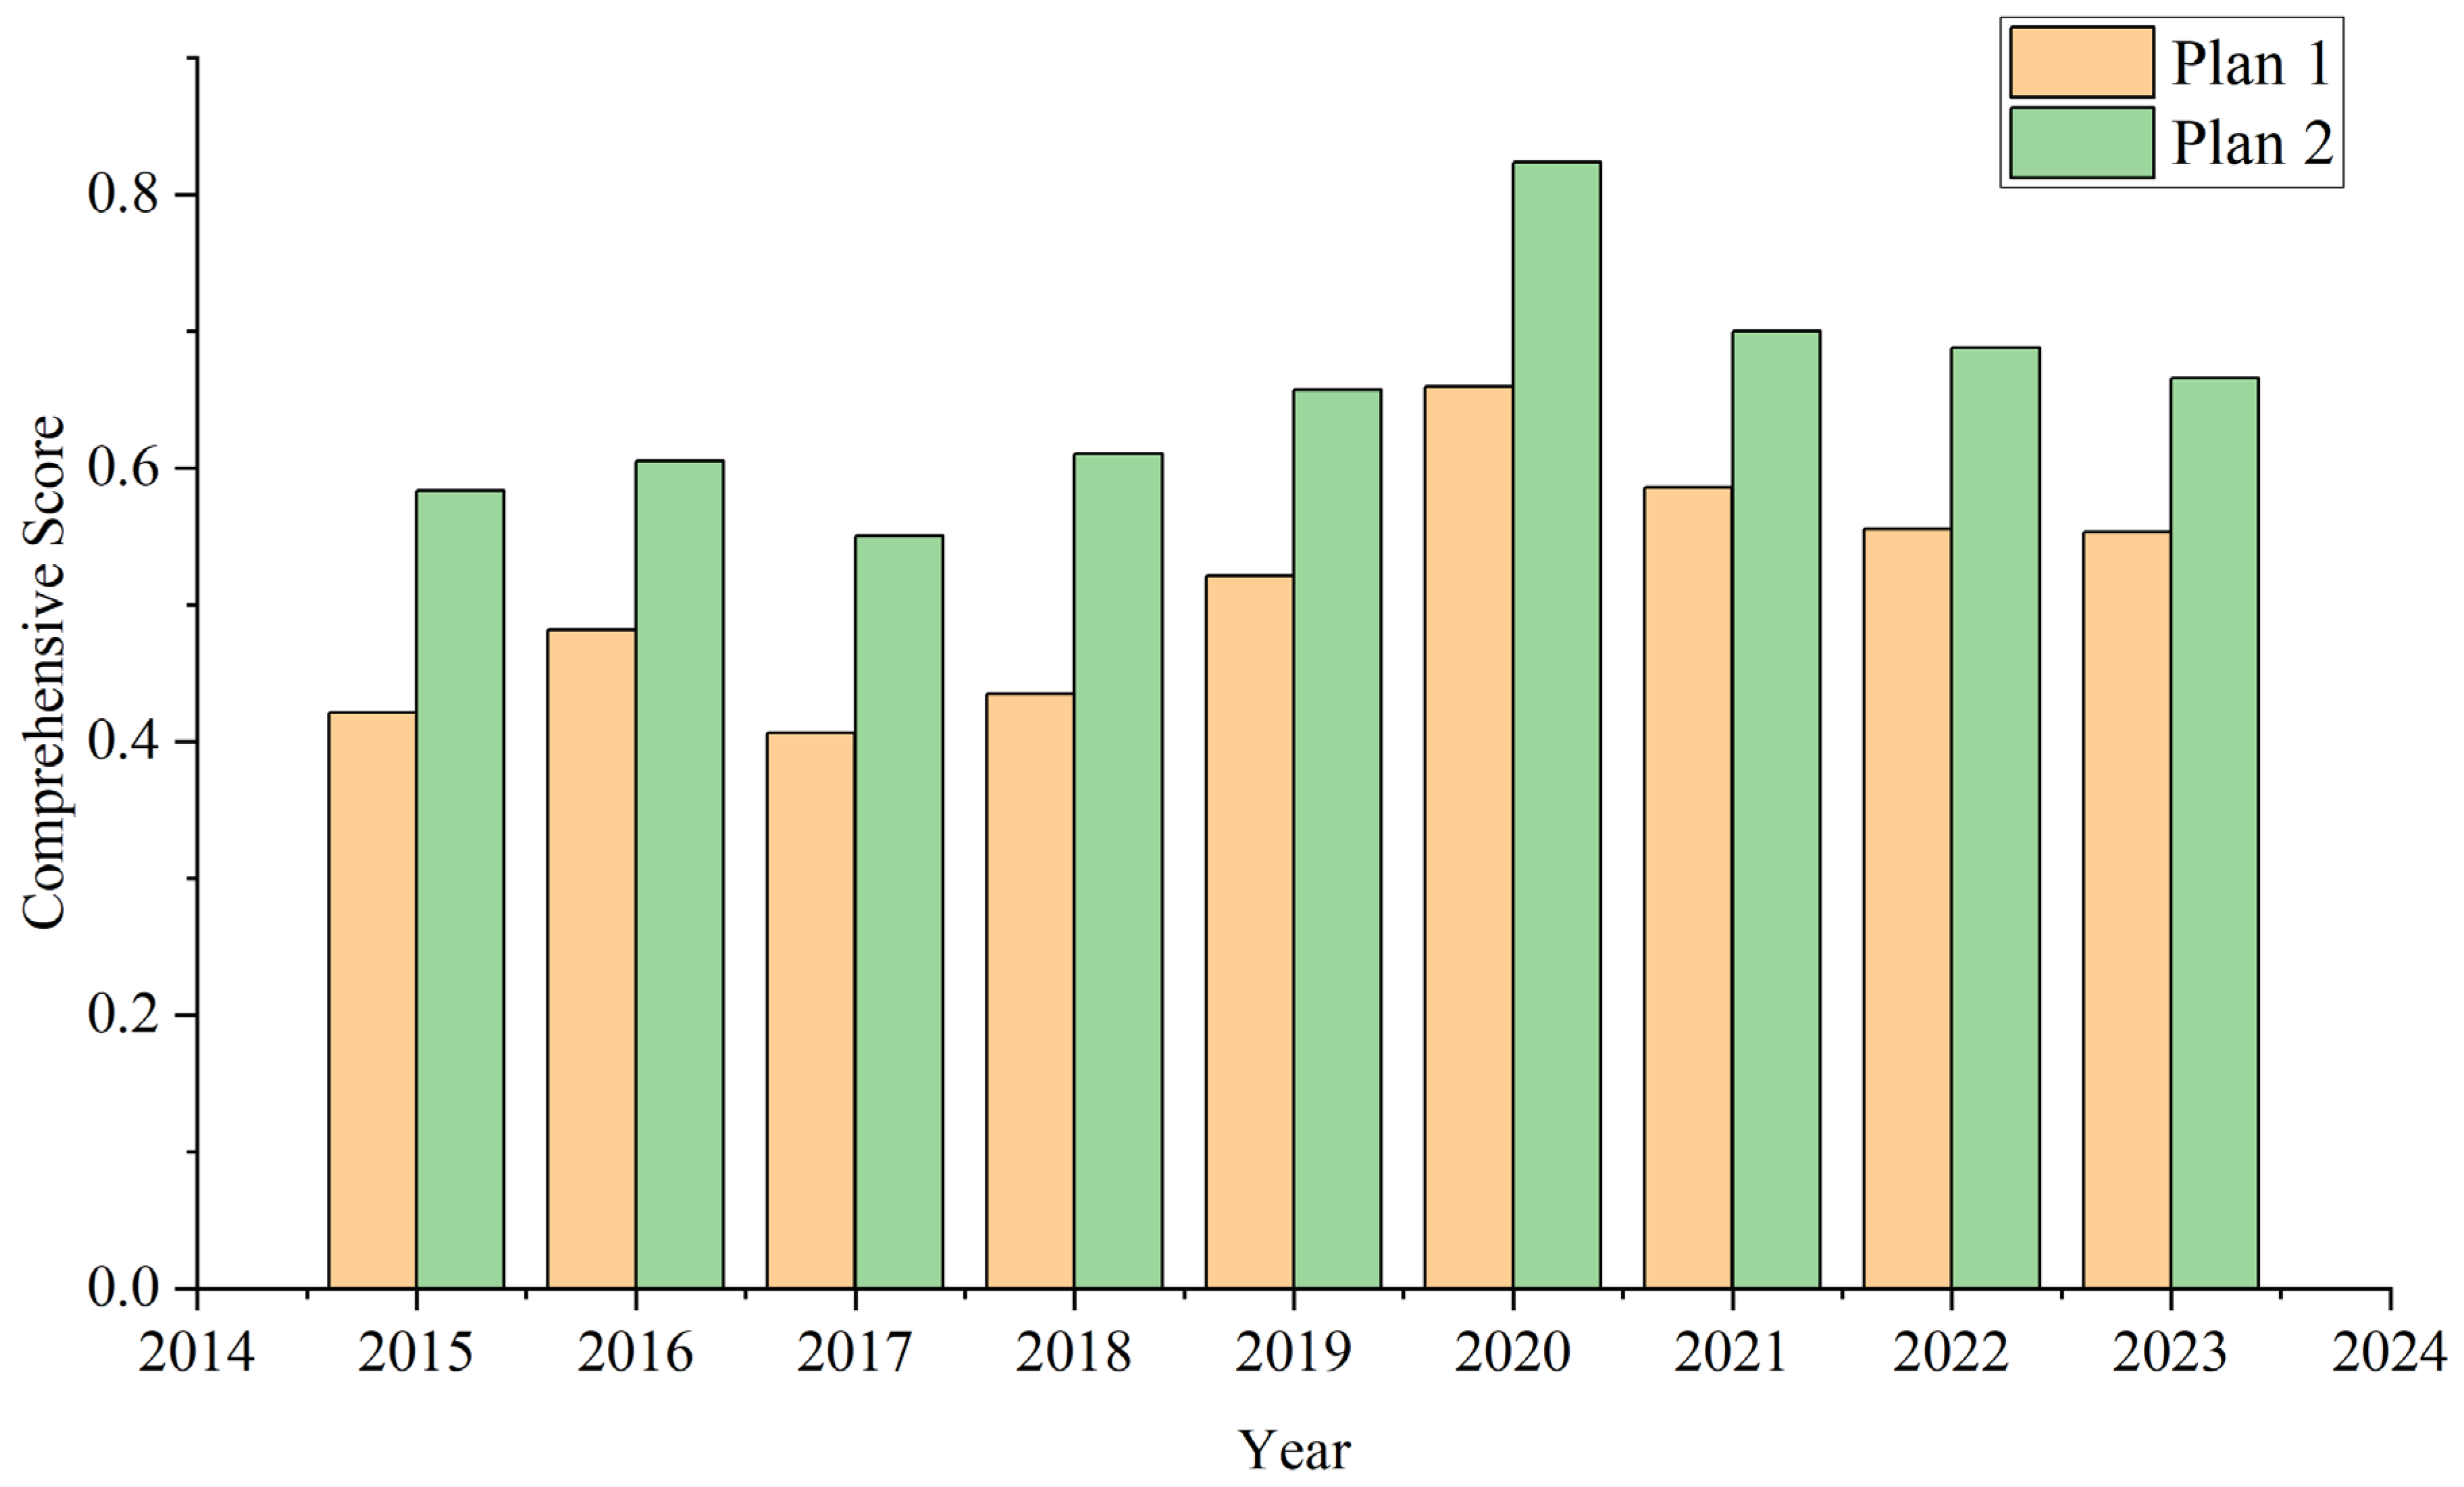
The updated data from the optimized water resource allocation scheme were reintroduced into the TOPSIS evaluation model. The comprehensive evaluation score and corresponding carrying capacity level were obtained by calculating the distances to the positive and negative ideal solutions. A comparative analysis was conducted against the pre-optimization results. The outcomes are presented in Figure 6.

4. Discussion

In this study, a comprehensive evaluation of water resource carrying capacity was conducted using a combination of the entropy weight method and the CRITIC method for objective weighting, alongside the TOPSIS model for comprehensive ranking and classification. This approach demonstrates both methodological soundness and forward-thinking innovation. Compared with traditional single weighting methods, such as the analytic hierarchy process (AHP) or entropy weighting alone [44,45], the integration of two objective weighting strategies in this study considers both indicator variability and discrimination, while reducing the influence of subjective bias. This enhances the objectivity and stability of the evaluation system. Such a combined weighting approach has been increasingly applied in studies on water resource sustainability and has proven to be highly adaptable for multi-criteria evaluation problems [46,47,48,49]. In this study, the entropy and CRITIC methods were integrated to minimize subjectivity and enhance the reliability of indicators [50,51,52], while the TOPSIS model was applied to rank carrying capacity status. The TOPSIS method determines rankings based on proximity to an ideal solution, which effectively reduces distortion from extreme values and enables dynamic comparison across multiple years [53,54]. This set of characteristics renders the integrated framework particularly well-suited for assessing temporal variations in WRCC and for facilitating subsequent optimization analysis, especially in regions such as Anji County, where the supply–demand balance of water resources shows considerable volatility. Therefore, the methodology employed in this study represents a structurally integrated and systematically optimized framework, building upon previous research while offering strong theoretical validity and practical feasibility.
In recent years, the water resource carrying capacity of Anji County has remained in a state of “near overload,” with certain years approaching the threshold of “mild overload.” This situation can be attributed to population growth, industrial expansion, and water resources’ spatial–temporal imbalance. On one hand, as a key area for green economic development in the Yangtze River Delta, Anji has experienced a steady rise in urbanization, leading to a continuously increasing total water demand. The intensified water consumption in the industrial and tertiary sectors has made water consumption per unit of economic output (e.g., indicator C24) a long-term limiting factor. On the other hand, although Anji generally receives abundant annual precipitation, the intra-annual distribution is uneven due to the influence of the monsoon climate. Coupled with the increasing frequency of extreme weather events in recent years, has resulted in a projected water shortage rate of up to 23% in dry years (by 2025), posing a serious constraint on the stable supply of water resources.
In response to the above challenges, the government recently increased policy investments to construct a water-saving society and utilize unconventional water sources. The 14th Five-Year Plan for the Comprehensive Utilization of Water Resources in Zhejiang Province explicitly proposes measures such as “promoting the reuse of treated wastewater, strengthening the control of groundwater extraction, and improving the efficiency of water supply scheduling,” which align closely with the optimization model proposed in this study. In particular, the substantial increase in wastewater reuse capacity, projected to reach 36.5 million m3 by 2030, provides crucial support in alleviating structural water shortages. Moreover, the in-depth implementation of the “Lucid waters and lush mountains are invaluable assets” concept has driven continuous progress in securing ecological water use and advancing ecological civilization institutional frameworks, thereby enhancing the resilience and recoverability of the overall water resource system. Although periodic tension in water resource carrying capacity remains, the dual impetus of policy guidance and technological advancement offers realistic potential for transitioning toward a “well-supported” carrying state.
Although this study establishes a relatively systematic evaluation framework for water resource carrying capacity and achieves optimized allocation through a multi-source, multi-object linear programming model, there are still certain limitations regarding research depth and model scope. First, the model does not account for hydrological variability induced by climate change. Future research could incorporate climate scenario simulation data (e.g., changes in precipitation and evaporation under 1.5 °C or 2 °C warming scenarios) to build a coupled “climate–hydrology–socioeconomic” model [55], enabling dynamic simulations of water resource carrying capacity under varying climate conditions and enhancing the model’s adaptability to extreme events. Second, the current optimization model focuses primarily on water quantity allocation and lacks consideration of water quality factors. Subsequent research should integrate pollutant discharge and water functional zone compliance rates to construct a coordinated “quantity–quality” optimization framework [56], improving water quality assurance in ecologically sensitive areas. Third, the present study does not fully explore the value attributes of water resources. Future efforts could draw on ecological economics to develop a full-cost accounting system for water resources and evaluate the potential and benefits of water rights trading between sectors such as agriculture and industry within a market-based allocation mechanism. Lastly, to facilitate the practical application of theoretical results, greater emphasis should be placed on integrating the model with policy implementation. This includes aligning with key initiatives in Anji County’s 14th Five-Year Water Development Plan, such as the expansion of wastewater treatment plants and water-saving irrigation projects, to promote dynamic parameter updates and real-world validation of optimization schemes in pilot regions, ensuring that the research outcomes can offer practical and actionable support for regional water resource management.

5. Conclusions

Based on data from Anji County spanning 2015 to 2023, this study established an evaluation index system for water resource carrying capacity, encompassing the water resource system, the production and living system, and the ecological and environmental system. A combined weighting approach integrating the entropy weight method and the CRITIC method was employed, and the TOPSIS model was introduced for comprehensive evaluation. The main research conclusions are as follows:
  • Water resource carrying capacity is tight and exhibits significant volatility. During the study period, Anji County was classified as being in a “near overload” state for most years, with an average comprehensive evaluation score of 0.5135, indicating that the water supply–demand relationship was approaching saturation. While performance in 2020 was relatively favorable, a decline was observed again in 2023, highlighting the region’s periodic vulnerability and the dynamic imbalance risks of its water resource system.
  • Key constraint factors are concentrated in wastewater reuse and water consumption per unit output. Obstacle degree analysis revealed that the wastewater reuse rate (C34) and water consumption per unit of industrial output (C24) were major limiting factors for improving water resource carrying capacity in multiple years, indicating substantial room for enhancing water use efficiency. Additionally, since 2021, the per capita water resource availability (C11) has gradually emerged as a major constraint and warrants close attention.
  • Forecasts show phased supply–demand balance improvement, yet structural weaknesses remain. Under average hydrological conditions (P = 50%), Anji County is projected to achieve a water surplus by 2030. However, dry-year water shortages persist (P = 75%). The situation is especially acute in 2025, with a projected shortage rate of 23%, reflecting the limited capacity of the water supply system to withstand extreme climatic events.
  • Optimized water resource allocation significantly enhances system carrying capacity. By developing a multi-source, multi-objective linear programming model based on maximizing net benefits, the study achieved rational allocation across domestic, industrial, agricultural, ecological, and tertiary-sector water uses, thereby maximizing resource utilization efficiency. After optimization, water allocation became more balanced, TOPSIS evaluation scores improved overall, and the water resource carrying capacity levels were notably enhanced, demonstrating the effectiveness of scientific allocation in alleviating water resource constraints.
In summary, while the overall operation of Anji County’s current water resource system remains relatively stable, urgent challenges persist, particularly low resource use efficiency, pronounced spatial and temporal distribution imbalances, and sharp supply–demand conflicts. Policy actions should be closely aligned with Anji County’s local development and water management priorities. First, expand wastewater reclamation facilities to meet the “14th Five-Year Plan” target of 36.5 million m3 reuse by 2030, with emphasis on industrial and municipal applications. Second, promote precision irrigation techniques in the tea and bamboo industries to reduce agricultural water demand while sustaining yields. Third, accelerate industrial upgrading toward green manufacturing to lower water consumption per unit of output (C24). Finally, enhance reservoir regulation and inter-basin transfers to balance the spatial mismatch between mountain and plain areas, thereby strengthening drought resilience.

Author Contributions

Conceptualization, H.Q. and H.C.; methodology, W.L.; software, F.W.; validation, C.X.; formal analysis, Z.W.; investigation, H.C.; resources, Y.W.; data curation, Y.C.; writing—original draft preparation, H.Q.; writing—review and editing, H.C.; visualization, J.T.; supervision, W.W.; project administration, H.C.; funding acquisition, H.C. All authors have read and agreed to the published version of the manuscript.

Funding

This research was funded by the Zhejiang Provincial Natural Science Foundation, grant number ZCLQ24E0901; the Scientific Research Fund of Zhejiang Provincial Education Department, grant number Y202352492; the Huzhou Science and Technology Plan Project, grant number 2023GZ64; and the Zhejiang Provincial Water Resources Department Science and Technology Program, grant number RC2213.

Institutional Review Board Statement

Not applicable.

Informed Consent Statement

Not applicable.

Data Availability Statement

The Anji County Water Resources Bulletin provides data related to water resources, including per capita water resources, annual precipitation, and the water yield coefficient (https://www.anji.gov.cn/xxgk/bmxxgk/xtjj/fdzdgknr/jjhshfztjxx/tjgb/index.html accessed on 15 March 2024). The Huzhou Statistical Yearbook offers socioeconomic data such as total GDP, irrigation water use, water consumption per 10,000 RMB of GDP and industrial added value, and urbanization rate (https://tjj.huzhou.gov.cn/col/col1229208257/index.html accessed on 15 March 2024). Ecological and environmental data—including per capita public green space area, per capita ecological and environmental water use, return water volume, and reclaimed wastewater volume—are obtained from the Huzhou Bureau of Ecology and Environment, Anji County Statistics, and the Anji County “14th Five-Year” Water Resources Development Plan.

Acknowledgments

We thank the Zhejiang Hydrological Management Center for providing hydrological and meteorological data.

Conflicts of Interest

The authors declare no conflicts of interest.

References

  1. Yan, B.; Jiang, H.; Zou, Y.; Liu, Y.; Mu, R.; Wang, H. An Integrated Model for Optimal Water Resources Allocation under “3 Redlines” Water Policy of the Upper Hanjiang River Basin. J. Hydrol-Reg. Stud. 2022, 42, 101167. [Google Scholar] [CrossRef]
  2. Chen, H.; Huang, S.; Qiu, H.; Xu, Y.P.; Teegavarapu, R.S.V.; Guo, Y.; Nie, H.; Xie, H.; Xie, J.; Shao, Y.; et al. Assessment of Ecological Flow in River Basins at a Global Scale: Insights on Baseflow Dynamics and Hydrological Health. Ecol. Indic. 2025, 178, 113868. [Google Scholar] [CrossRef]
  3. Li, P.; Wu, J. Water Resources and Sustainable Development. Water 2023, 16, 134. [Google Scholar] [CrossRef]
  4. Zhao, Y.; Wang, Y.; Wang, Y. Comprehensive Evaluation and Influencing Factors of Urban Agglomeration Water Resources Carrying Capacity. J. Clean. Prod. 2021, 288, 125097. [Google Scholar] [CrossRef]
  5. Wang, X.; Liu, L.; Zhang, S.; Gao, C. Dynamic Simulation and Comprehensive Evaluation of the Water Resources Carrying Capacity in Guangzhou City, China. Ecol. Indic. 2022, 135, 108528. [Google Scholar] [CrossRef]
  6. Chen, H.; Xu, B.; Qiu, H.; Huang, S.; Teegavarapu, R.S.V.; Xu, Y.P.; Guo, Y.; Nie, H.; Xie, H. Adaptive Assessment of Reservoir Scheduling to Hydrometeorological Comprehensive Dry and Wet Condition Evolution in a Multi-Reservoir Region of Southeastern China. J. Hydrol. 2025, 648, 132392. [Google Scholar] [CrossRef]
  7. Gao, J.; Wang, L. Embedding Spatiotemporal Changes in Carbon Storage into Urban Agglomeration Ecosystem Management-A Case Study of the Yangtze River Delta, China. J. Clean. Prod. 2019, 237, 117764. [Google Scholar] [CrossRef]
  8. Zhang, K.; Zhang, Y.; Xi, S.; Liu, J.; Li, J.; Hou, S.; Chen, B. Multi-Objective Optimization of Energy-Water Nexus from Spatial Resource Reallocation Perspective in China. Appl. Energy 2022, 314, 118919. [Google Scholar] [CrossRef]
  9. Li, J.; Meng, Z.; Zhang, J.; Chen, Y.; Yao, J.; Li, X.; Qin, P.; Liu, X.; Cheng, C. Prediction of Seawater Intrusion Run-Up Distance Based on K-Means Clustering and ANN Model. J. Mar. Sci. Eng. 2025, 13, 377. [Google Scholar] [CrossRef]
  10. Chu, J.; Wang, Z.; Bao, X.; Yao, Z.; Cui, X. Addressing the Contradiction between Water Supply and Demand: A Study on Multi-Objective Regional Water Resources Optimization Allocation. Environ. Dev. Sustain. 2024. [Google Scholar] [CrossRef]
  11. Li, J.; Xia, F.; Yang, D.; Huo, J. Comprehensive Evaluation of Water Resource Carrying Capacity in Northwest China. Water 2024, 17, 67. [Google Scholar] [CrossRef]
  12. Li, Y.; Zhang, J.; Song, Y. Comprehensive Comparison and Assessment of Three Models Evaluating Water Resource Carrying Capacity in Beijing, China. Ecol. Indic. 2022, 143, 109305. [Google Scholar] [CrossRef]
  13. Li, W.; Jiang, S.; Zhao, Y.; Li, H.; Zhu, Y.; Ling, M.; Qi, T.; He, G.; Yao, Y.; Wang, H. Comprehensive Evaluation and Scenario Simulation of Water Resources Carrying Capacity: A Case Study in Xiong’an New Area, China. Ecol. Indic. 2023, 150, 110253. [Google Scholar] [CrossRef]
  14. Yang, Z.; Song, J.; Cheng, D.; Xia, J.; Li, Q.; Ahamad, M.I. Comprehensive Evaluation and Scenario Simulation for the Water Resources Carrying Capacity in Xi’an City, China. J. Environ. Manag. 2019, 230, 221–233. [Google Scholar] [CrossRef] [PubMed]
  15. Wang, G.; Xiao, C.; Qi, Z.; Meng, F.; Liang, X. Development Tendency Analysis for the Water Resource Carrying Capacity Based on System Dynamics Model and the Improved Fuzzy Comprehensive Evaluation Method in the Changchun City, China. Ecol. Indic. 2021, 122, 107232. [Google Scholar] [CrossRef]
  16. Zhang, Y.; Song, X.; Wang, X.; Jin, Z.; Chen, F. Multi-Level Fuzzy Comprehensive Evaluation for Water Resources Carrying Capacity in Xuzhou City, China. Sustainability 2023, 15, 11369. [Google Scholar] [CrossRef]
  17. Zhou, K. Comprehensive Evaluation on Water Resources Carrying Capacity Based on Improved AGA-AHP Method. Appl. Water Sci. 2022, 12, 103. [Google Scholar] [CrossRef]
  18. Su, Y.; Xu, X.; Dai, M.; Hu, Y.; Li, Q.; Shu, S. A Comprehensive Evaluation of Water Resource Carrying Capacity Based on the Optimized Projection Pursuit Regression Model: A Case Study from China. Water 2024, 16, 2650. [Google Scholar] [CrossRef]
  19. Deng, L.; Yin, J.; Tian, J.; Li, Q.; Guo, S. Comprehensive Evaluation of Water Resources Carrying Capacity in the Han River Basin. Water 2021, 13, 249. [Google Scholar] [CrossRef]
  20. Liu, D.; Chen, X.; Lou, Z. A Model for the Optimal Allocation of Water Resources in a Saltwater Intrusion Area: A Case Study in Pearl River Delta in China. Water Resour. Manag. 2010, 24, 63–81. [Google Scholar] [CrossRef]
  21. Zhang, Z.; Zhang, P.; Zhang, G. Multi-Objective Optimal Allocation of Water Resources in Yangchangwan Mining Area Based on Ecological Priority. E3S Web Conf. 2021, 260, 01004. [Google Scholar] [CrossRef]
  22. Li, C.; Tian, X.; Cao, Z.; Wang, Y. Research on Optimal Allocation of Water Resources in the Western Mining Area of China Based on WEAP. Appl. Water Sci. 2022, 12, 113. [Google Scholar] [CrossRef]
  23. Ma, J.; Liu, H.; Wu, W.; Zhang, Y.; Dong, S. Research on Optimal Allocation of Water Resources in Handan City Based on the Refined Water Resource Allocation Model. Water 2022, 15, 154. [Google Scholar] [CrossRef]
  24. Luo, Y.; Sha, J.; Liu, B.; Zhang, Y.; Yang, J. Optimal Allocation of Water Resources Based on GWAS Model in Handan, China. Water 2023, 15, 1090. [Google Scholar] [CrossRef]
  25. Wang, Z.; Tian, J.; Feng, K. Optimal Allocation of Regional Water Resources Based on Simulated Annealing Particle Swarm Optimization Algorithm. Energy Rep. 2022, 8, 9119–9126. [Google Scholar] [CrossRef]
  26. Guo, W.; Sha, J.; Xu, D.; Liu, S.; Wang, C.; Li, K. Application of MOHUS in Multi-Objective Optimal Allocation of Water Resources for the Central Route South-to-North Water Diversion Project in Hebei Province, China. Water 2025, 17, 1612. [Google Scholar] [CrossRef]
  27. He, H.; Chen, A.; Yin, M.; Ma, Z.; You, J.; Xie, X.; Wang, Z.; An, Q. Optimal Allocation Model of Water Resources Based on the Prospect Theory. Water 2019, 11, 1289. [Google Scholar] [CrossRef]
  28. De Paula Fontainhas Bandeira, A.; Mendes, C.A.B. Optimization Water Allocation Model to Natural Resources Exploration. In Proceedings of the World Environmental and Water Resources Congress, Austin, TX, USA, 17 May 2015; American Society of Civil Engineers: Reston, VA, USA, 2015; pp. 2320–2329. [Google Scholar] [CrossRef]
  29. Wang, J.; Hou, B.; Jiang, D.; Xiao, W.; Wu, Y.; Zhao, Y.; Zhou, Y.; Guo, C.; Wang, G. Optimal Allocation of Water Resources Based on Water Supply Security. Water 2016, 8, 237. [Google Scholar] [CrossRef]
  30. Liu, P.; Lü, S.; Han, Y.; Wang, F.; Tang, L. Comprehensive Evaluation on Water Resources Carrying Capacity Based on Water-Economy-Ecology Concept Framework and EFAST-Cloud Model: A Case Study of Henan Province, China. Ecol. Indic. 2022, 143, 109392. [Google Scholar] [CrossRef]
  31. Yang, G.; Dong, Z.; Feng, S.; Li, B.; Sun, Y.; Chen, M. Early Warning of Water Resource Carrying Status in Nanjing City Based on Coordinated Development Index. J. Clean. Prod. 2021, 284, 124696. [Google Scholar] [CrossRef]
  32. Abdel-Basset, M.; Mohamed, R. A Novel Plithogenic TOPSIS- CRITIC Model for Sustainable Supply Chain Risk Management. J. Clean. Prod. 2020, 247, 119586. [Google Scholar] [CrossRef]
  33. Al-Aomar, R. A Combined AHP-ENTROPY Method for Deriving Subjective and Objective Criteria Weights. Int. J. Ind. Eng. Theory Appl. Pract. 2010, 17, 12–24. [Google Scholar] [CrossRef]
  34. Keyvanfar, M.; Janatrostami, S.; Ashrafzadeh, A. A Comprehensive Assessment of Water Resources Carrying Capacity in Anzali Wetland Using AHP-Entropy-CRITIC Combined Weighting Method and TOPSIS-GRA Model. Iran. J. Soil. Water Res. 2025, 56, 105–126. [Google Scholar] [CrossRef]
  35. Zafar, S.; Alamgir, Z.; Rehman, M.H. An Effective Blockchain Evaluation System Based on Entropy-CRITIC Weight Method and MCDM Techniques. Peer-to-Peer Netw. Appl. 2021, 14, 3110–3123. [Google Scholar] [CrossRef]
  36. Wei, Z.; Ji, D.; Yang, L. Comprehensive Evaluation of Water Resources Carrying Capacity in Henan Province Based on Entropy Weight TOPSIS—Coupling Coordination—Obstacle Model. Environ. Sci. Pollut. Res. 2023, 30, 115820–115838. [Google Scholar] [CrossRef]
  37. Zhang, Q.; Qian, H.; Xu, P.; Hou, K.; Yang, F. Groundwater Quality Assessment Using a New Integrated-Weight Water Quality Index (IWQI) and Driver Analysis in the Jiaokou Irrigation District, China. Ecotox Environ. Safe 2021, 212, 111992. [Google Scholar] [CrossRef]
  38. Lv, B.; Liu, C.; Li, T.; Meng, F.; Fu, Q.; Ji, Y.; Hou, R. Evaluation of the Water Resource Carrying Capacity in Heilongjiang, Eastern China, Based on the Improved TOPSIS Model. Ecol. Indic. 2023, 150, 110208. [Google Scholar] [CrossRef]
  39. Du, L.; Niu, Z.; Zhang, R.; Zhang, J.; Jia, L.; Wang, L. Evaluation of Water Resource Carrying Potential and Barrier Factors in Gansu Province Based on Game Theory Combined Weighting and Improved TOPSIS Model. Ecol. Indic. 2024, 166, 112438. [Google Scholar] [CrossRef]
  40. Chung, E.-S.; Abdulai, P.J.; Park, H.; Kim, Y.; Ahn, S.R.; Kim, S.J. Multi-Criteria Assessment of Spatial Robust Water Resource Vulnerability Using the TOPSIS Method Coupled with Objective and Subjective Weights in the Han River Basin. Sustainability 2017, 9, 29. [Google Scholar] [CrossRef]
  41. Xia, B.; Juliang, J.; Rongxing, Z.; Chengguo, W.; Yuliang, Z.; Libing, Z.; Yi, C. Coordination Evaluation and Obstacle Factors Recognition Analysis of Water Resource Spatial Equilibrium System. Environ. Res. 2022, 210, 112913. [Google Scholar] [CrossRef]
  42. Zhang, F.; Wu, Z.; Di, D.; Wang, H. Water Resources Allocation Based on Water Resources Supply-Demand Forecast and Comprehensive Values of Water Resources. J. Hydrol. Reg. Stud. 2023, 47, 101421. [Google Scholar] [CrossRef]
  43. Ruijs, A.; Kortelainen, M.; Wossink, A.; Schulp, C.J.E.; Alkemade, R. Opportunity Cost Estimation of Ecosystem Services. Environ. Resour. Econ. 2017, 66, 717–747. [Google Scholar] [CrossRef]
  44. Cui, Y.; Feng, P.; Jin, J.; Liu, L. Water Resources Carrying Capacity Evaluation and Diagnosis Based on Set Pair Analysis and Improved the Entropy Weight Method. Entropy 2018, 20, 359. [Google Scholar] [CrossRef]
  45. Lu, Y.; Xu, H.; Wang, Y.; Yang, Y. Evaluation of Water Environmental Carrying Capacity of City in Huaihe River Basin Based on the AHP Method: A Case in Huai’an City. Water Resour. Ind. 2017, 18, 71–77. [Google Scholar] [CrossRef]
  46. Yang, M.; Qu, D.; Shen, Y.; Yang, S.; Liu, B.; Lu, W. Evaluation of Water Resources Carrying Capacity of Zhangye City Based on Combined Weights and TOPSIS Modeling. Water 2023, 15, 4229. [Google Scholar] [CrossRef]
  47. Ren, B.; Zhang, Q.; Ren, J.; Ye, S.; Yan, F. A Novel Hybrid Approach for Water Resources Carrying Capacity Assessment by Integrating Fuzzy Comprehensive Evaluation and Analytical Hierarchy Process Methods with the Cloud Model. Water 2020, 12, 3241. [Google Scholar] [CrossRef]
  48. Peng, T.; Deng, H. Comprehensive Evaluation on Water Resource Carrying Capacity in Karst Areas Using Cloud Model with Combination Weighting Method: A Case Study of Guiyang, Southwest China. Environ. Sci. Pollut. Res. 2020, 27, 37057–37073. [Google Scholar] [CrossRef] [PubMed]
  49. Chi, M.; Zhang, D.; Fan, G.; Zhang, W.; Liu, H. Prediction of Water Resource Carrying Capacity by the Analytic Hierarchy Process-Fuzzy Discrimination Method in a Mining Area. Ecol. Indic. 2019, 96, 647–655. [Google Scholar] [CrossRef]
  50. Deng, L.; Guo, S.; Yin, J.; Zeng, Y.; Chen, K. Multi-Objective Optimization of Water Resources Allocation in Han River Basin (China) Integrating Efficiency, Equity and Sustainability. Sci. Rep. 2022, 12, 798. [Google Scholar] [CrossRef]
  51. Feng, T.; Liu, B.; Ren, H.; Yang, J.; Zhou, Z. Optimized Model for Coordinated Development of Regional Sustainable Agriculture Based on Water–Energy–Land–Carbon Nexus System: A Case Study of Sichuan Province. Energ. Convers. Manag. 2023, 291, 117261. [Google Scholar] [CrossRef]
  52. Wang, Y.; Sun, K.; Li, L.; Lei, Y.; Wu, S.; Wang, F.; Luo, J. The Optimal Allocation and the Evaluation of Water Resources Carrying Capacity in Shendong Mining Area. Resour. Policy 2022, 77, 102738. [Google Scholar] [CrossRef]
  53. Zhu, Q.; Cao, Y. Research on Provincial Water Resources Carrying Capacity and Coordinated Development in China Based on Combined Weighting TOPSIS Model. Sci. Rep. 2024, 14, 12497. [Google Scholar] [CrossRef]
  54. Wang, J.; Wang, Z.; Fu, Z.; Fang, Y.; Zhao, X.; Ding, X.; Huang, J.; Liu, Z.; Fu, X.; Liu, J. Spatial-Temporal Evaluation and Prediction of Water Resources Carrying Capacity in the Xiangjiang River Basin Using County Units and Entropy Weight TOPSIS-BP Neural Network. Sustainability 2024, 16, 8184. [Google Scholar] [CrossRef]
  55. Fu, Z.; Dong, J.; Zhang, J.; Guo, Y.; Zhang, Y.; Jiang, X.; Wang, H.; Wang, S. A Novel Energy-Water-Carbon Coupling System Optimization Management Model Based on Water Environmental Carrying Capacity under the Influence of Climate Change. Energy Strateg. Rev. 2024, 53, 101424. [Google Scholar] [CrossRef]
  56. Wu, L.; Su, X.; Ma, X.; Kang, Y.; Jiang, Y. Integrated Modeling Framework for Evaluating and Predicting the Water Resources Carrying Capacity in a Continental River Basin of Northwest China. J. Clean. Prod. 2018, 204, 366–379. [Google Scholar] [CrossRef]
Figure 1. Regional map of Anji County.
Sustainability 17 08383 g001
Figure 2. Flowchart of research methodology.
Sustainability 17 08383 g002
Figure 3. Indicators for WRCC evaluation.
Sustainability 17 08383 g003
Figure 4. Trend of obstacle degrees in the ecological and environmental system: C31: per capita public green space area; C32: per capita ecological and environmental water use; C33: return water volume; C34: reclaimed wastewater volume.
Sustainability 17 08383 g004
Figure 5. Comparison of predicted water demand and optimized water allocation in 2025 and 2030.
Sustainability 17 08383 g005
Figure 6. Comparison of comprehensive scores of water resource carrying capacity before and after optimization.
Sustainability 17 08383 g006
Table 1. Summary of data categories and sources for Anji County.
Data CategoryMain IndicatorsData SourcesYears
Water Resource SystemPer capita water resources (C11), annual precipitation (C12), water yield coefficient (C13)Anji County Water Resources Bulletin, https://www.anji.gov.cn/xxgk/bmxxgk/xtjj/fdzdgknr/jjhshfztjxx/tjgb/index.html (accessed on 15 March 2024)2019–2023
Socioeconomic SystemTotal GDP (C21), irrigation water use for farmland (C22), water consumption per 10,000 RMB GDP (C23), water consumption per 10,000 RMB of industrial added value (C24), urbanization rate (C25)Huzhou Statistical Yearbook,
https://tjj.huzhou.gov.cn/col/col1229208257/index.html (accessed on 15 March 2024)
2019–2023
Ecological and Environmental SystemPer capita public green space area (C31), per capita ecological and environmental water use (C32), return water volume (C33), reclaimed wastewater volume (C34)Huzhou Bureau of Ecology and Environment, Anji County Statistics, Anji County “14th Five-Year” Water Resources Development Plan2019–2023
Table 2. Evaluation criteria for WRCC in Anji County.
Closeness Coefficient IntervalLevelDescription
(0, 0.2)Severely OverloadedThe region has a very low level of WRCC, with significant contradictions and imbalances.
[0.2, 0.4)Slightly OverloadedWater resource utilization efficiency in certain areas needs improvement, and the current state of water resources has suffered to some extent.
[0.4, 0.6)Near OverloadThe carrying capacity is moderate but shows signs of gradual weakening.
[0.6, 0.8)Well-CarryingThe region has a relatively strong water supply capacity, sufficient to support the expansion and prosperity of socioeconomic activities.
[0.8, 1)Surplus CarryingThe area possesses abundant water resources, which are highly conducive to promoting socioeconomic development.
Table 3. Summary of forecasted water demand in planning years (108 m3).
YearDomestic Water DemandIndustrial Water DemandAgricultural & Livestock Water DemandEcological & Environmental Water DemandTertiary Industry Water DemandTotal Water Demand
P = 50%P = 75%P = 50%P = 75%
20250.28280.80881.28761.36950.36240.02672.76832.8502
20300.26440.84371.00231.05510.37960.03052.52062.5733
Table 4. Summary of forecasted available water supply in planning Years (108 m3).
YearSurface Water SupplyGroundwater SupplyNon-Conventional Water SupplyTotal Supply
P = 50%P = 75%P = 50%P = 75%
20252.07271.95350.08000.21902.34172.1525
20302.38311.66980.10000.36502.84812.1348
Table 5. Water use benefit coefficients by sector in Anji County.
SectorDomestic Water UseAgricultural Water UseIndustrial Water UseEcological and Environmental Water UseTertiary Industry Water Use
Water Use Benefit Coefficient1.000.364.430.1810.00
Table 6. Results of indicator weights in the evaluation.
Goal Level (A)Criterion Level (B)Indicator (C)Entropy Method Weight (w1)CRITIC Method Weight (w2)Multiplicative MethodAdditive Method
WRCC of Anji CountyWater Resource SystemPer Capita Water Resource Availability (C11)0.09920.12150.10840.1068
Annual Precipitation (C12)0.09010.07600.08480.0831
Water Yield Coefficient (C13)0.08960.07960.08650.0846
Production and Living SystemTotal GDP (C21)0.07780.06880.07500.0733
Irrigation Water Use for Farmland (C22)0.06860.07010.07100.0694
Water Consumption per 10,000 RMB of GDP (C23)0.07050.07030.07350.0718
Water Consumption per 10,000 RMB of Industrial Added Value (C24)0.08330.07800.08250.0806
Urbanization Rate (C25)0.05010.07430.06250.0622
Ecological and Environmental SystemPer Capita Public Green Space Area (C31)0.06290.07430.07000.0686
Per Capita Ecological and Environmental Water Use (C32)0.06050.10510.08160.0828
Return Water Volume (C33)0.04240.08940.06300.0659
Reclaimed Wastewater Volume (C34)0.21190.08980.14130.1509
Table 7. Evaluation results of WRCC in Anji County (2015–2023).
YearDistance to Positive Ideal SolutionDistance to Negative Ideal SolutionComprehensive Score IndexEvaluation Grade
20150.22560.16440.4215On the Verge of Overload
20160.20690.19230.4817On the Verge of Overload
20170.22690.15550.4067On the Verge of Overload
20180.19860.15350.4359On the Verge of Overload
20190.16890.18400.5215On the Verge of Overload
20200.11090.21470.6595Well Within Carrying Capacity
20210.14430.20420.5859On the Verge of Overload
20220.17700.22110.5554On the Verge of Overload
20230.18240.22610.5535On the Verge of Overload
Table 8. Major obstacle factors of key indicators in Anji County (2015–2023).
Year12345
2015C34C24C21C23C22
2016C34C24C31C21C23
2017C34C12C13C22C24
2018C34C25C13C24C21
2019C34C12C25C21C24
2020C33C34C12C25C13
2021C11C32C13C34C12
2022C11C13C12C32C33
2023C11C13C32C12C33
Table 9. Water supply–demand balance analysis of Anji County (108 m3).
YearWater DemandWater SupplySupply–Demand Balance (Surplus (−)/Deficit (+))Water Shortage Rate (%)
P = 50%P = 75%P = 50%P = 75%P = 50%P = 75%P = 50%P = 75%
20252.76832.85022.34172.15250.42660.697717.3%23.0%
20302.52062.57332.84812.1348−0.05270.1385/6.1%
Table 10. Water resource allocation results for planning years in Anji County (108 m3).
Planning
Year
Supply–Demand
Balance
Domestic
Use
Industrial
Use
Agricultural UseEcological
Use
Tertiary IndustryTotal
50%75%50%75%
2025Water Demand0.25340.62340.98321.13220.26330.0212.14432.2933
Surface Water0.25340.33340.72470.83200.16230.0211.49481.7021
Groundwater00.0600000.060.06
Reclaimed Water from
Wastewater Treatment
000.05850.00020.10100.15950.1012
Water Shortage00.230.10.3000.330.53
2030Water Demand0.22570.52660.88640.98380.35960.0252.02332.1207
Surface Water0.22570.22860.70420.78640.20170.0251.38521.5656
Groundwater00.0800000.080.08
Reclaimed Water from
Wastewater Treatment
000.08220.00740.157900.24010.2053
Water Shortage00.2180.10.19000.3180.408
Table 11. Comparison of predicted demand and optimized allocation (108 m3).
SectorOptimized 2025Predicted 2025Δ2025Optimized 2030Predicted 2030Δ2030
Domestic0.25340.2828−0.02940.22570.2644−0.0387
Industrial0.62340.8088−0.18540.52660.8437−0.3171
Agricultural (P = 50%)0.98321.2876−0.30440.88641.0023−0.1159
Agricultural (P = 75%)1.13221.3695−0.23730.98381.0551−0.0713
Ecological & Environmental0.26330.3624−0.09910.35960.3796−0.0200
Tertiary Industry0.0210.0267−0.00570.0250.0305−0.0055
Total (P = 50%)2.14432.7683−0.62402.02332.5206−0.4973
Total (P = 75%)2.29332.8502−0.55692.12072.5733−0.4526
Disclaimer/Publisher’s Note: The statements, opinions and data contained in all publications are solely those of the individual author(s) and contributor(s) and not of MDPI and/or the editor(s). MDPI and/or the editor(s) disclaim responsibility for any injury to people or property resulting from any ideas, methods, instructions or products referred to in the content.