Article

Reshaping Sustainable Technology Progress: The Role of China’s National Carbon Unified Market in the Power Sector

1
School of Economics, Zhejiang University, Hangzhou 310058, China
2
School of Economics and Finance, Hohai University, Changzhou 213200, China
*
Author to whom correspondence should be addressed.
Sustainability 2025, 17(18), 8377; https://doi.org/10.3390/su17188377
Submission received: 25 August 2025 / Revised: 13 September 2025 / Accepted: 16 September 2025 / Published: 18 September 2025

Abstract

To achieve carbon peak and neutrality goals and promote sustainable development, the power sector, as China’s largest source of carbon emissions, is the first industry to implement the national carbon emission trading scheme (ETS). A differences-in-differences model is employed on firm-level data to assess the causal impact of China’s national ETS, launched in 2017, on the sustainable technology progress of power generation enterprises. This study employs green patents and total factor productivity as measures for sustainable technology progress and then explores mechanisms and heterogeneity of the impact. Results show that: (1) The national ETS has a positive effect on green innovation capability and efficiency in the power industry, and the increasing causal effect is mainly achieved through research and development expenditure. (2) The national ETS exerts a more significant positive effect on power generation enterprises that are non-state-owned, have smaller asset scale, demonstrate superior environmental performance, and are located in the eastern region. However, there is no significant difference in total factor productivity across power enterprises. (3) Green innovations are predominantly concentrated in new energy and hybrid power generation enterprises. This study contributes to the literature by providing novel empirical evidence from China’s national ETS, highlighting its dual impact on innovation and productivity within a unified framework. The findings not only offer targeted recommendations for China’s power sector but also serve as an important reference for other high-emitting industries and other regions worldwide facing the same challenges in their pursuit of sustainable development.

1. Introduction

In the Paris Agreement in 2015, the Chinese government announced the carbon peak and neutrality target (hereafter, dual carbon goal). This commitment included a pledge to reduce carbon emissions per unit of GDP by 60% to 65% compared to 2005 levels. Additionally, the share of non-fossil fuels in primary energy consumption is expected to rise to around 20%, with carbon emissions projected to peak around 2030. China is the world’s largest carbon emitter, accounting for over a quarter of the world’s greenhouse gas emissions [1]. In China, fossil fuels remain the primary component of the energy structure [2,3]. In particular, the power industry contributes the largest amount of carbon emissions in China.
In order to lower carbon emissions, the Chinese government implements various policies, including a carbon tax [4,5,6], new energy subsidies [7,8], and a carbon emissions trading scheme (ETS) [1]. Among these, the ETS is a market-based policy instrument designed to achieve emission reduction goals by guiding corporate decision-making through market mechanisms. In October 2011, the NDRC issued the “Notice on Carrying out Pilot Work for Carbon Emission Trading”. The pilot ETS has been officially implemented in several provinces and cities (i.e., Beijing, Tianjin, Shanghai, Chongqing, Hubei, Guangdong, and Shenzhen), covering several high-carbon-emitting industries since 2013. During the pilot period, each pilot city independently conducts carbon trading. These decentralized markets not only differed in the industries covered under the ETS, but also differed in their methods for carbon quota allocation. Nonetheless, all pilot areas included the power industry.
The ETS underwent a major reform when the NDRC issued the “National Carbon Emission Trading Market Establishment Plan in Power Industry” in 2017 (hereafter, the plan). Since the standardized data measurement equipment of the power industry is convenient for data verification and allocation of quotas, and the carbon emission intensity of the power generation industry surpasses other industries, the pilot ETS was promoted nationwide in the power industry. There are 2267 power enterprises included in the national ETS officially, with carbon emissions of about 4.5 billion tons of carbon dioxide (CO2), accounting for over 40% of the national emission. The consolidation of decentralized pilot markets into a national unified system was a critical reform intended to reduce speculative arbitrage, thereby enhancing market efficiency and stability. As shown in Figure 1, the objective of this reform was initially achieved, as evidenced by the increase in both the average daily transaction price and total trading volume across pilot regions following the launch of the national ETS in 2017. These trends indicate that market integration was progressing smoothly and that the trading mechanism was beginning to function effectively, attracting more participation and reinforcing price signals.
The ETS regulates power enterprises through the allocation of carbon emission quotas. If an enterprise’s carbon emission exceeds its quota, it must purchase quotas in the market or be punished. In contrast, enterprises with lower unit carbon emissions can accumulate surplus quotas, which may be sold to higher-emitting enterprises in the market, thereby generating additional revenue. When compliance costs become prohibitively high, power companies face several strategic choices to maximize their interests under emission constraints. First, they may reduce fossil fuel consumption at the source by scaling back power output or shifting from thermal power to renewable energy generation, thereby directly reducing the production of CO2. Second, the power enterprises can choose to improve energy efficiency in the middle end, using less fossil fuels to produce the same amount of electricity, thereby reducing the amount of CO2 produced when producing the same amount of electricity. The third approach is to further utilize the final generated CO2 through capture technology at the end of energy. From a long-term perspective, enterprises which make progress in sustainable technology by implementing innovation activities and improve the production efficiency will hold a competitive edge in the market [9,10].
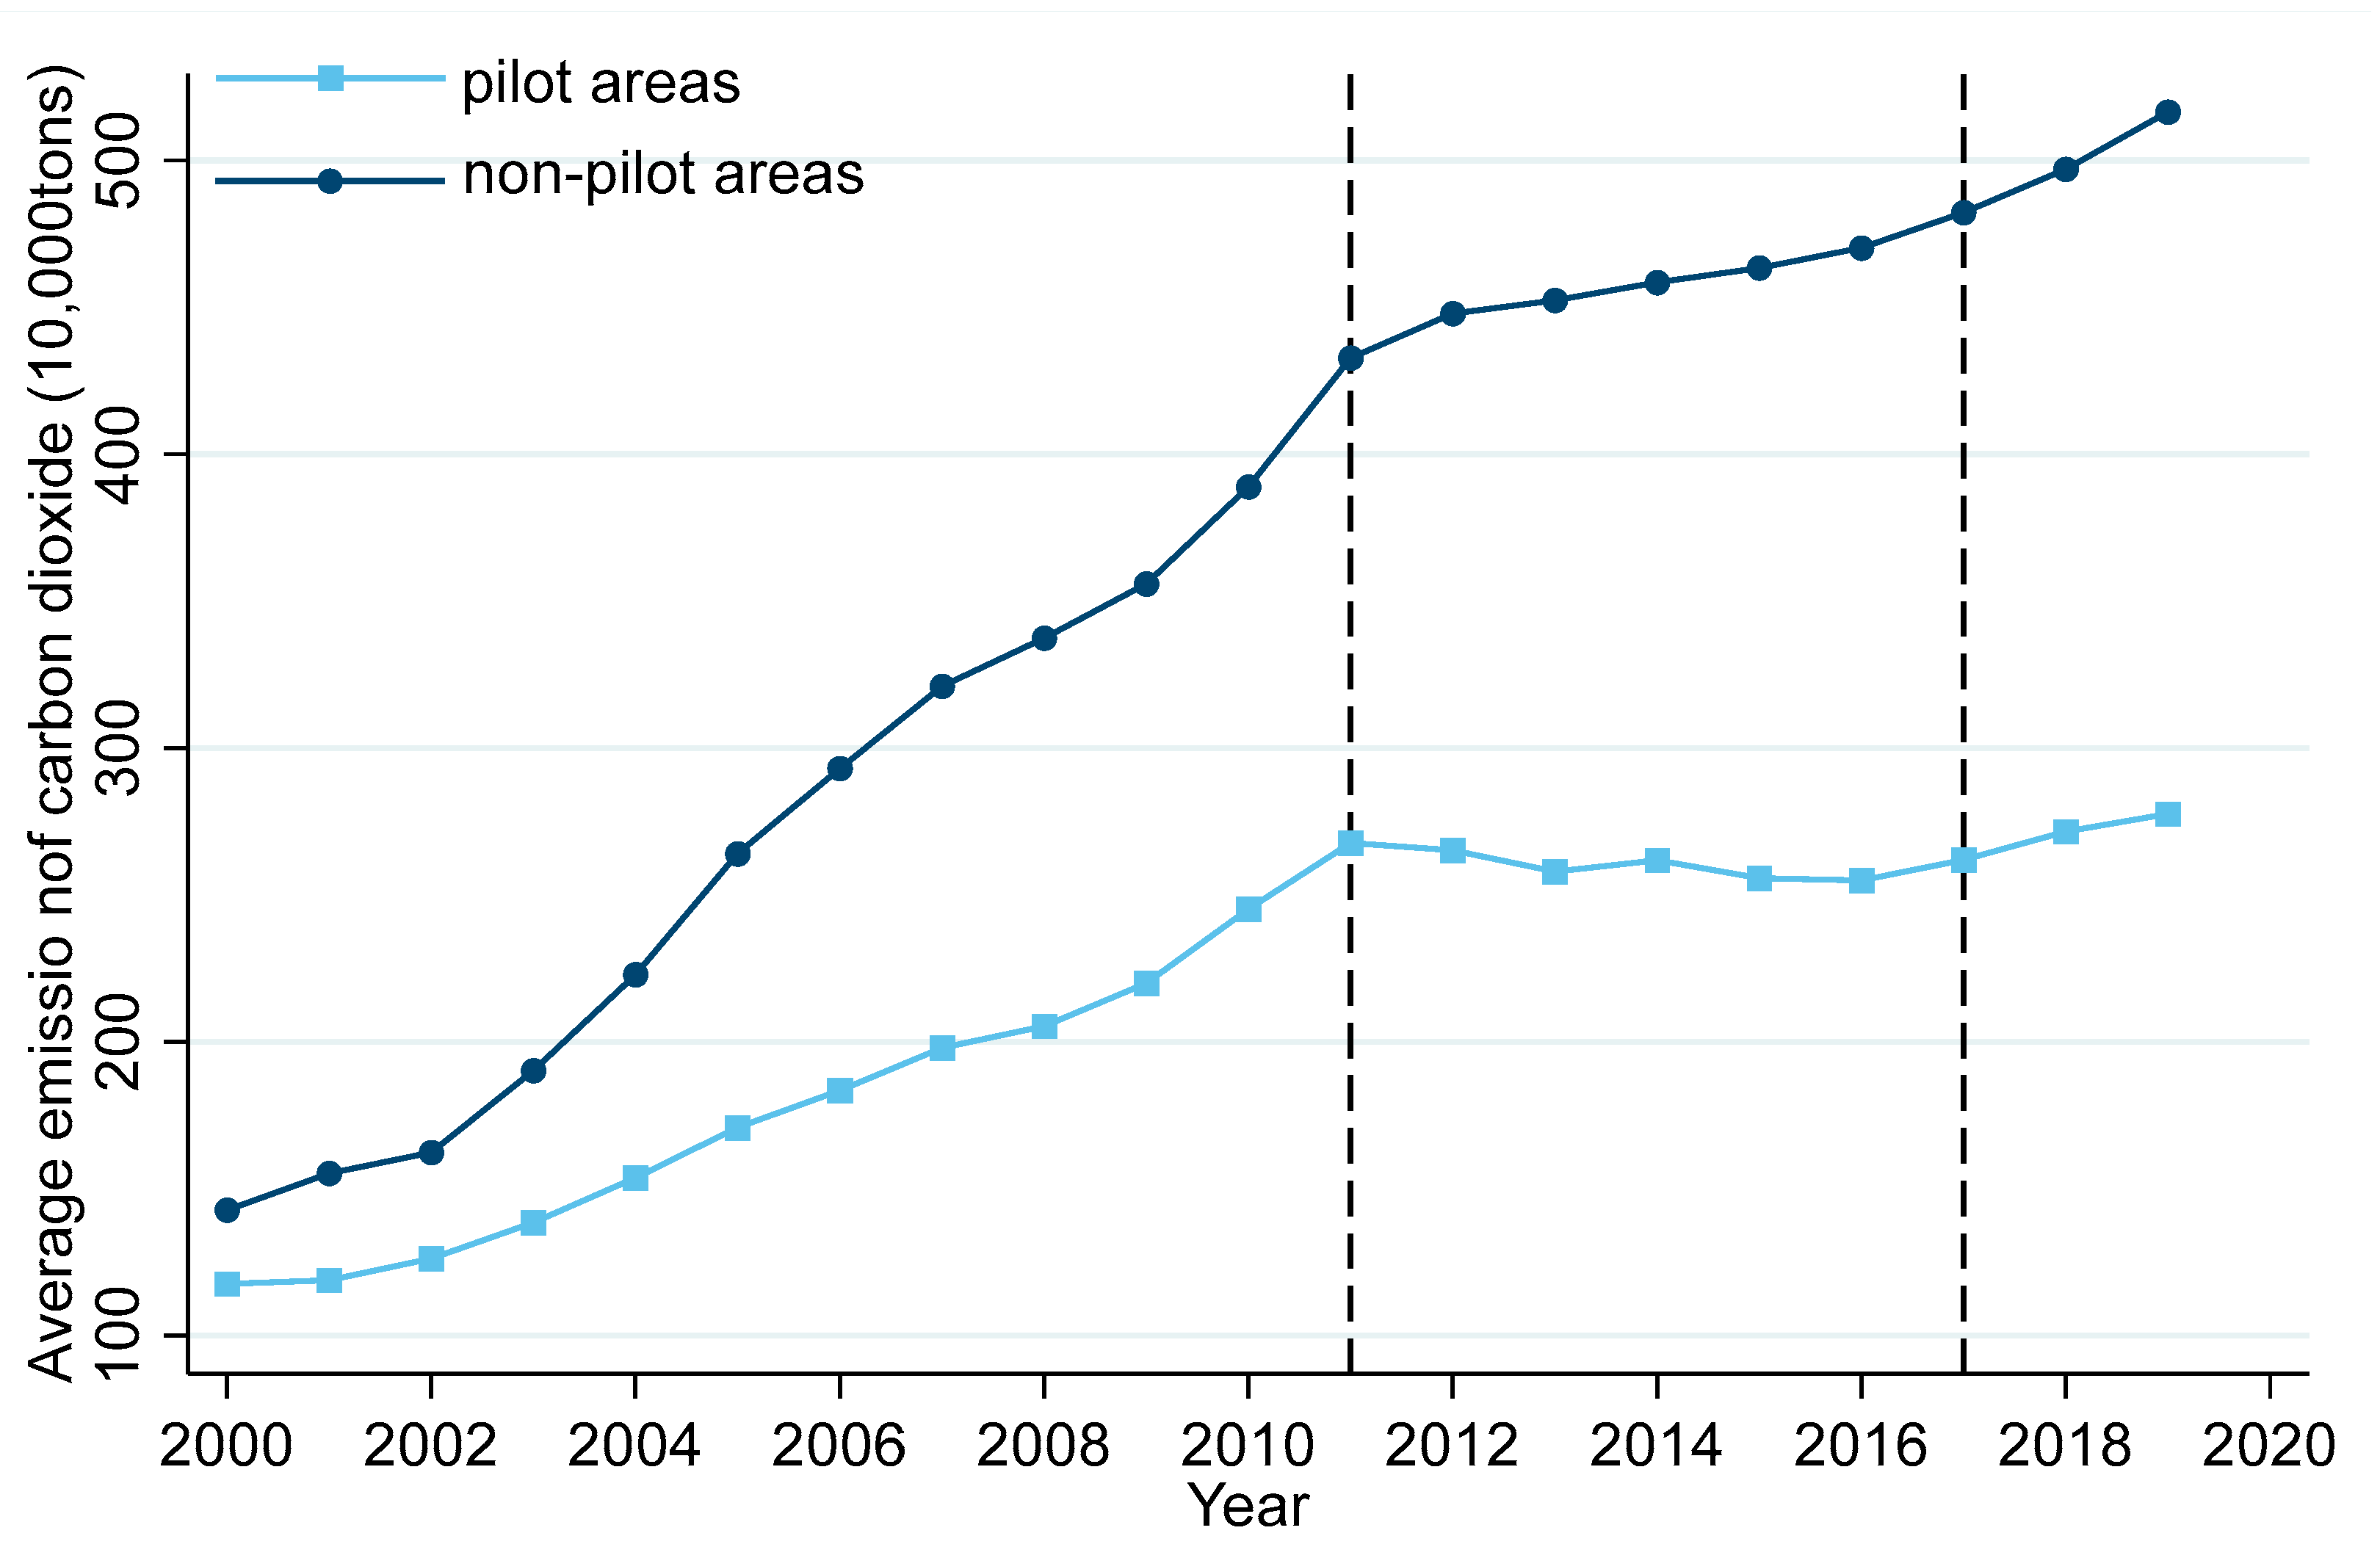
Carbon emissions in pilot areas experience a significant decline following the implementation of the ETS. As shown in Figure 2, carbon emissions in non-pilot areas continue to rise, while carbon emissions in the pilot areas have remained relatively stable with a slight decrease since 2011. Although both areas show an increase in emissions after 2017, the growth in pilot areas is significantly slower compared to that in non-pilot areas. These turning points coincide with the timing of ETS policy reform. Therefore, it is valuable to explore whether the emission reduction can be attributed to sustainable technological progress and what mechanisms are involved, as this is essential for evaluating the effectiveness of the ETS.
This paper mainly focuses on the green technological progress of power industry after the national ETS. In China, only the pilot policies with long-term viability and strategic importance are scaled up for nationwide implementation [11]. The national ETS is an essential part of dual carbon goals for the sustainability of economic and only targets for the power industry. Therefore, whether the national ETS promotes green technological innovations in the power industry is an important issue. To address this issue, we measure the technological level of enterprises by green patents and the total factor productivity (TFP) of power enterprises. Using firm-level data from 2015 to 2022, a differences-in-differences (DID) model is constructed to assess the causal impact of the national ETS on technological progress of power generation enterprises.
This study contributes to the existing literature in the following three aspects: (1) This study addresses the research gap concerning the impact of a national carbon unified market on technological innovation in developing countries. While existing studies on such market mainly focuses on developed countries [12,13,14,15], studies on China’s ETS have so far examined pilot programs’ effects on city-level carbon emissions [16,17,18,19], production efficiency [20,21], corporate investment [22], technological progress [3,12,16,23,24,25,26,27,28], and other related aspects [29,30]. By employing more reliable firm-level microdata and examining the national ETS’s influence on technological progress, this study provides new empirical support to the growing literature on the effects of ETS beyond the pilot period. (2) This study provides new empirical evidence of how ETS promotes technological progress by employing both technological innovation and productivity efficiency. Existing studies focus on either the role in driving technological innovation [9,10,24,25] or its impact on productivity efficiency [21,31,32], but their conclusions across these studies are inconsistent. Therefore, to address this gap, this study evaluates both aspects within a unified analytical framework. (3) This study expands the literature on corporate social responsibility (CSR) related to environmental regulation. Enterprises with better environmental performance can reduce information asymmetry with investors regarding long-term sustainable investments [33,34]. However, some scholars contend that CSR could result in excessive resource allocation and negative environmental spillovers [35]. Therefore, it is worth discussing how ETS will affect the performance of power generation companies in different environments.
The structure of this paper is as follows. Section 2 presents a review of the relevant literature and introduces the hypotheses. Section 3 is the methodologies we employed and the data. Section 4 provides more detailed results. The heterogeneity analysis is shown in Section 5. Section 6 concludes and presents policy implications. Finally, Section 7 discusses the limitations of this study and provides future research directions.

2. Literature and Hypotheses

2.1. Impact of National ETS on Green Patents

The ETS operates through two primary approaches to achieve its policy targets. One approach is to decrease production to stay within a specified emissions quota [9], or to reduce carbon emissions by closing and relocating companies [13,36]. The other is to invest in green technologies [37]. According to benefit–cost analysis, profit-maximizing firms are expected to choose the least-cost compliance path, which may include a technological upgrade [38]. However, technological upgrade requires substantial financial resources, and the promotional effect of government subsidies is limited [39,40,41]. Therefore, in addition to the firms’ investment in cleaner energy, market participation is also needed to reduce transition costs [39,42,43,44,45]. Achieving China’s dual carbon goals will require a coordinated effort combining market mechanisms and technological innovation. The original intention of the carbon ETS market is to reduce carbon emissions, promote technological innovation, and achieve sustainable development. However, some scholars have pointed out that enterprises that aim to maximizing profits may choose not to invest their resources in pollution reduction [46]. The low-carbon economy will depend on technological innovation and more sustainable behavior [27]. Therefore, it is worth discussing whether the goal of this policy can be achieved.
The common way to measure an enterprise’s technology level is the number of patent applications [47,48]. However, scholars have also come to different conclusions. Specifically, at the macro city level, Lin & Zhu [49] observe significant variation in the degree of technological innovation among China’s provinces. Zhang et al. [18] use China’s provincial data to find that innovation resources and knowledge as well as the energy efficiency are conducive to carbon reduction. At the firm level, in developed economies, Matin et al. [12] believe that the European Union ETS (EU-ETS) promotes carbon reduction and technological innovation of regulated enterprises. Caparrós et al. [9] discover that ETS may result in production reduction while improving emission reduction technologies, which may be seen as a negative side effect by policymakers. In China, ETS policies during the pilot period have also been noticed. Hu et al. [25] clarify that while pilot ETS has a beneficial impact on enterprise innovation, it primarily encourages an increase in the number of innovations rather than their overall quality. Chen et al. [24] find that the pilot ETS reduced the green patent application. Crucially, companies tend to focus on cutting production levels instead of investing in green technology innovation to meet emission requirements. Hu et al. [26] argue that ETS has contributed to decreased energy consumption and lower carbon emissions within regulated industries across the pilot regions. They attribute these effects primarily to enhanced technological efficiency and industrial restructuring.
The current literature indicate that the ETS can effectively affect firms’ green innovation. However, there has been relatively little discussion focused on China’s national unified ETS market. This study examines whether the transition from decentralized pilot markets to a unified national carbon market has affected green innovation in the power industry. The establishment of a national unified market may bring two main benefits. First, it reduces the opportunities for enterprises speculation. For instance, under the decentralized pilot markets, some companies resorted to relocating production to other regions to circumvent stricter emission reduction requirements. Second, it mitigates regional carbon price disparities, which previously resulted in limited decarbonization incentives for firms in low-price areas, while compelling enterprises in high-price areas to consider relocating or shifting operations to avoid stringent emission constraints. Therefore, the Hypothesis 1 is proposed as follows:
Hypothesis 1.
The national ETS has a positive effect on green technology innovation in power enterprises.

2.2. Impact of National ETS on TFP

TFP captures the overall outcomes of resource allocation, organizational efficiency, and production management levels [1,50,51]. It can also represent the average effects of technical level [1]. There are different methods to measure the TFP of enterprises. We mainly refer to the two-step estimation method which is proposed by Lee [52], which operates under the assumption that corporate investment decisions are influenced by their existing productivity levels. TFP is influenced by multiple factors, including environmental regulation [33], government intervention [53], and dependence on external technology [54].
Although certain advancements have been achieved in the study of TFP, there are limited literature exploring how ETS affect enterprises’ TFP in China. Existing literature has studied the impact of ETS on production efficiency in developed economies [13,14,15]. At the macro level, some scholars argue that through ETS, the distribution of production factors can be optimized, leading to improvements in total factor productivity [14,20,21,31,55,56,57]. Concretely, in economies with relatively more complete carbon trading market mechanisms, Löschel et al. [14] find EU-ETS positively influences the efficiency of manufacturing enterprises in Germany. Likewise, Moore et al. [13] identify the EU-ETS results in an average increase of 12.1%, indicating that it may have led to a shift in investment focus. However, Marin et al. [15] find that EU-ETS has negative effects on TFP for European companies. In China, Li et al. [31] observe that the pilot ETS positively influenced TFP by using provincial-level data. Yan et al. [58] confirm that ETS increased the proportion of labor compensation in total factor income. Yang et al. [21] also clarify the significant differences in green production performance among provinces, and ETS significantly improves green production performance. Chen et al. [32], using the firm-level data, find that the ETS improves the production efficiency of regulated enterprises. This is achieved mainly through technological progress and more efficient resource allocation [1].
We further assess the impact of the national ETS on TFP among power generation firms in China. Generally speaking, environmental policies can enhance firms’ investment efficiency and strengthen internal controls [59]. ETS can also promote the efficiency of enterprises [15]. However, there is also concern about the possible welfare losses [25,60,61,62], such as negative spillover effects like carbon leakage [63,64]. Enterprises may also respond to the policy by reducing output rather than pursuing long-term green innovation. Thus, Hypothesis 2 is proposed as follows:
Hypothesis 2.
The national ETS has promoted the TFP in power enterprises.

2.3. Impact Mechanism of the National ETS

A key target of the ETS policy is to promote the adoption of advanced emission reduction technologies by enterprises. However, some scholars point out that the ETS market can also generate incentives to reduce output instead of technology innovation, which may be viewed as negative side effects by policymakers [9,32,36]. Therefore, it is important to figure out whether and how the national ETS promotes technological innovation in power enterprises. The research and development (R&D) activities involve generating, accumulating, and applying new knowledge [65,66,67]. R&D expenditure includes both internal and external spending [68,69]. This indicator measures the strategic emphasis that a firm places on innovation. Higher R&D investment generally reflects a stronger commitment to innovation, which is commonly associated with enhanced long-term competitiveness and the pipeline for future products. Fundamentally, this indicator offers valuable insights into the strategic orientation and growth potential of enterprises [70]. Therefore, we consider the R&D expenditure to discuss the innovation mechanism of ETS.
Scholars also point out that R&D expenditure reflects both the size of investment and the sophistication of enterprises’ independent innovation capabilities, which are essential to technological progress [33,49,71,72,73,74,75,76,77,78,79]. Specifically, Hirshleifer et al. [78] consider that the company’s innovation originality can predict abnormal returns. Some studies have identified a significant effect of technological innovation on CO2 emission reduction, achieved primarily through continuous technological advancements [49,74,75,76]. Alam et al. [71] note that R&D significantly boosts clean energy consumption, while simultaneously negatively affecting the growth of carbon emissions. For example, Cai et al. [72] confirm that R&D investment can stimulate technological advancement in China’s photovoltaic industry. Gupta & Goldar [33] examine how R&D investments lead to improved energy efficiency. In contrast, Zhang et al. [79] find that green energy production affects the ecological footprint, and that economic growth along with R&D spending contributes to environmental degradation. In summary, we have a basic causal relationship between technological innovation and R&D investment activities. Therefore, Hypothesis 3 is proposed as follows:
Hypothesis 3.
The National ETS has ultimately influenced green innovation through the R&D expenditure of power enterprises.
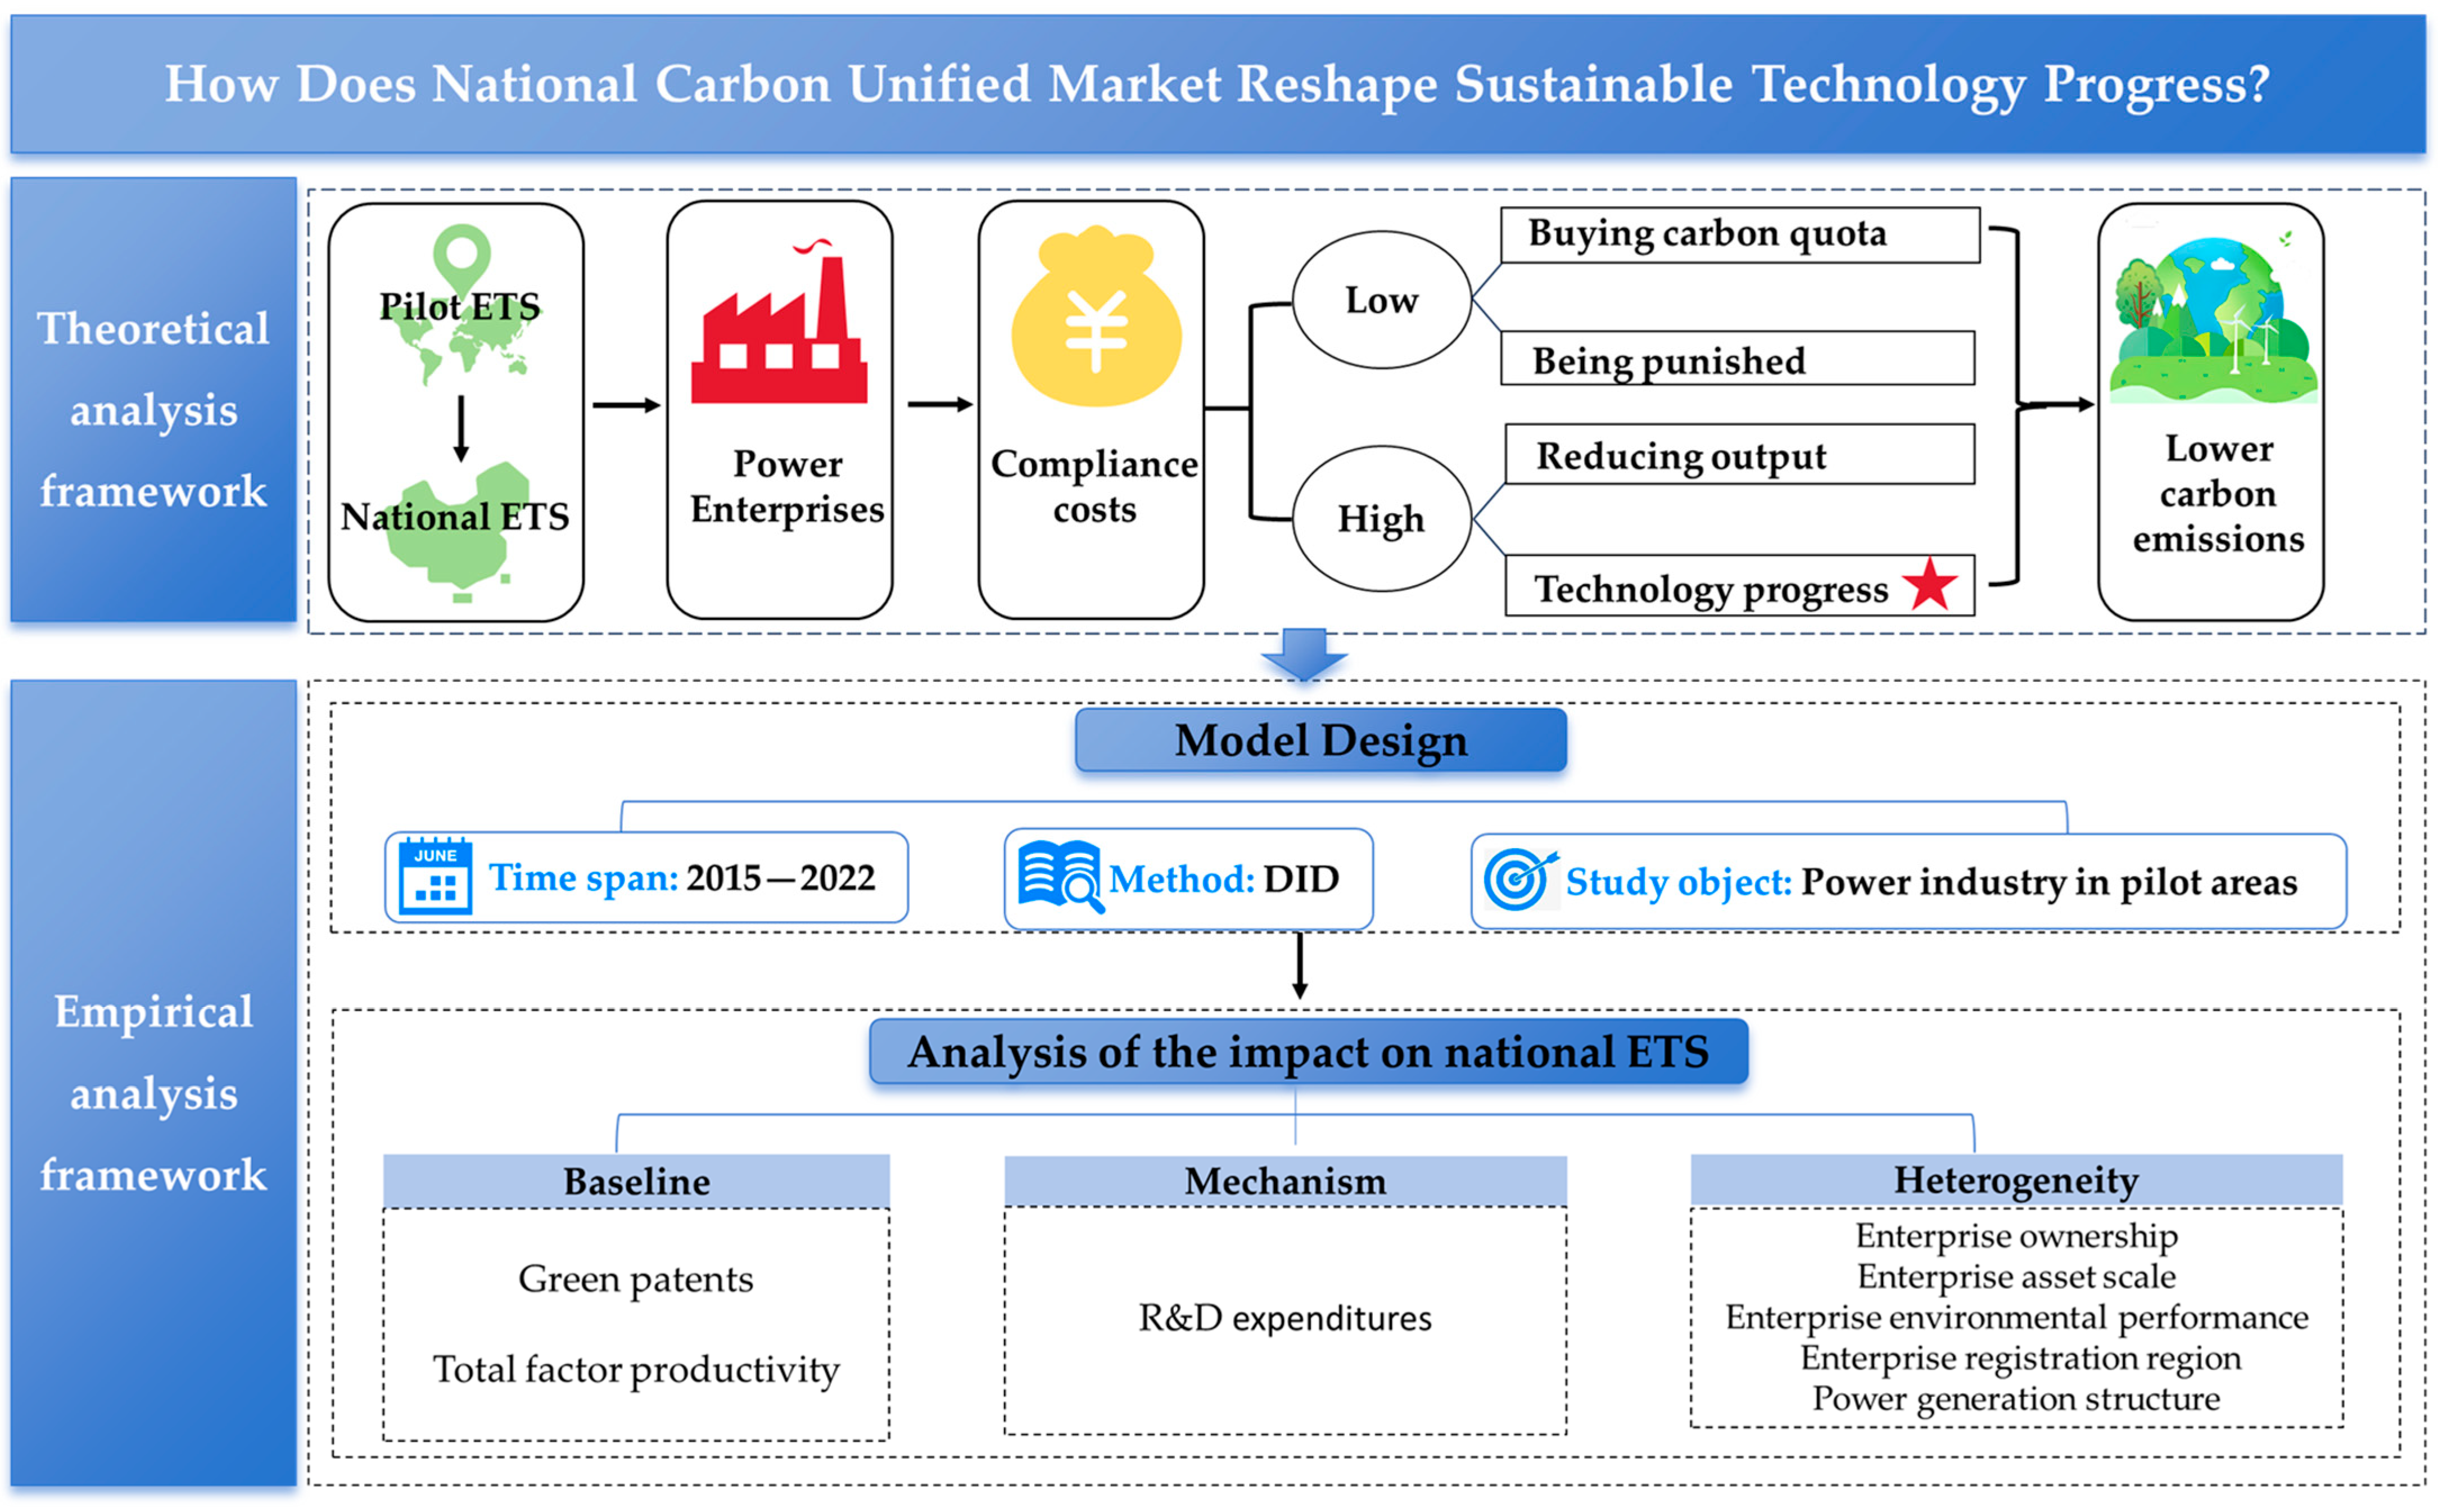
Our research framework is shown in Figure 3.

3. Materials and Methods

3.1. DID Methods

To identify the causal effects of the national ETS on the electric power industry, we specify the following DID model:
y i t = β 0 + β 1 T r e a t i × P o s t t + β 2 X i t + μ t + t s + ε i t
where y i t represents a series of key variables that are explained within a limited research period in each regression, such as green patents and TFP of enterprises. We use the number of patent applications to measure each enterprise’s technological capability. T r e a t i represents the treatment group dummy. P o s t t is the treatment time dummy. X i t is a series of control variables of enterprises’ financial condition, including enterprise asset scale, listing years, operating conditions, cash flow situation, etc. μ t and t s represent fixed effects of year and firm, respectively, used to control for unobservable factors affecting enterprise technological innovation, and ε i t is a random error term. We are most interested in the coefficient β 1 . If β 1 is significant, it indicates that the policy has a statistically meaningful effect on promoting green technological innovation among power enterprises.
The core explanatory variable is T r e a t i × P o s t t , representing the impact of the ETS on the technological innovation level of power industry enterprises. Our sample is limited to pilot cities only because only the carbon quota of the power industry can be traded in the national unified market. The treatment group consists of all listed power generation enterprises in the pilot areas, while the control group consists of other industries included in the same areas. The control group mainly includes other high-carbon-emitting industries covered in the pilot market within the trading system, such as electricity, steel, chemical, petroleum and petrochemical, cement, etc. Under policy shocks, when the enterprise is in the production and supply of electricity industry, the T r e a t   e q u a l s 1, otherwise, it equals 0.
Referring to the determination date of the national ETS of Ma et al. [80], the year 2017 marked the year when the National ETS was announced. In this study, we have set the time node as 2018, and we set the final target time as 2015 to 2022. When the year is 2018 or later, P o s t t is 1, otherwise it is 0. We select 2018 as the starting year for the policy shock based on the following considerations. Although the actual national trading began in 2021, its policy framework was announced as early as 2017, providing enterprises with a clear top-level design and expectations. The year 2018 signifies that policies are beginning to be steadily implemented. During the period 2018 to 2020, national and local authorities intensively rolled out detailed implementation rules, such as drafting and soliciting feedback on the “2019–2020 National Carbon Emission Allowance Allocation Implementation Plan for the Power Generation Industry”. Concurrently, foundational work such as historical data reporting, accounting, and verification was launched. These actions indicate that 2018 is when power generation enterprises began substantive preparations for future allowance quota and trading, forming clear market expectations. In this way, enterprises have started establishing carbon management teams and consolidating emission inventories, which directly influenced their innovation decisions. The true impact of a policy begins when firms perceive risks and initiate strategic adjustments, rather than when final transactions occur. The period from 2018 to 2020 constituted a key window during which enterprises comprehended the policy, assessed risks, and allocated R&D resources. Our empirical study is designed to capture this complete dynamic response process.
A potential concern regarding the identification strategy lies in whether the control group could have been affected by other environmental or industrial policies implemented during the same period. However, this concern is mitigated by the nature of these policies and our empirical design. Although other broad policies were indeed implemented during our sample period (2015–2022), such as Supply-Side Structural Reform, the Three-Year Action Plan for Winning the Blue-Sky Defense Campaign, and the Dual Carbon Goals, those policies targeted all high-energy-consumption and high-carbon-emitting industries. It means both our treatment group (power industry) and our control group (e.g., steel industry, chemical industry) were simultaneously regulated by those policies. Therefore, their impacts are largely absorbed by common trends, rather than asymmetric policy shocks specific to any one industry. In contrast, the national ETS only covered the power sector starting in 2017, leading to a distinct asymmetric policy shock. The key identification strategy of our DID model is to isolate the effect of this market-based environmental regulation on the power industry, after accounting for common trends affecting all industries.

3.2. Data Source

The data is collected from several sources. First, the green patents data were launched by the World Intellectual Property Organization (WIPO) in 2010. We use the IPC codes to identify and extract data on green patents. Second, the basic financial data and calculation of the element of enterprise TFP are both coming from the CSMAR database. Third, Huazheng Index Information Service Co., Ltd. (Shanghai, China) offers the corporate ESG ratings data. Fourth, the registered address information of listed enterprises comes from the China Securities Regulatory Commission. Finally, we collect the power generation structure information from the annual financial report of the power enterprises, as published by the National Enterprise Credit Information Publicity System.
This study considers enterprises listed on both the Shanghai and Shenzhen Stock Exchanges. Industry classifications for listed firms are determined according to the National Economic Industry Classification (NEIC) issued by the National Bureau of Statistics of China. According to the NEIC, the two-digit codes of industries in the pilot areas include: coal mining and washing (B06), oil and gas extraction (B07), textile manufacturing (C17), paper and paper products (C22), oil processing and nuclear fuel processing (C25), chemical raw materials and products manufacturing (C26), non-metallic mineral products (C30), ferrous metal smelting and rolling (C32), and electricity and heat production (D44). We mainly focus on the comparison between the power industry (D44) along with other sectors following the establishment of the national ETS. Furthermore, Financial data of listed enterprises from CSMAR is matched with the listed enterprise code to create a corporate financial panel dataset. To avoid outliers, we exclude ST firms, firms in the financial industry, and firms with extensive missing data. In our sample, there are a total of 89 enterprises in the power industry.

3.3. Variables

3.3.1. Independent Variable

Our main dependent variables are as follows:
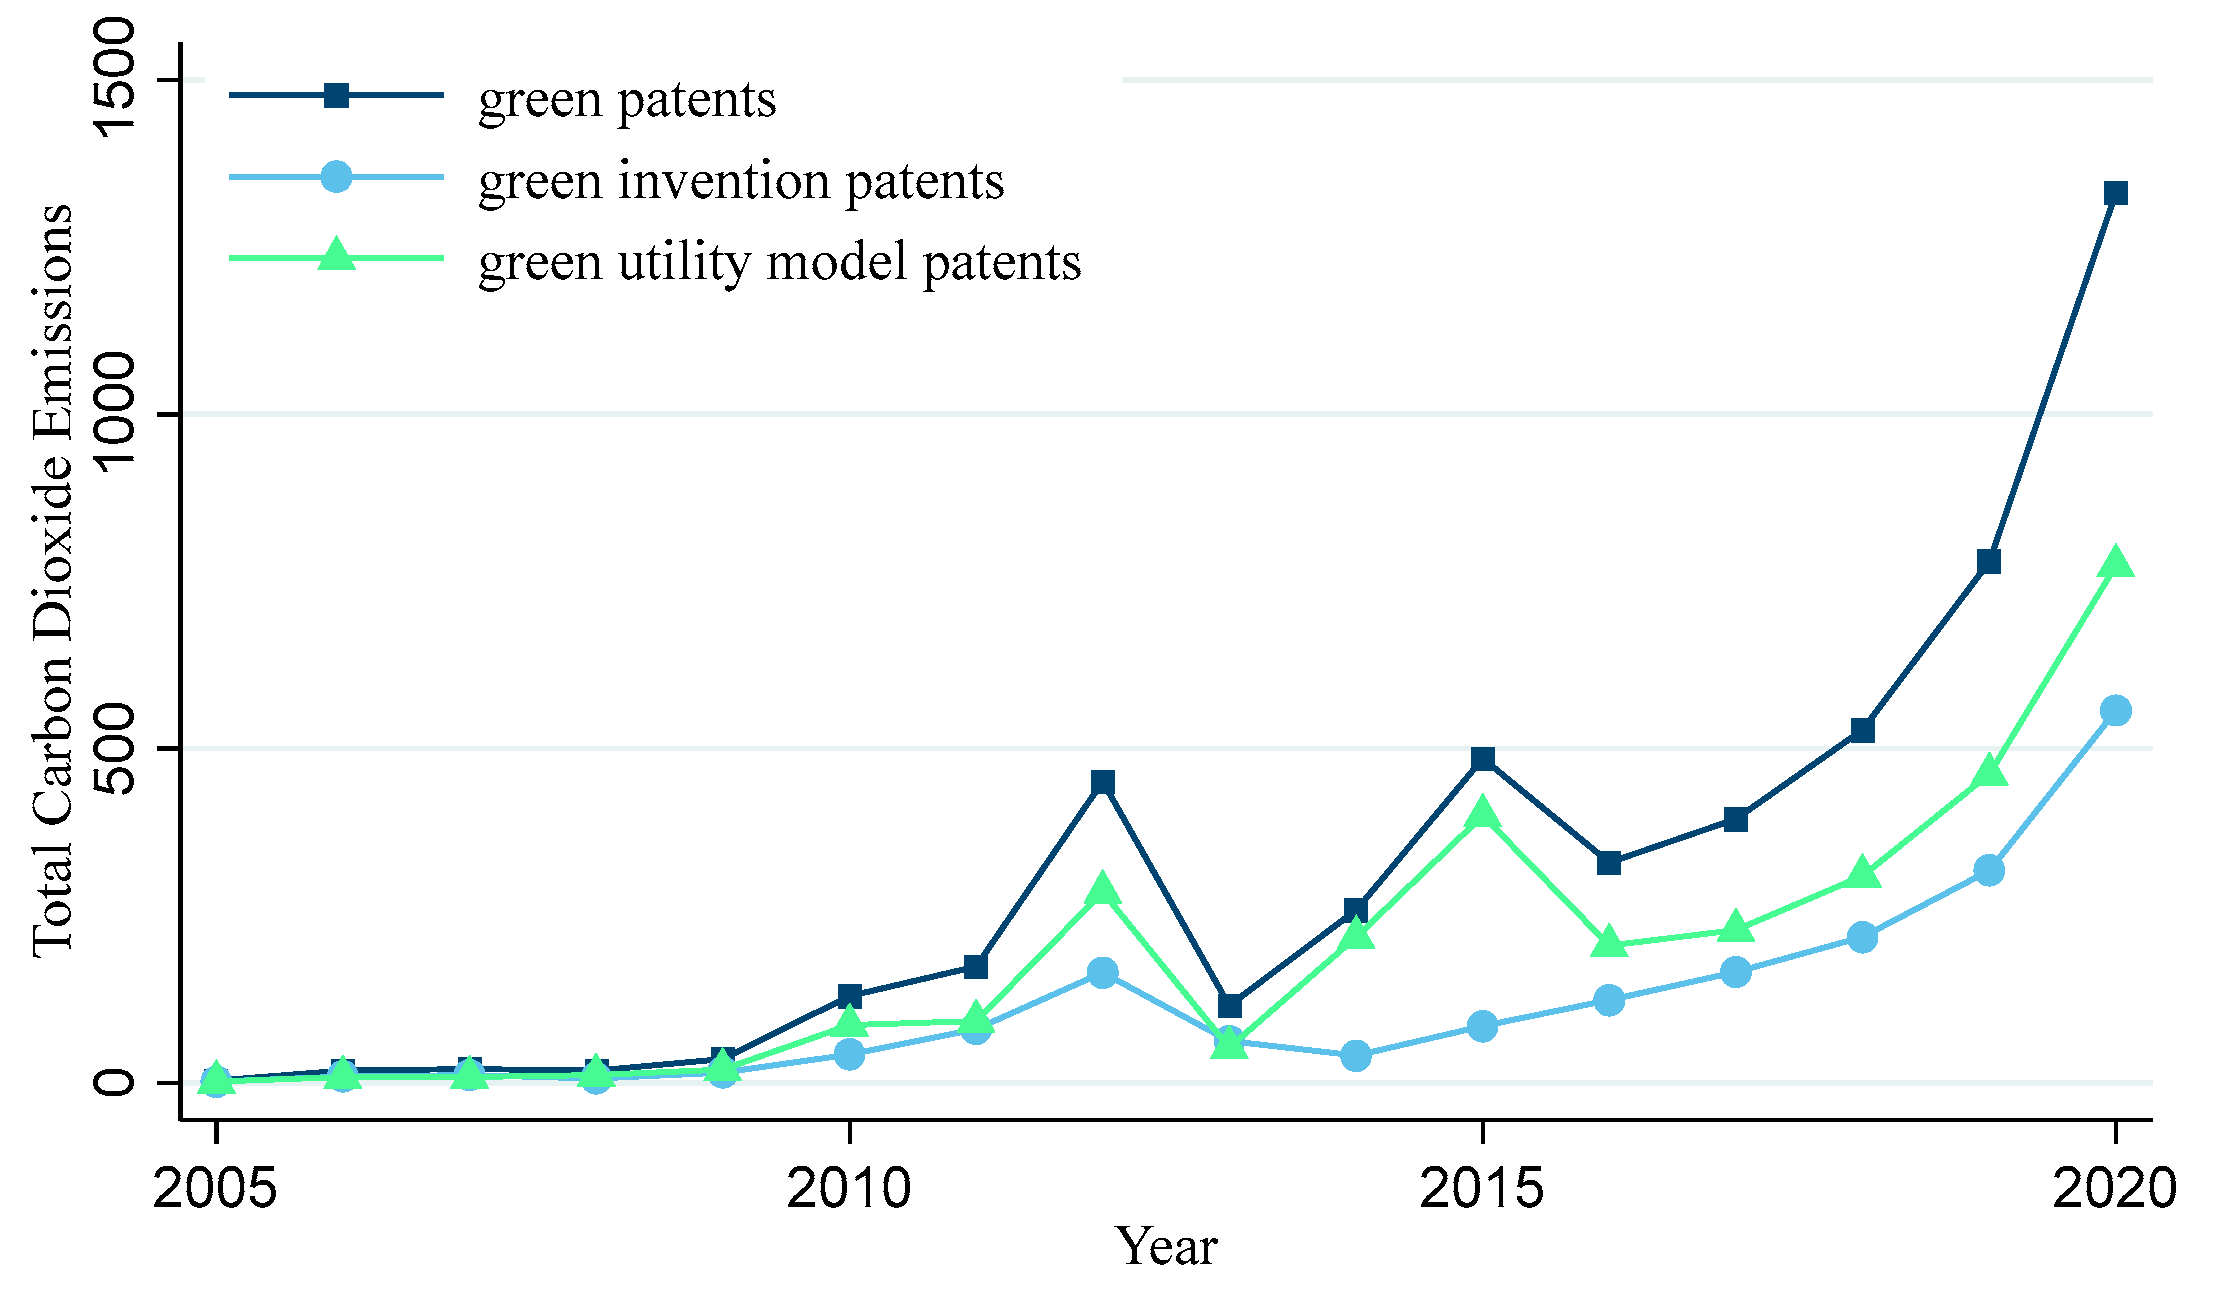
(1) Green Patents (GP): Given that green patents serve as a significant reflection of an enterprise’s capacity for green technology innovation [9,10,25], this study selects green patents that comply with the Green List published by WIPO from the patent database and uses the number of green patent applications as the indicator. We employ the following dependent variables: (i) Green Patents (GP), measured as the annual number of total green patent applications; (ii) Green Invention Patents (GP_in), representing the annual number of green invention patent applications; (iii) Green Utility Model Patents (GP_um), captured as the number of green utility model applications. Figure 4 shows the trend of green patent applications in the electric power industry over time. We find that green patents have significantly increased since 2017. It is known that China has started a carbon trading pilot project in seven regions since 2013. There was also a small peak before and after the pilot policy.
(2) TFP of enterprises (TFP_OP): To assess the innovation efficiency of enterprises, we estimate the TFP following the approach of Olley & Pakes [52]. TFP is an indicator reflecting the average output level in the production process. It is used to measure production efficiency, which represents enterprises’ capability to utilize all factors of production to drive economic growth at a given time [1,21,50,51]. Then, the GMM method is used to recalculate the TFP of the enterprise for robustness verification.
(3) R&D expenditure (R&D_expend): This variable incorporates all internal and external expenditures related to R&D activities within the reporting period, covering basic research, applied research, and experimental development [68,69]. R&D expenditure activities are essential to technology innovation. It assesses the degree of independent innovation capability that enterprises possess [73,77,78]. Moreover, it offers valuable insights into strategy orientation and future growth potential of enterprises [71]. We referred to Su et al. [81], who find that social trust significantly boosts enterprises’ R&D expenditure, and take the natural logarithm of the R&D expenditure after adding a constant to mitigate scaling issues.

3.3.2. Dependent Variables

(1) The cross-term of DID model ( T r e a t i × P o s t t ): This term serves as the core explanatory variable, representing the overall effect of the national ETS on the green innovation of power industry enterprises.
(2) Enterprise ownership (SOE): This dummy variable indicates ownership type, assigned a value of 1 if the enterprise is state-owned, and 0 otherwise.
(3) Enterprise asset size (Scale): This dummy variable is constructed to reflect enterprise size, taking the value of 1 if the enterprise’s total assets exceed 400 million RMB, and 0 otherwise. Our classification of large-sized enterprises is based on the reference of the Bureau of Statistics in China.
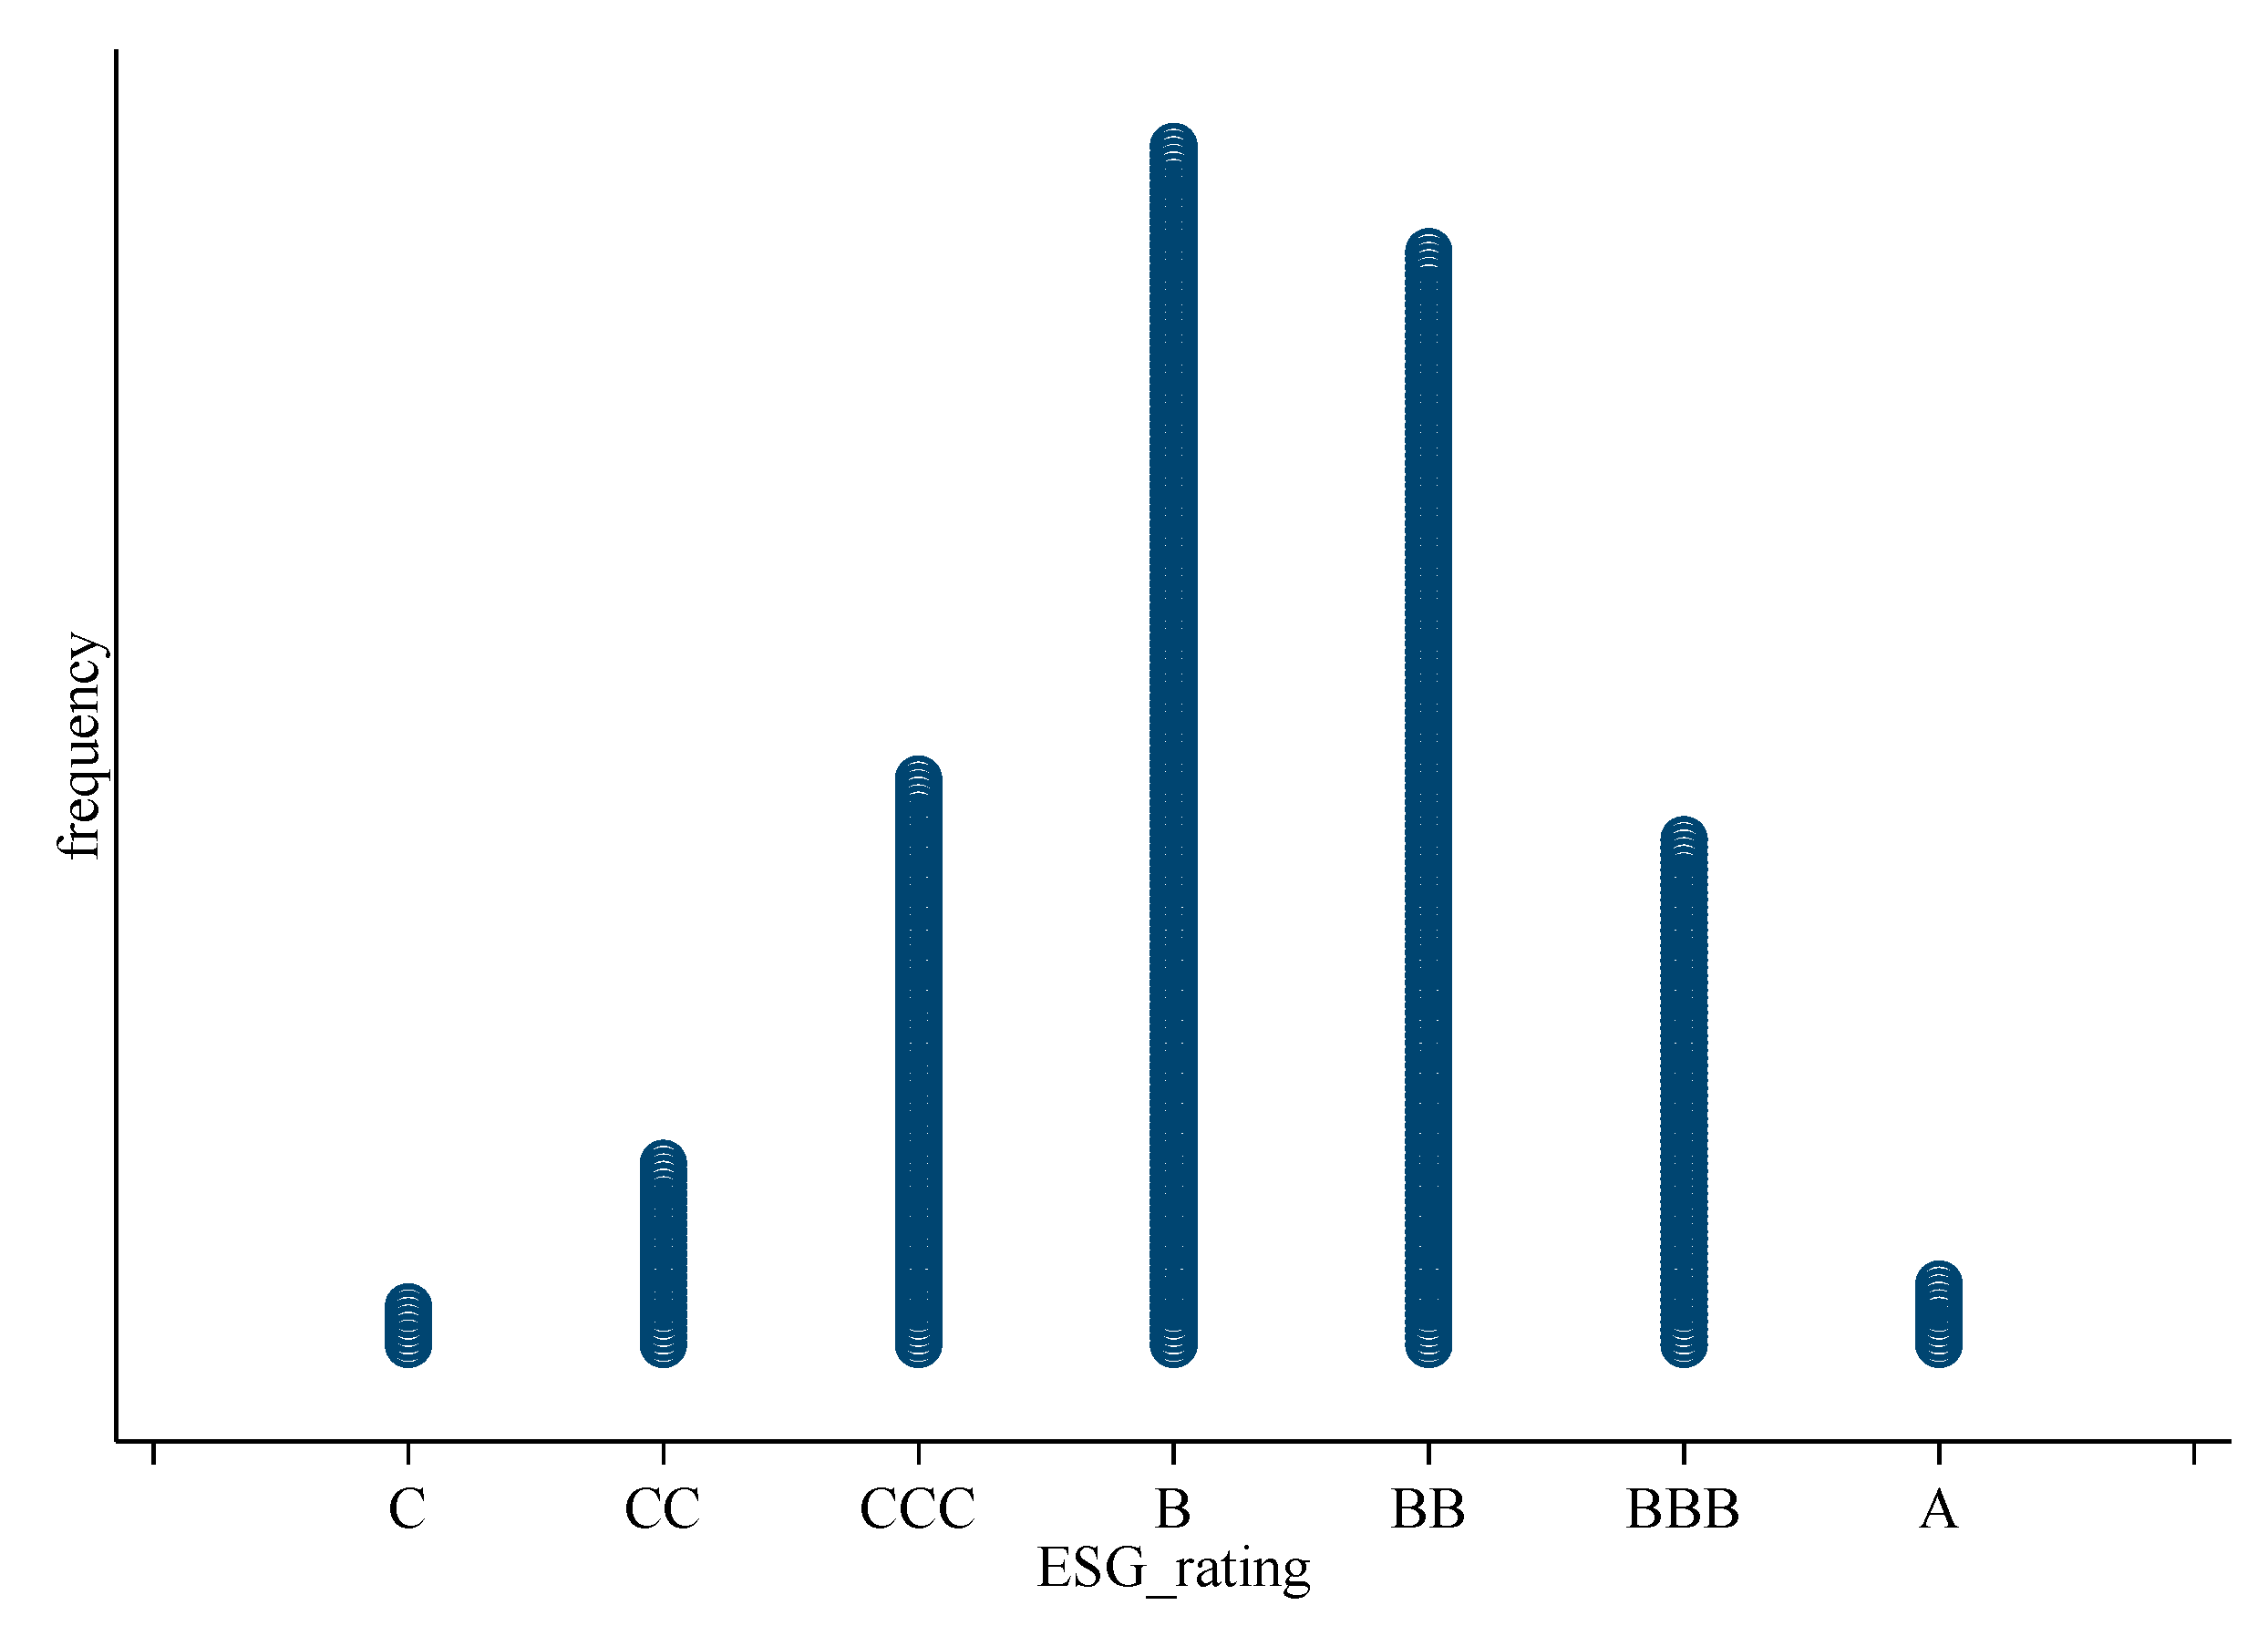
(4) Corporate ESG Rating (ESG): We adopt Huazheng’s corporate ESG rating because their rating of companies in the Chinese stock market is relatively comprehensive and covers the widest range of companies and time. ESG stands for environmental, social, and corporate governance. A high ESG rating represents a company’s outstanding performance in environmental sustainability and social responsibility. Moreover, it is generally believed that companies with high ESG ratings have more transparent disclosure of corporate environmental information, greener corporate strategies, and more sustainable and environmentally friendly business operations [82,83]. According to Huazheng’s ESG rating of enterprises, enterprises are classified as either high-rated or low-rated. The Huazheng rating framework comprises a total of 9 levels, ranging from the lowest C ranking to the highest AAA ranking. Figure 5 shows the distribution of enterprises’ ESG ratings. The average ESG rating of enterprises is around B, indicating that the majority of companies fall within level B. In this study, enterprises rated B or above are classified as high-rated and assigned a value of ESG = 1, while those rated below level B or lacking rating information are considered low-rated enterprises and assigned ESG = 0. Figure 5 shows the distribution of power industry enterprises ESG rating.
(5) Registration region of the enterprise (Region): The power generation industry has certain differences between different regions. This dummy variable is assigned a value of 1 if the enterprise is registered in an eastern region of China, and 0 otherwise.

3.3.3. Control Variables

We include several commonly used financial indicators of listed companies as control variables: (i) enterprise size (Size), total assets of the enterprise after logarithm processing; (ii) asset liability ratio (Lev), ratio of total liabilities to total assets at the end of the year; (iii) asset return rate (ROA), net profit of the enterprise divided by the average balance of total assets; (iv) enterprise listing age (ListAge), the duration of a company’s listing, and we did ln processing. The selection of control variables that we mainly refer to Meng & Zhang [84]. Descriptive statistics of the variables are presented in Table 1.

4. Empirical Results

4.1. Baseline Result

Table 2 shows the causal effect of the national ETS on the technology progress of power enterprises. Columns 1 to 3 show the comprehensive effect of the national ETS on the growth rate of green patents, green invention patents, and green utility model patents. Although patent application counts are often seen as measuring innovation quantity rather than quality, we address this concern by distinguishing between patent types. Following Rong et al. [85], we use green invention patents as a key proxy for higher-quality innovation, as they require a higher degree of novelty and undergo a more stringent substantive examination process in China than utility model patents. The estimated promotion effects are 0.330 for total green patents, 0.425 for green invention patents, and 0.287 for green utility model patents. The fact that the effect is largest for invention patents suggests that the national ETS fostered innovation not only in quantity but also in quality.
Column 4 shows the result for enterprise TFP under the OP algorithm [52]. We recognize that TFP can be influenced by factors beyond environmental regulation, such as managerial practices or market shocks. However, our empirical strategy employs firm fixed effects to control for time-invariant unobservables at the firm level, and year fixed effects to account for macroeconomic shocks. The positive and significant coefficient (0.113) indicates that the ETS led to an improvement in technical efficiency within the power industry, even after accounting for these broader influences.
These results suggest that, following the implementation of the national ETS, the power industry exhibited a stronger performance in technology progress compared to other high-carbon-emitting industries. Our results differ significantly from those of Chen et al. [24], who point out that China’s pilot ETS has a restraining effect on green technology. The main reason is that they are more focused on the pilot period, while we are focused on the national ETS period, and the setting of our experimental control group is relatively different.

4.2. Parallel Trend Test

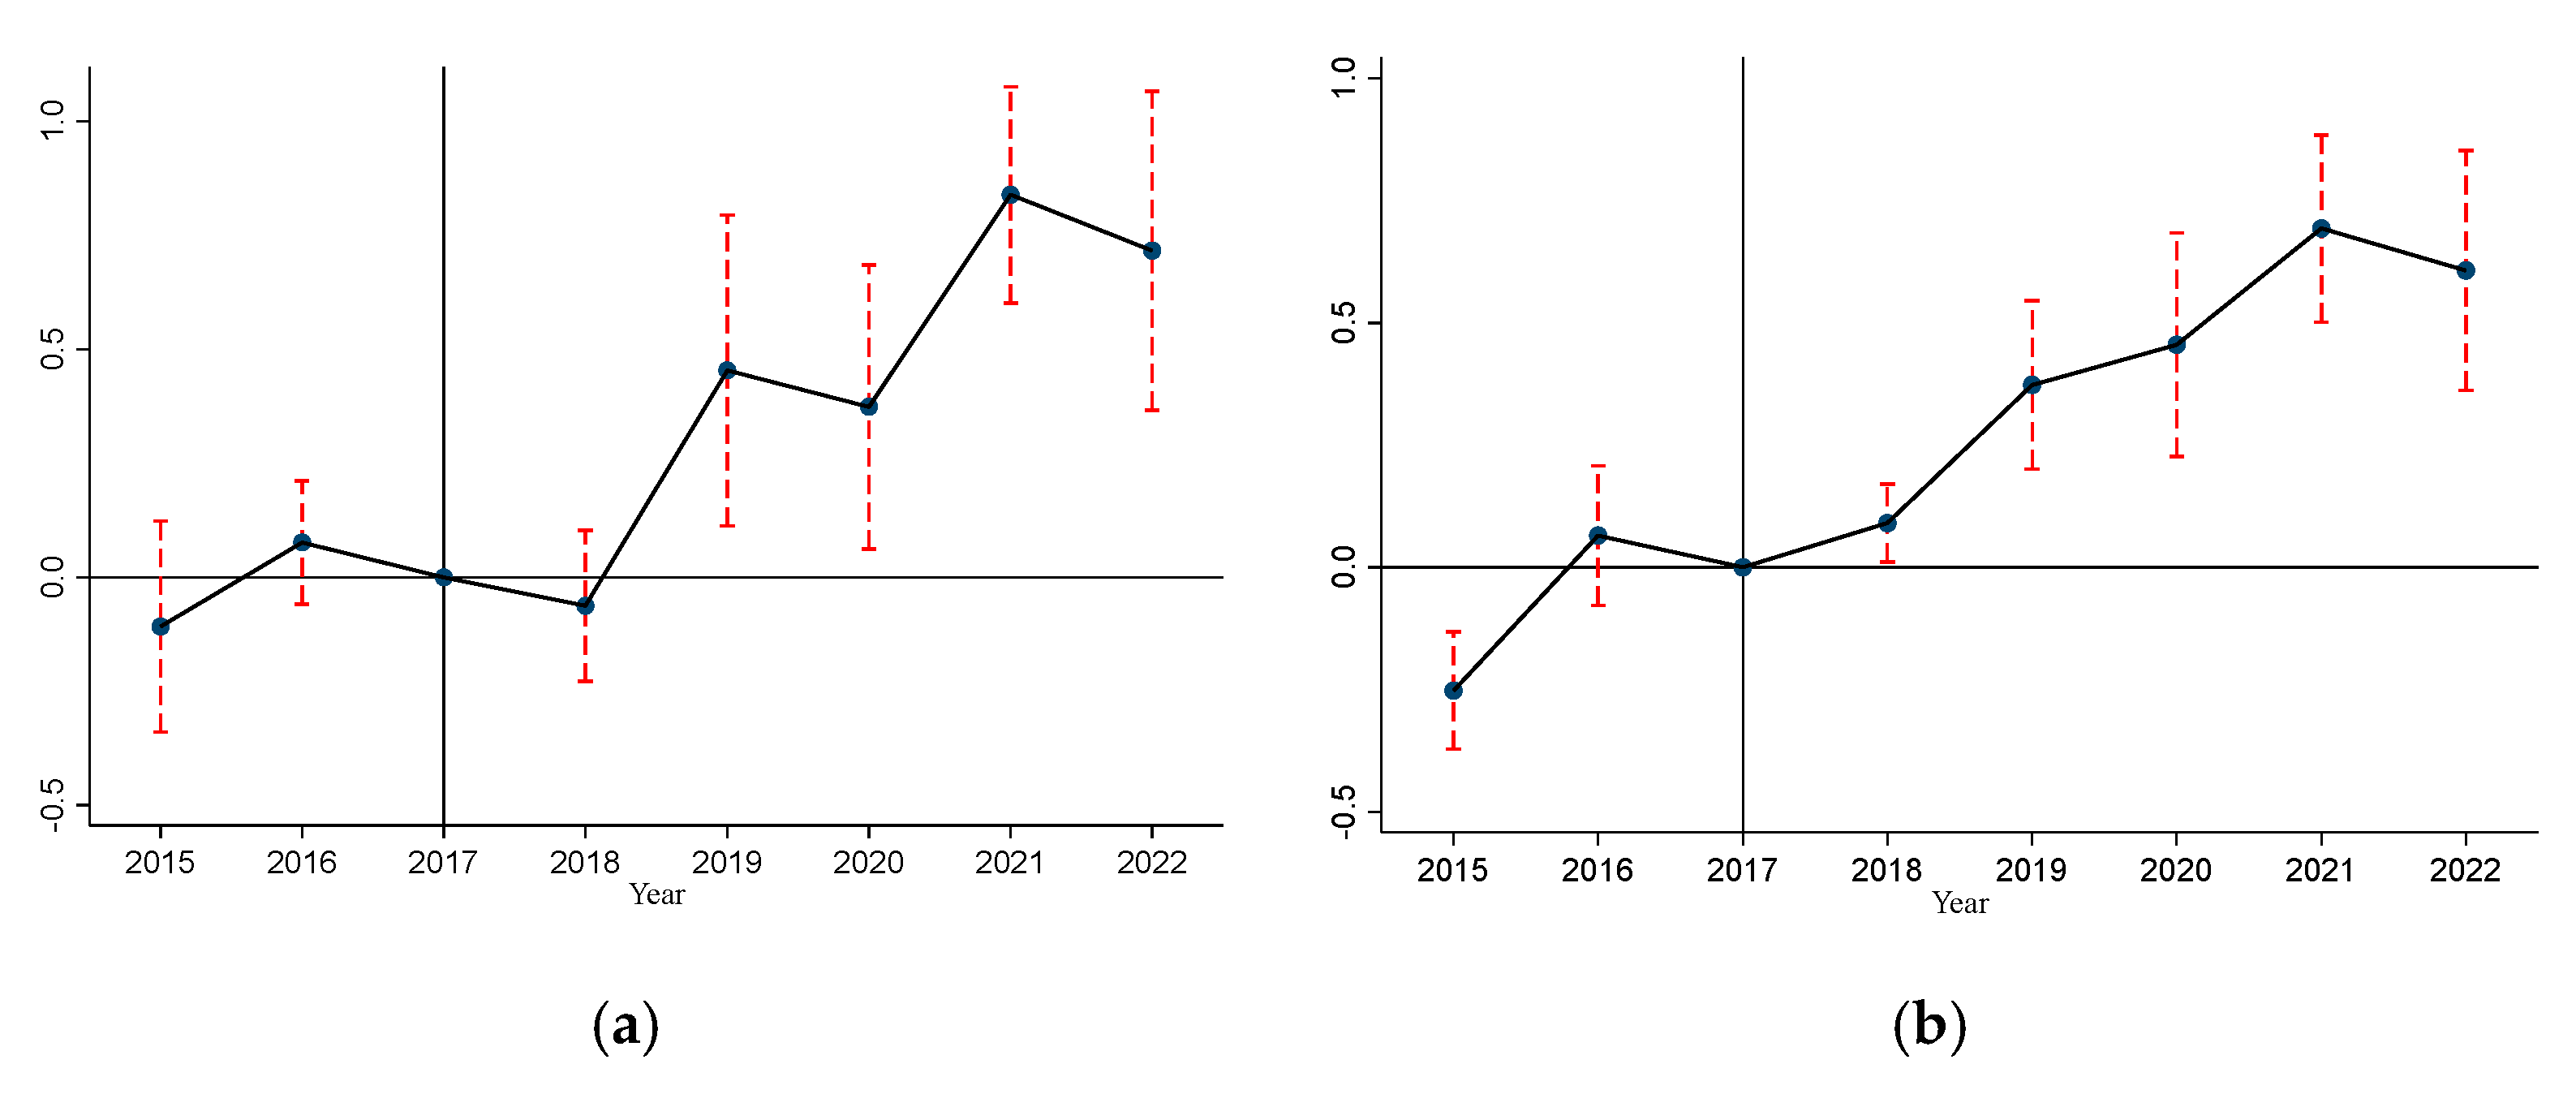
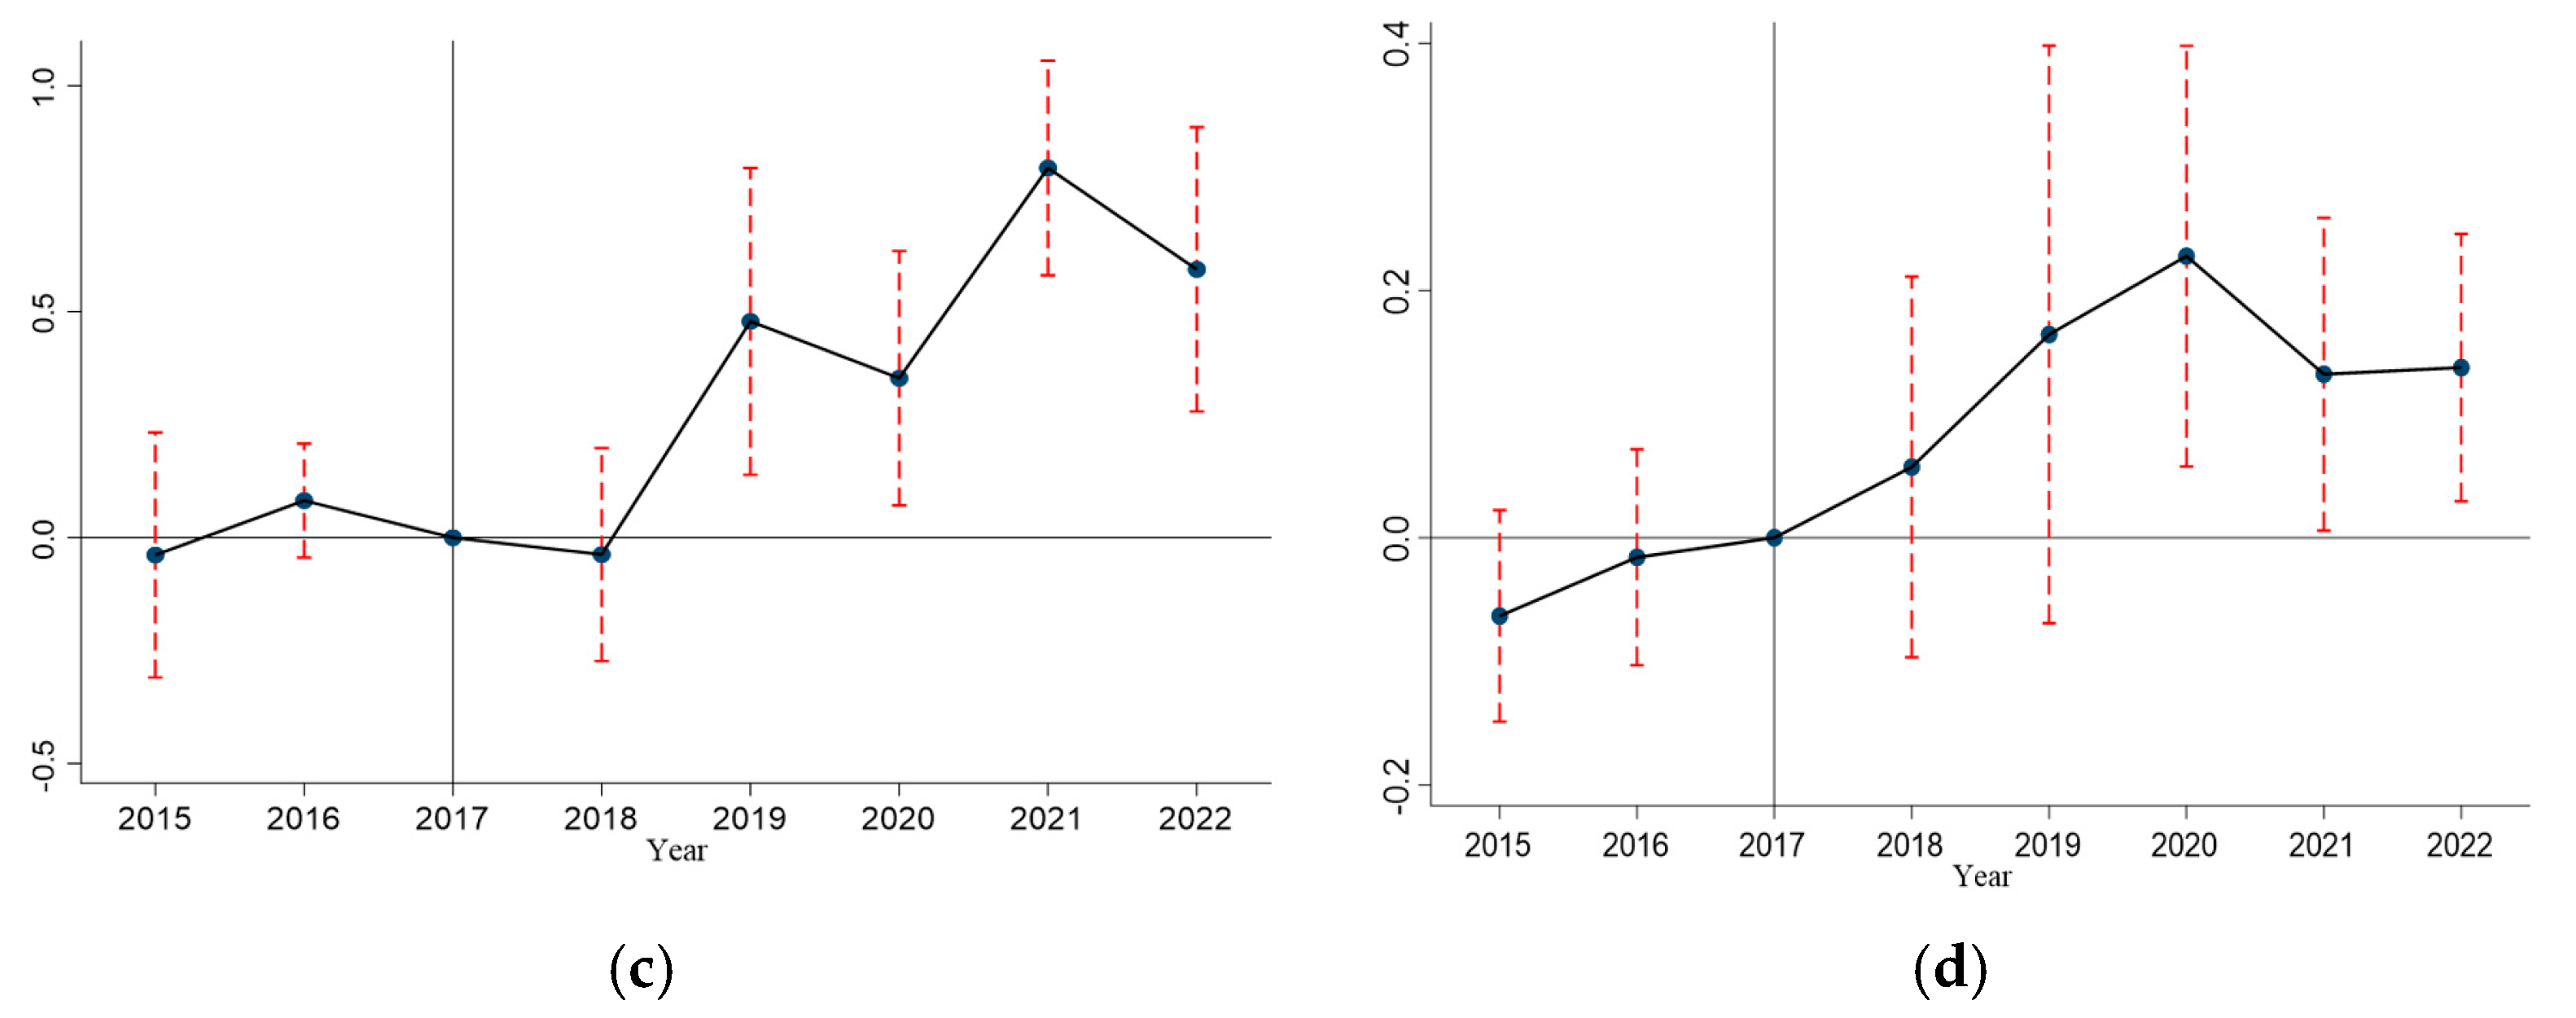
The parallel trend assumption, which is necessary for the DID model to be valid, is satisfied when there are no significant pre-treatment trends between the treatment and control groups. The estimated coefficients and corresponding 95% confidence intervals for the dependent variable’s leads and lags are shown in Figure 6. 2018 is our plan node, and to clearly visualize the results, we normalize the coefficient for 2017 to 0. There is no significant pre-trend for green patents or green utility model patents, as seen in Figure 6. For green invention patents, there is a clear significance in the first phase of the pre-test, but this does not greatly affect the overall rationality. Our four variables show no systematic divergence between treatment and control groups before 2018, supporting the validity of the empirical design.
The treatment effect of green patent application shown in our parallel trend plot becomes statistically significant in 2019, which does not contradict our identification strategy but rather strongly supports the genuine dynamic nature of the policy impact by indicating a reasonable lag effect. This pattern aligns with the inherent characteristics of corporate innovation activities, such as the time-consuming multiple stages of green patent applications, and the time for enterprises to adjust their strategies and reallocate resources.

4.3. Placebo Test

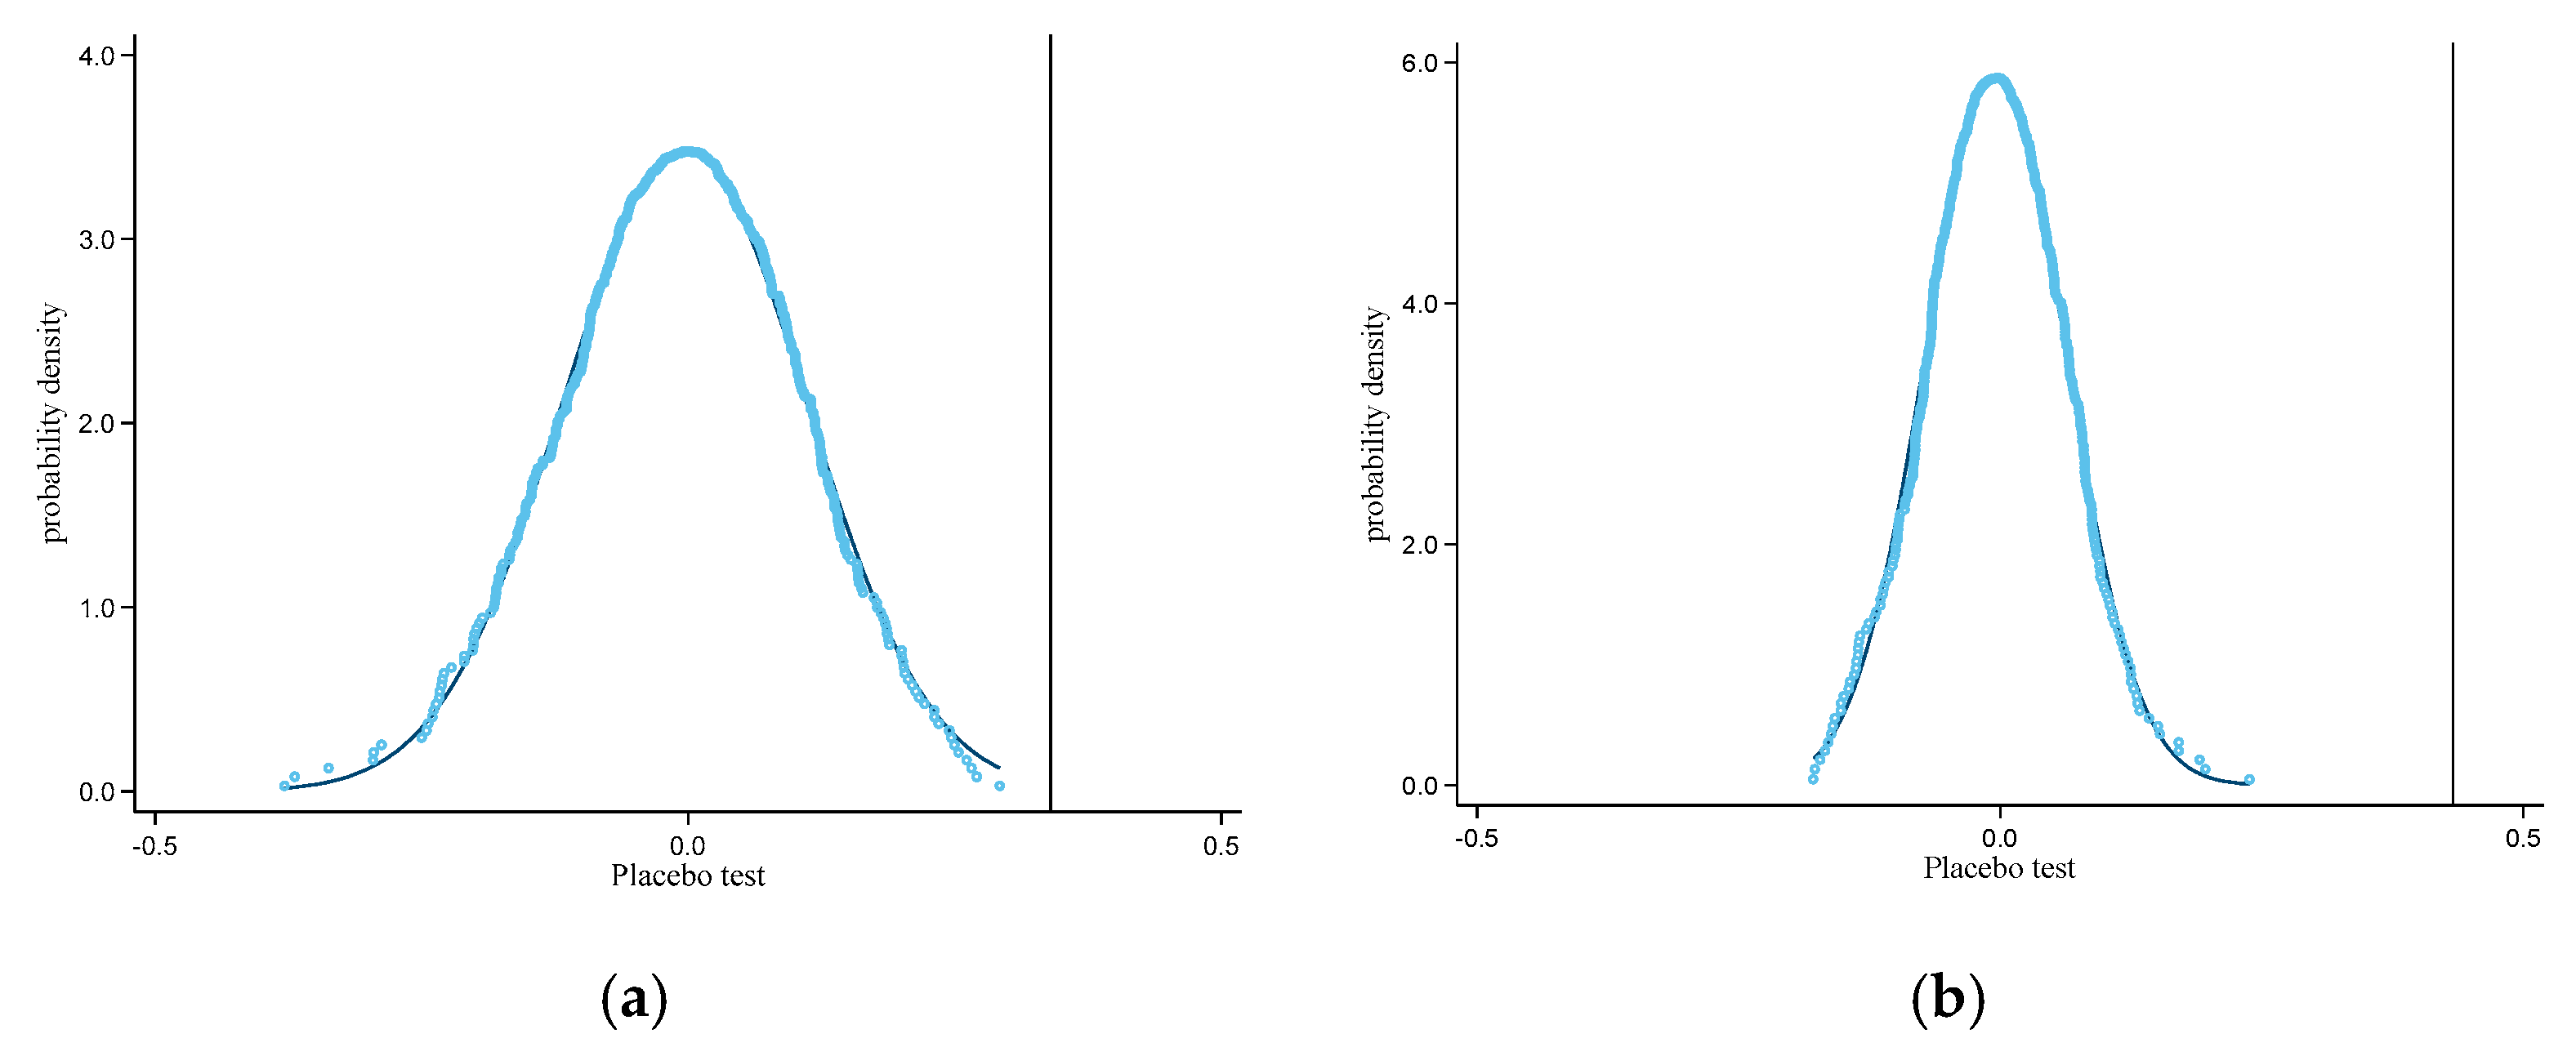
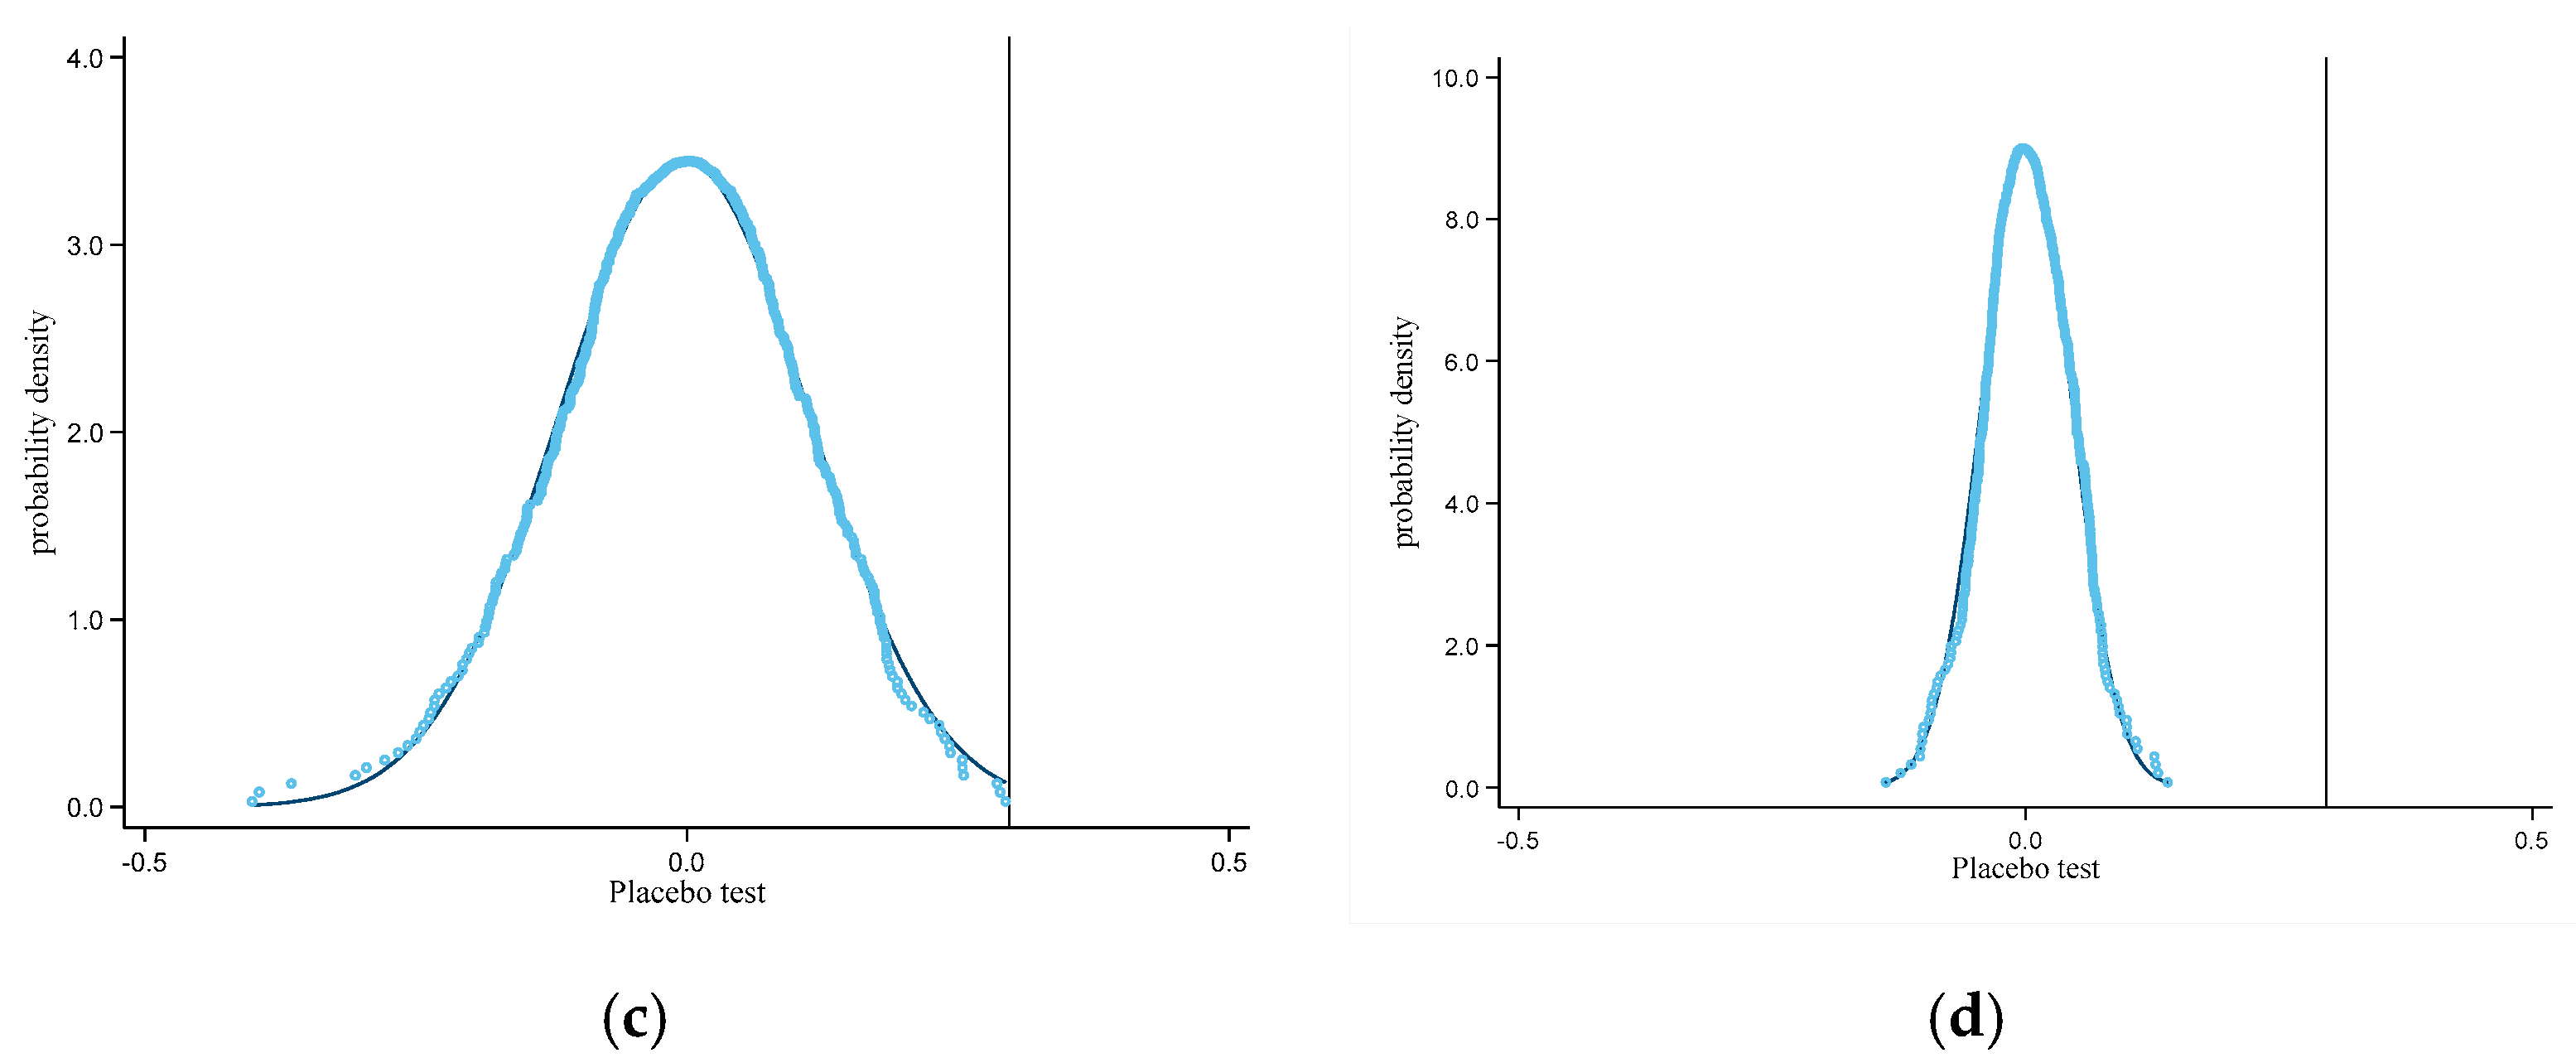
To further confirm the validity of the DID model, we carry out a placebo test. Figure 7 displays the cumulative distribution density of estimated coefficients for 500 runs. The vertical line in Figure 7 corresponds to the baseline estimates reported in Table 2, specifically the coefficients for green patents (0.330), green invention patents (0.425), green utility model patents (0.287), and TFP (0.113). As illustrated, the randomly generated estimates are densely clustered around 0, while the actual estimated values lie well outside the entire distribution or intersect with the tail. These results suggest that the observed treatment effects are unlikely to be driven by unobserved non-policy factors.

4.4. Robustness Check

The patent applications of enterprises have a certain time lag, which may cause some errors in the final results [24]. Therefore, we examine the lagged effects of green patents by one period to validate the robustness of our findings. L.GP, L.GP_in and L.GP_um in Table 3 represent the number of green patents, green invention patents, and green utility model patents in the next year. We also use the GMM algorithm of TFP as a robustness test. Table 3 indicate that the estimated coefficients for both the one-year lagged patent variables and the GMM-based TFP consistent with those of the current year’s application in Table 2 in coefficient and significance level. This means that our baseline result is robust.

5. Discussion and Further Analysis

The baseline results provide new evidence on the promotion effect on the green technological progress of the power industry through the national ETS market. We further explore the potential mechanism through which the ETS operates and examine how its effects vary across different types of enterprises, including those with different ownership structures, asset scales, environmental performance ratings, and geographical locations.

5.1. Mechanism Analysis

We further clarify the external mechanism of ETS on green technology innovation by using R&D expenditure. It delivers crucial financial assistance to enterprises or institutions, prompting them to allocate more resources toward developing new technologies, products, and processes. As shown in Table 4, the national ETS will increase the growth rate of corporate R&D expenditures. Given that R&D activities are closely related to technological innovation [73,77,78], the increase in R&D expenditures promotes the generation of innovative achievements and provides a technical foundation for green patents. We have the assumption that R&D can promote technological innovation.

5.2. Heterogeneity Analysis

5.2.1. Enterprise Ownership

Firstly, we discuss the heterogeneity result of enterprise ownership. Table 5 shows the heterogeneity analysis of ownership of the enterprise. We focus on the cross-term results of the key variable T r e a t i × P o s t t × S O E and the dummy variable SOE. The regression coefficients of the cross terms in columns 1 to 4 are not significant compared to other high-carbon-emitting industrial enterprises. A more favorable influence on the growth rate of green utility model patents is observed only among non-state-owned enterprises, as shown in column 2. This indicates that non-state-owned enterprises have stronger innovation capabilities, more competitiveness, and sustainable development prospects. The results of other independent variables are not statistically significant. To verify the level of enterprise production and innovation quality, we find that the TFP is also increased in non-state-owned power enterprises, but it is not significant.
T r e a t × P o s t × S O E T r e a t × P o s t Some studies suggest that non-state-owned enterprises may exhibit weaker innovation capabilities due to longstanding credit discrimination and financing constraints [86,87,88]. While others indicate that the ETS market may have a stronger stimulating effect on innovation in non-state-owned enterprises, especially during the pilot period [10]. However, our study does not find a statistically significant differential effect of the national ETS between state-owned and non-state-owned enterprises. A potential explanation is that non-state-owned enterprises may face tighter financing constraints due to these additional financial demands. To solve this dilemma, they may have a stronger motivation to pursue green innovation to reduce long-term compliance costs and enhance efficiency. Consequently, non-state-owned enterprises exhibit greater responsiveness to reduce cost pressures and allocate more R&D resources toward green technology. At the same time, state-owned enterprises may maintain more stable R&D departments and investment levels, which are less susceptible to fluctuations in environmental regulation [10]. As a result, the innovation advantage traditionally held by state-owned enterprises does not translate into significantly differentiated outcomes under the ETS policy.

5.2.2. Enterprise Asset Scale

Secondly, we focus on the heterogeneity result of enterprise scale. We focus on the cross-term results of T r e a t i × P o s t t × S c a l e and dummy variable Scale. Table 6 shows the heterogeneity analysis of enterprise size. In terms of the growth rate of total patents and utility model patent applications, we find the effect is significantly smaller in large-scale enterprises compared to small-scale ones. However, the effect of TFP on the heterogeneity of the asset scale is not significant. These results show that the national ETS has a greater promoting effect on small enterprises than on large enterprises, which is relatively opposite to the conclusion obtained by Chen et al. [24] in their study of pilot ETS. One possible explanation is that small-scale enterprises have stronger flexibility and can quicklier business directions to adapt to market changes. Small power generation enterprises often focus more on edging market, such as renewable energy, distributed generation, or smart grids. Meanwhile, the national ETS is slightly different from the pilot period. After the national ETS promotion, small-scale power generation enterprises can improve their innovation capabilities through the comprehensive effects of policy support and market demand changes. In general, we conclude that ETS exerts a stronger promotional effect on small enterprises in the power industry compared to large ones.
T r e a t × P o s t × S c a l e T r e a t × P o s t The results show that the national ETS market exerts a stronger promoting effect on utility model patents in small-scale enterprises primarily due to systematic differences in innovation patterns, resource constraints, and policy response compared to larger firms [89]. Utility model patents emphasize practicality, minor technological improvements, and process innovations rather than fundamental breakthroughs [90]. Constrained by limited R&D resources and capabilities, small enterprises tend to focus on this type of short-cycle and practical incremental innovation to rapidly reduce carbon emissions and meet ETS compliance requirements.

5.2.3. Enterprise Environmental Performance

Thirdly, we come to the heterogeneity result of enterprise environmental performance. High ESG ratings enterprises will also face lower environmental governance risks. On the contrary, ESG ratings reflect inadequate performance in these areas, potentially leading to disregard from investors and the public, adversely affecting the company’s long-term development and brand reputation. Table 7 shows the heterogeneity analysis of the enterprises’ ESG rating system. We focus on the cross-term results in T r e a t i × P o s t t × E S G and the dummy variable ESG. As shown in columns 1 to 3, the coefficients of the cross-term are significantly positive across all three categories of green patents. This indicates that the national ETS has a more positive effect on enterprises with higher ESG ratings, while its impact on enterprises with lower ESG ratings is not significant. Specifically, enterprises with advanced ESG ratings show significantly enhanced outcomes across all indicators of green innovation. In contrast, among enterprises with lower ESG ratings, a promoting effect is observed only in the case of green invention patents, while no significant impact is found on the growth rate of green utility model patents. Moreover, for the TFP of enterprises, the heterogeneity of enterprise environmental performance is not significant.

5.2.4. Enterprise Registration Region

Fourthly, we categorize the registered locations of enterprises into eastern and non-eastern regions. Yao et al. [28] believe that the effectiveness of ETS has significant heterogeneity effects among regions. We examine the heterogeneity effect on different enterprise registration regions. Table 8 presents the heterogeneity analysis across enterprises located in different regions. We focus on the variable T r e a t i × P o s t t × R e g i o n and the dummy variable Region. The results show that more positive combined effects of the national ETS on eastern enterprises. Overall, eastern power enterprises have stronger innovation capabilities compared to the non-eastern ones, which may be consistent with the original endowment differences between regions. Shanghai, Beijing, Shenzhen, Guangdong, and Tianjin are all in the eastern region, and Chongqing and Hubei are non-eastern regions. The power industry in these areas has grown more in terms of innovation quantity, though no significant difference was observed in production efficiency as measured by TFP. The concentrated population, technological foundation, market demand, and convenient infrastructure in the eastern region are relatively more advanced than those in non-eastern regions.

5.2.5. Power Generation Structure

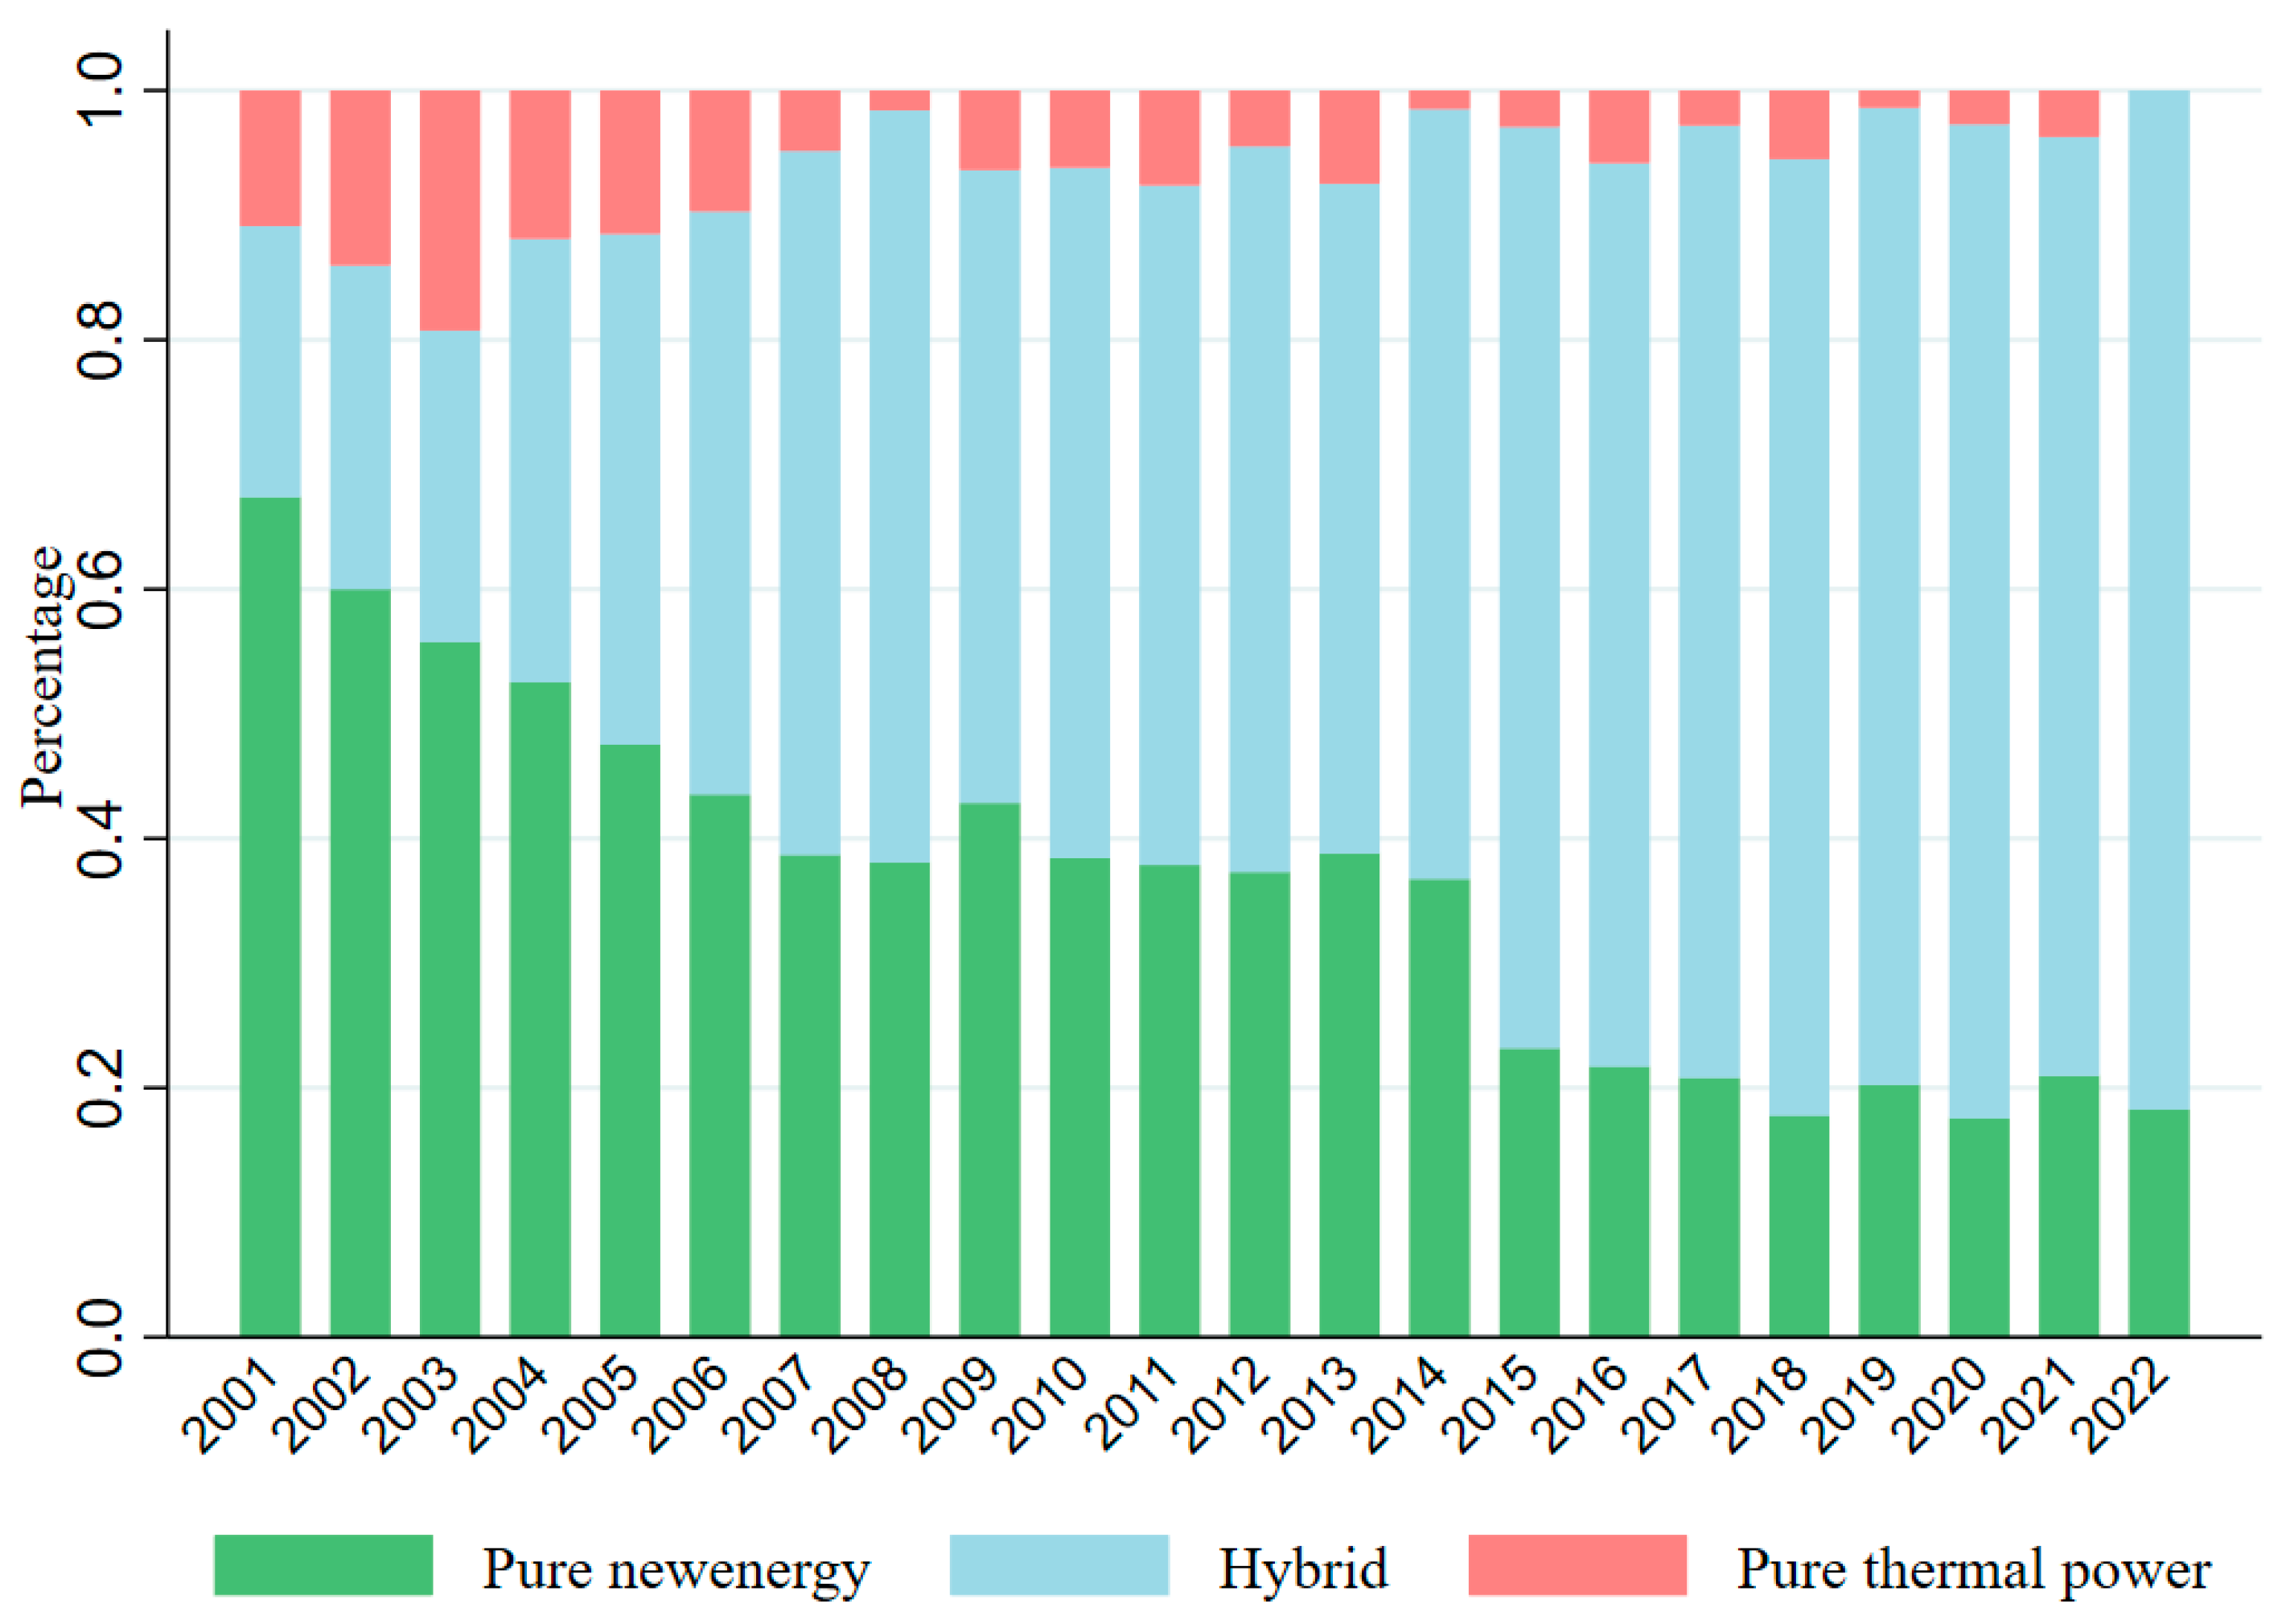
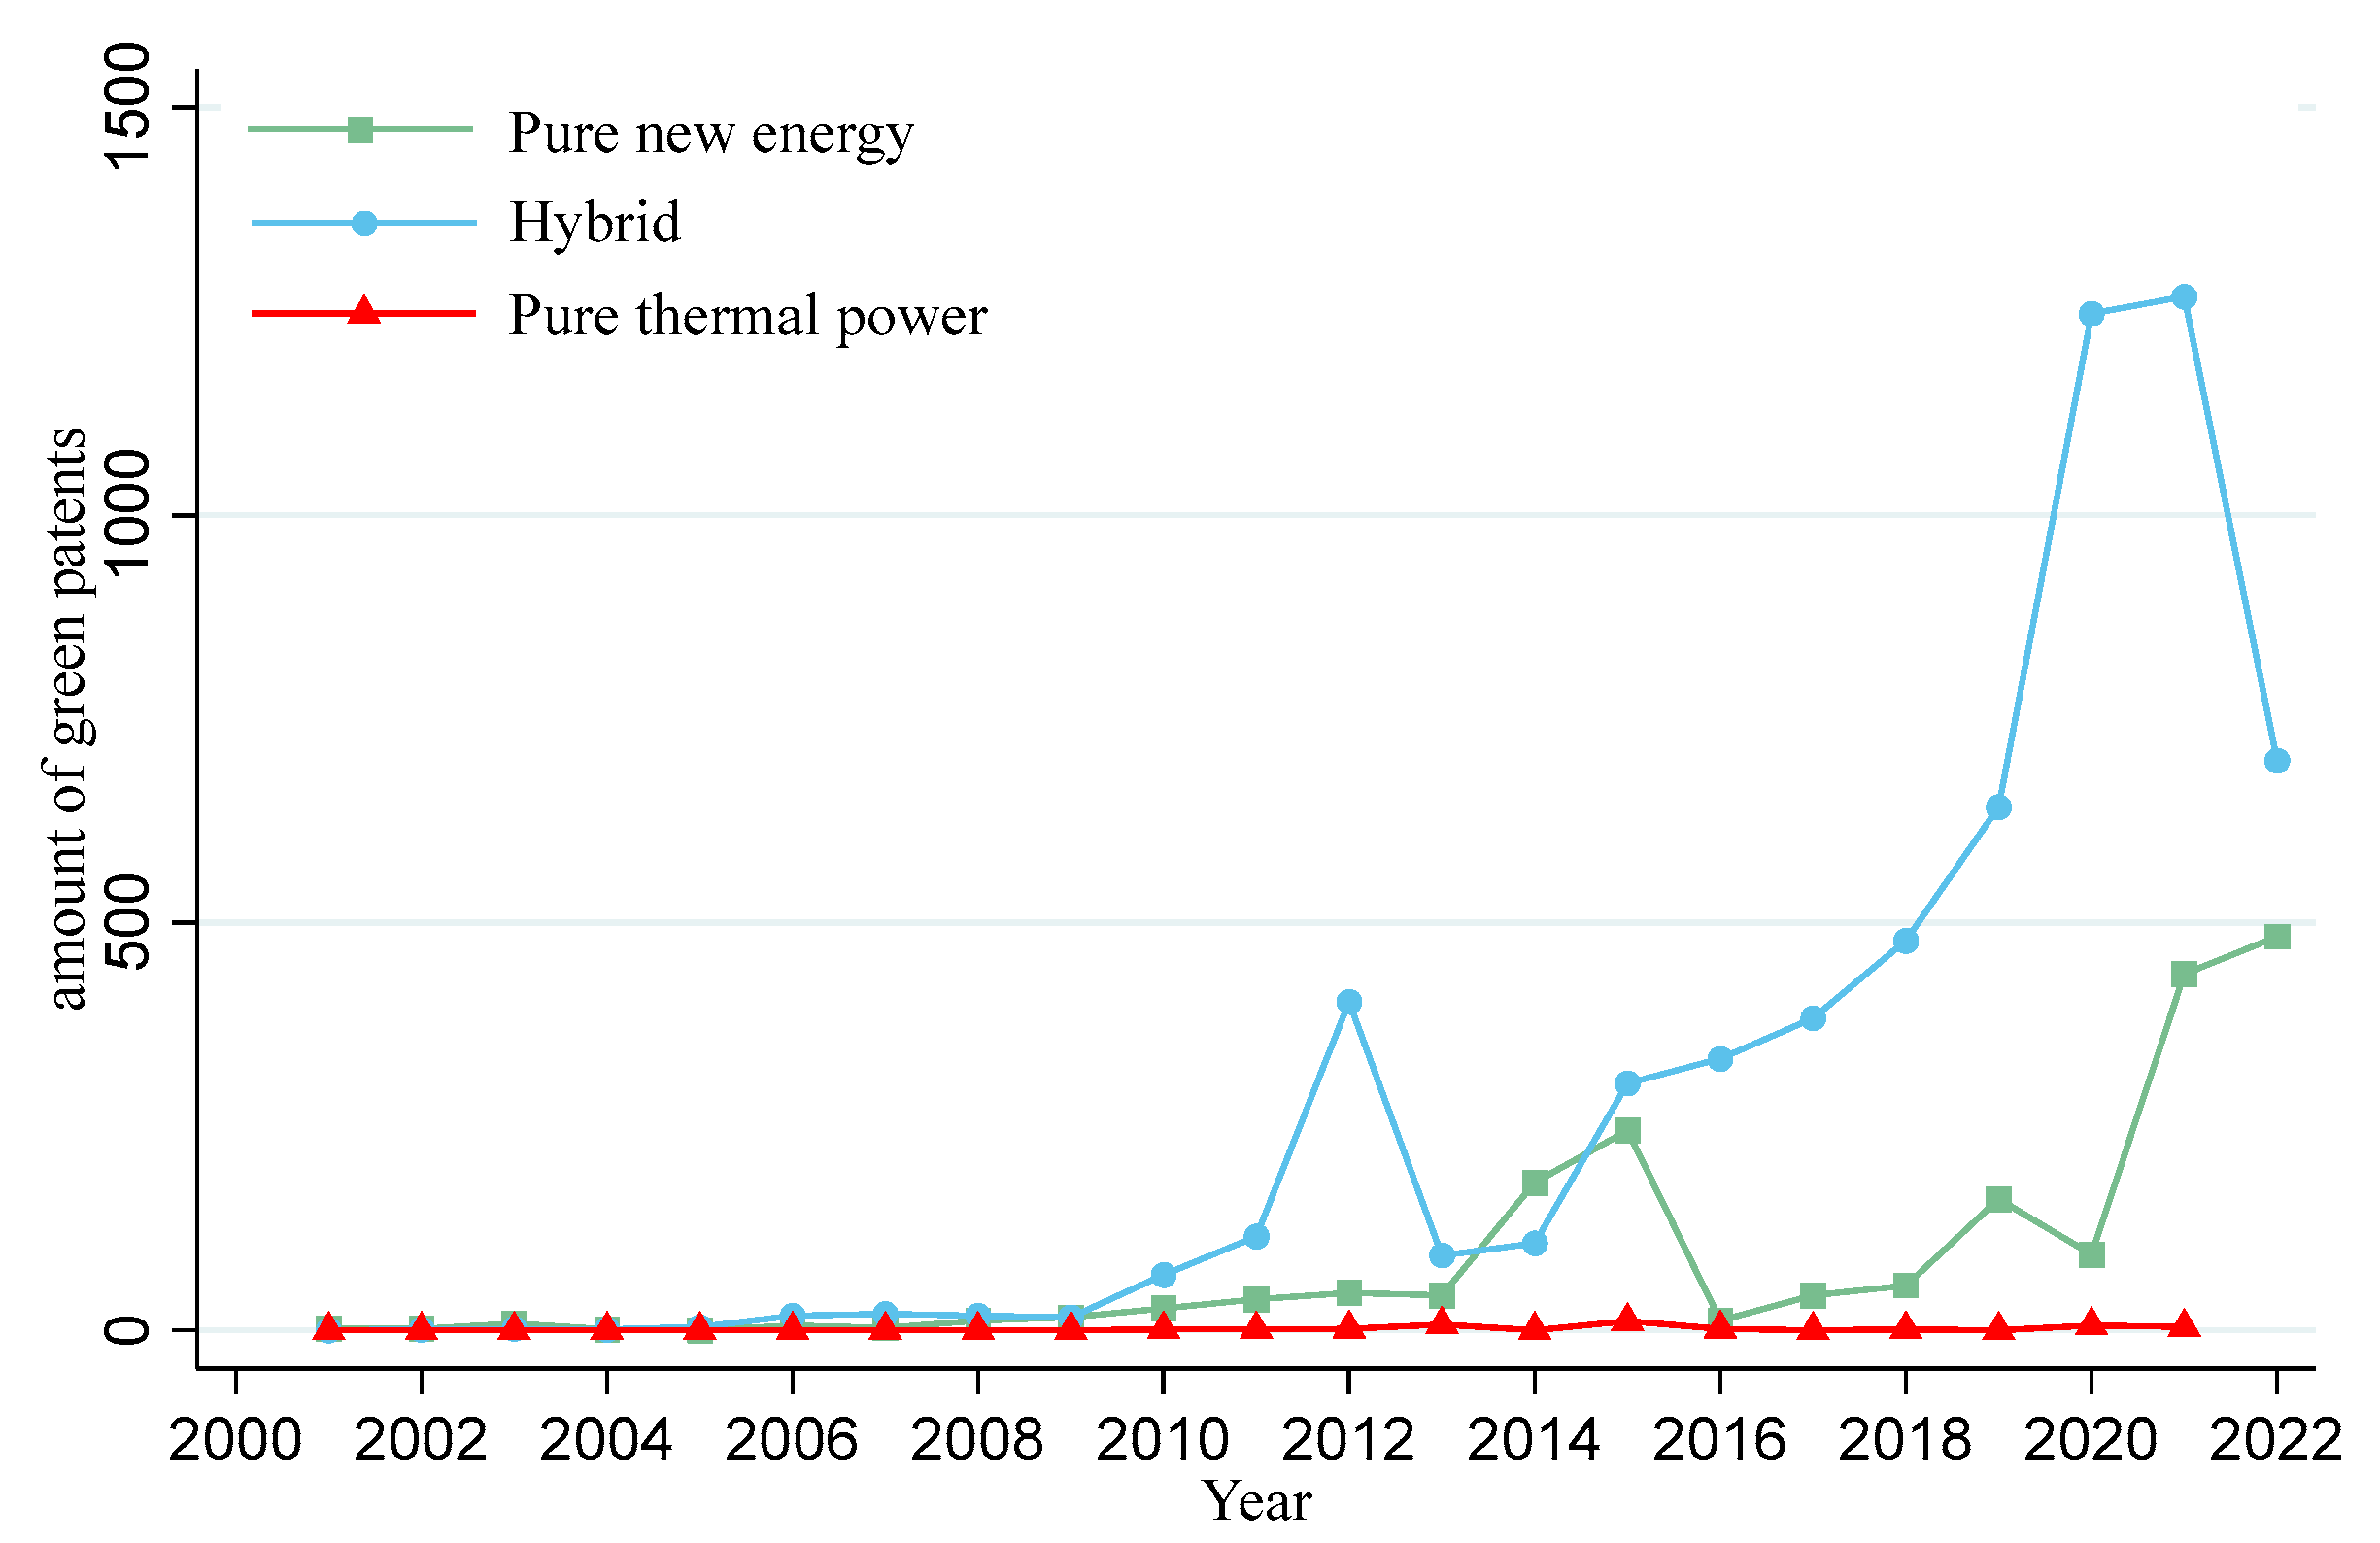
To further figure out whether enterprises with different power generation methods will have different green innovative performances, we collect the power generation structure. We divide the power generation methods into three types: pure thermal power generation, pure new energy and hybrid power generation enterprises. Among them, new energy power generation includes photovoltaic, wind power, hydropower, wind and solar power generation, biomass power generation, etc. Figure 8 displays the respective proportions of three different power generation methods among all power generation companies from 2001 to 2022. Our results indicate a declining trend in the share of both pure thermal and pure new energy power enterprises, while the proportion of hybrid energy enterprises has been increasing annually. It reflects the transformation of the generation structure in power enterprises. Figure 9 illustrates the distribution of green patents in the power enterprises with different power generation methods. The result shows that the increased proportion of green patents is mainly in the enterprises with hybrid power generation and pure new energy. For power enterprises that use pure thermal power generation, they are not active in innovation activities.

6. Conclusions and Policy Implications

6.1. Conclusions

Our study demonstrates an increased causal impact of the national ETS on the sustainable technology progress in power enterprises. We use the firm-level data from 2015 to 2022 through DID to assess the causal impact of the national ETS. This study employs green patents and total factor productivity as measures for sustainable technology progress. Additionally, we explore the mechanism and heterogeneity of the impact. The primary conclusions can be summarized as follows:
Firstly, the growth rate of green patent applications and production efficiency are increased after the national ETS compared to other high-carbon-emitting industries. Moreover, the TFP of these enterprises has also increased, indicating that the production efficiency of power companies has indeed improved. By exploring the mechanism, the positive causal effect is mainly achieved through R&D expenditure.
Secondly, heterogeneity analysis reveals that the national ETS exerts a more significant positive effect on power generation enterprises that are non-state-owned, have smaller asset scale, demonstrate superior environmental performance, and are located in eastern region. However, in the heterogeneity discussion of TFP among different enterprises, there is no significant difference.
Thirdly, we also find that the national ETS has contributed to the green transformation of power industry. The proportion of pure thermal power generation enterprises in the total number of power industry is decreasing, and the main green patent applications are concentrated in pure new energy and hybrid power generation enterprises.

6.2. Policy Implications

First, policymakers should steadily expand the national ETS to other high-carbon-emitting industries. Our findings demonstrate that the national unified market in the power sector has effectively stimulated green innovation and enhanced productivity efficiency. A unified carbon market may reduce corporate speculation, break down regional protectionism and market barriers, optimize resource allocation, stimulate market competition, and promote innovation and technology adoption. Therefore, promoting the monitoring of carbon emissions in other industries and expanding the nationwide unified carbon market to other sectors will promote both emission reduction and sustainable development. In addition, given the important role of environmental performance, policymakers should improve the transparency of environmental information disclosure.
Second, it is essential to increase targeted R&D support for highly responsive enterprises. Our results find that the positive effect of the national ETS on sustainable technology progress is mainly achieved through R&D expenditure. Moreover, the effect of the national ETS is stronger among enterprises that are non-state-owned, have smaller asset scale, demonstrate superior environmental performance, and are located in eastern region. Therefore, offering tailored R&D subsidies, tax benefits, or green credit will strengthen this mechanism.
Third, policymakers should adopt differential compliance mechanisms to address regional and structural disparities. Given that the impacts of the ETS vary significantly across firm types, while TFP responses remain relatively uniform, it is essential to implement more flexible carbon quota allocation methods and promote interregional technical collaboration. Such measures would provide targeted support to economically disadvantaged firms in less-developed regions, enhancing both equity and effectiveness in the transition to a low-carbon economy.
Fourth, policymakers should coordinate energy policy with ETS to accelerate thermal power transition to renewable energy power. With the patents’ applicant shifting from pure thermal power to new energy enterprises, the policymakers should tighten emission caps, complemented by targeted support for renewable integration, energy storage, and carbon capture, utilization, and storage (CCUS) technologies, which can facilitate a structured and gradual phase-out of pure thermal power generation.

7. Limitations and Future Research Directions

This study still has some limitations, which also present opportunities for future research.
First, since the emerging green technologies, such as carbon capture and storage in certain fields and microbial fuel cells are not covered in the Green List published by WIPO, directly using this classification of the green technology may omit some impacts of the national ETS. Future studies can extend beyond the WIPO Green List by incorporating additional sources as CCUS or microbial energy patent databases. In addition, we could also employ text mining and machine learning methods to identify emerging green technologies that are not yet classified in existing frameworks.
Second, due to the limited availability of data, we are only able to obtain the average carbon trading price for each region rather than transaction-level records. Therefore, we may overlook the potential impact of carbon prices on the technology innovation of power enterprises. Therefore, more detailed carbon pricing data should also be collected to better assess its marginal impact on innovation.
Furthermore, given that the CCUS technology may also generate new waste, which can put pressure on the environment and lead to new solid waste problems, the environmental side effects of end-of-pipe treatment are also worth discussing.

Author Contributions

Conceptualization, J.X. and F.R.; methodology, J.X. and F.R.; data curation, J.X. and F.R.; software, J.X. and F.R.; validation, J.X., F.R. and Q.P.; writing—original draft preparation, J.X. and F.R.; writing—review and editing, J.X., F.R. and Q.P.; supervision, J.X., F.R. and Q.P.; project administration, Q.P. All authors have read and agreed to the published version of the manuscript.

Funding

This research was supported by the Humanities and Social Science Research General Project of the Ministry of Education of China (No. 22YJAZH086).

Institutional Review Board Statement

Not applicable.

Informed Consent Statement

Not applicable.

Data Availability Statement

The data in this study are available upon request from the corresponding author.

Acknowledgments

The authors would like to thank all the reviewers for their expertise and valuable input.

Conflicts of Interest

The authors declare no conflicts of interest.

References

  1. Wang, J.; Zhong, K. The causal effect of carbon emission trading scheme on green TFP: Evidence from the Chinese transportation industry. Sustain. Manuf. Serv. Econ. 2024, 3, 100025. [Google Scholar] [CrossRef]
  2. Feng, T.; Sun, L.; Zhang, Y. The relationship between energy consumption structure, economic structure and energy intensity in China. Energy Policy 2009, 37, 5475–5483. [Google Scholar] [CrossRef]
  3. Xu, X.; Huang, S.; An, H. Identification and causal analysis of the influence channels of financial development on CO2 emissions. Energy Policy 2021, 153, 112277. [Google Scholar] [CrossRef]
  4. Sun, Y.; Mao, X.; Yin, X.; Liu, G.; Zhang, J.; Zhao, Y. Optimizing carbon tax rates and revenue recycling schemes: Model development, and a case study for the Bohai Bay area. China. J. Clean. Prod. 2021, 296, 126519. [Google Scholar] [CrossRef]
  5. Wang, H.; Li, L.; Sun, J.; Shen, M. Carbon emissions abatement with duopoly generators and eco-conscious consumers: Carbon tax vs carbon allowance. Econ. Anal. Policy 2023, 80, 786–804. [Google Scholar] [CrossRef]
  6. Fang, X.; He, W.; Wen, F.; An, M.; Song, M.; Wang, B.; Ramsey, T.S. Simulation study on the effect of differentiated carbon tax adjustment on CO2 emissions reduction in China from the perspective of carbon footprint. J. Clean. Prod. 2024, 434, 140071. [Google Scholar]
  7. Cai, J.; Zhu, M.; Wu, J.; Chen, X.; Xu, J.; Shen, Z.Y. Evaluating the impact of new energy vehicle subsidies on urban carbon emissions: Evidence from 261 Chinese cities. Renew. Energy 2025, 240, 122261. [Google Scholar] [CrossRef]
  8. Zhou, C.; Li, X.; Liu, R.; Liu, Y. Do subsidies always incentivize firms to reduce carbon emissions? Evidence from listed companies in China. Environ. Dev. Sustain. 2025, 1–23. [Google Scholar] [CrossRef]
  9. Caparrós, A.; Péreau, J.C.; Tazdaït, T. Emission trading and international competition: The impact of labor market rigidity on technology adoption and output. Energy Policy 2013, 55, 36–43. [Google Scholar] [CrossRef]
  10. Qi, S.; Lin, Y.; Cui, J. Can the environmental rights trading market induce green innovation-Evidence based on green patent data of listed companies in China. Econ. Res. 2018, 53, 129–143. (In Chinese) [Google Scholar]
  11. Wang, S.; Yang, D. Policy Experimentation in China: The Political Economy of Policy Learning. J. Political Econ. 2025, 133, 2180–2228. [Google Scholar] [CrossRef]
  12. Martin, R.; Muûls, M.; Wagner, U.J. The impact of the European Union emissions trading scheme on regulated firms: What is the evidence after ten years? Rev. Environ. Econ. Policy 2016, 10, 129–148. [Google Scholar] [CrossRef]
  13. Moore, N.A.D.; Grosskurth, P.; Themann, M. Multinational corporations and the EU Emissions Trading System: The specter of asset erosion and creeping deindustrialization. J. Environ. Econ. Manag. 2018, 94, 1–26. [Google Scholar]
  14. Löschel, A.; Lutz, B.J.; Managi, S. The impacts of the EU ETS on efficiency and economic performance—An empirical analysis for German manufacturing firms. Resour. Energy Econ. 2019, 56, 71–95. [Google Scholar] [CrossRef]
  15. Marin, G.; Marino, M.; Pellegrin, C. The impact of the European Emission Trading Scheme on multiple measures of economic performance. Environ. Resour. Econ. 2018, 71, 551–582. [Google Scholar] [CrossRef]
  16. Hu, J.; Huang, N.; Shen, H. Can market incentive based environmental regulation promote technological innovation in enterprises-Natural Experiment Based on China’s Carbon Emission Trading Mechanism. Financ. Res. 2020, 1, 171–189. (In Chinese) [Google Scholar]
  17. Shi, B.; Li, N.; Gao, Q.; Li, G. Market incentives, carbon quota allocation and carbon emission reduction: Evidence from China’s carbon trading pilot policy. J. Environ. Manag. 2022, 319, 115650. [Google Scholar] [CrossRef]
  18. Zhang, Y.; Peng, Y.L.; Ma, C.Q.; Shen, B. Can environmental innovation facilitate carbon emissions reduction? Evidence from China. Energy Policy 2017, 100, 18–28. [Google Scholar] [CrossRef]
  19. Zhou, B.; Zhang, C.; Song, H.Y.; Wang, Q.W. How Does Emission Trading Reduce China’s Carbon Intensity? An Exploration Using a Decomposition and Difference-in-Differences Approach. Sci. Total Environ. 2019, 676, 514–523. [Google Scholar] [CrossRef]
  20. Miao, C.; Fang, D.; Sun, L.; Luo, Q. Natural resources utilization efficiency under the influence of green technological innovation. Resour. Conserv. Recycl. 2017, 126, 153–161. [Google Scholar] [CrossRef]
  21. Yang, L.; Li, Y.; Liu, H. Did carbon trade improve green production performance? Evidence from China. Energy Econ. 2021, 96, 105185. [Google Scholar] [CrossRef]
  22. Zhang, Y.J.; Wang, W. How does China’s carbon emissions trading (CET) policy affect the investment of CET-covered enterprises? Energy Econ. 2021, 98, 105224. [Google Scholar] [CrossRef]
  23. Albrizio, S.; Kozluk, T.; Zipperer, V. Environmental policies and productivity growth: Evidence across industries and firms. J. Environ. Econ. Manag. 2017, 81, 209–226. [Google Scholar] [CrossRef]
  24. Chen, Z.; Zhang, X.; Chen, F. Do carbon emission trading schemes stimulate green innovation in enterprises? Evidence from China. Technol. Forecast. Soc. Change 2021, 168, 120744. [Google Scholar] [CrossRef]
  25. Hu, J.; Pan, X.; Huang, Q. Quantity or quality? The impacts of environmental regulation on firms’ innovation-Quasi-natural experiment based on China’s carbon emissions trading pilot. Technol. Forecast. Soc. Change 2020, 158, 120122. [Google Scholar] [CrossRef]
  26. Hu, Y.; Ren, S.; Wang, Y.; Chen, X. Can carbon emission trading scheme achieve energy conservation and emission reduction? Evidence from the industrial sector in China. Energy Econ. 2020, 85, 104590. [Google Scholar] [CrossRef]
  27. Sovacool, B.; Newell, P.; Carley, S.; Fanzo, J. Equity, technological innovation and sustainable behaviour in a low-carbon future. Nat. Hum. Behav. 2022, 6, 326–337. [Google Scholar] [CrossRef] [PubMed]
  28. Yao, S.; Yu, X.; Yan, S.; Wen, S. Heterogeneous emission trading schemes and green innovation. Energy Policy 2021, 155, 112367. [Google Scholar] [CrossRef]
  29. Chang, K.; Pei, P.; Zhang, C.; Wu, X. Exploring the price dynamics of CO2 emissions allowances in China’s emissions trading scheme pilots. Energy Econ. 2017, 67, 213–223. [Google Scholar] [CrossRef]
  30. Zhang, D.Y.; Kong, Q.X.; Wang, Y.Z.; Vigne, S.A. Exquisite workmanship through net-zero emissions? The effects of carbon emission trading policy on firms’ export product quality. Energy Econ. 2023, 123, 106701. [Google Scholar] [CrossRef]
  31. Li, C.; Qi, Y.; Liu, S.; Wang, X. Do carbon ETS pilots improve cities’ green total factor productivity? Evidence from a quasi-natural experiment in China. Energy Econ. 2022, 108, 105931. [Google Scholar]
  32. Chen, R.; Howley, P.; Kesidou, E. The impact of ETS on productivity in developing economies: A micro-econometric evaluation with Chinese firm-level data. Energy Econ. 2024, 131, 107376. [Google Scholar] [CrossRef]
  33. Gupta, S.; Goldar, B. Do stock markets penalize environment-unfriendly behavior? Evidence from India. Ecol. Econ. 2005, 52, 81–95. [Google Scholar] [CrossRef]
  34. Wood, D.J. Corporate Social Performance Revisited. Acad. Manag. Rev. 1991, 16, 691–718. [Google Scholar] [CrossRef]
  35. Zhang, K.; Li, W. Understanding the puzzle of polluting companies’ social responsibility. China Econ. Rev. 2024, 84, 102128. [Google Scholar] [CrossRef]
  36. Xie, R.H.; Yuan, Y.J.; Huang, J.J. Different types of environmental regulations and heterogeneous influence on “green” productivity: Evidence from China. Ecol. Econ. 2017, 132, 104–112. [Google Scholar] [CrossRef]
  37. An, C.; Tang, Y. Research on decision model of enterprise carbon reduction under emission trading mechanism. Econ. Res. 2012, 47, 45–58. (In Chinese) [Google Scholar]
  38. Tietenberg, T.; Lewis, L. Environmental and Natural Resource Economics, 12th ed.; Routledge: New York, NY, USA, 2023; pp. 41–72. [Google Scholar]
  39. Montgomery, W.D. Markets in licenses and efficient pollution control programs. J. Econ. Theory 1972, 5, 395–418. [Google Scholar] [CrossRef]
  40. Ye, X.S.; Liu, J. Heterogeneity in Research and Development, Government Support, and China’s Technological Innovation Dilemma. Econ. Res. 2018, 53, 116–132. (In Chinese) [Google Scholar]
  41. Zhao, X.; Yin, H.; Zhao, Y. Impact of environmental regulations on the efficiency and CO2 emissions of power plants in China. Appl. Energy 2015, 149, 238–247. [Google Scholar] [CrossRef]
  42. Coase, R.H. The Problem of Social Cost. J. Law Econ. 1990, 3, 1–44. [Google Scholar] [CrossRef]
  43. Dales, J.H. Pollution, Property & Prices: An Essay in Policy-Making and Economics; University of Toronto Press: Toronto, ON, Canada, 1968. [Google Scholar]
  44. Seifert, J.; Uhrig-Homburg, M.; Wagner, M. Dynamic Behavior of CO2 Spot Prices- Theory and Empirical Evidence. J. Environ. Econ. Manag. 2008, 56, 180–194. [Google Scholar] [CrossRef]
  45. Wang, C.; Ye, M.; Cai, W.; Chen, J. The value of a clear, long-term climate policy agenda: A case study of China’s power sector using a multi-region optimization model. Appl. Energy 2014, 125, 276–288. [Google Scholar] [CrossRef]
  46. Lanoie, P.; Laplante, B.; Roy, M. Can capital markets create incentives for pollution control? Ecol. Econ. 1998, 26, 31–41. [Google Scholar] [CrossRef]
  47. Dias, A.S.; Carneiro, P.A.; Boloy, R.; César, A.; Oliveira, U. Advancements in vinasse application: An integrated analysis of patents, literature and research profile. Clean. Eng. Technol. 2024, 22, 100795. [Google Scholar] [CrossRef]
  48. Zhang, Y.; Wang, L.; He, T. Can IP tribunals increase firm patent applications? Empirical evidence from China. China Econ. Rev. 2024, 87, 102240. [Google Scholar] [CrossRef]
  49. Lin, B.; Zhu, J. Determinants of renewable energy technological innovation in China under CO2 emissions constraint. J. Environ. Manag. 2019, 247, 662–671. [Google Scholar] [CrossRef]
  50. Long, Y.; Liu, L.; Yang, B. Different types of environmental concerns and heterogeneous influence on green total factor productivity: Evidence from Chinese provincial data. J. Clean. Prod. 2023, 428, 139295. [Google Scholar] [CrossRef]
  51. Persson, T.; Svensson, L.E.O. Why a stubborn conservative would run a deficit: Policy with time-inconsistent preferences. Q. J. Econ. 1989, 104, 325. [Google Scholar] [CrossRef]
  52. Olley, S.; Pakes, A. The Dynamics of Productivity in The Telecommunications Equipment Industry. Econometrica 1996, 64, 1263–1297. [Google Scholar] [CrossRef]
  53. Lee, J. Government interventions and productivity growth. J. Econ. Growth 1996, 1, 391–414. [Google Scholar] [CrossRef]
  54. Zhang, C.; Yao, Y.; Zhou, H. External technology dependence and manufacturing TFP: Evidence from China. Res. Int. Bus. Financ. 2023, 64, 101885. [Google Scholar] [CrossRef]
  55. Choi, Y.; Tang, Z.; Ma, Y. Lessons from the Pilot Project of Korean ETS on the Local Landscape of Economy. Land 2024, 13, 1603. [Google Scholar] [CrossRef]
  56. Xia, F.; Xu, J. Green total factor productivity: A re-examination of quality of growth for provinces in China. China Econ. Rev. 2020, 62, 101454. [Google Scholar] [CrossRef]
  57. Yu, F.; Zheng, S.; Zheng, S.; Guo, C. Does carbon ETS affect the distribution of labor’s slice of the factor income pie? From the low carbon transition perspective. Energy Econ. 2024, 134, 107569. [Google Scholar] [CrossRef]
  58. Yan, Z.; Du, K.; Yang, Z.; Deng, M. Convergence or divergence? Understanding the global development trend of low-carbon technologies. Energy Policy 2017, 109, 499–509. [Google Scholar] [CrossRef]
  59. Wang, J.; Xia, W. Public attention and investment efficiency: Incentive effect or deterrent effect? Analysis on heterogeneous bilateral stochastic frontier model. Technol. Forecast. Soc. Chang. 2022, 185, 122043. [Google Scholar] [CrossRef]
  60. Chai, S.; Yang, X.; Zhang, Z.; Abedin, M.; Lucey, B. Regional imbalances of market efficiency in China’s pilot emission trading schemes (ETS): A multifractal perspective. Res. Int. Bus. Financ. 2022, 63, 101758. [Google Scholar] [CrossRef]
  61. Ho, K.C.; Yan, C.; Gozgor, G.; Gu, Y. Energy related public environmental concerns and intra-firm pay gap in polluting enterprises: Evidence from China. Energy Econ. 2024, 130, 107320. [Google Scholar] [CrossRef]
  62. Wang, Z.; Sun, H.; Ding, C.X.; Zhang, X. Does public environmental concern cause pollution transfer? Evidence from Chi-nese firms’ off-site investments. J. Clean. Prod. 2024, 466, 142825. [Google Scholar] [CrossRef]
  63. Böhringer, C.; Rosendahl, K.; Storrøsten, H. Robust policies to mitigate carbon leakage. J. Public Econ. 2017, 149, 35–46. [Google Scholar] [CrossRef]
  64. Gao, Y.; Li, M.; Xue, J.; Liu, Y. Evaluation of effectiveness of China’s carbon emissions trading scheme in carbon mitigation. Energy Econ. 2020, 90, 104872. [Google Scholar] [CrossRef]
  65. Coe, T.; Helpman, E. International R&D Spillovers. Eur. Econ. Rev. 1995, 39, 858–887. [Google Scholar] [CrossRef]
  66. Griliches, Z. Productivity, R&D and the Data Constraint. Am. Econ. Rev. 1994, 84, 1–23. [Google Scholar]
  67. Romer, M. Endogenous Technological Change. J. Political Econ. 1990, 98, 71–102. [Google Scholar] [CrossRef]
  68. Link, A.N. An Analysis of the Composition of R&D Spending. South. Econ. J. 1982, 49, 342–349. [Google Scholar] [CrossRef]
  69. Salter, J.; Martin, R. The Economic Benefits of Publicly Funded Basic Research. Res. Policy 2001, 30, 509–532. [Google Scholar] [CrossRef]
  70. Chan, K.C.; Lakonishok, J.; Sougiannis, T. The stock market valuation of research and development expenditure. J. Financ. 2001, 56, 2431–2456. [Google Scholar] [CrossRef]
  71. Alam, M.; Apergis, N.; Paramati, S.; Fang, J. The impacts of R&D investment and stock markets on clean-energy consumption and CO2 emissions in OECD economies. Int. J. Financ. Econ. 2021, 26, 4979–4992. [Google Scholar]
  72. Cai, X.; Li, J.; Wu, J.; Zhang, H.; Chen, P.; Huang, X. The impact of enterprise R&D investment and government subsidies on technological progress: Evidence from China’s PV industry. Energies 2022, 15, 4462. [Google Scholar]
  73. Cardoso, A.; Teixeira, A.C. Returns on R&D Investment: A Comprehensive Survey on Magnitude and Evaluation Methodologies Working Paper; Institute for Systems and Computer Engineering of Porto, Innovation and Technology Transfer Unit: Porto, Portugal, 2009. [Google Scholar]
  74. Chen, X.; Liu, Y. Research and development efficiency, state-owned enterprises, and carbon intensity in China. Sustain. Futures 2024, 8, 100291. [Google Scholar] [CrossRef]
  75. Chen, Y.; Lee, C. Does technological innovation reduce CO2 emissions? Cross-country evidence. J. Clean. Prod. 2020, 263, 121550. [Google Scholar] [CrossRef]
  76. Dunyo, S.; Odei, S.; Chaiwet, W. Relationship between CO2 emissions, technological innovation, and energy intensity: Moderating effects of economic and political uncertainty. J. Clean. Prod. 2024, 440, 140904. [Google Scholar] [CrossRef]
  77. Galetovic, A.; Haber, S.; Levine, R. An Empirical Examination of Patent Holdup. J. Compet. Law Econ. 2015, 11, 549–578. [Google Scholar] [CrossRef]
  78. Hirshleifer, D.; Hsu, P.H.; Li, D. Innovative Originality, Profitability, and Stock Returns. Rev. Financ. Stud. 2018, 31, 2553–2605. [Google Scholar] [CrossRef]
  79. Zhang, Q.; Shah, S.; Yang, L. Modeling the effect of disaggregated renewable energies on ecological footprint in E5 economies: Do economic growth and R&D matter? Apply. Energy 2022, 310, 118522. [Google Scholar]
  80. Ma, T.; Du, Y.M.; Xu, T.; Pang, J. How the thermal power sector affects carbon trading: An empirical study on China’s ETSs. Appl. Econ. 2023, 55, 6739–6758. [Google Scholar] [CrossRef]
  81. Su, K.; Wu, J.; Lu, Y. With trust we innovate: Evidence from corporate R&D expenditure. Technol. Forecast. Soc. Chang. 2022, 182, 121834. [Google Scholar] [CrossRef]
  82. Aboud, A.; Ahmed, D. The Impact of Social, Environmental and Corporate Governance Disclosures on Firm Value. J. Account. Emerg. Econ. 2018, 8, 442–458. [Google Scholar] [CrossRef]
  83. Yang, B.; Park, S. Under the ESG Dome of China. Sustainability 2024, 16, 6983. [Google Scholar] [CrossRef]
  84. Meng, J.; Zhang, Z.X. Corporate environmental information disclosure and investor response: Evidence from China’s capital market. Energy Econ. 2022, 108, 105886. [Google Scholar] [CrossRef]
  85. Rong, Z.; Zhang, F.; Chen, S. Short-term loans and Firms’ high-quality innovation: Evidence from the access to patent-backed loans in China. China Econ. Rev. 2023, 78, 101918. [Google Scholar] [CrossRef]
  86. Xu, X.; Liu, Q. Transformation of innovation in heavily polluting enterprises under resource constraints: The role of green finance policy. Int. Rev. Econ. Financ. 2025, 103, 104524. [Google Scholar] [CrossRef]
  87. Shen, L.; Zhang, W.; Ma, D. ESG practices and financing constraints of Chinese high-carbon enterprises under carbon reduction pressure: The role of credit financing and corporate reputation. Econ. Model. 2025, 152, 107252. [Google Scholar] [CrossRef]
  88. Aghion, P.; Cai, J.; Dewatripont, M.; Du, L.; Harrison, A.; Legros, P. Industrial Policy and Competition. Am. Econ. J. Macroecon. 2015, 7, 1–32. [Google Scholar] [CrossRef]
  89. Heider, A.; Gerken, M.; van Dinther, N.; Hülsbeck, M. Business model innovation through dynamic capabilities in small and medium enterprises—Evidence from the German Mittelstand. J. Bus. Res. 2021, 130, 635–645. [Google Scholar] [CrossRef]
  90. Prud’homme, D. Utility Model Patent Regime Strength and Technological Development: Experiences of China and Other East Asian Latecomers. China Econ. Rev. 2017, 42, 50–73. [Google Scholar] [CrossRef]
Figure 1. Trends in average daily transaction price and total trading volume in pilot areas. Notes: The shaded blue area represents the transition period following the official launch of the national ETS for the power industry in 2017. Data is obtained from the China Emissions Trading Network.
Sustainability 17 08377 g001
Figure 2. The average emission of CO2 in pilot and non-pilot areas. Notes: Data comes from CEADs, the data is updated up to 2019.
Sustainability 17 08377 g002
Figure 3. Research framework. Notes: The “” in the figure represents the core pathway that is the primary focus of this study.
Sustainability 17 08377 g003
Figure 4. Amounts of green patents in the electric power industry.
Sustainability 17 08377 g004
Figure 5. Distribution of enterprises’ ESG ratings. Notes: The frequency represents the number of enterprises in level B. A higher frequency corresponds to a larger volume of enterprises at this level.
Sustainability 17 08377 g005
Figure 6. Parallel trend test of baseline results. (a) Parallel trend test of green patent applications; (b) Parallel trend test of green invention patent applications. (c) Parallel trend test of green utility model patent applications; (d) Parallel trend test of total factor productivity.
Sustainability 17 08377 g006aSustainability 17 08377 g006b
Figure 7. Placebo test of baseline result. (a) Placebo test of green patent applications; (b) Placebo test of green invention patent applications. (c) Placebo test of green utility model patent applications; (d) Placebo test of total factor productivity.
Sustainability 17 08377 g007aSustainability 17 08377 g007b
Figure 8. The generation structure annual change in listed power enterprises. Notes: The data of pure thermal power in 2022 is missing.
Sustainability 17 08377 g008
Figure 9. The distribution of green patents in listed power enterprises with different power generation methods. Notes: The data of pure thermal power in 2022 is missing.
Sustainability 17 08377 g009
Table 1. Data summary.
VariableDefinitionObsMeanStdMinMax
GPTotal green patents14092.4341.7310.0007.536
GP_inGreen invention patents14090.6961.1220.0005.521
GP_umGreen utility models patents14092.3391.7200.0007.441
TFP_OPTFP calculated by OP 13006.9820.8654.3509.34
TFP_GMMTFP calculated by GMM 13008.5791.0805.10011.73
SizeTotal assets138922.6631.66816.65028.636
LevAsset liability ratio13890.4600.7860.01328.548
ROAAsset liability ratio13890.0410.104−2.2450.953
ListAgeAsset liability ratio13892.2740.9370.0003.434
R&D_expendR&D expenditure125018.1641.7730.00024.081
ScaleDummy13890.5480.4980.0001.000
SOEDummy13890.3930.4890.0001.000
ESGDummy13890.2900.4540.0001.000
RegionDummy13890.7700.4210.0001.000
Table 2. The impact of the national ETS on the power industry.
Variablesln (GP)ln (GP_in)ln (GP_um)TFP_OP
(1)(2)(3)(4)
T r e a t × P o s t 0.330 ***0.425 ***0.287 ***0.113 **
(0.085)(0.087)(0.073)(0.053)
Constant−12.799 ***−9.480 ***−12.181 ***−1.992 ***
(0.725)(0.961)(0.747)(0.385)
ControlsYesYesYesYes
Firm FEYesYesYesYes
Year FEYesYesYesYes
Observations1381138113811270
R-squared0.5040.5620.4850.716
Notes: Cluster standard errors at the firm level are reported in parentheses. Asterisks *** and ** mean the significance levels are 1% and 5%, respectively.
Table 3. Robustness check.
Variablesln (L.GP)ln (L.GP_in)ln (L.GP_um)TFP_GMM
(1)(2)(3)(4)
T r e a t × P o s t 0.341 **0.494 ***0.297 **0.119 **
(0.121)(0.103)(0.105)(0.052)
Constant3.733 ***1.071 **3.567 ***−1.186 **
(0.650)(0.431)(0.665)(0.434)
ControlsYesYesYesNo
Firm FEYesYesYesYes
Year FEYesYesYesYes
Observations1380138013801285
R20.2260.2700.2320.606
Notes: Cluster standard errors at the firm level are reported in parentheses. Asterisks *** and ** mean the significance levels are 1% and 5%, respectively.
Table 4. Mechanism analysis of the national ETS on power enterprises.
Variablesln (R&D_expand)
T r e a t × P o s t 0.573 ***
(0.038)
Constant0.923
(1.567)
ControlsYes
Firm FEYes
Year FEYes
Observations1249
R-squared0.528
Notes: Cluster standard errors at the firm level are reported in parentheses. Asterisk *** means the significance level is 1%.
Table 5. Heterogeneity impact of enterprise ownership.
Variablesln (GP)ln (GP_in)ln (GP_um)TFP_OP
(1)(2)(3)(4)
T r e a t × P o s t × S O E 0.2440.2260.2730.037
(0.288)(0.158)(0.310)(0.063)
T r e a t × P o s t 0.1710.284 ***0.1060.080
(0.178)(0.076)(0.205)(0.097)
SOE0.1110.2860.0750.075
(0.345)(0.172)(0.345)(0.064)
Constant−12.315 ***−8.603 ***−11.763 ***−1.928 ***
(0.988)(0.896)(0.838)(0.464)
ControlsYesYesYesNo
Firm FEYesYesYesYes
Year FEYesYesYesYes
Observations1387138713871292
R20.5040.5710.4850.717
Notes: If the enterprise is state-owned, the SOE is equal to 1; otherwise, it is set to 0. Cluster standard errors at the firm level are reported in parentheses. Asterisk *** means the significance level is 1%.
Table 6. Heterogeneity impact of enterprise scale.
Variablesln (GP)ln (GP_in)ln (GP_um)TFP_OP
(1)(2)(3)(4)
T r e a t × P o s t × S c a l e −0.483 ***0.059−0.470 ***−0.008
(0.125)(0.109)(0.121)(0.064)
T r e a t × P o s t 0.703 ***0.341 **0.648 ***0.105
(0.147)(0.130)(0.114)(0.104)
Scale−0.145−0.411 **−0.154−0.001
(0.226)(0.151)(0.224)(0.088)
Constant−13.742 ***−11.234 ***−13.153 ***−2.120 ***
(1.456)(1.246)(1.571)(0.521)
ControlsYesYesYesYes
Firm FEYesYesYesYes
Year FEYesYesYesYes
Observations1387138713871292
R20.5050.5740.4860.716
Notes: If the enterprise is a large enterprise with over 400 million, the scale is equal to 1; otherwise, it is set to 0. Cluster standard errors at the firm level are reported in parentheses. Asterisks *** and ** mean the significance levels are 1% and 5%, respectively.
Table 7. Heterogeneity impact of enterprise environmental performance.
Variablesln (GP)ln (GP_in)ln (GP_um)TFP_OP
(1)(2)(3)(4)
T r e a t × P o s t × E S G 0.757 ***0.430 ***0.736 ***0.086
(0.123)(0.075)(0.123)(0.090)
T r e a t × P o s t −0.0030.250 ***−0.0360.088
(0.094)(0.075)(0.091)(0.096)
ESG−0.286 *0.012−0.278 *0.134
(0.149)(0.073)(0.152)(0.105)
Constant−13.043 ***−9.162 ***−12.419 ***−1.643 ***
(0.804)(0.868)(0.801)(0.422)
ControlsYesYesYesYes
Firm FEYesYesYesYes
Year FEYesYesYesYes
Observations1387138713871283
R20.5090.5640.4900.718
Notes: If an enterprise is rated B or above in Huazheng’s ESG rating system, ESG dummy equals 1, otherwise, it is set to 0. Cluster standard errors at the firm level are reported in parentheses. Asterisks *** and * mean the significance levels are 1% and 10%, respectively.
Table 8. Heterogeneity impact of different regions.
Variablesln (GP)ln (GP_in)ln (GP_um)TFP_OP
(1)(2)(3)(4)
T r e a t × P o s t × R e g i o n 0.537 **0.276 *0.528 **0.090
(0.232)(0.153)(0.223)(0.061)
T r e a t × P o s t −0.0640.239 ***−0.1000.052
(0.156)(0.079)(0.165)(0.091)
Region0.0390.0900.0750.081
(0.246)(0.147)(0.242)(0.071)
Constant−12.603 ***−9.581 ***−11.987 ***−1.758 ***
(0.761)(0.942)(0.889)(0.441)
ControlsYesYesYesYes
Firm FEYesYesYesYes
Year FEYesYesYesYes
Observations1387138713871283
R20.5120.5740.4940.712
Notes: If a power enterprise belongs to the eastern region, we set the region dummy to 1, otherwise we set it to 0. Cluster standard errors at the firm level are reported in parentheses. Asterisks ***, ** and * mean the significance levels are 1%, 5% and 10%, respectively.
Disclaimer/Publisher’s Note: The statements, opinions and data contained in all publications are solely those of the individual author(s) and contributor(s) and not of MDPI and/or the editor(s). MDPI and/or the editor(s) disclaim responsibility for any injury to people or property resulting from any ideas, methods, instructions or products referred to in the content.