An Example of Vulnerability Analysis According to Disasters: Neighborhoods in the Southern Region of Izmir
Abstract
1. Introduction
- Disasters affect all individuals in society; however, they have much more devastating effects on vulnerable groups such as children, the elderly, women, and people with disabilities.
- The difficulties caused by conditions specific to rural areas and other challenges faced by disadvantaged groups make these individuals more vulnerable to disaster risks compared to those living in urban areas.
- The socio-economic and spatial characteristics of rural settlements play a significant role in determining resilience levels.
- Physical and structural factors (such as high-density construction, infrastructure deficiencies, and the impacts of building quality) influence vulnerability levels.
2. Methodology
3. Vulnerability Analyses at Neighborhood Scale
3.1. Social and Economic Vulnerability Analyses
3.2. Vulnerability Analyses by Disasters at Neighborhood Scale
4. Social, Economic, Natural, and Artificial Vulnerability Levels by Districts
5. Evaluation and Conclusions
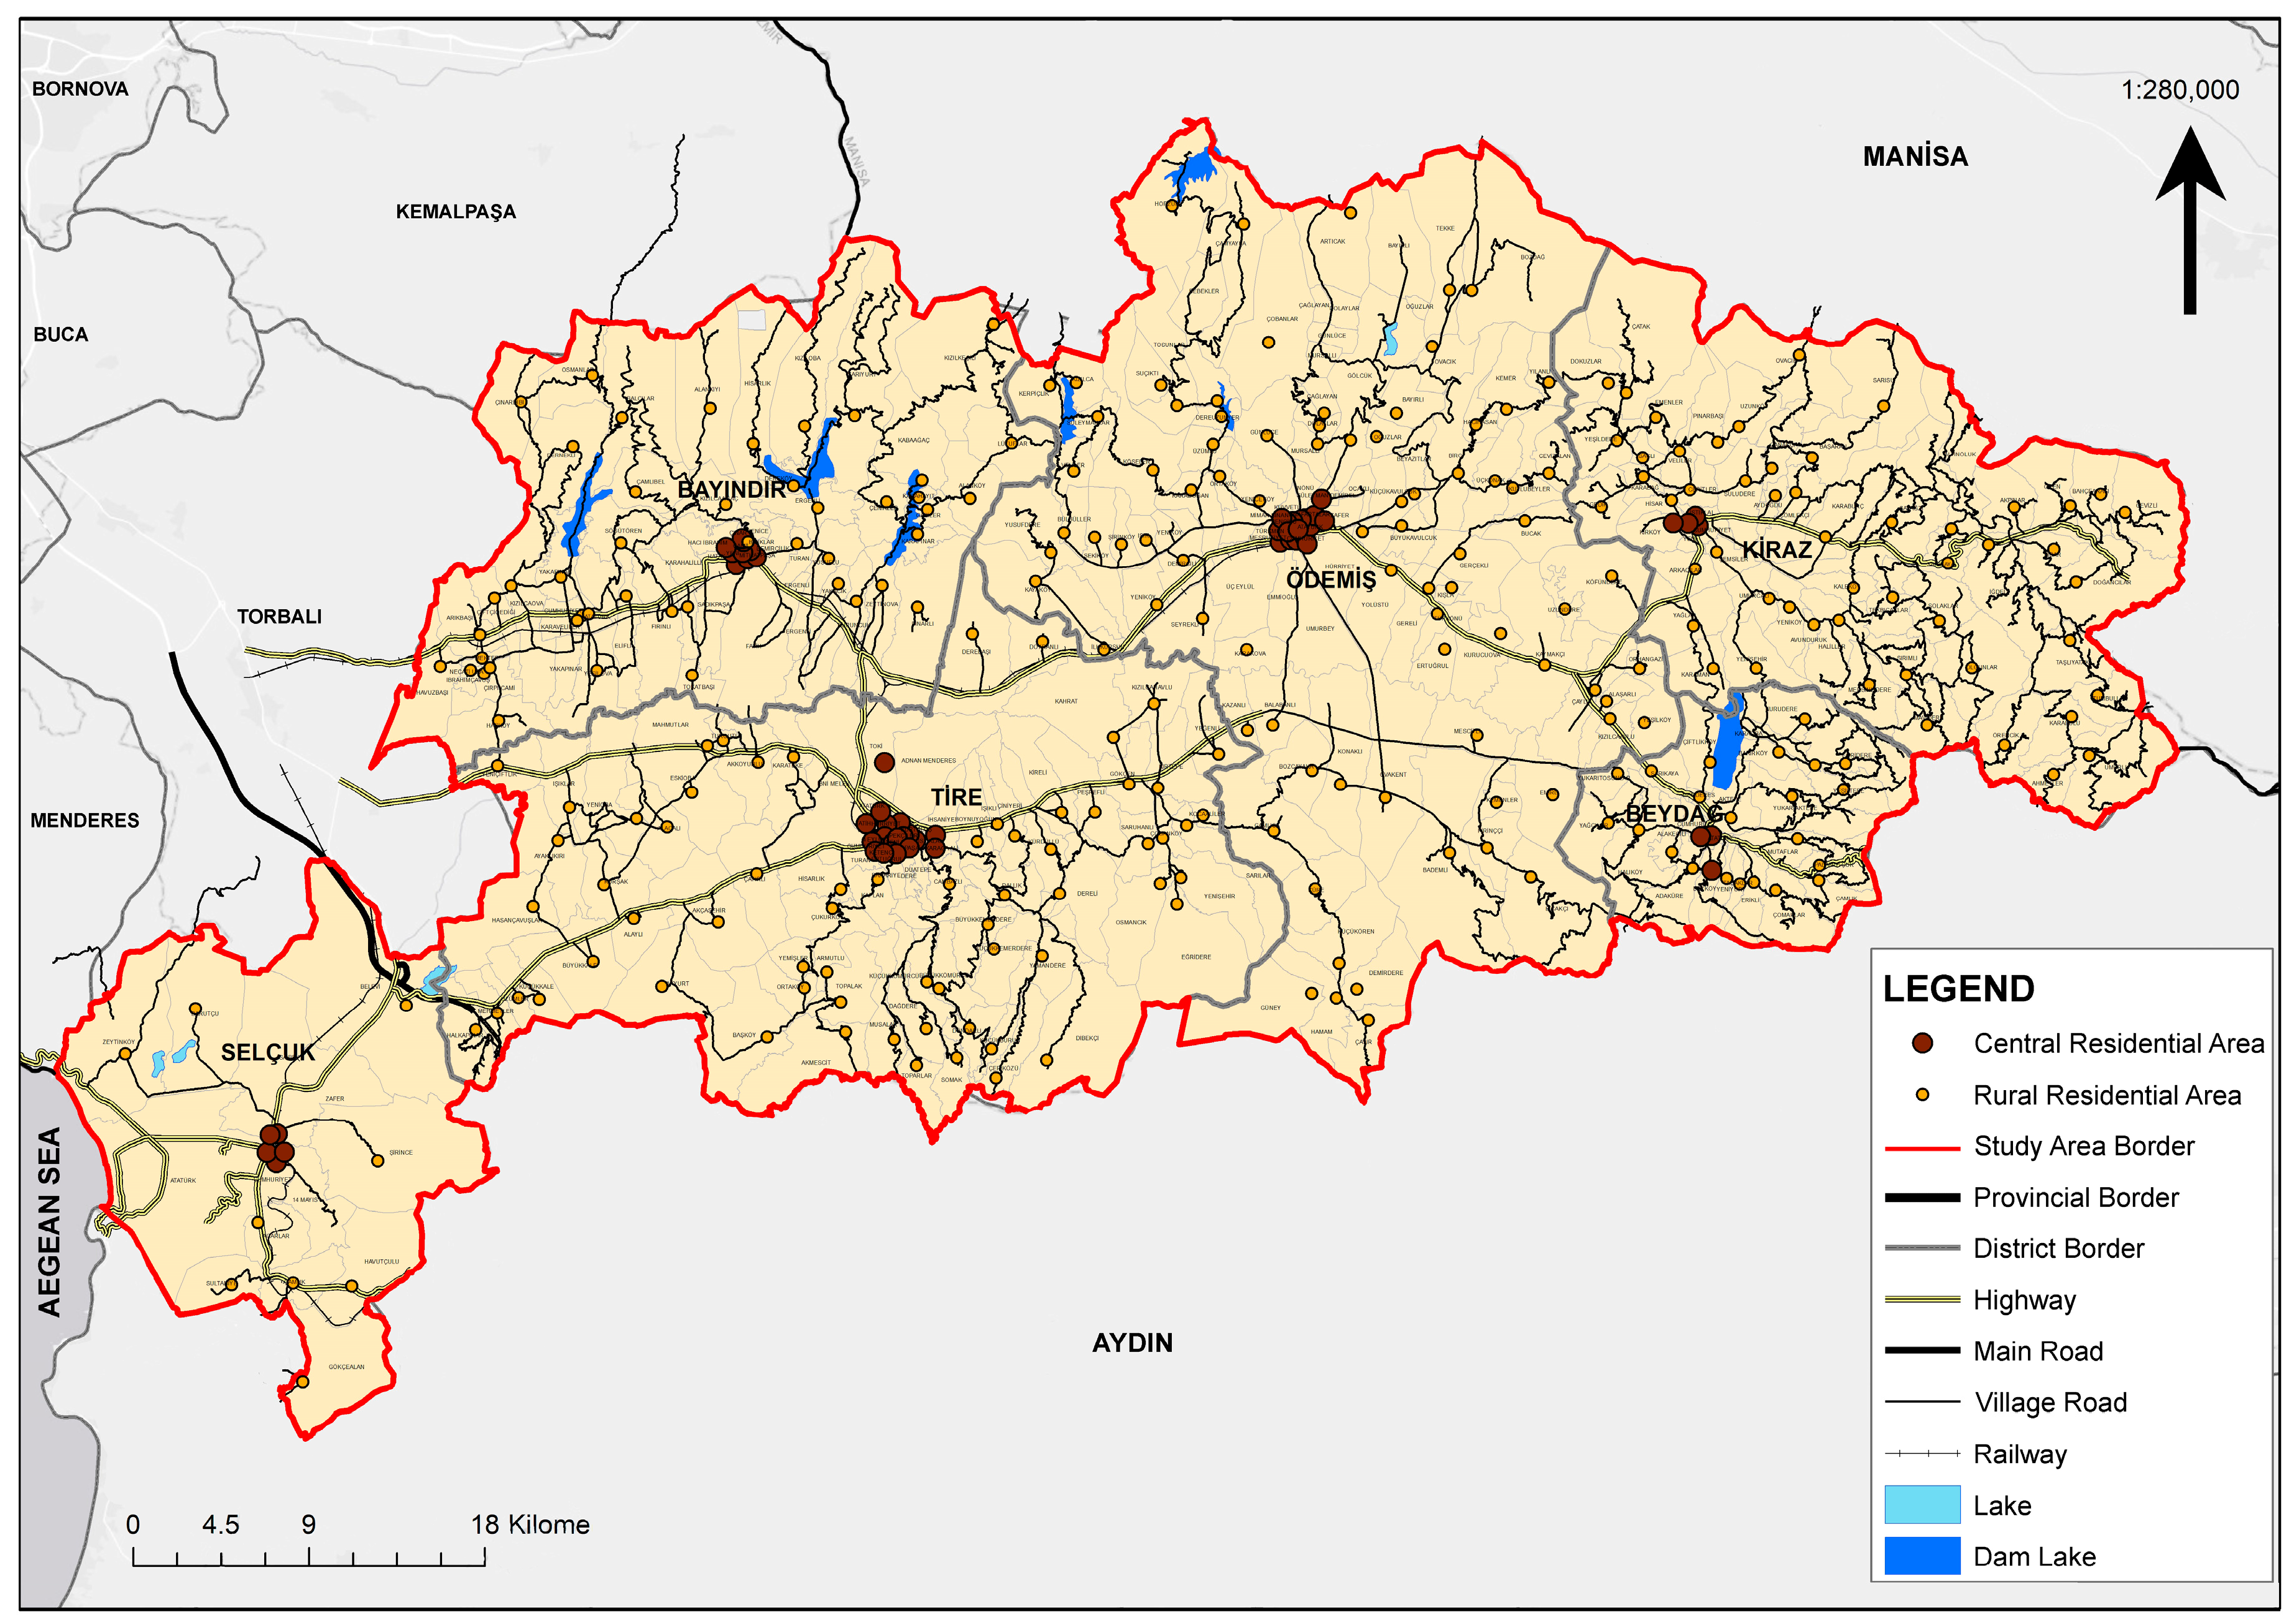
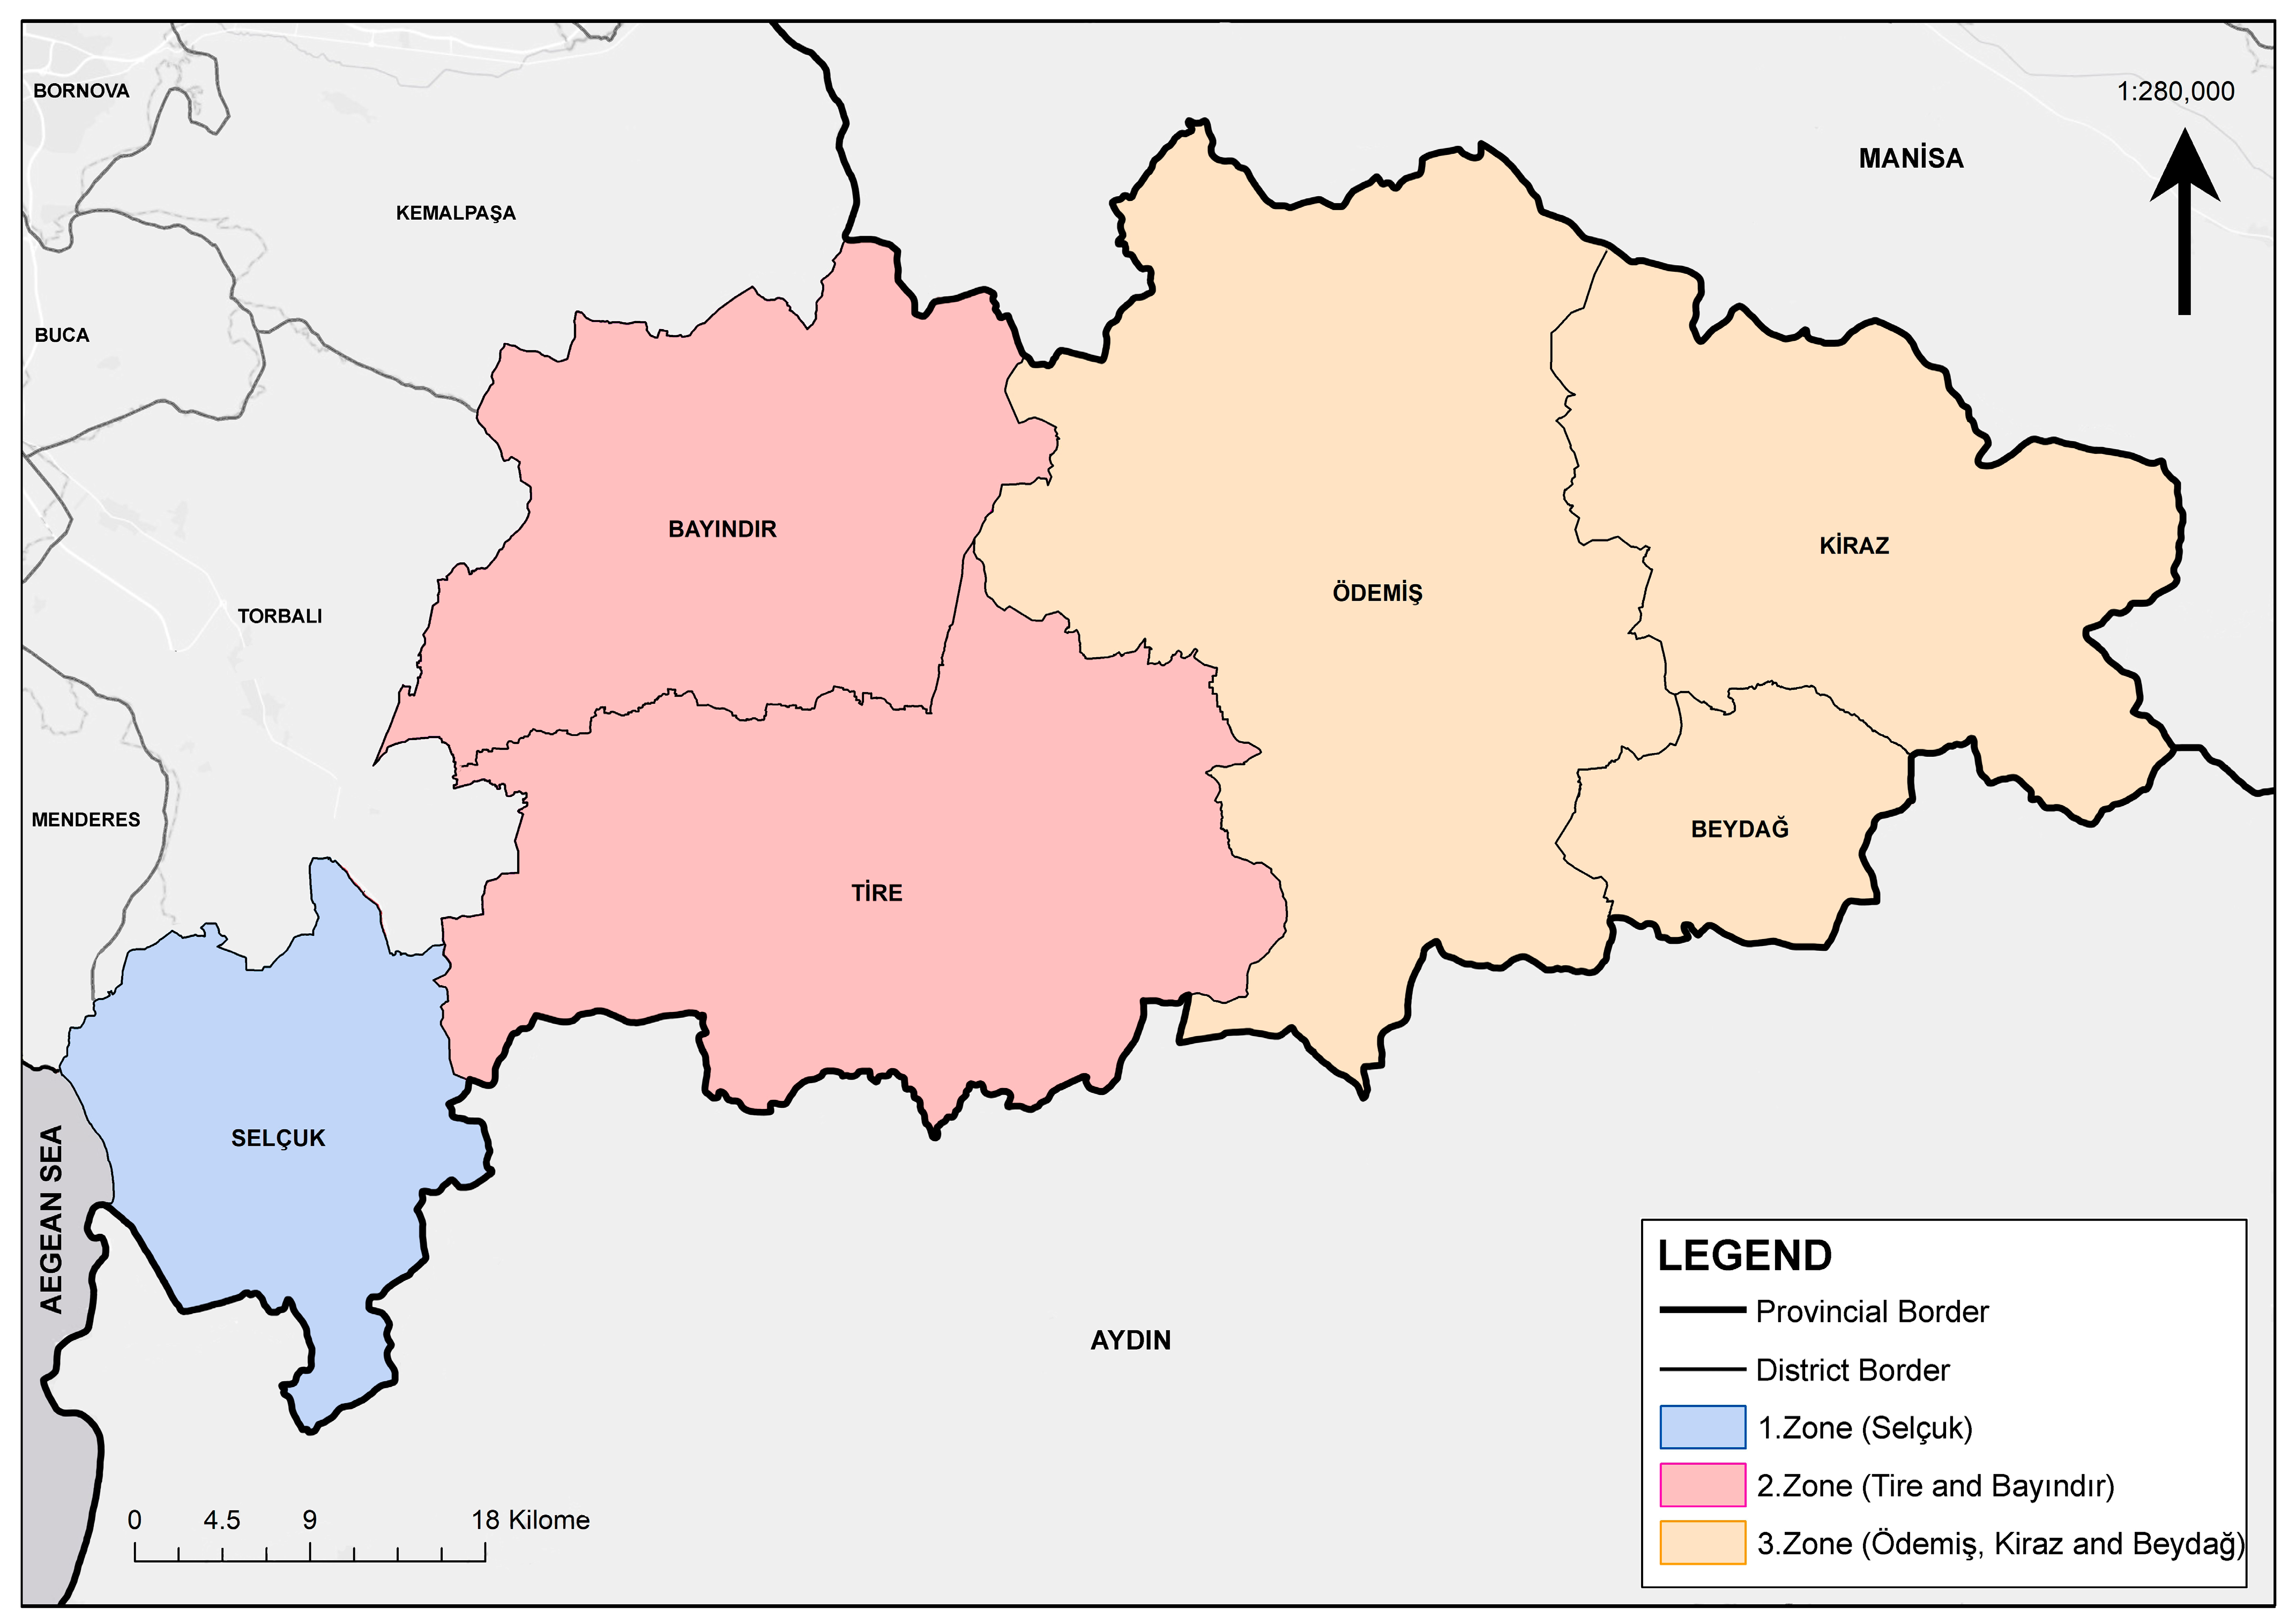
- Region 1: Selçuk district.
- Region 2: Tire and Bayındır districts.
- Region 3: Ödemiş, Kiraz, and Beydağ districts.
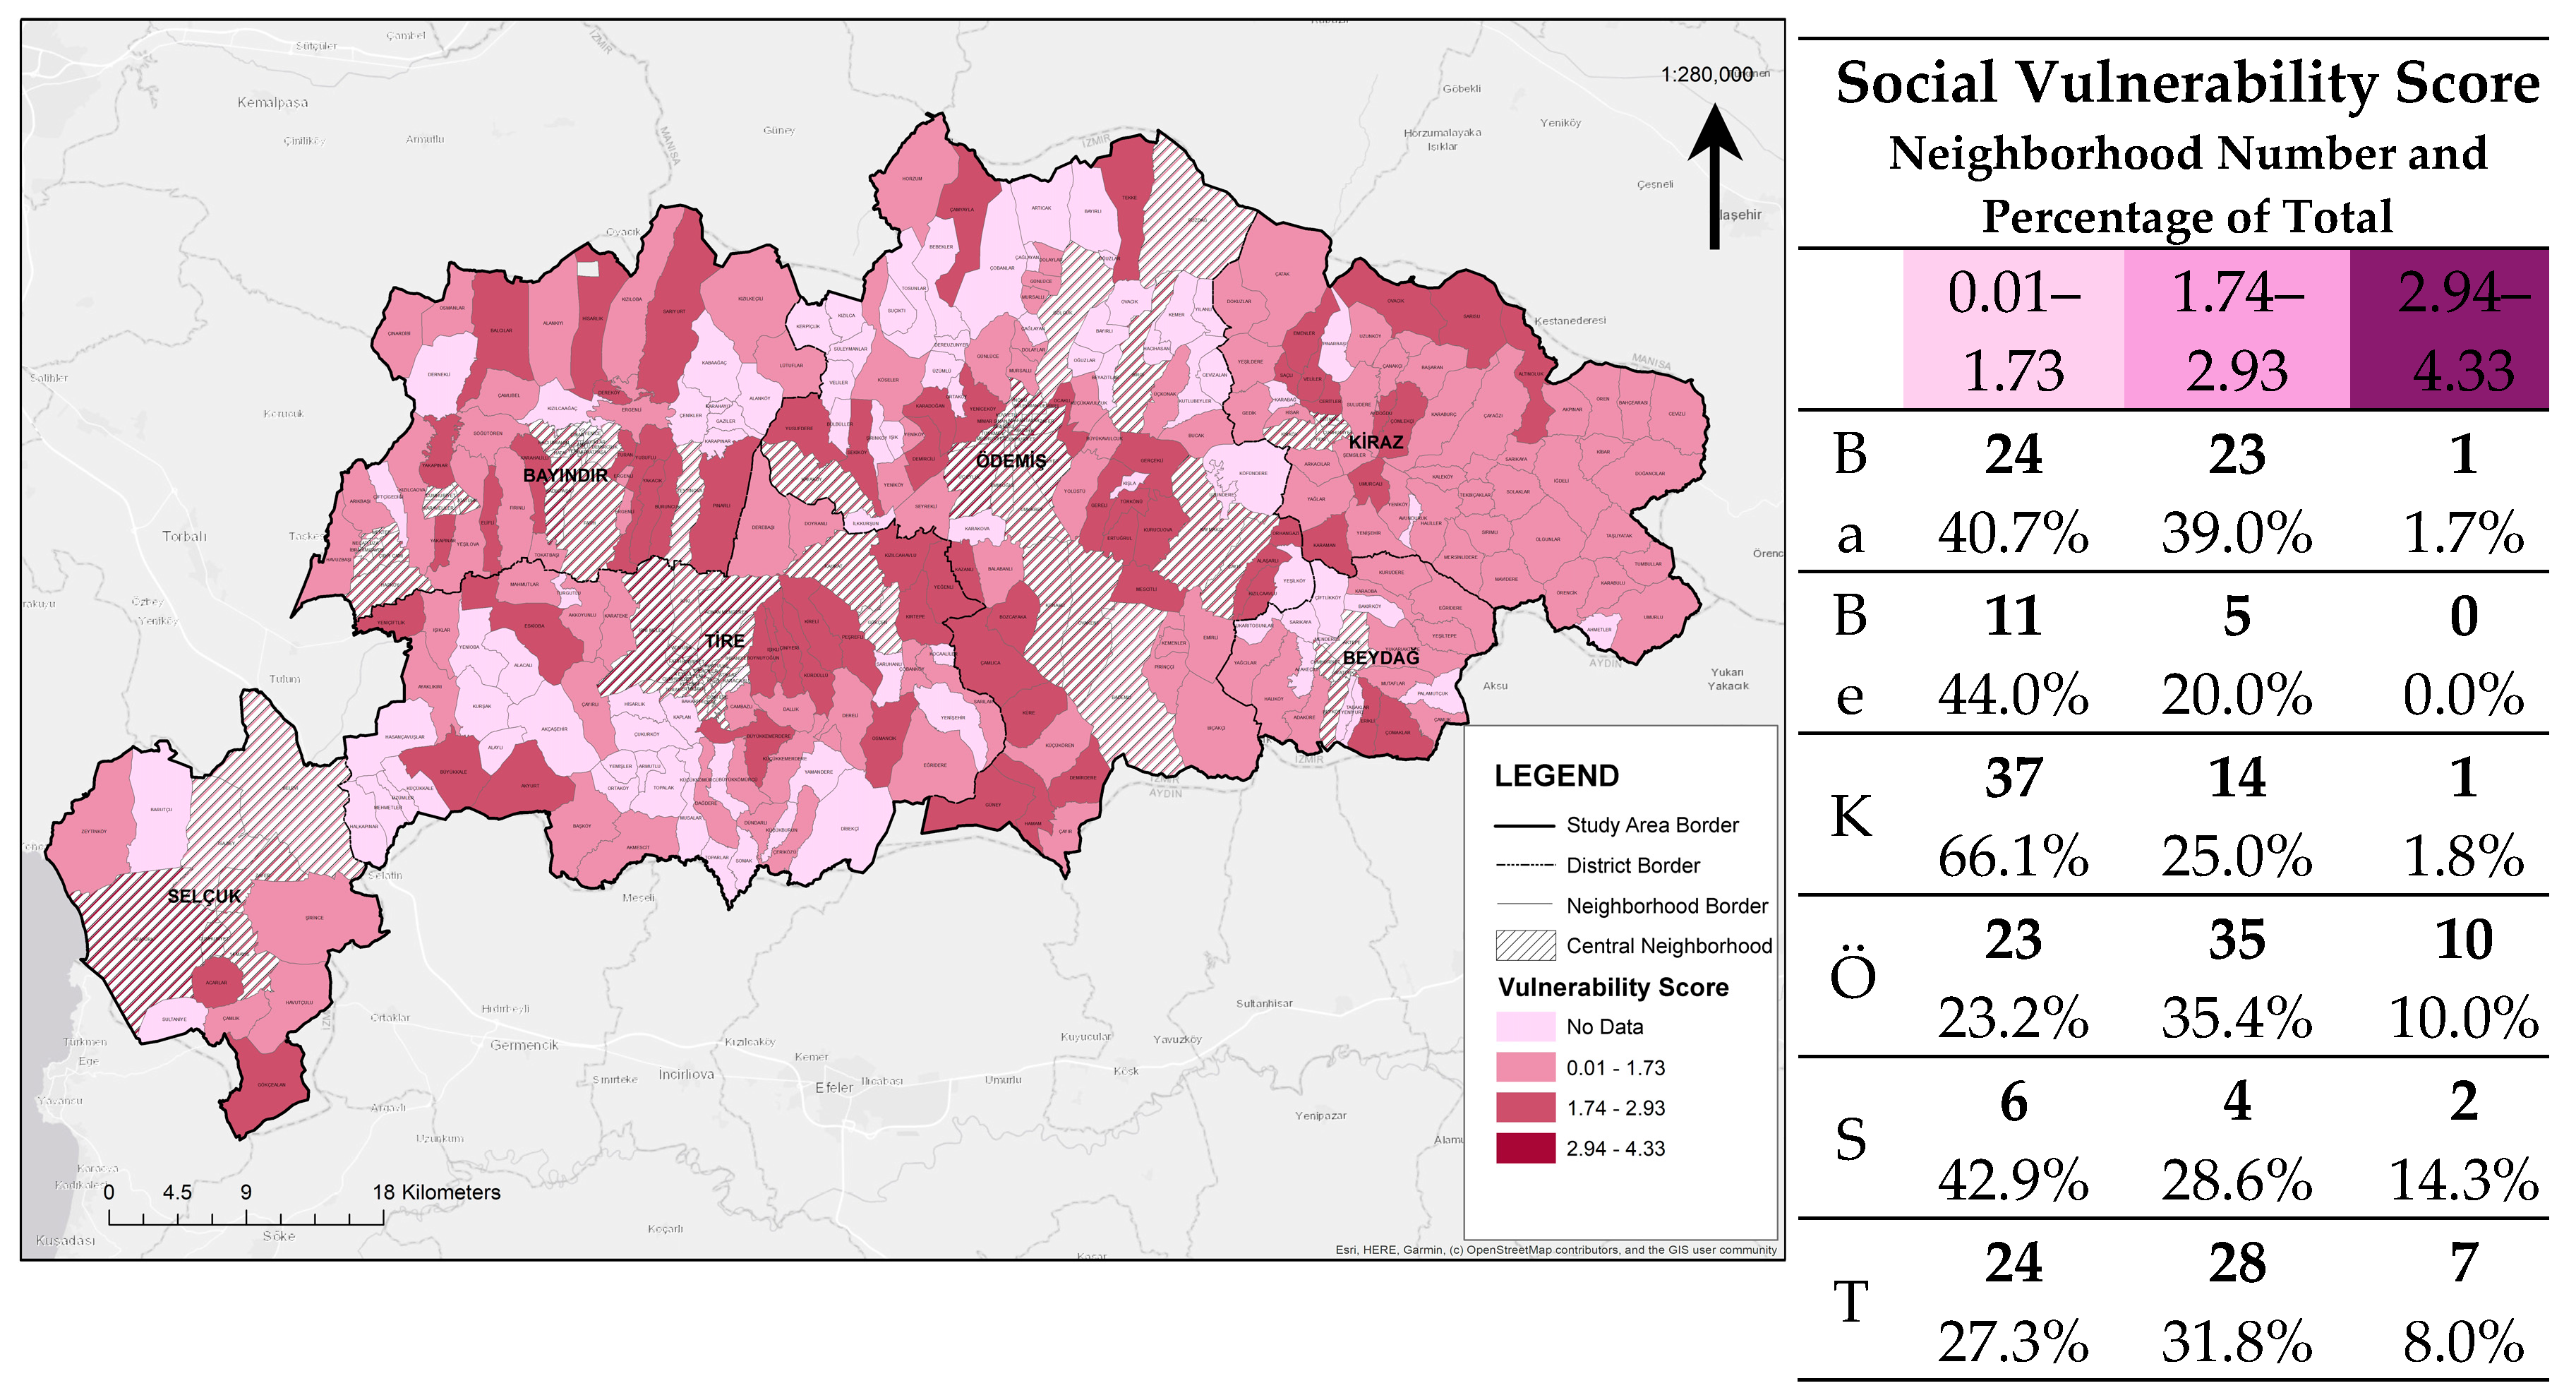
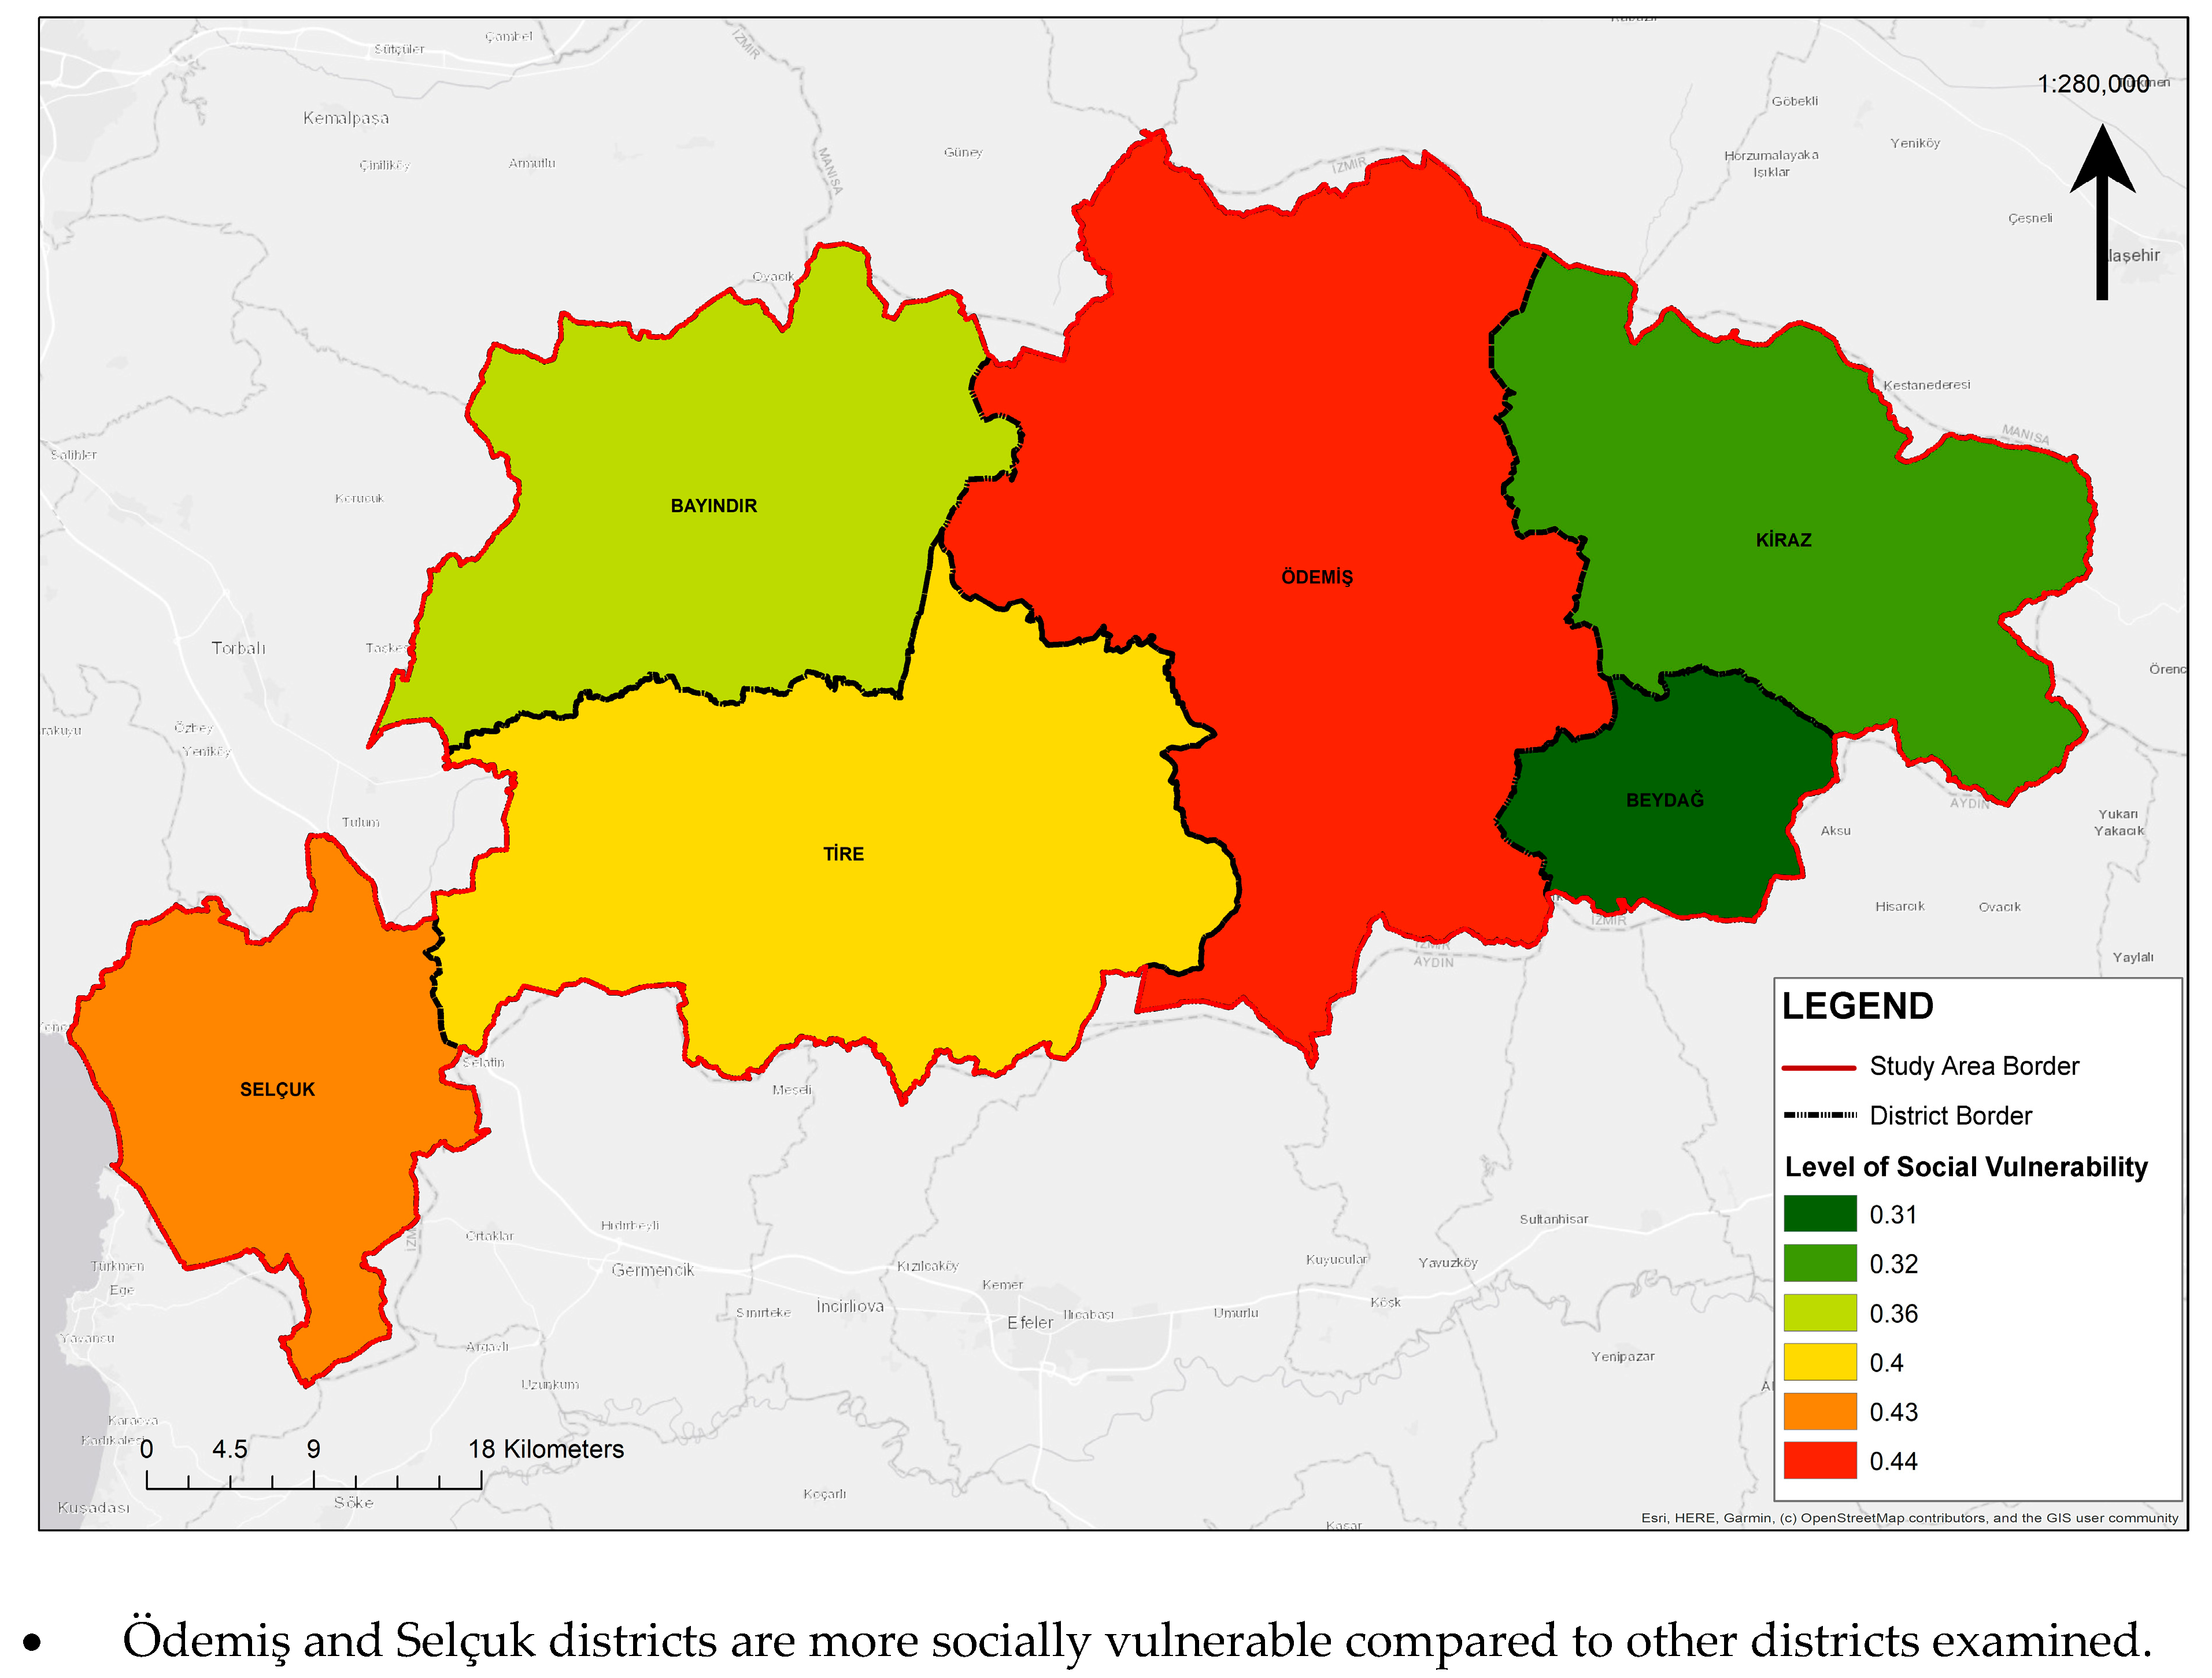
- Social vulnerability: Ödemiş district is the most vulnerable (0.44), while Beydağ district, located immediately to the southeast and neighboring it, is the least vulnerable (0.31).
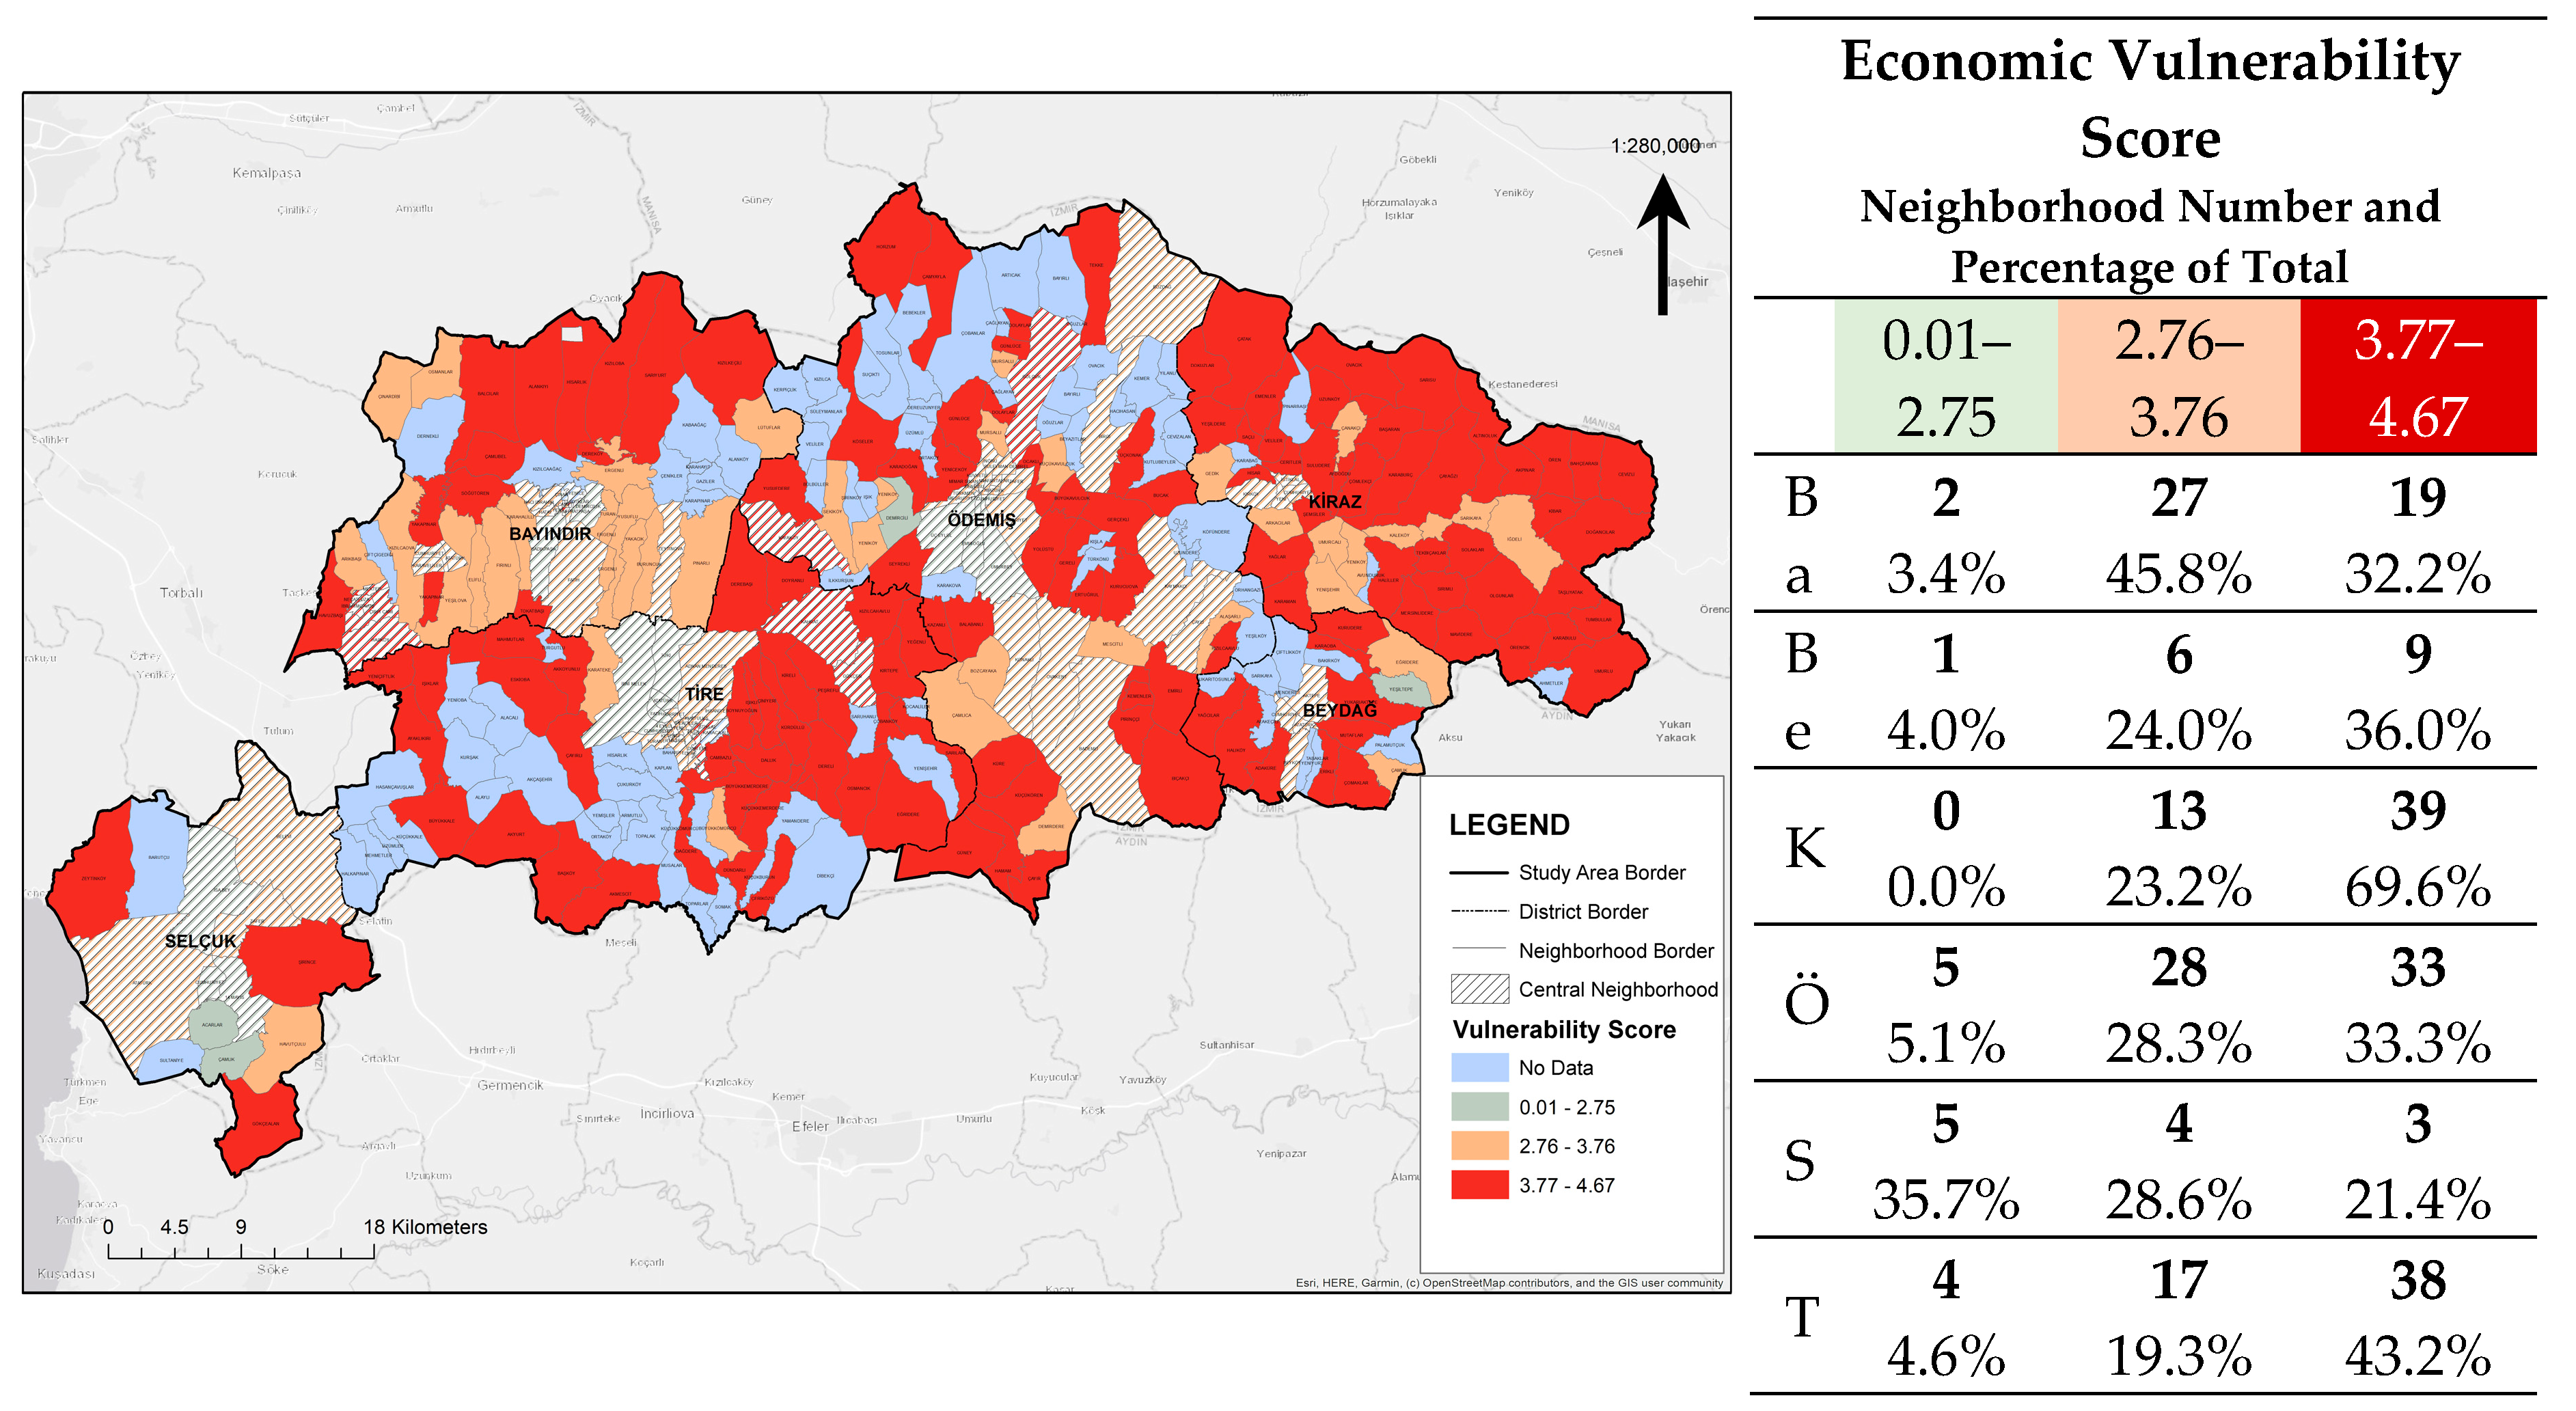
- Economic vulnerability: Kiraz district, located in the far east of the study area, is the most vulnerable (0.80), while Selçuk district, located in the far west, is the least vulnerable (0.60).
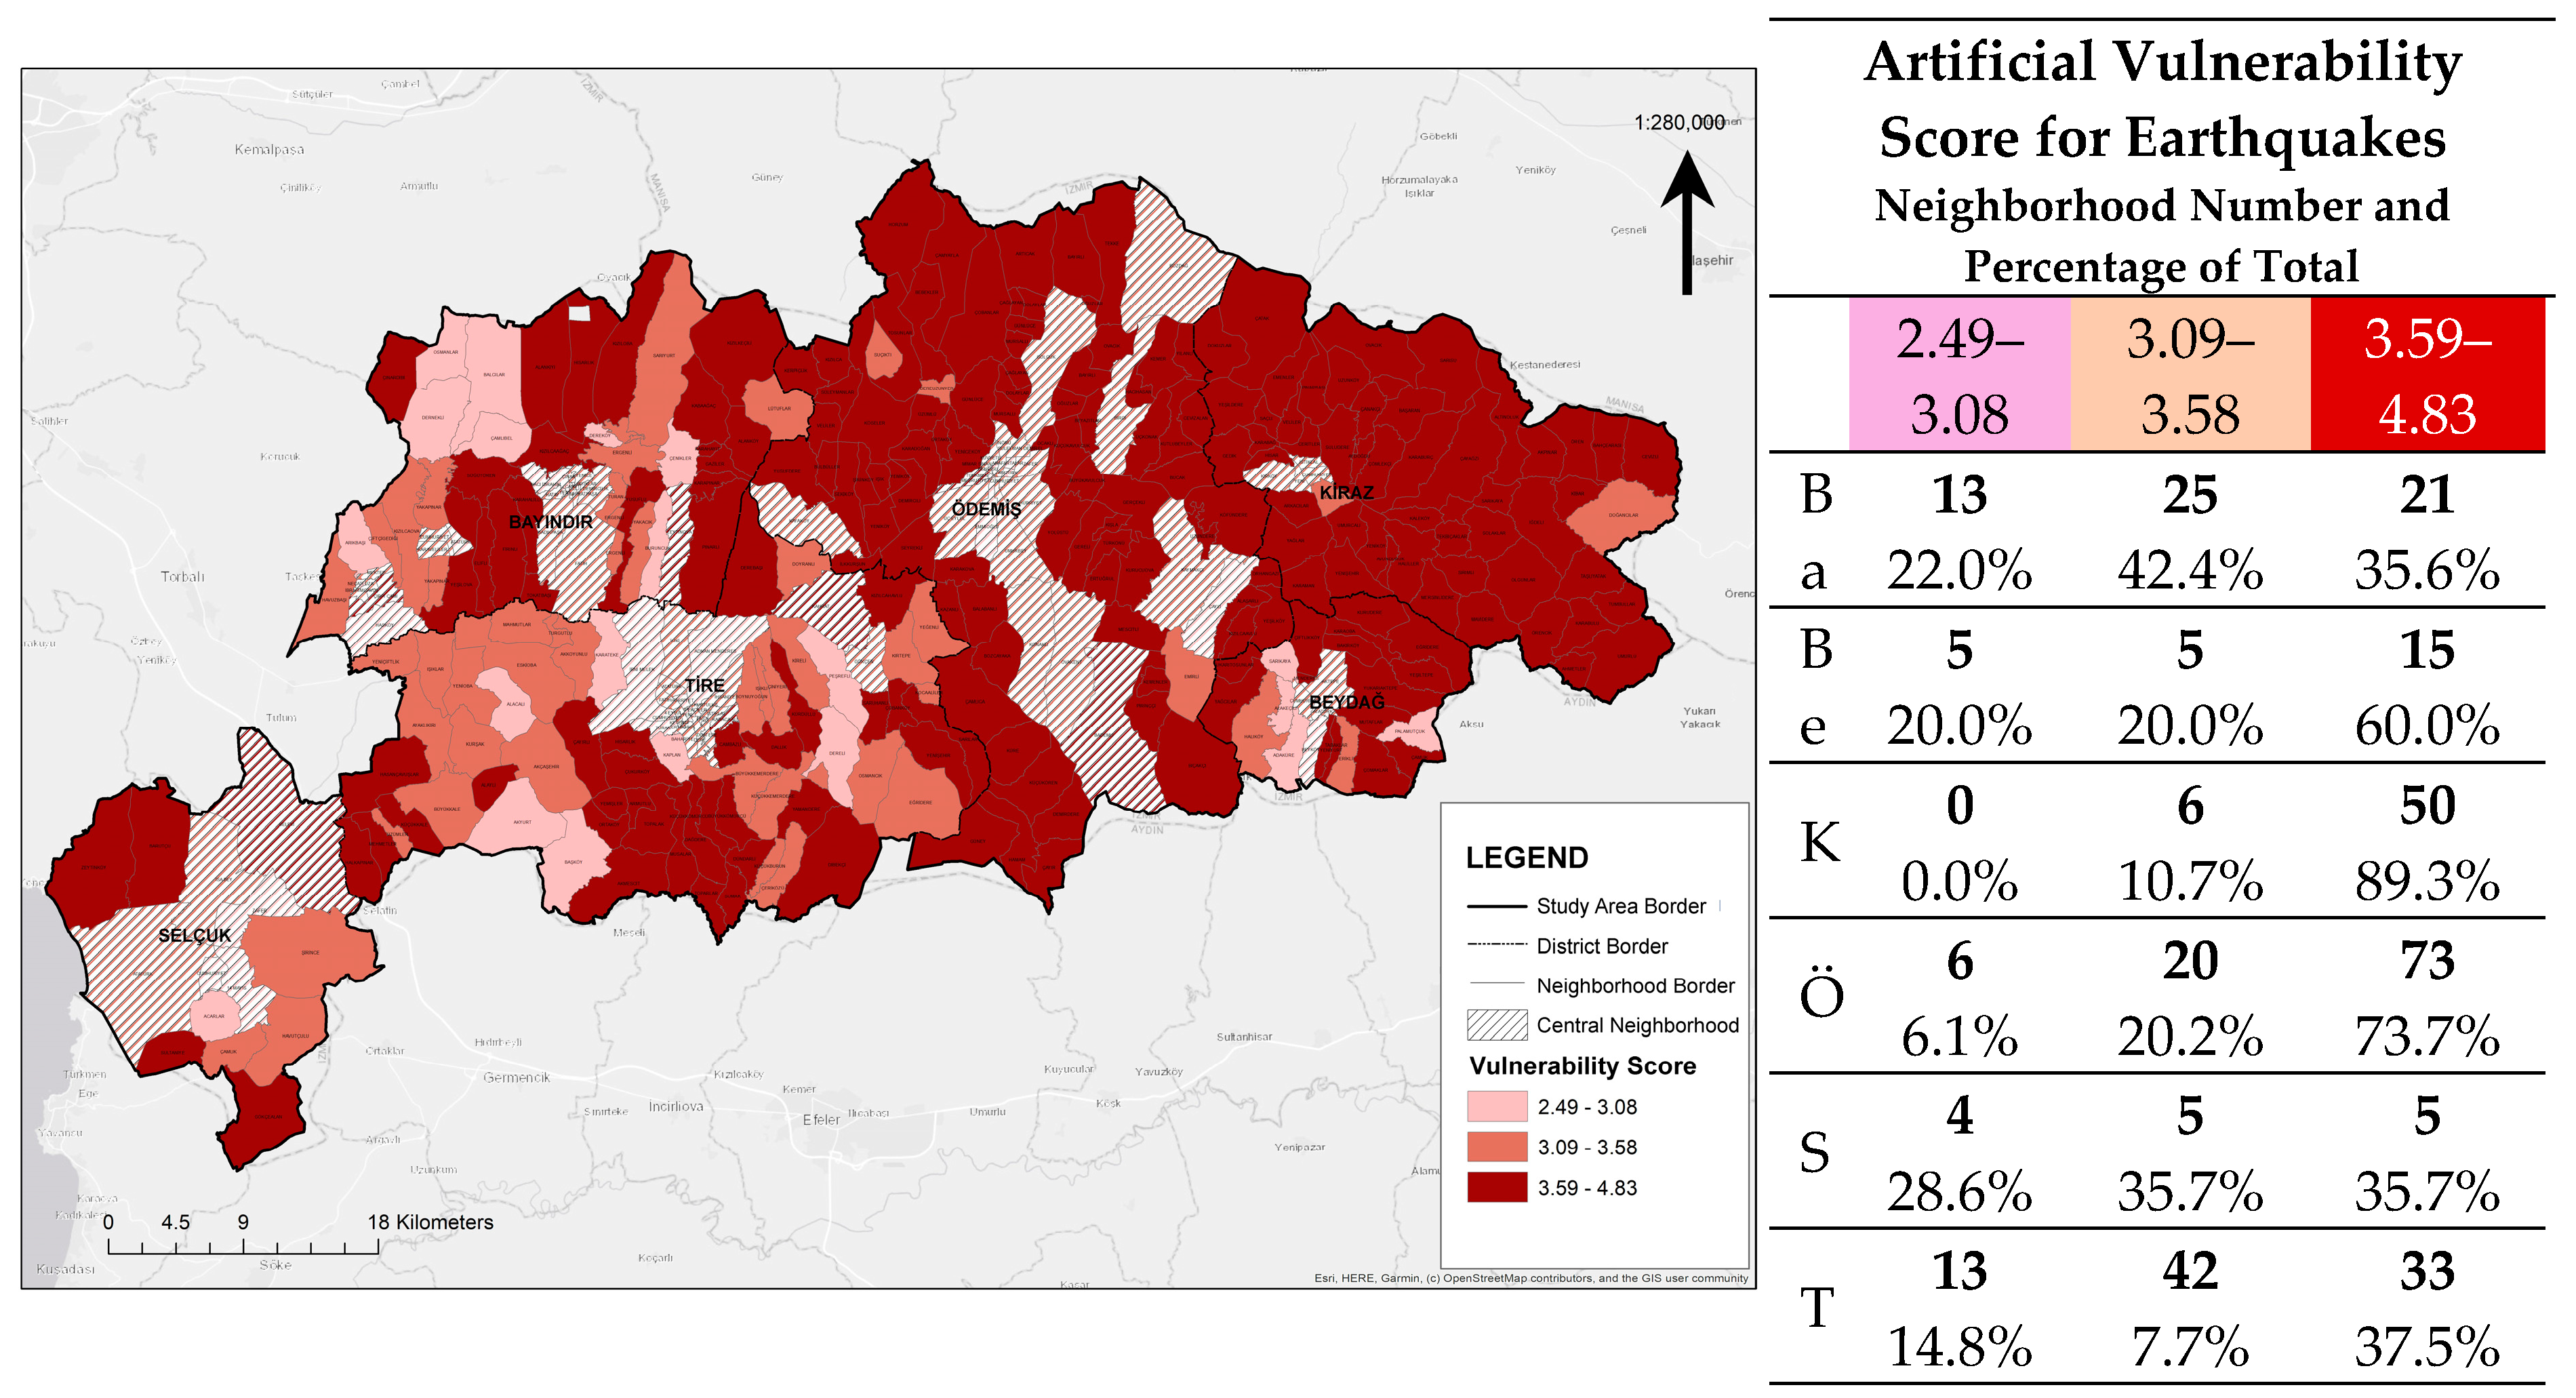
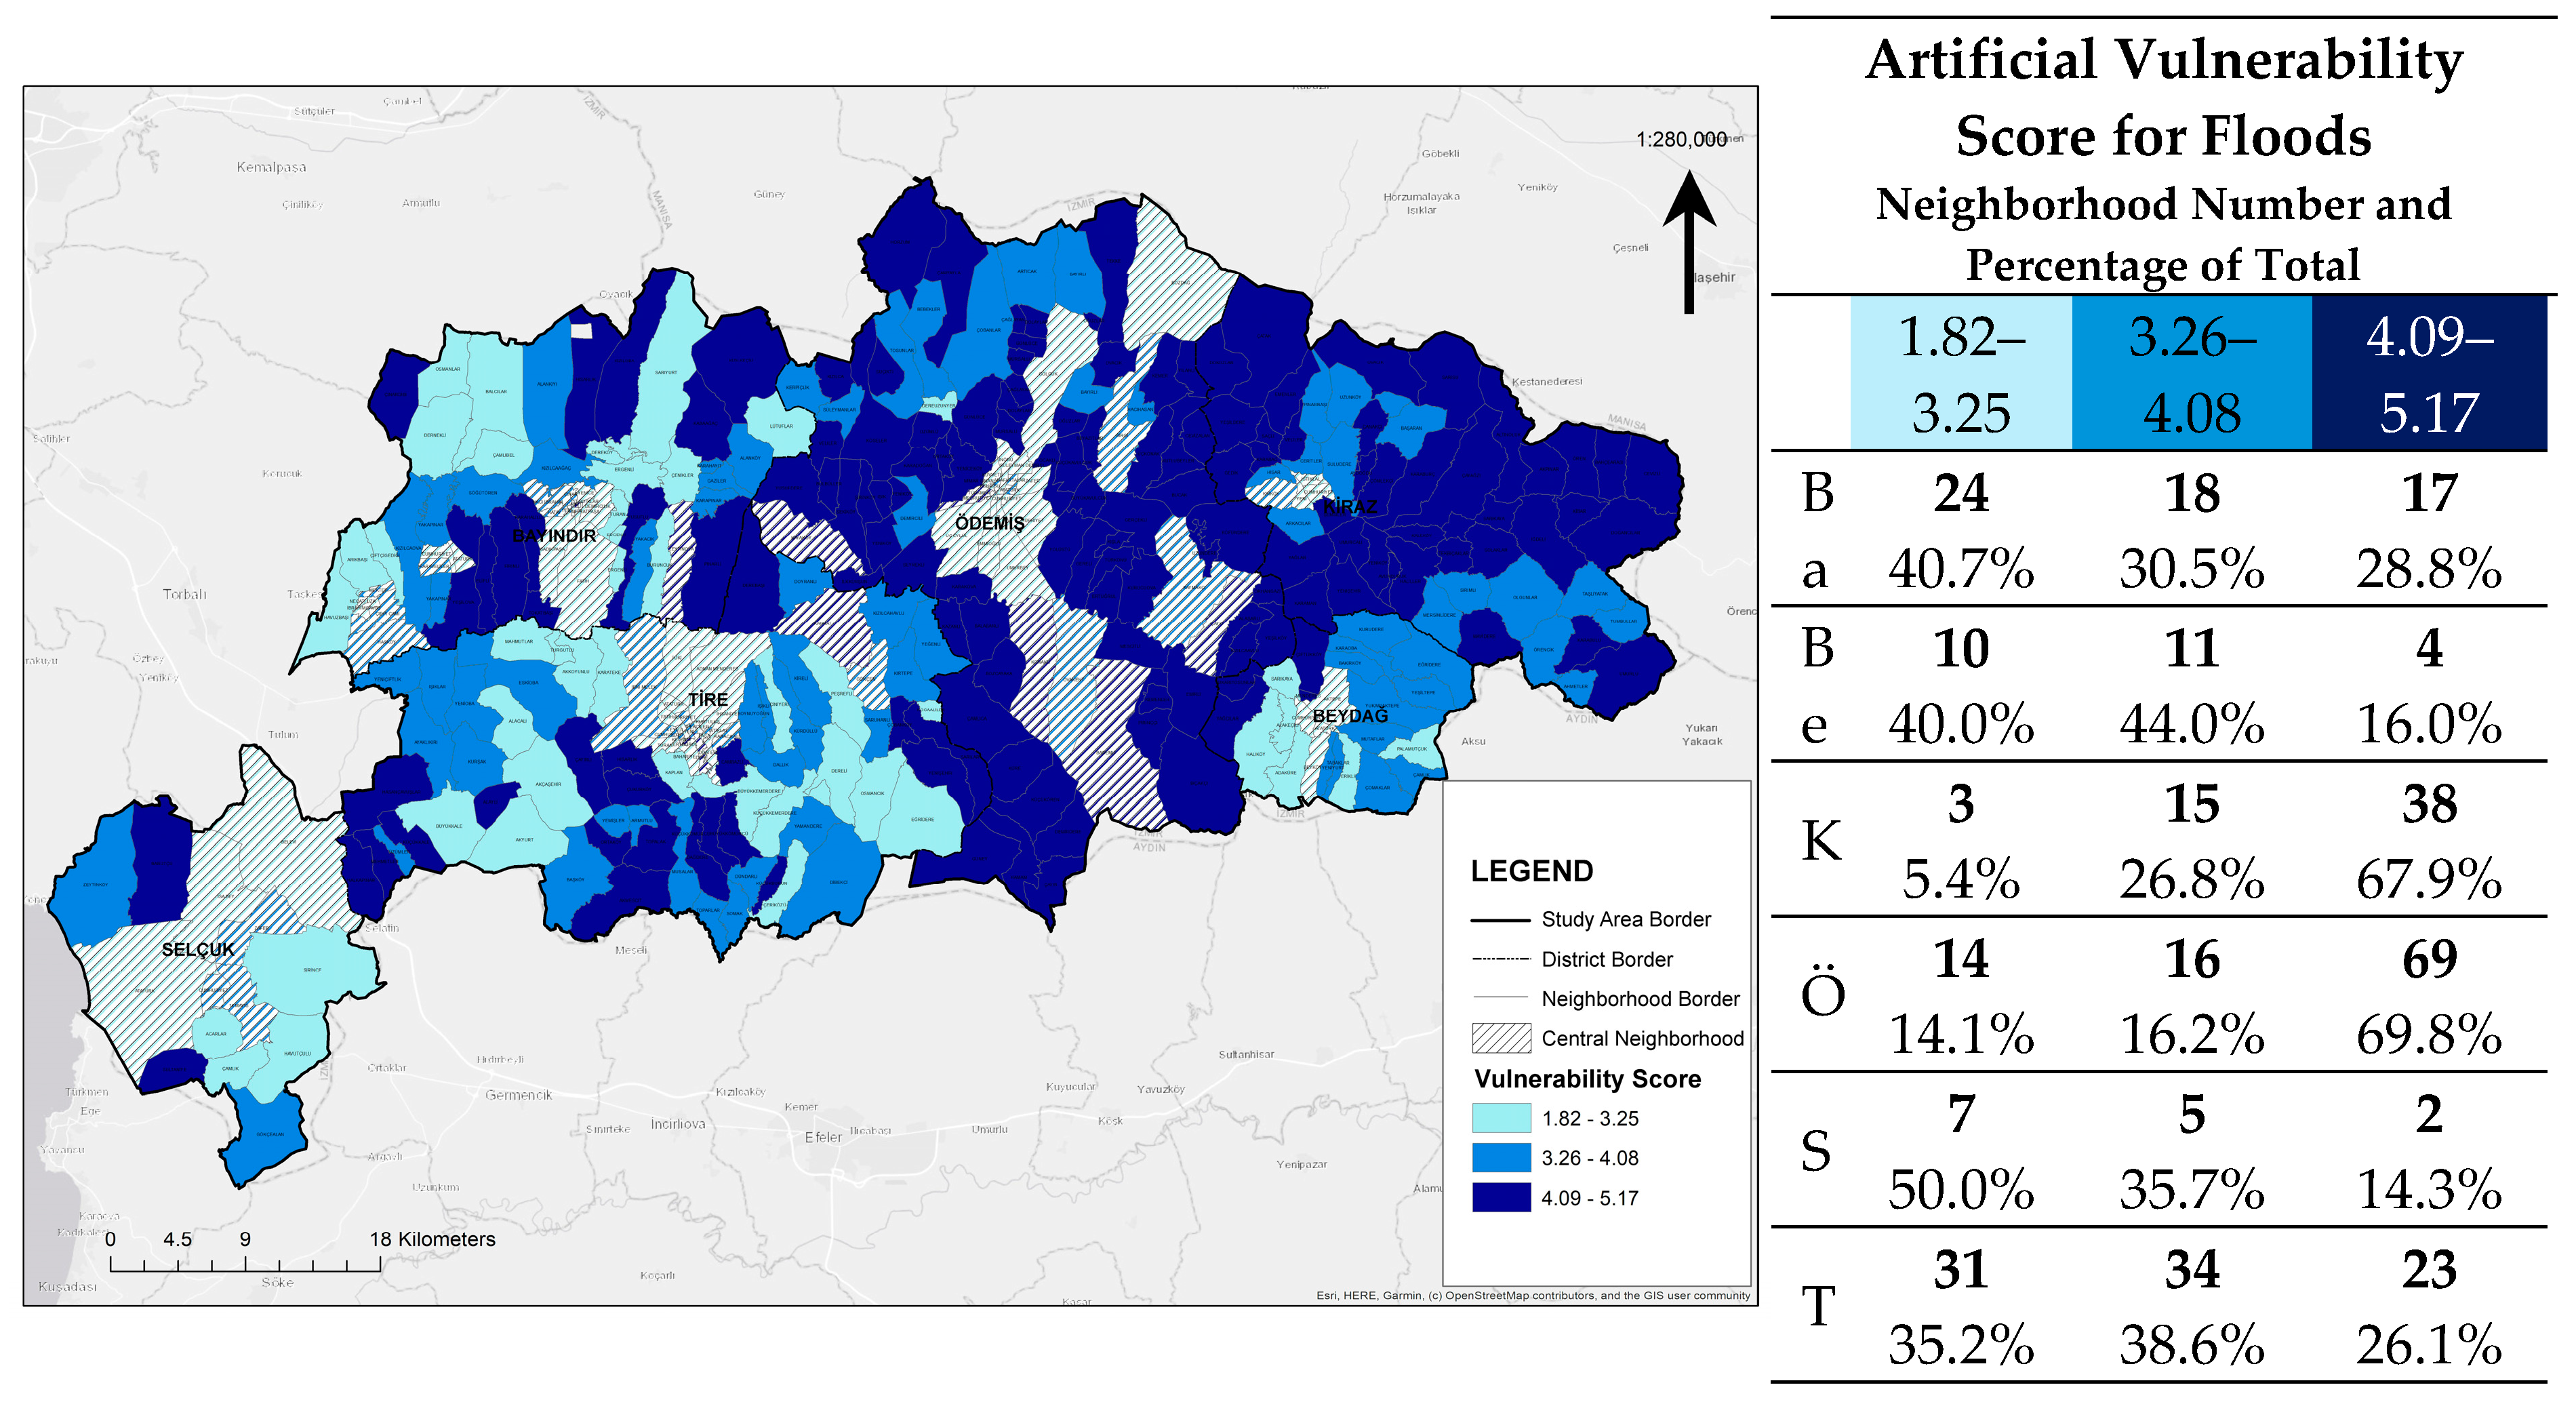
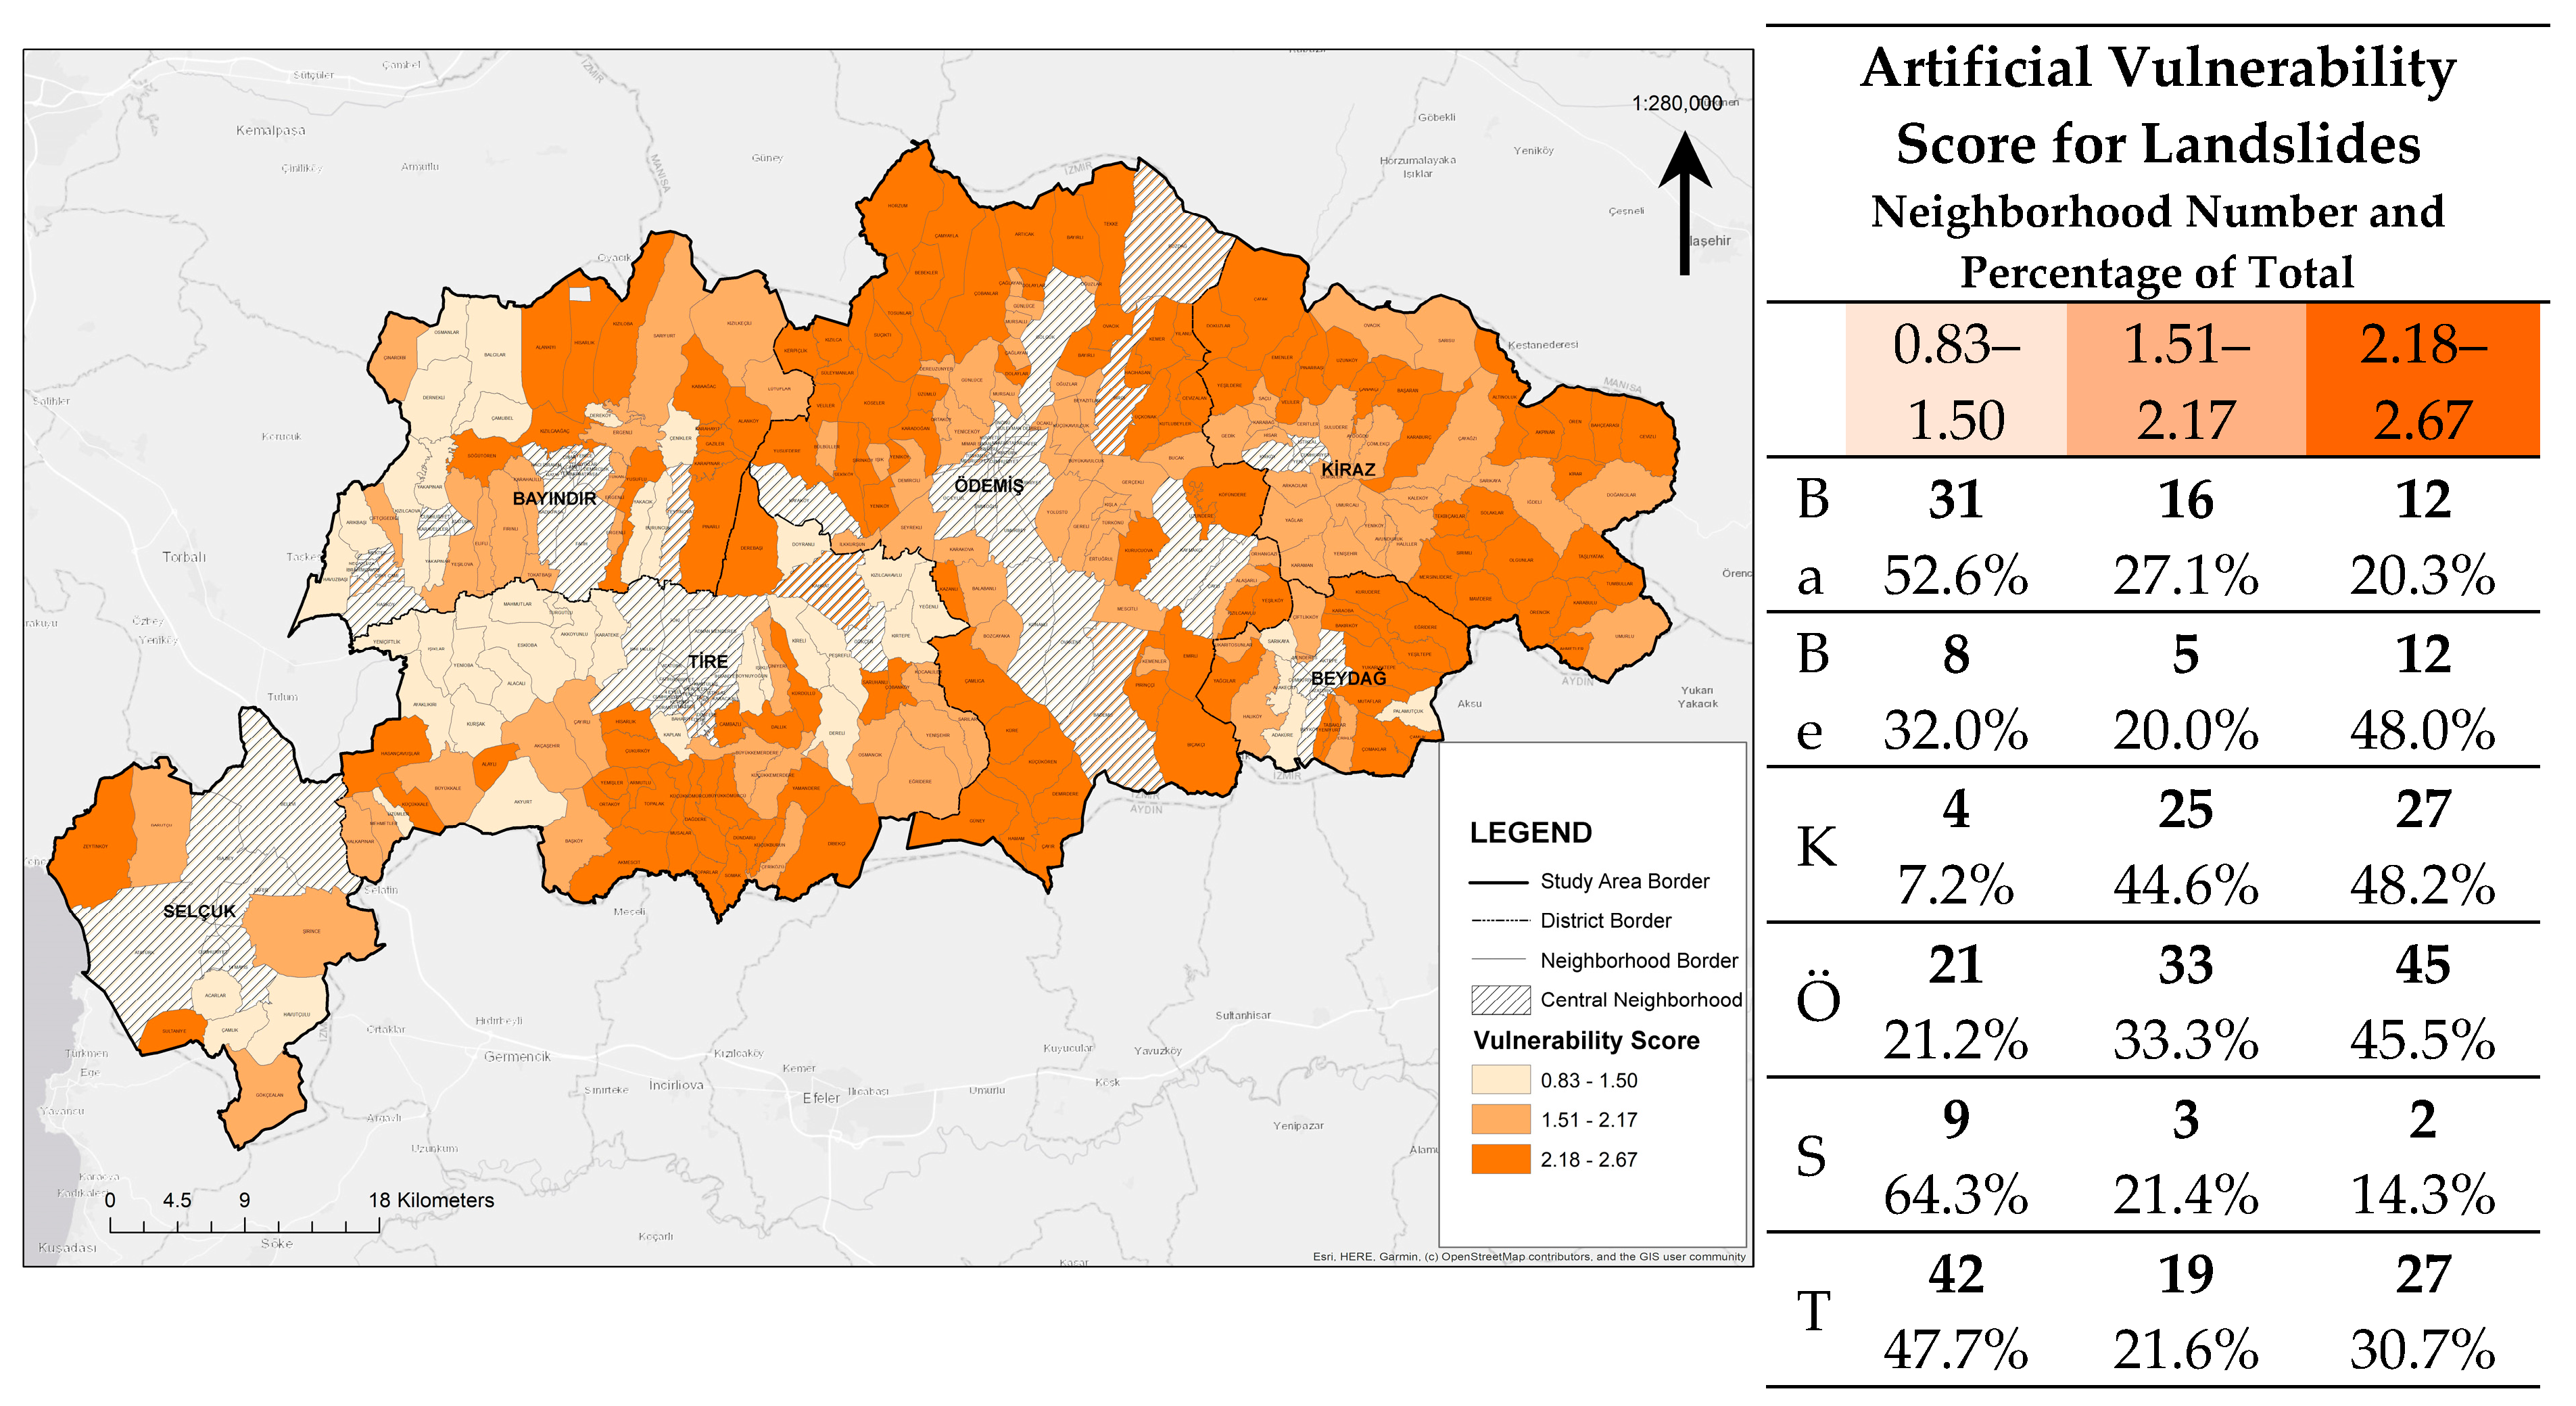
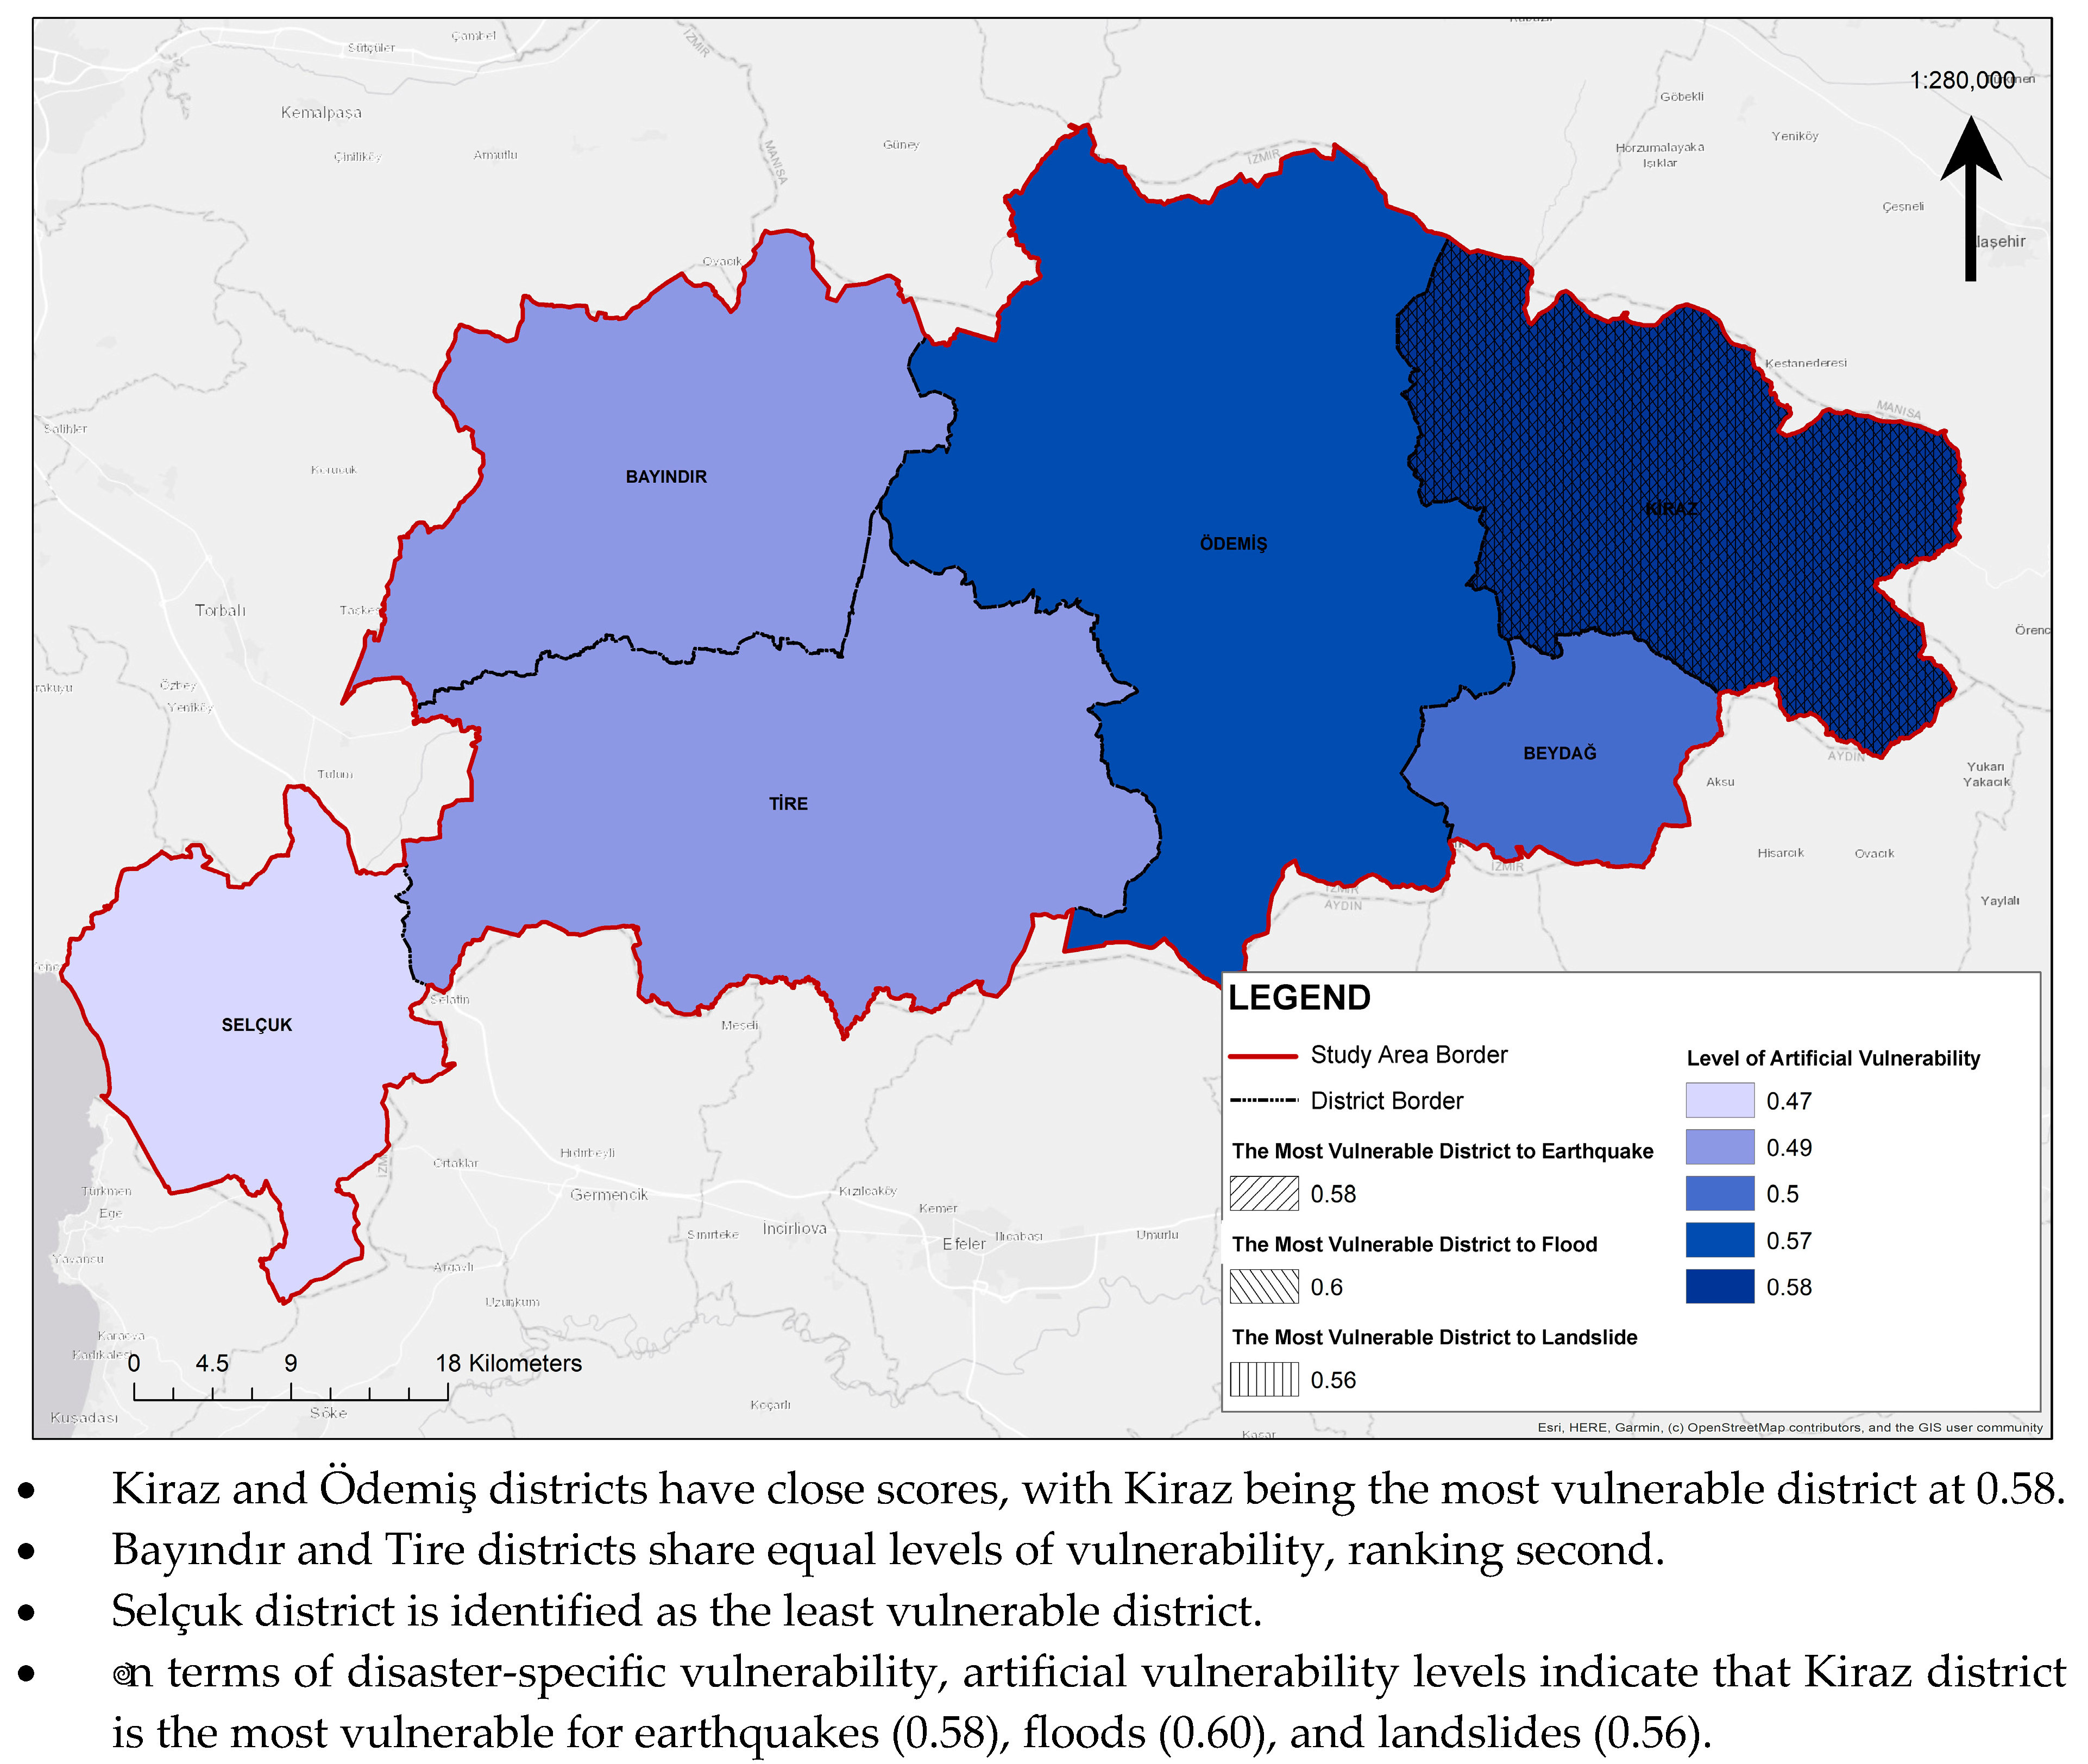
- Artificial vulnerability: Kiraz district is the most vulnerable (0.58) in the far east of the study area, while Selçuk district is the least vulnerable (0.47) in the far west. In addition, Kiraz district is the most vulnerable to earthquakes (0.58), floods (0.60), and landslides (0.56).
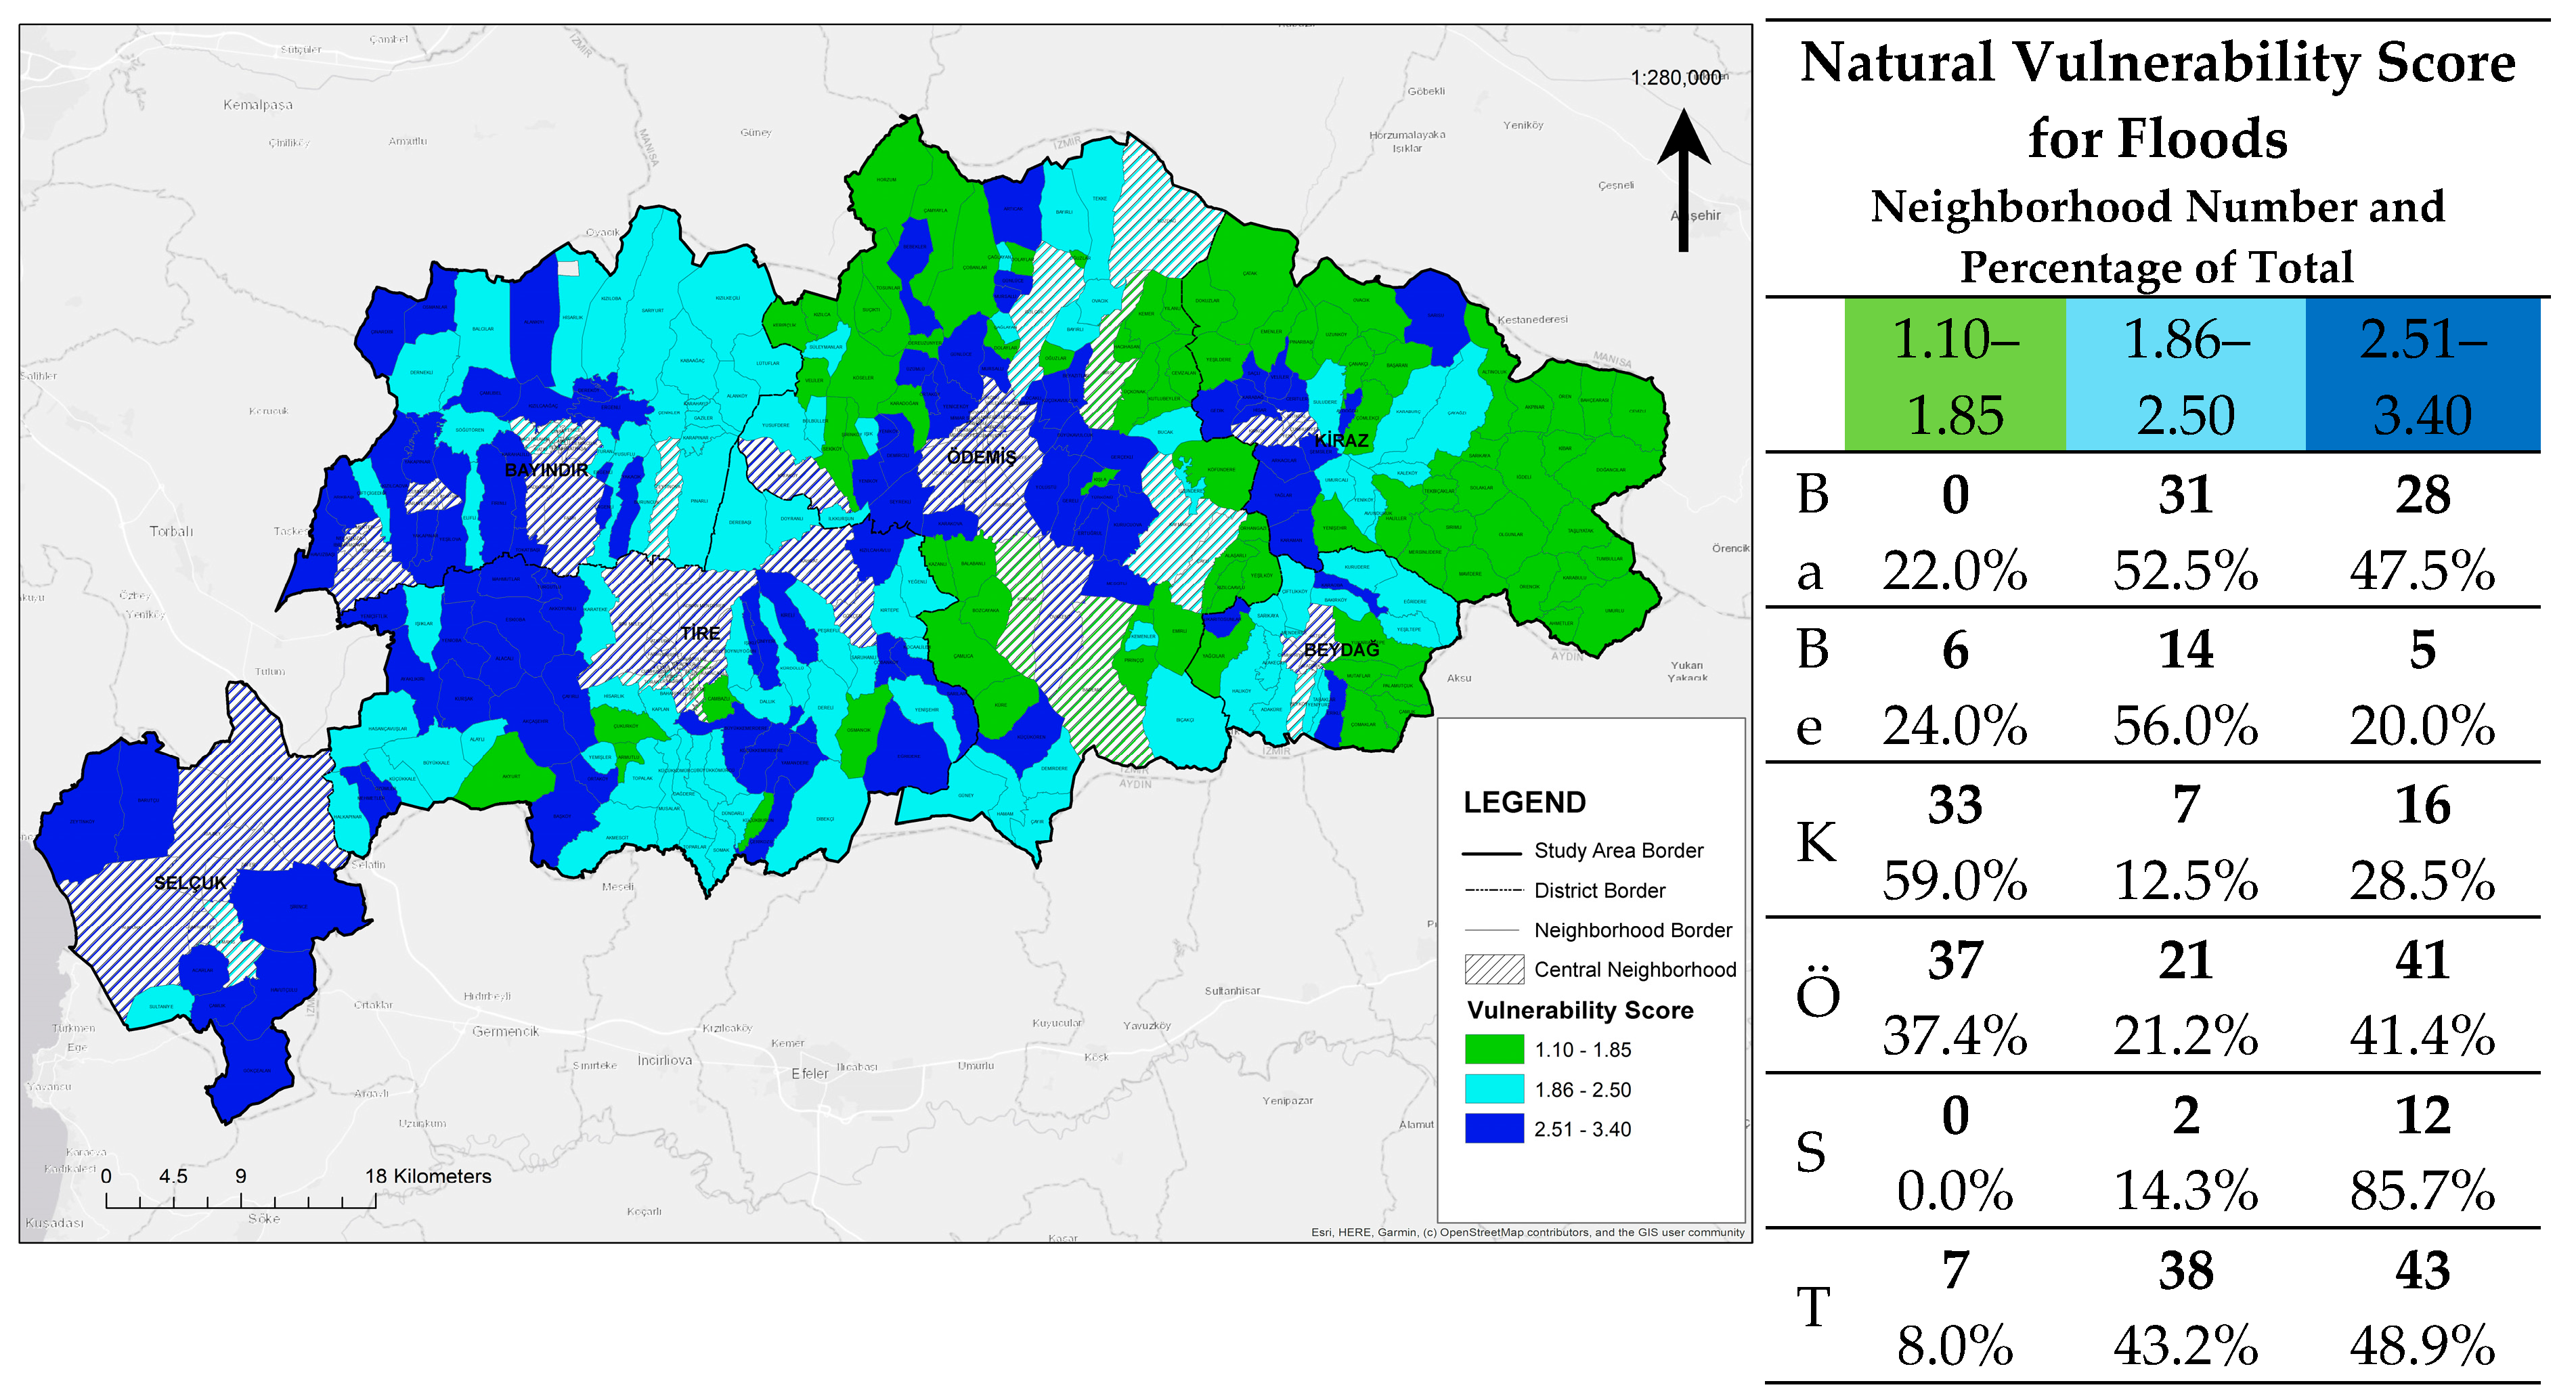
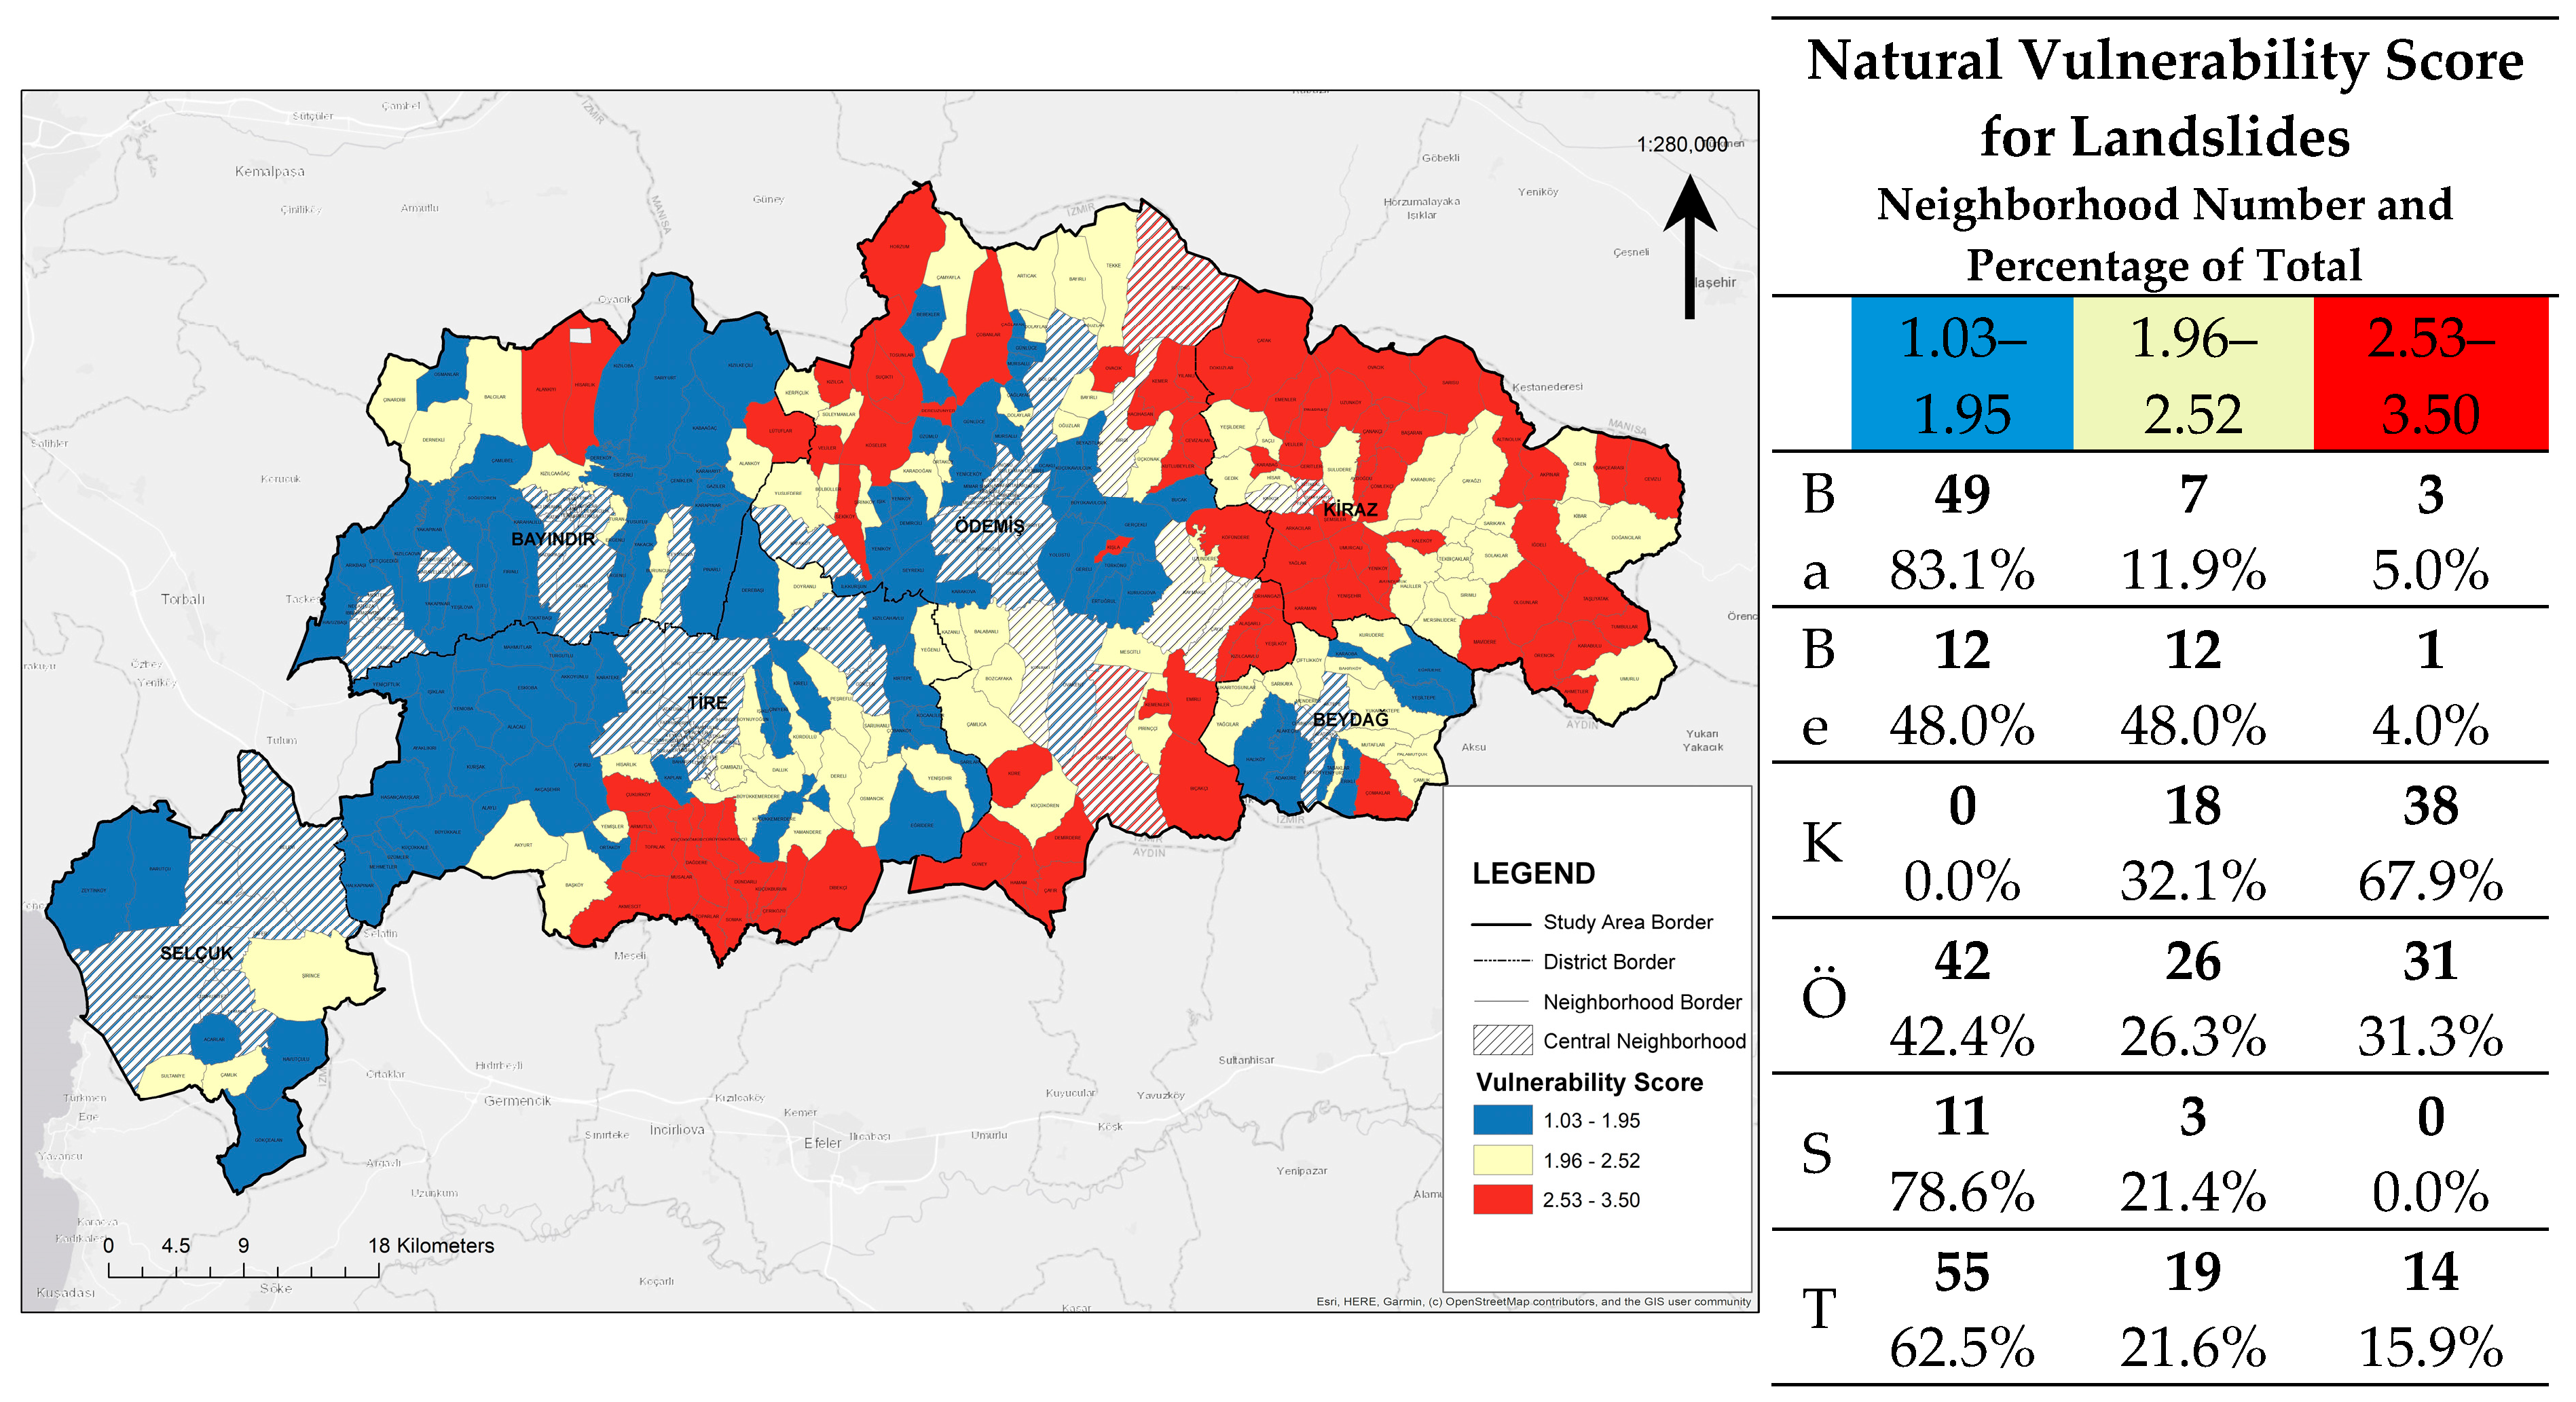
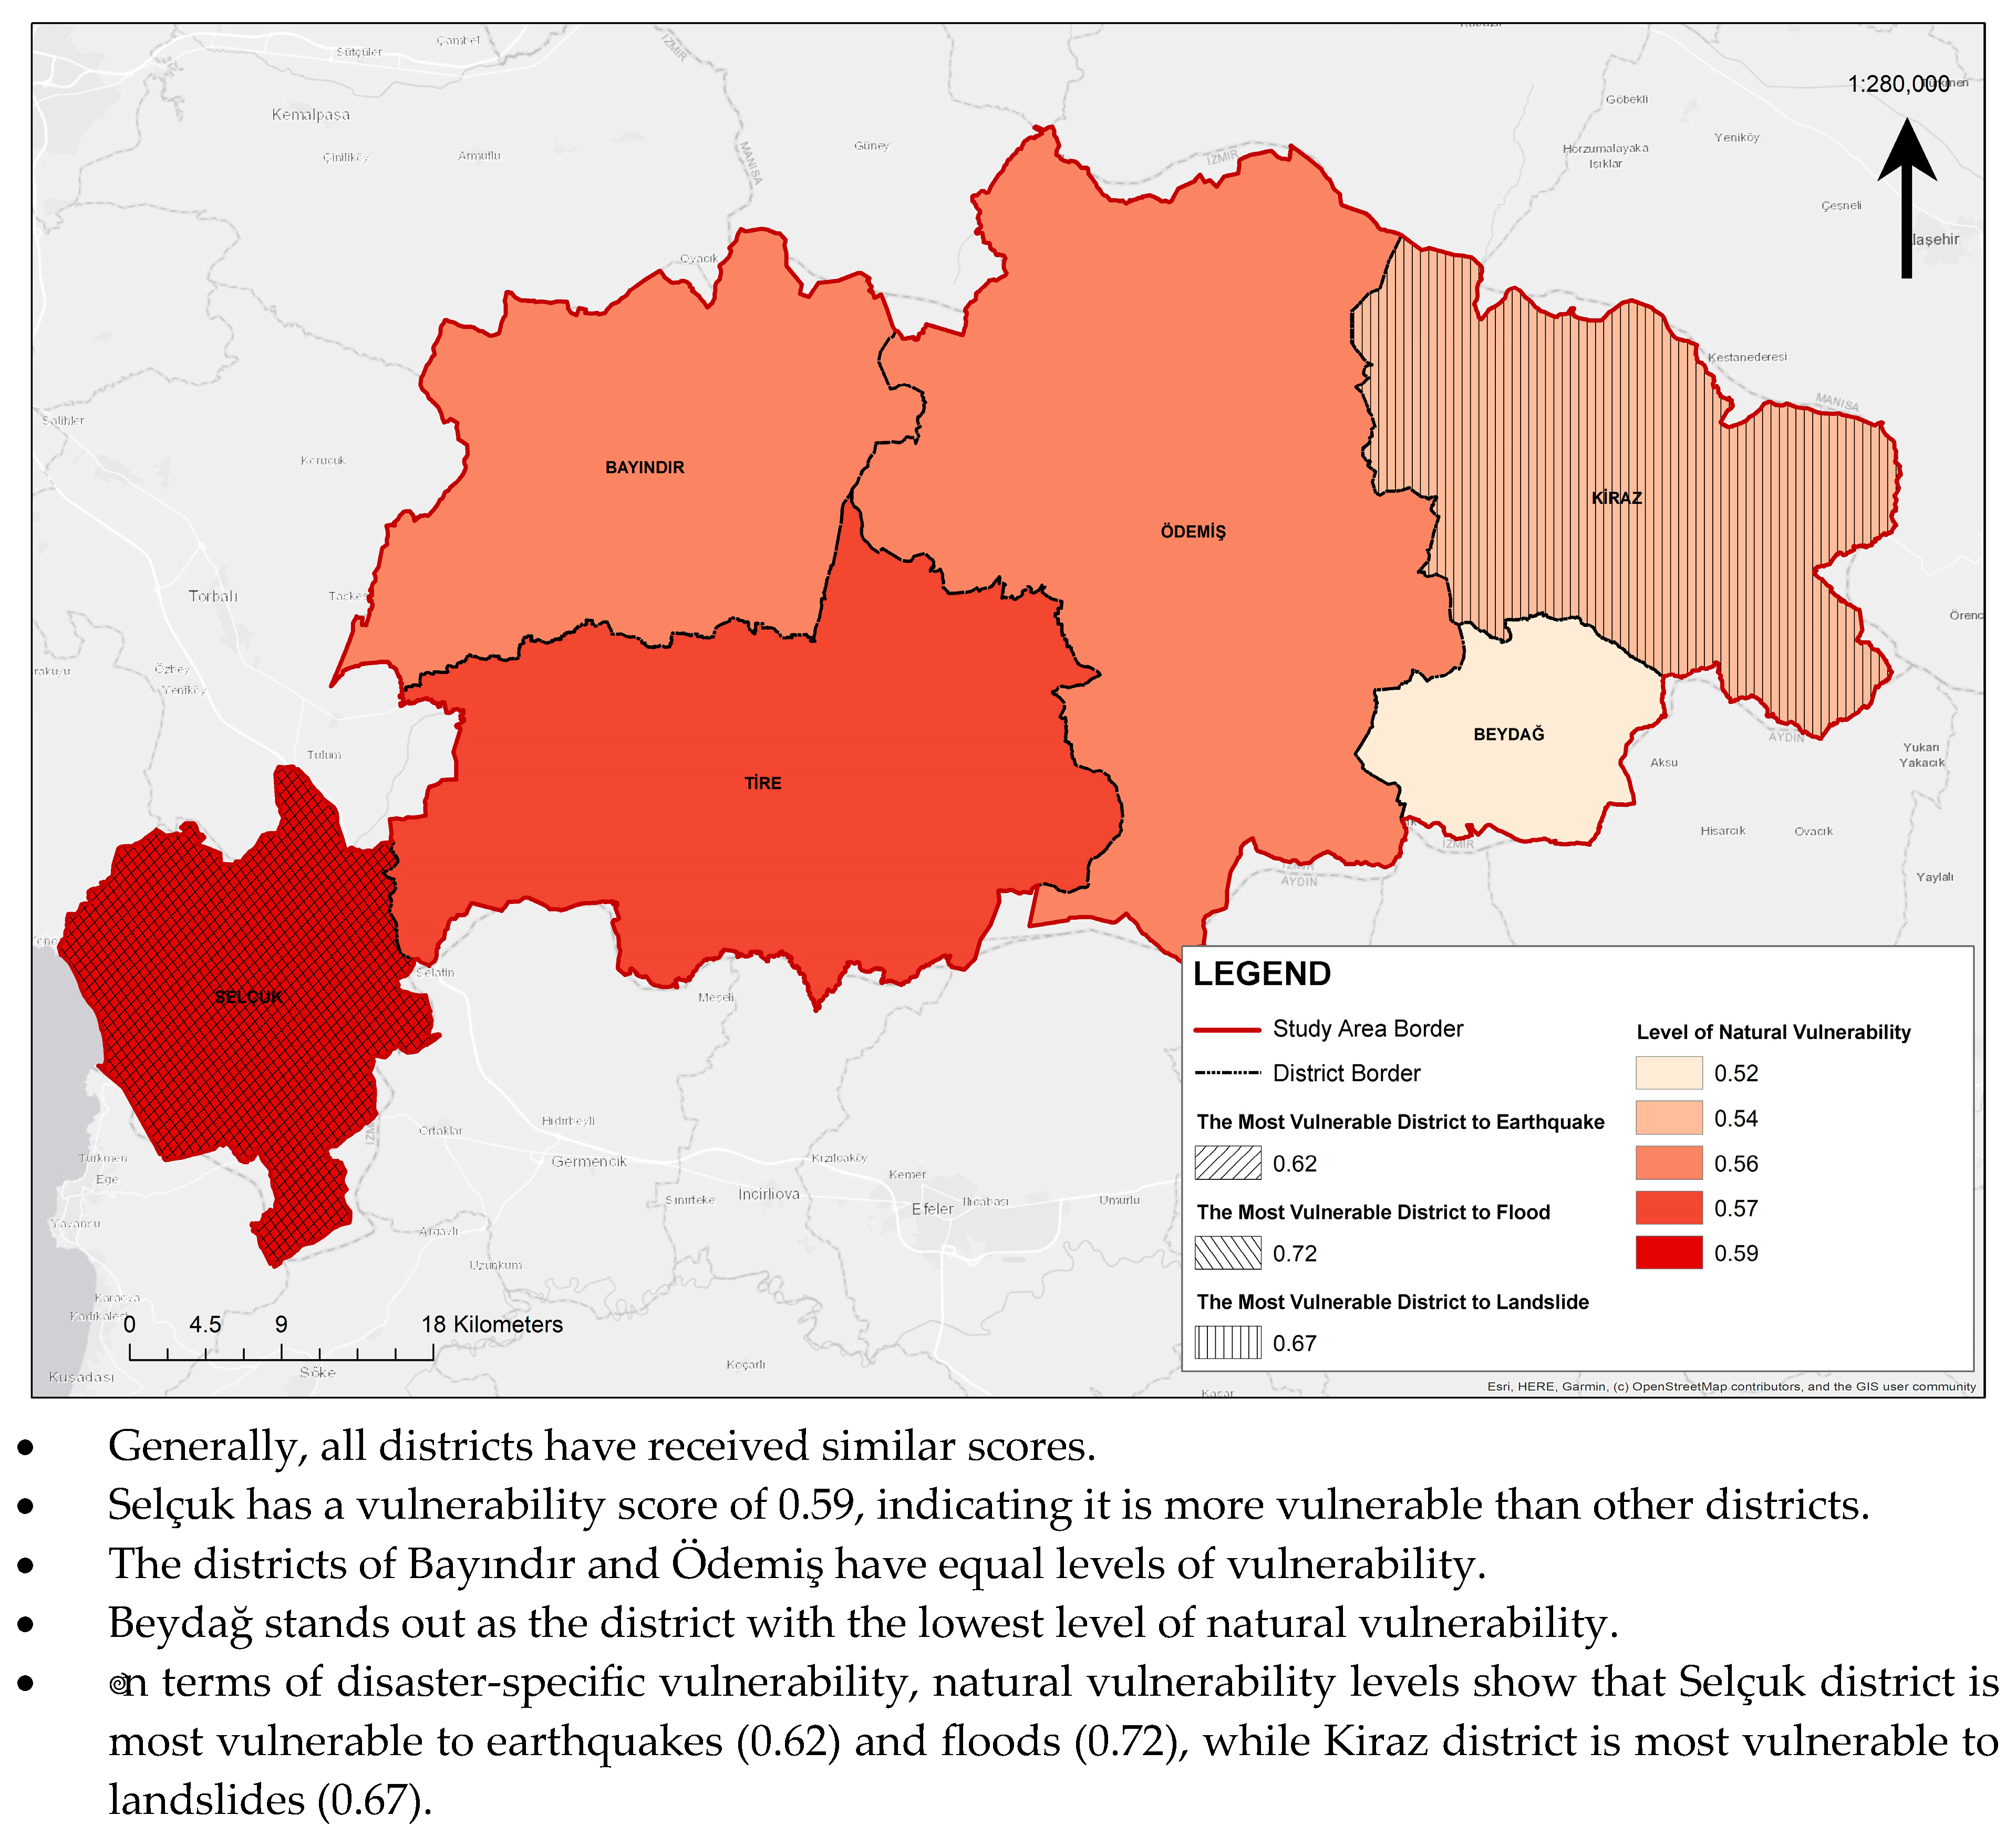
- Natural vulnerability: Selçuk district, located in the far west of the study area, is the most vulnerable (0.59), while Beydağ district, located in the far east, is the least vulnerable (0.52). In addition, Selçuk district is the most vulnerable to earthquakes (0.62) and floods (0.72), while Kiraz district is the most vulnerable to landslides (0.67).
- It has been determined that Ödemiş district is the most vulnerable according to social vulnerability factors, Kiraz district is the most vulnerable according to economic and artificial vulnerability factors, and Selçuk district is the most vulnerable according to natural vulnerability factors.
- Although Bayındır and Selçuk are less vulnerable compared to other districts for all disasters, they should be addressed together.
- Tire district has an equal level of vulnerability to Ödemiş in terms of earthquakes and to Beydağ in terms of landslides, making it the second priority district to be addressed.
Author Contributions
Funding
Conflicts of Interest
References
- Afet ve Acil Durum Yönetimi Başkanlığı [AFAD]. Açıklamalı Afet Yönetimi Terimleri Sözlüğü. 2025. Available online: https://www.afad.gov.tr/aciklamali-afet-yonetimi-terimleri-sozlugu (accessed on 1 February 2025).
- Taubenbock, H.; Post, J.; Roth, A.; Zosseder, K.; Strunz, G.; Dech, S. A conceptual vulnerability and risk framework as outline to identify capabilities of remote sensing. Nat. Hazards Earth Syst. Sci. 2008, 8, 409–420. [Google Scholar] [CrossRef]
- Bankoff, G. Historical concepts of disaster and risk. In Handbook of Hazards and Disaster Risk Reduction; Routledge: Oxfordshire, UK, 2012; pp. 37–47. [Google Scholar]
- Wamsler, C. Cities, Disaster Risk and Adaptation; Routledge: Oxfordshire, UK, 2014. [Google Scholar]
- Mandal, K.; Dey, P. Coastal vulnerability analysis and RIDIT scoring of socio-economic vulnerability indicators–A case of Jagatsinghpur, Odisha. Int. J. Disaster Risk Reduct. 2022, 79, 103143. [Google Scholar] [CrossRef]
- Prelog, A.J.; Miller, L.M. Perceptions of disaster risk and vulnerability in rural Texas. J. Rural Soc. Sci. 2013, 28, 1–24. [Google Scholar]
- Bankoff, G.; Frerks, G.; Hilhorst, D. Mapping Vulnerability: Disasters, Development and People; Routledge: Oxfordshire, UK, 2013. [Google Scholar]
- PennState. Vulnerability to Natural Hazards; Penn State University: University Park, PA, USA, 2023; Available online: https://www.e-education.psu.edu/geog30/node/379 (accessed on 1 February 2025).
- Pelling, M. The Vulnerability of Cities: Natural Disasters and Social Resilience; Routledge: Oxfordshire, UK, 2003; Available online: https://books.google.com.tr/books?id=cjjBdCzB-C0C (accessed on 1 February 2025).
- Birkmann, J. Measuring vulnerability to promote disaster-resilient societies: Conceptual frameworks and definitions. In Measuring Vulnerability to Natural Hazards: Towards Disaster Resilient Societies; United Nations University Press: Tokyo, Japan, 2006; pp. 9–54. [Google Scholar]
- Romshoo, S.A.; Amin, M.; Qazi, A.U.S. Opportunity mapping to inform rural development planning at village level using geospatial techniques. Environ. Dev. Sustain. 2024, 1–32. [Google Scholar] [CrossRef]
- Duzgun, Ş.; Yucemen, S.; Kalaycıoğlu, S.; Celik, K.; Kemeç, S.; Ertugay, K. An integrated earthquake vulnerability assessment framework for urban areas. Nat. Hazards 2011, 59, 917–947. [Google Scholar] [CrossRef]
- McSweeney, K.; Coomes, O.T. Climate-related disaster opens a window of opportunity for rural poor in northeastern Honduras. Proc. Natl. Acad. Sci. USA 2011, 108, 5203–5208. [Google Scholar] [CrossRef]
- Kuriakose, S.L.; Sankar, G.; Muraleedharan, C. History of landslide susceptibility and a chorology of landslide-prone areas in the Western Ghats of Kerala, India. Environ. Geol. 2009, 57, 1553–1568. [Google Scholar] [CrossRef]
- Faizah, S.; Masri, M.; Hapsari, S. Evaluation of GIS-based flood disaster vulnerability level for sustainable settlement planning in Dayeuhkolot District. IOP Conf. Ser. Earth Environ. Sci. 2025, 1462, 012065. [Google Scholar] [CrossRef]
- Şanlı, N.; Varol, F.N.; Ecemiş Kılıç, S.; Efe Güney, M. Planlama kapsamında kentsel risklerin tespiti ve derecelendirilmesine yönelik iki çalışma: Kocaeli örneği. İdealkent 2021, 12, 415–440. [Google Scholar] [CrossRef]
- Altıntaş, G.; Hovardaoğlu, O. Kırsal kırılganlık ve dayanıklı kırsal planlama. Sketch J. City Reg. Plan. 2023, 4, 24–52. [Google Scholar]
- Ari Kovancı, Y. Afet ve kırılgan gruplar. Siirt Üniversitesi Sos. Bilim. Enstitüsü Derg. 2024, 12, 13–30. [Google Scholar] [CrossRef]
- Choo, M.; Yoon, D.K. A meta-analysis of the relationship between disaster vulnerability and disaster damage. Int. J. Disaster Risk Reduct. 2024, 102, 104302. [Google Scholar] [CrossRef]
- Dursun, D.; Yavaş, M. Kentlerin iklim risklerinin ölçülmesinde parametre bazlı değerlendirme modeli. Planlama 2024, 34, 36–57. [Google Scholar] [CrossRef]
- Karakayacı, Ö.; Keser, F. Yeni bölgesel gelişme paradigmalarında dirençli mekanlar olarak kırsal alanlar: Beyşehir (Konya) kırsalı örneği. Coğrafya Derg. 2021, 43, 217–233. [Google Scholar] [CrossRef]
- Rasool, S.; Rana, I.A.; Bin Waseem, H. Assessing multidimensional vulnerability of rural areas to flooding: An index-based approach. Int. J. Disaster Risk Sci. 2024, 15, 88–106. [Google Scholar] [CrossRef]
- Tepecik, A. Kırsal Alanlarda Dirençlilik Meselesi Üzerinde bir Inceleme. In 5. Uluslararası Afet ve Dirençlilik Kongresi; Gebze Teknik Üniversitesi: Gebze, Türkiye, 2023; Available online: https://idrcongress.org/uploads/files/Papers_of_idRc_2023.pdf (accessed on 1 September 2025).
- Bariş, M.E. Effectiveness of Turkish Disaster Management System and Recommendations. Biotechnol. Biotechnol. Equip. 2009, 23, 1391–1398. [Google Scholar] [CrossRef]
- Ülker, V.; Erdoǧan, Ö. Disaster Education and Drills in Turkey: Do We Prepare Ourselves for Unexpected Disasters? Prehospital Disaster Med. 2019, 34, s121. [Google Scholar] [CrossRef]
- Akgul, M.; Akay, A.; Ozocak, M.; Esin, A.; Şenturk, N. A new approach to spatial risk analysis in the long-term (1950–2020) assessment of natural disasters (avalanche, landslide, rockfall, flood) in Turkey. Nat. Hazards 2022, 114, 3471–3508. [Google Scholar] [CrossRef]
- Mavrouli, M.; Mavroulis, S.; Lekkas, E.; Tsakris, A. An Emerging Health Crisis in Turkey and Syria after the Earthquake Disaster on 6 February 2023: Risk Factors, Prevention and Management of Infectious Diseases. Healthcare 2023, 11, 1022. [Google Scholar] [CrossRef]
- Korkmaz, K. Earthquake disaster risk assessment and evaluation for Turkey. Environ. Geol. 2009, 57, 307–320. [Google Scholar] [CrossRef]
- Afet ve Acil Durum Yönetimi Başkanlığı [AFAD]. 06 Şubat 2023 Pazarcık–Elbistan Kahramanmaraş (Mw:7.7–Mw:7.6) Depremleri Raporu. 2023. Available online: https://deprem.afad.gov.tr/assets/pdf/Kahramanmara%C5%9F%20Depremi%20%20Raporu_02.06.2023.pdf (accessed on 1 February 2025).
- Özcan, A.K.; Gökçeoğlu, C. Statistical assessment of geological and geomorphological factors on building damages caused by the February 6, 2023 earthquakes in the Amanos Region of Türkiye. Nat. Hazards Rev. 2025, 26, 04024052. [Google Scholar] [CrossRef]
- Jamshed, A.; Rana, A.; Mirza, M.; Birkman, J. Assessing relationship between vulnerability and capacity: An empirical study on rural flooding in Pakistan. Int. J. Disaster Risk Reduct. 2019, 36, 101109. [Google Scholar] [CrossRef]
- McEntire, D.; Gilmore, C.; Peters, E. Addressing vulnerability through an integrated approach. Int. J. Disaster Resil. Built Environ. 2010, 1, 50–64. [Google Scholar] [CrossRef]
- Drakes, O.; Tate, E.; Rainey, J.; Brody, S. Social vulnerability and short-term disaster assistance in the United States. Int. J. Disaster Risk Reduct. 2021, 53, 102010. [Google Scholar] [CrossRef]
- Tasnuva, A.; Hossain, M.R.; Salam, R.; Islam, A.R.M.T.; Patwary, M.M.; Ibrahim, S.M. Employing social vulnerability index to assess household social vulnerability of natural hazards: An evidence from southwest coastal Bangladesh. Environ. Dev. Sustain. 2021, 23, 10223–10245. [Google Scholar] [CrossRef]
- De Pascale, F. Geoethics and dimensions of vulnerability in Central Africa: The case study of the Democratic Republic of the Congo. AIMS Geosci. 2021, 7, 440–456. [Google Scholar] [CrossRef]
- Blaikie, P.; Cannon, T.; Davis, I.; Wisner, B. At Risk: Natural Hazards, People’s Vulnerability and Disasters, 2nd ed.; 2014. Available online: https://www.preventionweb.net/files/670_72351.pdf (accessed on 1 February 2025).
- Singh, S.R.; Eghdami, M.R.; Singh, S. The concept of social vulnerability: A review from disasters perspectives. Int. J. Interdiscip. Multidiscip. Stud. 2014, 1, 71–82. [Google Scholar]
- Pulwarty, R.S.; Riebsame, W.E. The political ecology of vulnerability to hurricane-related hazards. Clim. Res. 1997, 9, 7–16. [Google Scholar] [CrossRef]
- Alvarez, S.; Bahja, F.; Fyall, A. A framework to identify destination vulnerability to hazards. Tour. Manag. 2022, 90, 104469. [Google Scholar] [CrossRef]
- Yu, Z.; Li, B.; Zhang, X. Social ecological system and vulnerability driving mechanism analysis. Acta Ecol. Sin. 2014, 34, 1870–1879. [Google Scholar] [CrossRef]
- Mwalwimba, I.K. Assessing vulnerability trends and magnitudes in light of human responses to floods in Karonga District, Malawi. Int. J. Sci. Res. 2020, 9, 938–945. [Google Scholar] [CrossRef]
- Intergovernmental Panel on Climate Change (IPCC). Climate Change 2021: The Physical Science Basis. Contribution of Working Group I to the Sixth Assessment Report of the Intergovernmental Panel on Climate Change; Cambridge University Press: Cambridge, UK, 2021. [Google Scholar] [CrossRef]
- Intergovernmental Panel on Climate Change (IPCC). Summary for policymakers. In Climate Change 2023: Synthesis Report. Contribution of Working Groups I, II and III to the Sixth Assessment Report of the Intergovernmental Panel on Climate Change; Lee, H., Romero, J., Eds.; IPCC: Geneva, Switzerland, 2023; pp. 1–34. [Google Scholar] [CrossRef]
- United Nations Office for Disaster Risk Reduction (UNDRR). Sendai Framework for Disaster Risk Reduction 2015–2030; United Nations: New York, NY, USA, 2015; Available online: https://www.undrr.org/publication/sendai-framework-disaster-risk-reduction-2015-2030 (accessed on 1 February 2025).
- Batabyal, A.A. Should population density be used in a social vulnerability index? Econ. Bull. 2023, 43, 102–111. [Google Scholar]
- Bergstrand, K.; Mayer, B.; Brumback, B.; Zhang, Y. Assessing the relationship between social vulnerability and community resilience to hazards. Soc. Indic. Res. 2014, 122, 391–409. [Google Scholar] [CrossRef] [PubMed]
- Cutter, S.L.; Boruff, B.J.; Shirley, W.L. Social vulnerability to environmental hazards. Soc. Sci. Q. 2003, 84, 242–261. [Google Scholar] [CrossRef]
- Cutter, S.L.; Emrich, C.T.; Mitchell, J.T.; Boruff, B.J.; Gall, M.; Schmidtlein, M.C.; Burton, C.G.; Melton, G. The long road home: Race, class, and recovery from Hurricane Katrina. Environ. Sci. Policy Sustain. Dev. 2008, 48, 8–20. [Google Scholar] [CrossRef]
- Deria, R.; Shiferaw, W.; Worku, M. Flood risk assessment using geospatial techniques: A case study in Ethiopia. Int. J. Disaster Risk Reduct. 2020, 50, 101691. [Google Scholar] [CrossRef]
- Ehrlich, D.; Kemper, T.; Pesaresi, M.; Corbane, C.; Florczyk, A.J. Built-up area and population density as input for global disaster risk models. Int. J. Disaster Risk Reduct. 2018, 31, 219–230. [Google Scholar] [CrossRef]
- Isia, I.; Hadibarata, T.; Jusoh, M.N.H.; Bhattacharjya, R.K.; Shahedan, N.F.; Fitriyani, N.L.; Syafrudin, M. Identifying Factors to Develop and Validate Social Vulnerability to Floods in Malaysia: A Systematic Review Study. Sustainability 2023, 15, 12729. [Google Scholar] [CrossRef]
- Devi, K.; Reddy, C.C.; Rahul, K.; Khuntia, J.R.; Das, B.S. A holistic methodology for evaluating flood vulnerability, generating flood risk map and conducting detailed flood inundation assessment. Sci. Rep. 2025, 15, 28253. [Google Scholar] [CrossRef]
- Zhu, X.; Sun, B.; Jin, Z. A new approach on seismic mortality estimations based on average population density. Earthq. Sci. 2016, 29, 337–344. [Google Scholar] [CrossRef]
- Cutter, S.L.; Boruff, B.; Shirley, W.L. Indicators of Social Vulnerability to Hazards [Unpublished Paper]; University of South Carolina, Hazards Research Lab: Columbia, SC, USA, 2001. [Google Scholar]
- Enarson, E.; Morrow, B.H. (Eds.) The Gendered Terrain of Disaster: Through Women’s Eyes; Praeger: Westport, CT, USA, 1998. [Google Scholar]
- Fatema, S.R.; Islam, M.S.; East, L.; Usher, K. Women’s health-related vulnerabilities in natural disasters: A systematic review. Int. J. Disaster Risk Reduct. 2019, 37, 101182. [Google Scholar] [CrossRef]
- Fatouros, D. Gender inequalities in disaster risk reduction: Evidence from low- and middle-income countries. Disasters 2021, 45, 823–846. [Google Scholar] [CrossRef]
- Heinz Center for Science, Economics, and the Environment. Human Links to Coastal Disasters; The H. John Heinz III Center for Science, Economics and the Environment: Washington, DC, USA, 2002. [Google Scholar]
- Ikeda, K. Gender differences in human loss and vulnerability in natural disasters: A case study from Bangladesh. Indian J. Gend. Stud. 1995, 2, 171–193. [Google Scholar] [CrossRef]
- Intergovernmental Panel on Climate Change (IPCC). Climate Change 2022: Impacts, Adaptation, and Vulnerability. Contribution of Working Group II to the Sixth Assessment Report of the IPCC; Cambridge University Press: Cambridge, UK, 2022. [Google Scholar] [CrossRef]
- Neumayer, E.; Plümper, T. The gendered nature of natural disasters: The impact of catastrophic events on the gender gap in life expectancy, 1981–2002. Ann. Assoc. Am. Geogr. 2007, 97, 551–566. [Google Scholar] [CrossRef]
- Nolting, I.K.L.; Morina, N.; Hoppen, T.H.; Tam, K.P.; Kip, A. A meta-analysis on gender differences in prevalence estimates of mental disorders following exposure to natural hazards. Eur. J. Psychotraumatology 2025, 365, 153–167. [Google Scholar] [CrossRef] [PubMed]
- Thurston, A.M.; Stöckl, H.; Ranganathan, M. Natural hazards, disasters and violence against women and girls: A global mixed-methods systematic review. BMJ Glob. Health 2021, 6, e004377. [Google Scholar] [CrossRef] [PubMed]
- UN Women. Gender Dimensions of Disaster Risk and Resilience: Existing Evidence; United Nations Entity for Gender Equality and the Empowerment of Women: New York, NY, USA, 2021; Available online: https://wrd.unwomen.org/sites/default/files/2021-11/Gender-Dimensions-of-Disaster-Risk-and-Resilience-Existing-Evidence.pdf (accessed on 1 February 2025).
- United Nations Office for Disaster Risk Reduction (UNDRR). Disaster Risk Reduction and Climate Change; UNDRR Policy Brief. 2023. Available online: https://www.undrr.org/media/73374/download?startDownload=20250909 (accessed on 1 February 2025).
- Adams, V.; Kaufman, S.R.; van Hattum, T.; Moody, S. Aging disaster: Mortality, vulnerability, and long-term recovery among Katrina survivors. Med. Anthropol. 2011, 30, 247–270. [Google Scholar] [CrossRef]
- Alisic, E.; Zalta, A.K.; van Wesel, F.; Larsen, S.E.; Hafstad, G.S.; Hassanpour, K.; Smid, G.E. Rates of post-traumatic stress disorder in trauma-exposed children and adolescents: Meta-analysis. Br. J. Psychiatry 2014, 204, 335–340. [Google Scholar] [CrossRef]
- Brunkard, J.; Namulanda, G.; Ratard, R. Hurricane Katrina deaths, Louisiana, 2005. Disaster Med. Public Health Prep. 2008, 2, 215–223. [Google Scholar] [CrossRef]
- Cutter, S.L.; Mitchell, J.T.; Scott, M.S. “Revealing the Vulnerability of People and Places: A Case Study of Georgetown County, South Carolina. Ann. Assoc. Am. Geogr. 2000, 90, 713–737. [Google Scholar] [CrossRef]
- Cordone, A.; Fairchild, V.; Cicero, M.X. Impact of natural disasters on children: Key considerations for pediatricians. Pediatr. Rev. 2025, 46, 189–197. [Google Scholar] [CrossRef]
- D’Ippoliti, D.; Michelozzi, P.; Marino, C.; De’Donato, F.; Menne, B.; Katsouyanni, K.; Kirchmayer, U.; Analitis, A.; Medina-Ramón, M.; Paldy, A.; et al. The impact of heat waves on mortality in 9 European cities: Results from the EuroHEAT project. Environ. Health 2010, 9, 37. [Google Scholar] [CrossRef]
- Fothergill, A.; Peek, L. Children of Katrina; University of Texas Press: Austin, TX, USA, 2015. [Google Scholar]
- Fouillet, A.; Rey, G.; Laurent, F.; Pavillon, G.; Bellec, S.; Guihenneuc-Jouyaux, C.; Clavel, J.; Jougla, E.; Hémon, D. Excess mortality related to the August 2003 heat wave in France. Int. Arch. Occup. Environ. Health 2006, 80, 16–24. [Google Scholar] [CrossRef]
- Fujimoto, M.; Hayashi, K.; Nishiura, H. Possible adaptation measures for climate change in preventing heatstroke among older adults in Japan. F. Pub. Health 2023, 11, 1184963. [Google Scholar] [CrossRef]
- Furr, J.M.; Comer, J.S.; Edmunds, J.M.; Kendall, P.C. Disasters and youth: A meta-analytic examination of posttraumatic stress. J. Consult. Clin. Psychol. 2010, 78, 765–780. [Google Scholar] [CrossRef] [PubMed]
- Hiller, R.M.; Meiser-Stedman, R.; Fearon, P.; Lobo, S.; McKinnon, A.; Fraser, A.; Halligan, S.L. Research Review: Changes in the prevalence and symptom severity of child post-traumatic stress disorder in the year following trauma—A meta-analytic study. J. Child Psychol. Psychiatry 2016, 57, 884–898. [Google Scholar] [CrossRef] [PubMed]
- Trickey, D.; Siddaway, A.P.; Meiser-Stedman, R.; Serpell, L.; Field, A.P. A meta-analysis of risk factors for post-traumatic stress disorder in children and adolescents. Clin. Psychol. Rev. 2012, 32, 122–138. [Google Scholar] [CrossRef] [PubMed]
- Parker, G.; Lie, D.; Siskind, D.; Martin-Khan, M.; Raphael, B.; Crompton, D.; Kisely, S. Mental health implications for older adults after natural disasters: A systematic review and meta-analysis. Int. Psychogeriatr. 2016, 28, 11–20. [Google Scholar] [CrossRef]
- Peek, L. Children and disasters: Understanding vulnerability, developing capacities, and promoting resilience—An introduction. Child. Youth Environ. 2008, 18, 1–29. [Google Scholar] [CrossRef]
- Raccanello, D.; Burro, R.; Hall, R. Coping with natural disasters at school: A systematic review. Int. J. Disaster Risk Reduct. 2022, 74, 102903. [Google Scholar] [CrossRef]
- Robine, J.-M.; Cheung, S.L.K.; Le Roy, S.; Van Oyen, H.; Griffiths, C.; Michel, J.-P.; Herrmann, F.R. Death toll exceeded 70,000 in Europe during the summer of 2003. Comptes Rendus Biol. 2008, 331, 171–178. [Google Scholar] [CrossRef]
- Seddighi, H.; Salmani, I.; Javadi, M.H.; Seddighi, S. Child abuse in natural disasters and conflicts: A systematic review. Trauma Violence Abus. 2021, 22, 176–185. [Google Scholar] [CrossRef]
- UNICEF. The Climate Crisis is a Child Rights Crisis: Introducing the Children’s Climate Risk Index; United Nations Children’s Fund: New York, NY, USA, 2021; Available online: https://www.unicef.org/media/105376/file/UNICEF-climate-crisis-child-rights-crisis.pdf (accessed on 1 February 2025).
- United Nations Economic Commission for Europe (UNECE). Older Persons in Emergency Situations (UNECE Policy Brief No. 25). 2020. Available online: https://unece.org/fileadmin/DAM/pau/age/Policy_briefs/ECE_WG1_36_PB25.pdf (accessed on 1 February 2025).
- Yuan, L.; Madaniyazi, L.; Vicedo-Cabrera, A.M.; Ng, C.F.S.; Oka, K.; Chua, P.L.; Ueda, K.; Tobias, A.; Honda, Y.; Hashizume, M. Non-optimal temperature-attributable mortality and morbidity burden by cause, age and sex under climate and population change scenarios: A nationwide modelling study in Japan. Lancet Reg. Health West. Pac. 2024, 52, 101214. [Google Scholar] [CrossRef]
- Doma, H.; Tran, T.; Romero, L.; Makleff, S.; Krishna, R.N.; Varshney, K.; Fisher, J. Effects of natural hazards on early childhood development: A systematic review protocol. BMJ Open 2023, 13, e070068. [Google Scholar] [CrossRef]
- Armaş, I.; Gavriş, A. Social vulnerability assessment using spatial multi-criteria analysis (SEVI model) and the Social Vulnerability Index (SoVI model)—A case study for Bucharest, Romania. Nat. Hazards Earth Syst. Sci. 2013, 13, 1481–1499. [Google Scholar] [CrossRef]
- Flanagan, B.E.; Gregory, E.W.; Hallisey, E.J.; Heitgerd, J.L.; Lewis, B. A social vulnerability index for disaster management. J. Homel. Secur. Emerg. Manag. 2011, 8, 3. [Google Scholar] [CrossRef]
- Fatemi, F.; Ardalan, A.; Aguirre, B.; Mansouri, N.; Mohammadfam, I. Social vulnerability indicators in disasters: Findings from a systematic review. Int. J. Disaster Risk Reduct. 2017, 22, 219–227. [Google Scholar] [CrossRef]
- Heinz Center for Science, Economics, and the Environment. The Hidden Costs of Coastal Hazards: Implications for Risk Assessment and Mitigation; Island Press: Covello, CA, USA, 2000. [Google Scholar]
- Linnekamp, F.; Koedam, A.; Baud, I.S.A. Household vulnerability to climate change: Examining perceptions of households of flood risks in Jakarta, Indonesia. Habitat Int. 2011, 35, 447–456. [Google Scholar] [CrossRef]
- Puente, S. Social Vulnerability to Disaster in Mexico City. In Crucibles of Hazard: Mega-Cities and Disasters in Transition; Mitchell, J.K., Ed.; United Nations University Press: Tokyo, Japan, 1999; pp. 295–334. [Google Scholar]
- Rygel, L.; O’Sullivan, D.; Yarnal, B. A method for constructing a Social Vulnerability Index: An application to hurricane storm surges in a developed country. Mitig. Adapt. Strateg. Glob. Change 2006, 11, 741–764. [Google Scholar] [CrossRef]
- Tavares, A.O.; Barros, J.L.; Freire, P.; Santos, P.P.; Perdiz, L.; Fortunato, A.B. A coastal flooding database from 1980 to 2018 for the continental Portuguese coastal zone. Appl. Geogr. 2021, 135, 102534. [Google Scholar] [CrossRef]
- Rufat, S.; Tate, E.; Burton, C.G.; Maroof, A.S. Social vulnerability to floods: Review of case studies and implications for measurement. Int. J. Disaster Risk Reduct. 2015, 14, 470–486. [Google Scholar] [CrossRef]
- Aksha, S.K.; Juran, L.; Resler, L.M. Spatial and temporal analysis of natural hazard mortality in Nepal. Env. Hazards 2018, 17, 163–179. [Google Scholar] [CrossRef]
- Choi, H.; Kim, J. The influence of demographic structure on disaster damage and recovery. Int. J. Disaster Risk Reduct. 2016, 19, 97–108. [Google Scholar] [CrossRef]
- Tapsell, S.M.; Penning-Rowsell, E.C.; Tunstall, S.M.; Wilson, T.L. Vulnerability to flooding: Health and social dimensions. Philos. Trans. R. Soc. A 2002, 360, 1511–1525. [Google Scholar] [CrossRef]
- Tate, E. Uncertainty analysis for a social vulnerability index. Ann. Assoc. Am. Geogr. 2013, 103, 526–543. [Google Scholar] [CrossRef]
- Briguglio, L.; Cordina, G.; Farrugia, N.; Vella, S. Economic vulnerability and resilience: Concepts and measurements. Oxf. Dev. Stud. 2009, 37, 229–247. [Google Scholar] [CrossRef]
- Briguglio, L. Small island developing states and their economic vulnerabilities. World Dev. 1995, 23, 1615–1632. [Google Scholar] [CrossRef]
- Briguglio, L.; Galea, W. Updating and Augmenting the Economic Vulnerability Index; Occasional Paper, University of Malta: Msida, Malta, 2003. [Google Scholar]
- Chang, S.E. Urban disaster recovery: A measurement framework and its application to the 1995 Kobe earthquake. Disasters 2010, 34, 303–327. [Google Scholar] [CrossRef]
- Cutter, S.L.; Emrich, C.T.; Webb, J.J.; Morath, D.P. Social vulnerability to climate variability hazards: A review of the literature. Final. Rep. Oxfam Am. 2009, 5, 1–44. [Google Scholar]
- Okuyama, Y. Economic modeling for disaster impact analysis: Past, present, and future. Econ. Syst. Res. 2007, 19, 115–124. [Google Scholar] [CrossRef]
- Rose, A. Defining and measuring economic resilience to disasters. Disaster Prev. Manag. 2004, 13, 307–314. [Google Scholar] [CrossRef]
- Bruneau, M.; Chang, S.E.; Eguchi, R.T.; Lee, G.C.; O’Rourke, T.D.; Reinhorn, A.M.; Shinozuka, M.; Tierney, K.; Wallace, W.A.; Von Winterfeldt, D. A framework to quantitatively assess and enhance the seismic resilience of communities. Earthq. Spectra 2003, 19, 733–752. [Google Scholar] [CrossRef]
- Pelling, M.; Uitto, J.I. Small island developing states: Natural disaster vulnerability and global change. Environ. Hazards 2001, 3, 49–62. [Google Scholar] [CrossRef]
- Skidmore, M.; Toya, H. Do natural disasters promote long-run growth? Econ. Inq. 2002, 40, 664–687. [Google Scholar] [CrossRef]
- Chang, S.E. Disasters and transport systems: Loss, recovery and competition at the Port of Kobe after the 1995 earthquake. J. Transp. Geogr. 2000, 8, 53–65. [Google Scholar] [CrossRef]
- Chang, S.E.; Miles, S.B. The dynamics of recovery: A general framework. In Modeling Spatial and Economic Impacts of Disasters; Okuyama, Y., Chang, S.E., Eds.; Springer: Berlin/Heidelberg, Germany, 2004; pp. 181–204. [Google Scholar] [CrossRef]
- Chang, S.E.; Nojima, N. Measuring post-disaster transportation system performance: The 1995 Kobe earthquake in comparative perspective. Transp. Res. Part A Policy Pract. 2001, 35, 475–494. [Google Scholar] [CrossRef]
- Donovan, B.; Work, D.B. Empirically quantifying city-scale transportation resilience to extreme events. Transp. Res. Part C Emerg. Technol. 2017, 79, 333–346. [Google Scholar] [CrossRef]
- Kermanshah, A.; Derrible, S. Robustness of road systems to extreme flooding: Using elements of GIS, travel demand, and network science. Nat. Hazards 2017, 86, 151–164. [Google Scholar] [CrossRef]
- Koks, E.E.; Rozenberg, J.; Zorn, C.; Tariverdi, M.; Vousdoukas, M.; Fraser, S.A.; Hall, J.W.; Hallegatte, S. A global multi-hazard risk analysis of road and railway infrastructure assets. Nat. Commun. 2019, 10, 2677. [Google Scholar] [CrossRef]
- Mattsson, L.-G.; Jenelius, E. Vulnerability and resilience of transport systems—A discussion of recent research. Transp. Res. Part A Policy Pract. 2015, 81, 16–34. [Google Scholar] [CrossRef]
- Taylor, M.A.P.; Sekhar, S.V.C.; D’Este, G.M. Application of accessibility based methods for vulnerability analysis of strategic road networks. Netw. Spat. Econ. 2006, 6, 267–291. [Google Scholar] [CrossRef]
- Ajtai, I.; Ștefănie, H.; Maloș, C.; Botezan, C.; Radovici, A.; Bizău-Cârstea, M.; Baciu, C. Mapping social vulnerability to floods. A comprehensive framework using a vulnerability index approach and PCA analysis. Ecol. Indic. 2023, 154, 110838. [Google Scholar] [CrossRef]
- Aykut, F.; Tezcan, D. Evaluating sea level rise impacts on the southeastern Türkiye coastline: A coastal vulnerability perspective. PFG–J. Photogramm. Remote Sens. Geoinf. Sci. 2024, 92, 335–352. [Google Scholar] [CrossRef]
- Evren, M.B. Taşkın risk yönetim stratejilerinin SEÇTİK (STAPLEE) modeli ile değerlendirilmesi: Edirne. Kırklareli Üniversitesi Mimar. Fakültesi Derg. 2023, 1, 73–86. [Google Scholar]
- Fox, S.; Agyemang, F.; Hawker, L.; Neal, J. Integrating social vulnerability into high-resolution global flood risk mapping. Nat. Commun. 2024, 15, 3155. [Google Scholar] [CrossRef]
- Intergovernmental Panel on Climate Change (IPCC). IPCC Special Report on the Ocean and Cryosphere in a Changing Climate (SROCC), Chapter 4: Sea Level Rise and Implications for Low-Lying Islands, Coasts and Communities; Cambridge University Press: Cambridge, UK, 2019. [Google Scholar] [CrossRef]
- Jongman, B.; Winsemius, H.C.; Aerts, J.C.; Coughlan de Perez, E.; Van Aalst, M.K.; Kron, W.; Ward, P.J. Declining vulnerability to river floods and the global benefits of adaptation. Proc. Natl. Acad. Sci. USA 2015, 112, E2271–E2280. [Google Scholar] [CrossRef]
- Özşahin, E. Havsa (Edirne) ilçesinde taşkın tehlike duyarlılığının değerlendirilmesi. In Her Yönüyle Havsa (ss. 711–732); Tan, M., Erdoğan, T., Eds.; Paradigma Akademi Yayınları: Çanakkale, Türkiye, 2022. [Google Scholar]
- Roukounis, C.N.; Tsihrintzis, V.A. Indices of coastal vulnerability to climate change: A review. Environ. Process. 2022, 9, 29. [Google Scholar] [CrossRef]
- Şenol Balaban, M. An Assessment of Flood Risk Factors in Riverine Cities of Turkey: Lessons for Resilience and Urban Planning. ODTÜ Mimar. Fakültesi Derg. 2016, 33, 45–71. [Google Scholar] [CrossRef]
- Wu, S.Y.; Yarnal, B.; Fisher, A. Vulnerability of coastal communities to sea-level rise: A case study of Cape May County, New Jersey, USA. Clim. Res. 2002, 22, 255–270. [Google Scholar] [CrossRef]
- Boeing, G.; Ha, S. Resilient by design: Simulating street network disruptions across every urban area in the world. arXiv 2024, arXiv:2403.10636. [Google Scholar] [CrossRef]
- Barrington-Leigh, C.; Millard-Ball, A. Global trends toward urban street-network sprawl. Proc. Natl. Acad. Sci. USA 2020, 117, 1941–1950. [Google Scholar] [CrossRef]
- Bostenaru Dan, M. Earthquake impact on settlements: The role of urban and building scales. Nat. Hazards Earth Syst. Sci. 2015, 15, 2283–2297. [Google Scholar] [CrossRef]
- Brody, S.D.; Kim, H.; Gunn, J. Examining the impacts of development patterns on flooding on the Gulf of Mexico Coast. Urban Stud. 2013, 50, 789–806. [Google Scholar] [CrossRef]
- Brody, S.D.; Zahran, S.; Highfield, W.E.; Grover, H.; Vedlitz, A. The rising costs of floods: Examining the impact of planning and development decisions on property damage in Florida. J. Am. Plan. Assoc. 2007, 73, 330–345. [Google Scholar] [CrossRef]
- Faraji Sabokbar, H.; Badri, S.A.; Tahmasebi, B. Spatial assessment of vulnerability to earthquake in rural settlements using a fuzzy inference system: Case study of rural settlements in the Tehran Metropolitan Area. J. Sustain. Rural Dev. 2021, 5, 175–188. [Google Scholar]
- Gerçek, D.; Güven, İ.T. Urban earthquake vulnerability assessment and mapping at the microscale based on the catastrophe progression method. Int. J. Disaster Risk Sci. 2023, 14, 768–781. [Google Scholar] [CrossRef]
- He, C.; Huang, Q.; Bai, X.; Robinson, D.T.; Shi, P.; Dou, Y.; Zhang, H. A global analysis of the relationship between urbanization and fatalities in earthquake-prone areas. Int. J. Disaster Risk Sci. 2021, 12, 805–820. [Google Scholar] [CrossRef]
- Hsu, A.; Sheriff, G.; Chakraborty, T.; Manya, D. Disproportionate exposure to urban heat island intensity across major US cities. Nat. Commun. 2021, 12, 2721. [Google Scholar] [CrossRef]
- Kang, S. Urban form and natural hazards: Exploring the dual aspect concept of the impact of urban forms on flood damage. Sustainability 2021, 13, 9007. [Google Scholar] [CrossRef]
- Li, C.; Brody, S.D.; Kim, H.; Highfield, W.E. Urban form and flood risk: Evidence from insurance claims data in Miami, Florida. J. Plan. Educ. Res. 2024. Advance online publication. [Google Scholar] [CrossRef]
- Radeloff, V.C.; Helmers, D.P.; Kramer, H.A.; Mockrin, M.H.; Alexandre, P.M.; Bar-Massada, A.; Butsic, V.; Hawbaker, T.J.; Martinuzzi, S.; Syphard, A.D.; et al. Rapid growth of the US wildland–urban interface raises wildfire risk. Proc. Natl. Acad. Sci. USA 2018, 115, 3314–3319. [Google Scholar] [CrossRef] [PubMed]
- Spyratos, V.; Bourgeau-Chavez, L.L.; Gauthier, S. Development at the wildland–urban interface and the mitigation of forest-fire risk. Proc. Natl. Acad. Sci. USA 2007, 104, 14272–14276. [Google Scholar] [CrossRef]
- Stone, B.; Hess, J.J.; Frumkin, H. Urban form and extreme heat events: Are sprawling cities more vulnerable? Environ. Health Perspect. 2010, 118, 1425–1428. [Google Scholar] [CrossRef]
- Abdel Raheem, S.E.; Ahmed, M.M.; Hayashikawa, T. Seismic pounding effects on adjacent buildings in series with different alignment configurations. Steel Compos. Struct. 2018, 28, 289–308. [Google Scholar] [CrossRef]
- Fayaz, M. Earthquake vulnerability assessment of the built environment: The role of urban morphology. Nat. Hazards Earth Syst. Sci. 2022, 23, 1593–1610. [Google Scholar] [CrossRef]
- Formisano, A. An overview on seismic analysis of masonry building aggregates. Front. Built Environ. 2022, 8, 966281. [Google Scholar] [CrossRef]
- Liu, Y. Seismic vulnerability assessment at urban scale using data-driven approaches. Int. J. Disaster Risk Reduct. 2019, 38, 101211. [Google Scholar] [CrossRef]
- Mavroulis, S.; Argyropoulos, I.; Vassilakis, E.; Carydis, P.; Lekkas, E. Earthquake environmental effects and building properties controlling damage caused by the 6 February 2023 earthquakes in East Anatolia. Geosciences 2023, 13, 303. [Google Scholar] [CrossRef]
- Özkaynak Yolcu, M.; Özdemir, Z. Afet riski altındaki kırılgan bölgelerde kentsel dönüşümü yeniden düşünmek: Amasya kenti üzerinden bir değerlendirme. Kentsel Dönüşüm Araştırmaları Derg. 2025, 4, 45–67. [Google Scholar] [CrossRef]
- Pinasco, S.; Lagomarsino, S.; Oneto, L.; Coraddu, A.; Cattari, S. Training and validation of a machine learning model for seismic vulnerability of masonry buildings in aggregate and selection of key parameters. Structures. 2025, 80, 109773. [Google Scholar] [CrossRef]
- Torres, Y.; Arranz, J.J.; Gaspar-Escribano, J.M.; Haghi, A.; Martinez-Cuevas, S.; Benito, B.; Ojeda, J.C. Integration of LiDAR and multispectral images for exposure and earthquake vulnerability estimation: Application in Lorca, Spain. Int. J. Appl. Earth Obs. Geoinf. 2019, 81, 161–175. [Google Scholar] [CrossRef]
- Anajafi, H.; Medina, R.A. The effect of number of stories on the seismic performance of buildings: A probabilistic assessment. Eng. Struct. 2018, 168, 778–790. [Google Scholar] [CrossRef]
- Chan, F.K.S.; Griffiths, J.A.; Higgitt, D.; Xu, S.Y.; Zhu, F.; Tang, Y.-T.; Xu, Y.; Thorne, C.R. Influence of urban morphology on pluvial flooding in high-density cities. Landsc. Urban Plan. 2021, 209, 104046. [Google Scholar] [CrossRef]
- Farsi, M.; Mossaiby, F.; Hamidi, H. Influence of building height on seismic vulnerability using fragility curves. Soil Dyn. Earthq. Eng. 2021, 144, 106675. [Google Scholar] [CrossRef]
- Kappes, M.S.; Papathoma-Köhle, M.; Keiler, M. Assessing physical vulnerability for multi-hazards using an indicator-based methodology. Appl. Geogr. 2012, 32, 577–590. [Google Scholar] [CrossRef]
- Kassem, M.M.; Nazri, F.M.; Farsangi, E.N. The seismic vulnerability assessment methodologies: A state-of-the-art review. Ain Shams Eng. J. 2020, 11, 849–864. [Google Scholar] [CrossRef]
- Li, Z.; Guo, S.; Liu, C.; Xu, Y. Impact of building configuration on flood vulnerability in urban areas. Water 2019, 11, 1648. [Google Scholar] [CrossRef]
- Applied Technology Council. Tall Buildings Safety Strategy (Technical Report). City and County of San Francisco: San Francisco, CA, USA, 2019; Available online: https://www.onesanfrancisco.org/sites/default/files/inline-files/San%20Francisco%20Tall%20Buildings%20Safety%20Strategy_June%202019.pdf (accessed on 1 February 2025).
- Papathoma-Köhle, M.; Gems, B.; Sturm, M.; Fuchs, S. Matrices, curves and indicators: A review of approaches to assess physical vulnerability to debris flows. Earth-Sci. Rev. 2017, 171, 272–288. [Google Scholar] [CrossRef]
- Peng, C.; Zhang, L. Relationship between building height and seismic vulnerability: Case study of Wenchuan Earthquake. Nat. Hazards 2020, 104, 729–747. [Google Scholar] [CrossRef]
- Yadav, N.; Singh, A.; Bhati, S.; Tiwari, P.; Yadav, V. Systematic exploration of heat-wave impact on mortality at intra-urban scales. Sustain. Cities Soc. 2023, 97, 104892. [Google Scholar] [CrossRef]
- Gao, C.; Zhang, B.; Shao, S.; Hao, M.; Zhang, Y.; Xu, Y.; Kuang, Y.; Dong, L.; Wang, Z. Risk assessment and zoning of flood disaster in Wuchengxiyu Region, China. Urban Clim. 2023, 49, 101562. [Google Scholar] [CrossRef]
- Aitsi-Selmi, A.; Murray, V.; Wannous, C.; Dickinson, C.; Johnston, D.; Kawasaki, A.; Stevance, A.S.; Yeung, T. Reflections on a science and technology agenda for 21st century disaster risk reduction. Int. J. Disaster Risk Sci. 2016, 7, 1–29. [Google Scholar] [CrossRef]
- Toprak, S.; Uckan, M.E.; Yilmaz, M.T.; Cuceoglu, F.; Gumusay, M.U.; Nacaroglu, E.; Kaya, E.S.; Aksel, M. Performance of hydraulic structures, lifelines and industrial structures during October 30, 2020 Samos-Aegean sea earthquake. Bull. Earthq. Eng. 2022, 20, 7907–7931. [Google Scholar] [CrossRef]
- Ganin, A.A.; Kitsak, M.; Marchese, D.; Keisler, J.; Seager, T.; Linkov, I. Resilience and efficiency in transportation and water distribution networks. Sci. Adv. 2017, 3, e1701079. [Google Scholar] [CrossRef]
- Johnston, D.; Becker, J.; Paton, D. Evaluating disaster resilience: The impact of water and sanitation systems. Int. J. Disaster Risk Reduct. 2014, 10, 327–340. [Google Scholar] [CrossRef]
- Nawrotzki, R.J.; DeWaard, J. Putting trapped populations into place: Climate change and inter-district migration flows in Zambia. Reg. Environ. Change 2018, 533–546. [Google Scholar] [CrossRef]
- UN-Habitat. World Cities Report 2016: Urbanization and Development—Emerging Futures; UN-Habitat: Nairobi, Kenya, 2016. [Google Scholar]
- Balk, D.; Montgomery, M.R.; McGranahan, G.; Kim, D.; Mara, V.; Todd, M.; Buettner, T.; Dorelien, A. Mapping urban settlements and the risks of climate change in Africa, Asia and South America. In Population Dynamics and Climate Change; Guzmán, J.M., Martine, G., McGranahan, G., Schensul, D., Tacoli, C., Eds.; UNFPA: New York, NY, USA; IIED: London, UK, 2009; pp. 80–103. [Google Scholar]
- Glavovic, B.; Dawson, R.; Chow, W.; Garschagen, M.; Haasnoot, M.; Singh, C.; Thomas, A. Cross-Chapter Paper 2: Cities and Settlements by the Sea. In Climate Change 2022: Impacts, Adaptation and Vulnerability; Contribution of Working Group II to the Sixth Assessment Report of the Intergovernmental Panel on Climate Change; Pörtner, H.-O., Roberts, D.C., Tignor, M., Poloczanska, E.S., Mintenbeck, K., Alegría, A., Craig, M., Langsdorf, S., Löschke, S., Möller, V., et al., Eds.; Cambridge University Press: Cambridge, UK, 2022; pp. 2163–2194. [Google Scholar] [CrossRef]
- Hallegatte, S.; Green, C.; Nicholls, R.J.; Corfee-Morlot, J. Future flood losses in major coastal cities. Nat. Clim. Change 2013, 3, 802–806. [Google Scholar] [CrossRef]
- Hanson, S.; Nicholls, R.J.; Ranger, N.; Hallegatte, S.; Corfee-Morlot, J.; Herweijer, C.; Chateau, J. A global ranking of port cities with high exposure to climate extremes. Clim. Change 2011, 104, 89–111. [Google Scholar] [CrossRef]
- Kulp, S.A.; Strauss, B.H. New elevation data triple estimates of global vulnerability to sea-level rise and coastal flooding. Nat. Commun. 2019, 10, 4844. [Google Scholar] [CrossRef] [PubMed]
- MacManus, K.; Balk, D.; Engin, H.; McGranahan, G.; Inman, R. Estimating population and urban areas at risk of coastal hazards, 1990–2015: How data choices matter. Earth Syst. Sci. Data 2021, 13, 5747–5801. [Google Scholar] [CrossRef]
- McGranahan, G.; Balk, D.; Anderson, B. The rising tide: Assessing the risks of climate change and human settlements in low elevation coastal zones. Environ. Urban. 2007, 19, 17–37. [Google Scholar] [CrossRef]
- Oppenheimer, M.; Glavovic, B.C.; Hinkel, J.; van de Wal, R.; Magnan, A.K.; Abd-Elgawad, A.; Cai, R.; Cifuentes-Jara, M.; DeConto, R.M.; Ghosh, T.; et al. Sea level rise and implications for low-lying islands, coasts and communities. In IPCC Special Report on the Ocean and Cryosphere in a Changing Climate; Pörtner, H.-O., Roberts, D.C., Masson-Delmotte, V., Zhai, P., Tignor, M., Poloczanska, E., Mintenbeck, K., Alegría, A., Nicolai, M., Okem, A., et al., Eds.; Cambridge University Press: Cambridge, UK, 2019; pp. 321–445. [Google Scholar] [CrossRef]
- Vousdoukas, M.I.; Athanasiou, P.; Giardino, A.; Mentaschi, L.; Stocchino, A.; Kopp, R.E.; Menéndez, P.; Beck, M.W.; Ranasinghe, R.; Feyen, L. Small Island Developing States under threat by rising seas even in a 1.5 °C warming world. Nat. Sustain. 2023, 6, 1552–1564. [Google Scholar] [CrossRef]
- Diriba, D. Flood hazard analysis using remote sensing and GIS-based multi-criteria decision-making techniques. Geomat. Nat. Hazards Risk 2024, 15, 2361813. [Google Scholar] [CrossRef]
- Jeong, S. Examining vulnerability factors to natural disasters with a spatial regression model. Sustainability 2018, 10, 1651. [Google Scholar] [CrossRef]
- Kamal, A.S.M.M.; Rahman, M.A.; Alam, M.S. Assessing landslide disaster risk from slope failure: A cross-disciplinary approach. Nat. Hazards 2023. Advance online publication. [Google Scholar] [CrossRef]
- Kang, D.; Zhou, Y.; Wang, Y.; Zhang, L. Study on landslide hazard risk in Wenzhou based on slope units. Sci. Rep. 2025, 15, 91669. [Google Scholar] [CrossRef]
- Mulu, A. Identification of flood vulnerability areas using analytical hierarchy process and geospatial techniques. Sci. Rep. 2025, 15, 13822. [Google Scholar] [CrossRef] [PubMed]
- Raj, D. Seismic fragility analysis of coupled building–slope systems. Earthq. Eng. Struct. Dyn. 2024, 53, 873–889. [Google Scholar] [CrossRef]
- Schwarz, I. Flood vulnerability assessment and mapping using geospatial techniques: A case study. Remote Sens. 2022, 14, 4894. [Google Scholar] [CrossRef]
- Thanapackiam, P.; Khairulmaini, O.S.; Fauza, A.G. Vulnerability and adaptive capacities to slope failure threat: A study of the Klang Valley Region. Nat. Hazards 2012, 62, 805–826. [Google Scholar] [CrossRef]
- Yılmaz, M.; Alemdar, K.D. Multi-criteria flood risk mapping in Yakutiye, Erzurum, Türkiye. Environ. Earth Sci. 2025, 84, 12393. [Google Scholar] [CrossRef]
- Yiheng, W.; Peng, L.; Ming, L. Unlocking seismic slope stability for risk assessment. MethodsX 2024, 12, 103108. [Google Scholar] [CrossRef]
- Cheng, X.; Fang, Z.; Lin, G.; Li, C.; Huang, H. Seismic vulnerability analysis of the interaction system of saturated soft soil and subway station structures. Sci. Rep. 2023, 13, 7591. [Google Scholar] [CrossRef]
- Işık, E.; Avcil, F.; Büyüksaraç, A.; Arkan, E.; Harirchian, E. Impact of local soil conditions on the seismic performance of reinforced concrete structures: In the context of the 2023 Kahramanmaraş earthquakes. Appl. Sci. 2025, 15, 2389. [Google Scholar] [CrossRef]
- National Research Council. Practical Lessons from the Loma Prieta Earthquake; The National Academies Press: Washington, DC, USA, 1994. [CrossRef]
- Oliveira, L.; Costa, A.; Pinto, P.; Sousa, M.L.; Matildes, R. Seismic site effects in Lisbon: The role of complex geological settings. Bull. Earthq. Eng. 2024. Advance online publication. [Google Scholar] [CrossRef]
- Pavel, F.; Vladut, R.; Farsangi, E.N. Correlation of Soil Conditions with Seismic Damage of Structures in Craiova, Romania. Pract. Period. Struct. Des. Constr. 2024, 29, 05024003. [Google Scholar] [CrossRef]
- Semblat, J.-F.; Duval, A.-M.; Dangla, P. Seismic site effects in a deep alluvial basin: Numerical analysis by the boundary element method. Comput. Geotech. 2009, 29, 573–585. [Google Scholar] [CrossRef]
- Tran, T.X.; Nguyen, N.H.; Nguyen, D.T.; Ho, T.D. A spatial landslide risk assessment based on hazard and vulnerability mapping: A case study in Son La, Vietnam. Sustainability 2024, 16, 9574. [Google Scholar] [CrossRef]
- Uyanık, O. Seismic microzonation and geotechnical modeling studies. Earth Space Sci. 2024, 11, e2023EA003460. [Google Scholar] [CrossRef]
- Pandey, R.; Kumar, P.; Sahu, N. Socio-ecological vulnerability to climate change: A case study of forest-dependent communities in India. Environ. Dev. 2017, 21, 39–50. [Google Scholar]
- Ansari, A. Fuzzy synthetic approach for seismic risk assessment of bridges: The role of proximity to fault rupture. Sci. Rep. 2025, 15, 98277. [Google Scholar] [CrossRef]
- Champion, C.; Liel, A. The effect of near-fault directivity on building seismic collapse risk. Earthq. Eng. Struct. Dyn. 2012, 41, 207–240. [Google Scholar] [CrossRef]
- Khoshnoud, A.; Shafieezadeh, A. A decision-making framework for seismic risk assessment of gas infrastructure considering fault line proximity. Front. Built Environ. 2025, 11, 1569624. [Google Scholar] [CrossRef]
- McDonald, G.N. Fault Trace Mapping and Surface-Fault-Rupture Special Study Zone Delineation of the Wasatch Fault Zone, Utah and Idaho; Utah Geological Survey Report of Investigation No. 280; USGS: Salt Lake City, UT, USA, 2020. [CrossRef]
- Zengin, E.; Bozorgnia, Y.; Stewart, J.P. Evaluating the Seismic Vulnerability and Resilience of BART’s Berkeley Hills Tunnel that intersects the Hayward Fault; UCLA ITS Technical Report; UC ITS: Berkeley, CA, USA, 2025; Available online: https://escholarship.org/uc/item/6r54s37t (accessed on 1 September 2025). [CrossRef]
- Caldas, A.M.; Pissarra, T.C.T.; Costa, R.C.A.; Neto, F.C.R.; Zanata, M.; Pissarra, R.D.B.V.; Sanches Fernandes, L.F.; Pacheco, F.A.L. Flood vulnerability, environmental land use conflicts, and conservation of soil and water: A study in the Batatais SP municipality, Brazil. Water 2018, 10, 1357. [Google Scholar] [CrossRef]
- Saco, P.M.; Moreno-de las Heras, M.; Willgoose, G.R.; Hancock, G.R.; Rodríguez, J.F.; Bouchet, R.J. The role of soils in the regulation of hazards and extreme events. Sci. Total Environ. 2021, 755 Pt 1, 142569. [Google Scholar] [CrossRef]
- Sharma, L.P.; Patel, N.; Debnath, P.K.; Ghose, M.K. Assessing landslide vulnerability from soil characteristics—A GIS-based analysis. Arab. J. Geosci. 2010, 5, 789–796. [Google Scholar] [CrossRef]
- Agnoletti, M.; Conti, L.; Frezza, L.; Santoro, A. Terraced landscapes and hydrogeological risk: Effects of land abandonment in Cinque Terre (Italy) and implications for conservation. Sustainability 2019, 11, 235. [Google Scholar] [CrossRef]
- Bordoni, M.; Meisina, C.; Valentino, R.; Luino, F.; Turconi, L. Estimation of the susceptibility of a road network to shallow landslides triggered by rainfall in a hilly area using the generalized additive model. Nat. Hazards Earth Syst. Sci. 2018, 18, 1735–1758. [Google Scholar] [CrossRef]
- Murgia, I.; Rossi, M.; Marchesini, I.; Alvioli, M.; Guzzetti, F. Effects of land cover changes on shallow landslide susceptibility. Land 2024, 13, 1575. [Google Scholar] [CrossRef]
- Pacheco Quevedo, R.; Cepeda, J.; Hidalgo, C. Land use and land cover as a conditioning factor in landslide susceptibility: A literature review. Landslides 2023, 20, 1171–1188. [Google Scholar] [CrossRef]
- Pepe, G.; Mandarino, A.; Raso, E.; Scarpellini, P.; Brandolini, P.; Cevasco, A. Investigation on farmland abandonment of terraced slopes using multitemporal data sources, GIS techniques and landscape metrics. Water 2019, 11, 1552. [Google Scholar] [CrossRef]
- Persichillo, M.G.; Bordoni, M.; Meisina, C.; Valentino, R.; Luino, F. Shallow landslides susceptibility assessment in different geo-environmental settings: Comparison between statistical and deterministic methods. Geomat. Nat. Hazards Risk 2017, 8, 448–473. [Google Scholar] [CrossRef]
- Schilirò, L.; Capparelli, G.; Versace, P. Shallow landslide initiation on terraced slopes: Modelling and monitoring. Geomat. Nat. Hazards Risk 2018, 9, 1789–1816. [Google Scholar] [CrossRef]
- Shen, S.; Yang, Q.; Li, Z. Assessment of social vulnerability to natural hazards in China. Int. J. Disaster Risk Reduct. 2018, 27, 507–520. [Google Scholar]
- Singh, O.; Kumar, M. Development of a composite climate vulnerability index for agricultural communities in India. Environ. Dev. 2020, 33, 100504. [Google Scholar]
- Spirkova, D.; Mura, L.; Stehlikova, B.; Hruska, R. Quantification of economic, ecological and social impacts of climate change in the EU. Eur. J. Interdiscip. Stud. 2022, 14, 63–81. [Google Scholar] [CrossRef]
- Islam, M.M.; Lim, S. Vulnerability modeling for disaster risk management. Nat. Hazards 2015, 79, 1621–1640. [Google Scholar]
- OECD. Handbook on Constructing Composite Indicators: Methodology and User Guide; OECD Publishing: Paris, France, 2008. [Google Scholar] [CrossRef]
- Saisana, M.; Tarantola, S. State-of-the-Art Report on Current Methodologies and Practices for Composite Indicator Development; European Commission, Joint Research Centre, Institute for the Protection and the Security of the Citizen: Ispra, Italy, 2002. [Google Scholar]
- Saltelli, A.; Ratto, M.; Tarantola, S.; Campolongo, F. Sensitivity Analysis in Practice: A Guide to Assessing Scientific Models; Wiley: Hoboken, NJ, USA, 2007. [Google Scholar]
- UNDP. Human Development Report 2010: The Real Wealth of Nations—Pathways to Human Development; Palgrave Macmillan: New York, NY, USA, 2010. [Google Scholar]
- İzmir Metropolitan Municipality (İMM). Explanatory Report of the 1/25,000 Scale Master Development Plan for the Eastern Region of İzmir, İzmir, Türkiye. 2017. Available online: https://www.izmir.bel.tr/YuklenenDosyalar/NazimImarPlani/2809224_16568.pdf (accessed on 1 September 2025).
- Türkiye Statistic Institute (TSI). Statistics Database, İzmir. 2023. Available online: https://www.tuik.gov.tr/ (accessed on 1 February 2025).
- Guo, S.; Zhang, L. Research on characteristics and influencing factors of high temperature disaster risk in Wuhan based on local climate zone. Landsc. Archit. 2025, 32, 105–113. [Google Scholar] [CrossRef]
- Ingle, K.; Chattopadhyay, S. A place-based approach to assess the vulnerability of communities to urban floods: Case of Nagpur, India. Int. J. Disaster Risk Reduct. 2022, 75, 102933. [Google Scholar] [CrossRef]
- Sood, A.; Vignesh, K.; Prapanchan, V.N. Multi-hazard vulnerability zone identification using GIS-based fuzzy AHP and MCDM techniques. Nat. Hazards 2025, 121, 8501–8539. [Google Scholar] [CrossRef]
- Wang, C.; He, Y.; Ma, G.; Wang, W. Research on the economic loss prediction and vulnerability risk zoning of coastal erosion disaster: A case study from Liaoning, China. Front. Mar. Sci. 2024, 11, 1431302. [Google Scholar] [CrossRef]
- Yang, X.; Guo, S.; Deng, X.; Wang, W.; Xu, D. Study on livelihood vulnerability and adaptation strategies of farmers in areas threatened by different disaster types under climate change. Agriculture 2021, 11, 1088. [Google Scholar] [CrossRef]
- Jamshed, A.; Rana, A.; Birkman, J.; McMillan, J.; Kienberger, S. A bibliometric and systematic review of the Methods for the Improvement of Vulnerability Assessment in Europe framework: A guide for the development of further multi-hazard holistic framework. Jàmbá J. Disaster Risk Stud. 2023, 15, 11. [Google Scholar] [CrossRef]
- Navarro, D.; Cantergiani, C.; Abajo, B.; de Salazar, I.G.; Feliu, E. Territorial vulnerability to natural hazards in Europe: A composite indicator analysis and relation to economic impacts. Nat. Hazards 2023. [Google Scholar] [CrossRef]
- Limongi, G.; Galderisi, A. Twenty years of European and international research on vulnerability: A multi-faceted concept for better dealing with evolving risk landscapes. Int. J. Disaster Risk Reduct. 2021, 63, 102451. [Google Scholar] [CrossRef]
- Liu, G.; Zhong, Z.; Ye, T.; Meng, J.; Zhao, S.; Liu, J.; Luo, S. Impact failure and disaster processes associated with rockfalls based on three-dimensional discontinuous deformation analysis. Earth Surf. Process. Landf. 2024, 49, 3344–3366. [Google Scholar] [CrossRef]
- Chen, L.; Wang, Q.; Zhu, G.; Lin, X.; Qiu, D.; Jiao, Y.; Wang, Y. Dataset of stable isotopes of precipitation in the Eurasian continent. Earth Syst. Sci. Data 2024, 16, 1543–1557. [Google Scholar] [CrossRef]

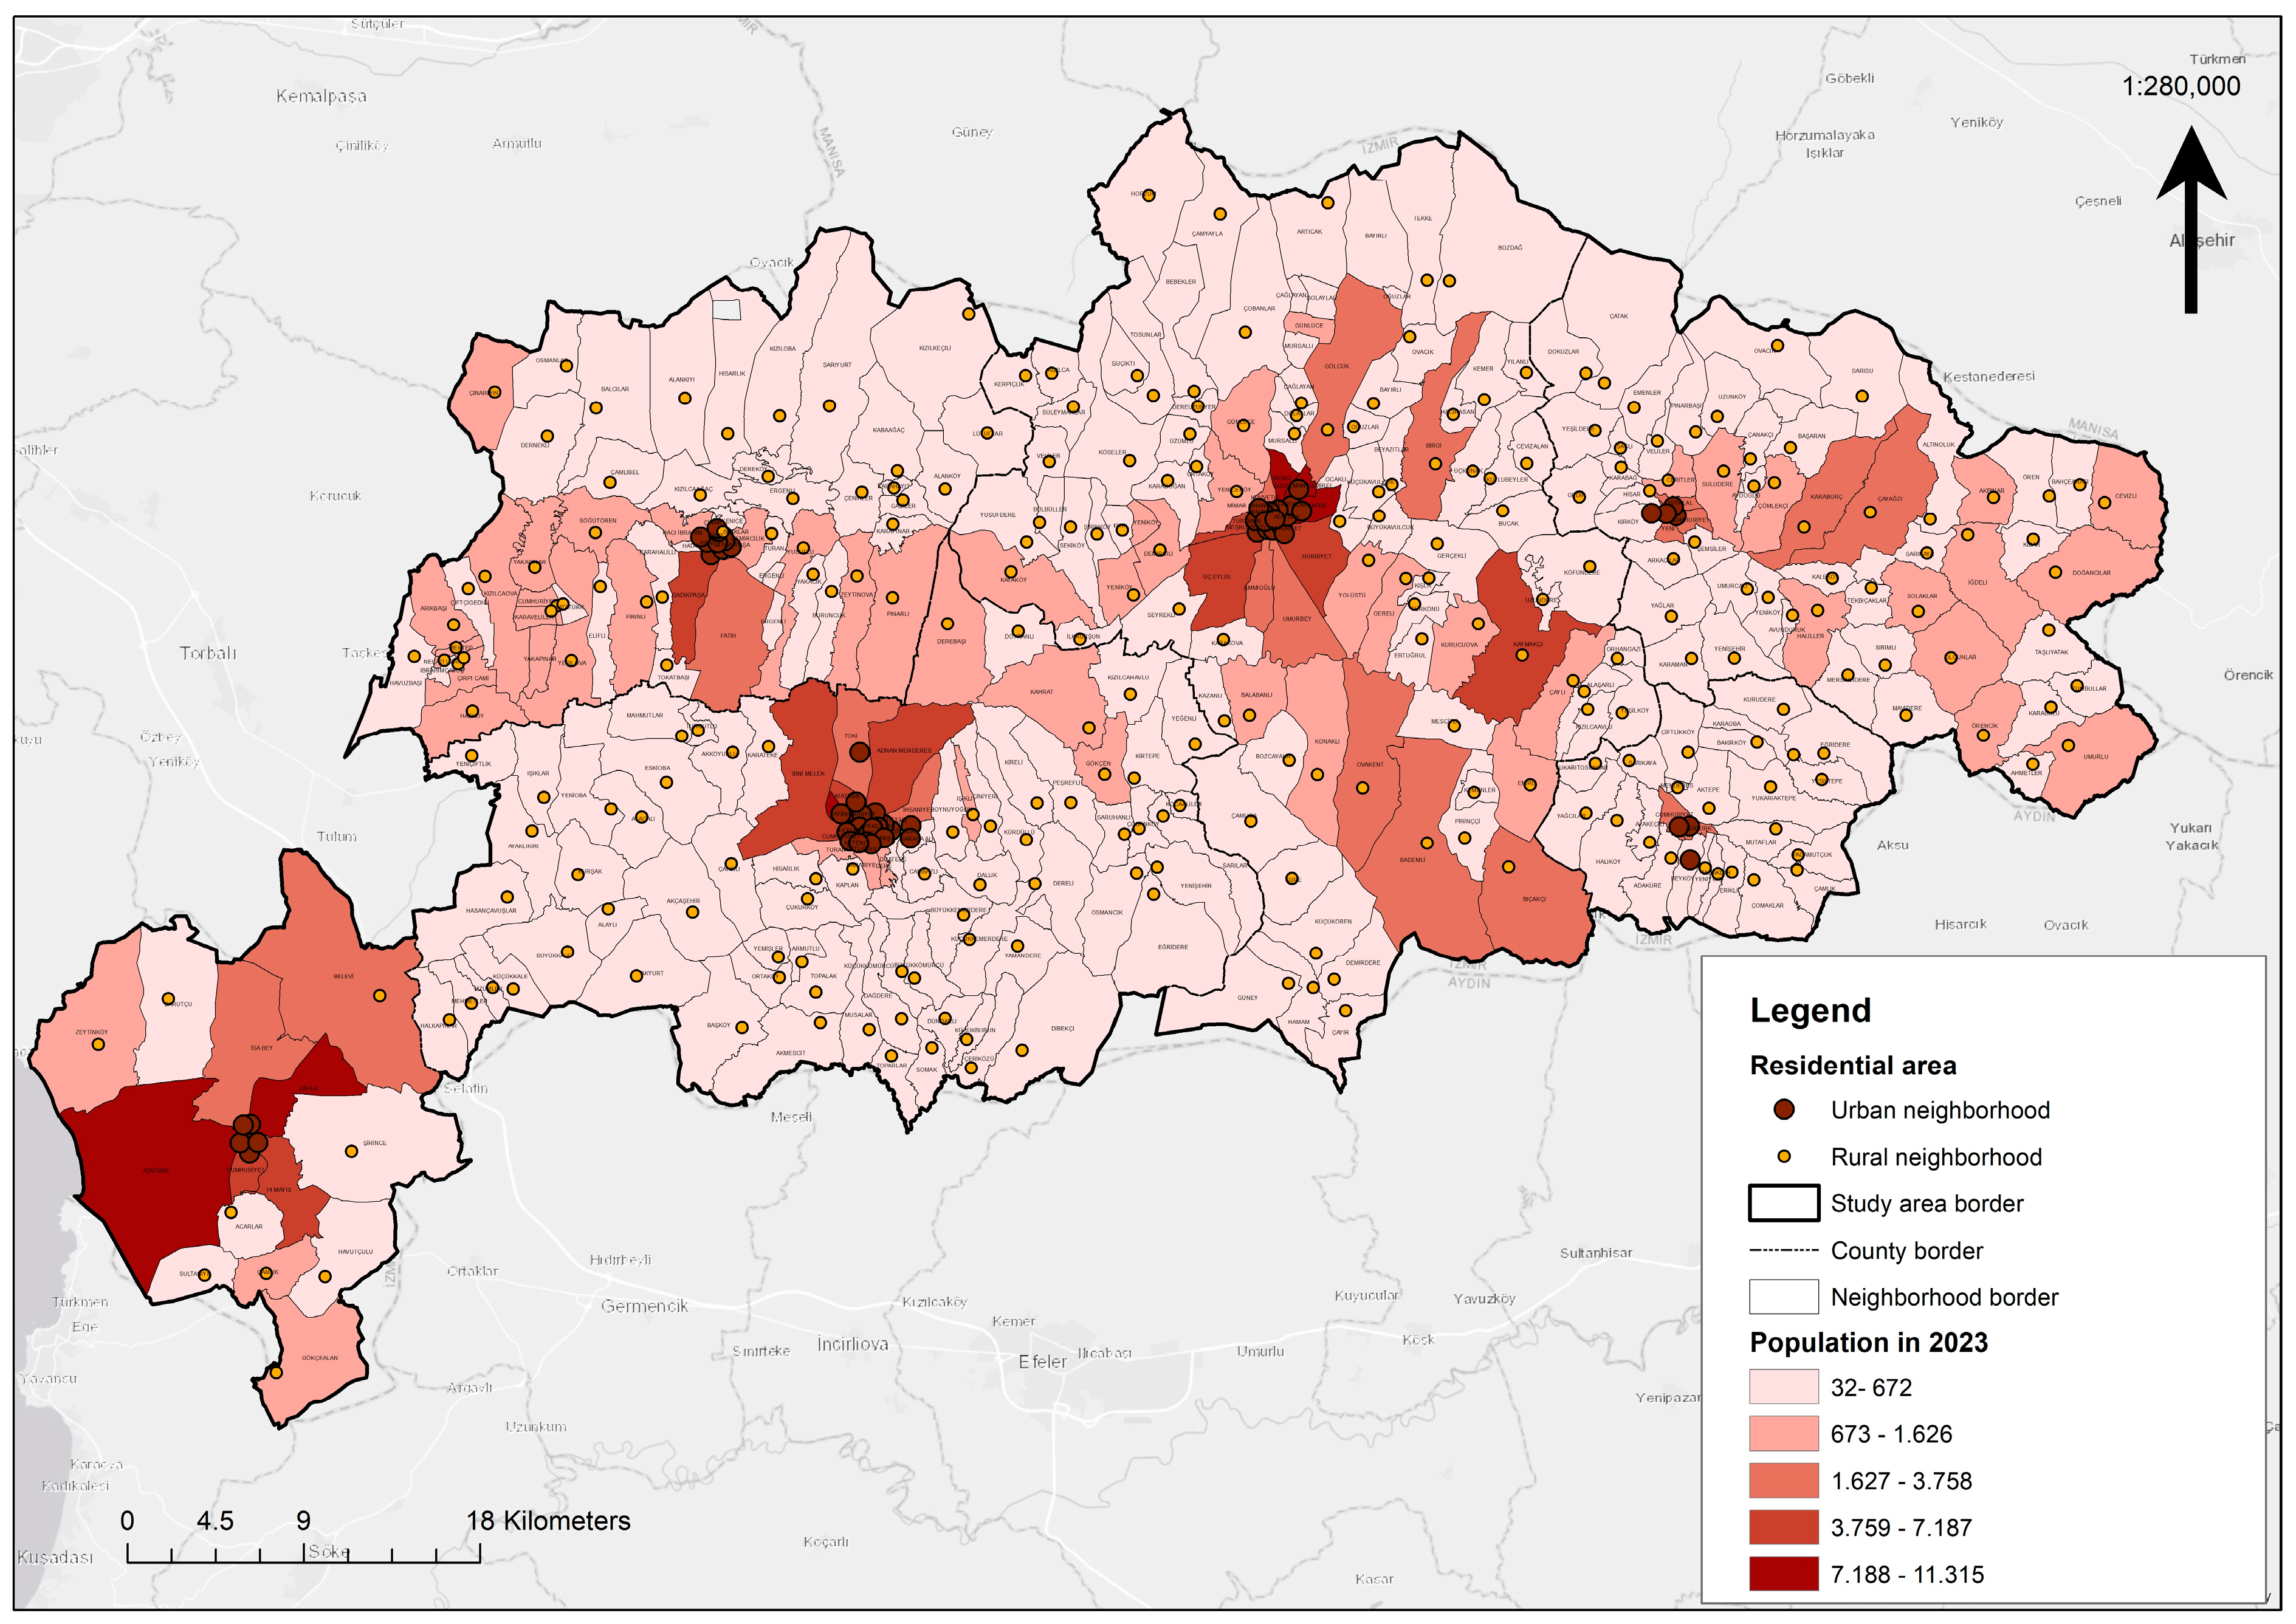


| District | Number of Urban Neighborhoods | Number of Rural Neighborhoods | Total |
|---|---|---|---|
| Selçuk | 6 | 8 | 14 |
| Bayındır | 23 | 36 | 59 |
| Tire | 24 | 64 | 88 |
| Beydağ | 4 | 21 | 25 |
| Ödemiş | 25 | 74 | 99 |
| Kiraz | 4 | 52 | 56 |
| Total | 86 | 255 | 341 |
| Indicators | Assumptions | Rationales | References |
|---|---|---|---|
| Total Population (2023) | As the population increases, social vulnerability tends to rise. |
| [45,46,47,48,49,50,51,52,53] |
| Gender | Women exhibit higher levels of social vulnerability. |
| [47,54,55,56,57,58,59,60,61,62,63,64,65] |
| Child Population (0–14) Elderly Population (65+) | Children and the elderly exhibit heightened levels of social vulnerability. |
| [47,60,66,67,68,69,70,71,72,73,74,75,76,77,78,79,80,81,82,83,84,85,86] |
| Number of Household Members | As household size increases, social vulnerability also rises. |
| [47,87,88,89,90,91,92,93,94,95] |
| Indicators | Assumptions | Rationales | References |
|---|---|---|---|
| Child Dependency Ratio Elder Dependency Ratio | As the dependency ratio of children and the elderly increases, economic vulnerability correspondingly intensifies. |
| [47,88,89,95,96,97,98,99] |
| Primary Economic Activity Type | The primary type of economic activity influences the level of economic vulnerability. |
| [100,101,102,103,104,105,106,107,108,109] |
| Road Connection Railway Connection | The absence and/or limitation of road and railway accessibility increases economic vulnerability. |
| [110,111,112,113,114,115,116,117] |
| Indicators | Assumptions | Rationales | References |
|---|---|---|---|
| Settlement Area Type | The proximity of settlements to coastal zones, rivers, and lakes increases disaster vulnerability, particularly in relation to earthquakes, floods, and landslides. |
| [60,118,119,120,121,122,123,124,125,126,127] |
| Settlement/Building Block Form | The spatial form of a settlement (linear, dispersed, or grid) influences its disaster vulnerability. |
| [128,129,130,131,132,133,134,135,136,137,138,139,140,141] |
| Structure Relationships | The spatial relationship between buildings (whether contiguous or detached) influences disaster vulnerability. |
| [142,143,144,145,146,147,148,149] |
| Number of Floors | Building height significantly influences disaster vulnerability. |
| [139,150,151,152,153,154,155,156,157,158,159,160] |
| Drinking Water Infrastructure Sewage Infrastructure | The condition of potable water and sewerage infrastructure is a critical factor influencing disaster vulnerability. |
| [161,162,163,164,165,166] |
| Indicators | Assumptions | Rationales | References | |
|---|---|---|---|---|
| Height Above Sea Level (m) | Elevation above sea level influences vulnerability to disasters. |
| [167,168,169,170,171,172,173,174,175] | |
| Slope Condition (%) | Slope conditions influence vulnerability to disasters. |
| [176,177,178,179,180,181,182,183,184,185] | |
| Geological Formation Type | Geological formation types influence vulnerability to earthquakes. |
| [186,187,188,189,190,191,192,193,194] | |
| Fault Line Nature Proximity to Fault Line (m) | The presence of fault lines and proximity to them significantly influence earthquake vulnerability. |
| [195,196,197,198,199] | |
| Proximity to the Shore (m) Proximity to Streams (m) | The proximity of a settlement to coastal areas, rivers, or lakes increases disaster vulnerability, particularly in relation to earthquakes, floods, and landslides. |
| [60,118,119,120,121,122,123,124,125,126,127] | |
| Soil Class | The quality of agricultural land influences disaster vulnerability, particularly with respect to floods and landslides. |
| [180,192,200,201,202] | |
| Natural Land Use | The land use patterns of agricultural areas (e.g., olive groves, vineyards, orchards) influence disaster vulnerability in terms of landslides. |
| [203,204,205,206,207,208,209] | |
| Social Vulnerability | Economic Vulnerability | ||||
|---|---|---|---|---|---|
| Indicators | Sub-Indicators | Weighting | Indicators | Sub-Indicators | Weighting |
| Total Population * | 32–672 | 0.2 | Child Dependency Ratio * | 0–15 | 0.33 |
| 673–1626 | 0.4 | 15.01–30 | 0.67 | ||
| 1627–3758 | 0.6 | 30.01+ | 1 | ||
| 3759–7187 | 0.8 | Elder Dependency Ratio * | 0–20 | 0.33 | |
| 7188–11,315 | 1 | 20.01–40 | 0.67 | ||
| Gender * | Women | 1 | 40.01+ | 1 | |
| Men | 0 | Primary Economic Activity Type * | Private (Central Neighborhood) | 0.25 | |
| Child Population (0–14) * | 0–830 | 0.33 | |||
| 831–1665 | 0.67 | Service Activities | 0.50 | ||
| 1666+ | 1 | ||||
| Elderly Population (65+) * | 0–480 | 0.33 | Agricultural Labor | 0.75 | |
| 481–960 | 0.67 | Agricultural Production/ Livestock Activities | 1 | ||
| 961+ | 1 | ||||
| Number of Household Members * | <5 | 0.33 | |||
| 5–10 | 0.67 | Road Connection ▲ | First Degree | 0.33 | |
| 10+ | 1 | Second Degree | 0.67 | ||
| Third Degree | 1 | ||||
| Railway Connection ▲ | Available | 0 | |||
| Not Available | 1 | ||||
| Artificial Vulnerability | Natural Vulnerability | ||||
|---|---|---|---|---|---|
| Indicators | Sub-Indicators | Weighting | Indicators | Sub-Indicators | Weighting |
| Settlement Area Type ▲ | Coastal Area | 1 | Height Above Sea Level (m) ▼ | 0–50 | 1 |
| River/Lake Shore | 0.75 | 51–100 | 0.8 | ||
| Other (Plain, etc.) | 0.50 | 101–500 | 0.6 | ||
| Valley/Slope | 0.25 | 501–1000 | 0.4 | ||
| Settlement Form ▲ | Linear | 0.33 | 1001+ | 0.2 | |
| Compact | 0.67 | Slope Condition (%) ▼ | Low Slope (0–10) | 0.25 | |
| Dispersed | 1 | Slight Slope (11–30) | 0.5 | ||
| Building Block Form ▲ | Grid | 0.33 | Mixed | 0.75 | |
| Mixed | 0.67 | Highly Sloped (≥31) | 1 | ||
| Organic | 1 | Geological Formation Type ● | Alluvial Fan, Terrace, Unconsolidated Quaternary Deposits, Pliocene Quaternary Deposits | 1 | |
| Structure Relationships ▲ | Adjacent Order | 1 | İzmir Flysch (sandstone), Schist, Gneiss, Paleozoic Schist, Marble, Quartzite, Phyllite, Siltstone, Loras Formation (limestone), Kırkağaç Formation, etc. | 0 | |
| Mixed | 0.67 | Fault Line Nature ● | Active/Strike-slip/Normal/Vertical Fault | 1 | |
| Separate Order | 0.33 | Approximate Fault Location | 0.5 | ||
| Number of Floors ▲ | Low-Rise (1–2) | 0.33 | |||
| Mid-Rise (3–5) | 0.67 | ||||
| High-Rise (6+) | 1 | ||||
| Drinking Water Infrastructure ● | Available | 0 | Proximity to Fault Line (m) ● | 0–100 | 1 |
| Not Available | 1 | 101–500 | 0.8 | ||
| Sewage Infrastructure ● | Available | 0 | 501–1000 | 0.6 | |
| Not Available | 1 | 1001–1500 | 0.4 | ||
| 1501+ | 0.2 | ||||
| Artificial Vulnerability | Natural Vulnerability | ||||
|---|---|---|---|---|---|
| Indicators | Sub-Indicators | Weighting | Indicators | Sub-Indicators | Weighting |
| Settlement Area Type ▲ | Coastal Area | 1 | Slope Condition (%) ▼ | Low Slope (0–10) | 1 |
| River/Lake Shore | 0.75 | Slight Slope (11–30) | 0.75 | ||
| Other (Plain, etc.) | 0.5 | Mixed | 0.50 | ||
| Valley/Slope | 0.25 | Highly Sloped (≥31) | 0.25 | ||
| Settlement Form ▲ | Compact | 1 | Proximity to the Shore (m) ▼ | 0–5000 | 1 |
| Linear | 0.67 | 5001–10,000 | 0.8 | ||
| Dispersed | 0.33 | 10,001–50,000 | 0.6 | ||
| Building Block Form ▲ | Organic | 1 | 50,001–100,000 | 0.4 | |
| Grid | 0.67 | 100,001+ | 0.2 | ||
| Mixed | 0.33 | Proximity to Stream (m) ▼ | 0–50 | 1 | |
| Structure Relationships ▲ | Adjacent Order | 1 | 51–100 | 0.8 | |
| Mixed | 0.67 | 101–500 | 0.6 | ||
| Separate Order | 0.33 | 501–1000 | 0.4 | ||
| Number of Floors ▲ | Low-Rise (1–2) | 1 | 1001+ | 0.2 | |
| Mid-Rise (3–5) | 0.67 | Soil Class ● | I and II Class | 0.25 | |
| High-Rise (6+) | 0.33 | III and IV Class | 0.50 | ||
| Drinking Water Infrastructure ● | Available | 0 | V-VI-VII Class | 0.75 | |
| Not Available | 1 | VIII Class | 1 | ||
| Sewage Infrastructure ● | Available | 0 | |||
| Not Available | 1 | ||||
| Artificial Vulnerability | Natural Vulnerability | ||||
|---|---|---|---|---|---|
| Indicators | Sub-Indicators | Weighting | Indicators | Sub-Indicators | Weighting |
| Settlement Area Type ▲ | Sea/River/Lake Shore, Other (Plain, etc.) | 0.5 | Height Above Sea Level (m) ▲ | 0–100 | 0.2 |
| 101–500 | 0.4 | ||||
| Valley/Slope | 1 | 501–750 | 0.6 | ||
| 751–1000 | 0.8 | ||||
| Building Block Form ▲ | Grid | 1 | 1001+ | 1 | |
| Organic | 0.33 | Slope Condition (%) ▲ | Low Slope (0–10) | 0.25 | |
| Mixed | 0.67 | Slight Slope (11–30) | 0.5 | ||
| Drinking Water Infrastructure ● | Available | 0 | Mixed | 0.75 | |
| Not Available | 1 | Highly Sloped (≥31) | 1 | ||
| Sewage Infrastructure ● | Available | 0 | Soil Class ● | I and II Class | 0.25 |
| Not Available | 1 | III and IV Class | 0.5 | ||
| V-VI-VII Class | 0.75 | ||||
| VIII Class | 1 | ||||
| Natural Land Use ▲ | Irrigated Agriculture | 1 | |||
| Rainfed Agriculture | |||||
| Vineyard | 0.67 | ||||
| Garden | |||||
| Pasture | |||||
| Heathland | |||||
| Olive | 0.33 | ||||
| Forest | |||||
| District | Neighborhood Number | Social Vulnerability | Economic Vulnerability | ||||
|---|---|---|---|---|---|---|---|
| Score | Indicator Number | SC/(NN × IN) | Score | Indicator Number | SC/(NN × IN) | ||
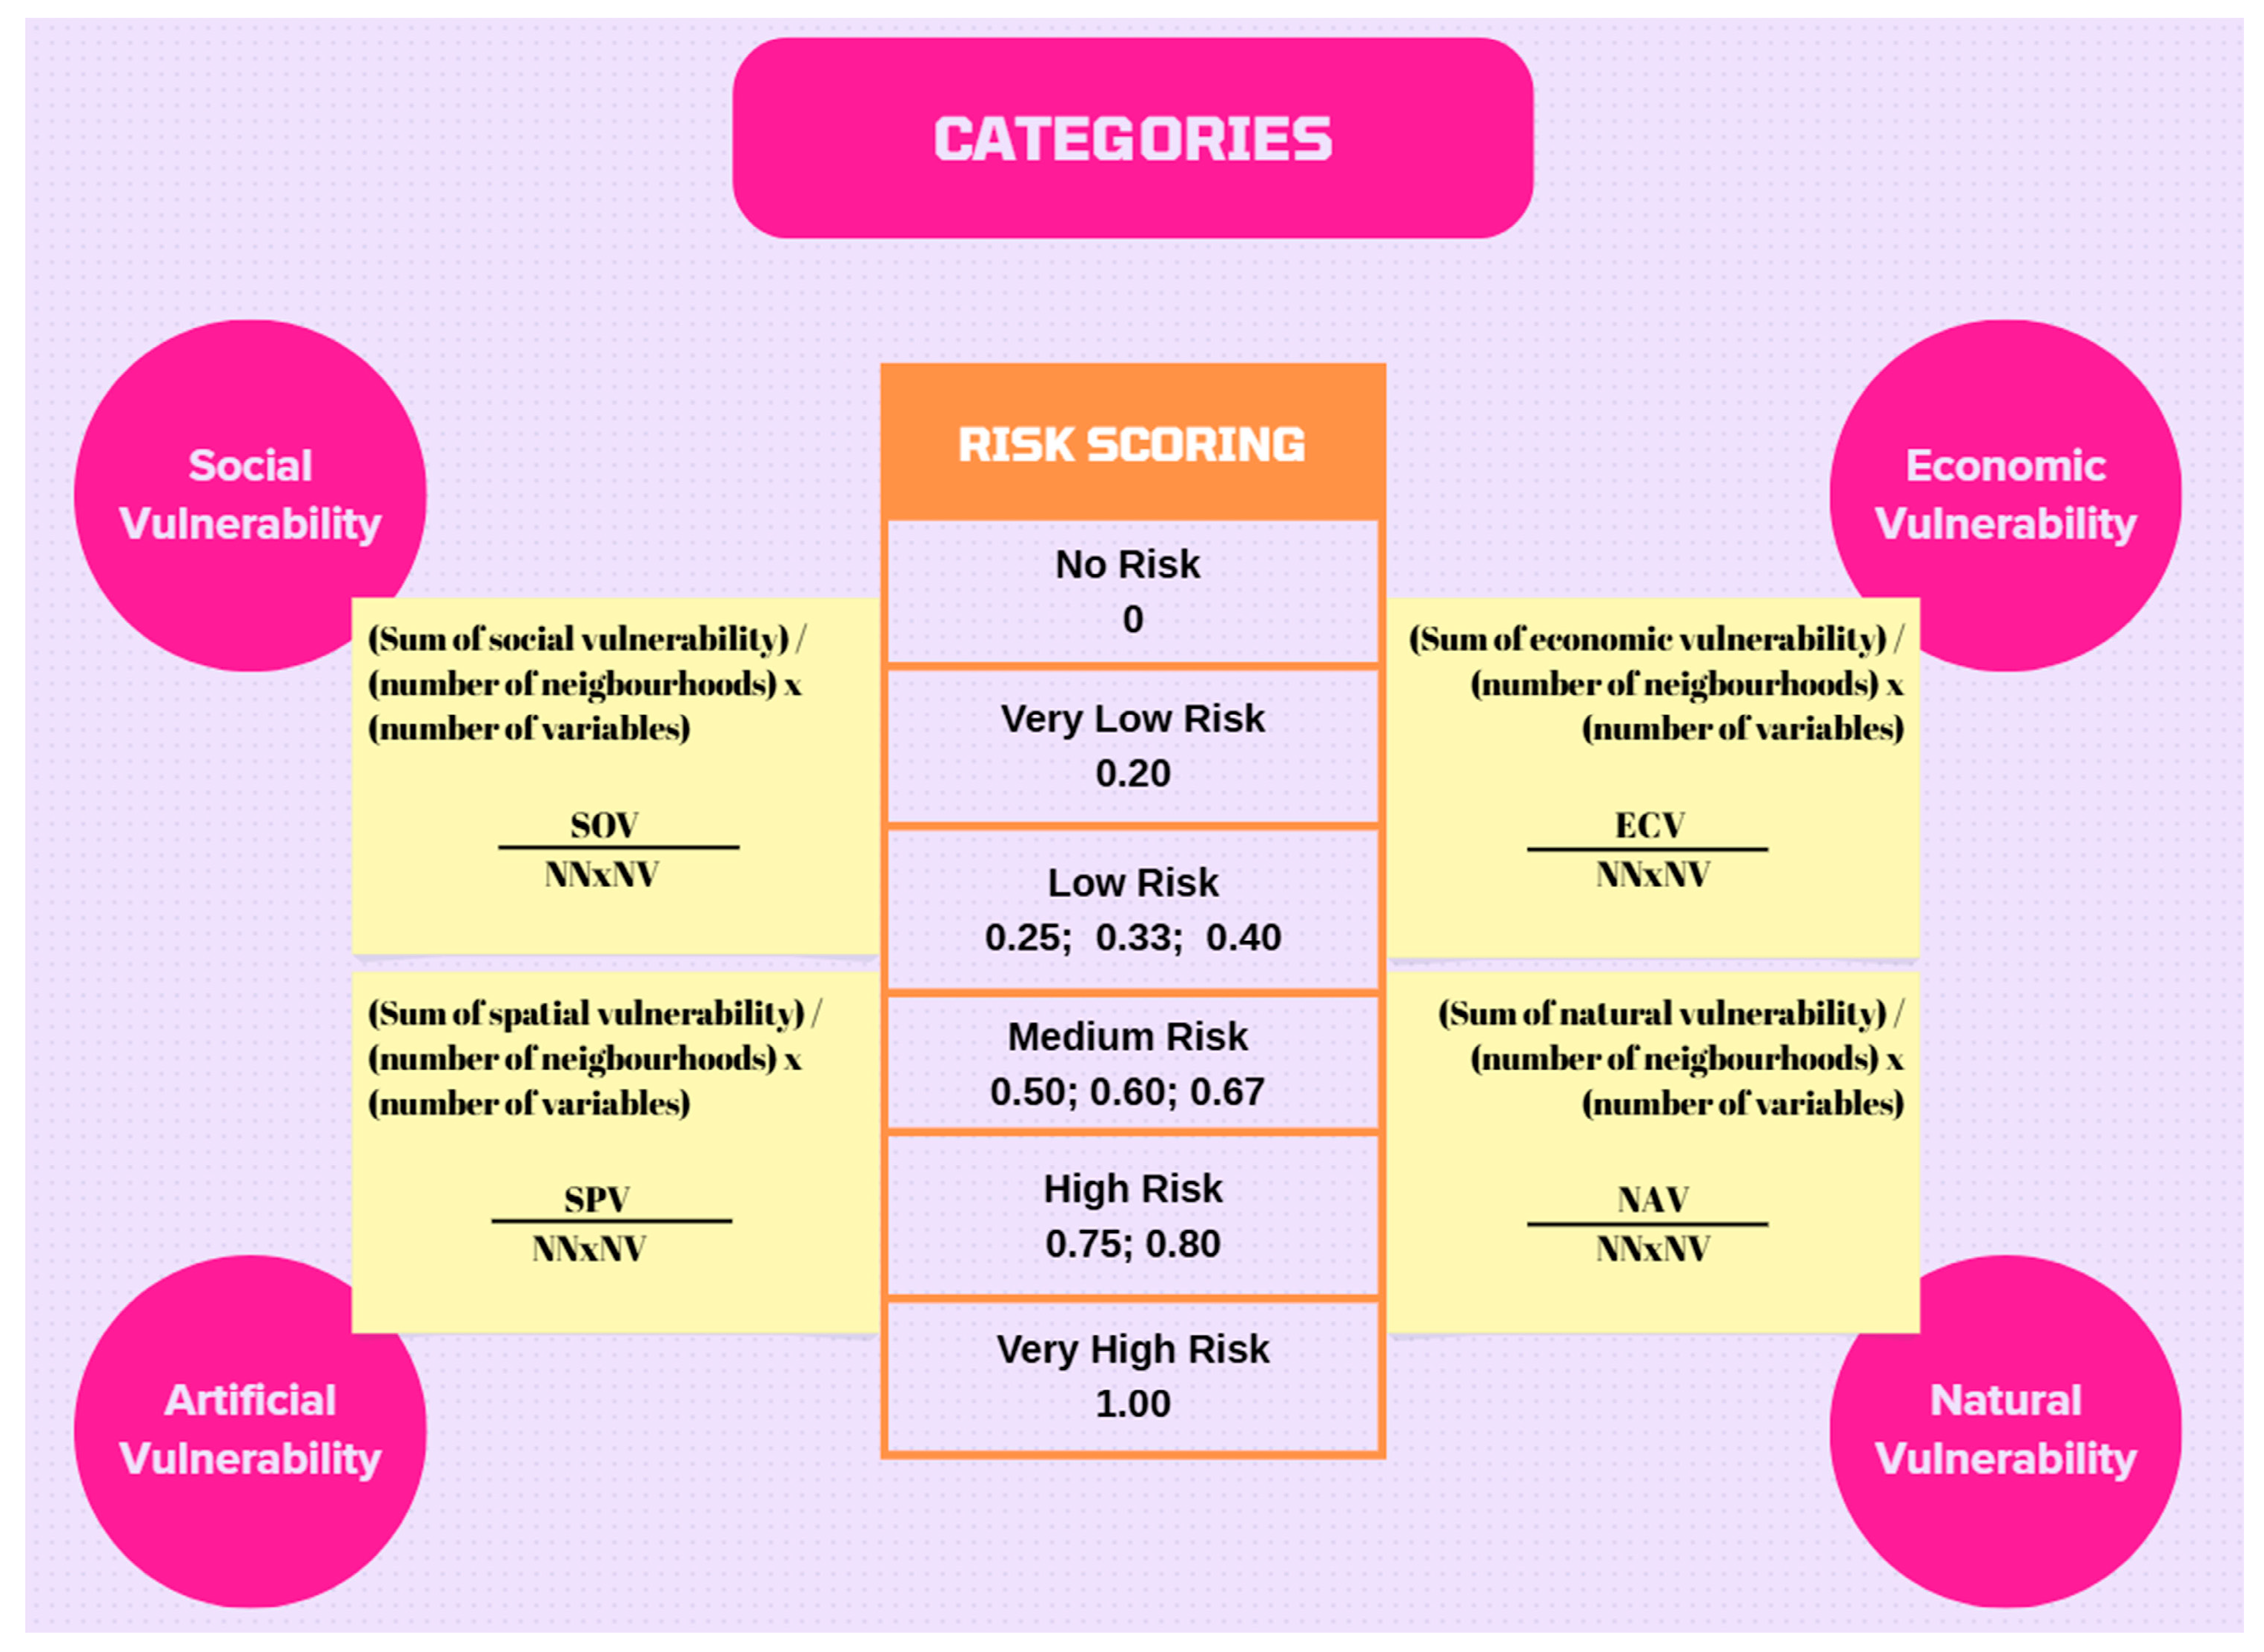
| Selçuk | 12 | 25.53 | 5 | 0.43 | 35.95 | 5 | 0.60 |
| Bayındır | 48 | 87.2 | 5 | 0.36 | 176.59 | 5 | 0.74 |
| Tire | 59 | 118.62 | 5 | 0.40 | 225.81 | 5 | 0.77 |
| Beydağ | 16 | 24.84 | 5 | 0.31 | 61.36 | 5 | 0.77 |
| Kiraz | 52 | 82.64 | 5 | 0.32 | 207.85 | 5 | 0.80 |
| Ödemiş | 68 | 149.63 | 5 | 0.44 | 246.98 | 5 | 0.73 |
| District | Disaster Type | Neighborhood Number | Artificial Vulnerability | Natural Vulnerability | ||||
|---|---|---|---|---|---|---|---|---|
| Score | Indicator Number | SC/(NN × IN) | Score | Indicator Number | SC/(NN × IN) | |||
| Selçuk | Earthquake | 14 | 48.3 | 7 | 0.49 | 43.35 | 5 | 0.62 |
| Flood | 14 | 47.94 | 7 | 0.49 | 40.3 | 4 | 0.72 | |
| Landslide | 14 | 21.54 | 4 | 0.38 | 23.3 | 4 | 0.42 | |
| Total | 14 | 117.78 | 18 | 0.47 | 106.95 | 13 | 0.59 | |
| Bayındır | Earthquake | 59 | 207.94 | 7 | 0.50 | 175.75 | 5 | 0.60 |
| Flood | 59 | 211.56 | 7 | 0.51 | 151.2 | 4 | 0.64 | |
| Landslide | 59 | 97.24 | 4 | 0.41 | 104.85 | 4 | 0.44 | |
| Total | 59 | 516.74 | 18 | 0.49 | 431.8 | 13 | 0.56 | |
| Tire | Earthquake | 88 | 314.13 | 7 | 0.51 | 256.05 | 5 | 0.58 |
| Flood | 88 | 317.4 | 7 | 0.52 | 218.15 | 4 | 0.62 | |
| Landslide | 88 | 150.79 | 4 | 0.43 | 174.39 | 4 | 0.50 | |
| Total | 88 | 782.32 | 18 | 0.49 | 648.59 | 13 | 0.57 | |
| Beydağ | Earthquake | 25 | 90.88 | 7 | 0.52 | 62.25 | 5 | 0.50 |
| Flood | 25 | 89.2 | 7 | 0.51 | 55.65 | 4 | 0.56 | |
| Landslide | 25 | 46.61 | 4 | 0.47 | 50.16 | 4 | 0.50 | |
| Total | 25 | 226.69 | 18 | 0.50 | 168.06 | 13 | 0.52 | |
| Kiraz | Earthquake | 56 | 228.78 | 7 | 0.58 | 130.3 | 5 | 0.47 |
| Flood | 56 | 234.08 | 7 | 0.60 | 108.35 | 4 | 0.48 | |
| Landslide | 56 | 125.24 | 4 | 0.56 | 151 | 4 | 0.67 | |
| Total | 56 | 588.1 | 18 | 0.58 | 389.65 | 13 | 0.54 | |
| Ödemiş | Earthquake | 99 | 390.01 | 7 | 0.56 | 289.5 | 5 | 0.58 |
| Flood | 99 | 411.3 | 7 | 0.59 | 218.15 | 4 | 0.55 | |
| Landslide | 99 | 212.6 | 4 | 0.54 | 214.6 | 4 | 0.54 | |
| Total | 99 | 1013.91 | 18 | 0.57 | 722.25 | 13 | 0.56 | |
| Social Vulnerability | Economic Vulnerability | Artificial Vulnerability | Natural Vulnerability | Type of Disaster | Priority |
|---|---|---|---|---|---|
| Ödemiş and Selçuk | Kiraz, Tire, and Beydağ | Kiraz and Ödemiş | Selçuk and Bayındır | Earthquake | First |
| Kiraz and Ödemiş | Selçuk and Bayındır | Flood | |||
| Kiraz and Ödemiş | Kiraz | Landslide | |||
| Bayındır and Tire | Bayındır | Beydağ and Tire | Tire and Ödemiş | Earthquake | Second |
| Tire, Bayındır, and Beydağ | Tire | Flood | |||
| Beydağ | Ödemiş | Landslide |
Disclaimer/Publisher’s Note: The statements, opinions and data contained in all publications are solely those of the individual author(s) and contributor(s) and not of MDPI and/or the editor(s). MDPI and/or the editor(s) disclaim responsibility for any injury to people or property resulting from any ideas, methods, instructions or products referred to in the content. |
© 2025 by the authors. Licensee MDPI, Basel, Switzerland. This article is an open access article distributed under the terms and conditions of the Creative Commons Attribution (CC BY) license (https://creativecommons.org/licenses/by/4.0/).
Share and Cite
Ecemiş Kılıç, S.; Efe Güney, M.; Ayhan Selçuk, İ.; Alğın Demir, K.; Gür, G. An Example of Vulnerability Analysis According to Disasters: Neighborhoods in the Southern Region of Izmir. Sustainability 2025, 17, 8358. https://doi.org/10.3390/su17188358
Ecemiş Kılıç S, Efe Güney M, Ayhan Selçuk İ, Alğın Demir K, Gür G. An Example of Vulnerability Analysis According to Disasters: Neighborhoods in the Southern Region of Izmir. Sustainability. 2025; 17(18):8358. https://doi.org/10.3390/su17188358
Chicago/Turabian StyleEcemiş Kılıç, Sibel, Mercan Efe Güney, İrem Ayhan Selçuk, Kübra Alğın Demir, and Gizem Gür. 2025. "An Example of Vulnerability Analysis According to Disasters: Neighborhoods in the Southern Region of Izmir" Sustainability 17, no. 18: 8358. https://doi.org/10.3390/su17188358
APA StyleEcemiş Kılıç, S., Efe Güney, M., Ayhan Selçuk, İ., Alğın Demir, K., & Gür, G. (2025). An Example of Vulnerability Analysis According to Disasters: Neighborhoods in the Southern Region of Izmir. Sustainability, 17(18), 8358. https://doi.org/10.3390/su17188358


