Article

Innovation in Vertical Farming: A Model-Based Energy Assessment and Performance Comparison of Adaptive Versus Standard Systems

by
Antonio De Donno
*,
Luca Antonio Tagliafico
and
Patrizia Bagnerini
Department of Mechanical, Energy, Management and Transport Engineering (DIME), Polytechnic School, University of Genoa, Via all’Opera Pia 15/A, 16145 Genoa, Italy
*
Author to whom correspondence should be addressed.
Sustainability 2025, 17(18), 8319; https://doi.org/10.3390/su17188319
Submission received: 6 August 2025 / Revised: 5 September 2025 / Accepted: 12 September 2025 / Published: 17 September 2025

Abstract

According to United Nations projections, the global population is expected to reach 9.7 billion by 2050, with 70% residing in urban areas, while arable land availability continues to decline. Vertical farming (VF) offers a promising pathway for sustainable urban food production by utilizing vertical space and controlled environments. Among emerging approaches, the adaptive vertical farm (AVF) introduces movable shelving systems that adjust to plant growth stages, allowing a higher number of cultivation shelves to be accommodated within the same rack height. In this study, we developed a computational model to quantify and compare the energy consumption of AVF and conventional VF systems under industrial-scale conditions. The reference scenario considered 272 multilevel racks, each hosting 8 shelves in the VF and 15 shelves in the AVF, with Lactuca sativa as the test crop. Energy consumption for thermohygrometric control and lighting was estimated under different sowing schedules, with crop growth dynamics simulated using scheduling algorithms. Plant heat loads were calculated through the Penman–Monteith model, enabling a robust estimation of evapotranspiration and its impact on indoor climate control. Simulation results show that the AVF achieves an average 22% reduction in specific energy consumption for climate control compared to the VF, independently of sowing strategies. Moreover, the AVF nearly doubles the number of cultivation shelves within the same footprint, increasing the cultivable surface area by over 400% compared to traditional flat indoor systems. This work provides the first quantitative assessment of AVF energy performance, demonstrating its potential to simultaneously improve land-use efficiency and reduce energy intensity, thereby supporting the sustainable integration of vertical farming in urban food systems.

1. Introduction

Vertical farming, a novel form of agriculture characterized by the cultivation of crops in vertically stacked layers within an indoor environment, is receiving increasing attention due to its potential for addressing critical sustainability challenges in our rapidly urbanizing world [1]. By employing advanced farming techniques such as hydroponics and aeroponics and substituting natural sunlight with artificial light sources, vertical farming presents a transformative approach to food production [2]. The efficiency of vertical farming in spatial utilization is one of its most significant attributes. Unlike conventional farming methods, vertical farming can produce substantial crop yields in limited spaces, thereby rendering it a potential solution for urban agriculture. Moreover, it also contributes to the reduction of deforestation and land degradation by lessening the dependence on expansive agricultural lands. Furthermore, vertical farming’s ability to facilitate year-round crop production, independent of seasonal limitations, can potentially increase the per-area yield, surpassing that of traditional farming. Vertical farming is increasingly seen not only as an agricultural innovation but also as a potential driver for urban transformation. A recent study suggests that the integration of vertical farming within urban planning frameworks—through urban food planning strategies and multifunctional infrastructure—can support broader sustainability goals [3]. Additionally, its inherent water efficiency and protective environment, which shields crops from weather adversities and pests, are notable features that can contribute to sustainable agricultural practices. Vertical farms are gaining increasing attention as a sustainable solution for urban agriculture, thanks to their ability to optimize space and reduce the use of natural resources. This trend is reflected in the growing number of peer-reviewed scientific articles published each year. In particular, a bibliometric search conducted in Scopus (subject area: Engineering; years: 2011–2024), using “vertical farm” as a keyword in titles, abstracts, and author keywords, shows a steady increase in the number of publications, as illustrated in Figure 1.
Recent studies on Italian consumers’ attitudes show a growing interest in sustainable food systems, with vertical farming perceived positively for its environmental and safety benefits. However, widespread acceptance is hindered by limited consumer knowledge, cost concerns, and competition from more established preferences such as local and organic produce [5]. The work of Chalabi [6] analyzes key points such as the carbon footprint of VF, opportunities and barriers towards greater uptake, and the location/design. The journey towards a wide-scale implementation of vertical farming is not without its hurdles. High initial setup costs, significant energy requirements [7], limited crop variety, technical skills requirement, and the potential impact of a completely artificial environment on crop nutrition and taste all present substantial challenges.
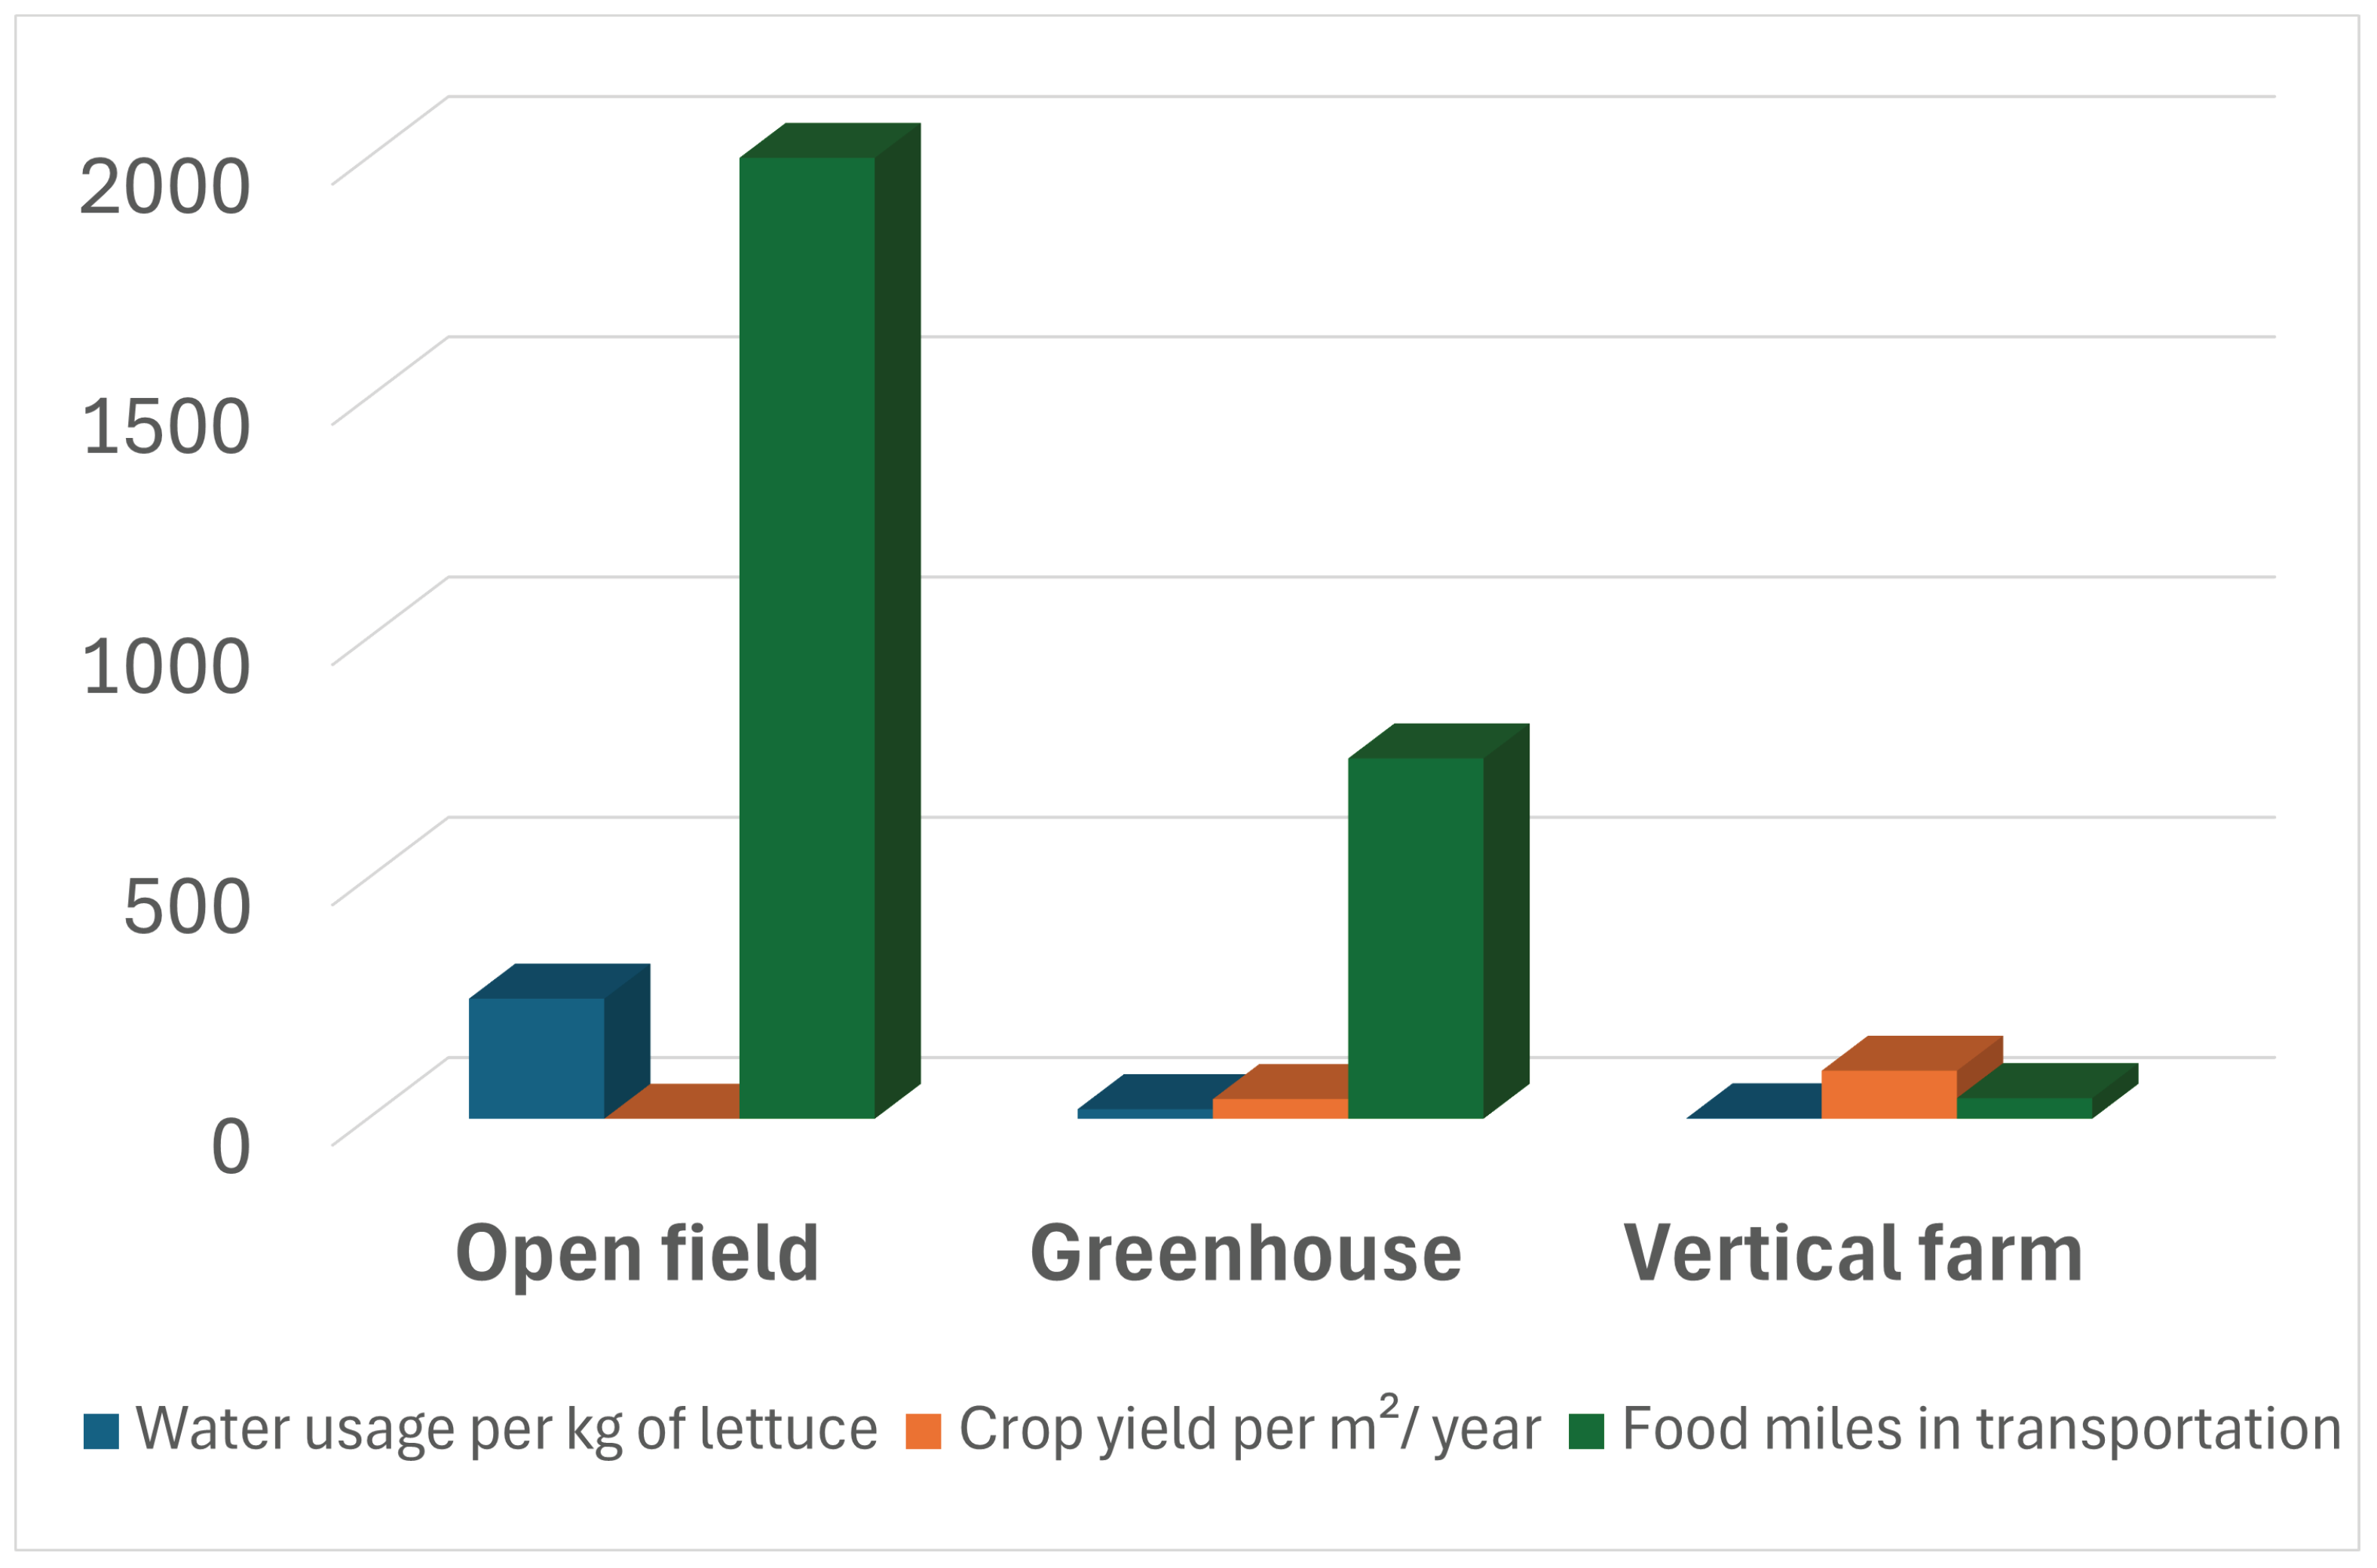
However, according to a recent study of Arabzadeh et al. [8], integrating urban vertical farming into the city’s energy system can lead to significant savings in electricity costs, with a reduction ranging from 5% to 30%, depending on the variability of electricity prices throughout the day. In particular, the flexibility in managing lighting, thanks to demand response (DR) control, allows for avoiding peak hours, resulting in greater savings, especially for plants with shorter lighting periods. As the global community strives towards sustainable urban agriculture, vertical farming appears as a promising, albeit complex, pathway. Cossu et al. [9] explored the integration of vertical farming into closed agrivoltaic systems (CA), showing that VF can significantly increase land productivity up to 13 times compared to traditional CA systems. This improvement was accompanied by a 12% reduction in CO2 emissions and an increase in land productivity, with a land equivalent ratio (LER) of up to 1.60 for green varieties. The results suggest that vertical farming can not only improve energy efficiency but also increase yields, provided that advanced technologies such as dynamic lighting control are utilized. In their work [10], Stanghellini and Katzin highlight that, although vertical farming (VF) offers advantages such as reduced water consumption (Figure 2), almost zero chemical emissions, and the possibility of producing close to consumers, its environmental credentials are not unlimited. In particular, the use of LEDs instead of sunlight can be advantageous in terms of controlled production, but it also implies a high energy consumption, which can undermine the environmental benefits. Vertical farms offer significant advantages in terms of environmental sustainability compared to conventional agriculture. In Japan, a study conducted in Miyagi Prefecture showed that replacing imported vegetables with VF production reduced the nitrogen and phosphorus footprints by 37% and 36%, respectively, thereby helping to reduce water pollution and improve regional food self-sufficiency [11]. Furthermore, VF has proven effective in post-disaster agricultural reconstruction and represents a resilient solution in areas prone to natural disasters. Another crucial aspect of vertical farming concerns the ability to accurately determine the optimal time for harvesting. This aspect becomes particularly complex in industrial contexts, where different crops are transplanted on different days and, as a result, reach maturity at different times. Accurate management of these differences is essential to ensure operational efficiency, product quality, and waste reduction. Automatic recognition of growth and ripening stages is crucial for optimizing indoor cultivation operations. Several studies have shown that image processing combined with deep learning models can improve the accuracy of identifying fruits or leaves at different stages of development. For example, Wang et al. developed a YOLO-BLBE model [12] capable of distinguishing blueberries in different stages of ripeness with high precision, achieving accuracies of over 96%. Although this work focuses on fruit, the methodological principles can also be transferred to lettuce and other species, where monitoring does not concern fruit ripeness but, rather, the assessment of vegetative development and the optimal time for harvesting. Another challenge in vertical farming is the automation of plant handling, particularly the transplanting of seedlings into cultivation shelves and shelves. This process currently requires precise navigation and positioning in GPS-denied indoor environments, where conventional SLAM methods are prone to drift during long-term operations. Recent advances, such as the preciseSLAM framework integrating LiDAR, IMU, and ultrasonic sensors, have demonstrated sub-decimeter positioning accuracy in plant factories [13], suggesting promising directions. Nevertheless, fully automated and reliable robotic transplanting in vertical farming remains an open issue. However, long-term sustainability depends on the ability to integrate these systems with local environmental conditions and optimize resource use. Blom et al. [14] conducted a quantitative carbon footprint assessment of lettuce cultivation in different farming systems, including open-field farms, soil-based greenhouses, hydroponic greenhouses, and vertical farming (VF) in the Netherlands. The results showed that the carbon footprint of VF (8.177 kg CO2-eq/kg) was significantly higher than that of open-field (0.490 kg CO2-eq/kg), soil-based greenhouses (1.211 kg CO2-eq/kg), and hydroponic greenhouses (1.451 kg CO2-eq/kg). The study also considers alternative scenarios to improve the carbon footprint, such as using renewable energy, identical packaging, and accounting for land-use change. With these scenarios, the VF footprint reduced to 1.797 kg CO2-eq/kg, still higher than the other systems but with a notable improvement. A large portion of the VF’s carbon footprint was due to electricity consumption, particularly from artificial lighting. The study found that while vertical farming offers benefits over conventional farming, it is not yet a sustainable solution in terms of carbon footprint. To become more sustainable, vertical farms need to drastically reduce energy consumption and improve material use.

Adaptive Vertical Farm, a New Perspective

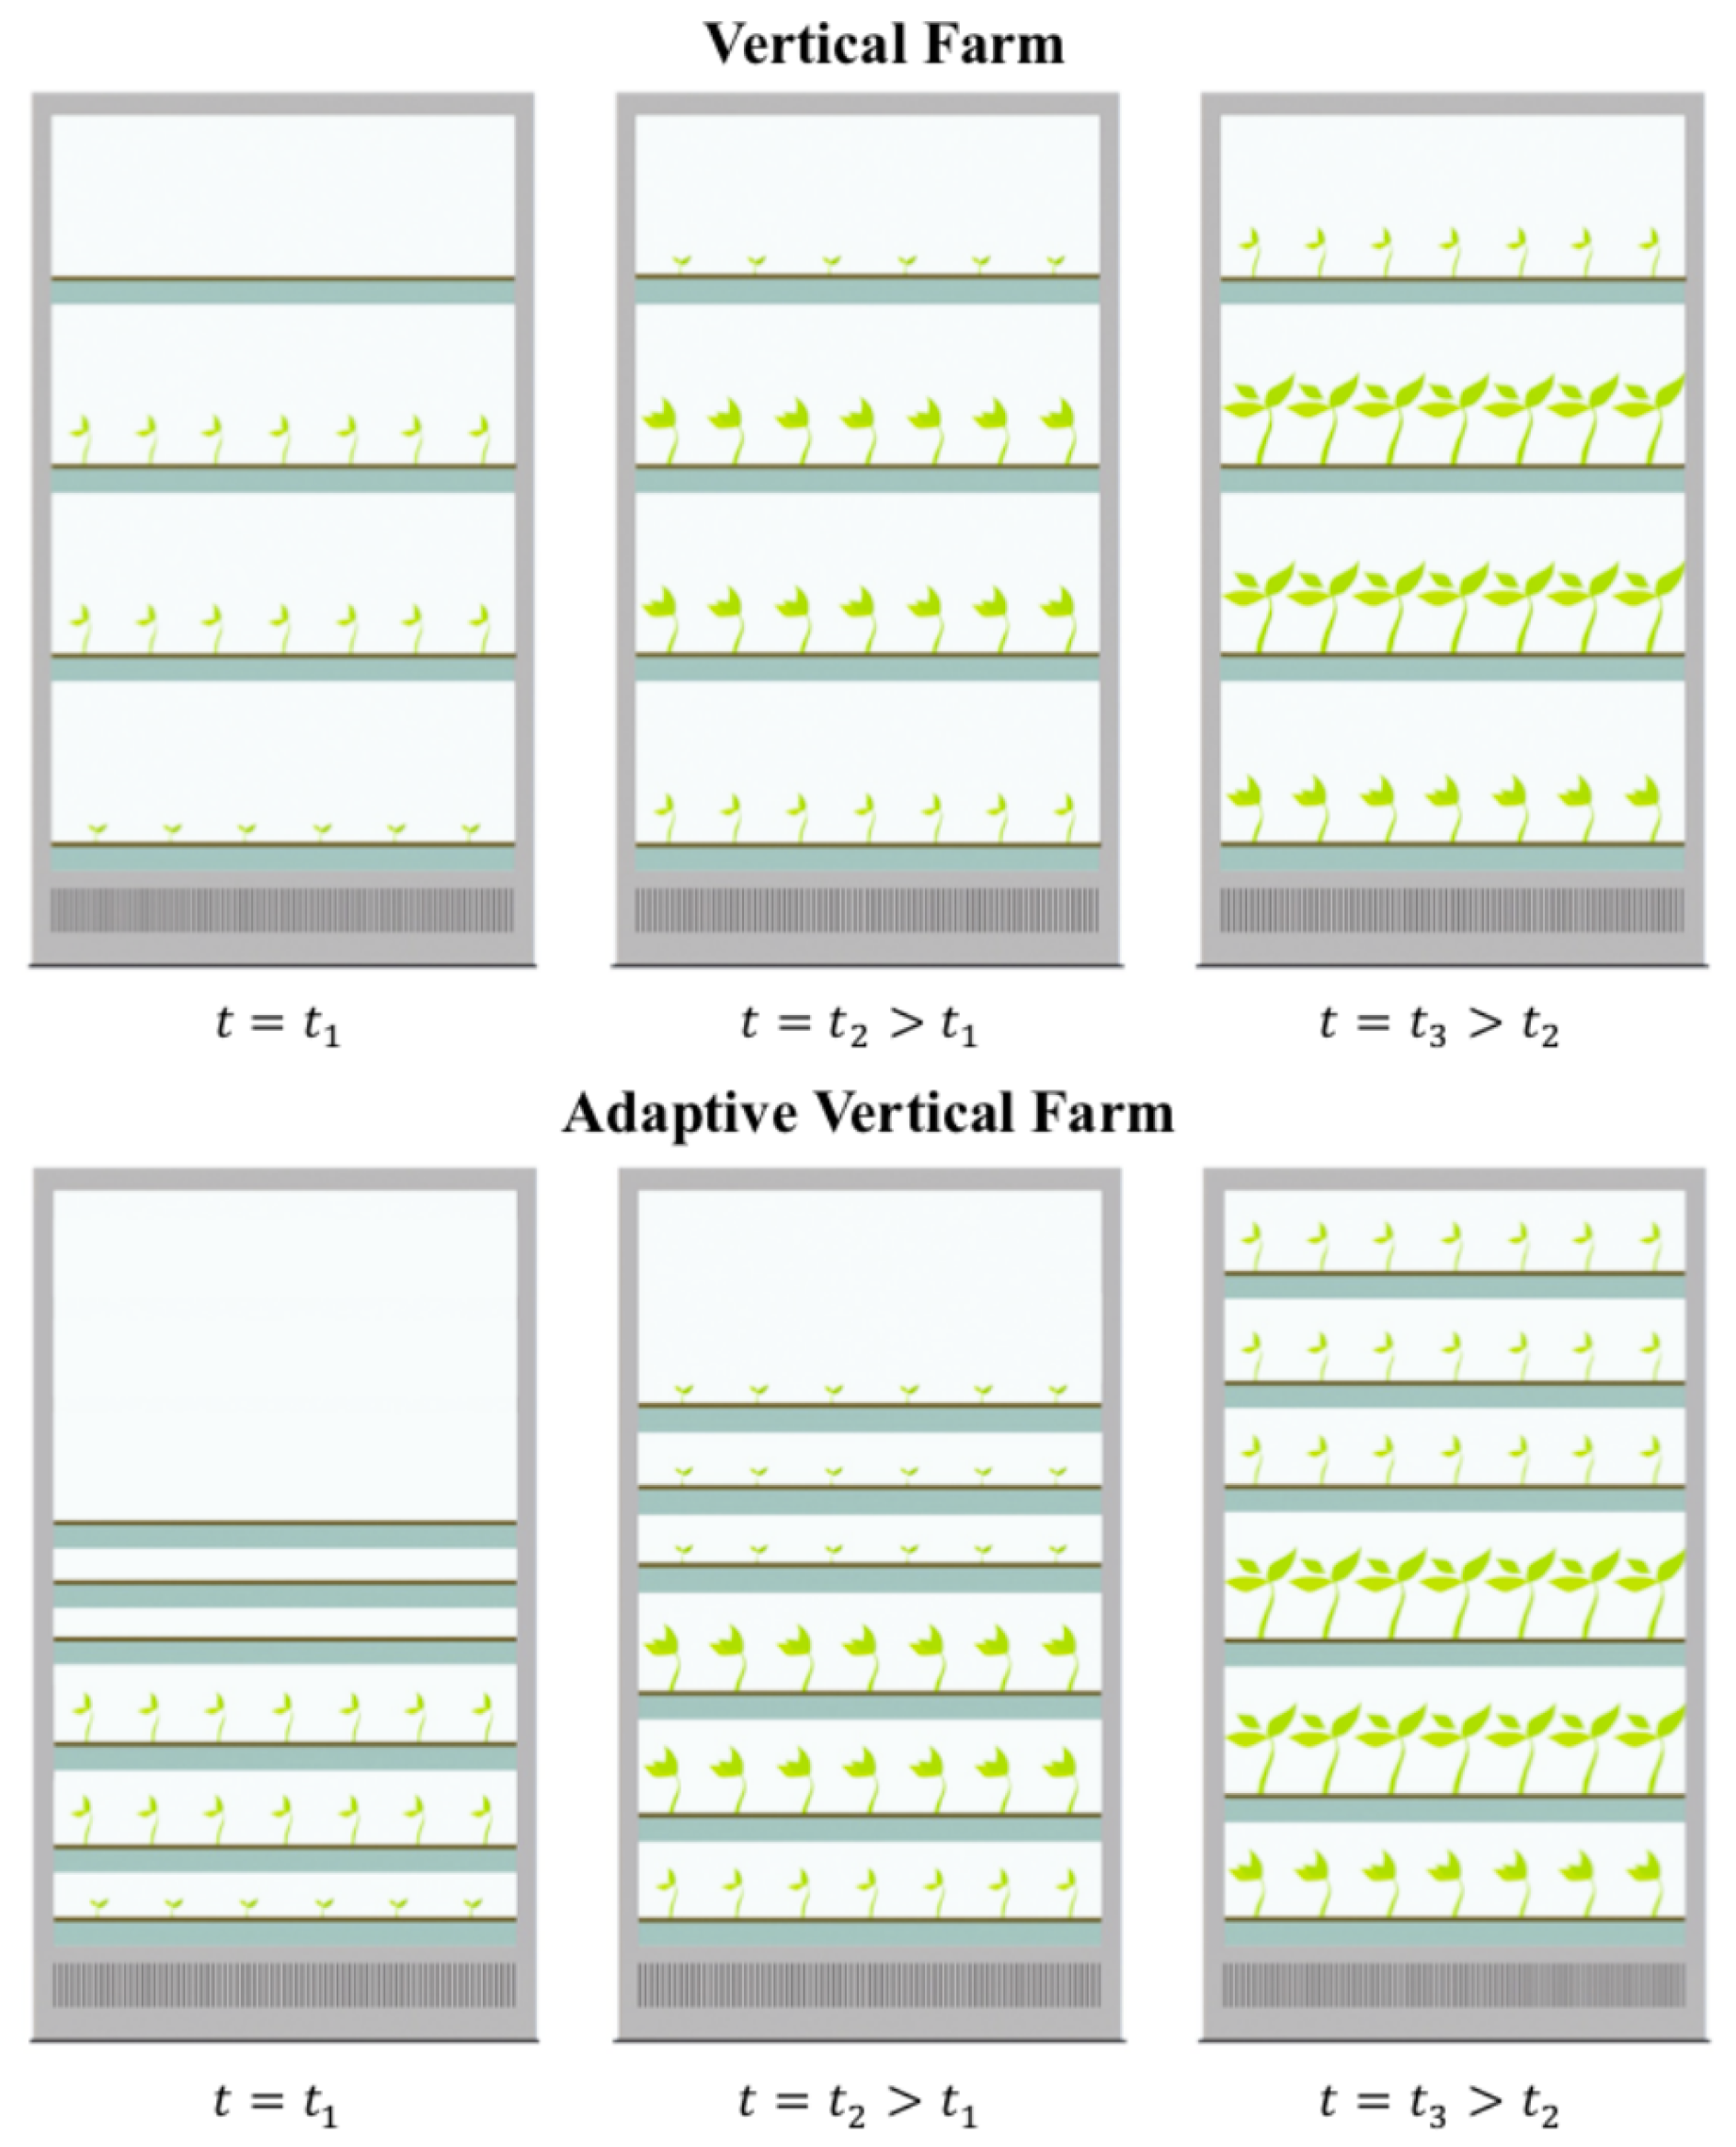
In [16,17,18,19], a new concept of vertical farm, called adaptive vertical farm (AVF), was proposed, based on the possibility of adapting the vertical space available for crop growth [20]. The innovation behind the adaptive greenhouse is its adaptive characteristic to the growth of plants. Whereas in a traditional vertical greenhouse the stacked growing shelves maintain a fixed spacing (defined at the design stage) throughout the crop development cycle, in AVF the height of the growing shelves is adaptable to the different stages of crop development. Intelligent management of the position of the growing shelves automatically allocates to plants only the conditional volume they really need during their growth. As during much of their early development plants are in a growth phase that requires little space, continuous “intelligent adaptation” of the adaptive greenhouse shelf placement allows plants to share the same volumes during different growth phases. Therefore, the adaptive greenhouse allows more shelves to fit in the same volume than a fixed-shelf greenhouse, and, thus, greatly increases production yield. Under optimal conditions, AVF provides production gains averaging 108%, compared to a traditional vertical greenhouse of the same volume [16,17], but can increase depending on the type of crops and greenhouse parameters [18]. In addition, the ventilation and microconditioning system can be individualized for each growing shelf in order to grow even very different plant species simultaneously [20].
In a study conducted by the University of Bologna [21], it was shown that the gain from an investment in such technology in a comparative scenario of an adaptive vertical farm occupying 1500 m2 in 10 years is about 200% compared to a traditional vertical farm (VF) of the same size. A preliminary assumption of the study [21] is that the energy consumption for greenhouse air conditioning, in relation to the cultivated area, is the same for both types of greenhouse. However, there are no studies that quantitatively compare the consumption between standard and adaptive vertical greenhouses. The increase in cultivated surface area that is made available by moving the shelves of the AVF system would lead to a decrease in the volume of air in the system and, at the same time, to an increase in the amount of vapor transpired by the plants and the associated latent load. For these reasons, the adaptive greenhouse could lead to higher air conditioning consumption than a traditional one.
The aim of the present work is to fill this gap by developing a thermoenergetic calculation model for vertical farms in order to make a comparison between VF and AVF energy consumption and quantify the energy impact of AVF systems.
In particular, in this paper, a comparison in terms of energy consumption between the two types of greenhouse mentioned above is presented by means of quantitative energy consumption calculations of each air conditioning plant. Moreover, for the VF, three different seeding scheduling strategies are simulated to understand if and how much they affect the energy performance.
Calculations of the thermohygrometric loads for both systems are carried out to design the components of the all air conditioning plants. The systems consist of the same components, carefully sized for both greenhouses. The same control algorithm is employed in both cases to have a fair comparison.
Finally, specific energy consumption parameters referred to the cultivated area are calculated for both VF and AVF greenhouses.
This paper is organized as follows. Section 2 provides a description of the geometric characteristics of the AVF and VF systems, along with a schematic of the all-air conditioning system employed for both. Section 3 reports the computational model used to estimate plant transpired vapor flow rates and heat loads within the control volume. Additionally, the energy and mass balances, implemented in the Matlab code, necessary to calculate the air input conditions into the system, are presented. Section 4 shows heat loads and plant transpired humidity values as a result of simulations with the algorithm defined in the previous chapter. In Section 5, the results for a series of thermoenergy simulations by adopting different seeding strategies in both greenhouses are shown. Section 6 contains concluding remarks.

2. Description of Adaptive Vertical Farm Technology

The present work aims to compare a traditional vertical farm (VF) and an adaptive vertical farm (AVF). In the considered scenario, the VF is composed of 272 multilevel racks. Each rack includes 8 stacked cultivation shelves, reaching a total height of 6.5 m. With a floor footprint of 2.05 m2 per rack, each shelf provides 2.04 m2 of effective growing area. Walkways and processing aisles, 1.2 m wide, are included between each pair of racks for accessibility. Overall, the system accommodates 2176 cultivation shelves, corresponding to a total cultivation area of 4439 m2. In the adaptive technology case, each rack—thanks to the movable shelving system—accommodates 15 cultivation shelves within the same total height of 6.5 m. The footprint remains 2.05 m2 per rack, but each shelf provides 1.79 m2 of growing area. Altogether, the adaptive system hosts 4080 cultivation shelves, with a total cultivation area of 7303 m2. Despite the fact that the adaptive system has 14% less cultivation area [21] than the conventional system (due to the presence of the shelf handling systems), the application of adaptive technology implies an increase of approximately 65% of the total cultivation area per multilevel shelf.
As shown in Table 1, the adaptive greenhouse further increases the cultivable area for the same amount of soil. In the VF, different case scenarios will be analyzed during this work: coeval sowings and different scheduling strategies. AVF necessitates carefully planned sowing schedules to fully leverage the adaptation principle and maximize overall yield. Given the greater number of shelves occupying the same vertical space compared to a traditional VF, sowing all shelves simultaneously would lead to the surpassing of the total height capacity of the greenhouse structure before the crops reach their harvest stage. Therefore, seedlings are transplanted on different days, in order to make better use of the available space and maximize the number of shelves in a single rack. Consequently, sowings in the AVF system are non-coeval. The germination phase is handled separately in a climate chamber and lasts 14 days. The comparison will be made on a series of 6 cultivation cycles lasting 21 days with the same, appropriately sized climate chamber.
Reducing soil wastage is and will be increasingly important as the years go by. Global population growth requires an increase in food production, but soil wastage reduces the availability of agricultural land. In their work, Huang et al. [22], showed how urbanization has a significant influence on farmland area, such that a 1% increase of urban population share is associated with a 3% decrease of farmland. By using soil in a more efficient and sustainable way, food production can be maximized and food security for all can be ensured. Soil is also a living environment for numerous organisms, including bacteria, fungi, insects, and microorganisms [23]. Excessive soil wastage can lead to the destruction of natural habitats and loss of biodiversity. It also plays a key role in the water cycle, retaining rainwater and recharging aquifers. Reducing soil wastage helps conserve water resources and mitigate water-related challenges. Soil can also act as a carbon sink, retaining large amounts of atmospheric CO2. Soil wastage can lead to the loss of carbon from the soil, contributing to increased greenhouse gas emissions and the greenhouse effect. Optimizing land use is a key issue today.
However, the energy that is required for climate control in these systems is not negligible. One of the major problems of vertical farms is, in fact, the energy cost for the climatic management of the environment. In an adaptive greenhouse, it is essential that this cost, in relation to the cultivated area, is not higher than in a VF, as it would negate the positive effect of the increase in area for the same amount of land occupied and the rise in production yield. Figure 3 shows the concept of an adaptive vertical system.

Air Conditioning System

A possible configuration for the climatization system is the HVAC system, which is particularly suitable for managing sensible and latent heat loads. In view of the purpose of the study to determine the average consumption of the AVF, no particularly complex system configurations (such as recuperators or air mixing units) were implemented. The configuration of the proposed air conditioning system is depicted in Figure 4. The black lines represent treated air, the red line the refrigeration cycle heat transfer fluid (R134a in this model), and the blue line the water flows.
Figure 3. AVF rack concept (bottom) and comparison with VF (top), from [16].
Sustainability 17 08319 g003
Figure 4. Air conditioning system.
Sustainability 17 08319 g004
The air passes through the evaporator of a chiller, which acts as a dehumidifier to reduce the external hygrometric content and ensure optimal inlet conditions. Next, there is a heater to bring the air back to the appropriate temperature. Before the heater, a counter-current finned intermediate heat exchanger can be provided to recover the residual heat of the air leaving the greenhouse. Finally, there is a humidification coil that increases the hygrometric content of the air by atomizing water drawn from a special tank with atomizers.
All these components, suitably coordinated by a control unit and appropriate sensors, are essential to treat the incoming air and bring it to the inlet conditions necessary to maintain the greenhouse at the ideal thermohygrometric conditions for plant growth. The control unit is essential for the regulation and autonomous management of the air conditioning system. The unit processes data collected by a series of sensors located in the greenhouse, outside (for temperature and humidity parameters), and on the refrigeration cycle evaporator (for wall temperature). These sensors communicate with the control unit through periodic checks, allowing the HVAC system to dynamically adjust operating conditions (inlet temperature and relative humidity) to maintain air parameters within ranges beneficial for plant growth. The detailed methodology adopted to calculate the thermohygrometric inlet conditions for air supply is described in Section 3. The green lines in Figure 4 represent regulation signals and the blue lines represent the detection signals.

3. Description of the Calculation Model

The energy model, based on the calculation of the thermohygrometric loads of the system and using the energy and mass balance equations, estimates the ideal input conditions of the treated air to maintain the ideal temperature and humidity for plant growth. The model is based on the energy and mass flows by considering the growth and evapotranspiration models for lettuce (Lactuca sativa L.).
There are many examples in the literature useful for calculating the contributions of energy and mass balances. The work of Arcasi et al. shows an example of a model for energy balance [24]. To calculate the transpiration contribution of plants, and so the mass balance, this work refers to the model employed by Graamans et al. [25]. There are several models in the literature that are useful for assessing the transpiration rate of plants. In [26], Stanghellini shows the model useful especially for calculating transpiration resulting from tomato cultivation. In [27], Brouwer and Heibloem employed a different model in order to calculate the water requirements of several plant species and their evotranspiration. Graamans et al. [25] utilized Penman’s model for evapotranspiration [28] to develop and validate a model that describes the energy fluxes involved in lettuce production within closed plant cultivation systems. Another work that employs Penman’s model is that of Weidner et al. [29], which investigates and compares the best-practice energy intensity of CEA systems (plant factories and open and closed greenhouses) for several climate zones.

3.1. Transpiration Model

In [30], Arcasi et al., examined the state of the art of evapotranspiration models. In this work, the Penman–Monteith model was used to calculate the transpiration rate. The Penman–Monteith (PM) model [28] is based on the assumption that the three-dimensional crop canopy can be reduced to a one-dimensional “big leaf” [25] in which net radiation is absorbed, heat is exchanged, and water vapor is released. The leaf absorbs radiation (in this case, artificial radiation produced by LEDs) and, as it is at a specific temperature (Ts), it exchanges a sensible heat flux with the environment. The radiation gives energy to the leaves to carry out the process of chlorophyll photosynthesis. The water absorbed by the plants through the roots travels up to the leaves and is emitted into the environment as vapor through the leaf stomas. Energy directly related to photomorphogenesis is limited and can be considered negligible [31]. Under stationary conditions, the energy balance is
R n e t Q s e n s Q l a t = 0
where
  • R n e t is the radiation absorbed by a leaf and it is a function of the number of leaves and their arrangement. It can be expressed as
    R n e t = ( 1 ρ o ) · P A R · ( 1 e x p L A I / 1.8 ) 0.8
    where ρ 0 is the reflection coefficient of the leaves, typically in the range [0.05–0.08], cf. [32]; P A R (photosynthetically active radiation [33] [W/m2] is the radiation available for the photosynthesis process to work; and L A I is the leaf area index, a parameter indicating leaf area in relation to cultivated area.
    L A I = S l e a f S c u l t i v a t e d
  • Q s e n s is the sensible heat flux exchanged between the leaves and the environment, determined by the fact that the temperature of the leaves T s is different from the temperature of the air around them T a . It can be expressed as
    Q s e n s = L A I · ρ a · C p a · ( T s T a ) r a
    where ρ a [kg/m3] is the density of air evaluated at T a , C p a [kJ/kgK] is the specific heat of the air evaluated at T a , and r a [s/m] is the aerodynamic resistance to the passage of heat and diffusion of water. For r a , Fuchs, ref. [34] proposed a method that integrates the mean leaf diameter (l), the uninhibited air speed ( u ) and L A I :
    r a = 350 · l u 0.5 · L A I 1
    with l [m] being the average leaf size and u [m/s] being the air velocity lapping the leaf. The aerodynamic boundary layer resistance influences the transfer of sensible heat and water vapor from the leaf surface into the surrounding air. It is made with the resistance to momentum transfer [35,36]. It has been shown, e.g., Stanghellini [26], that the transpiration of crops is only minimally dependent on the aerodynamic resistance of the boundary layer (as a consequence of thermal feedback). It is practical, however, to formulate standardized values for preliminary calculations for simplicity. An L A I of 3 [37,38] and a mean leaf size of 0.11 m [39] can be used for predictive, static calculations. Near the leaf surface, it is better to have low air speeds to avoid excessive mechanical stress. Considering an air velocity between the leaves of 0.15 m/s, we obtain a value of ra equal to 100 s/m.
  • Q l a t is the latent heat flux due to the mass exchange of water between the leaves and the air. It can be expressed as
    Q l a t = L A I · λ · χ s χ a r s + r a
    where λ [kJ/kg] is the latent heat of vaporization of water, χ s [gv/m3] is the concentration of vapor in moist air under saturation conditions at temperature T s , χ a is the vapor concentration in the humid air under conditions of temperature T a and humidity i a , and r s is the resistance of the stoma to vapor diffusion, which can be expressed as [25]
    r s = 60 · 1500 + P P F D 200 + P P F D
    where P P F D [ μ /m2s] is the density of the photosynthetic photon flux on the surface, i.e., photons with wavelengths in the 400–700 nm spectrum. Wang et al. [40] found that different R/B ratios (red light to blue light) in particular influence the r s of lettuce and illustrate the response of stomatal conductance to irradiance.
    Given the latent heat flux Q l a t , the flow rate of water evaporated by the leaves is computed by
    m ˙ v = Q l a t λ
To validate the model, experimental results (Wheeler) reported in [25] were used. In the study of Wheeler et al. [41], evotranspiration rates were registered daily and with the development of canopy cover. Their data were transcribed to determine the dry mass development in relation to canopy cover. The simulations for the validation of the model were carried out under the thermohygrometric conditions of the Wheeler’s experiment air temperature of 22.5 °C, 80% relative humidity, and P P F D of 293 μ mol/m2s.

3.2. Energy and Mass Balances

In order to calculate the air conditions at inlet, it is necessary to perform an energy and mass balance under steady-state conditions of the whole system. First of all, the thermohygrometric conditions for plant growth should be defined. Recent studies [42] show that modeling crop responses to temperature and CO2 (not investigated in this case) can guide real-time environmental adjustments, improving both yield and cost-efficiency. These strategies are well aligned with the AVF paradigm, which emphasizes system flexibility and responsiveness. In the present work, small leaf lettuce was considered, which has a set point condition defined in Table 2.
It is possible to write the energy balance as
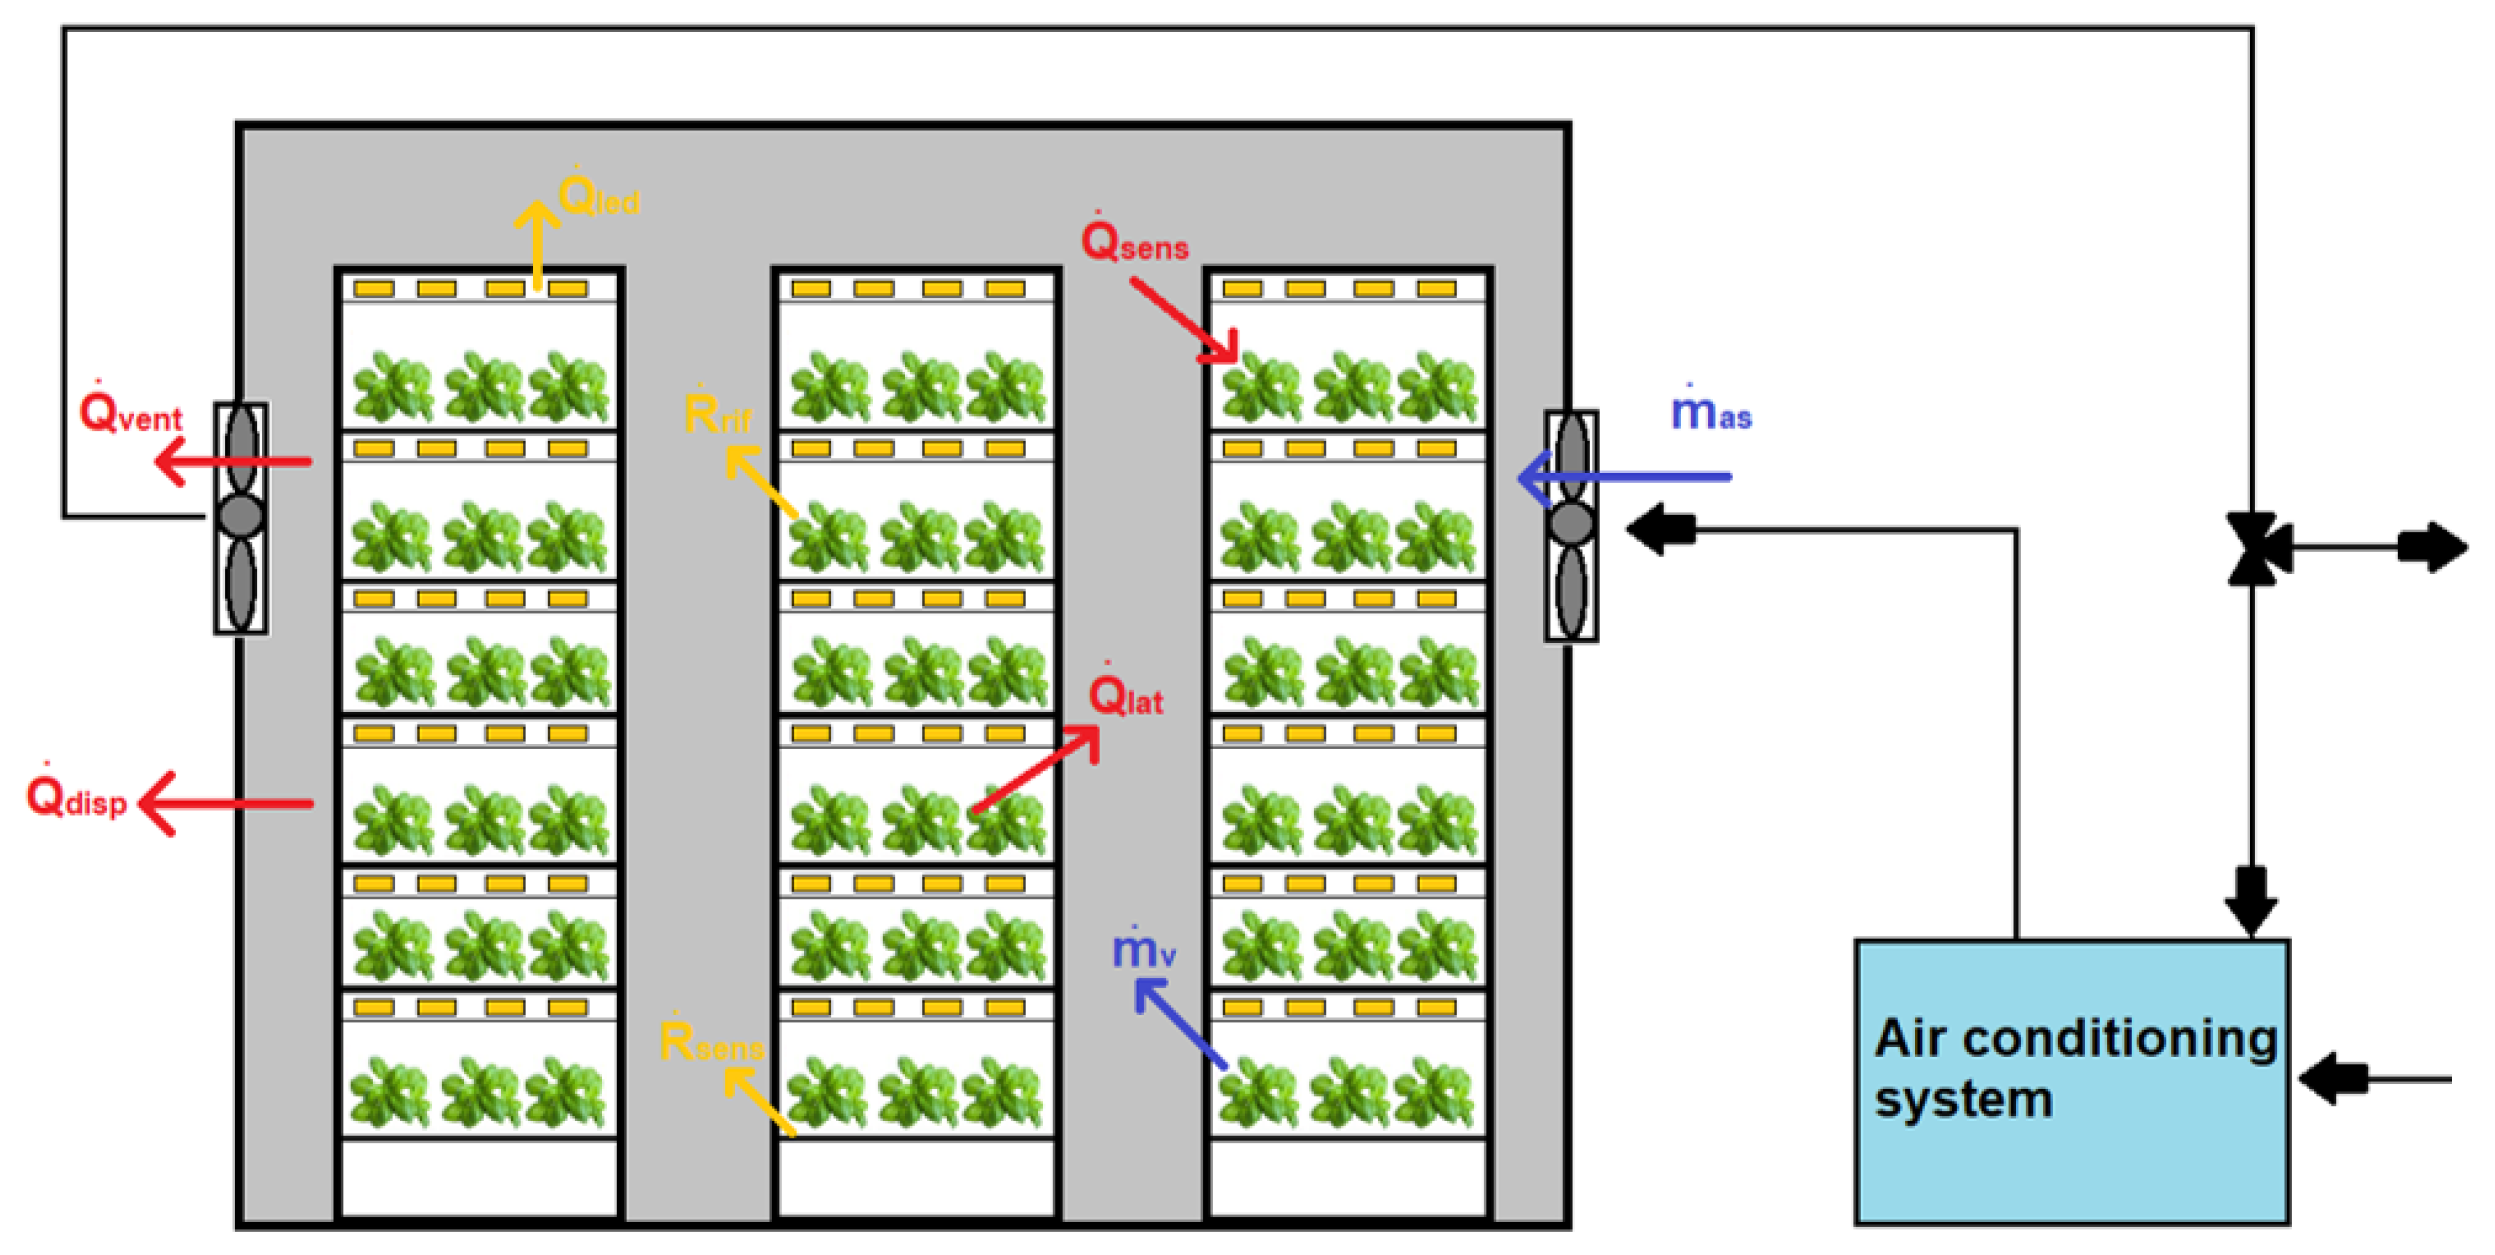
Q ˙ d i s p + Q ˙ l a t + Q ˙ s e n s + R ˙ s e n s + R ˙ r i f + Q ˙ l e d + Q ˙ v e n t = m ˙ a s · ( h a h i m )
where the different terms represent, respectively, the following:
  • Q ˙ d i s p is the contribution related to heat exchange through the shell of the structure, and is given by
    Q ˙ d i s p = i = 1 n K i · A i · ( T a T e ) + K b · A b · ( T a T t )
    where K is walls thermal transmittance, assumed to be 0.4 [W/m2K], A i the dispersing surface to the outside [m2], A b is the dispersing surface to the ground [m2], and n is the number of dispersing surfaces.
  • Q ˙ l a t is the contribution related to plant evapotranspiration and is defined as follows:
    Q ˙ l a t = L A I · λ · A c · χ s χ a r s + r a
    where A c is the cultivated surface, expressed in m2.
  • R ˙ s e n s is a contribution related to artificial lighting, specifically the heat flux that reaches the ground through radiation. It is assumed that this heat flux becomes sensible flux:
    R ˙ s e n s = P A R · ( A c A b f )
    where A b f is a portion of A c covered by the canopy, expressed in m2.
  • R ˙ r i f is another contribution related to LED illumination; it refers to the heat flux that, arriving on the leaves through radiation, is reflected by the leaf surface, and is given by
    R ˙ r i f = ρ 0 · P A R · A c · L A I
  • Q ˙ l e d is the last contribution related to artificial lighting. The term is the heat dissipated by LEDs, due to their non-unitary efficiency:
    Q ˙ l e d = ( 1 η ) η · P A R · A c
    where η is the led efficiency, assumed equal to 0.52 ([44]).
  • Q ˙ v e n t is a contribution related to air exchange within the shell
    Q ˙ v e n t = N · V c · ρ a 3600 · Δ h
    where N is the number of air changes per hour [h−1], V c is the conditioned volume [m3], and Δ h is the enthalpy variation [kJ/kgK].
    The conditioned volume is given by the base area of 1358 m2 multiplied by the height of the structure (6.5 m). It is assumed that the 272 racks occupy a portion of this volume equal to 35% in the traditional vertical farm and 40% in AVF. As the air handling system is an HVAC system, the term Q ˙ v e n t is included in
    Q ˙ H V A C = m ˙ a s · ( h a h i m )
    where m ˙ a s is the air flow rate processed by the system [kg/s], h a is the enthalpy content of indoor thermohygrometric conditions [kJ/kgK], and h i m is the enthalpy content of inlet thermohygrometric conditions [kJ/kgK].
  • Q ˙ sens is a contribution related to the sensible flux that the leaf exchanges with the environment:
    Q ˙ s e n s = L A I · C p a · A c · T s T a r a · v a
The mass balance is given by
m ˙ a s · ( y i m y a ) + m ˙ v = 0
where y i m is the hygrometric content of the air at system inlet [kgv/kgas], y a is the hygrometric content of the air at set point conditions [kgv/kgas], and m ˙ v is the vapor flow rate emitted by the plants [kg/s].
The leaf area index used is taken from an experimental study reported in the literature [45]. To obtain a daily estimate, the L A I curve was then derived as a function of days using the least squares method. The relationship obtained between the L A I and the day of cultivation ( D C ) is as follows:
L A I = i = 1 5 a i sin ( b i · D C + c i )
where a, b, and c are the L A I coefficients given in Table 3. The RMSE value is 0.02695. This curve is then trimmed to take into account only the growing days inside AVF and VF, thus excluding the germination phase which, as mentioned, takes place in a separate climate chamber for both greenhouses in our scenario. As the algorithm is based on well-known thermodynamic balance equations, there was no need to perform a validation.
The algorithm built in Matlab performs a series of operations (Equations (1)–(20)) to define the optimal input conditions at the close of balances for each day of the growing cycle under light and dark conditions.
h i m = Q ˙ d i s p + Q ˙ l a t + Q ˙ s e n s + R ˙ s e n s + R ˙ r i f + Q ˙ l e d + Q ˙ v e n t m ˙ a s + h a y i m = m ˙ v m ˙ a s + y a m a s = V c · N 3600 · v a
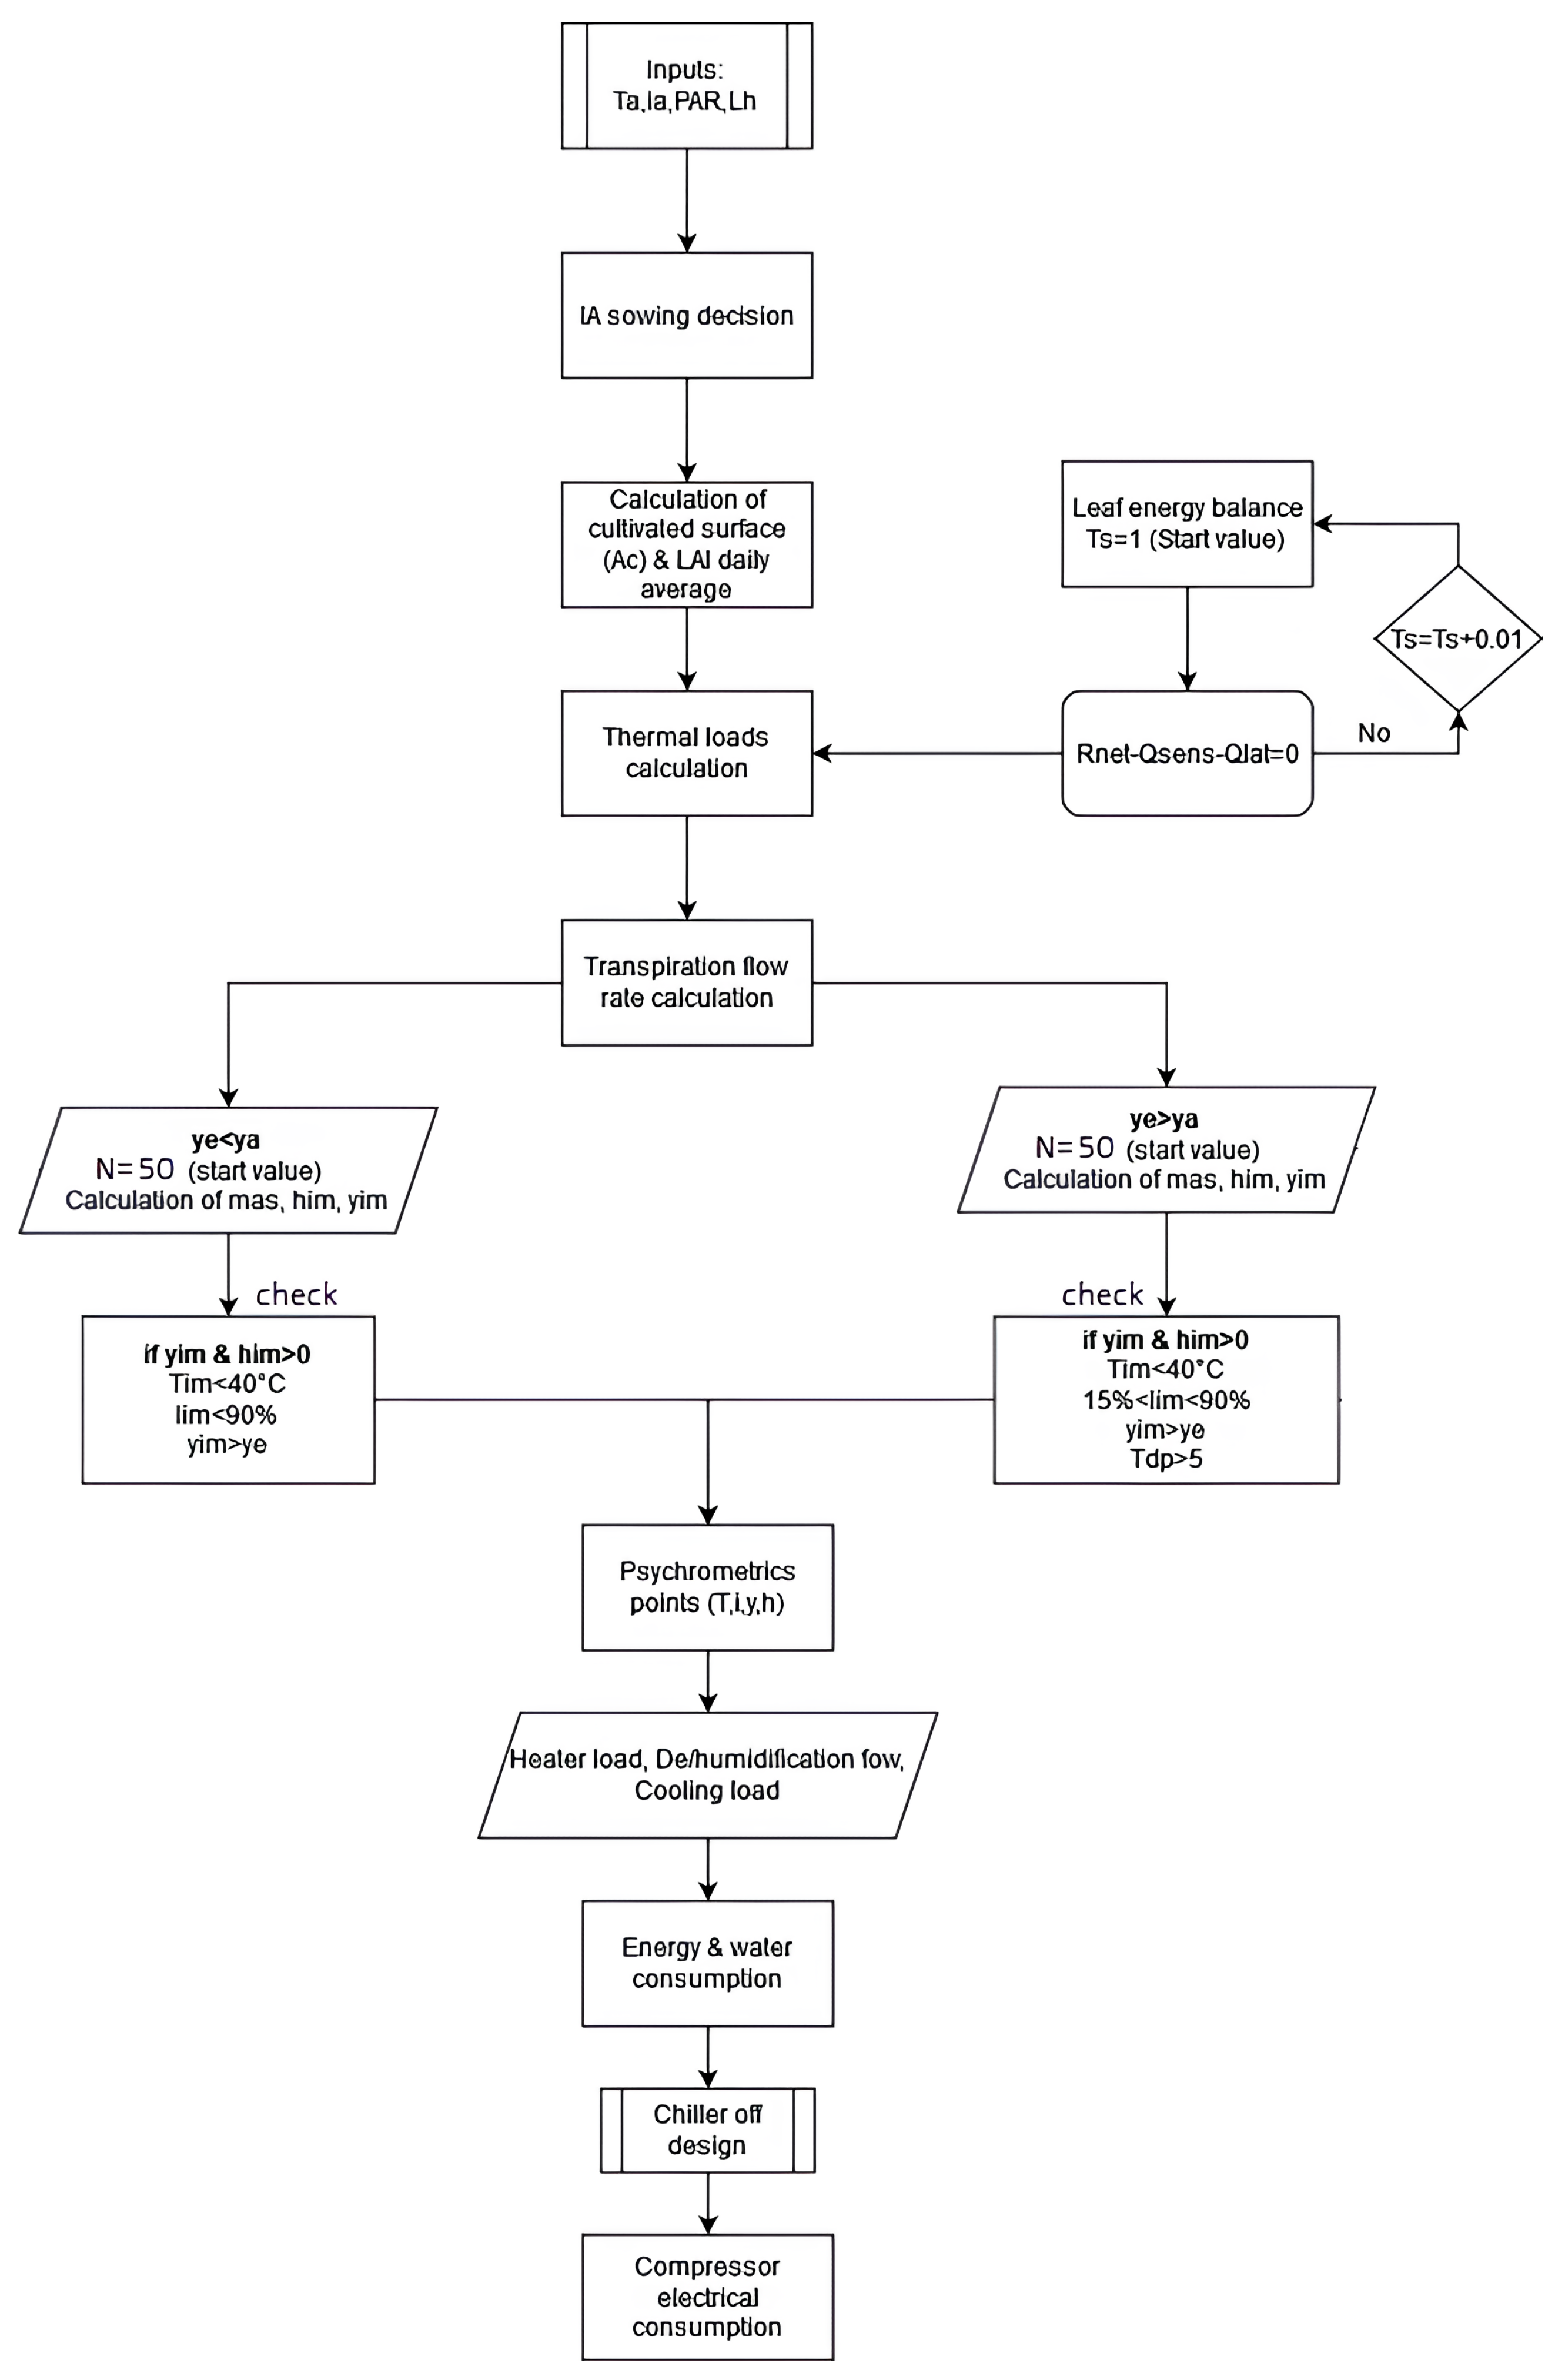
Each day, the algorithm calculates all the energy and mass loads, which can be seen in Figure 5, and then it finds the inlet conditions. The flow chart represented in Figure 6 resumes the series of operations performed by the algorithm. Once the inlet conditions are defined, the algorithm computes all the psychrometric points on the ASHRAE diagram and then reports all the loads of the HVAC system. Finally, once the evaporator load is known, there is a section that calculates the chiller off-design energy input to obtain the compressor energy consumption. Once the algorithm has calculated the airflow values for each day of the growing cycle, it will be possible to determine the inlet conditions of enthalpy and absolute humidity that the HVAC system has to reach with its components. In this work, a number of hourly changes of N = 50 h−1 was chosen to ensure the closing of mass and energy balances on each growing day and optimal control of indoor microclimatic conditions. The assumption of a constant ventilation rate of N = 50 h−1 is consistent with findings from CFD-based studies of plant factories [46] conducted by Gao et al., which demonstrate that higher air exchange rates reduce temperature stratification and humidity deviations, thereby enhancing microclimate uniformity above the crop canopy. However, excessively large N values may not further improve uniformity and would increase energy use. This ventilation rate ensures constant temperature and humidity to given set points. In addition, frequent ventilation reduces the risk of disease by eliminating spores and other pathogens in the air. N has been assumed constant and equal to the highest value found by the algorithm under steady-state conditions, also because technological limitations prevent having a variable capacity system that modifies the airflow by more than 10% from the nominal value. As reported from Okochi et al. [47], this would lead to issues of noise, increased pressure losses, and variation in the inlet velocity in the greenhouse, potentially causing problems for the cultivated plants.

4. Thermal Loads and Humidity

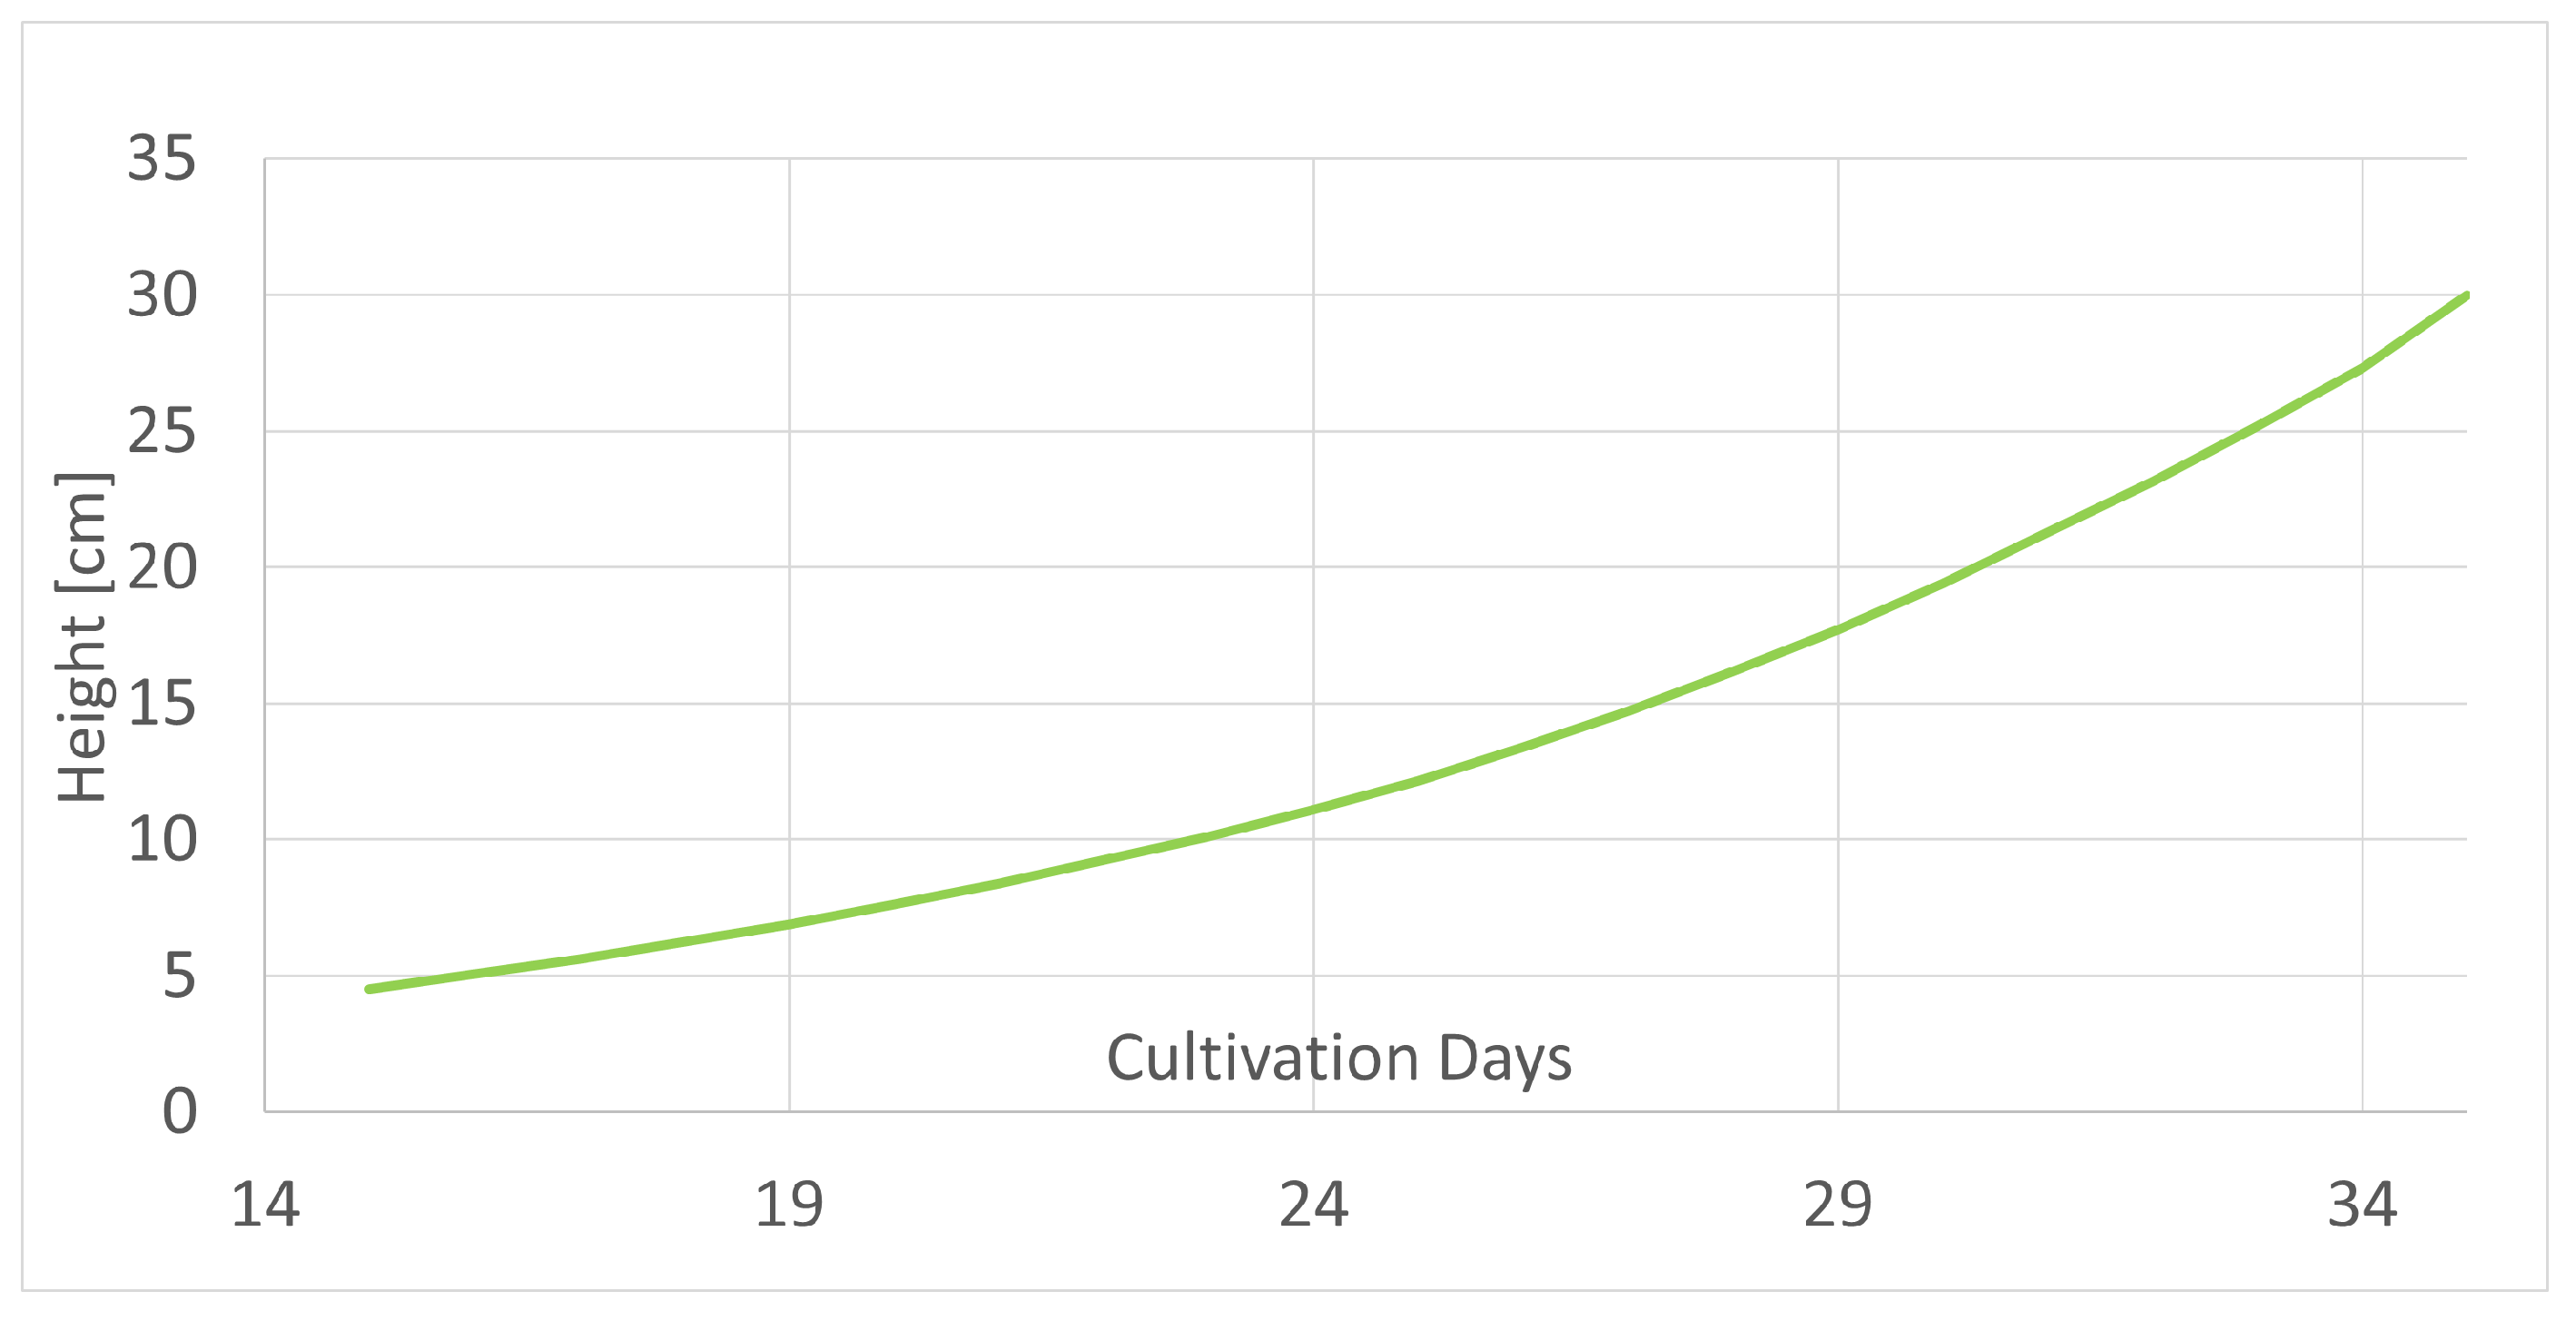
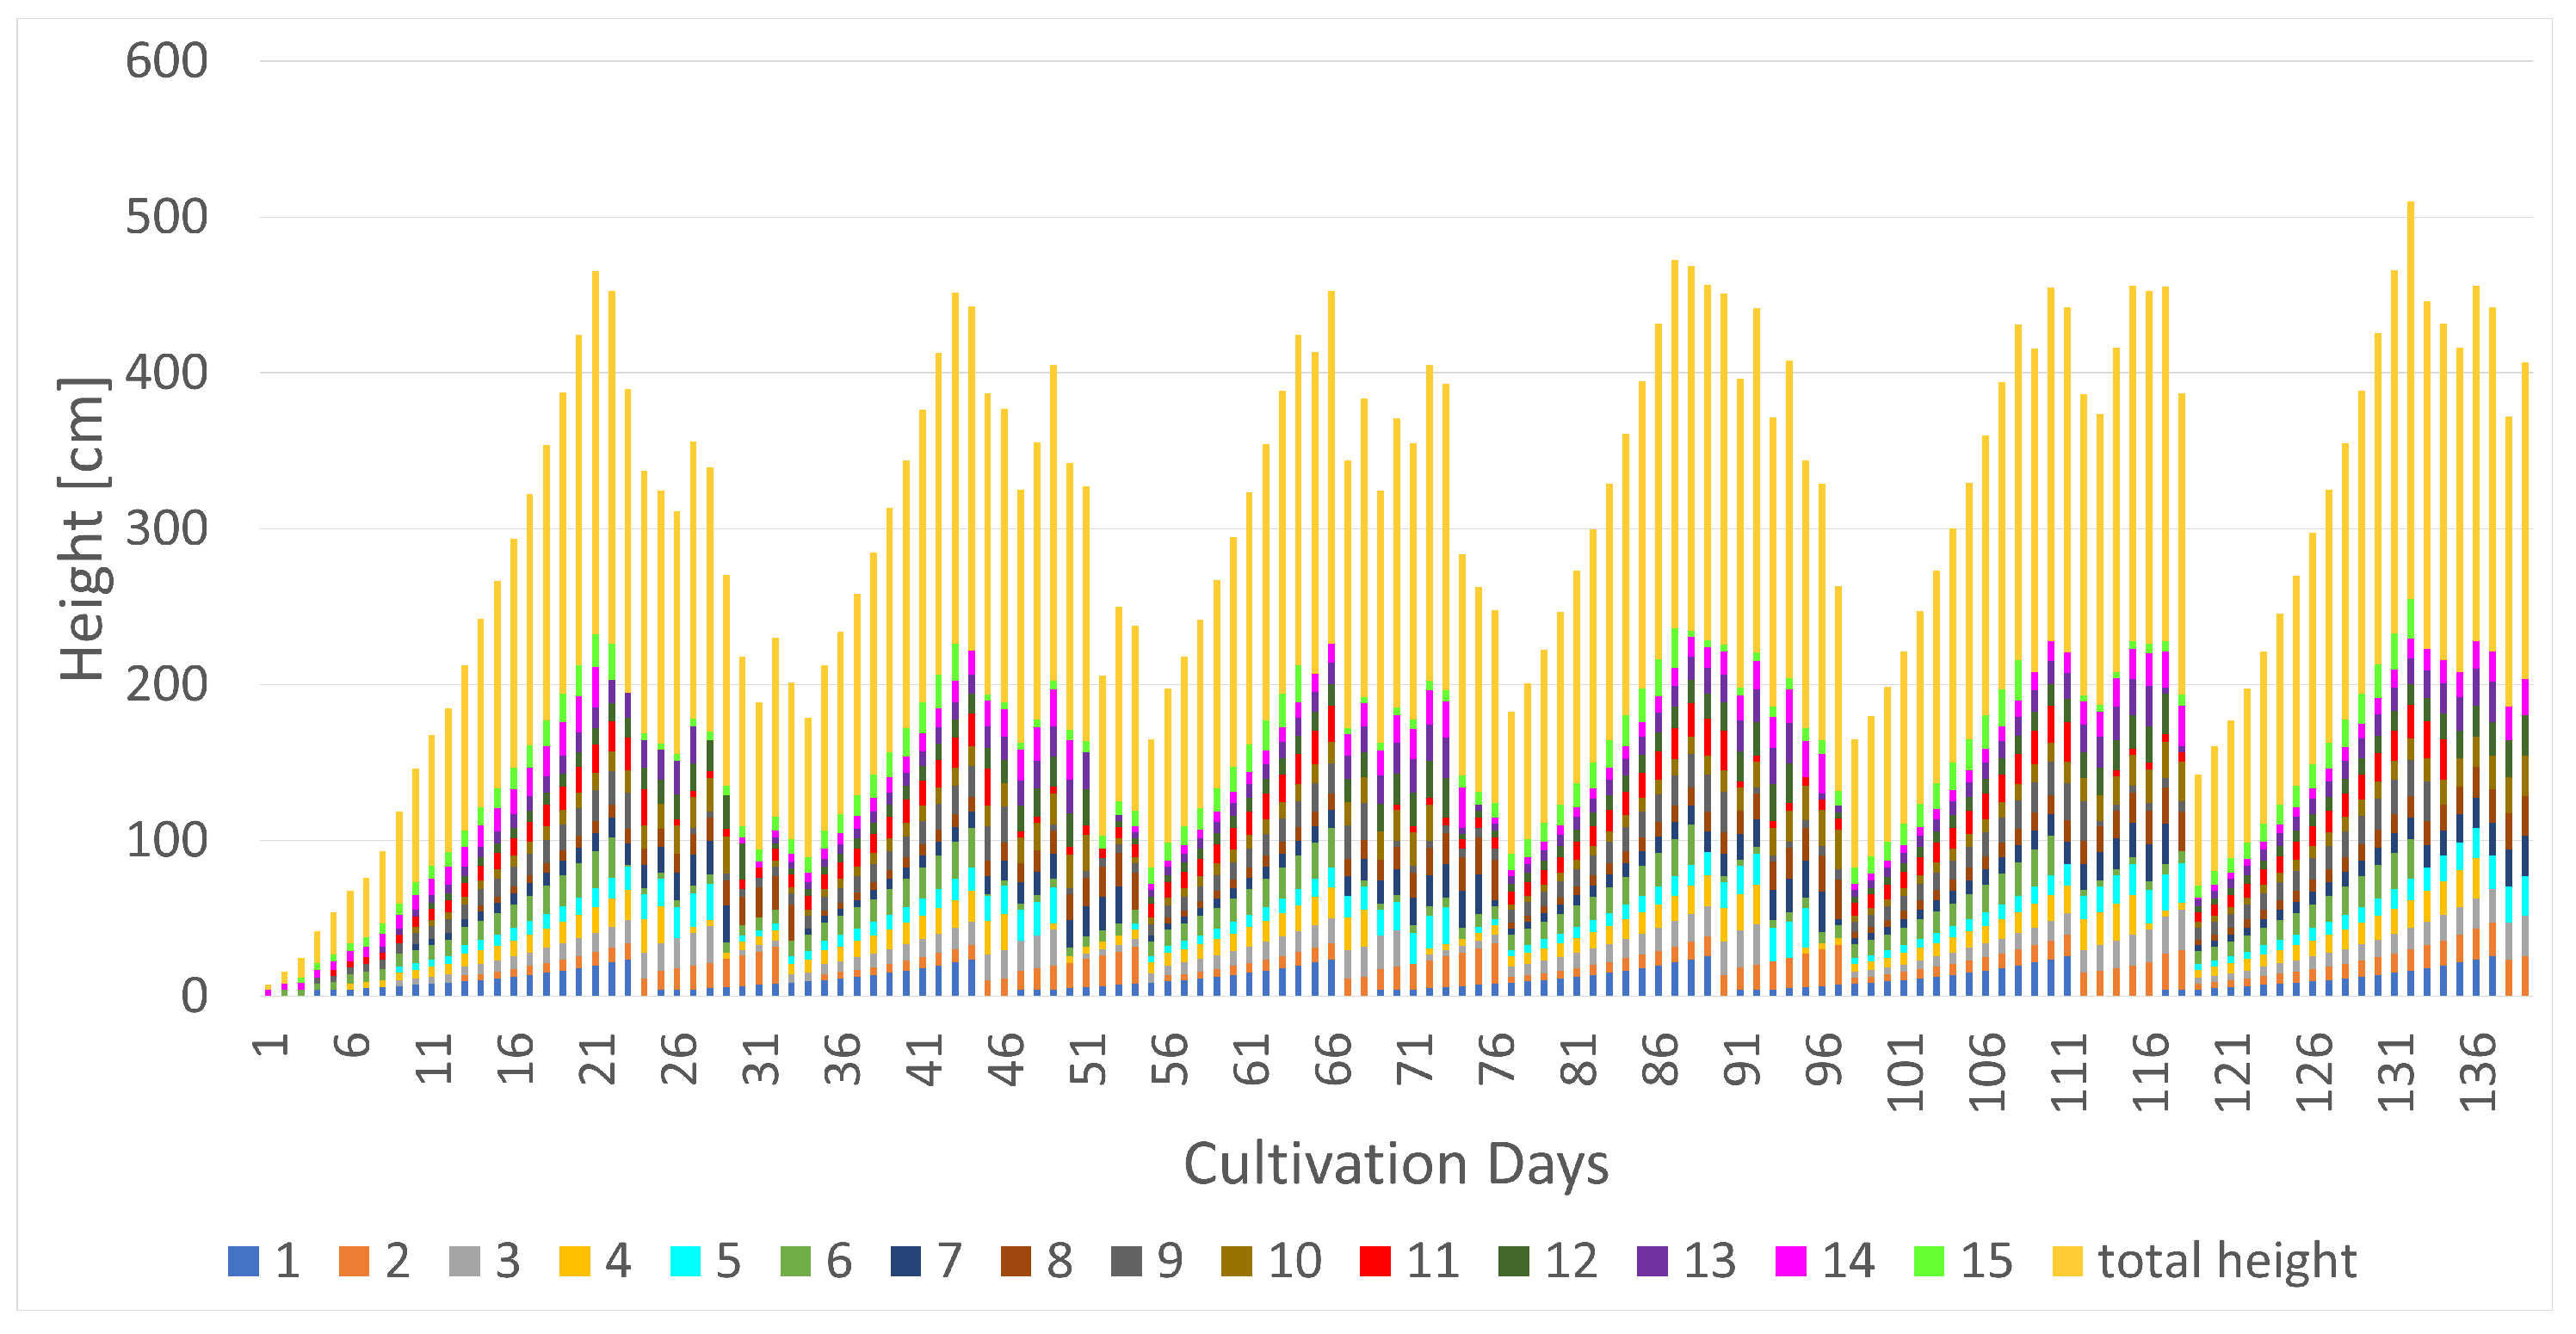
In [16,17,18], a scheduling approach of seedings was proposed that requires the solution of a mixed-integer linear programming problem to fully utilize all the available vertical space and maximize yield. AVF scheduling is reported in Table 4. The algorithm determines the days on which transplanting should take place, and calculates fundamental parameters such as L A I and cultivated area for each day. In order to optimally calculate the planting days in the different compartments, it is necessary to know the growth pattern of plants. Accurate growth curves enhance the sensitivity of the algorithm, leading to more precise results. The growth curve depicted in Figure 7 was used for lettuce [48]. Once the plant height trend is known, other parameters have to be established for the calculation. To provide a clearer understanding of the adaptive vertical farm (AVF) operation, the daily variation in the position of each shelf was analyzed. Figure 8 reports the evolution of shelf height during the cultivation cycle, highlighting how the system dynamically adjusts the spacing between shelves to accommodate plant growth. This adaptive mechanism allows for the maximization of the number of shelves within the same rack height, thereby improving land use efficiency compared to fixed-shelf vertical farming systems.
From the transplanting days in the greenhouse, the code calculates cultivated area and then the average leaf area index for each rack in the greenhouse. As the greenhouse is considered to be empty at the initial time in the simulation (see Figure 9), there is a “start-up transient phase”, corresponding to the first cultivation cycle in which the cultivable area is not yet maximized. It is followed by subsequent cultivation cycles, defined as “steady state”.
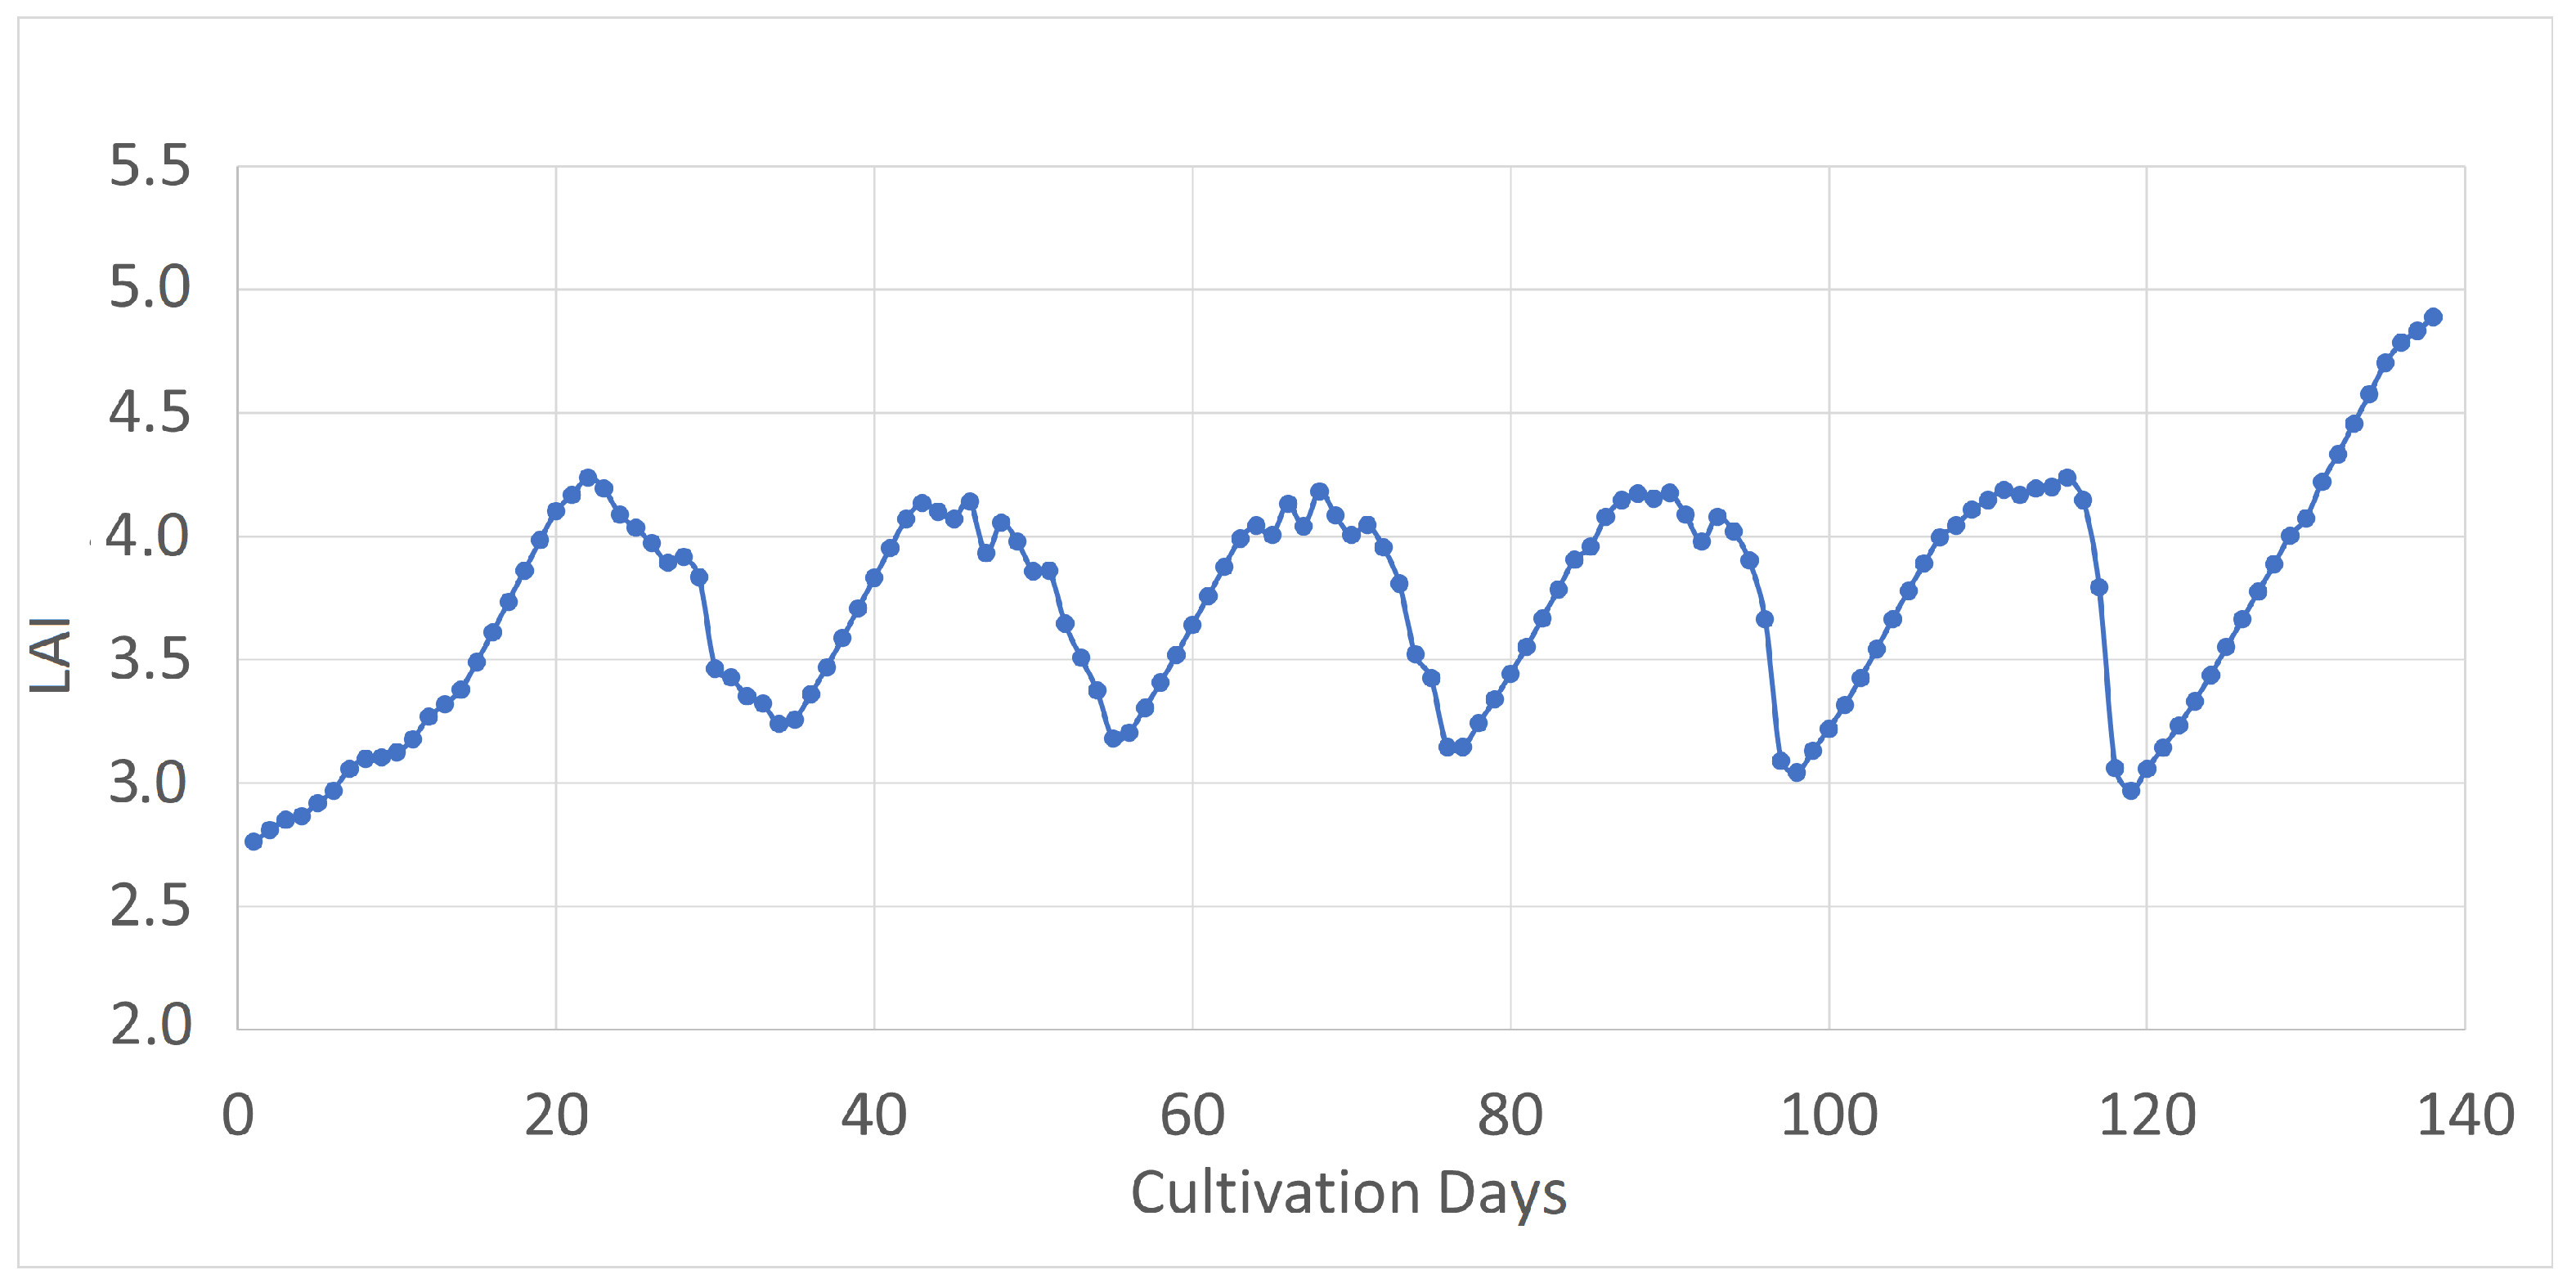
The L A I is one of the fundamental parameters influencing the energy consumption of a greenhouse, so the more accurate it is, the better the estimation of all plant-related thermal and water contributions will be. On average, therefore, due to non-coincidental sowing, the L A I tends to be lower in the adaptive greenhouse as, on the same day, there may be plants that are on day 21 of the cycle and plants that will be in the early days.
In the final phase, on the other hand, the plants will all reach the maximum L A I as no new crops will be added and, therefore, the L A I will be calculated on the last, most overgrown plants. Another key parameter resulting from the first calculation phase of the algorithm is the vapor output of the plants ( L A I in adaptive vertical farm is shown in Figure 10). Once these parameters have been estimated, the calculation of thermal loads can be performed. In particular, for the heat fluxes exchanged with the plants, an iterative calculation cycle is required to find the leaf surface temperature ( T s ). In such a cycle, the leaf temperature is updated until the energy balance at the leaf carries an error of 10−3.
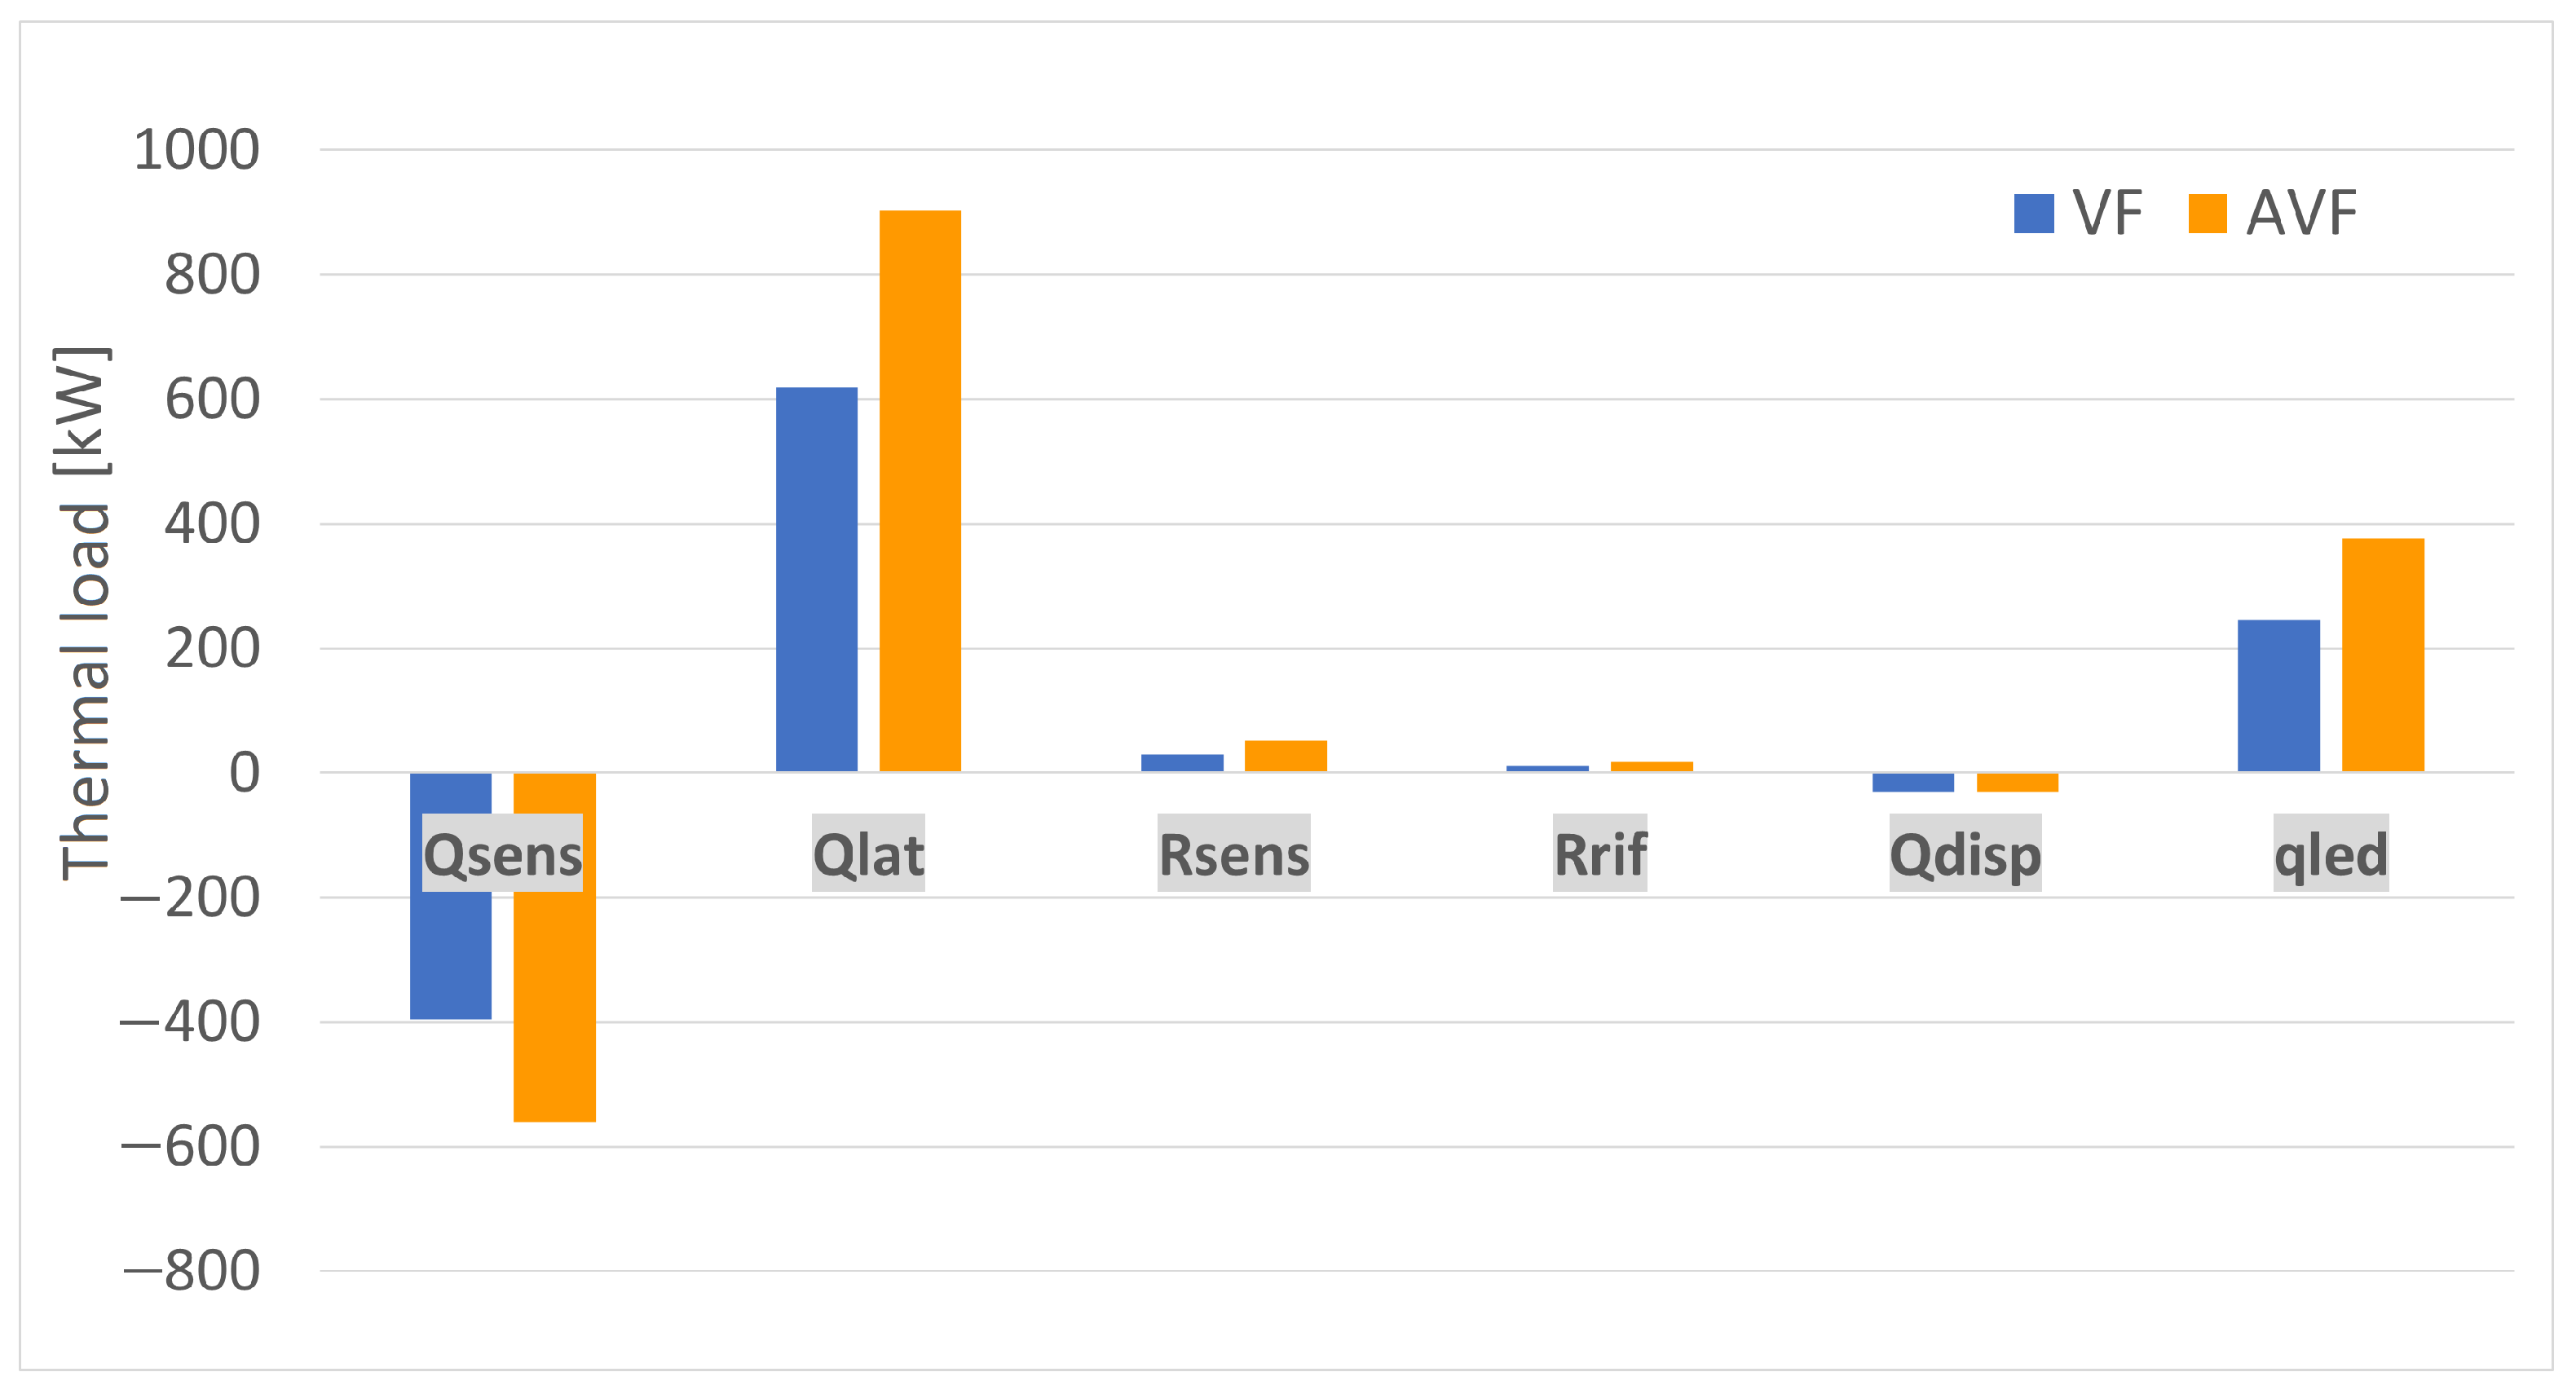
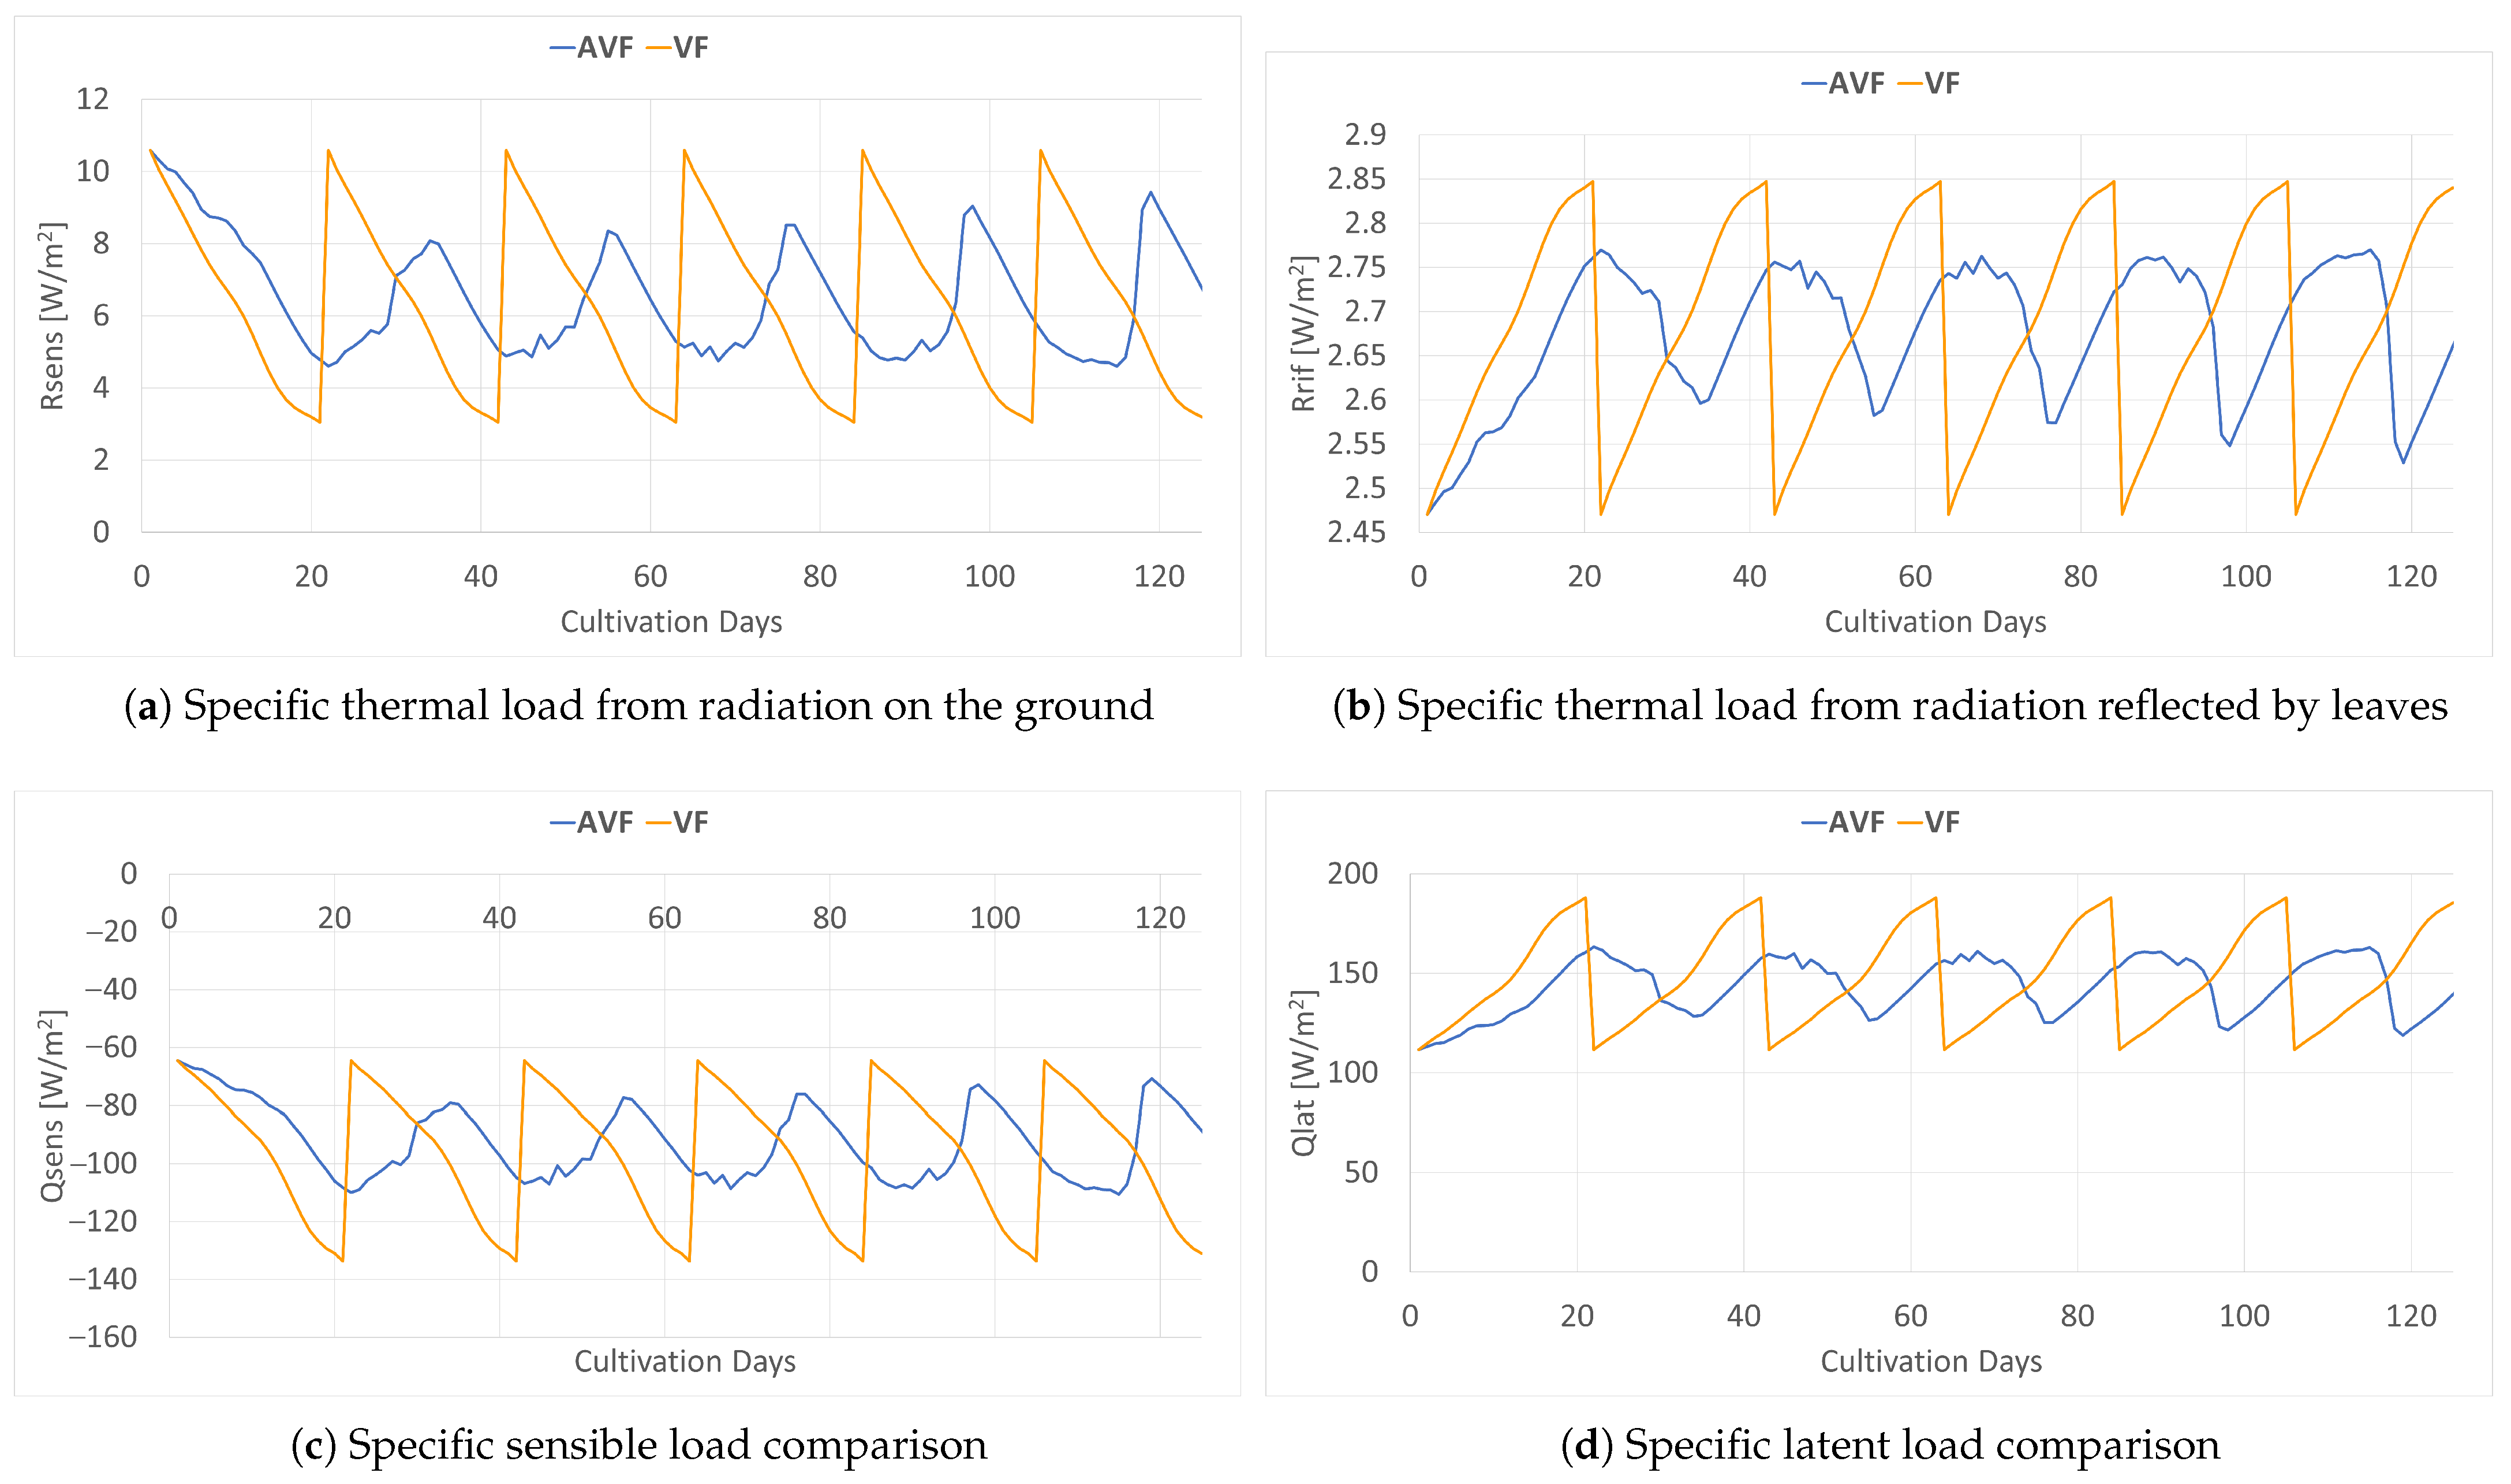
Figure 11 shows an example of thermal loads. It is evident how the larger cultivated area leads to a considerable increase in heat loads. As shown in Figure 11, the load that has the greatest impact is the latent load. The sensible flux exchanged between the leaf surfaces and the environment increases considerably, as does the latent one. The increase in the cultivated surface area leads to the need to operate with considerably higher thermal loads. Both of these parameters exhibit extreme temporal variability. This is due to the fact that they depend on several time-varying variables such as leaf area index, cultivated area, and leaf temperature.
A qualitative analysis of Figure 12 reveals that the integral of these specific loads over time is significantly lower in the adaptive system (AVF) compared to the conventional VF. This implies that the adaptive greenhouse operates with lower cumulative thermal loads throughout the cultivation cycle. This difference lies in the fact that both the sensitive and latent loads are proportional to the cultivated area and the leaf area index. As explained at the beginning of the paragraph, the adaptive greenhouse has a slightly lower average daily L A I than the traditional greenhouse, which results in lower specific loads compared to VF.
Especially on certain days, as observed in Figure 13, the L A I of AVF has lower values than that of VF. If we consider the coeval case, in VF the cultivated area is constant and always equal to the maximum value of 4439 m2 (except on days when new seedlings are transplanted). As shown in Figure 12, every 21 days there is a peak in heat loads. On seedling renewal days, it can be seen that AVF has higher specific loads. This highlights how the L A I plays a key role in energy consumption. On the days when the new plants are transplanted, in fact, VF has a lower L A I , because the plants still have small leaves. In the adaptive greenhouse, on the other hand, as the sowings are not coeval, the leaves are larger on average, which implies an increase in heat loads.
The heat flux of irradiation impacting the soil R s e n s due to LEDs tends to decrease during each cultivation cycle (as shown in Figure 12), because of the increase in leaf area. In the adaptive greenhouse, there are more fluctuations, again due to the non-coincidental sowing that continuously changes the irradiated surface. In the first days of the start-up transient, AVF shows higher values than VF. This difference is related to the fact that the average daily L A I is lower in the AVF system, which leads to a reduction in the crop area coverage and, thus, to a smaller leaf area projected onto the ground. Subsequently, there are phases in which the adaptive greenhouse has a prevailing load and phases in which the load of VF prevails. In general, VF always has a higher load during the first days of cultivation in the steady-state cycles due to the smaller leaf area present during transplanting. The contribution due to the thermal radiation reflected by the leaves R r i f , on the other hand, is expected to increase over time (Figure 12), which is related to the continuous growth of leaf area. As this parameter is proportional to the cultivated area and leaf area, it is higher for the VF (during the start-up phase) due to the higher average L A I . During the steady-state cycles, however, the load of the system with the larger leaf area dominates. Heat flux dissipated by LEDs is directly proportional to the cultivated area (Figure 14). It is logical, therefore, to expect a constant trend in the heat flux dissipated by LEDs for VF in the coeval case. It is more interesting, however, to observe the trend of the flux dissipated by the LEDs of the adaptive greenhouse, which follows the cultivated area trend.
Once the heat loads have been calculated, the transpiration rate emitted by the plants can be estimated. All these parameters are closely related and have an impact on the calculation of the vapor flow rate. As expected, the adaptive greenhouse produces more transpiration than the conventional one. The strong fluctuations observed in Figure 14 are related to planting and harvesting phases that change both the cultivated area and the average daily L A I . During the night, when there is no sunlight, plants stop photosynthesis, and their stomata close. As a result, transpiration decreases significantly or stops altogether. This occurs because plants do not need to absorb carbon dioxide and there is no light energy available to carry out the photosynthetic process. As a result, plants reduce transpiration during the night. The present work is limited to a single ET estimation approach (Penman–Monteith) tailored to controlled-environment systems. However, recent advances have shown that integrating multimodal data with more complex models, such as the UAV-calibrated TSEB for rice paddies [49], can significantly improve the accuracy of energy flux and ET estimation. Extending such approaches to vertical farming scenarios may further refine the prediction of crop water demand and energy exchanges.

5. Results and Discussion

5.1. General Approach to Other Scenarios

The presented analysis is valid specifically for lettuce cultivations but can be easily extended to other crop types provided there are proper experimental data about L A I and relationship between growth rate and thermohygrometric conditions. Furthermore, other scheduling strategies can be analyzed, as shown below. The results reported consider outdoor climatic conditions of 30 °C and 80% relative humidity. In the simulations carried out, an identical plant configuration was used for both cases studied (VF and AVF), naturally sized according to the thermohygrometric loads of each greenhouse.
The analysis is carried out under stationary thermohygrometric conditions (both indoor and outdoor). Sowing is managed using the optimization algorithm described in [16,18] that searches for the best day to transplant the seedlings during the growing cycle. The germination phase is managed separately in a dedicated climate chamber and lasts 14 days. The simulations conducted for VF involved several non-coeval seeding strategies and one with the coeval seeding mode:
  • Coeval transplant: All transplantation takes place in one day.
  • Scheduling 1: Transplantation takes place so that the VF is 1/3 filled every week.
  • Scheduling 2: The algorithm used to decide the transplantation days is the same as in AVF but with only 8 shelves.
  • Scheduling 3: The algorithm used to decide the transplantation days is the same as in AVF; in this case, the racks are divided into 15 groups: 13 groups of 18 racks and 2 groups of 19 racks. In this case, the algorithm decide by group and not by shelves.
The strategy of non-coeval sowing, in AVF, allows for an increase in the number of rooms and thus more cultivable area with the same number of racks. As the adaptive greenhouse needs a certain period to reach full capacity, it is worthwhile observing what happens once this period has elapsed. Already after a first cultivation cycle, it can be seen that the cultivated area is almost maximized. The L A I trend, shown in Figure 15, used for the traditional vertical farm is that of the baby leaf lettuce from an experimental study reported in the literature [45]. For VF, the L A I does not fluctuate as much as in the adaptive greenhouse. As sowing in the adaptive greenhouse is conducted on different days, there will be a different L A I in each compartment in the racks. As mentioned above, it was appropriate to make an estimate of the average daily L A I , shown in Figure 13, that is representative of the situation that occurs on average in each rack. The L A I is one of the fundamental parameters influencing the energy consumption of a greenhouse, so the more accurate it is, the better the estimation of all thermal and water contributions related to the plants will be. On average, therefore, due to non-coherent sowing, the L A I tends to be lower in the adaptive greenhouse as, on the same day, there may be plants that are on day 21 of the cycle and plants that will be in the early days. The trend of the average daily L A I for all the different scheduling and for coeval seeding is shown in Figure 13. As can be seen, the most disadvantageous L A I is present in the case of coeval seeding, i.e., when the transplanting of species occurs simultaneously in all racks. In this way, the situation is certainly more homogeneous but this approach is also less realistic as it would require a high degree of automation of the system. The L A I of the AVF system follows a trend that fluctuates greatly, as mentioned earlier, due to the variability of the transplanting period in each individual rack. Because of this, there are days when the L A I of the VF has higher values than that of the adaptive greenhouse, thus leading to higher consumption. However, the former scheduling is disadvantageous compared to the latter because it still leads to greater homogeneity of sowings by having more species present late in the growing cycle. The second scheduling following the AVF decision algorithm still ensures greater variability between different L A I shelves. Thus, overall, we will have a lower L A I than scheduling 1. Scheduling 3 is conducted in such a way as to cancel out the difference that exists between adaptive L A I and the traditional one; in fact, the two values will be the same for all growing days, as can be seen in the figure.

5.2. Energy Consumption for Air Conditioning

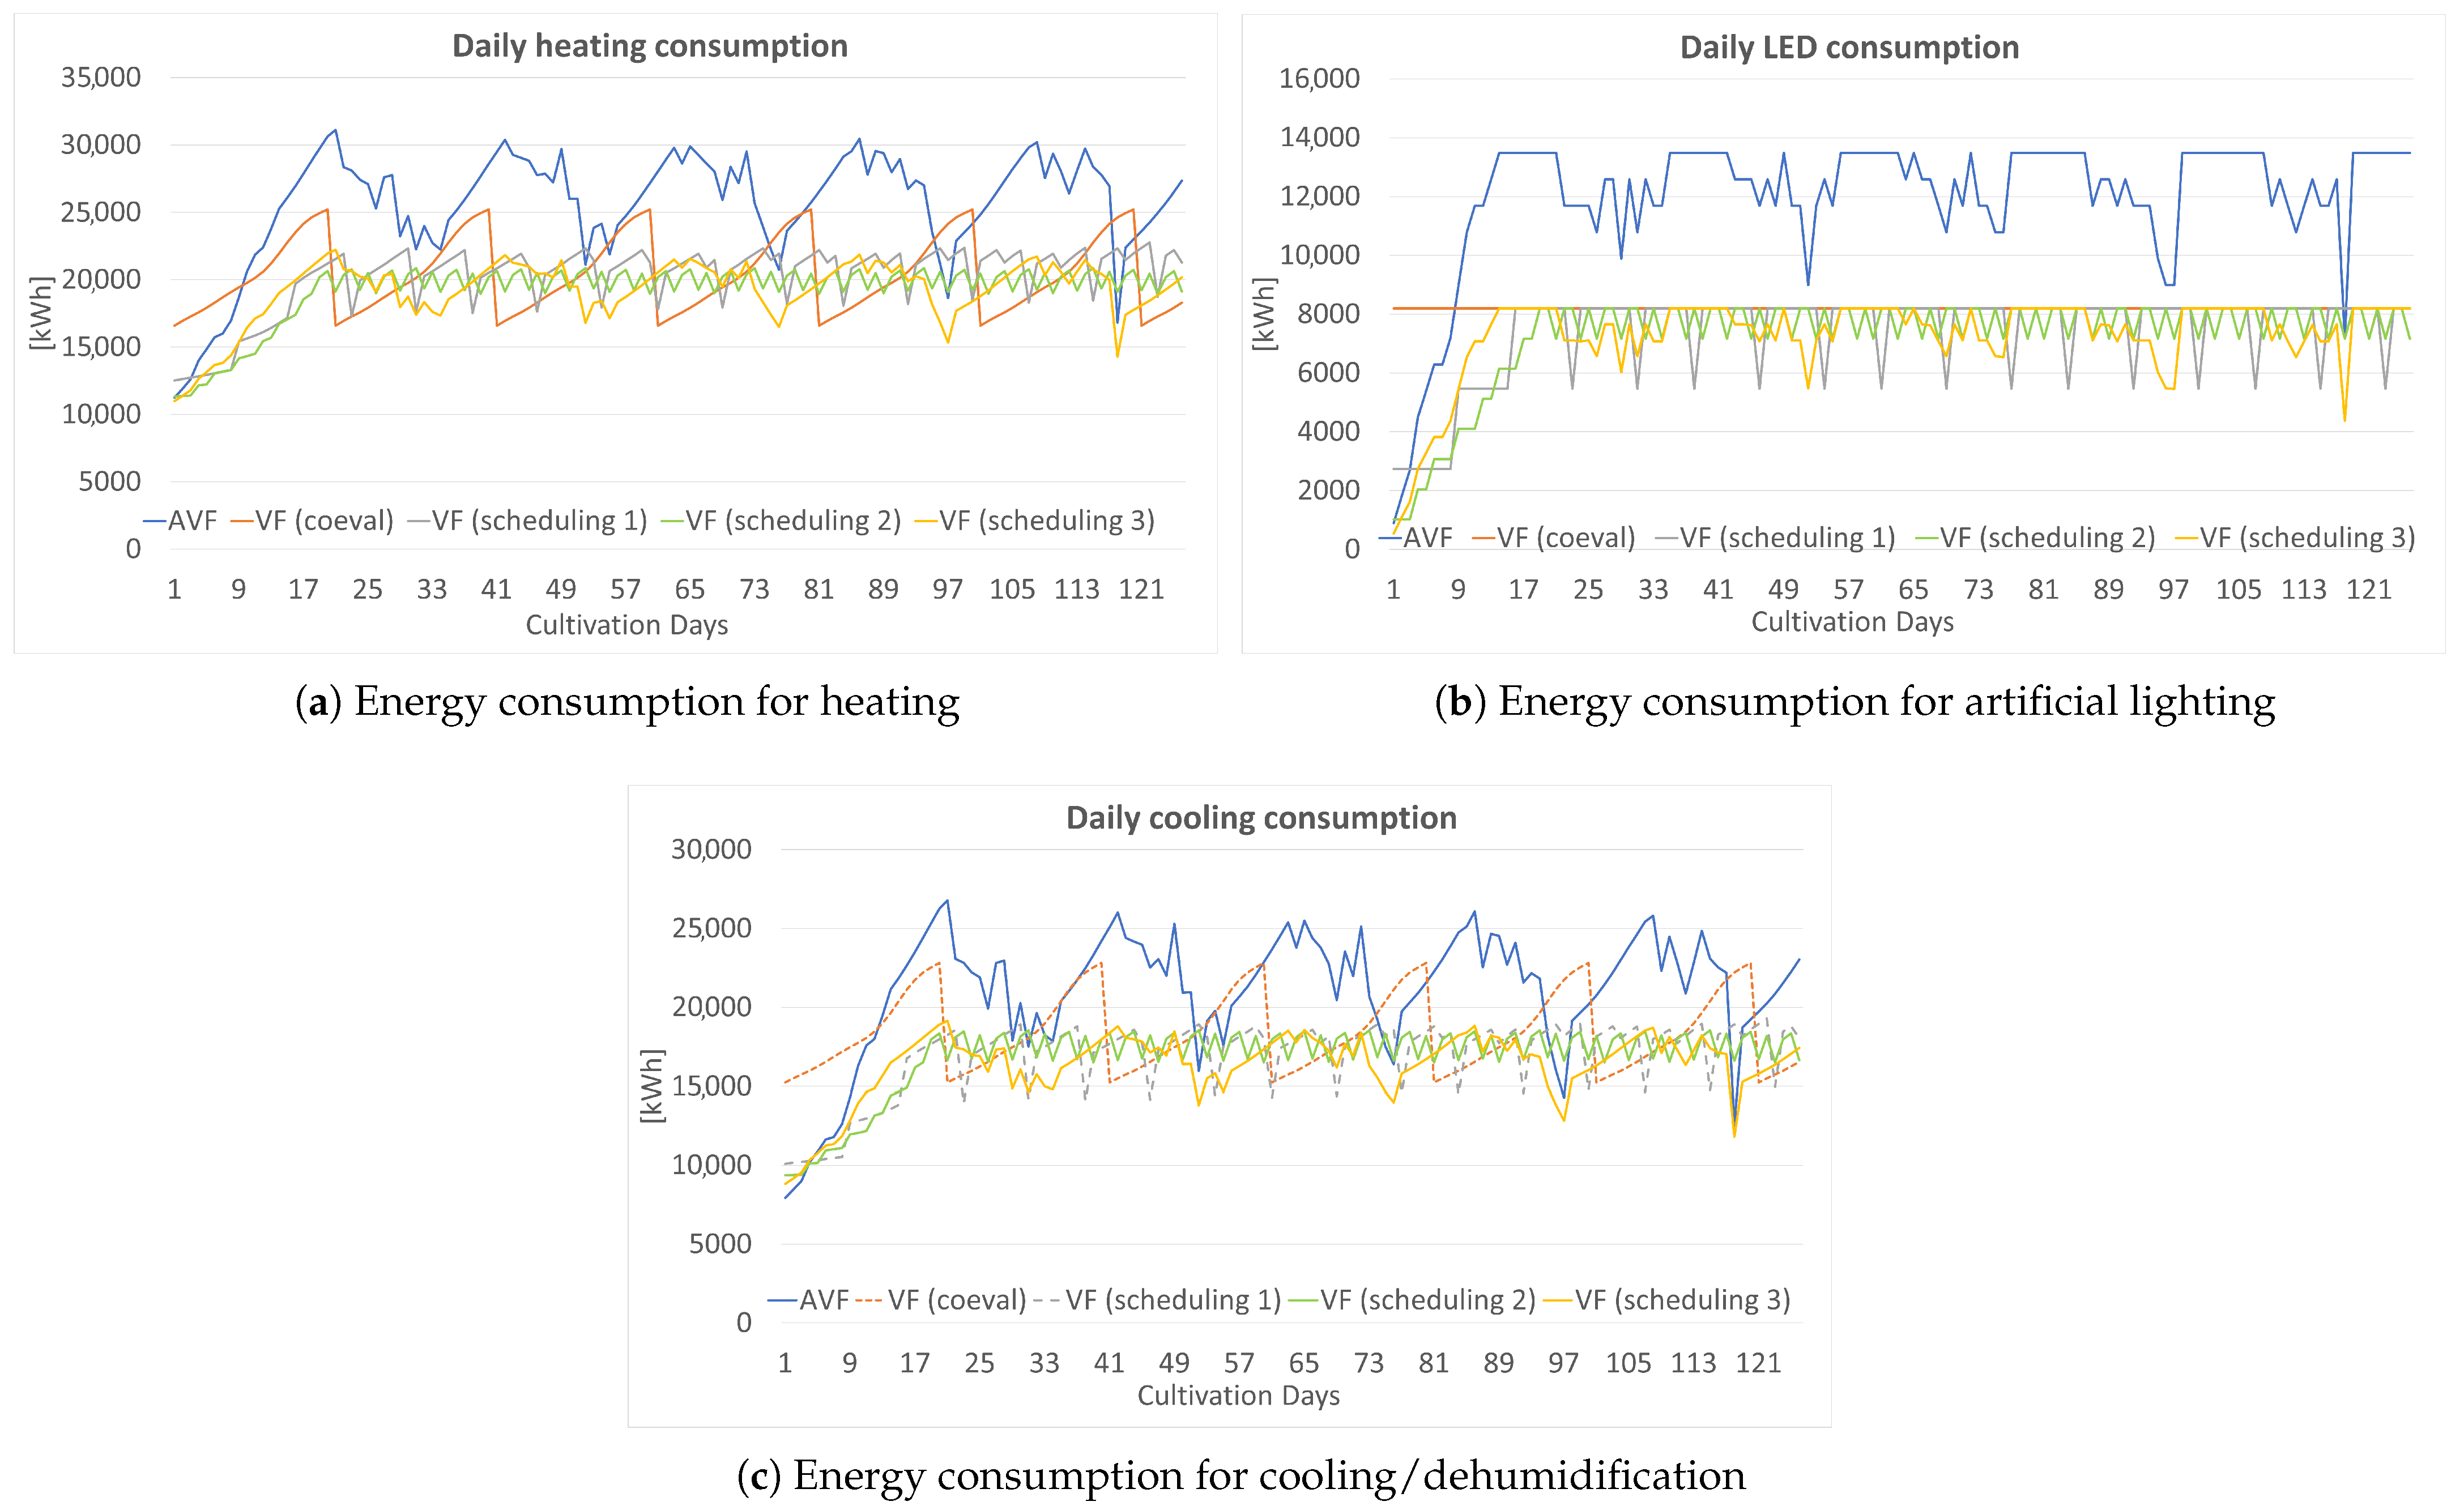
All consumptions are calculated after the first cultivation cycle, to ensure that the AVF system conforms to the regime. The first thing observed is the extreme variability of heating consumption. This is undoubtedly linked to the variation in heat loads during the plant transplanting, sowing, and harvesting phases. In particular, every 21 days or so, a minimum value of consumption can be observed, no doubt dictated by the lower energy requirements of the system due to the lower presence of plants. Similarly, before 21 days (and thus before harvesting), a maximum value of consumption can be discerned.
Figure 16 shows the difference that exists between AVF and VF in all different scheduling configurations. Again, the same considerations made for L A I are reported here; the coeval VF case will be the most energetically disadvantageous, due to the large number of plants in the environment simultaneously.
The energy consumption of LEDs is directly proportional to the cultivated area. It is logical, therefore, to expect a constant consumption trend for the conventional greenhouse; it is around 8000 kWh/day. In AVF, the lightning consumption is variable (Figure 16) due to the cultivation surface variation. Clearly, the more compartments grown, the higher the artificial lighting to be provided to the system. The same applies to all the different scheduling modes suggested. Of course, the upper limit is obtained when the greenhouse reaches the regime situation with the maximum cultivated area.
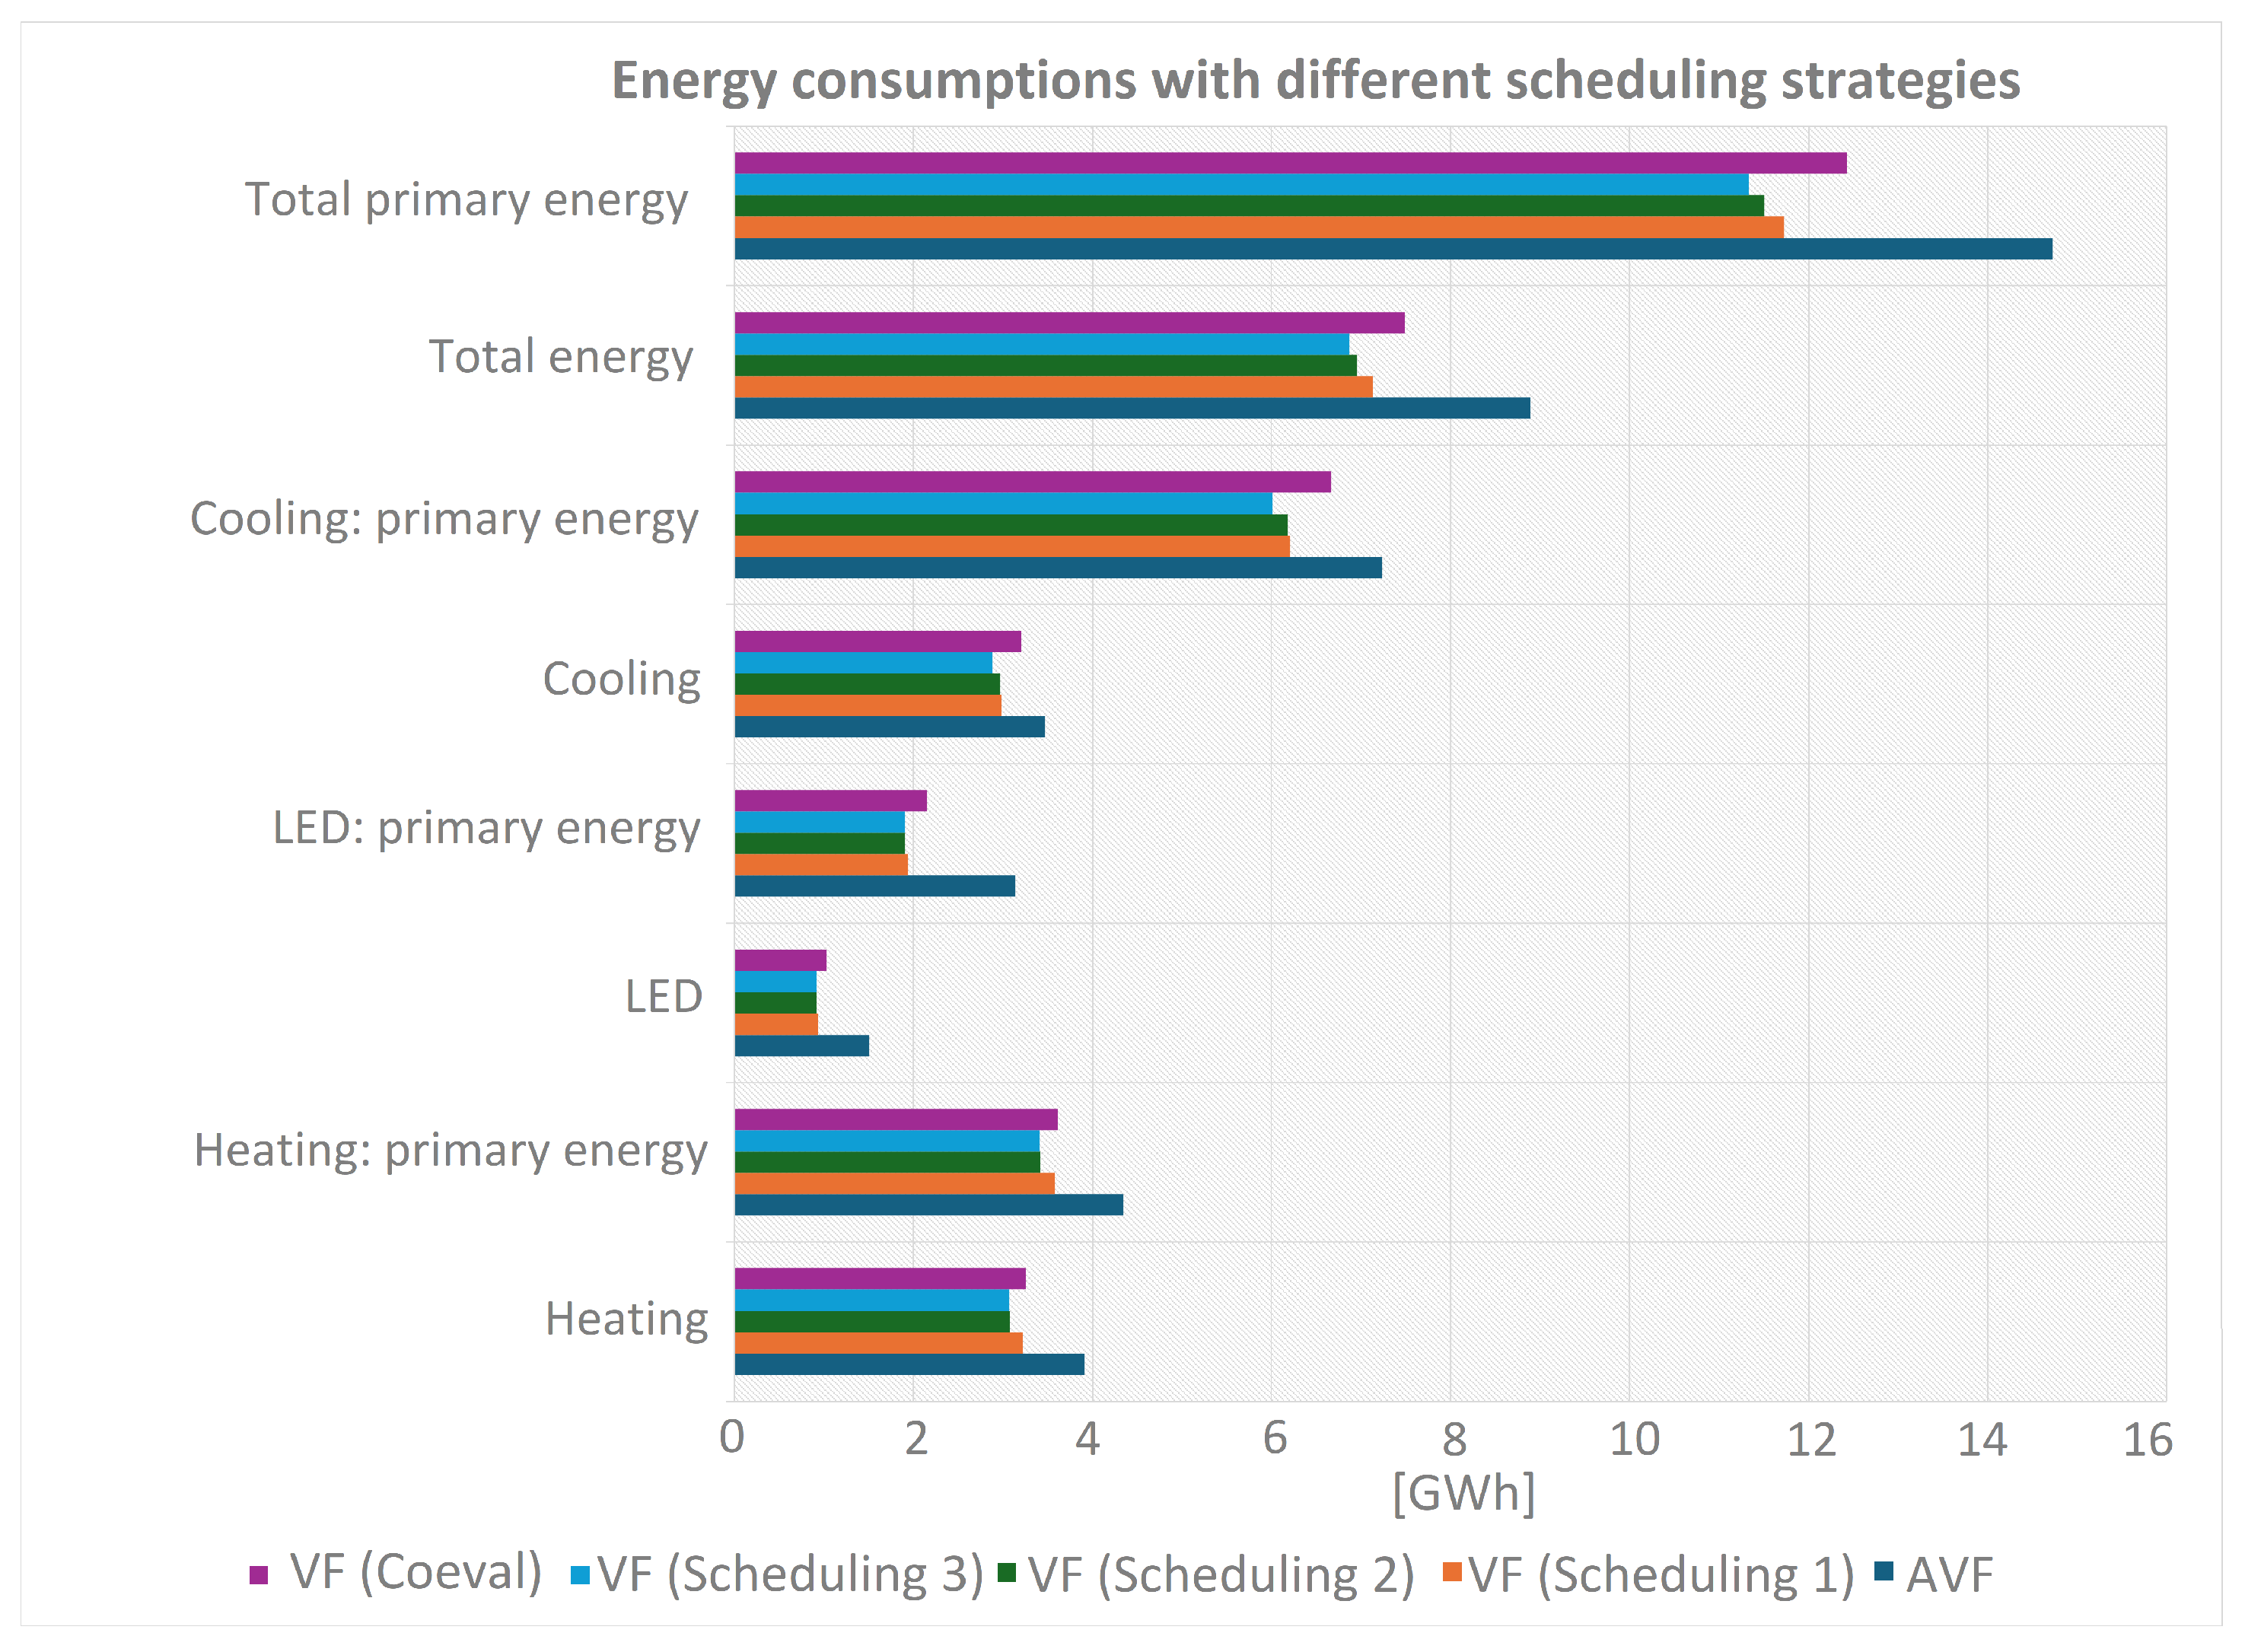
The control unit, by examining the signals sent by the sensors located throughout the system, calculates the optimal temperature to be ensured by the refrigeration cycle to the evaporator. This parameter is essential to ensure adequate dehumidification of the treated air. The second component of the HVAC system is a hot coil that heats the air to the desired enthalpy level for the input conditions. Dehumidification consumption also varies widely throughout the growing cycles (Figure 16). These variations are essentially due to the growth of the plants, which, by increasing their leaf area ( L A I ), will tend to emit a greater transpiration rate. Of course, another parameter influencing this consumption is the cultivated area. Essentially, in the traditional greenhouse, the latter parameter is assumed to be constant (in the coeval case), so the consumption trend is the same as the L A I ; in the adaptive greenhouse, on the other hand, consumption is influenced by both the leaf area and the cultivated area (which varies day by day due to non-coincident sowing). Even in this situation, the peaks present in the case of coeval sowings of VF exceed all the case histories of VF with different scheduling, and in some cases even the consumption of AVF. All the contributions of energy consumption are shown in Figure 17; as expected, consumption is higher in the AVF, as there is more cultivated area. Summarizing what was seen, the energy consumption is shown in Table 5. In addition, it is important to bring energy contributions all to the same level. Here, to obtain a better view of the energy system, the various contributions in primary (thermal) energy are reported. For this reason, the values of energy consumed for heating are divided by the average efficiency of a boiler (90%). Electrical energy values, on the other hand, will be related to the national generation efficiency value (in Italy, for example, it is 48% [50]).
As can be seen, the consumption of the adaptive greenhouse is higher for all three components: heating, lighting, and cooling. However, reaching the steady-state condition leads the adaptive greenhouse to cultivate an area of 7303 m2, compared to 4439 m2 for the conventional greenhouse. Parameterizing the total consumption on the respective cultivated area shows that the specific consumption is as follows:
  • Scheduling 1: AVF energy saving is 24%.
  • Scheduling 2: AVF energy saving is 22%.
  • Scheduling 3: AVF energy saving is 21%.
  • Coeval: AVF energy saving is 28%.
The reason behind this energy saving is mainly related to the smaller volume that needs to be conditioned in the adaptive greenhouse (due to the larger number of shelves in the racks) compared to the standard vertical farm. In addition, the scheduling of the AVF combined with the greater number of shelves per rack allows an average daily L A I that fluctuates much more than a greenhouse with fewer shelves. In fact, as can be seen in Figure 13, when the L A I drops to lower values compared to the VF, reduced consumptions for the adaptive greenhouse result. Moreover, the results confirm what we have seen so far, namely, that in the coeval seeding strategy, consumption is the highest compared to all other case histories, precisely because of the lower L A I fluctuation.
In addition, the consumption comparison was made under the same conditions and without delving into the nature of energy inputs of the air conditioning system. For this reason, it will be interesting to investigate this issue by introducing an air handling system with a boiler heating unit and heat recovery systems from the condenser and the air leaving the greenhouse to minimize the heating energy expenditure. Despite the promising results of the AVF system in terms of energy efficiency and cultivable area, several limitations of the present study should be acknowledged. First, only a single crop species (Lactuca sativa) was investigated. Extending the analysis to multiple species would require providing the model with species-specific growth curves (plant height over time) and leaf area index ( L A I ) dynamics. Unfortunately, such data are still scarce in the literature, and additional experimental measurements would be necessary to obtain reliable inputs. Second, the integration of AVF systems with urban energy grids has not yet been investigated. Given the high energy demands of vertical farming, assessing grid interactions, potential demand–response strategies, and energy storage solutions will be crucial for evaluating the sustainability of large-scale AVF implementations. Addressing these limitations is essential for guiding future research toward robust, multispecies, and energy-integrated vertical farming solutions. Beyond energy optimization, future developments in vertical farming could also benefit from the integration of IoT and AI-driven information systems, which have already shown promising results in agricultural product price forecasting, as shown by Luo et al. [51]. In the context of vertical farming, such tools could enable more precise crop management through real-time monitoring of growth and microclimatic conditions, predictive scheduling aligned with market demand, and smart integration with urban energy and logistics systems. Coupling advanced production models with market-oriented prediction systems may, therefore, provide a more holistic approach to sustainable urban agriculture.

6. Conclusions

Vertical farming is essential for reducing soil waste as it allows food to be grown in urban environments by utilizing vertical space rather than horizontal land. Additionally, vertical farming enables the cultivation of food in confined spaces, reducing the consumption of agricultural land and contributing to more sustainable and less invasive farming practices for the environment. The adaptive vertical farm (AVF) is based on the idea of gradually adjusting the shelf distance to accommodate plant growth. Thanks to scheduling algorithms, after an appropriate start-up phase, the AVF system reaches the steady-state condition maximizing the cultivated surface and optimizing the volume at its disposal, corresponding to a significant increase in productivity with the same footprint area.
The present paper shows an overview comparison between VF and AVF cultivation technologies, focusing on the crucial problem of energy consumption in vertical farming. To our knowledge, this is the first attempt to develop calculation algorithms able to quantify actual energy consumptions of VF and AVF in particular.
We considered an industrial-scale vertical farm scenario comprising 272 multilevel racks, each containing 8 stacked cultivation shelves. We analyzed the energy consumption for air conditioning and lighting of the AVF system in this scenario and compared it to a standard vertical farm (VF) with fixed shelves under the same conditions, including crop species, outdoor and indoor thermohygrometric conditions, lighting parameters, and air conditioning systems. A specific computational model was developed, and simulations were performed using various scheduling strategies.
The calculation algorithm is suitable for straightforward generalization provided that proper experimental data about L A I and relationship between growth rate and thermohygrometric conditions of each crop are available. The results indicate that the AVF system achieves a reduction of about 22% in specific (relative to the total cultivated area) energy consumption needed for thermohygrometric control, compared to the VF system, as can be seen in Table 5. This highlights the potential of AVF systems to enhance energy efficiency and productivity. The performances of vertical farms compared to traditional indoor cultivations are reported in Table 1. AVF can increase the cultivable area (by more than 400% for the same amount of land occupied by traditional flat indoor cultivations) and simultaneously reduce the expenditure of energy resources for cultivation. For the VF, this increase is just 200%, which means that, thanks to the scheduling algorithm, AVF exploits twice as much floor area as VF.
Using the presented calculation model, several simulations were carried out, also varying the scheduling of the sowing in the VF. The results show that the energy consumption of the AVF system is reduced by approximately 20% compared to the VF, regardless of the sowing strategies employed. This demonstrates that the reduction in energy consumption is not significantly dependent on the sowing scheduling, highlighting that the AVF technology can have effective industrial applications, both in terms of land use optimization and energy resource efficiency.
Despite the promising results of the AVF system in terms of energy efficiency and cultivable area, several limitations of the present study were evidenced in the discussion Section 5 (such as the need to extend the analysis to different crop species using specific growth and transpiration data based on experimental measurements). Overall, the findings of this study highlight the significant potential of AVF systems to enhance productivity and energy efficiency in urban agriculture, paving the way for future research and technological development toward sustainable solutions.

Author Contributions

Conceptualization, L.A.T. and P.B.; Methodology, L.A.T. and P.B.; Software, A.D.D. and P.B.; Resources, A.D.D.; Data curation, A.D.D.; Writing—original draft, A.D.D.; Writing—review & editing, L.A.T. and P.B.; Visualization, A.D.D. and P.B.; Supervision, L.A.T. and P.B. All authors have read and agreed to the published version of the manuscript.

Funding

This research received no external funding.

Institutional Review Board Statement

Not applicable.

Informed Consent Statement

Not applicable.

Data Availability Statement

The data presented in this study are available on request from the corresponding author.

Conflicts of Interest

The authors declare no conflicts of interest.

Nomenclature

SymbolDescriptionUnit
A b Ground surfacem2
A b f Surface covered by the canopym2
A c Cultivated aream2
COPCoefficient of performance-
C p a Specific heat capacityJ kg−1 K−1
D c Cultivation day-
hSpecific enthalpyJ kg−1
iRelative humidity%
KThermal transmittanceW m−2 K−1
lAverage leaf size m
L A I Leaf area index-
L h Light hours h
m ˙ a s Dry air flow ratekg s−1
m ˙ v Transpiration flow ratekg s−1
NNumber of air changesh−1
P A R Photosynthetically active radiationW m−2
P P F D Photosynthetic photon flux densityμmol m−2 s−1
Q ˙ d i s p Dispersed heat flux W
Q ˙ H V A C Required heat flow W
Q ˙ l a t Latent heat flux W
Q l a t Latent specific heat fluxW m−2
Q ˙ l e d LED dissipated heat flux W
Q ˙ s e n s Sensible heat flux W
Q s e n s Sensible specific heat fluxW m−2
Q ˙ v e n t Ventilation heat flow W
R n e t Radiation absorbed by leavesW m−2
R ˙ r i f LED reflected radiation W
R ˙ s e n s LED radiation on the ground W
r a Aerodynamic resistance to heat transfers m−1
r s Resistance of the stoma to vapor diffusions m−1
TTemperature°C
uAir velocity near the leafm s−1
V c Conditioned volume m 3
vSpecific volumem3 kg−1
yAbsolute humiditykg kg−1
Δ h Difference in hJ kg−1
ρ 0 Leaf reflection coefficient-
ρ Densitykg m−3
η LED efficiency-
λ Latent heat of vaporization of waterJ kg−1
χ Vapor concentration in humid airkg m−3

References

  1. Erekath, S.; Seidlitz, H.; Schreiner, M.; Dreyer, C. Food for future: Exploring cutting-edge technology and practices in vertical farm. Sustain. Cities Soc. 2024, 106, 105357. [Google Scholar] [CrossRef]
  2. Kabir, M.S.N.; Reza, M.N.; Chowdhury, M.; Ali, M.; Samsuzzaman; Ali, M.R.; Lee, K.Y.; Chung, S.O. Technological Trends and Engineering Issues on Vertical Farms: A Review. Horticulturae 2023, 9, 1229. [Google Scholar] [CrossRef]
  3. Buscher, J.; Bakunowitsch, J.; Specht, K. Transformative Potential of Vertical Farming—An Urban Planning Investigation Using Multi-Level Perspective. Sustainability 2023, 15, 15861. [Google Scholar] [CrossRef]
  4. Elsevier. ScienceDirect. 2025. Available online: https://www.sciencedirect.com/ (accessed on 4 March 2025).
  5. Celestre, A.; Mina, G.; Bollani, L.; Peira, G.; Bonadonna, A. Vertical Farming as a Sustainable Alternative for Agriculture: The Italian Consumer Point of View. Biol. Life Sci. Forum 2023, 26, 35. [Google Scholar] [CrossRef]
  6. Al-Chalabi, M. Vertical farming: Skyscraper sustainability? Sustain. Cities Soc. 2015, 18, 74–77. [Google Scholar] [CrossRef]
  7. Elsoragaby, S.; Yahya, A.; Mahadi, M.R.; Nawi, N.M.; Mairghany, M. Energy utilization in major crop cultivation. Energy 2019, 173, 1285–1303. [Google Scholar] [CrossRef]
  8. Arabzadeh, V.; Miettinen, P.; Kotilainen, T.; Herranen, P.; Karakoc, A.; Kummu, M.; Rautkari, L. Urban vertical farming with a large wind power share and optimised electricity costs. Appl. Energy 2023, 331, 120416. [Google Scholar] [CrossRef]
  9. Cossu, M.; Tiloca, M.T.; Cossu, A.; Deligios, P.A.; Pala, T.; Ledda, L. Increasing the agricultural sustainability of closed agrivoltaic systems with the integration of vertical farming: A case study on baby-leaf lettuce. Appl. Energy 2023, 344, 121278. [Google Scholar] [CrossRef]
  10. Stanghellini, C.; Katzin, D. The dark side of lighting: A critical analysis of vertical farms’ environmental impact. J. Clean. Prod. 2024, 458, 142359. [Google Scholar] [CrossRef]
  11. Liu, J.; Oita, A.; Hayashi, K.; Matsubae, K. Sustainability of Vertical Farming in Comparison with Conventional Farming: A Case Study in Miyagi Prefecture, Japan, on Nitrogen and Phosphorus Footprint. Sustainability 2022, 14, 42. [Google Scholar] [CrossRef]
  12. Wang, C.; Han, Q.; Li, J.; Li, C.; Zou, X. YOLO-BLBE: A Novel Model for Identifying Blueberry Fruits with Different Maturities Using the I-MSRCR Method. Agronomy 2024, 14, 658. [Google Scholar] [CrossRef]
  13. Gong, L.; Gao, B.; Sun, Y.; Zhang, W.; Lin, G.; Zhang, Z.; Li, Y.; Liu, C. preciseSLAM: Robust, Real-Time, LiDAR–Inertial–Ultrasonic Tightly-Coupled SLAM With Ultraprecise Positioning for Plant Factories. IEEE Trans. Ind. Inform. 2024, 20, 8818–8827. [Google Scholar] [CrossRef]
  14. Blom, T.; Jenkins, A.; Pulselli, R.; Van den Dobbelsteen, A. The embodied carbon emissions of lettuce production in vertical farming, greenhouse horticulture, and open-field farming in the Netherlands. J. Clean. Prod. 2022, 377, 134443. [Google Scholar] [CrossRef]
  15. Naus, T. Is Vertical Farming Really Sustainable. EIT Food, 2018. Available online: https://www.eitfood.eu/blog/is-vertical-farming-really-sustainable (accessed on 18 July 2022).
  16. Bagnerini, P.; Gaggero, M.; Ghio, M.; Malerba, F.; Malerba, M. Adaptive Vertical Farm for Fresh Food Production in Orbital Stations and Future Lunar Settlements. In Proceedings of the 2022 IEEE 9th International Workshop on Metrology for AeroSpace (MetroAeroSpace), Pisa, Italy, 27–29 June 2022; pp. 402–407. [Google Scholar]
  17. Bagnerini, P.; Gaggero, M.; Ghio, M.; Malerba, F. The Adaptive Vertical Farm as an Efficient Tool for the Cultivation of Multiple Crops in Space. In Proceedings of the 2023 IEEE 10th International Workshop on Metrology for AeroSpace (MetroAeroSpace), Milan, Italy, 19–21 June 2023. [Google Scholar]
  18. Bagnerini, P.; Gaggero, M.; Ghio, M. Mixed-Integer Linear Programming for the Scheduling of Seedings in an Industrial Adaptive Vertical Farm. In Proceedings of the 2023 IEEE 19th International Conference on Automation Science and Engineering (CASE), Auckland, New Zealand, 26–30 August 2023. [Google Scholar]
  19. Germina S.r.l. Available online: https://www.germina.bio (accessed on 4 March 2025).
  20. Ghio, M. System for the Vegetable Garden and Nursery Cultivation of Plants. Italian Patent Number 12120995, 22 October 2024. [Google Scholar]
  21. Orsini, F. Sistemi per Vertical Farming: Valutazione Tecnico-Economica dell’Adozione del Sistema Adattivo Germina; Technical Report; Department of Agricultural Sciences, University of Bologna; Unpublished; 2022. [Google Scholar]
  22. Huang, Z.; Du, X.; Castillo, C.S.Z. How does urbanization affect farmland protection? Evidence from China. Resour. Conserv. Recycl. 2019, 145, 139–147. [Google Scholar] [CrossRef]
  23. Wall, D.H.; Nielsen, U.N.; Six, J. Soil biodiversity and human health. Nature 2015, 528, 69–76. [Google Scholar] [CrossRef] [PubMed]
  24. Arcasi, A.; Mauro, A.; Napoli, G.; Tariello, F.; Vanoli, G. Energy and cost analysis for a crop production in a vertical farm. Appl. Therm. Eng. 2024, 239, 122129. [Google Scholar] [CrossRef]
  25. Graamans, L.; van den Dobbelsteen, A.; Meinen, E.; Stanghellini, C. Plant factories; crop transpiration and energy balance. Agric. Syst. 2017, 153, 138–147. [Google Scholar] [CrossRef]
  26. Stanghellini, C. Transpiration of Greenhouse Crops: An Aid to Climate Management; Wageningen University and Research: Wageningen, The Netherlands, 1987. [Google Scholar]
  27. Brouwer, C.; Heibloem, M. Irrigation water management: Irrigation water needs. Train. Man. 1986, 3, 1–5. [Google Scholar]
  28. Monteith, J.L. Evaporation and environment. In Symposia of the Society for Experimental Biology; Cambridge University Press: Cambridge, UK, 1965; Volume 19, pp. 205–234. [Google Scholar]
  29. Weidner, T.; Yang, A.; Hamm, M.W. Energy optimisation of plant factories and greenhouses for different climatic conditions. Energy Convers. Manag. 2021, 243, 114336. [Google Scholar] [CrossRef]
  30. Arcasi, A.; Mastrullo, R.; Mauro, A.; Pantaleo, A. State of the Art of Evapotranspiration Models for Plant Cultivation in Open Fields, Greenhouse Systems and Plant Factories. J. Phys. Conf. Ser. 2022, 2385, 012002. [Google Scholar] [CrossRef]
  31. Gates, D.M. Energy, plants, and ecology. Ecology 1965, 46, 1–13. [Google Scholar] [CrossRef]
  32. Frantz, J.M.; Ritchie, G.; Cometti, N.N.; Robinson, J.; Bugbee, B. Exploring the limits of crop productivity: Beyond the limits of tipburn in lettuce. J. Am. Soc. Hortic. Sci. 2004, 129, 331–338. [Google Scholar] [CrossRef]
  33. Alados, I.; Foyo-Moreno, I.; Alados-Arboledas, L. Photosynthetically active radiation: Measurements and modelling. Agric. For. Meteorol. 1996, 78, 121–131. [Google Scholar] [CrossRef]
  34. Fuchs, M. Transpiration and foliage temperature in a greenhouse. In Proceedings of the International Workshop on Cooling Systems for Greenhouses, Tel Aviv, Israel, 2–5 May 1993; pp. 89–98. [Google Scholar]
  35. Perrier, A. Étude physique de l’évapotranspiration dans les conditions naturelles. III. Évapotranspiration réelle et potentielle des couverts végétaux. Ann. Agron. 1975, 26, 529–556. [Google Scholar]
  36. Allen, R.G.; Pereira, L.S.; Raes, D.; Smith, M. Crop evapotranspiration-Guidelines for computing crop water requirements-FAO Irrigation and drainage paper 56. Fao Rome 1998, 300, D05109. [Google Scholar]
  37. Tei, F.; Scaife, A.; Aikman, D. Growth of lettuce, onion, and red beet. 1. Growth analysis, light interception, and radiation use efficiency. Ann. Bot. 1996, 78, 633–643. [Google Scholar] [CrossRef]
  38. Tuzet, A.; Perrier, A.; Leuning, R. A coupled model of stomatal conductance, photosynthesis and transpiration. Plant Cell Environ. 2003, 26, 1097–1116. [Google Scholar] [CrossRef]
  39. Ohashi-Kaneko, K.; Takase, M.; Kon, N.; Fujiwara, K.; Kurata, K. Effect of light quality on growth and vegetable quality in leaf lettuce, spinach and komatsuna. Environ. Control Biol. 2007, 45, 189–198. [Google Scholar] [CrossRef]
  40. Wang, J.; Lu, W.; Tong, Y.; Yang, Q. Leaf morphology, photosynthetic performance, chlorophyll fluorescence, stomatal development of lettuce (Lactuca sativa L.) exposed to different ratios of red light to blue light. Front. Plant Sci. 2016, 7, 250. [Google Scholar] [CrossRef] [PubMed]
  41. Wheeler, R.; Mackowiak, C.; Sager, J.; Yorio, N.; Knott, W.; Berry, W. Growth and gas exchange by lettuce stands in a closed, controlled environment. J. Am. Soc. Hortic. Sci. 1994, 119, 610–615. [Google Scholar] [CrossRef]
  42. Shasteen, K.; Kacira, M. Predictive Modeling and Computer Vision-Based Decision Support to Optimize Resource Use in Vertical Farms. Sustainability 2023, 15, 7812. [Google Scholar] [CrossRef]
  43. Esmaili, M.; Aliniaeifard, S.; Mashal, M.; Ghorbanzadeh, P.; Mehdi, S.; Gavilan, M.U.; Carrillo, F.F.; Lastochkina, O.; Tao, L. CO2 enrichment and increasing light intensity till a threshold level, enhance growth and water use efficiency of lettuce plants in controlled environment. Not. Bot. Horti Agrobot. Cluj-Napoca 2020, 48, 2244–2262. [Google Scholar] [CrossRef]
  44. Royal Philips, N. Philips Horticulture LED Solutions—GreenPower LED Toplighting—High Output. Available online: https://www.lighting.philips.com/application-areas/specialist-applications/horticulture/greenpower-specialist-applications/led-toplighting (accessed on 15 September 2024).
  45. Chang, C.L.; Huang, Y.M.; Hong, G.F. Using a Novel Wireless-Networked Decentralized Control Scheme under Unpredictable Environmental Conditions. Sensors 2015, 15, 28690–28716. [Google Scholar] [CrossRef] [PubMed]
  46. Gao, H.; Tan, Z.C.; Yang, M.; Ma, C.P.; Tang, Y.F.; Zhao, F.Y. Microclimate Air Motion and Uniformity of Indoor Plant Factory System: Effects of Crop Planting Density and Air Change Rate. Appl. Sci. 2025, 15, 4329. [Google Scholar] [CrossRef]
  47. Okochi, G.S.; Yao, Y. A review of recent developments and technological advancements of variable-air-volume (VAV) air-conditioning systems. Renew. Sustain. Energy Rev. 2016, 59, 784–817. [Google Scholar] [CrossRef]
  48. Goudriaan, J.; Van Laar, H. Modelling Potential Crop Growth Processes: Textbook with Exercises; Springer Science & Business Media: Berlin/Heidelberg, Germany, 2012; Volume 2. [Google Scholar]
  49. Wu, T.; Liu, K.; Cheng, M.; Gu, Z.; Guo, W.; Jiao, X. Paddy Field Scale Evapotranspiration Estimation Based on Two-Source Energy Balance Model with Energy Flux Constraints and UAV Multimodal Data. Remote Sens. 2025, 17, 1662. [Google Scholar] [CrossRef]
  50. Balaras, C.A.; Dascalaki, E.G.; Psarra, I.; Cholewa, T. Primary energy factors for electricity production in Europe. Energies 2022, 16, 93. [Google Scholar] [CrossRef]
  51. Luo, J.; Zhao, C.; Chen, Q.; Li, G. Using deep belief network to construct the agricultural information system based on Internet of Things. J. Supercomput. 2022, 78, 379–405. [Google Scholar] [CrossRef]
Figure 1. Annual number of scientific articles about vertical farming [4].
Sustainability 17 08319 g001
Figure 2. Comparison of open field production, greenhouse production, and vertical farming in terms of water usage, crop yield, and distance traveled by the food [15].
Sustainability 17 08319 g002
Figure 5. Mass and energy exchange in the greenhouse.
Sustainability 17 08319 g005
Figure 6. Operations performed by the algorithm.
Sustainability 17 08319 g006
Figure 7. Variation of lettuce height with cultivation time excluding germination phase.
Sustainability 17 08319 g007
Figure 8. Evolution of variable height on each shelf of the rack during the cultivation period.
Sustainability 17 08319 g008
Figure 9. Variation of cultivated area in AVF system during cultivation period.
Sustainability 17 08319 g009
Figure 10. Temporal variation of the L A I daily average of lettuce during cultivation period.
Sustainability 17 08319 g010
Figure 11. Thermal loads contributions in VF and AVF systems on cultivation day 32.
Sustainability 17 08319 g011
Figure 12. Comparison of specific thermal loads in VF and AVF: (a) Specific thermal load of LED radiation on the ground. (b) Load from radiation reflected by leaves. (c) Sensible load comparison. (d) Latent load comparison.
Sustainability 17 08319 g012
Figure 13. Leaf area index daily average with different scheduling solutions over cultivation period.
Sustainability 17 08319 g013
Figure 14. Comparison of LED heat flux and vapor flow rate in AVF system. (a) Heat flux dissipated by LEDs in AVF and cultivated area. (b) Transpirated vapor flow rate under illuminated and dark conditions.
Sustainability 17 08319 g014
Figure 15. Leaf area index of lettuce (excluding germination phase) over cultivation period.
Sustainability 17 08319 g015
Figure 16. Comparison of energy consumption in AVF and VF systems across different scheduling scenarios: (a) Heating. (b) Artificial lighting. (c) Cooling and dehumidification.
Sustainability 17 08319 g016
Figure 17. Energy consumptions in AVF and VF with different scheduling strategies over 6 cultivation cycles.
Sustainability 17 08319 g017
Table 1. Comparison between traditional (VF) and adaptive system (AVF) in terms of cultivated surface.
FeatureVFAVF
Shelves per rack815
Shelf surface2.04 m21.79 m2
Total shelves21764080
Cultivable area4439 m27303 m2
Floor area1358 m21358 m2
Increase for the same amount of land+226%+437%
Table 2. Thermohygrometric and lighting conditions [43].
Set PointTemperature (Ta) [°C]Relative Humidity (ia)PAR [W/m2]PPFD [ μ mol/m2s]Hours
Light2565%6030016 h
Dark2375%008 h
Table 3. L A I coefficients with sine sum approximation.
Coefficient12345
a16.70.30330.17010.06470.02787
b0.0087180.20720.34920.57110.7886
c0.01462−1.6333.712.4362.23
Table 4. Greenhouse transplanting days per shelf at each cultivation cycle.
Cultivation Cycles
Shelves 1 2 3 4 5 6
1425476991117
21335567798119
3930517298119
4627497295116
5930547598119
6223446589110
71034557697119
81435567798119
9427497092113
101032537798119
11526477091114
121132537497119
13832537496117
14130547697118
15324456788112
Table 5. Energy consumption over 6 cultivation cycles in AVF and VF with different scheduling algorithms.
TechnologyAVFVF (Scheduling 1)VF (Scheduling 2)VF (Scheduling 3)VF (Coeval)
Heating [MWh]39113220307530703252
Heating: primary energy [MWh]43463578341734113613
LED [MWh]15079319159161032
LED: primary energy [MWh]31401940190619082150
Cooling [MWh]34742980296828853200
Cooling: primary energy [MWh]72386208618360106667
Total energy [MWh]88927131695868717484
Total primary energy [MWh]14,72311,72611,50611,33012,430
Total specific primary energy [MWh/m2]2.022.642.592.552.80
Disclaimer/Publisher’s Note: The statements, opinions and data contained in all publications are solely those of the individual author(s) and contributor(s) and not of MDPI and/or the editor(s). MDPI and/or the editor(s) disclaim responsibility for any injury to people or property resulting from any ideas, methods, instructions or products referred to in the content.