Article

Building the I/SVOC Emission Inventory for Ocean-Going Ships: A Case Study on the Southeast Coast of China

Laboratory of Transport Pollution Control and Monitoring Technology, Transport Planning and Research Institute, Ministry of Transport, Beijing 100028, China
*
Author to whom correspondence should be addressed.
Sustainability 2025, 17(18), 8310; https://doi.org/10.3390/su17188310
Submission received: 18 June 2025 / Revised: 9 September 2025 / Accepted: 14 September 2025 / Published: 16 September 2025
(This article belongs to the Special Issue Sustainable Maritime Logistics and Low-Carbon Transportation)

Abstract

Controlling air pollution from sea-going vessels is crucial to the sustainable development of maritime transportation. However, emissions of intermediate volatility organic compounds (IVOCs), an emerging aerosol precursor, remain poorly understood. This study developed a ship-type-, fuel-, and operating-mode-specific IVOC emission factor dataset based on existing real-world vessel measurements, and a ship-call-based IVOC inventory methodology tailored for regulatory applications. We quantified IVOC emissions from sea-going ships (excluding fishing and military vessels) entering or departing from the ports in the Economic Zone on the West Coast of the Taiwan Straits in 2014. The total IVOC emissions were 481.4 ± 220.0 t, with Xiamen Port contributing the highest share. Cargo and passenger ships accounted for 65% and 21% of emissions, respectively. While switching to low-sulfur and ultra-low-sulfur fuels increased IVOC emissions by 87% and 49% compared to high-sulfur fuels, the greater reductions in particulate matter and SO2 emissions still yielded net environmental benefits. The ship IVOC emissions might have become more important in recent years due to enhanced port activity and fuel switching. Uncertainty analysis emphasizes the urgent need for IVOC emission testing on more vessel types. By providing a high-resolution profile of IVOC emissions from selected ports, this study underscores the urgency of adopting shore power and zero-emission vessels to mitigate organic aerosol pollution and offers a foundation for refining environmental impact assessments and efficient emission control policies to achieve sustainability in maritime transportation.

1. Introduction

Maritime shipping is the predominant mode of global trade. Sea-going vessels emit air pollutants that have significant impacts on human health and climate [1,2]. Understanding and controlling air pollutant emissions from sea-going vessels is crucial to achieve sustainable development in maritime transportation. Ports in China handle massive cargo throughput, and the high activity level of sea-going vessels contributes significantly to the particulate pollution in coastal regions [3,4]. As emissions from industrial, residential, and on-road transportation sources are increasingly controlled, the impact of sea-going vessel emissions—which face relatively limited control measures—on air quality will become more pronounced in coastal cities. Controlling atmospheric pollutant emissions from ships will thus be a crucial measure for further improving air quality and sustainability development in China’s coastal areas in the future. This calls for an accurate understanding of vessel emissions.
Numerous studies have investigated atmospheric pollutant emissions from sea-going vessels and developed corresponding emission inventories [5,6,7]. These inventories typically include pollutants such as SO2, NOx, CO, particulate matter (PM), and VOCs, aligning with conventional emission frameworks [8,9]. These species comprehensively cover the precursors of particulate pollution. However, recent studies have found that intermediate-volatility organic compounds (IVOCs), despite having much lower emissions than VOCs, can significantly contribute to secondary organic aerosol (SOA) formation [10,11]. In recent years, with increasing IVOC emission measurements from various source sectors (e.g., biomass burning, on-road vehicles, off-road transportation), several studies have established IVOC emission inventories for China [12,13,14,15,16]. However, there are few studies that focus on IVOC emissions from sea-going vessels, and existing studies had only made rough estimates, lacking in-depth study on vessel-type-specific and fuel-type-specific emission inventories [17]. Observational evidence suggests that ship emissions are likely a major source of atmospheric SOA in coastal regions in China [18,19]. Accurately assessing the contribution of sea-going vessels to PM2.5—especially SOA—requires precise IVOC emission inventories. Fortunately, recent advances in IVOC measurement for ships have laid the groundwork for developing refined emission factors and inventories for sea-going vessels [20,21,22,23,24].
The Economic Zone on the West Coast of the Taiwan Straits (WCTS) is a vital economic region and maritime transportation hub in China. Centered on Fujian Province, it encompasses parts of eastern Guangdong, southern Zhejiang, and southeastern Jiangxi, including ten coastal cities: Wenzhou, Ningde, Fuzhou, Putian, Quanzhou, Xiamen, Zhangzhou, Shantou, Jieyang, and Chaozhou, with multiple major ports included. The WCTS cities generally enjoy good air quality, with Fujian—as a national pioneer in ecological civilization—consistently ranking among the top regions with good air quality in eastern China. Meanwhile, the area also faces higher environmental targets. In 2023, the average PM2.5 concentration across these ten cities was 22 μg/m3, already well below China’s national air quality standards (35 μg/m3) but still far from the WHO guideline (5 μg/m3). According to Fujian’s 14th Five-Year Plan for Ecological Development [25], the PM2.5 level in Fujian must further decline by 2035. Existing studies indicate that sea-going vessels are significant sources of PM2.5 in the WCTS region [26,27]. Consequently, understanding and controlling emissions from vessels are urgent priorities for the region.
In this study, we developed a ship-type-, engine-, operation-mode-, and fuel-sulfur-content-specific methodology to calculate IVOC emissions from sea-going vessels, based on existing emission testing studies. Using the coastal cities in the WCTS as a case study, we estimated the IVOC emissions from vessels in 2014 by applying the ship-call-based method. We studied changes in IVOC emissions when using fuels with different sulfur contents. This study fills the gap in existing research on IVOC emission inventory of ships, with detailed data, methods and a case study on emission factors and inventory development. The findings could help to gain a clearer understanding of the IVOC emission characteristics of sea-going ships and provide policy insights for mitigating ship-related air pollution, which helps achieve sustainable development of the maritime transportation.

2. Materials and Methods

2.1. Emission Factors

This study compiled an IVOC emission factor dataset covering different ship types, engines, fuel types, and operating conditions, based on emission factors reported in existing literature on real-world emission testing on sea-going ships exhaust. Huang et al. [21] tested IVOC emissions from a bulk carrier equipped with a 2-stroke low-speed diesel main engine and a 4-stroke medium-speed diesel auxiliary engine. That study covered two fuel types (high-sulfur fuel oil with 1.12% m/m sulfur content and low-sulfur fuel oil with 0.38% m/m sulfur content) and two operating modes (departure/arrival and cruising) with engine loads ranging from 15% to 74%. The IVOC emission test by Liu et al. [22] focused on an oil tanker and two bulk carriers each equipped with 2-stroke low-speed diesel engine as main engine and 4-stroke medium-speed diesel engine as auxiliary engine, and covered fuel types of low-sulfur fuel oil with 0.38% m/m sulfur content and maritime gas oil (MGO) with 0.023% m/m sulfur content.
While existing tests have covered various ship types, fuels, and operating conditions, they do not encompass all possible combinations of these categories. Therefore, this study extrapolated the emission factor data to all ship type–fuel–operation mode combinations. Ship types were classified into tankers, bulk carriers, other cargo ships, passenger ships, and non-transport ships (e.g., engineering ships, excluding fishing boats, military vessels, and recreational/sports boats). Fuels included HSFO (sulfur content >0.5% m/m), VLSFO (sulfur content ≤0.5% and >0.1% m/m), and ultra-low-sulfur oil (ULSFO or MGO, sulfur content ≤0.1% m/m), based on the definitions by the IMO [28]. Engines comprised main engines (MEs), auxiliary engines (AEs) and boilers, with ME operation modes covering cruising and maneuvering (arrival/departure). Only emissions from AEs and boilers were considered at-berth.
The following key extrapolation assumptions were included. (1) ME emission factor ratios are the same across ship types for different sulfur contents and for maneuvering vs. cruising (based on Huang et al. [21]), given the fact that the ratios are similar for regular pollutants such as PM2.5 and HC; (2) AE emission factor ratios for HSFO/VLSFO are consistent with ME ratios from the same study; (3) To determine the IVOC emission factors for non-transport vessels, we estimate them using the IVOC/OC emission factor ratio of cargo ships and the OC emission factors of non-transport ships [29]; (4) Boiler emission factors (lacking direct measurements) were adopted from the ABaCAS inventory [30]. The compiled and extrapolated emission factors are listed in Table 1. IVOC emission factors generally ranges from 106.2 mg/kWh to 641.4 mg/kWh for ME and AE.
It should be noted that this study did not account for variations in the emission factors (expressed in unit power) among vessels of different tonnages. According to emission factor test results for ships of varying gross tonnages reported by Huang et al. [21] and Liu et al. [22], differences in IVOC emission factors between tonnage ranges are significantly smaller than variations observed under different engine power outputs, indicating that tonnage is not a primary parameter that influence IVOC emission factors (expressed in unit power). This approach aligns with the methodology adopted by the IMO and other studies for ship emission estimations. Since ships with large tonnage have higher engine power, the emission per ship will also be larger.

2.2. Methodology for Establishing the Emission Inventory Based on Ship Calls

There are multiple methodologies for establishing ship emission inventories, each suited to specific scenarios [31]. The emission factor dataset developed in this study can be applied to various power-based ship emission inventory building approaches. Balancing data accessibility and the feasibility of port-level emission management, we adopt a modified power-based method which uses ship calls to estimate IVOC emissions from ships operating in major ports in the WCTS region. The basic equation is:
S E = a , b S E M + S E A + S E B
where SE is the total emission; SEM, SEA and SEB are the emissions of main engine, auxiliary engine and boiler, respectively; a stands for the number of ship type, and b stands for the number of gross tonnage types. The SEM, SEA and SEB from a ship of certain ship type and gross tonnage type are calculated from:
S E M = N × P M × L F M , c × D c S c × E F M , c + L F M , m × D m S m × E F M , m
S E A = N × P A × L F A , c × D c S c + L F A , m × D m S m + L F A , b × T b × E F A
S E B = N × P B × D c S c + D m S m + T b × E F B
where N is the entry/exit vessel counts (for ship type a and tonnage type b); P is the rated power of the engine (kW); LF is the load factor of the engine; D is the sailing distance (nautical mile); S is the average speed (kn); Tb is the berthing time (h); EF is the emission factor of IVOC (mg/kWh, as is given in this study). Subscripts M, A, B, c, m and b denotes main engine, auxiliary engine, boiler, cruising, maneuvering and at berth, respectively.
By specifying the ship type and gross tonnage type classification, the above approach can effectively align with the maritime statistical mechanism in China.

2.3. Key Parameters in the Case Study of the WCTS Region

The key parameters needed to calculate the IVOC emission inventory for the WCTS region are basically determined based on statistical data from transportation administrative departments. Here we utilize the maritime statistical data of 2014 reported by each port in the WCTS region to get the entry/exit vessel counts of different ship types and gross tonnage types, as well as the average duration at berth for each port, which ranges from 16.0 h to 24.3 h. The ship types include cargo ships, passenger ships, and other ships including push/tug boats, non-transport ships but exclude fishing boats, military vessels and recreational/sports boats. Gross tonnage types include less than 100 GT, 100–500 GT, 500–1000 GT, 1000–3000 GT, 3000–10,000 GT, 10,000–50,000 GT and larger than 50,000 GT. We should note that in this study, the ship call data used is the total number for the whole year, without information on seasonal or diurnal variation. Therefore, although ship activity may vary substantially with meteorological conditions (such as typhoons) and national holidays (such as the Spring Festival), yet currently we are not able to study the temporal variation of the emissions. This could be achieved if ship call statistic data with finer temporal resolution was provided.
We define the route distance between port berths and the 12-nautical-mile (nm) territorial sea boundary (which aligns with the boundary of the emission control area) as the sailing distance for the vessels that entering/leaving the corresponding port, ranging between 30–67 nm across ports. The maneuvering distance of cargo ships is assumed to be approximately 4 nm for acceleration/deceleration during port approaches/departures, and therefore the remaining distance is designated as cruising distance. Based on the average distance between major offshore islands and the mainland, the average sailing distance for short-haul passenger ships (e.g., ferries) is set as 2 nm. The cruising speed of cargo ships, high-speed passenger vessels and other passenger ships are assumed to be 10 knots, 25 knots and 15 knots, respectively. The average speed during entering and exiting is set to 4 knots. The load factors of the engines are determined by considering the ratio of actual speed to design speed [5,32,33]. Other parameters such as the average rated powers for each ship type and gross tonnage type as well as the ratios between main engine, auxiliary engine and boiler are from our previous study [5]. The value as well as data sources for determining parameters of emission factors and activity data are summarized in Table 2. We built the inventory based on ship-call data from 2014 and analyzed the trends of emissions after 2014 with statistical data as indicative context.
We conducted uncertainty analysis on the emission inventory. The methodology for the uncertainty analysis follows the literature [34,35,36], where the uncertainty of the emission factors and activity data are first reflected by the Coefficient of Variation (CV) and the uncertainty of the emission inventory is then quantified by conducting Monte Carlo simulations utilizing the Oracle Crystal Ball software (version 11.1.2.4.900). For the emission factors, the CV is determined by the range reported in the literature and is properly enhanced if they are from the estimation by the hypothesis in this study. For the activity data, we set the CV value based on the data source (ship database, literature and investigation) [34,35,36]. We did not consider the uncertainty of the parameters from objective statistics. The uncertainty level and the corresponding methods and values are summarized in Table 2. We conducted 10,000 Monte Carlo simulations in total and obtained the probability distribution of total emissions. The contributions of the uncertainties of certain parameters to final results are determined by additional simulations that do not consider the corresponding CVs.
Table 2. The value, data source, and uncertainty estimation methods for the key parameters used to estimate the emissions by ship calls data in the WCTS region.
ParameterValueData Source ReferenceUncertainty Estimation Method
Emission factors that are directly from literaturesSee Table 1Huang et al. [21]; Liu et al. [22]; Zheng et al. [30]A
Emission factors that are extrapolatedSee Table 1Huang et al. [21]; Liu et al. [22]B
Emission factors that are estimated from IVOC/OCSee Table 1OC data from Zhang et al. [29]; IVOC/OC from Huang et al. [21]B
Ship calls1,622,224 in total (port, ship type and tonnage specific)Maritime statistical data of the government-
Berthing duration16–24.3 h (port specific)Maritime statistical data of the governmentC
Average rated powerSee Chen et al. [5]Chen et al. [5], which is estimated from Lloyd’s database and the China Classification Society databaseC
Loading FactorSee Chen et al. [5]Chen et al. [5], which is estimated from the combination of Lloyd’s database, the China Classification Society database, AIS data, and the Propeller Law.D
Cruising speedCargo ships: 10 kn
High-speed passenger vessels: 25 kn
Other passenger vessels: 15 kn
Determined based on investigation and literaturesD
Maneuvering speed4 knDetermined based on investigation and literaturesD
Duration of entering and exiting1 hDetermined based on investigation and literaturesD
Total sailing distance30–67 nm for cargo ships, 2 nm for passenger shipsDetermined based on the distance between the port and the 12 nm territorial sea boundary, or on the average distance between major offshore islands and the mainland-
A: The CVs are directly from the original data in the references. B: Additional variability components are incorporated beyond the original data’s CVs, including those for the extrapolation of ship-type, main/auxiliary engine differences (estimated based on the emission factor differences across ship types and between main/auxiliary engines from Liu et al. [22]), and IVOC/OC ratios (estimated based on the variability of IVOC/OC ratios from Huang et al. [21]). C: CVs are assigned categorized values according to their data sources (based on Streets et al. [35]). D: The uncertainty range is determined based on typical value ranges identified through literature review.

3. Results and Discussions

3.1. Total IVOC Emissions

We calculated the IVOC emissions from the vessels that enter or depart ports in the 10 coastal cities in the WCTS region in 2014. Results show that the total IVOC emissions are 481.4 ± 220.0 t. Considering the ports defined in the China’s Coastal Port Layout Plan [37] and port operating status, we categorized the numerous ports across the 10 coastal cities into seven major ports or port clusters, i.e., Wenzhou Port, Ningde Port, Fuzhou Port, Putian Port, Quanzhou Port, Xiamen port cluster (including Xiamen and Zhangzhou ports), and Shantou port cluster (including Shantou, Jieyang, and Chaozhou ports). The IVOC emissions for each of these seven major port or port clusters are shown in Figure 1. Notably, total IVOC emissions vary significantly among ports. Xiamen port cluster has the largest emission that reaches 272.4 tons, accounting for 57% of the total emissions of the ports in the WCTS region. Fuzhou Port, Wenzhou Port, and Quanzhou Port emitted 65.9 t, 58.7 t, and 41.3 t, respectively. Emissions from the remaining ports are all less than 20 t.
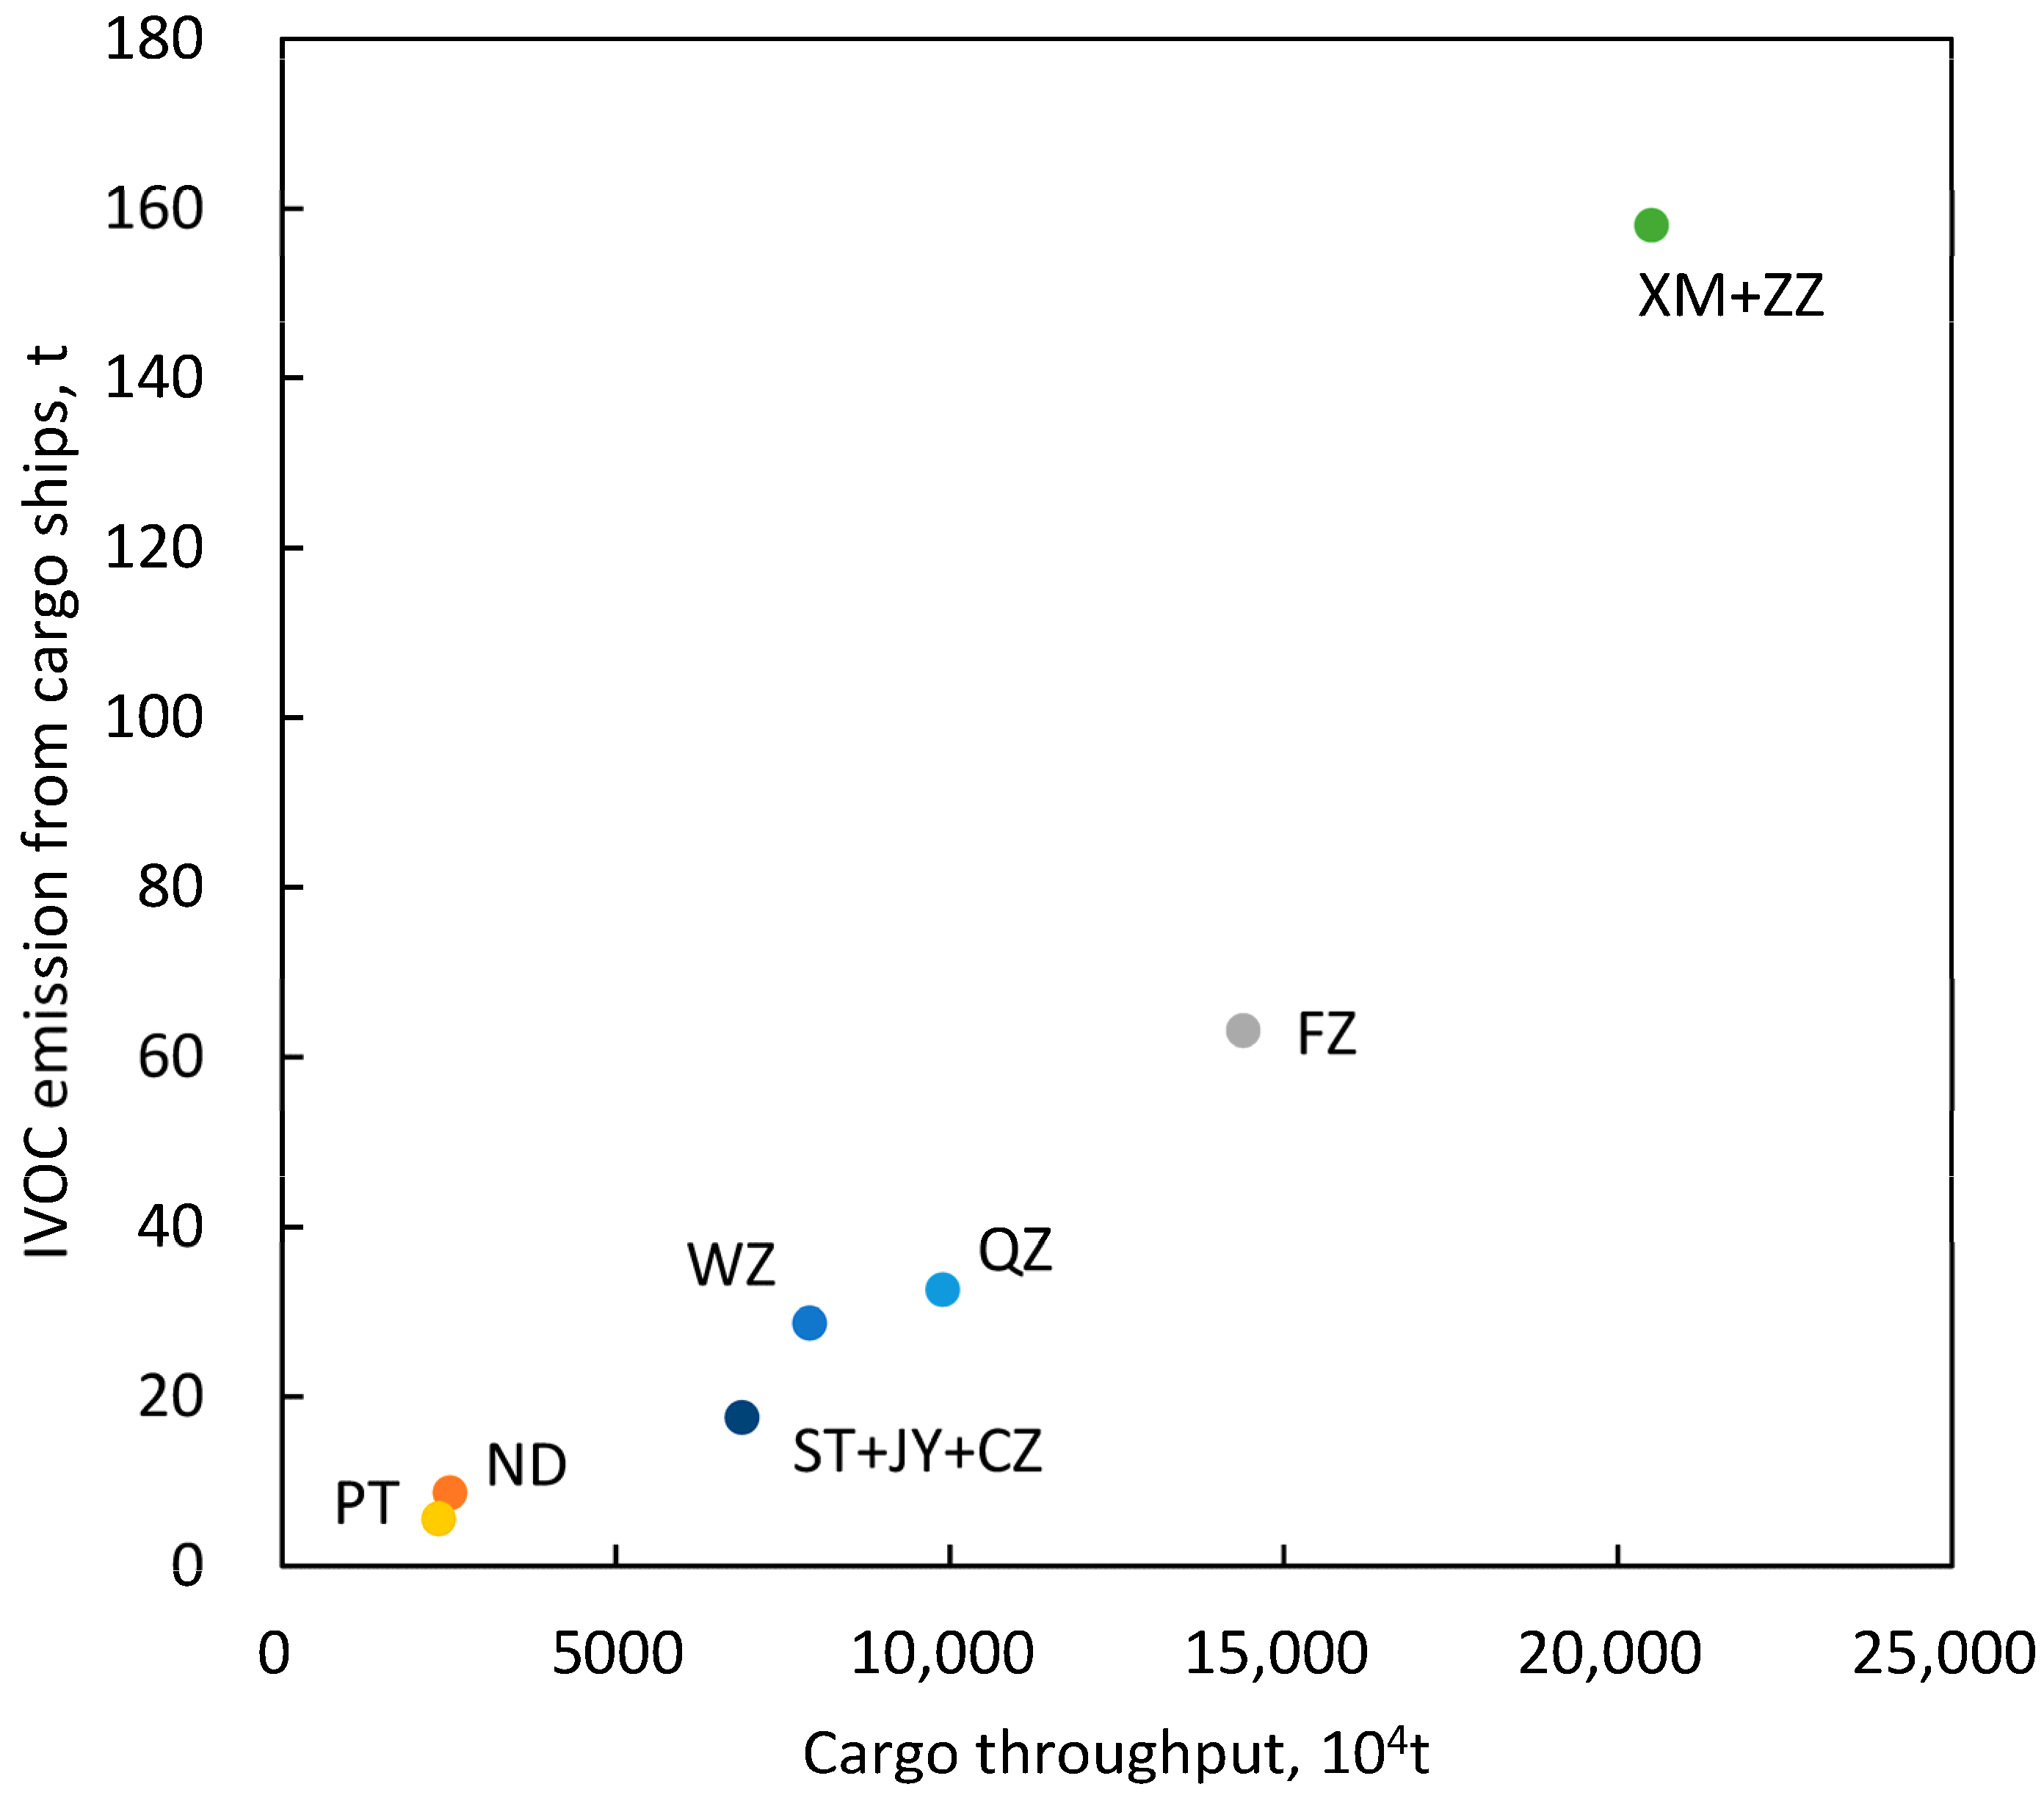
Freight transport is the most critical function of coastal ports, with cargo ships being the major source of IVOC emissions. By comparing port cargo throughput with cargo ship IVOC emissions, we can evaluate the emission efficiency of each port. Figure 2 illustrates the 2014 cargo throughput and cargo ship IVOC emissions for each port. Evidently, ports with higher cargo throughput generally exhibit greater cargo ship IVOC emissions, though disparities exist in IVOC emissions per unit of throughput across ports. Specifically, the Xiamen port cluster has relatively higher IVOC emissions per unit throughput. This variation may be attributed to the fact that different ports have different dominant vessel types (detailed in Section 3.2). Xiamen Port handles a larger proportion of container ships, which typically carry lighter goods than bulk carriers of equivalent tonnage. Consequently, achieving the same throughput requires either larger container vessels (with higher engine power) or more frequent ship calls, resulting in higher IVOC emissions per unit throughput.
We compared the calculated IVOC emissions from vessels derived in this study with emissions from other land-based transportation sources in the ABaCAS inventory of the year 2014 [30]. The results are presented in Table 3. The total IVOC emissions from land-based transportation sources in the 10 cities are 10,466.4 t, comprising 8017.7 t from on-road vehicles and 2448.7 t from off-road transportation. Notably, as a non-road traffic emission source, sea-going vessels contributed 481.4 t IVOC emission, accounting for 5% of total transportation IVOC emission and 20% of off-road transportation emission. Among the 10 cities, the Xiamen + Zhangzhou port cluster exhibited the highest proportion of vessel-related emissions, reaching 10% of total transportation emission and 51% of off-road transportation emissions. Thus, sea-going vessels that enter and depart from ports constitute a significant component of the IVOC emissions of transportation in certain cities in the WCTS region.
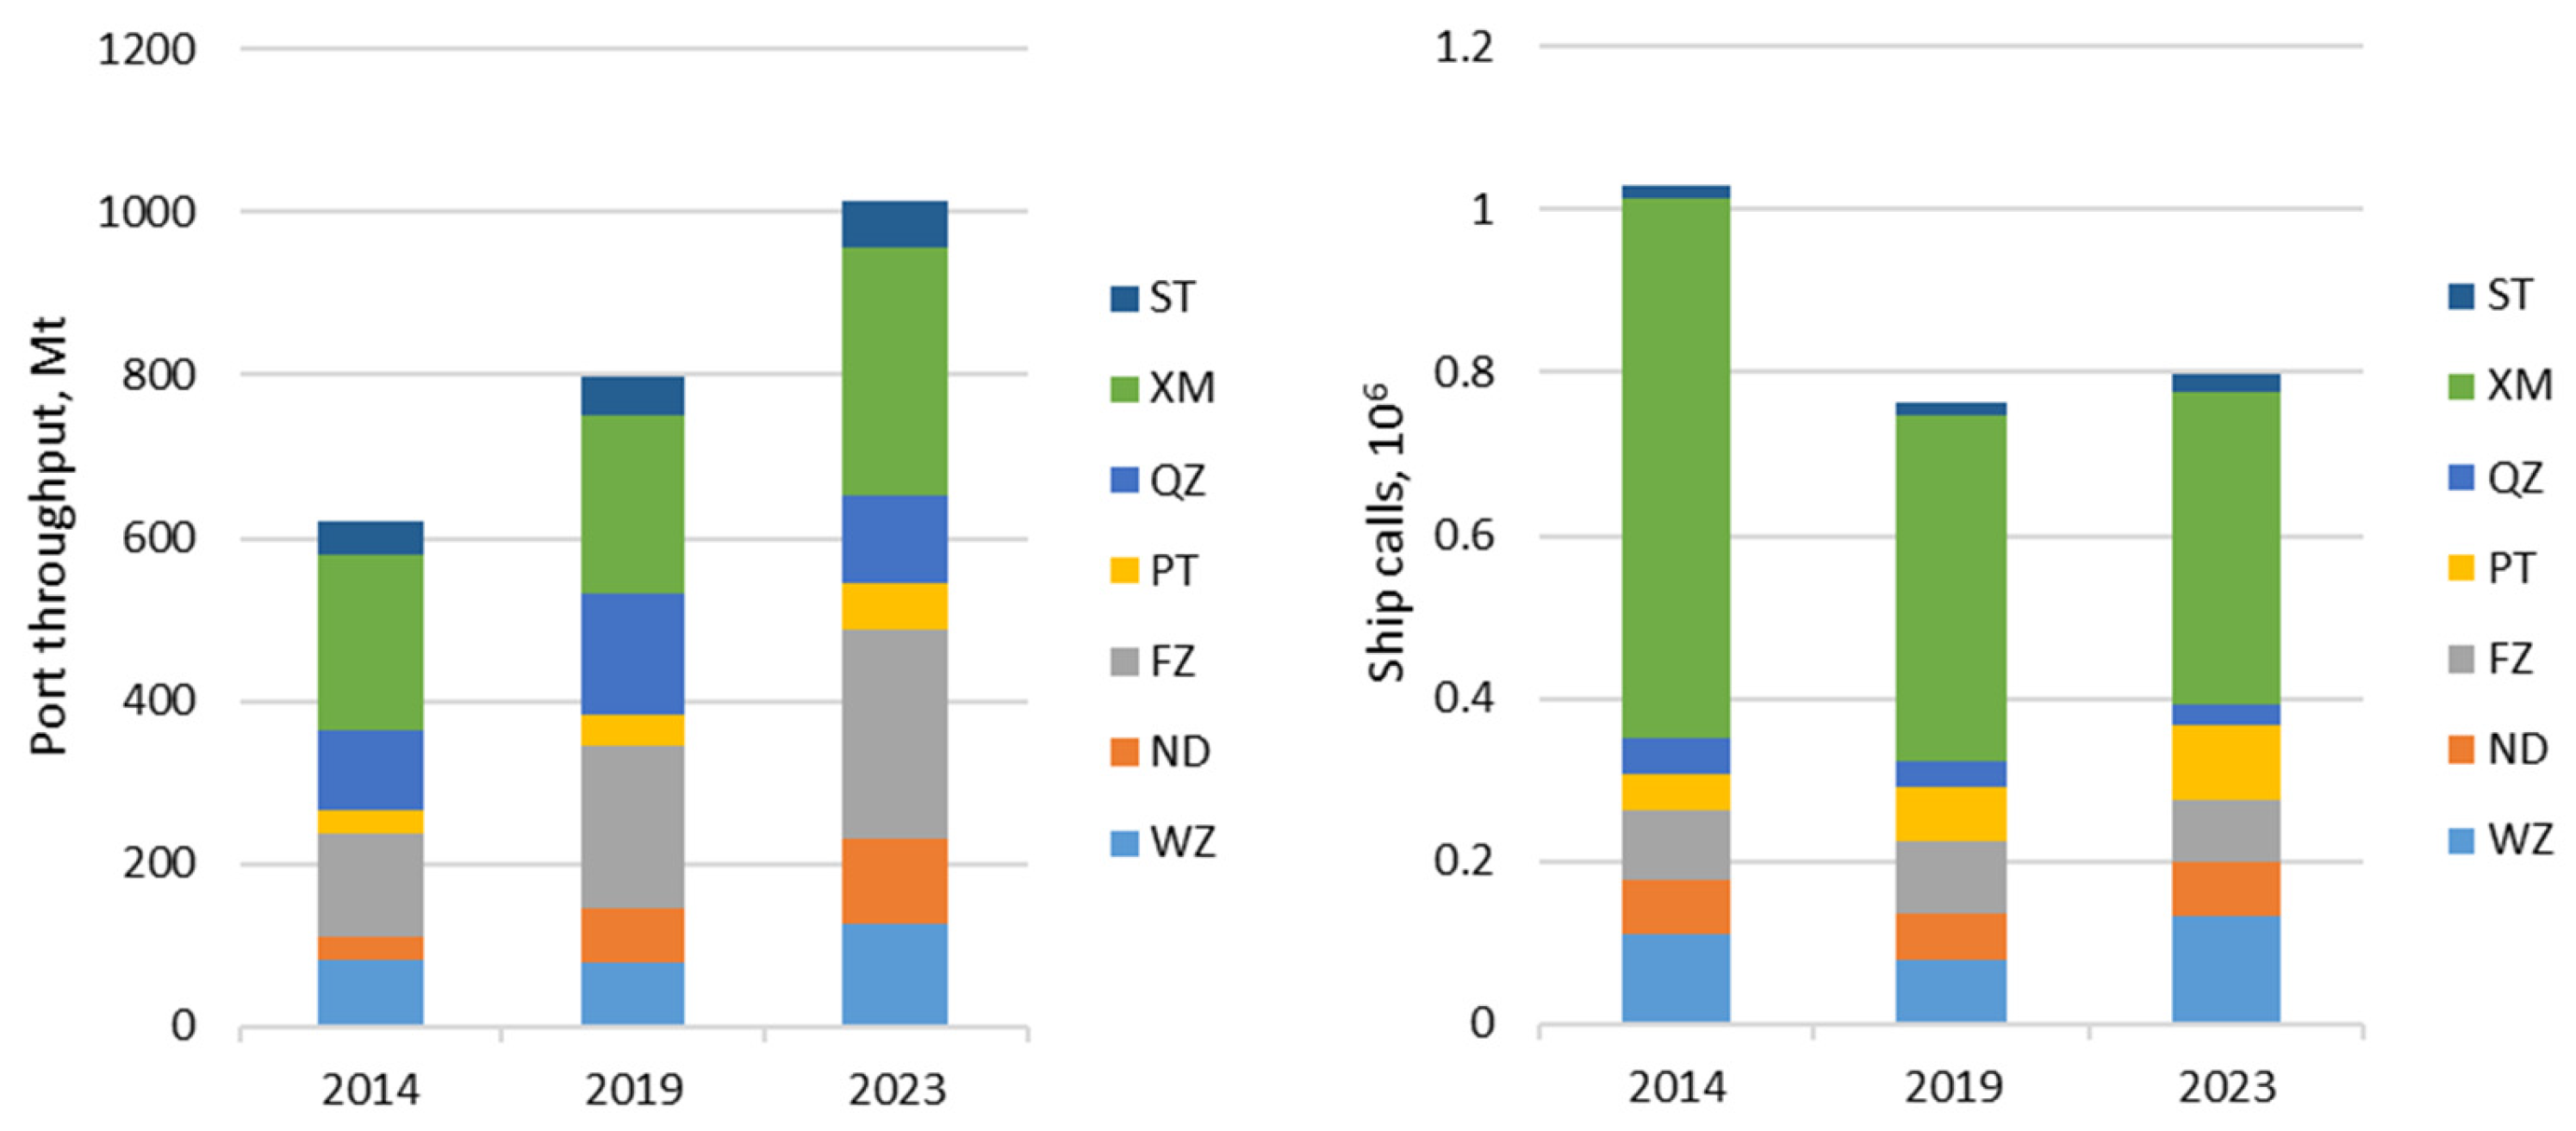
Notably, with the change of port activity levels and the implementation of vessel emission control policies, the IVOC emission characteristics of the ships in the WCTS region may have undergone changes compared to 2014. Due to the lack of detailed ship-type-specific ship call data, we are not able to calculate emissions after 2014. Instead, we utilized the overall variation in port arrivals and cargo throughput in the WCTS region to indirectly reflect potential changes in ship IVOC emissions, as illustrated in Figure 3. We find that during 2014–2023, while total vessel arrivals in the WCTS ports showed a slight decline trend, total cargo throughput experienced a remarkable increase (exceeding 60%), which drive an upward trend in ship IVOC emissions. At individual port level, although Xiamen Port maintained dominance, both Fuzhou Port and Ningde Port demonstrated significant throughput growth. Furthermore, in compliance with China’s Domestic Emission Control Area (DECA) policy, ships berthing in these ports have been required to use VLSFO with sulfur content below 0.1% since 2019. This measure may further elevate IVOC emissions (see Section 3.3). On the other hand, an emerging concern is that while air pollutant emissions from land-based sources in the WCTS region have consistently decreased alongside improving air quality during 2014–2023, the potential upward trend in ship IVOC emissions may progressively amplify their relative contribution to regional air pollution.

3.2. IVOC Emission Compositions

The detailed IVOC emission composition was subsequently studied for the year 2014. We first examine emissions by vessel type, as is shown in Table 4. Of the total emissions (481.4 t), cargo ships accounted for 314.0 t (65%), passenger ships for 102.6 t (21%), and the remaining 64.8 t were attributed to other vessels such as push/tug boats and non-transport ships (excluding fishing boats, military vessels, and recreational/sports boats). Among cargo ships, container ships had the highest emissions of 134.8 t, constituting 43% of the total cargo ship emissions, followed by bulk carriers which emitted 54.4 t constituting 17%.
The composition of emissions by vessel type significantly varies across ports (Figure 1). Container ships are the dominant IVOC emission source that accounted for 39% of the IVOC emissions in Xiamen port cluster, while Wenzhou Port and Putian Port were dominated by passenger ships, contributing 48% and 59% of total IVOC emissions, respectively. Fuzhou Port exhibited substantial emissions from both container ships (27%) and bulk carriers (30%). As a major container hub, Xiamen port cluster had a container throughput of 8.57 million TEU in 2014, which is the only port in the WCTS region that ranked among China’s top 10 ports in container throughput. Consequently, container ships became its primary atmospheric pollutant source.
Wenzhou, Putian, and Xiamen ports serve densely populated or tourist islands (e.g., Dongtou Archipelago in Wenzhou, Meizhou and Nanri Islands in Putian, and Gulangyu Island in Xiamen), which brings high demand for cross-sea passenger transport. Xiamen alone recorded 0.765 million passenger vessel calls annually. Despite the generally small size, passenger ships still contributed nearly 1/4 of Xiamen Port’s total emissions. These passenger vessels generally have a small size, short routes, and fixed itineraries, and are highly applicable for electrification. Therefore, a wide adoption of electric short-haul passenger ships could effectively reduce total IVOC emissions from vessels in the WCTS region.
We then examine the emissions by different gross tonnage types of cargo ships, as is shown in Table 5. The IVOC emissions mainly concentrate in vessels with high gross tonnage. Although the number of ships larger than 10,000 Gt only comprises 14% of total cargo ships, they emitted up to 56.4% of the total IVOC emissions from cargo ships. The number of ships with gross tonnage of 100–500 Gt is the largest, but they only contribute 5.7% of total IVOC emission from cargo ships.
We proceed to analyze emissions by navigation status (Table 6). Under the current calculation boundaries, the cruising phase and berthing phase both generate high emissions, each accounting for nearly half of the total IVOC emissions. It is noteworthy that berthing vessels operate much closer to the residential areas onshore, thus potentially contributing significantly to the organic aerosol pollution in coastal areas. This makes them a critical focus for emission control.
In recent years, China has intensified efforts to promote shore power adoption, mandating that vessels equipped with power reception facilities must use shore power when berthing for over 3 h at ports with corresponding infrastructure. For example, Xiamen Port has completed shore power facilities at all container berths and incentivizes usage through discounted electricity fees. In 2024, 6958 berthing container vessel calls utilized shore power. Xiamen port also enhanced operational efficiency of loading/unloading and transport procedures via smart port initiatives, which also helps reduce the berthing time. These measures have collectively mitigated emissions of atmospheric pollutants, including IVOCs, from ships.

3.3. The Impacts of Controlling Fuel Sulfur Content

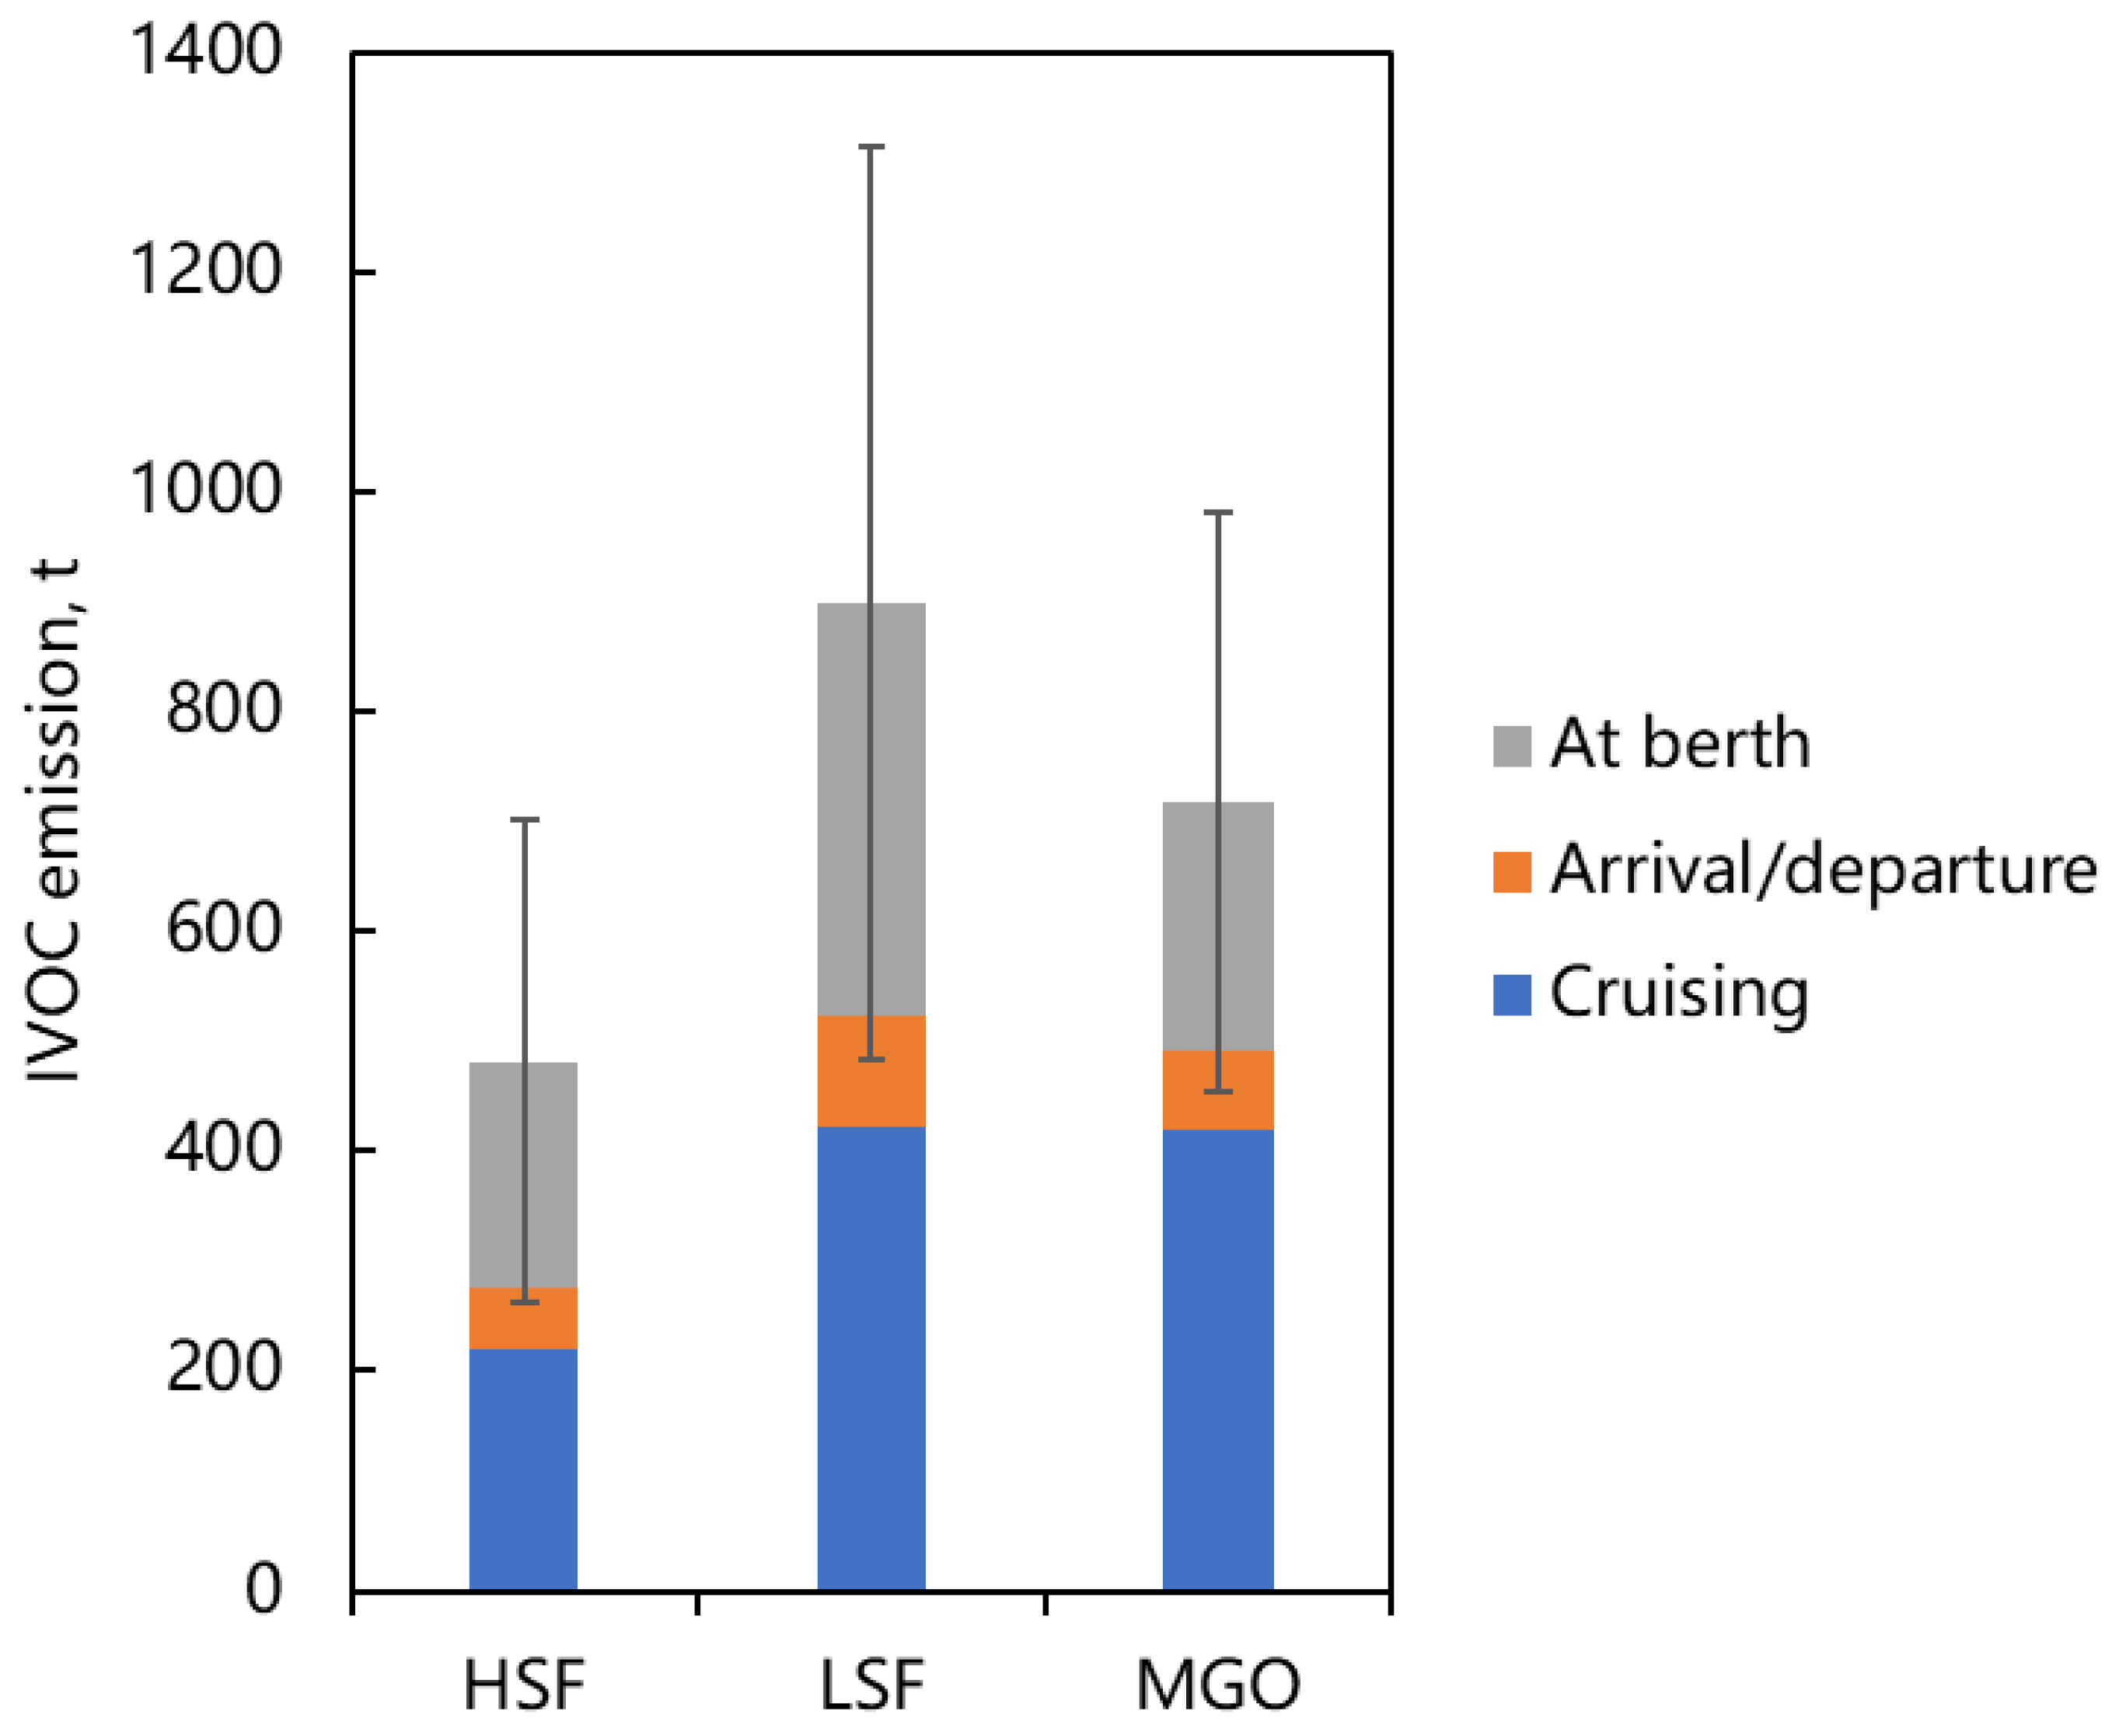
Using lower-sulfur fuel effectively reduces ship emissions of SO2 and particulate matter (PM), driving widespread global adoption of such fuels to mitigate atmospheric pollution from maritime activities. However, the influence of low-sulfur fuels on IVOC emissions of operating ship fleets remains poorly understood. By 2014, China had not implemented the 0.5% fuel sulfur content limitation in coastal waters. Subsequent policies under the Domestic Emission Control Area (DECA) framework progressively tightened fuel sulfur limits. Using the emission factors of VLSFO and MGO in Table 1 and the same calculation method when using HSFO, we evaluate the IVOC emissions in the WCTS region when using VLSFO and MGO, and compare the results with those of HSFO, as illustrated in Figure 4. Results demonstrate that adopting VLSFO would result in a total IVOC emission of 898 ± 414 t from the entry/departure vessels of the ports in the WCTS region, which is significantly higher than using HSFO in 2014. While using MGO reduces total IVOC emissions to 718 ± 263 t as compared to VLSFO, they remain elevated relative to 2014 HSFO baselines.
The rise in IVOC emissions following the adoption of low-sulfur fuel is primarily attributed to its higher emission factors. The hydrodesulfurization process when refining VLSFO from HSFO may shorten hydrocarbon molecular chains and increases the overall volatility of the fuel [22,38,39], causing more unburned components to shift from particulate to gaseous phases during combustion, which are primarily IVOC. Lower PAH and higher n-alkanes in MGO also contribute to its higher IVOC emission [22,40]. While low-sulfur fuel effectively reduces primary PM2.5 and SO2 emissions, the accompanying increase in IVOC emissions may partially diminish its overall benefits for mitigating atmospheric PM pollution. In this case study, reducing fuel sulfur content from 1.0% to 0.5% lowered primary PM2.5 emissions from vessels in the WCTS region by 387 t (from 1106 t to 719 t) and SO2 emissions by 5134 t (from 10,259 t to 5125 t), but IVOC emissions increased by 417 t (from 481 t to 898 t). To estimate the overall impact of the emission change to the ambient aerosol pollution, we convert the IVOC and SO2 emissions into PM-equivalent mass using an 80% IVOC-to-OA potential [30] and a 0.28 sulfate conversion ratio for SO2 [41]. The net effect showed an OA-equivalent increase of 334 t, which significantly offset but did not surpass the PM2.5 reduction, while the sulfate-equivalent reduction (1438 t) remained substantially larger. Thus, despite the elevated IVOC emissions, using VLSFO still delivers a net reduction in PM2.5 pollution. The benefits are expected to be even greater when using MGO with 0.1% m/m sulfur content. On the other hand, however, the PM2.5 composition may shift toward higher organic fractions [42], necessitating further model-based assessments to evaluate health and environmental trade-offs, given the divergent impacts of PM components on air quality and climate. We should note that the above analysis is a primary estimation, since the contributions of IVOC and SO2 to particulate depend on atmospheric conditions, and are also influenced by complex atmospheric processes such as heterogeneous reaction. Even under the most extreme condition where the IVOC-to-OA potential is 100% making the potential OA enhancement larger than the primary PM2.5 reduction, a net benefit in ambient PM2.5 can still be achieved, provided the sulfate conversion ratio exceeds a very small value (0.006). While the overall benefit is robust, a precise quantitative assessment calls for future works using chemical transport models. Moreover, the speciation profile of IVOC emissions affects its SOA yield, which needs further testing in future studies.
The above findings also offer insights into the global benefits of ships switching to low-sulfur fuels. Some studies in North America and Europe (e.g., [43,44]) have used air quality models to assess the reduction in PM2.5 concentrations and associated health benefits from coastal vessels using low-sulfur fuel oil. However, as ship IVOC emissions have only recently gained attention, no previous studies have considered IVOC emissions or their environmental impacts. Our results suggest that, due to increased IVOC emissions, a reevaluation might be needed for prior estimates of PM2.5 reduction benefits from low-sulfur fuel adoption. These findings could also provide more accurate foundations for future policies on broader or stricter Emission Control Areas (e.g., mandating fuel with sulfur content ≤0.1% m/m).

3.4. Uncertainty Analysis

The uncertainty range (expressed as CV) of the calculated total IVOC emissions from vessels in the WCTS region is approximately 46%, with a 95% confidence interval ranging from −57% to +116%. Although this uncertainty is higher than that of conventional pollutants such as SO2 and NOx, it is comparable to, if not lower than, the uncertainties reported in other IVOC emission studies [14,16]. To identify key parameters that contribute significantly to the overall uncertainty, we conducted sensitivity analysis. Results show that excluding the uncertainty of emission factors could reduce the total uncertainty to 26%; excluding the uncertainties of rated power and engine load could decrease it to 40%; and excluding the uncertainties of speed, operating time, and maneuvering distance could lower it to 44%. This indicates that emission factors are the primary source of current inventory uncertainty. More specifically, excluding the uncertainty of the AE emission factors alone could reduce the total uncertainty to 30%, showing that the uncertainty of AE emission factors is particularly critical, followed by ME, while the uncertainty from boilers emission factors contribute little to the total uncertainty. The high contribution of emission factors stems from data gaps for some vessel types which necessitates substitution or extrapolation.
Therefore, reducing the uncertainty in the IVOC emission hinges on improving the accuracy of emission factors, especially for auxiliary engines, which requires future testing studies on more vessel types. Moreover, future work could also explore the impact of other factors such as ambient temperature on emission factors, further reducing uncertainty. Additionally, the uncertainty in activity data significantly impacts the results, which is an inherent limitation of the ship-call-based methodology. Employing more precise ship-specific port entry/exit records (such as port entry/exit records for individual ships, which is typically available to port authorities) could effectively reduce uncertainties of parameters related to power, load, time, and speed.

4. Conclusions

As an important but overlooked precursor of atmospheric organic aerosols, IVOC emissions have recently garnered widespread attention. This study developed a ship-type-, fuel-, and operating-mode-specific IVOC emission factor dataset for ocean-going vessels using published test data. We established a ship-call-based methodology for building up IVOC emission inventory, which is compatible with China’s maritime statistical framework and is thus highly applicable. The emission factor dataset can also be applied to other inventory approaches such as AIS-based activity methods.
Using ports in Economic Zone on the West Coast of the Taiwan Straits (WCTS) as a case study, we estimated the IVOC emissions from vessels of ports in the 10 coastal cities in 2014 based on the above-mentioned port-call-based method. Results reveal a total IVOC emission of 481.4 ± 220 t, and Xiamen Port has the largest contribution. The IVOC emission of vessels across Xiamen Port is 51% as large of the non-road mobile source IVOC emissions citywide. The results also highlight the significance of passenger ship emissions (mostly short-distance island ferries) in cities like Wenzhou, Putian, and Xiamen. Using statistical data after 2014 as indicative context, we infer that in recent years, with increasing port activities and reductions in other emission sources, ship IVOC emissions have become more important. As a leading region in China’s air quality control efforts, the WCTS area serves as a pioneering indicator for the future development of ports in other regions. This case study on WCTS can provide valuable references for IVOC emission calculations in ports across China and globally, both in methodology and analytical results.
By analysing the impact of fuel sulfur content on IVOC emissions, we find that switching from high-sulfur fuel (HSFO) to low-sulfur fuel with 0.5% m/m sulfur content (VLSFO), while effectively reducing SO2 and PM emissions, could increase IVOC emissions by up to 1.9-fold. A 1.5-fold rise persists even when switching to maritime gas oil (MGO) with less than 0.1% m/m sulfur content. By estimating PM-equivalent emissions from IVOC and SO2, we found that although elevated IVOC emissions partially offset PM reduction benefits, low-sulfur fuels still yielded net reductions in ship-related PM pollution. Given the difficulty of controlling IVOC emissions through fuel quality improvements, our findings underscore the necessity of zero-emission solutions like shore power systems and electric vessels to mitigate shipping pollutants, particularly IVOCs. This calls for planning for the layouts of charging facilities in coastal ports in China.
The emission results obtained in this study still carry significant uncertainty due to uncertainties in calculation parameters, particularly emission factors. It is recommended to strengthen future research on IVOC emission testing for a broader range of vessel types, fuel types and operating conditions, especially focusing on auxiliary engines, so as to reduce the uncertainty in IVOC emission inventory estimates. Moreover, future works should utilize chemical transport models to validate the emission inventory by comparing them with observations. Nevertheless, this study provides preliminary insights into IVOC emissions from ocean-going vessels, especially for the entering and departing vessels that can be controlled by ports. We should note that after IVOC emissions are considered, the environmental impact and the corresponding mitigation strategies might have potential discrepancies with our existing knowledge, which calls for further comprehensive studies with models.

Author Contributions

Conceptualization, X.C. and Y.L.; methodology, X.C., Y.L., Y.Z. and M.L.; investigation, X.C., Y.L., Y.Z. and X.Y.; data curation, X.C., Y.L., Y.Z., M.L. and X.Y.; writing—original draft preparation, X.C.; writing—review and editing, Y.L.; visualization, X.C., Y.Z. and X.Y.; supervision, Y.L., Q.H., J.L. and Y.X.; project administration, X.C., Y.L., Y.S. and R.W.; funding acquisition, Y.S., R.W. and J.L. All authors have read and agreed to the published version of the manuscript.

Funding

This research was funded by the Technology Development Project of Transport Planning and Research Institute (grant number 092317-108), Ministry of Industry and Information Technology of the People’s Republic of China (grant number CBG5N21-4-3), and the Technology Development Project of Transport Planning and Research Institute (grant number 092308-001).

Institutional Review Board Statement

Not applicable.

Informed Consent Statement

Not applicable.

Data Availability Statement

The original data presented in the study are openly available in Zenodo at doi: 10.5281/zenodo.17077167.

Conflicts of Interest

The authors declare no conflicts of interest.

Abbreviations

The following abbreviations are used in this manuscript:
IVOCIntermediate-volatility organic compounds
PMParticulate matter
OAOrganic aerosol
SOASecondary organic aerosol
WCTSThe Economic Zone on the West Coast of the Taiwan Straits
MEMain engine
AEAuxiliary engine
HSFOHigh sulfur content fuel oil
VLSFOVery low sulfur content fuel
MGOMaritime gas oil
CVCoefficient of Variation

References

  1. Eyring, V.; Isaksen, I.S.A.; Berntsen, T.; Collins, W.J.; Corbett, J.J.; Endresen, O.; Grainger, R.G.; Moldanova, J.; Schlager, H.; Stevenson, D.S. Transport impacts on atmosphere and climate: Shipping. Atmos. Environ. 2010, 44, 4735–4771. [Google Scholar] [CrossRef]
  2. Contini, D.; Merico, E. Recent Advances in Studying Air Quality and Health Effects of Shipping Emissions. Atmosphere 2021, 12, 92. [Google Scholar] [CrossRef]
  3. Lv, Z.; Liu, H.; Ying, Q.; Fu, M.; Meng, Z.; Wang, Y.; Wei, W.; Gong, H.; He, K. Impacts of shipping emissions on PM2.5 pollution in China. Atmos. Chem. Phys. 2018, 18, 15811–15824. [Google Scholar] [CrossRef]
  4. Liu, Z.; Lu, X.; Feng, J.; Fan, Q.; Zhang, Y.; Yang, X. Influence of Ship Emissions on Urban Air Quality: A Comprehensive Study Using Highly Time-Resolved Online Measurements and Numerical Simulation in Shanghai. Environ. Sci. Technol. 2016, 51, 202–211. [Google Scholar] [CrossRef] [PubMed]
  5. Chen, D.; Wang, X.; Li, Y.; Lang, J.; Zhou, Y.; Guo, X.; Zhao, Y. High-spatiotemporal-resolution ship emission inventory of China based on AIS data in 2014. Sci. Total Environ. 2017, 609, 776–787. [Google Scholar] [CrossRef] [PubMed]
  6. Mao, J.; Zhang, Y.; Yu, F.; Chen, J.; Sun, J.; Wang, S.; Zou, Z.; Zhou, J.; Yu, Q.; Ma, W.; et al. Simulating the impacts of ship emissions on coastal air quality: Importance of a high-resolution emission inventory relative to cruise- and land-based observations. Sci. Total Environ. 2020, 728, 138454. [Google Scholar] [CrossRef]
  7. Yi, W.; Wang, X.; He, T.; Liu, H.; Luo, Z.; Lv, Z.; He, K. The high-resolution global shipping emission inventory by the Shipping Emission Inventory Model (SEIM). Earth Syst. Sci. Data 2025, 17, 277–292. [Google Scholar] [CrossRef]
  8. Wang, S.; Xing, J.; Chatani, S.; Hao, J.; Klimont, Z.; Cofala, J.; Amann, M. Verification of anthropogenic emissions of China by satellite and ground observations. Atmos. Environ. 2011, 45, 6347–6358. [Google Scholar] [CrossRef]
  9. Zhang, Q.; Streets, D.G.; Carmichael, G.R.; He, K.B.; Huo, H.; Kannari, A.; Klimont, Z.; Park, I.S.; Reddy, S.; Fu, J.S.; et al. Asian emissions in 2006 for the NASA INTEX-B mission. Atmos. Chem. Phys. 2009, 9, 5131–5153. [Google Scholar] [CrossRef]
  10. Robinson, A.L.; Donahue, N.M.; Shrivastava, M.K.; Weitkamp, E.A.; Sage, A.M.; Grieshop, A.P.; Lane, T.E.; Pierce, J.R.; Pandis, S.N. Rethinking organic aerosols: Semivolatile emissions and photochemical aging. Science 2007, 315, 1259–1262. [Google Scholar] [CrossRef]
  11. Zhao, Y.L.; Hennigan, C.J.; May, A.A.; Tkacik, D.S.; de Gouw, J.A.; Gilman, J.B.; Kuster, W.C.; Borbon, A.; Robinson, A.L. Intermediate-Volatility Organic Compounds: A Large Source of Secondary Organic Aerosol. Environ. Sci. Technol. 2014, 48, 13743–13750. [Google Scholar] [CrossRef]
  12. Liu, H.; Man, H.; Cui, H.; Wang, Y.; Deng, F.; Wang, Y.; Yang, X.; Xiao, Q.; Zhang, Q.; Ding, Y.; et al. An updated emission inventory of vehicular VOCs and IVOCs in China. Atmos. Chem. Phys. 2017, 17, 12709–12724. [Google Scholar] [CrossRef]
  13. Wu, L.; Ling, Z.; Liu, H.; Shao, M.; Lu, S.; Wu, L.; Wang, X. A gridded emission inventory of semi-volatile and intermediate volatility organic compounds in China. Sci. Total Environ. 2021, 761, 143295. [Google Scholar] [CrossRef] [PubMed]
  14. Wu, L.Q.; Wang, X.M.; Lu, S.H.; Shao, M.; Ling, Z.H. Emission inventory of semi-volatile and intermediate-volatility organic compounds and their effects on secondary organic aerosol over the Pearl River Delta region. Atmos. Chem. Phys. 2019, 19, 8141–8161. [Google Scholar] [CrossRef]
  15. Zhang, Z.; Man, H.; Zhao, J.; Huang, W.; Huang, C.; Jing, S.; Luo, Z.; Zhao, X.; Chen, D.; He, K.; et al. VOC and IVOC emission features and inventory of motorcycles in China. J. Hazard. Mater. 2024, 469, 133928. [Google Scholar] [CrossRef]
  16. Zhu, Y.; Wang, Q.; Huang, L.; Yin, S.; Li, L.; Wang, Y. Emission Inventory of Intermediate Volatility Organic Compounds (IVOCs) from Biomass Burning in the Yangtze River Delta During 2010–2018. Huanjing Kexue 2020, 41, 3511–3517. [Google Scholar]
  17. Zhao, J.; Qi, L.; Lv, Z.; Wang, X.; Deng, F.; Zhang, Z.; Luo, Z.; Bie, P.; He, K.; Liu, H. An updated comprehensive IVOC emission inventory for mobile sources in China. Sci. Total Environ. 2022, 851, 158312. [Google Scholar] [CrossRef]
  18. Lyu, X.P.; Guo, H.; Cheng, H.R.; Wang, X.M.; Ding, X.; Lu, H.X.; Yao, D.W.; Xu, C. Observation of SOA tracers at a mountainous site in Hong Kong: Chemical characteristics, origins and implication on particle growth. Sci. Total Environ. 2017, 605–606, 180–189. [Google Scholar] [CrossRef]
  19. Tong, M.; Zhang, Y.; Zhang, H.; Chen, D.; Pei, C.; Guo, H.; Song, W.; Yang, X.; Wang, X. Contribution of Ship Emission to Volatile Organic Compounds Based on One-Year Monitoring at a Coastal Site in the Pearl River Delta Region. J. Geophys. Res. Atmos. 2024, 129, e2023JD039999. [Google Scholar] [CrossRef]
  20. Cui, M.; Xu, Y.; Liu, Z.; Zhang, Y.; Zhang, F.; Yan, C.; Chen, Y. Characteristics of intermediate volatility organic compounds emitted from inland vessels with different influential factors and implication of reduction emissions. Sci. Total Environ. 2023, 904, 166868. [Google Scholar] [CrossRef]
  21. Huang, C.; Hu, Q.; Wang, H.; Qiao, L.; Jing, S.a.; Wang, H.; Zhou, M.; Zhu, S.; Ma, Y.; Lou, S.; et al. Emission factors of particulate and gaseous compounds from a large cargo vessel operated under real-world conditions. Environ. Pollut. 2018, 242, 667–674. [Google Scholar] [CrossRef] [PubMed]
  22. Liu, Z.; Chen, Y.; Zhang, Y.; Zhang, F.; Feng, Y.; Zheng, M.; Li, Q.; Chen, J. Emission Characteristics and Formation Pathways of Intermediate Volatile Organic Compounds from Ocean-Going Vessels: Comparison of Engine Conditions and Fuel Types. Environ. Sci. Technol. 2022, 56, 12917–12925. [Google Scholar] [CrossRef] [PubMed]
  23. Lou, H.J.; Hao, Y.J.; Zhang, W.W.; Su, P.H.; Zhang, F.; Chen, Y.J.; Feng, D.L.; Li, Y.F. Emission of intermediate volatility organic compounds from a ship main engine burning heavy fuel oil. J. Environ. Sci. 2019, 84, 197–204. [Google Scholar] [CrossRef] [PubMed]
  24. Su, P.; Hao, Y.; Qian, Z.; Zhang, W.; Chen, J.; Zhang, F.; Yin, F.; Feng, D.; Chen, Y.; Li, Y. Emissions of intermediate volatility organic compound from waste cooking oil biodiesel and marine gas oil on a ship auxiliary engine. J. Environ. Sci. 2020, 91, 262–270. [Google Scholar] [CrossRef]
  25. The People’s Government of Fujian Province. The ‘14th Five-Year’ Special Plan for the Construction of Ecological Province in Fujian Province. 2022. Available online: https://www.fujian.gov.cn/zwgk/ghjh/ghxx/202204/t20220427_5900528.htm (accessed on 13 September 2025).
  26. Lin, Z.; Fan, X.; Chen, G.; Hong, Y.; Li, M.; Xu, L.; Hu, B.; Yang, C.; Chen, Y.; Shao, Z.; et al. Sources appointment and health risks of PM2.5-bound trace elements in a coastal city of southeastern China. J. Environ. Sci. 2024, 138, 561–571. [Google Scholar] [CrossRef]
  27. Yu, G.; Zhang, Y.; Wang, Q.; Han, Z.; Jiang, S.; Yang, F.; Yang, X.; Huang, C. Changes in the impacts of ship emissions on PM2.5 and its components in China under the staged fuel oil policies. EGUsphere 2025, 2025, 9497–9518. [Google Scholar] [CrossRef]
  28. IMO. 2019 Guidelines for Consistent Implementation of the 0.50% Sulphur Limit Under Marpol Annex VI, MEPC 74/18/Add.1 Annex 14; IMO: London, UK, 2019; Available online: https://wwwcdn.imo.org/localresources/en/KnowledgeCentre/IndexofIMOResolutions/MEPCDocuments/MEPC.320%2874%29.pdf (accessed on 7 August 2025).
  29. Zhang, F.; Chen, Y.; Tian, C.; Lou, D.; Li, J.; Zhang, G.; Matthias, V. Emission factors for gaseous and particulate pollutants from offshore diesel engine vessels in China. Atmos. Chem. Phys. 2016, 16, 6319–6334. [Google Scholar] [CrossRef]
  30. Zheng, H.; Chang, X.; Wang, S.; Li, S.; Yin, D.; Zhao, B.; Huang, G.; Huang, L.; Jiang, Y.; Dong, Z.; et al. Trends of Full-Volatility Organic Emissions in China from 2005 to 2019 and Their Organic Aerosol Formation Potentials. Environ. Sci. Technol. Lett. 2023, 10, 137–144. [Google Scholar] [CrossRef]
  31. Li, Y.; Zhang, Y.; Cheng, J.; Zheng, C.; Li, M.; Xu, H.; Wang, R.; Chen, D.; Wang, X.; Fu, X.; et al. Comparative Analysis, Use Recommendations, and Application Cases of Methods for Develop Ship Emission Inventories. Atmosphere 2022, 13, 1224. [Google Scholar] [CrossRef]
  32. Fu, M.; Liu, H.; Jin, X.; He, K. National- to port-level inventories of shipping emissions in China. Environ. Res. Lett. 2017, 12, 114024. [Google Scholar] [CrossRef]
  33. Ng, S.K.W.; Loh, C.; Lin, C.; Booth, V.; Chan, J.W.M.; Yip, A.C.K.; Li, Y.; Lau, A.K.H. Policy change driven by an AIS-assisted marine emission inventory in Hong Kong and the Pearl River Delta. Atmos. Environ. 2013, 76, 102–112. [Google Scholar] [CrossRef]
  34. Li, N. Quantitative Uncertainty Analysis and Verification of Emission Inventory in Guangdong Province, 2012. Master’s Thesis, South China University of Technology, Guangzhou, China, 2017. [Google Scholar]
  35. Streets, D.G.; Bond, T.C.; Carmichael, G.R.; Fernandes, S.D.; Fu, Q.; He, D.; Klimont, Z.; Nelson, S.M.; Tsai, N.Y.; Wang, M.Q.; et al. An inventory of gaseous and primary aerosol emissions in Asia in the year 2000. J. Geophys. Res.-Atmos. 2003, 108, 8809. [Google Scholar] [CrossRef]
  36. Wei, W. Study on Current and Future Anthropogenic Emissions of Volatile Organic Compounds in China. Ph.D. Thesis, Tsinghua University, Beijing, China, 2009. [Google Scholar]
  37. Ministry of Transport of the People’s Republic of China. National Coastal Ports Layout Plan. 2006. Available online: https://xxgk.mot.gov.cn/2020/jigou/zhghs/202006/t20200630_3320031.html (accessed on 13 September 2025).
  38. Chen, M. Implement Research of Marine Low Sulphur Fuel Oil. Open J. Transp. Technol. 2021, 10, 154–163. [Google Scholar] [CrossRef]
  39. Ershov, M.A.; Savelenko, V.D.; Makhmudova, A.E.; Rekhletskaya, E.S.; Makhova, U.A.; Kapustin, V.M.; Mukhina, D.Y.; Abdellatief, T.M.M. Technological Potential Analysis and Vacant Technology Forecasting in Properties and Composition of Low-Sulfur Marine Fuel Oil (VLSFO and ULSFO) Bunkered in Key World Ports. J. Mar. Sci. Eng. 2022, 10, 1828. [Google Scholar] [CrossRef]
  40. Xiao, B.; Zhang, F.; Liu, Z.; Zhang, Y.; Li, R.; Wu, C.; Wan, X.; Wang, Y.; Chen, Y.; Han, Y.; et al. Enhanced emission of intermediate-volatility/semi-volatile organic matter in gas and particle phases from ship exhausts with low-sulfur fuels. Atmos. Chem. Phys. 2025, 25, 7053–7069. [Google Scholar] [CrossRef]
  41. Chen, Y.; Yang, C.; Xu, L.; Chen, J.; Zhang, Y.; Shi, J.; Fan, X.; Zheng, R.; Hong, Y.; Li, M. Chemical composition of NR-PM1 in a coastal city of Southeast China: Temporal variations and formation pathways. Atmos. Environ. 2022, 285, 119243. [Google Scholar] [CrossRef]
  42. Lack, D.A.; Cappa, C.D.; Langridge, J.; Bahreini, R.; Buffaloe, G.; Brock, C.; Cerully, K.; Coffman, D.; Hayden, K.; Holloway, J.; et al. Impact of Fuel Quality Regulation and Speed Reductions on Shipping Emissions: Implications for Climate and Air Quality. Environ. Sci. Technol. 2011, 45, 9052–9060. [Google Scholar] [CrossRef]
  43. U.S and Canada Proposal to Designate an Emission Control Area for Nitrogen Oxides, Sulphur Oxides and Particulate Matter; MEPC 59/6/5; IMO: London, UK, 2009. Available online: https://www.epa.gov/sites/default/files/2018-05/documents/mepc59-6-5.pdf (accessed on 7 August 2025).
  44. Viana, M.; Fann, N.; Tobías, A.; Querol, X.; Rojas-Rueda, D.; Plaza, A.; Aynos, G.; Conde, J.A.; Fernández, L.; Fernández, C. Environmental and Health Benefits from Designating the Marmara Sea and the Turkish Straits as an Emission Control Area (ECA). Environ. Sci. Technol. 2015, 49, 3304–3313. [Google Scholar] [CrossRef]
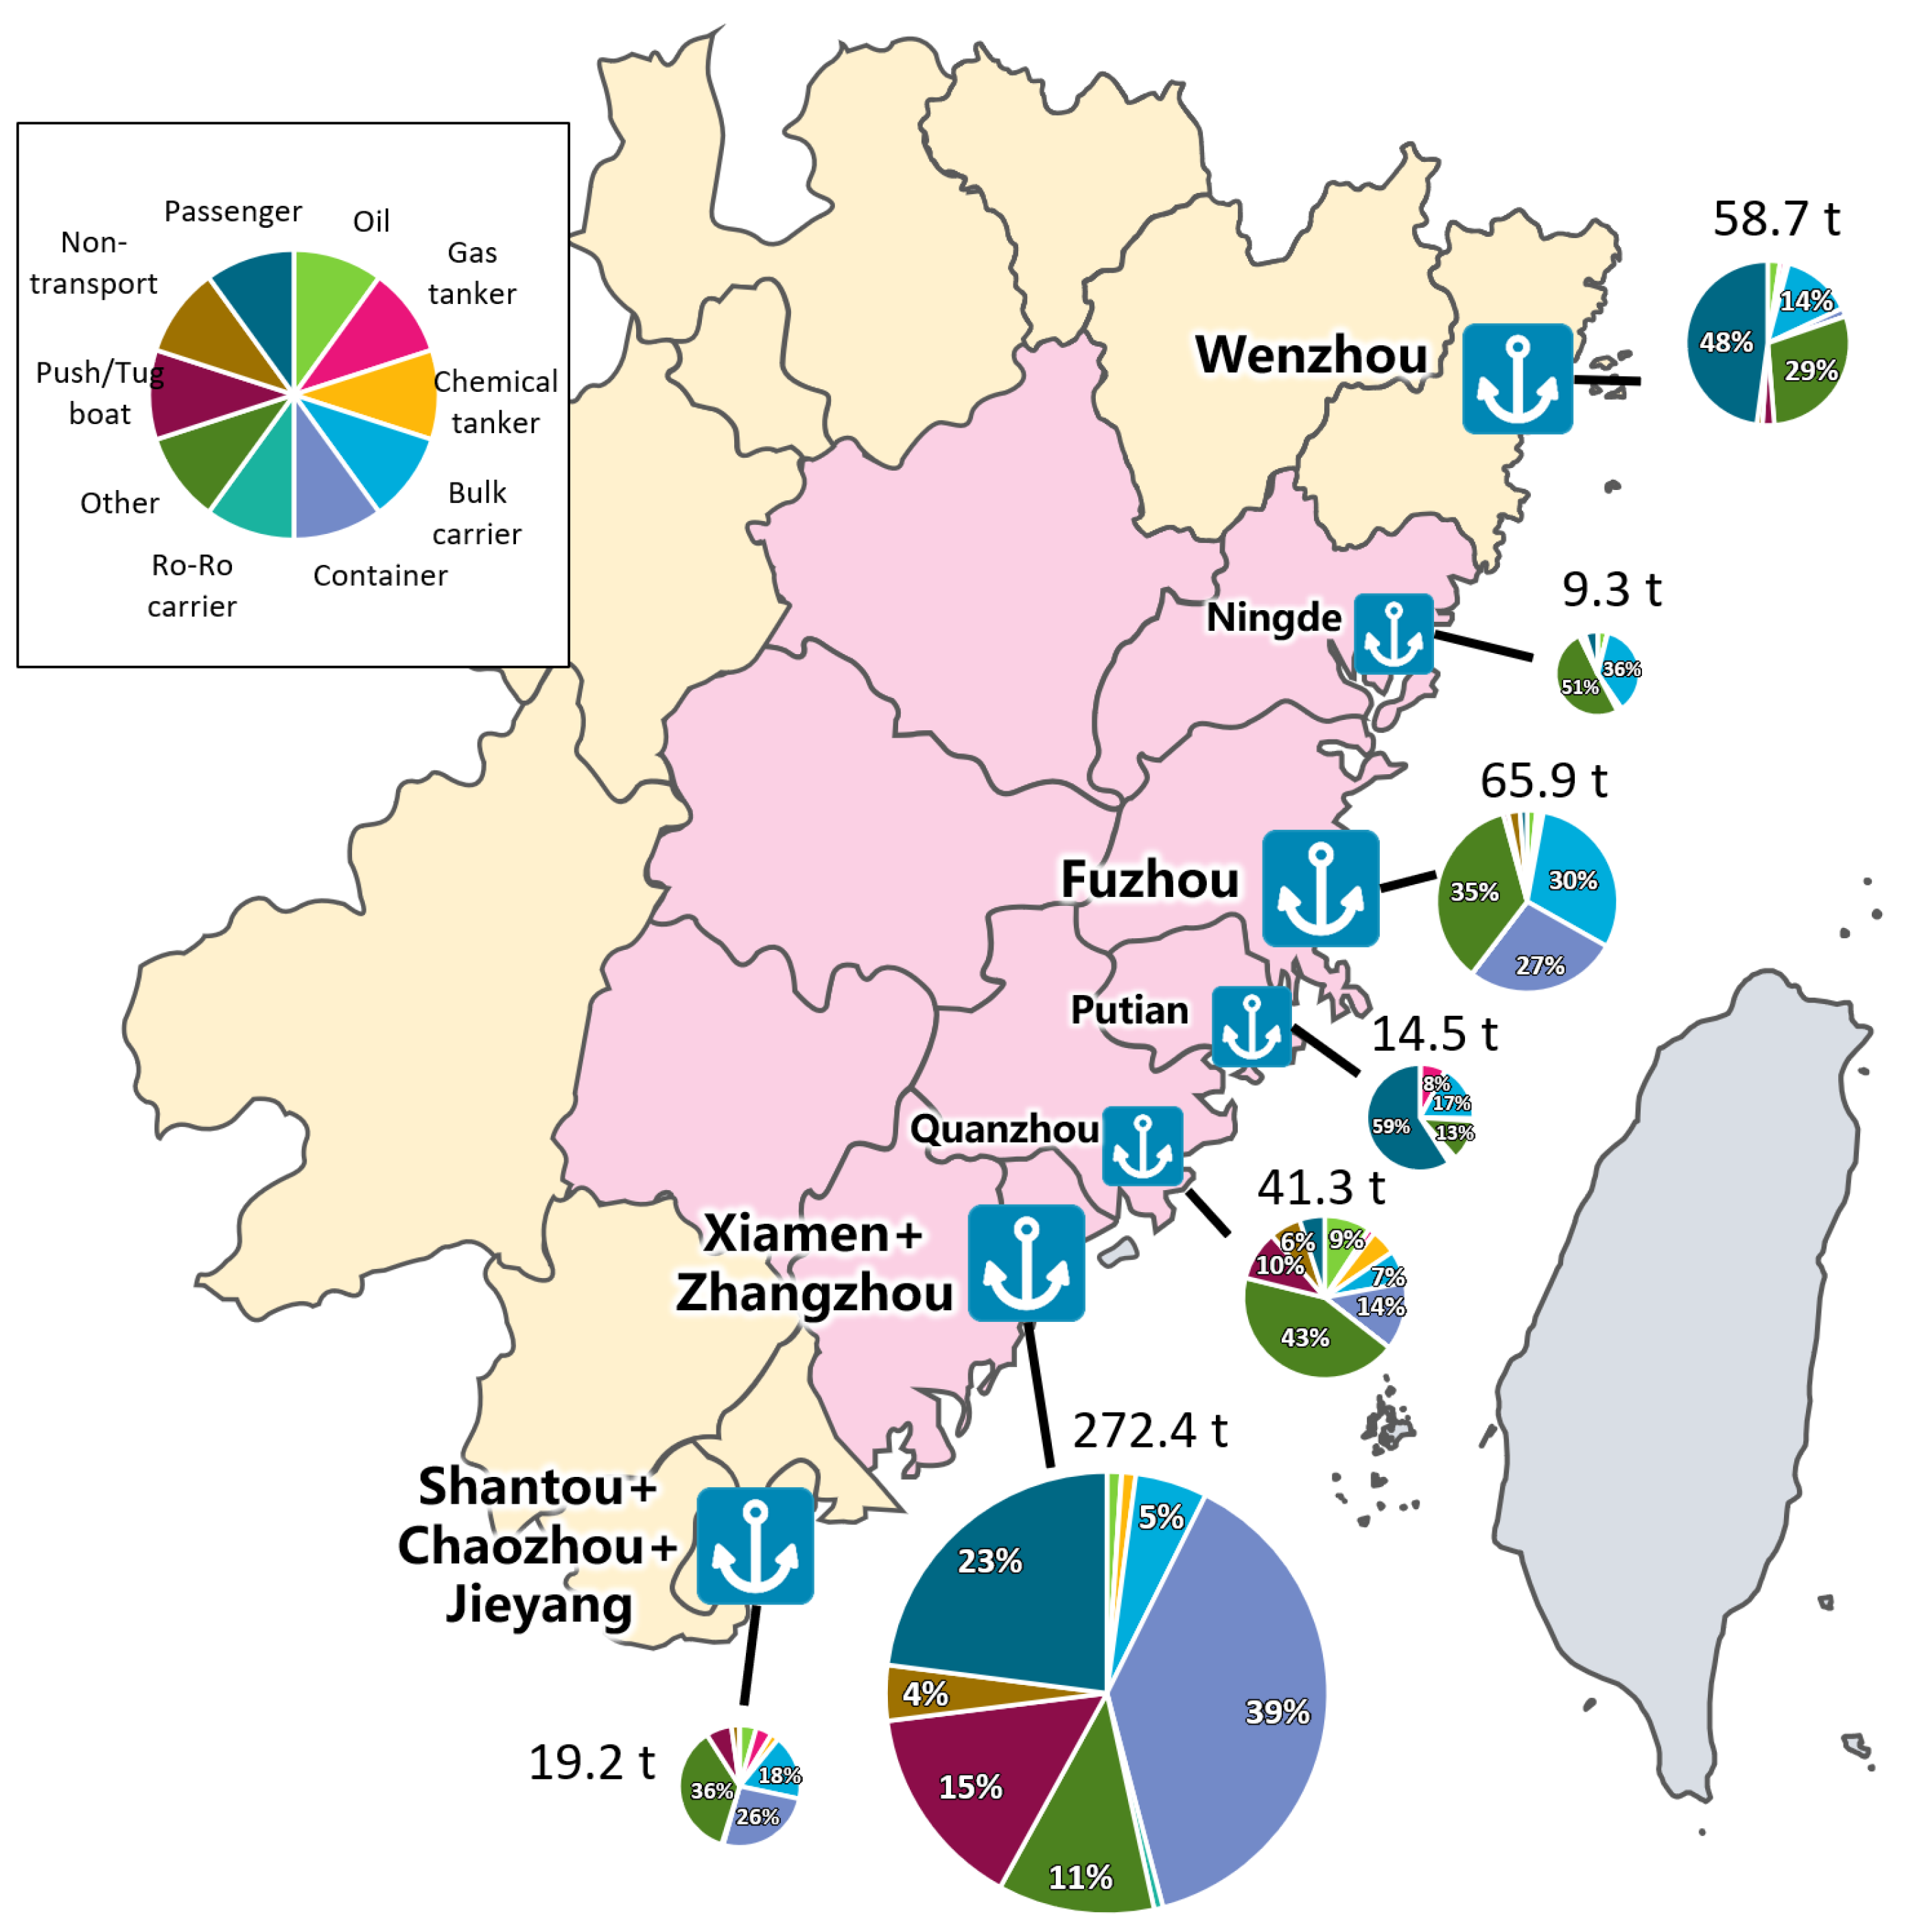
Figure 1. IVOC emissions from the major ports in the WCTS region (marked above the pie charts) and their ship type composition shown by the pie charts. The size of the pie charts reflects the total emissions. Fujian province is marked in pink, and the other cities of the WCTS in orange.
Sustainability 17 08310 g001
Figure 2. IVOC emissions from cargo ships vs. the total cargo throughput of major ports in the WCTS region. PT: Putian, ND: Ningde, ST + JY + CZ: Shantou + Jieyang + Chaozhou, WZ: Wenzhou, QZ: Quanzhou, FZ: Fuzhou, XM + ZZ: Xiamen + Zhangzhou.
Sustainability 17 08310 g002
Figure 3. The port throughput (left panel) and ship calls (right panel) for ports in the WCTS region in 2014, 2019 and 2023. ST: Shantou, XM: Xiamen, QZ: Quanzhou, PT: Putian, FZ: Fuzhou, ND: Ningde, WZ: Wenzhou.
Sustainability 17 08310 g003
Figure 4. IVOC emissions of sea-going ships in the WCTS region when using HSFO (1% m/m sulfur content), VLSFO (≤0.5% m/m sulfur content) and MGO (≤0.1% m/m sulfur content). The error bars show the uncertainties (CVs) of the total emissions.
Sustainability 17 08310 g004
Table 1. The integrated IVOC emission factors (EF) of sea-going vessels with different ship types, fuel types and operation modes. The IVOC EFs marked with asterisks are determined by this study based on extrapolation or estimation, while others are directly from the literature.
Ship TypeEngineFuel (Sulfur Content)Operation ModeIVOC EF (mg/kWh)
Bulk carrierMain engineHSFO (>0.5%)Cruising151.6
Maneuvering225.1
VLSFO (≤0.5% and >0.1%)Cruising325.2
Maneuvering439.1
MGO (≤0.1%)Cruising402.3
Maneuvering543.1 *a
Auxiliary engineHSFO (>0.5%)All328.8 *d
VLSFO (≤0.5% and >0.1%)All641.4
MGO (≤0.1%)All367.4
BoilerAllAll5.24
Oil tankerMain engineHSFO (>0.5%)Cruising94.6 *c
Maneuvering140.4 *c
VLSFO (≤0.5% and >0.1%)Cruising202.9
Maneuvering274.0 *b
MGO (≤0.1%)Cruising212.8
Maneuvering287.3 *b
Auxiliary engineHSFO (>0.5%)All281.0 *c
VLSFO (≤0.5% and >0.1%)All548.1 *c
MGO (≤0.1%)All219.4
BoilerAllAll5.24
Other cargo vessels and tug boatMain engineHSFO (>0.5%)Cruising151.6
Maneuvering225.1
VLSFO (≤0.5% and >0.1%)Cruising325.2
Maneuvering439.1
MGO (≤0.1%)Cruising402.3
Maneuvering543.1 *a
Auxiliary engineHSFO (>0.5%)All328.8 *d
VLSFO (≤0.5% and >0.1%)All641.4
MGO (≤0.1%)All367.4
BoilerAllAll5.24
Passenger shipsMain engineHSFO (>0.5%)Cruising106.2 *c
Maneuvering122.3 *b
VLSFO (≤0.5% and >0.1%)Cruising207.1
Maneuvering214.7 *b
MGO (≤0.1%)Cruising219.4
Maneuvering227.5 *b
Auxiliary engineHSFO (>0.5%)All328.8 *d
VLSFO (≤0.5% and >0.1%)All641.4
MGO (≤0.1%)All367.4
BoilerAllAll5.24
Non-transport shipsMain engineMGO (≤0.1%)Cruising59.2 *e
Maneuvering28.2 *e
*a Extrapolated based on the assumption that the ratio of cruising and maneuvering are the same across fuel types. *b Extrapolated based on the assumption that the ratio of cruising and maneuvering are the same across ship types. *c Extrapolated based on the assumption that the ratio of different fuel types is the same across ship types. *d Extrapolated based on the assumption that the ratio of different fuel types is the same across engine types. *e Estimated based on IVOC/OC.
Table 3. Comparisons of the vessel IVOC emissions with other land-based transportation (including on road vehicles and off-road transportation) IVOC emissions from the ABaCAS emission inventory in the WCTS region in 2014 [30]. The unit is ton.
CityWenzhouNingdeFuzhouPutianQuanzhouXiamen+
Zhangzhou
Shantou+
Chaozhou+
Jieyang
On road vehicles1187.9376.51661.8402.71579.22062.5747.1
Off-road transportation433.0144.5426.0127.5522.7537.8257.3
Port ships58.89.365.914.541.3272.419.2
Table 4. The IVOC emissions from different vessel types (total emissions from the 7 ports or port clusters in the WCTS region). The unit is ton.
Cargo Ship (314.0 t in Total)Passenger ShipNon-Transport ShipPush/Tug Boat
Oil TankerGas TankerChemical TankerBulk CarrierContainerRo-Ro CarrierOther
10.43.56.254.4134.81.9102.9102.616.348.5
Table 5. The IVOC emissions and their shares (%) from different gross tonnage types (total emissions from the 7 ports or port clusters in the WCTS region). Also shown is the number of entry/departure ships (ship calls) and the share (%) of each gross tonnage types.
<100 Gt100~500 Gt500~1000 Gt1000~2000 Gt3000~10,000 Gt10,000~50,000 Gt>50,000 Gt
IVOC emission, t0.118.12.553.463.095.781.2
%0.0%5.7%0.8%17.0%20.0%30.5%25.9%
Ship calls262095,008518469,01836,67323,6368917
%1.1%39.4%2.2%28.6%15.2%9.8%3.7%
Table 6. The IVOC emissions and their shares (%) from different operation modes (total emissions from the 7 ports or port clusters in the WCTS region).
CruisingArrival/DepartureAt Berth
IVOC emission, t220.454.7206.3
%45.8%11.4%42.9%
Disclaimer/Publisher’s Note: The statements, opinions and data contained in all publications are solely those of the individual author(s) and contributor(s) and not of MDPI and/or the editor(s). MDPI and/or the editor(s) disclaim responsibility for any injury to people or property resulting from any ideas, methods, instructions or products referred to in the content.