Article

Developing and Validating a Data-Driven Application for Street-Accessible Urban Bench Analysis and Planning to Support Evidence-Based Decision Making in Age-Friendly, Sustainable Cities

by
Agnieszka Ptak-Wojciechowska
1,*,
Agata Gawlak
1,
Patryk Maciejewski
2,
Dmytro Romaniv
2,
Michał Skrzypek
2,
Dariusz Brzeziński
2 and
Jerzy Stefanowski
2
1
Faculty of Architecture, Institute of Architecture and Heritage Protection, Poznan University of Technology, ul. Jacka Rychlewskiego 2, 61-131 Poznan, Poland
2
Faculty of Computing and Telecommunication, Institute of Computing Science, Poznan University of Technology, ul. Piotrowo 2, 60-965 Poznan, Poland
*
Author to whom correspondence should be addressed.
Sustainability 2025, 17(18), 8251; https://doi.org/10.3390/su17188251
Submission received: 26 July 2025 / Revised: 4 September 2025 / Accepted: 5 September 2025 / Published: 14 September 2025
(This article belongs to the Section Health, Well-Being and Sustainability)

Abstract

Ageing societies place new demands on urban spaces, such as aligning with the 15 min city concept prominent in the European Union’s strategies for urban planning. Promoting the idea of a supportive open public space for all, reducing inequalities, and improving health and well-being are considerations in line with Sustainable Development Goals. However, achieving accessible environments requires focusing on specific needs, such as street infrastructure for seniors, and urban benches are crucial for enhancing older adults’ mobility and societal participation, yet their placement often lacks systematic analysis. In this study, we address the above gap by developing a data-driven application that allows users to analyse bench locations and spacing along city streets. Our case studies from selected European cities show that current bench distributions along streets frequently deviate from designated good practices. The results of these case studies can serve as references for other cities around the world and provide insights into developing new standards. With the proposed tool, users can not only visualise the current level of street age-friendliness in terms of urban benches, but also potentially simulate future urban bench location scenarios, supporting evidence-based decision making by city authorities worldwide, thus promoting more sustainable cities and communities.

Graphical Abstract

1. Introduction

Urban areas face challenges, such as demographic shifts [1] and climate change [2], which impact vulnerable populations; seniors are particularly affected by these changes: their health and well-being are influenced by weather conditions, among other things [3], while their mobility is significantly correlated with the built environment [4,5]. Moreover, both social inclusion and physical activity are influenced by land use, as well as the proximity of public utility services, which is reflected in the newest European Union legislation, highlighting the importance of implementing the 15 min city concept in urban planning [6,7]. A 15 min city is environmentally friendly; lowering car traffic is associated with less air pollution and lower noise, and the concept prioritises intergenerational, age-friendly environments, taking service-related needs into account in a fair and sustainable manner [8]. The idea, focused on ensuring that residents have access to key services and places of daily use—such as, for instance, shops, workplaces, and recreation—within a short walk or bike ride [9], improves the each age group’s liveability; however, it may have a significant impact on the elderly, who tend to want to age in place [10]. Due to their limited mobility, older citizens are often excluded from many of the functions offered by a city, as they are unable to travel the same distances as an average pedestrian, tending to become tired and discouraged more easily. The walking pace of older adults is approximately 0.84 m/s, slower than the general population’s average pace, which is around 1.31–1.47 m/s [11]; moreover, while walking, elderly people tend to require frequent breaks. Although close proximity of services to older citizens’ residential areas is important, this does not matter so much when a senior is not able to stop and rest during their journey.
The presence of adequate space and infrastructure for allowing pedestrians to rest for a while, including benches or half-benches in cities, encourages people to walk, stay out longer, and develop relationships [12], which is in line with leading urban design theories, such as that by Gehl and Alexander, who argue that urban space succeeds when public life is prioritised and fostered by well-designed human-scale elements. Gehl claims that cities must provide good conditions for basic activities, such as walking, standing, sitting, watching, listening, and talking [13]. Among walking variations, he lists, e.g., goal-oriented walking, slow strolling, and also older people walking out of determination to exercise, run an errand, or just enjoy fresh air. As a walk may be a potential occasion for other activities, Gehl also draws attention to sitting options, diversifying them into primary (e.g., benches) and secondary (e.g., wall seats). Although children and youth can sit anywhere, older people require more comfort; thus, it is essential to offer them good seating. Following Christopher Alexander, streets should not only be for moving through; they should be designed to encourage longer stays [14]. He suggests designing streets with seats and highlights the importance of choosing good spots for them. One such pattern is a Front Door Bench, a solution allowing an occupant to watch the street from just outside the front door. The need for furnishings on streets was also indicated by Mehaffy et al. in a new collection of 80 patterns formulated to address new urban challenges [15]; the authors suggest providing places to sit along a Walkable Streetscape and argue that at least some of the provided seats should be movable. Among other elements that can make a streetscape more attractive, the authors list lamps, planters, signs, banners, protective bollards, and art pieces.
Since the impacts of the built-up environment on quality of life are undeniable, more and more studies and available instruments have measured the liveability of cities [16,17,18]; there is also extensive research narrowed down to senior mobility and the accessibility of space. Existing works cover the following topics:
-
Seniors’ perceptions of spatial aspects [19,20,21];
-
Measuring spatial barriers [22,23];
-
The relationships between spatial attributes and older adults’ physical activity, mobility, and mental health [24,25,26,27,28];
-
Safety and mobility issues [29];
-
The associations between satisfaction with the built environment and the physical movement of the elderly [30];
-
Multicriteria methods to improve urban pedestrian accessibility [31];
-
Systematic analyses of the work in the above fields [4,29,32,33].
Among other urban spatial attributes (public toilets, lighting, pavement slope and width, etc.), and significant from the perspective of walkability and older citizens’ needs [34,35,36], the importance of benches in cities has been highlighted [12,33,37,38]. According to Wysocki, a special level of accessibility requires that a resting place for people with limited mobility be designated approximately every 50–100 m [39], whereas planners of Gdynia, the first Polish city from the WHO Global Network for Age-Friendly Cities and Communities, placed benches at 150 m intervals [40]. Following these recommendations, as part this study, we developed an assessment framework that grades city streets based on the number of and distance between benches, where a 50 m interval is optimal, and a 150 m interval is convenient.
Studies on urban areas’ accessibility to seniors are in line with the EU’s Sustainable Development Goals (SDGs), which state that cities should become inclusive for all, including older people [41]. Promoting walking, a sustainable alternative to conventional transportation, is in line with the EU’s aims to lower CO2 emissions from transportation [35,42]; moreover, it is related to health, specifically lower obesity rates. Adding benches may indirectly improve citizens’ health and well-being, while also reducing inequalities in accessing and using a public space.
The World Health Organization inspires and supports governments and communities to become more age-friendly through the WHO Global Network for Age-Friendly Cities and Communities, launched in 2010 [43]; today, the network includes 1606 cities and communities in 53 countries that are committed to working with their ageing populations, monitoring the environment for age-friendliness, and sharing experiences with other cities and communities [44]. Some Polish cities, such as Poznań [45] and Gdynia, have joined the network, along with other European cities, including, e.g., Amsterdam (Netherlands) and Stuttgart (Germany) [46]. Due to their different histories, cultures, and geographic locations, it is worth conducting a comparative analysis of the current bench arrangements in these cities, to compare their levels of rest stop accessibility.
Apart from differences between cities, the level of age-friendliness may also differ for specific urban areas within the same city [47], a phenomenon confirmed in a previous study, in which the neighbourhoods (districts) of Poznań that are inhabited by the largest numbers of older people (Rataje, Piątkowo, Św. Łazarz, Grunwald Południe, and Chartowo), were evaluated and compared based on their comprehensive spatial quality (including sets of different criteria, sub-criteria, and metrics), which impacts the well-being of the elderly [16,48]. Benches in the aforementioned neighbourhoods were analysed separately, from the viewpoints of expert assessments and seniors’ perceptions, as part of the street furniture sub-criterion (by experts) and, more specifically, the number of benches metric (by seniors). In the study presented herein, we compare those survey data with the quantitative results of an analysis carried out using the new map-based tool we propose.
To the best of the authors’ knowledge, there are currently no tools that can be used to analyse the number and distribution of benches in a city; thus, there is also a lack of support for considering improvement scenarios. Although, the StreetMix tool can be used to visualise public spaces and analyse how street and pavement layout change according to different scenarios, with one of the functionalities being the option to add benches, the tool can only be used to analyse the selected street sections, not entire maps [49]. There are commercial tools, such as ArcGIS or Urban Footprint, for analysing maps and developing scenarios using data mining; however, they do not offer any dedicated functions for bench analyses. In this paper, in order to address these gaps, we propose a data mining tool that integrates guidelines for age-friendly streets, using data on benches available on Open Street Map.
The aim of this study was to develop and validate a data-driven application for the analyses of street-accessible urban benches and their future placement simulation, in order to support evidence-based decision making for more age-friendly and sustainable cities. The objectives of this study were as follows: (i) to synthesise the available standards and good practices of bench distribution; (ii) to develop a new data-driven tool for measuring distances between street-accessible urban benches, grading streets, and recommending improvement scenarios; (iii) to compare experts’ and seniors’ assessments of the current state of urban benches, with objective quantitative data from five selected Poznan neighbourhoods; (iv) to compare and assess the current state of street-accessible urban benches in selected age-friendly cities from Poland and cities in Europe; and (v) to develop new standards for street-accessible urban bench placement.
The reminder of this paper is organised as follows. Section 2 describes our materials and methods, including data sources and preparation (Section 2.1), formulating guidelines for bench distribution assessment (Section 2.2), implementing the algorithm for bench-to-street assignment (Section 2.3), developing a metric for calculating street age-friendliness in terms of urban bench placement (Section 2.4) and developing an application for its assessment (Section 2.5), comparative analyses of five Poznan neighbourhoods (Section 2.6) and selected age-friendly Polish and European cities (Section 2.7), and simulation of urban bench distribution (Section 2.8). Section 3 details the comparative analysis results of the following: Poznan neighbourhoods (Section 3.1), Polish cities from the Age-Friendly Cities Network (Section 3.2), European cities from the Age-Friendly Cities Network (Section 3.3), and proposed standards for the number and distribution of age-friendly street-accessible urban benches (Section 3.4). Section 4 follows with discussion, and Section 5 with conclusions.

2. Materials and Methods

The first stage of this study involved problem identification, which led to the development of the main aim and objectives (see Section 1: Introduction). The next stages included the development of guidelines for bench placement (based on the available standards and good practices), data sources and preparation, bench-to-street assignment, the development of a metric for calculating street age-friendliness in terms of street-accessible urban bench placement, the development of the application for street assessment, and the implementation of a bench placement simulation. Thereafter, the actual state of street-accessible urban benches along streets in five selected Poznan (Polish) neighbourhoods was analysed with the use of an app. The subsequent stages involved comparative analyses of selected age-friendly Polish and European cities based on their street-accessible urban bench placements, as well as manipulating the standards for age-friendly urban benches’ number and distribution. Finally, the data were analysed and conclusions drawn (Figure 1); the comparative analyses were a cornerstone for proposing guidelines for new urban planning standards.

2.1. Data Sources and Preparation

In an attempt to make the developed street assessment tool open and applicable to different cities around the world, data on specific bench locations were sourced from Open Street Map (OSM), a comprehensive mapping service that presents data on a city’s infrastructure (e.g., street segments, buildings, benches, canopies), all introduced by OSM users. Map elements in OSM are described using so-called tags, which facilitate the classification and addition of information with regard to individual objects. OSM was chosen because it is a free resource with global, user-provided data, making the developed bench analysis tool available to users around the world without requiring access to paid repositories and maps; moreover, due to its open-source nature, OSM has also been successfully used by other researchers [50,51] and publicly available urban tools, such as Open Route Service.
The level of detail in an OSM element depends on user activity; to verify the applicability of OSM data for this study, we decided to revise the database to make sure that we based this study’s conclusions on up-to-date data. In our initial study visit of Poznan streets, we discovered that the data regarding benches were incomplete in OSM; therefore, a group of 180 students from the Faculty of Architecture of Poznan University of Technology conducted on-site bench location verifications. The data available in OSM were compared with the actual situation on the ground, and additional geographic coordinates were provided for benches that were missing or inaccurately mapped in five Poznań neighbourhoods; simultaneously, the demographic statistics regarding the retired population were obtained from the official database of the city of Poznań.
After verifying and extending OSM data, we developed an interactive web application using Python 3.11.0 for OSM data filtering, visualisation, and analysis; for this purpose, we used the following libraries: pandas 2.2.3, numpy 2.1.0, osmnx 1.7.0, shapely 2.0.6, geopy 2.4.1, folium 0.17.0, and streamlit 1.38.0. Additional data regarding the five selected Poznan neighbourhoods were taken from a study concerning the multicriteria index of the spatial quality of Poznan neighbourhoods [16,48]. The data juxtaposed the opinions of 96 inhabitants on benches in their neighbourhoods against evaluations of the neighbourhoods by 8 experts; this on-site data verification, combined with a statistical validation of our final metric against senior citizen surveys (detailed in the Section 3: Results), formed the basis for ensuring our tool’s accuracy and relevance.

2.2. Formulating Guidelines for Bench Distribution Assessment

Determining bench placement standards was the most crucial element of this study; the intervals between benches for each level of street age-friendliness were developed based on available recommendations [39,52,53,54], as well as good practices implemented by municipalities [40]. According to the developed assessment criteria, streets were classified as follows:
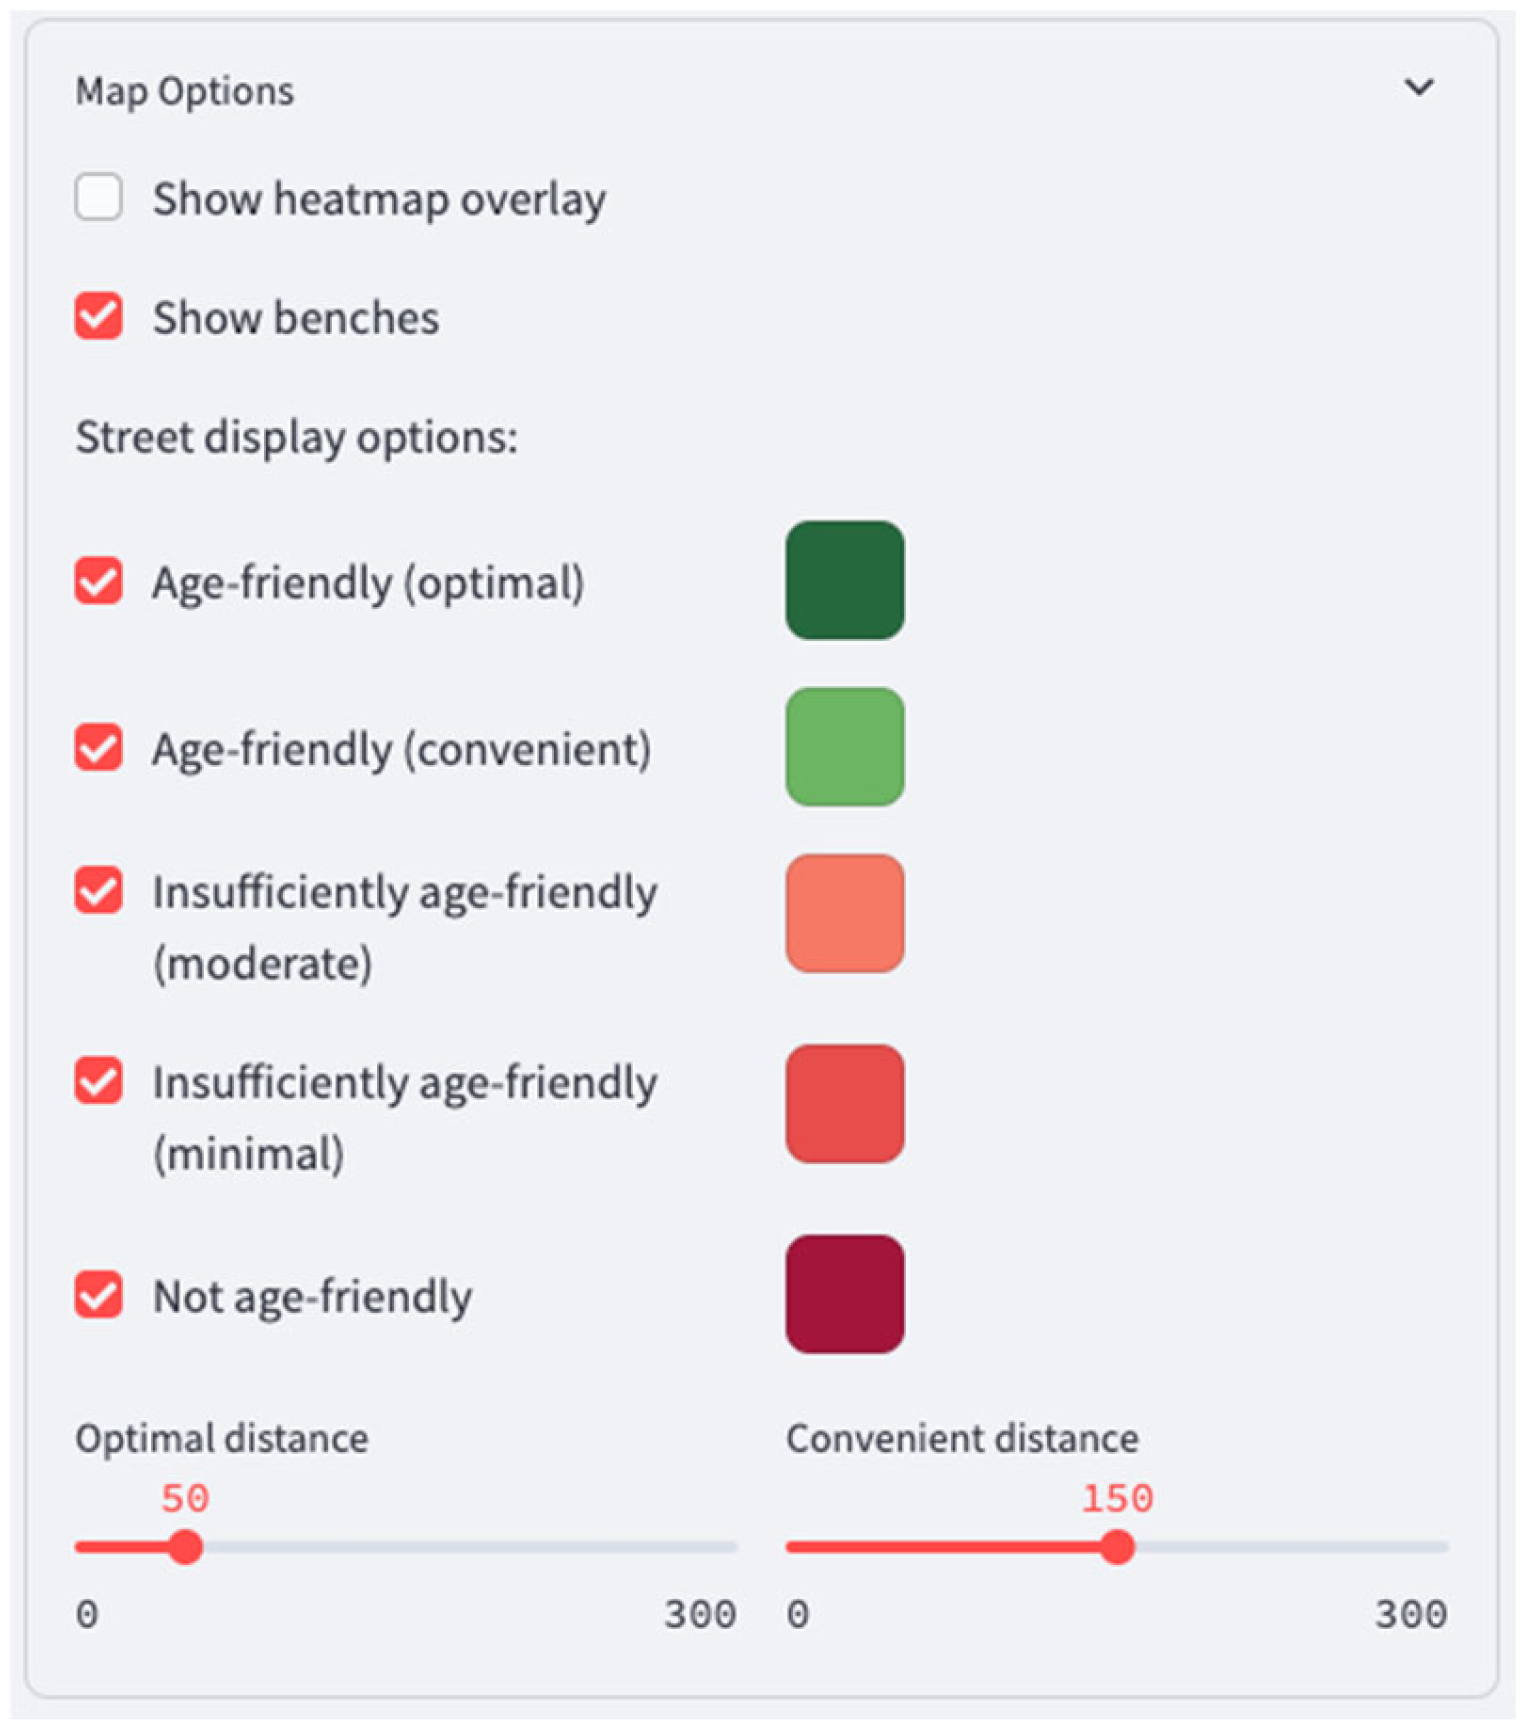
  • “Age-friendly (optimal)”—a street with benches located every 50 m, at most [39,52,53,54];
  • “Age-friendly (convenient)”—a street with benches located every 150 m, at most [40,54];
  • “Insufficiently age-friendly (moderate)”—a street with several benches, distributed at intervals of more than 150 m;
  • “Insufficiently age-friendly (minimal)”—a street containing one bench [27];
  • “Not age-friendly”—a street with no benches.
  • Each class was reflected using an assigned colour, as in Figure 2.

2.3. Bench-to-Street Assignment

The assessment of streets, discussed in Section 2.2, relies on the assignment of benches to street segments; to this end, we implemented an algorithm that assigns benches and classifies streets in the following steps:
  • Filtering Open Street Map geometric data (e.g., polygons and multipolygons) that do not represent sidewalks. Walkways of less than 55 m in length were removed to prevent excessive misassignments; moreover, junctions and pedestrian crossings were removed, since they are not suitable for placing benches.
  • Creating a spatial margin for each pavement, with a width of 11 m; such a margin of error makes it possible to assign benches, even when there are minor shifts in the geospatial data.
  • Assigning benches iteratively. The algorithm searches through bench data and assigns each bench to a sidewalk (OSM street segment) if it is within its spatial margin. In a situation where a bench can potentially be assigned to more than one sidewalk, the algorithm chooses the closest sidewalk according to Euclidean distance. The benches taken into account during this step include those originally in OSM, as well as any user-specified bench coordinates provided via external files (e.g., collected as part of a field study).
  • Dynamically reclassifying segments. Once benches are assigned to street segments, the walkways are classified according to the guidelines detailed in Section 2.2; for this purpose, the tool calculates the spacing between benches to determine a given street’s classification. We note that this is not a simple straight-line measurement. Instead, the algorithm projects each bench’s location onto the street segment’s geometry (a linestring), and then calculates the distance along this linestring path between each consecutive bench; this method ensures that the measurement accurately reflects the true pedestrian walking distance, accounting for any curves in the street. The final classification (e.g., ‘optimal’, ‘convenient’) is based on the maximum path distance found between any two consecutive benches on that segment.

2.4. Metric for Calculating Street Age-Friendliness in Terms of Urban Bench Placement

The metric for assessing street age-friendliness in terms of urban bench placement within a given urban area was derived from the bench-to-street ratio, which was calculated by assessing urban bench availability along each street. The formula takes into account street length, the current number of benches, and the ideal number of benches based on a user-defined reference (‘optimal’) value. As mentioned in Section 2.2, the default optimal value, according to our literature research, is one bench every 50 m.
Street age-friendliness in terms of the urban bench placement score was calculated in stages. First, the ideal number of benches expected on a given street, i.e., the number of benches a street should have to achieve the classification of “age-friendly (optimal)”, was calculated; this ideal value was estimated by dividing the street length by the user-defined ‘optimal’ bench placement interval (default 50 m). Subsequently, the ratio of the current number of benches to the ideal number required was calculated; this step was repeated for every street i within an analysed region. Finally, to obtain the overall Street Age-friendliness Score for a region, a weighted average, based on each street’s length, was computed. The formula for a region’s Street Age-Friendliness Score is as follows:
Street   Age - friendliness   Score   =   i = 1 n   Current   Benches i Ideal   Benches i   ×   Length   of   Street i     i = 1 n Length   of   Street i  
where:
n is the total number of streets evaluated;
Current Benchesi is the current number of benches on street i;
Total Benches Neededi is the ideal number of benches for street i, calculated heuristically as Length of Streeti/Optimal Bench Distance;
Optimal Bench Distance is a user-defined parameter representing the ideal distance between two benches on a street (50 m in this study).
Length of Streeti is the length of street i.
This formula can be used to quantify the extent to which an area caters to the needs of its senior residents, thereby providing a measurable indicator of its street age-friendliness in terms of urban bench placement, enabling city planners and decision makers to identify areas requiring improvement and allocate resources for urban enhancement.

2.5. An App for Assessing Street Age-Friendliness in Terms of Urban Bench Placement

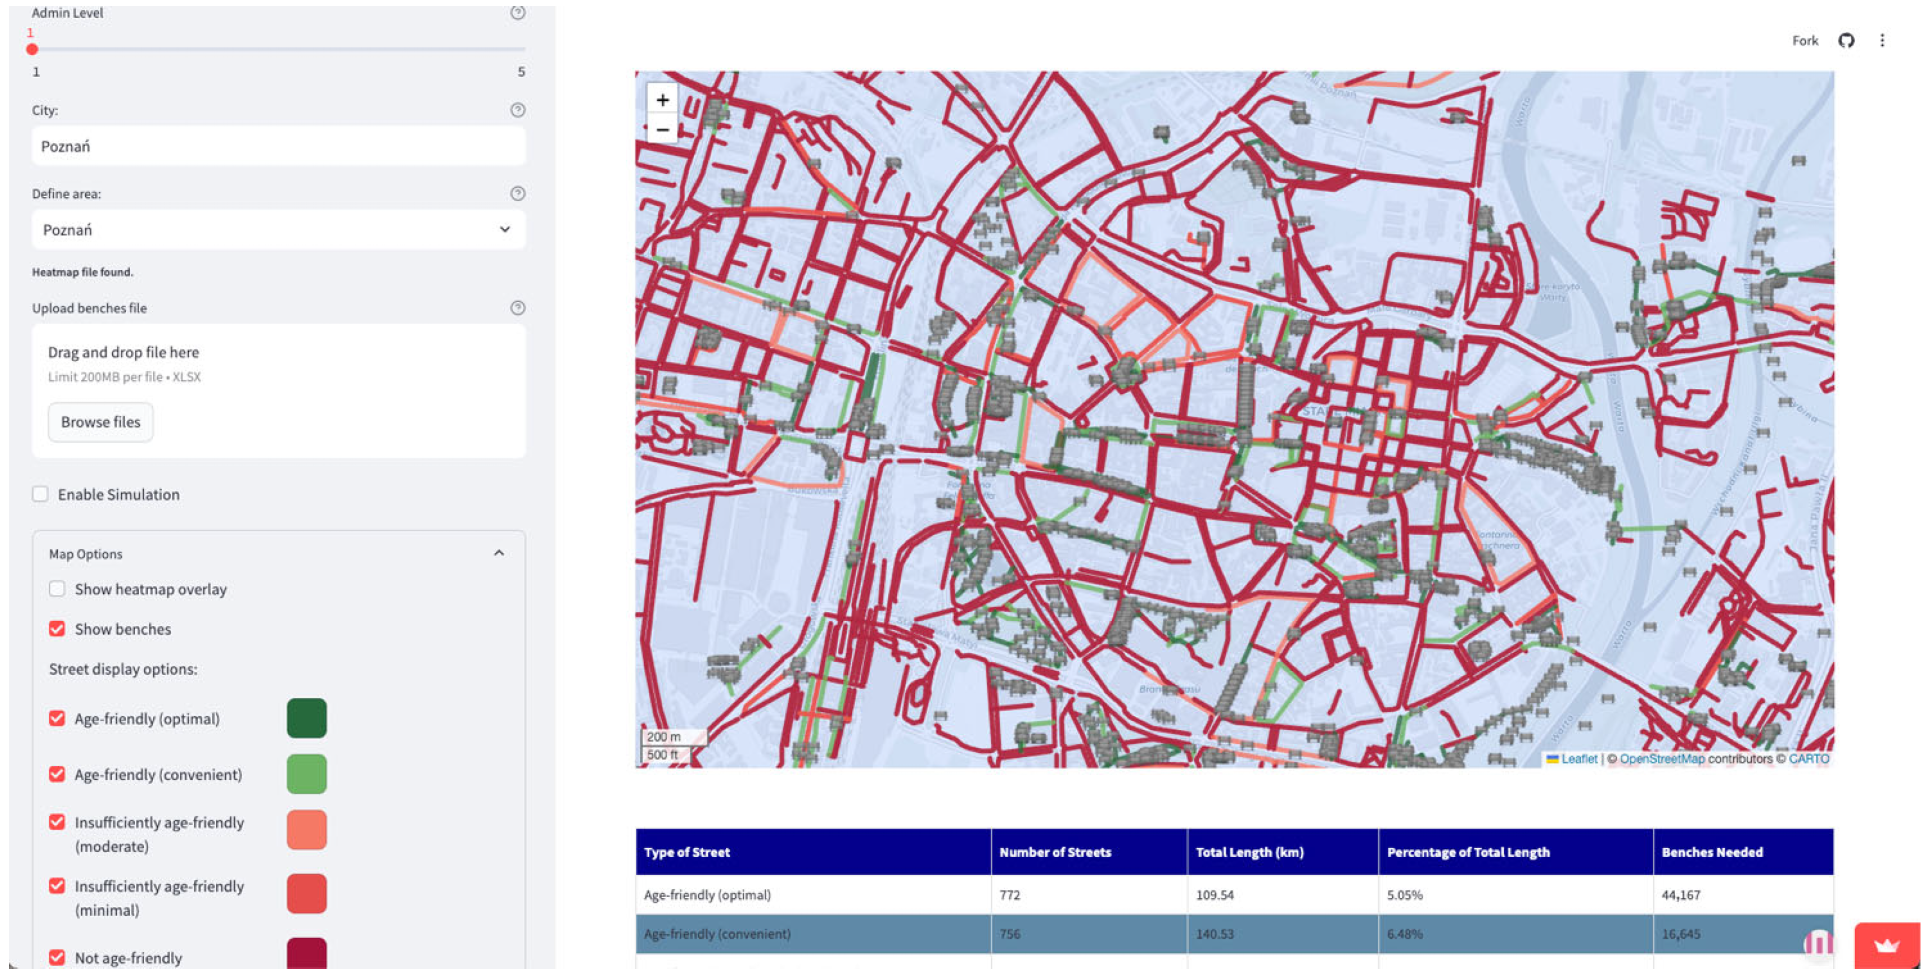
An interactive web application serves as an interface for the insights derived from this study (Figure 3); it visualises the current urban bench distribution in the selected area (neighbourhood or city), generates tables with reports on, e.g., the number of benches, and generates improvement scenarios.
The app is structured as follows:
  • User interface: The application features a straightforward design with a functional sidebar for navigation, facilitating seamless switching between the map view and heat map view, as well as map parameter tweaking.
  • Map view: At the heart of the app is the map view, incorporating Open Street Map data; it showcases the benches, and the streets are coloured per their respective classes. Users can interact with this map for detailed exploration of specific regions.
  • Settings page: The settings page offers customisation options for analysis parameters, including options such as “Admin Level”, with a scale to change the administrative division level from 1 to 5 (where lower values are more general, e.g., city; and higher values are more specific, e.g., neighbourhood), as well as the ability to upload custom location data for the benches or demographic heatmap.
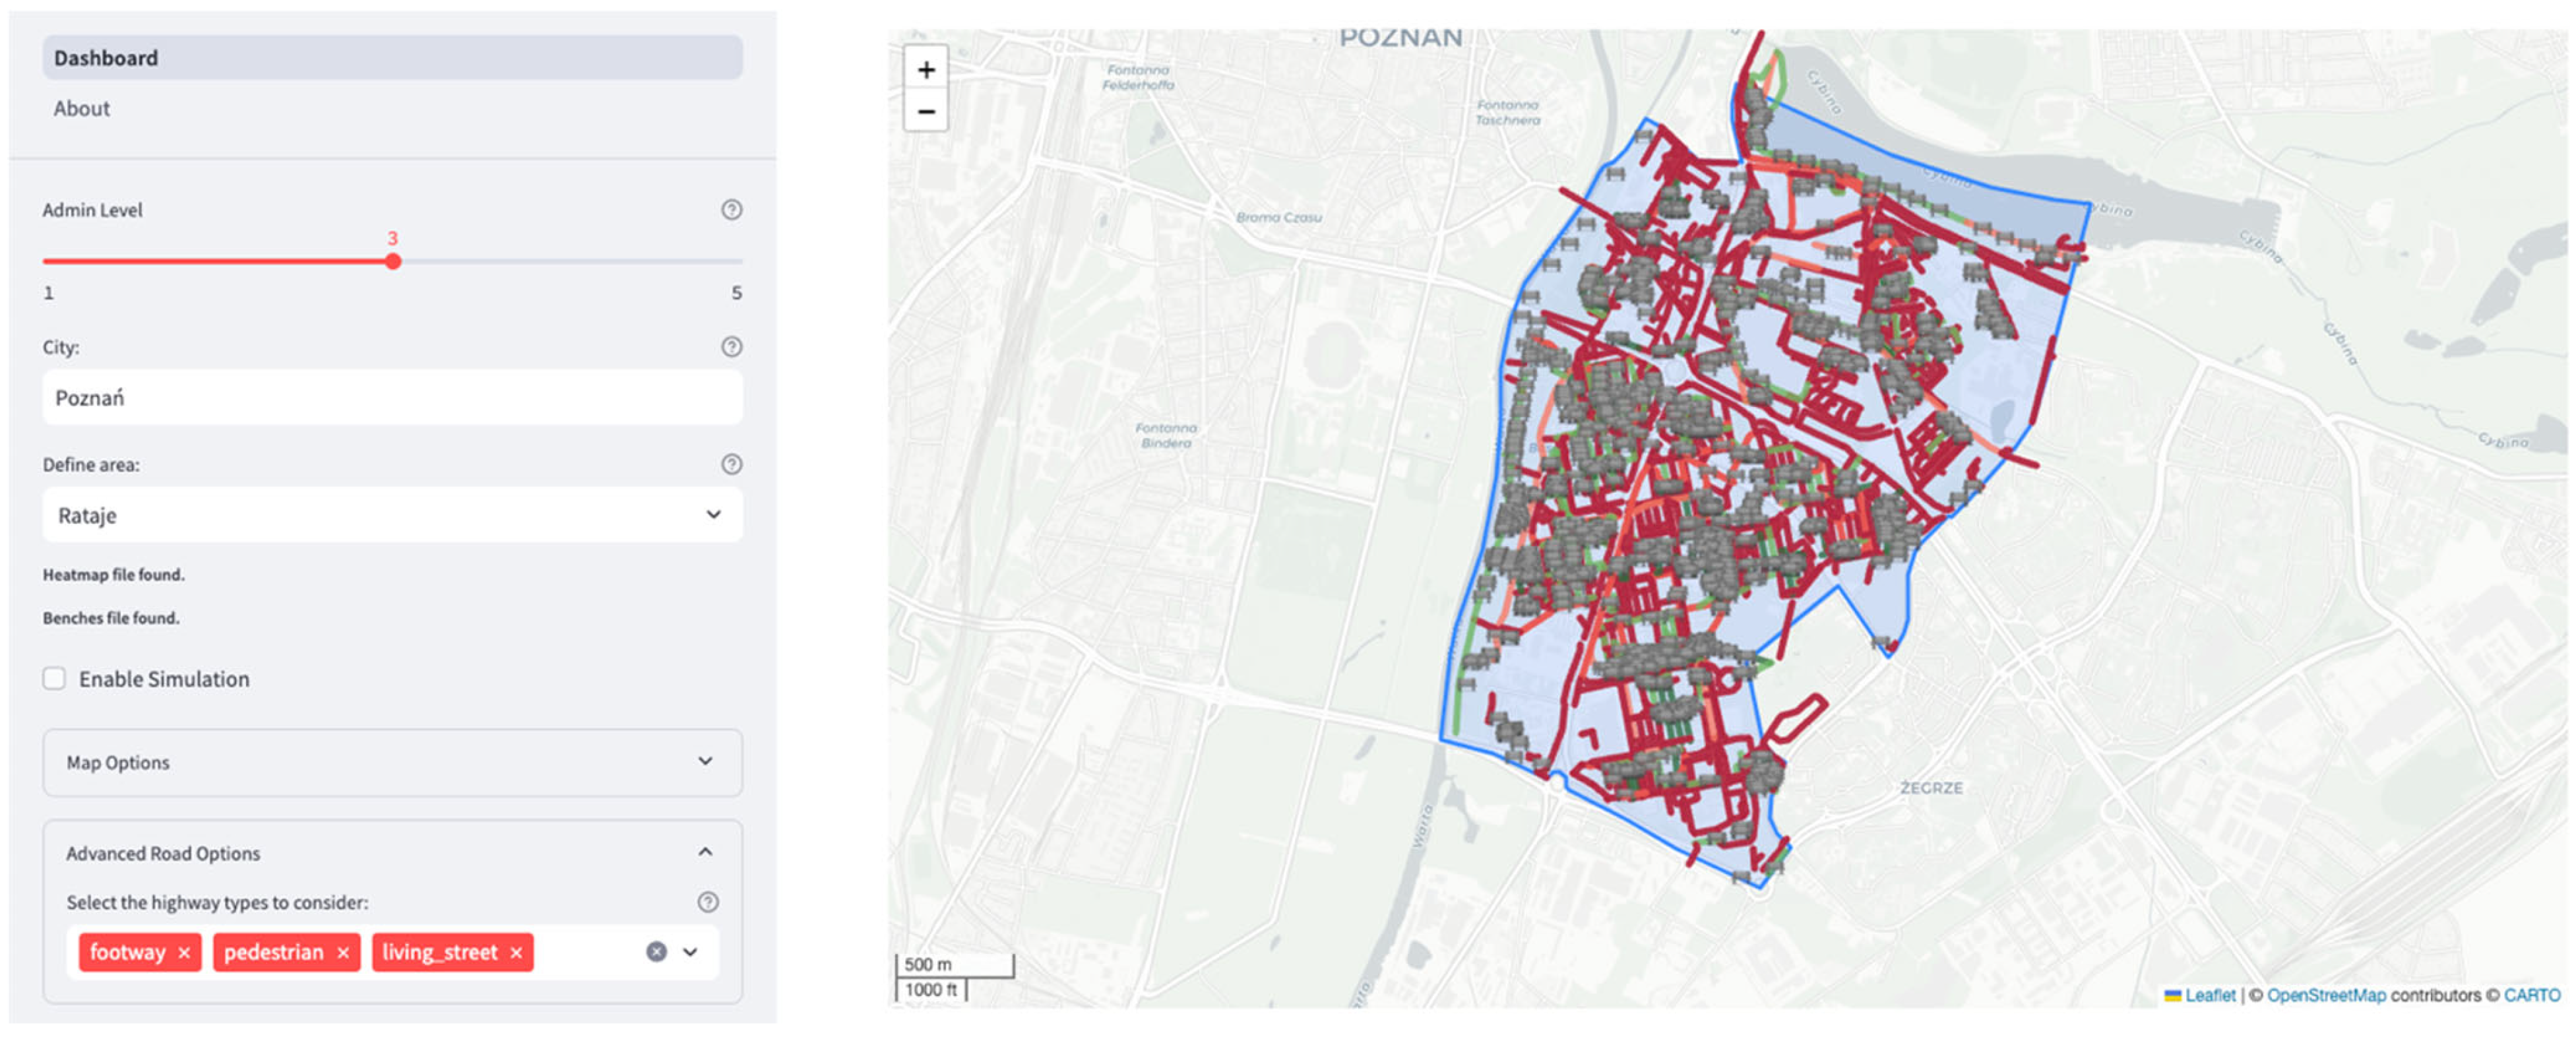
  • The following functionalities can also be accessed in the settings page: “Map Options”, which allows the user to show a heatmap overlay and show or hide benches; “Street display options”, which enables the user to show or hide the selection of individual street classes, with a slider for setting the optimal and convenient distances; and “Advanced Road Options”, allowing the user to customise which Open Street Map ‘highway’ types are included in the analysis. By default, we focused on the most pedestrian-friendly environments, those safer and more comfortable for older adults; however, every region is different, so it is also possible to consider additional road, path, or infrastructure types depending on local conditions, data availability, and specific goals.
  • Simulation: This feature enables the user to initiate a simulation that estimates the enhancement of the Street Age-Friendliness Score in terms of urban bench placement, taking into account a specified budget and the cost of a single bench; both settings are entered into the application and can be updated at any time. The current approach employs a heuristic method through which to identify the longest street segments that fall short of the minimum street age-friendliness class in terms of the urban bench placement criteria; the existing benches are displayed in grey, and the suggested ones in brown (Figure 4).
  • The map’s appearance can be individually customised by changing the colour palette for street classes.

2.6. Comparison of Five Poznan Neighbourhoods

This stage consisted of generating reports about the actual states of different Poznan neighbourhoods for the purpose of comparative analysis. Data were analysed with regards to the following criteria:
  • Density (number of seniors/km2);
  • Number of street segments (sections depending on the street layouts, e.g., located between cross-sections; sections were downloaded from Open Street Map and can vary for given city or country);
  • Number of age-friendly streets;
  • Percentages of the following:
    Age-friendly (optimal) streets;
    Age-friendly (convenient) streets;
    Insufficiently age-friendly (moderate) streets;
    Insufficiently age-friendly (minimal) streets;
    Non-age-friendly streets.
  • Average distance (m) between benches in a given neighbourhood.
Furthermore, maps showing neighbourhoods and streets, coloured according to their given class, were analysed.
A heatmap based on senior population density, serving to visualise the demographic distribution across a city, was developed as an additional functionality of the software tool; it allows the user to identify areas where the elderly population is most concentrated, and, thus, might benefit from improved urban equipment. In this study, we used demographic data from GEOPOZ [55] (which are currently limited, with non-open access).
In the developed tool, there is a “Show heatmap overlay” option, which enables the user to set layer transparency, in order to compare bench distribution with the number of seniors inhabiting the analysed area.

2.7. Comparative Analysis of Selected Age-Friendly Polish and European Cities

The purpose of this phase was to generate reports and maps on the current states of different Polish (Poznań, Gdańsk, Gdynia, Kraków, and Wrocław) and European (Poznań, Amsterdam, Dublin, Stuttgart, and Vienna) cities from WHO’s Age-Friendly Cities Network [56] in order to facilitate their comparative analysis. The territorial scope of the research was limited to European cities due to their similarities in terms of urban structure and common physiognomic type.
Data were analysed and compared with regards to the following criteria:
  • Number of street segments;
  • Number of age-friendly streets;
  • Percentages of the following:
    Age-friendly (optimal) streets;
    Age-friendly (convenient) streets;
    Insufficiently age-friendly (moderate) streets;
    Insufficiently age-friendly (minimal) streets;
    Non-age-friendly streets.
  • Average distance (m) between benches in a given urban area.
Moreover, the spatial distribution of age-friendly streets, as shown in Figure 3, was analysed.

2.8. Simulation of Bench Distribution

The bench arrangement simulation process was implemented as an algorithm that includes the following steps:
  • Generating candidate locations. On each street, potential bench location points are generated at intervals adapted to the street length, with the number of candidates proportional to the street length.
  • Iteratively selecting the best locations. In each step, the algorithm selects a location that maximises the distance from existing benches, improving the areas with the greatest deficits.
  • Dynamically updating the distances for subsequent candidates and the street age-friendliness classifications after adding each bench.
  • Ending the simulation when there are no more bench placement candidates, or a user-specified budget is exhausted.

3. Results

The research findings led to the development of an interactive web application (https://age-friendly.streamlit.app/, (accessed on 8 September 2025)), which was further used to analyse street age-friendliness in terms of urban bench placement, based on the number and distribution of benches, as well as to simulate improvement scenarios.

3.1. Comparative Analysis of Five Poznan Neighbourhoods

For the analysis of Poznan neighbourhoods (Figure 5), we used data that were based on the following Open Street Map tags: living_street; pedestrian; footway.
Both the heatmap and reported data indicated that the following neighbourhoods (see Table 1) have substantial elderly populations (each above 6500).
According to the Percentage of Total Length, values for Age-friendly (optimal) streets range between 5.67% and 11.64%.
More than 50% of street segments for all analysed neighbourhoods (range: 53.79–72.78%; median: 60.73%; mean: 62.84%) are not age-friendly, according to the adopted street category thresholds (Section 2.2); the remaining street segments were classified mainly as convenient (range: 8.94–18.69%; median: 11.47%; mean: 13.62%) or minimal (having one bench) (range: 7.89–12.51%; median: 9.54%; mean: 10%).
Overall street age-friendliness in terms of urban bench placement varies between 12.64% (Grunwald Południe) and 25.17% (Chartowo). The median is 15.98%, and the mean is 18.07%. The discrepancy between these results may be related to the fact that Grunwald Południe is characterised by single-family houses and multi-family dwellings, whereas Chartowo is dominated by blocks of flats and services, which may be correlated with a higher number of rest areas.
The data show how many benches are needed in each neighbourhood to achieve each street category threshold. For instance, for the neighbourhood ranked highest (Chartowo), between 349 and 1845 additional benches would be required to achieve a minimal or optimal street age-friendliness (in terms of urban bench placement) level. To become age-friendly (convenient), an additional 629 benches would be required.
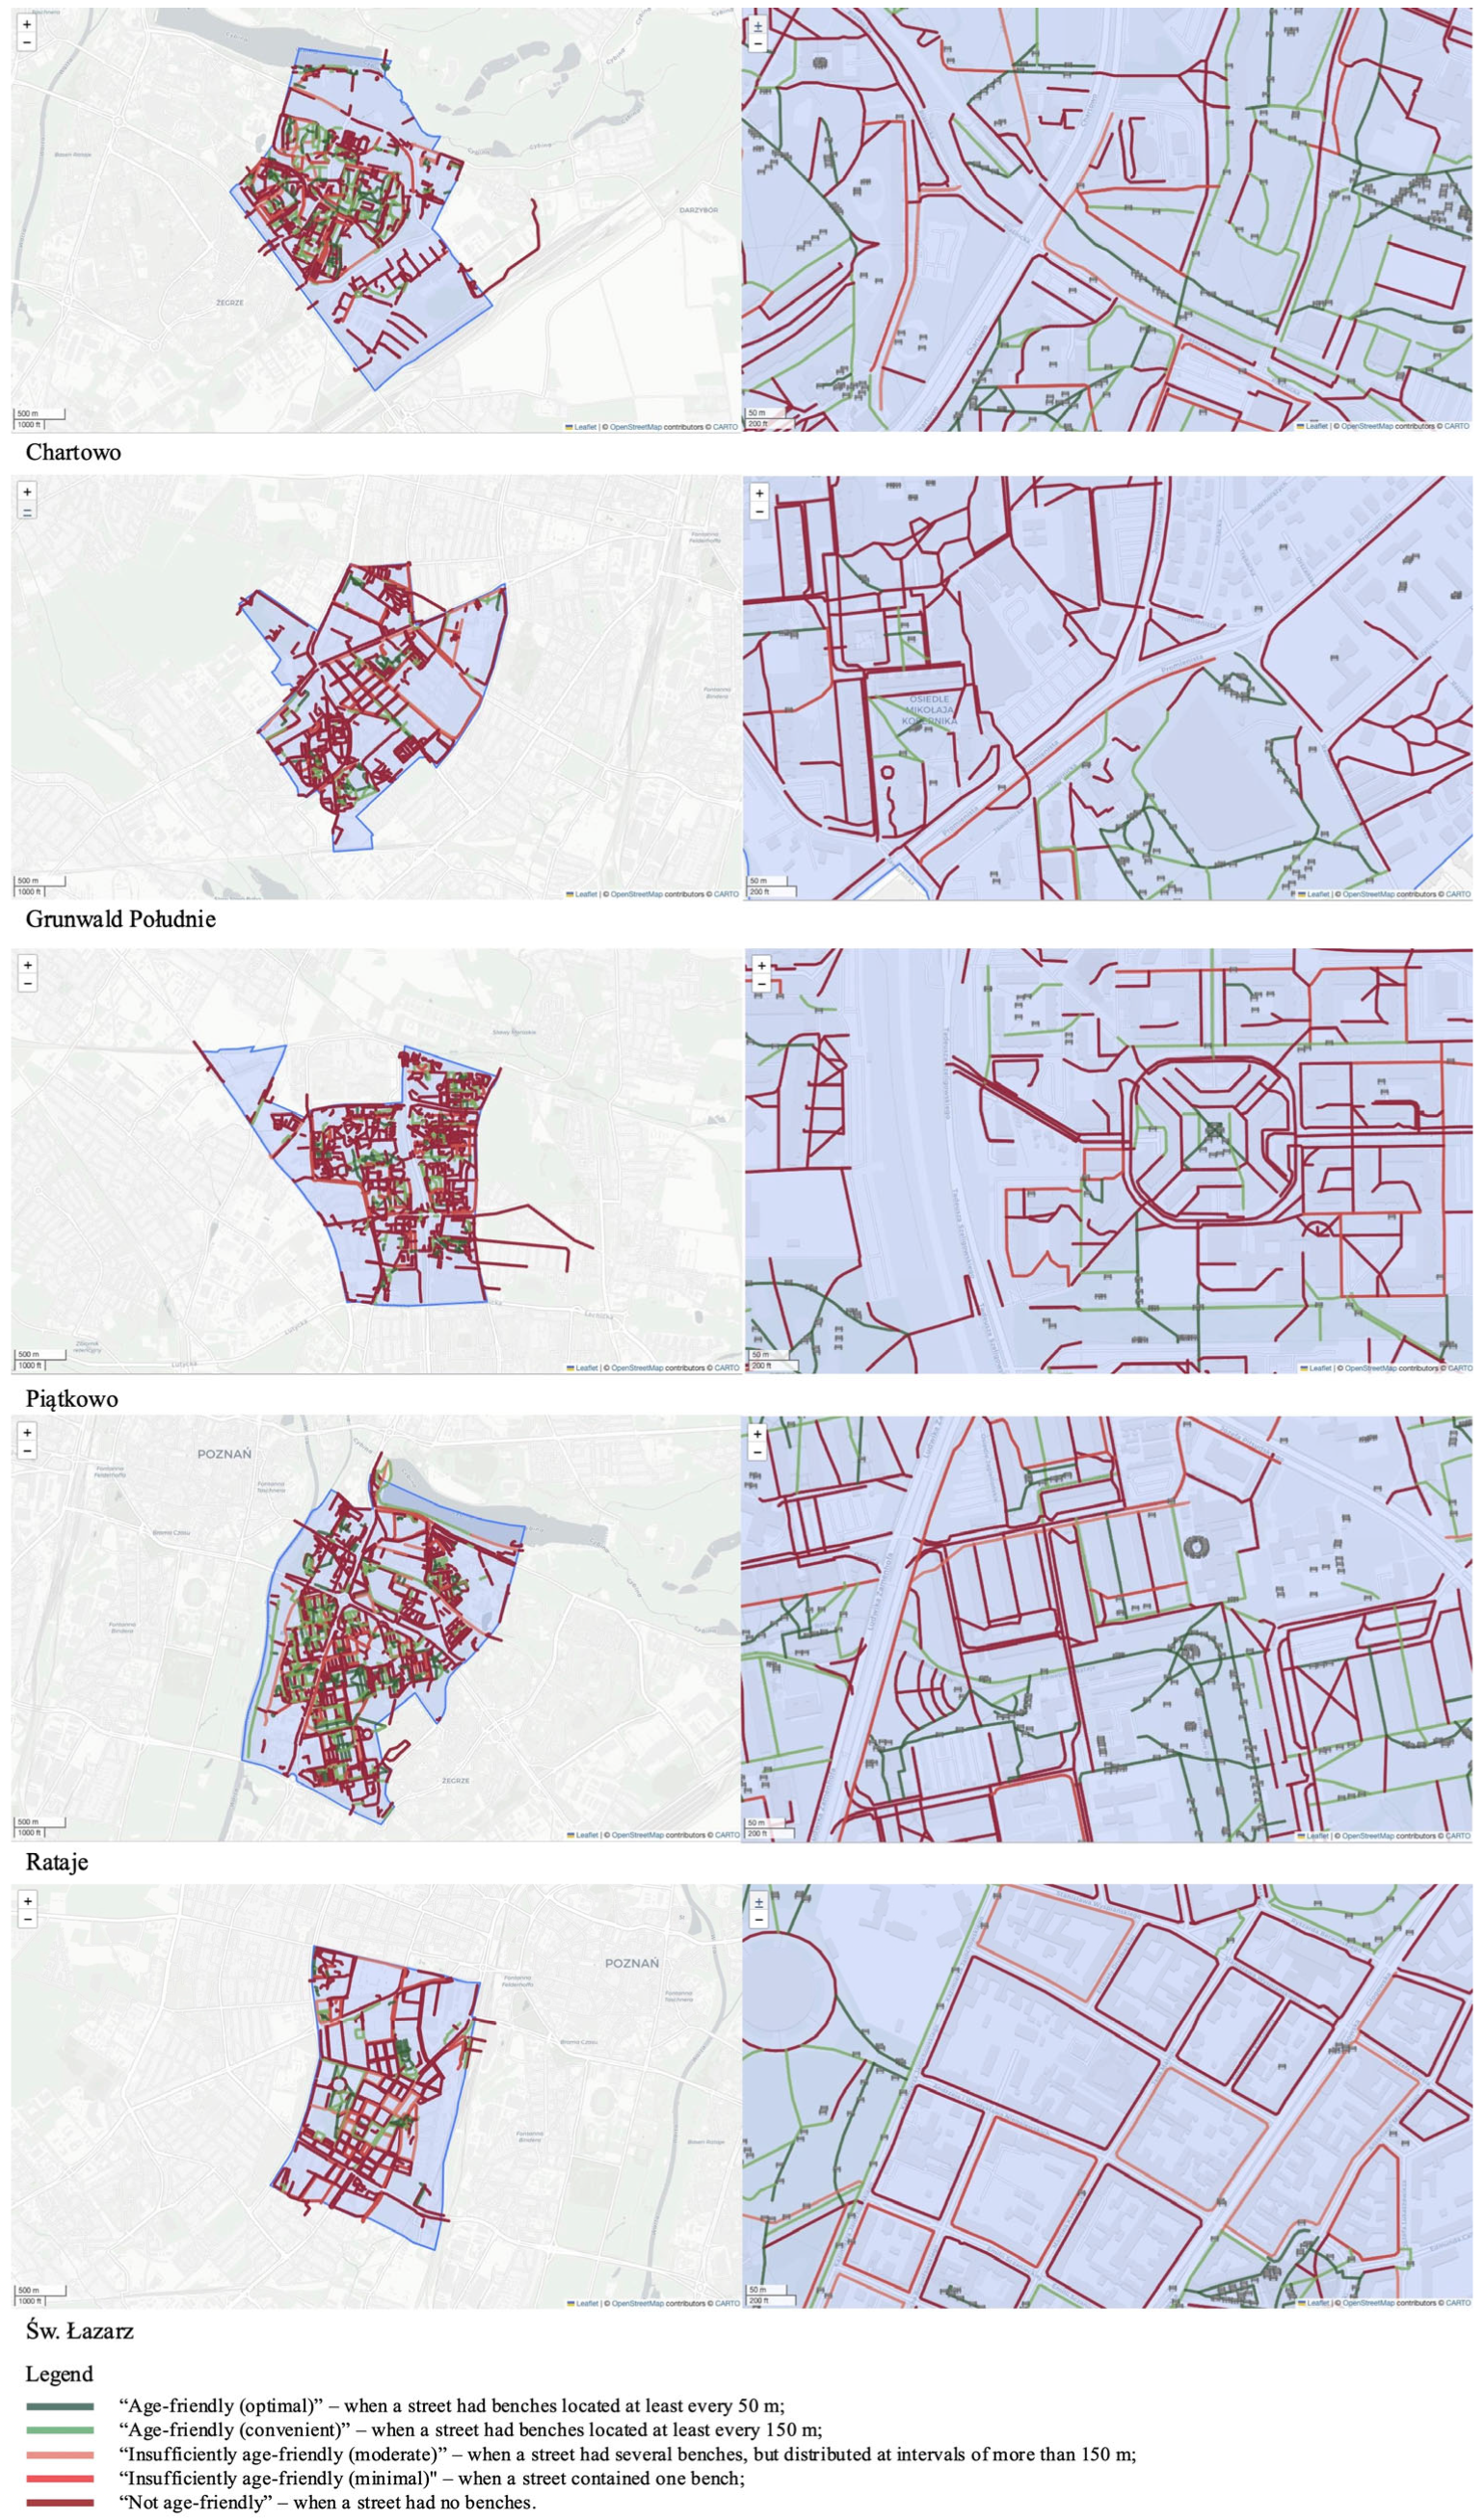
Another analysis covered the spatial distribution of benches in the analysed neighbourhoods (see Figure 6), through which it can be seen that the largest concentrations of benches occur in neighbourhoods with blocks of flats and multi-family buildings. The benches are located near recreational areas, parks, squares, promenades, and marketplaces. Benches are lacking in the vicinities of single-family housing estates on the outskirts of cities.
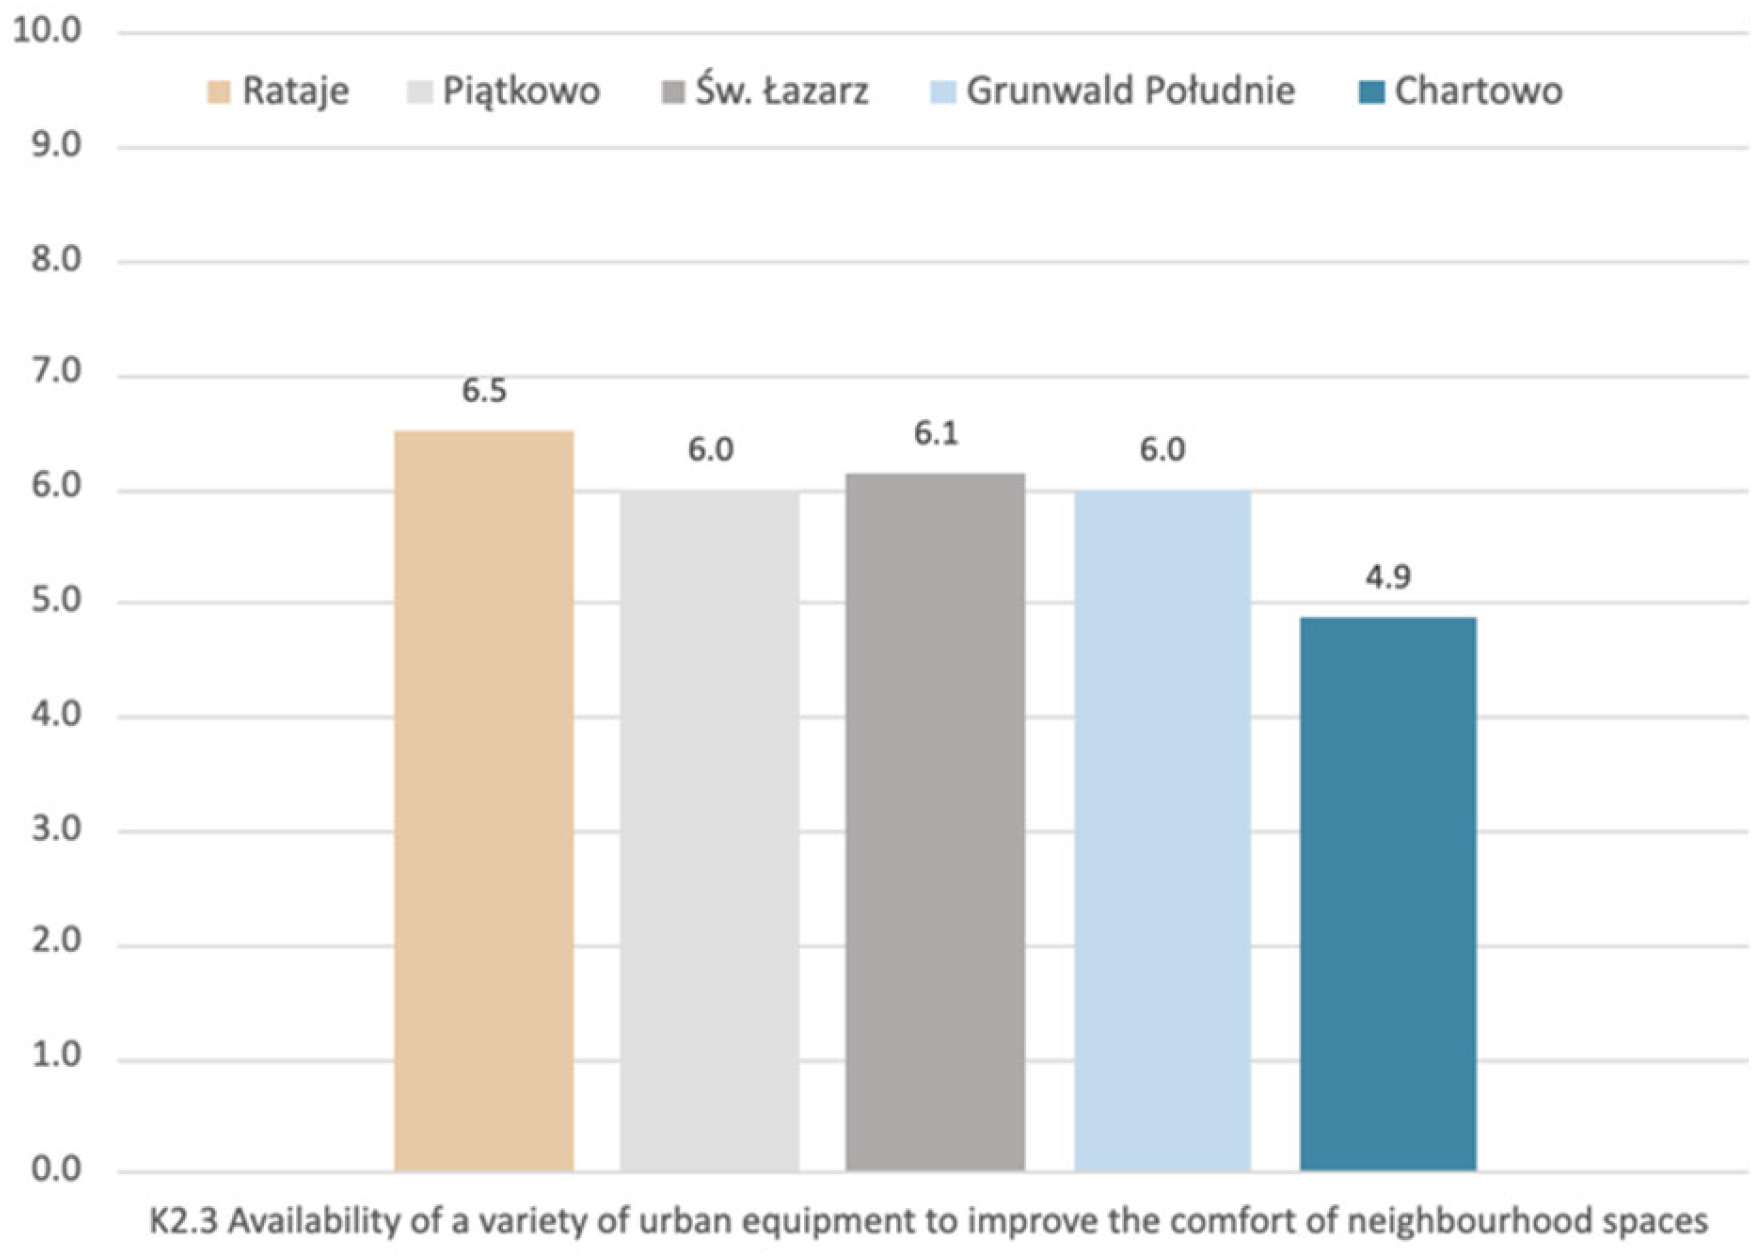
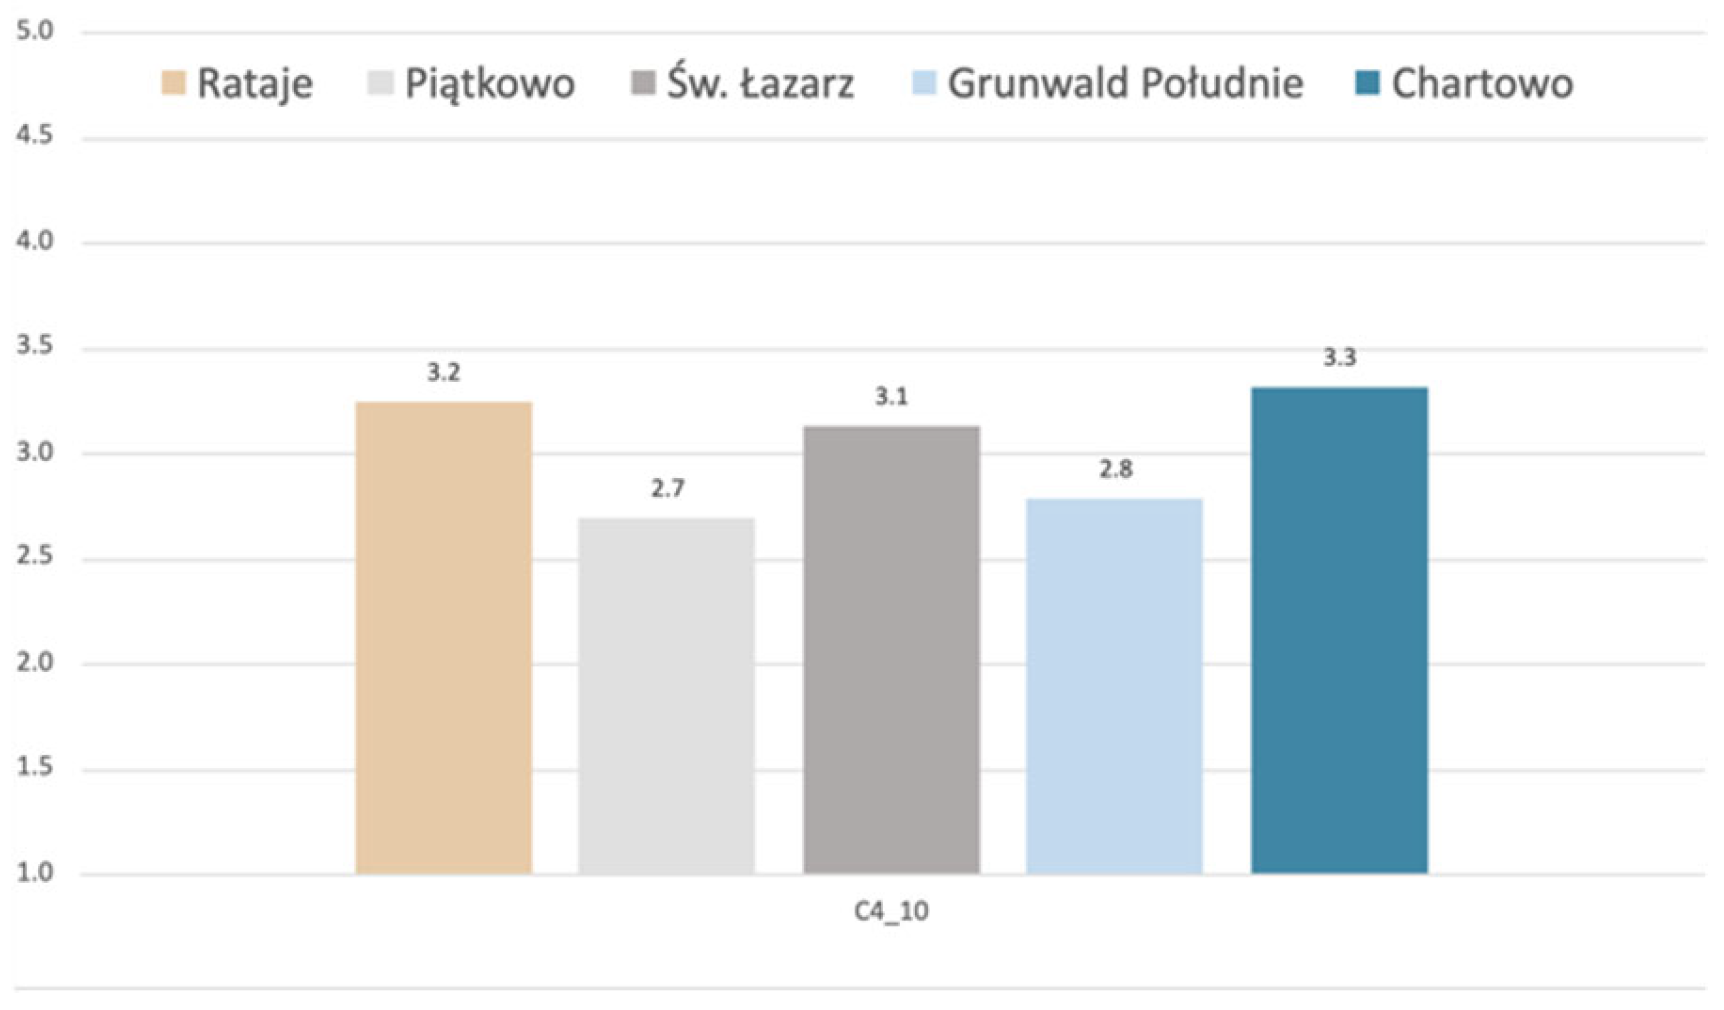
We compared the objective results, generated in the form of a report from the tool, with the analysis results from expert evaluations of urban equipment in the five neighbourhoods, as well as complementary subjective assessments from seniors on the availability of benches in the same neighbourhoods [16,48] (Figure 7 and Figure 8).
The expert and senior ratings were normalised and compared with the tool’s evaluation (see Table 2).
Calculating the Pearson correlation coefficient between subjective senior assessments and the calculated street age-friendliness in terms of the urban bench placement score, a very high correlation of r = 0.914 (p-value: 0.029) is found. The correlations between senior assessments and expert opinions (r = −0.340, p-value = 0.575) and between experts and the tool (r = −0.390, p-value = 0.515) are very low and cannot be considered statistically significant. Indeed, the seniors’ assessment was strictly related to the number of benches, whereas experts evaluated the more general category of urban equipment. The aforementioned results show that our tool strongly correlates with citizen opinions on benches.
Nevertheless, the normalised senior assessment values and the data-based street age-friendliness in terms of urban bench placement score differ in terms of ranges, with senior scores between 54 and 66%, and data-derived scores between 13 and 25%, which may suggest that seniors’ current expectations might be lower than the 50 m bench distance standards proposed by planners; therefore, in Section 3.4 we will analyse the potential effects of defining less stringent bench placement standards.

3.2. Comparative Analysis of Polish Cities from Age-Friendly Cities Network

The criteria for selecting Polish cities were based on similar area (200–300 km2) (Table 3), and it turns out that their total street length (2100–2800 km) is similar, as well, with the exception of smaller Gdynia (area: 135 km2, total street length: 786.45 km), which was the first Polish city to join the Age-Friendly Cities Network and, thus, is worth analysing.
For uniformity, the same tags: footway, pedestrian, living_street, were used for all cities. According to the Percentage of Total Length, values for age-friendly (optimal) streets range between 2.84% (Wrocław) and 5.08% (Poznań); the median is 4.01%, while mean is 3.93%. More than 79% of street segments for all analysed neighbourhoods (range: 79.72–91.52%; median: 83.38%; mean: 84.33%) are not age-friendly according to the adopted street category thresholds (Section 2.2). The remaining street segments were classified mainly as convenient (range: 2.91–7.06%; median: 4.87%; mean: 5.22%) or minimal (having one bench) (range: 2.07–6%; median: 4.48%; mean: 4.17%).
A further analysis was carried out on the spatial distribution of benches in the Polish cities analysed (Figure 9). Streets with benches that meet the criteria set in this study can be observed near blue-green areas.
According to the simulation for Polish cities, the number of benches that should be purchased to reach the optimal level on average exceeds the current number of benches by seven times in a given city. However, to reach the convenience level, this figure is about three times. The difference between the convenient and moderate (insufficiently age-friendly) levels is ~2800 benches on average, which is ~6% compared to the average optimal (~44,400). In order to reach the minimal level, the number of benches would have to be doubled on average compared to the current situation.
The above comparison included an analysis of the entire city of Poznan, whereas Section 3.1 focused on its selected neighbourhoods. In this context, it is interesting to note that the overall street age-friendliness in terms of the urban bench placement score for Poznan (9.73%) is much lower than for neighbourhoods inhabited by the largest number of elderly people (12.64–25.17%).

3.3. Comparative Analysis of European Cities from the Age-Friendly Cities Network

Criterion for selecting European cities was based on similar area (200–300 km2) (Table 4) or density (3000–5000 person/km2). Vienna was additionally interesting, as in 2024 it was chosen (again) as the best city to live in [57].
According to the Percentage of Total Length, values for age-friendly (optimal) streets range between 1.08% (Dublin) and 5.08% (Poznań) (the median is 2.92%, while mean is 2.93%). More than 80% of street segments for all analysed neighbourhoods (range: 80.82–90.72%; median: 83.2%; mean: 84.63%) are not age-friendly, according to the adopted street category thresholds (Section 2.2). The remaining street segments were classified mainly as convenient (range: 2.74–6.73%; median: 6.15%; mean: 5.22%) or minimal (having one bench) (range: 2.07–6%; median: 4.48%; mean: 4.2%). According to the simulation for European cities, the number of benches that should be added to reach the optimal level, on average, exceeds the current number of benches by eight times in a given city; however, to reach the convenience level, this value is about three times the current number of benches. The difference between the convenient and moderate (insufficiently age-friendly) levels is ~2900 benches on average, which is ~7% of the average optimal level (~40,300). In order to reach the minimal level, the number of benches would still have to be doubled on average, compared to the current situation (almost the same as for Polish cities).
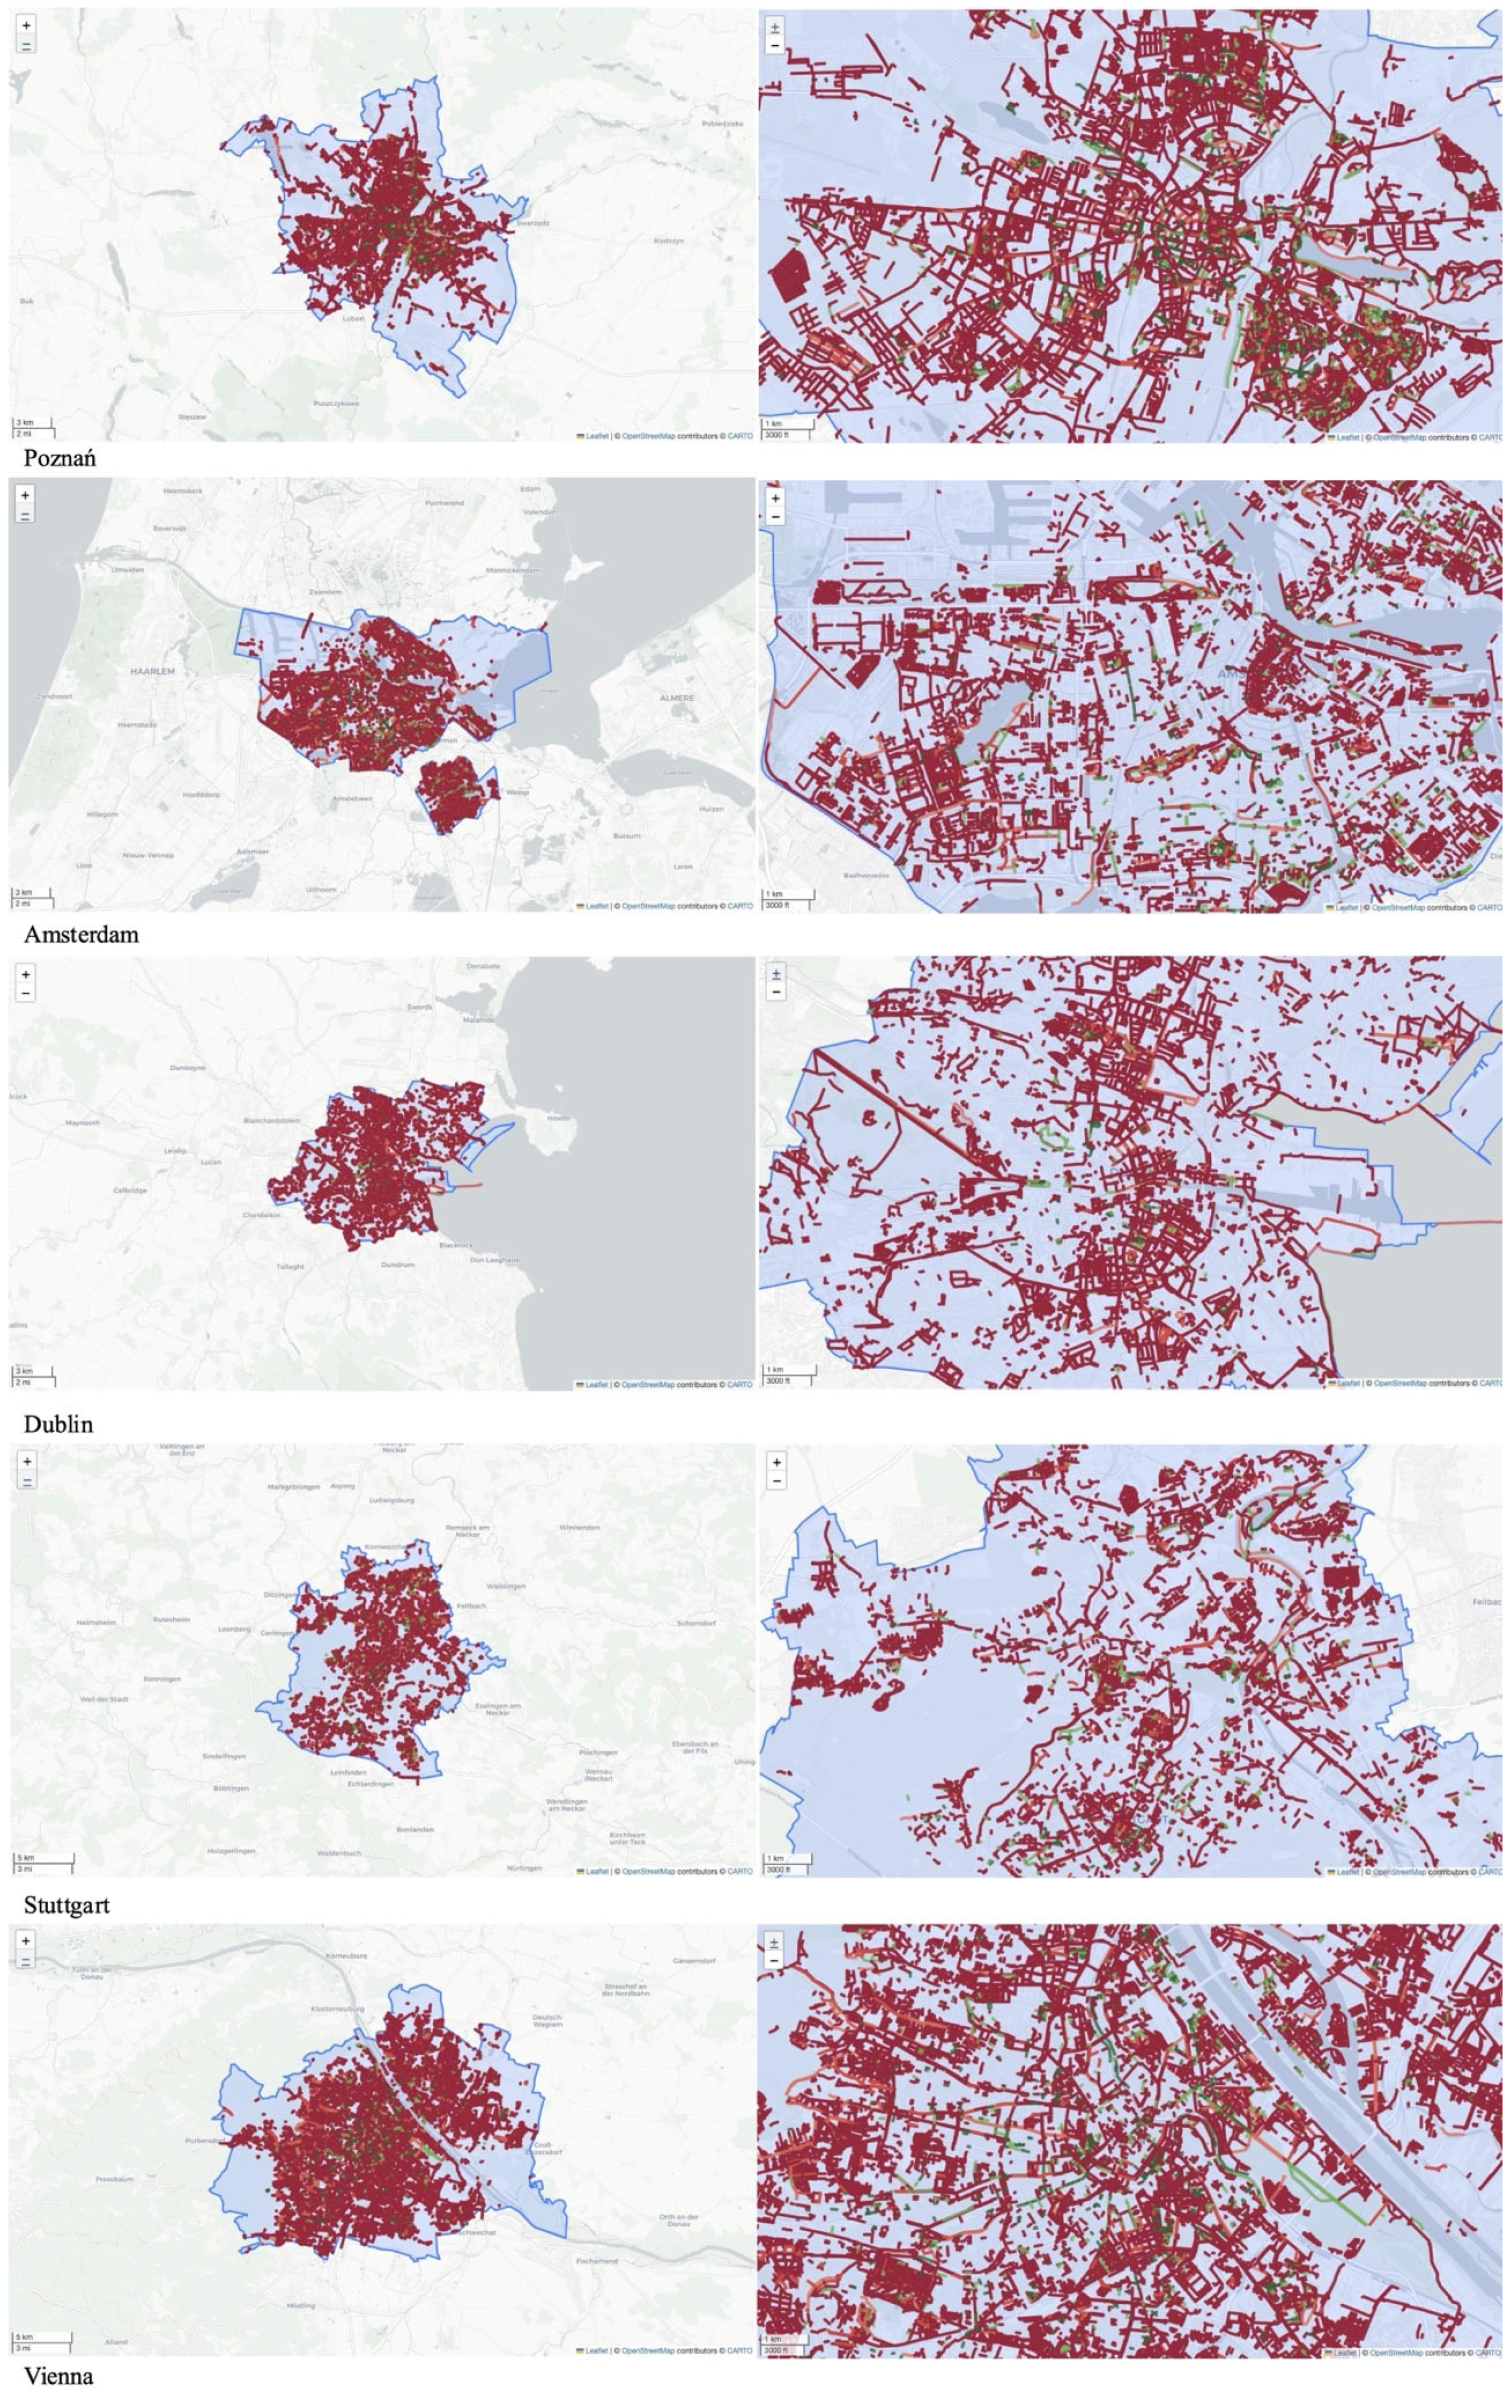
The spatial distribution of benches in the European cities analysed was the subject of further analysis (see Figure 10).
As presented in the maps showing the individual street segment evaluations in European cities, benches can also be found in the vicinities of recreational areas, parks, squares, and boulevards. In Amsterdam, the dark green colour, which indicates the optimal level, stands out, for example, in the Admiralengracht, a canal surrounded with tenement houses, along which benches are placed.
Due to the fact that the simulation process was based on a selection of candidate sites, ranked according to the greatest distance from the nearest bench, thereby allowing new benches to be placed where they are most lacking, municipalities will know which areas require more attention.

3.4. Proposed Standards for the Number and Distribution of Age-Friendly Benches’

As it follows from the data presented in the above subsections, for the 50 m distance standard, the assessments of Polish and European cities are relatively low.
We analysed how the overall friendliness index would change if the optimal distance between benches was 100 m, as suggested in Manual for Streets [58], instead of 50 m (Table 5).
According to the data, for Poznan neighbourhoods, the score would increase 32–43 percent; for Polish cities, 29–42 percent; and for European cities, 33–49 percent. For each administrative area, doubling the distance required between benches would reduce the number of benches needed to meet the optimal level by half.
The accessibility standard adopted (optimal bench interval) should be differentiated and related to the volume of trips made on foot (with increased pedestrian traffic, some benches may be occupied), terrain (in areas with a steep slopes, seats should be placed more often), proximity to public facilities (e.g., hospitals, libraries, cemeteries), and the lengths of journeys to the destination points. The standard should not depend on the distance from the city centre, but rather be linked to the locations of housing facilities occupied by senior citizens; after all, older people living on a city’s outskirts have the same need to reach important destinations, and, as they age, eye diseases occur, making it impossible to travel by car, for example. The city of the future, which envisages seniors’ self-reliance and independence from family members, should include sufficient seating along routes to destinations [12,38,53,59]; for the most demanding routes (footpath to key destinations from the senior residential areas, close to public facilities and greenery, heavy foot traffic), the suggested distance between seats should be 50 m, while, for less frequently used streets, this distance should be 100 m. The analysis showed that the difference in the numbers of extra urban benches needed to achieve the convenient and moderate street age-friendliness classes are low compared to the number needed for the optimal class; therefore, it is suggested that street-accessible urban benches should be placed every 150 m, and no further, for the senior pedestrians’ comfort and safety. In situations where there are alternative access routes from housing to a particular point of interest—for instance, three routes from point A to point B—and one of them meets the standard regarding the number of benches, the other two routes may have a lower standard; that is, in practice, there should exist at least one route between a senior’s home and a crucial amenity that meets the standard. Any analysis of the number and location of urban benches should be strictly linked with an analysis of important destination points and residential areas for the elderly, which is the subject of our ongoing research.

4. Discussion

According to the urban design theories advocated by Gehl and Alexander, the success of an urban space depends on prioritising public life. Cities must ensure adequate conditions for basic activities, such as standing, walking, and sitting, and these should be supported by well-designed human-scale elements (seats, lamps, planters, art pieces, etc.). Although previous studies indicated different elements related to the walkability and age-friendliness of streets, e.g., public toilets, benches, lighting, and slope, we focused extensively on benches in this research. The literature identifies seating as a key element, and the introduction of benches into urban spaces is relatively low-cost, as opposed to installing lamps, reducing the slope of the pavement, or widening the pavement, which may require the reconstruction of entire roads. Therefore, even though such barriers can be identified in the space, it will not always be possible to make improvements; benches, on the other hand, can be introduced in places or in ways that do not require reconstruction.
The aim of this study was to develop and validate a new tool for measuring distances between street-accessible urban benches, evaluating streets based on predefined classes, and providing simulations for new urban bench locations along streets (based on a given budget and the price of single bench) to support evidence-based decision making for more age-friendly and sustainable cities. Since the web-based tool was developed with the use of Open Street Map data, it can be used universally, in any city or smaller urban administrative area, such as a neighbourhood or a district. In order to validate the tool and demonstrate its universality, various cities in Poland and Europe were evaluated, and the scales of the evaluated urban areas were differentiated to examine both the entire city and particular neighbourhoods.
The Street Age-Friendliness Scores (in terms of urban bench placement) in Poznan neighbourhoods inhabited by the largest numbers of seniors, such as Chartowo (25.17%), Grunwald Południe (12.64%), Piątkowo (13.28%), Rataje (23.30%), and Św. Łazarz (15.98%), demonstrate frequently overlooked disparities in urban infrastructure. The results indicate that, even within a single urban area, the distribution of amenities such as benches can be uneven. Benches are present near housing estates with blocks of flats and blue-green infrastructure, such as parks, but they are missing along pedestrian pathways; similar conclusions can be drawn from the analysis of Polish and European cities. An interesting answer to the problem of the lack of benches on pathways, where there are numerous entrances to buildings, are benches placed right next to the tenement house walls, as is the observed case near the Admiralengracht in Amsterdam; this is in line with one of Christopher Alexander’s patterns, named Front Door Bench [14].
The street age-friendliness ratings for selected European cities (median: 7%, mean: 6.74%) and Polish cities (median: 7.8%, mean: 7.6%) demonstrated similar results, especially when compared with the Poznań neighbourhood results (median: 15.98%, mean: 18.07%), which received higher ratings; however, of the urban areas analysed, the one that performed best—Chartowo neighbourhood—received a rating of only 25.17%.
Since the most exorbitant bench spacing standards resulted in very low indicators of street friendliness for seniors, we considered how the indicator would change when the distance was doubled, which was considered the lower threshold of good practices; the number of benches needed was halved, which would certainly make it easier to achieve satisfying results. A significant difference in the assessment can also be seen in the analysis of neighbourhoods, compared to the analysis of entire cities; however, it should be borne in mind that the data on benches for neighbourhoods have been checked and supplemented, which may be the direct reason.
The analysis showed that the senior and data-based assessments did not align perfectly, possibly due to the fact that our score did not take senior population densities, or favoured routes, into account.
In studying the selected research problem, the authors of this study had to face certain limitations. First, the accuracy of Open Street Map (OSM) data and self-reported data may be a cause for concern, as, in areas where community mapping is less active, data may be incomplete or outdated, which could result in biased analyses. In response to this problem, our developed application allows for the manual input of bench location data; however, the need to complete the data manually can significantly slow down the process and make the tool less effective. Furthermore, an exclusive emphasis on the positioning of benches may result in the neglect of other crucial age-friendly urban planning aspects, such as the creation of secure walking routes. In addition, the tool does not take into account strategic locations, such as building entrances, ground-level windows, stairs, or other parts of the building that cannot be obscured when creating scenarios.
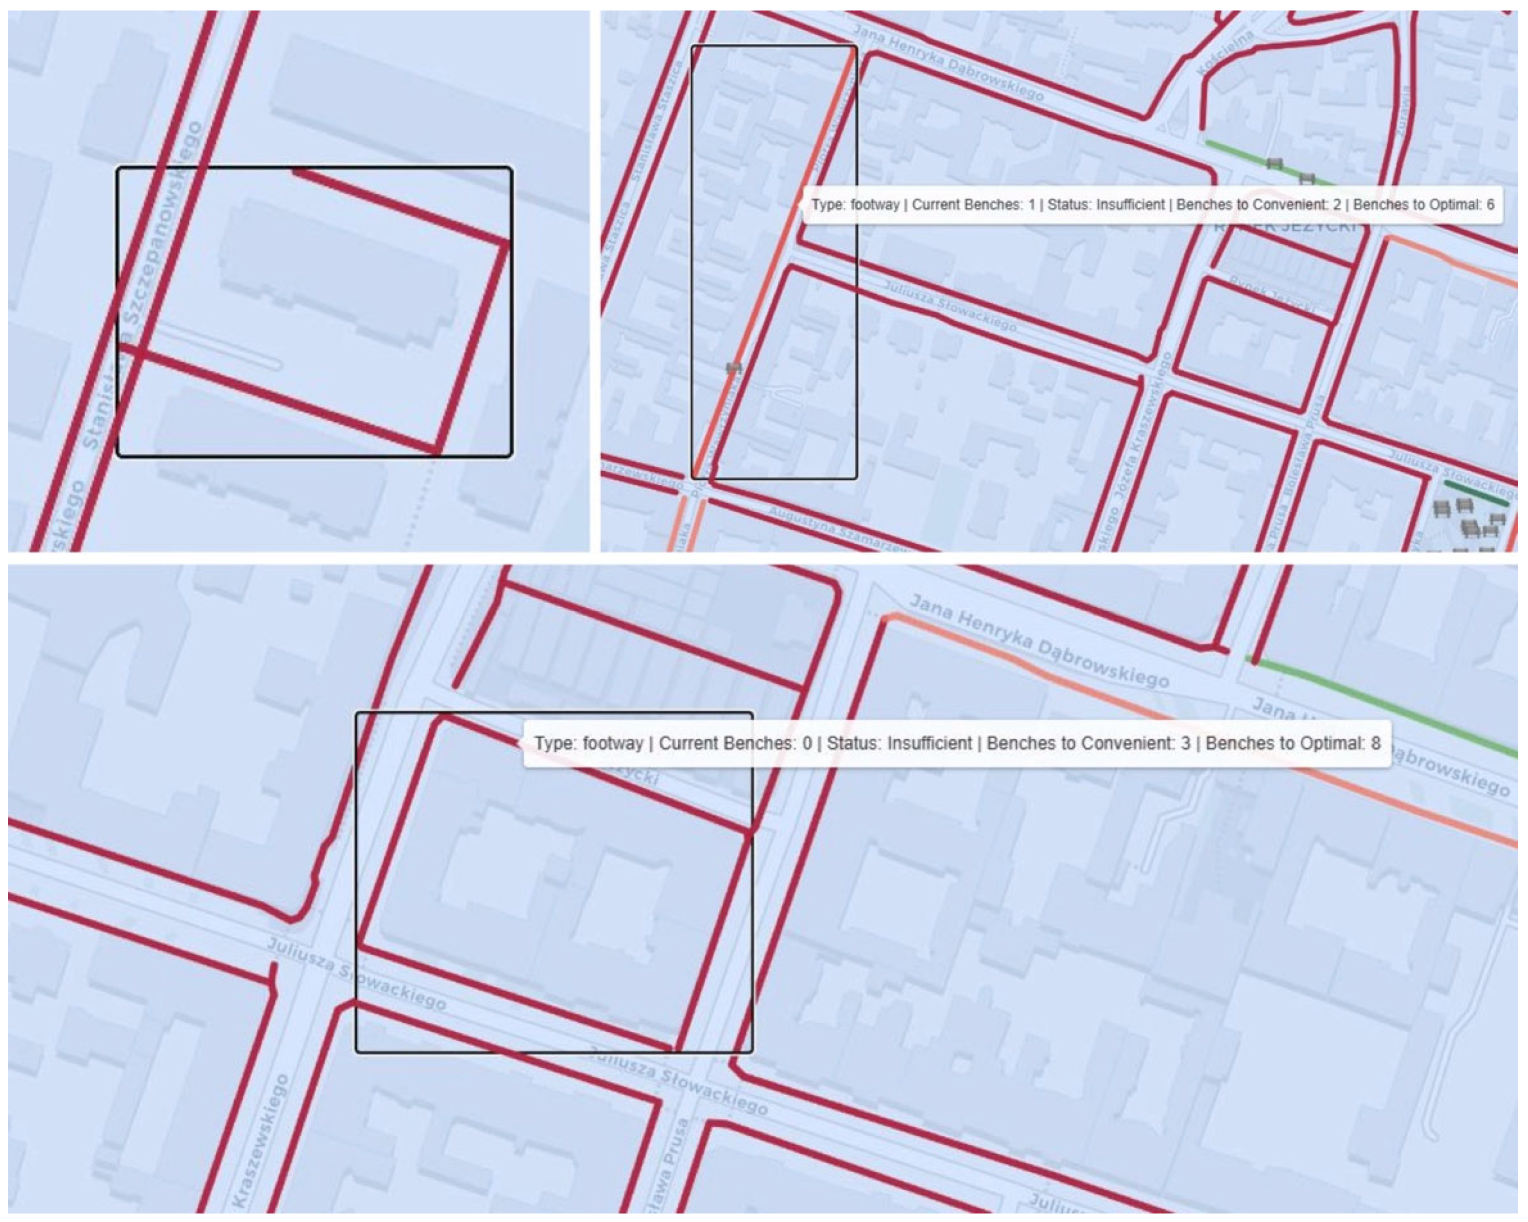
Another limitation of the proposed tool is the fact that the analysed street segments are taken directly from OSM data, which do not always correspond perfectly with entire walkways; at the beginning, an attempt was made to group segments into entire walkways according to the administrative division, but, in many cases, this was impossible. Our main obstacles resulted from incompleteness in the data (the segments were not assigned names by which to group them) and unusual section shapes (where segments of different streets were already grouped into one separate section). As can be observed in Figure 11, individual “street segments” are sections surrounded by black frames, where a user can also find information about their type and basic statistics. The appearance of these segments varies from country to country, or even city to city, which makes it difficult to formulate a universal definition. Nevertheless, these discrepancies between OSM segments and actual walkways have negligible impacts on the estimated street age-friendliness (in terms of urban bench placement) scores of entire districts and cities.
It is also worth mentioning that, in the application’s initial development phase, the “footway” street tag was mainly used for analysis, which worked well for data from Polish cities; due to differences in how different OSM users manually tag streets, however, there is no one-size-fits-all option that works in every country or city. In order to reliably analyse cities from other European countries, it was necessary to expand the tag list using more categories (e.g., “pedestrian”, “living_street”, “residential”) because, in other cities, such as Amsterdam, the data were marked differently than in Poland. The tool has therefore been extended with additional functionality, i.e., the option to select road/street types in the “Advanced Road Options” section of the side panel, which allows the user to adapt the analysis to the local realities of OSM.
One of our tasks in this study was to obtain information on the average distance between benches in the selected area/location, which would allow for setting new distance standards; for this purpose, an analysis of the existing bench arrangement on the map was carried out. On the basis of these data, the average distance to the nearest bench was calculated, i.e., for each bench, the nearest adjacent and measured distance was identified, and then the average distance for the entire bench network was computed; however, some locations had significant concentrations of benches, especially in parks and other high-traffic areas, so the average distance in a particular area may be even smaller than the minimum distance guidelines. To let urban planners decide whether such park-related bench clusters should be taken into account during region assessments, it would be necessary to introduce clustering and outlier detection algorithms in future versions of the tool, which would allow users to identify and potentially exclude bench clusters from calculations.
Simulation is another challenge in the context of measuring average distances; it aims to place new benches in areas located far from existing clusters—for example, at street edges or in less developed areas—a process based on the selection of candidate bench locations, ranked according to the greatest distance from the nearest bench, thus allowing new benches to be placed where they are missing. As a result of this process, each new bench is located at a considerable distance from the others, often exceeding the previous average distance to the nearest bench. On the scale of the entire network, due to the long distances to new points, the average distance to the nearest bench may paradoxically increase; therefore, it is the “Street Age-Friendliness (in terms of urban bench placement) Score” indicator that should be used to assess the simulation’s effectiveness, as it measures the ratio of existing benches to the recommended number, taking into account the pavement length, so the overall result, expressed as a percentage, should remain the same or increase with the addition of new benches, but it should never decrease.
Despite its limitations, the proposed tool serves to bridge the gap between urban planning and a city’s demographic needs, with a particular focus on the requirements of the elderly. Through this research, we demonstrate how technology and data can be employed to support stakeholders, such as urban planners and municipalities, in making more informed decisions and, thus, enhance the quality of life for elderly populations in urban settings. We recommend that planners first check whether there are streets, in the urban area of their interest, that are marked as age-friendly in terms of street-accessible urban bench placement; if, according to the tool’s assessment, the area is not age-friendly regarding access to urban benches, and planners have some financial resources to invest, we suggest they use the simulation function. By adding information about the available budget and the cost of a single bench, planners can glean specific information about how many benches, and in which locations, they should add, the data for which will be presented both on a map and in tabular form.
The tool’s utility is not limited to the aforementioned applications; to avoid neglecting other significant spatial factors, it might include other street parameters, e.g.,
  • Status (city centre street, periphery, recreational area, etc.) related to the volume of trips made on foot;
  • Terrain (flat or sloped);
  • Presence of greenery on the street (flowers, flowerbeds, nearby park, etc.);
  • Other amenities (public toilet, shelter, lighting, drinking fountain, etc.);
  • Presence of an important function of a 15 min city within 700 m.
In future research, the data accuracy might be enhanced by incorporating AI-driven validation and classification methods. For example, with the use of AI, it would be possible to group, e.g., households in the vicinity of which there are accessible paths with benches; it would also be possible to detect outliers (indicate places on the map that are unusual in some way). An important functional extension of the tool will be the ability to determine whether there is at least one path from a given house to a given function (doctor, hairdresser, etc.) that meets the standard, which would allow for a more detailed analysis within a smaller area. Further advancements will include the development and implementation of more sophisticated heuristics for bench placement optimisation in the simulation module, with a special focus on incorporating demographic data with which to ensure that the needs of specific population segments are met.
In our study, we use the term “bench”; this is a simplification, which results both from the popularity of this form of seating in urban spaces, both in the nomenclature and in the designations within available databases. As the research results show, the available number of benches is significantly different from the optimal number; at the same time, one should be aware that purchasing the optimal number of benches is a huge financial, organisational, and planning challenge. Sometimes, adding a bench on a pedestrian route will limit the clear sidewalk width, and other times, it will block the entrance to a facility; thus, due to existing urban infrastructure, adding benches according to the simulation will not be possible everywhere.
However, the tool highlights the enormity of the problem, which concerns the lack of seats on the movement routes of the elderly. As previous research has shown, a lower frequency of social interaction affects health and is linked to the conditions on travel routes [60,61,62]. Previous researchers have signalled the need to add both seats and toilets along walking paths [63,64,65].
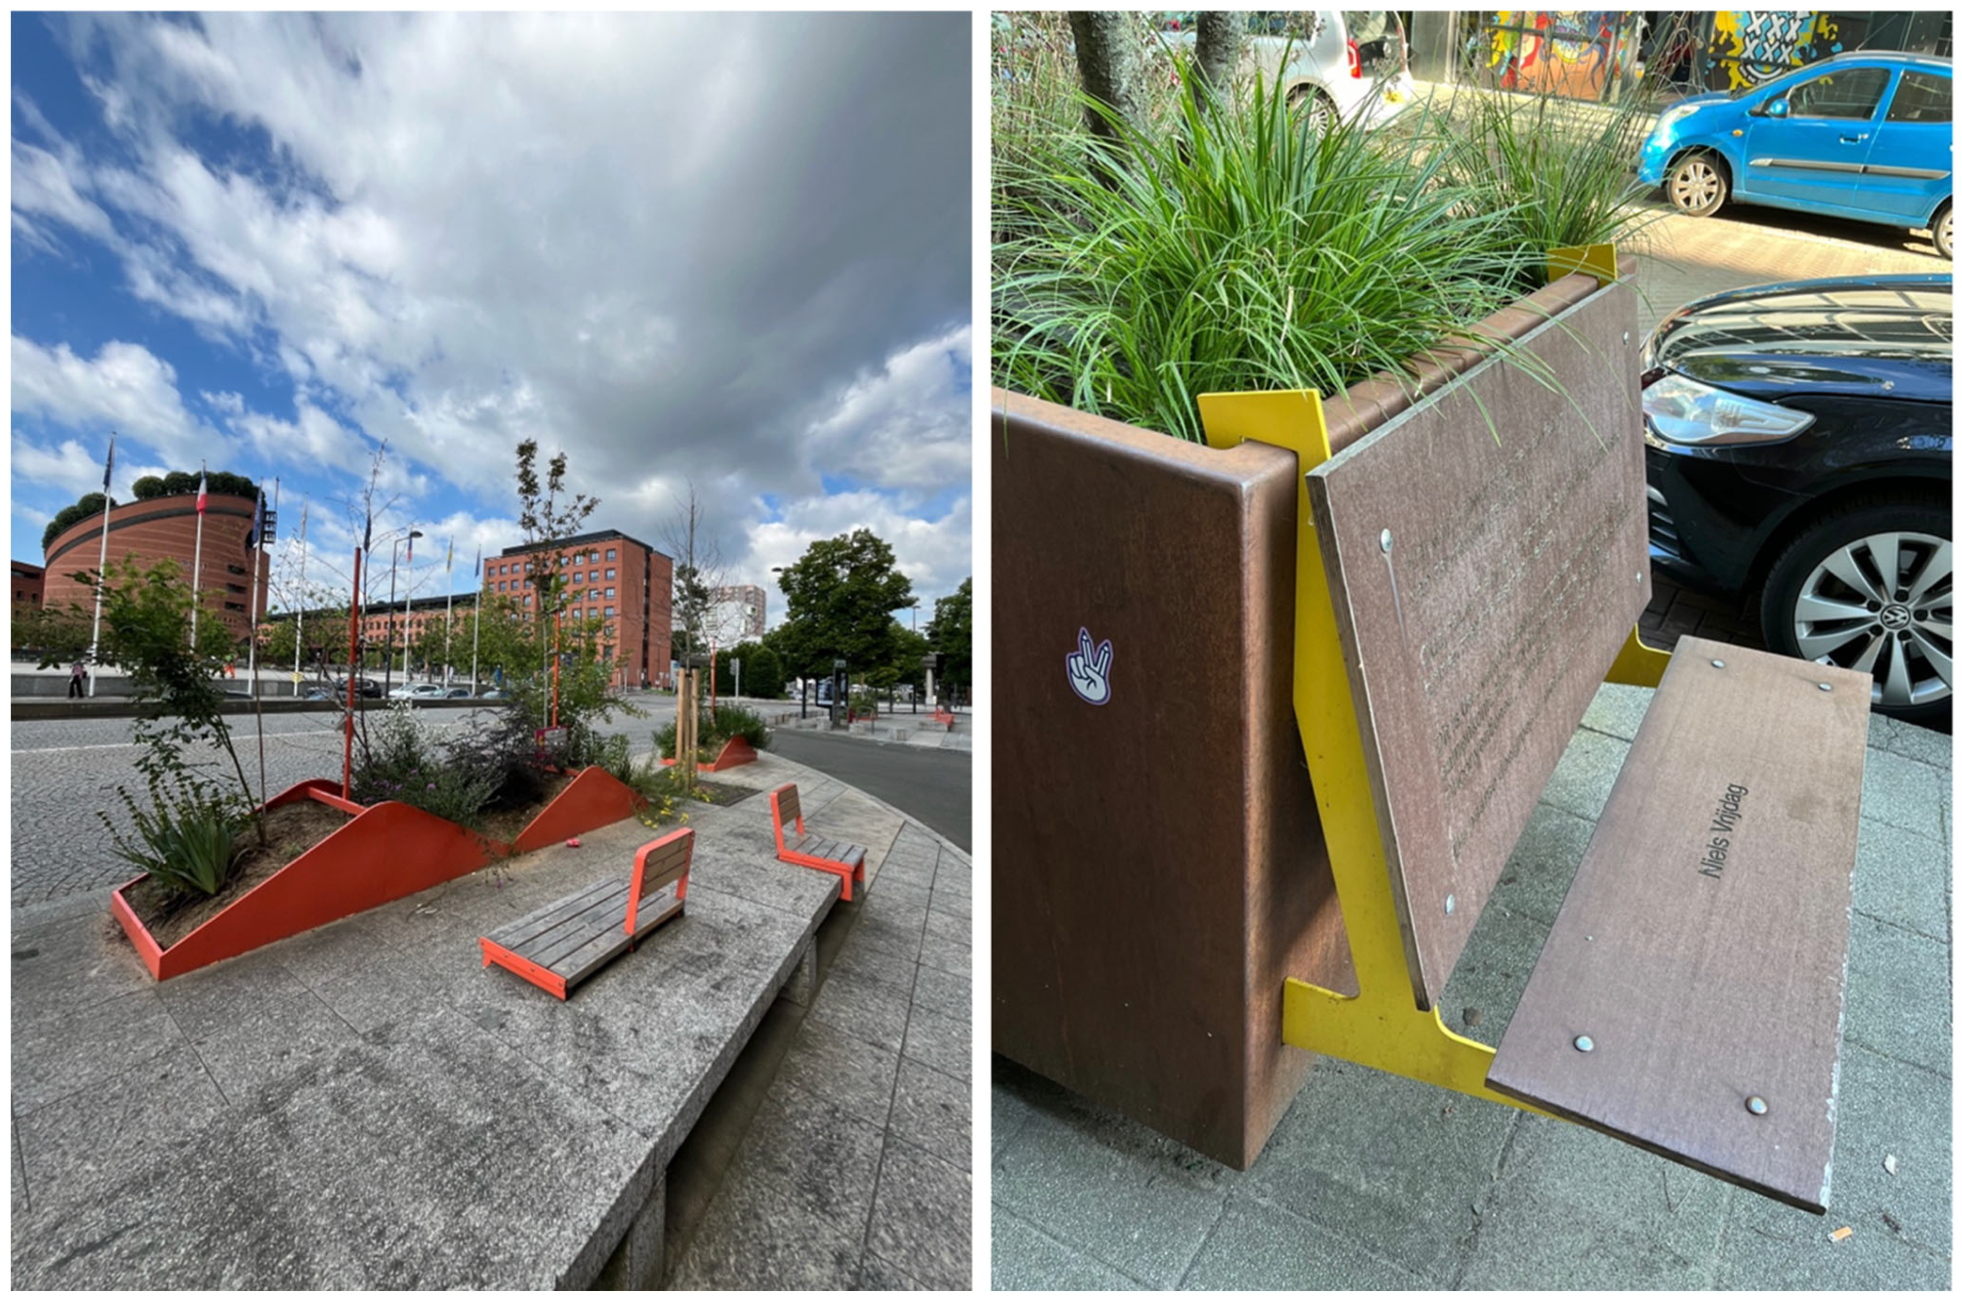
Since we focused on benches in this study, we should point out that the bench is used as the symbol for a seat; therefore, the suggested number of benches is actually the suggested number of any seats adapted for seniors. Such seats can be benches, but half-benches, park chairs, modular seating, platforms, and seating walls are also acceptable. Existing seating walls can even be adapted by installing a special overlay with a seat and backrest. The solution does not have to be very expensive, or organisationally difficult, because it can be an element of tactical urbanism, in which residents, as part of short-term interventions, improve the space themselves; an example of such an intervention is the improvement of seated spaces through the addition of wooden overlays with backrests to the existing infrastructure in Evry-Courcouronnes; another solution may be an edge-mounted bench, designed to fit onto a planter (Figure 12).
Half-benches, on the other hand, occupy less space and are sometimes even more helpful, because a senior may need only temporary support, and sitting on a low bench takes more time and effort.
Finally, collaborations with local governments for real-time data sharing and feedback mechanisms are envisaged, with the aim of ensuring a dynamic and constantly improving tool for urban planners. Further research into the socio-economic factors influencing the distribution of urban amenities will also be crucial in developing a more holistic approach to city planning.

5. Conclusions

In this paper, we have attempted to address the current gaps in the available urban analysis tools by developing a novel interactive tool for assessing and improving street age-friendliness in terms of urban bench placement. Using Open Street Map data, demographic information, and a unique bench-to-street ratio metric, we provided a quantifiable measure of a city’s infrastructure in terms of urban bench accessibility for older people. We add value to urban planning through this study by introducing a new tool for street analysis, demonstrating its use, and providing new data on different cities and their fragments. The proposed tool is a step towards empowering city administrations and planners to create more age-friendly urban environments, particularly catering to the needs of the elderly population. Our study postulates the creation of complete and up-to-date databases about cities, which would facilitate urban analyses and simulations.
Research shows that, for seniors, seating arrangements should be evenly distributed, rather than cumulative; analysis results indicate that there is a serious issue regarding missing seating along pavements. In this context, municipalities are not limited to purchasing new benches, but may also involve different stakeholders and strategies, such as tactical urbanism supported by local communities; half-benches can be bought instead of typical benches, while existing urban infrastructure can be temporarily adapted with the use of overlays, so as to increase the mobility of the elderly and improve their quality of life.
Future work will involve taking housing and elderly population density into account, as well as the number of alternative paths towards an area’s age-friendliness in terms of the placement of street-accessible urban benches score. In its next stage, our tool will also be optimised to include all street types, but exclude their redundancy. The aforementioned improvements to the current tool will enable deeper analyses and allow users to correlate findings with the unique demographic and spatial characteristics of a given urban area; these improvements will enable urban planners and stakeholders to not only obtain general knowledge about the current state (number and distribution) of benches in the analysed urban areas, but also adjust and optimise bench placement in accordance with actual, evidence-based needs.

Author Contributions

Conceptualisation: A.P.-W., A.G., P.M., D.R., M.S., D.B. and J.S.; methodology: A.P.-W., A.G., D.B. and J.S.; software: P.M., D.R., M.S. and D.B.; validation: A.P.-W. and D.B.; formal analysis: A.P.-W., P.M., D.R., M.S. and D.B.; investigation: A.P.-W., P.M., D.R., M.S. and D.B.; resources: A.P.-W., A.G., P.M., D.R., M.S. and D.B.; data curation: A.P.-W., P.M., D.R. and M.S.; writing—original draft: A.P.-W., P.M., D.R., M.S. and D.B.; writing—review and editing: A.P.-W., A.G., D.B. and J.S.; visualisation: A.P.-W., P.M., D.R., M.S. and D.B.; supervision: A.P.-W., A.G., D.B. and J.S.; project administration: A.P.-W. and D.B.; funding acquisition: A.G. All authors have read and agreed to the published version of the manuscript.

Funding

This work was supported by the Ministry of Science and Higher Education (Poland) [grant numbers 112/SBAD/0114; 0311/SBAD/0752].

Institutional Review Board Statement

Not applicable.

Informed Consent Statement

Not applicable.

Data Availability Statement

The original contributions presented in this study are included in the article and an interactive web application. Further inquiries can be directed to the corresponding author.

Acknowledgments

The authors thank those whose work contributed to the expansion of the data set: the students who inventoried bench locations, the seniors who provided subjective assessments of the benches’ presence, and the experts who provided their specialised assessments.

Conflicts of Interest

The authors declare no conflicts of interest.

References

  1. United Nations, Department of Economic and Social Affairs. World Population Prospects 2022: Summary of Results. 2022. Available online: https://www.un.org/development/desa/pd/content/World-Population-Prospects-2022 (accessed on 30 October 2022).
  2. World Economic Forum. Global Risks Report 2025, 20th ed. 2025. Available online: https://www.weforum.org/publications/global-risks-report-2025/ (accessed on 8 April 2025).
  3. Lee, J.Y.; Kim, H. Projection of future temperature-related mortality due to climate and demographic changes. Environ. Int. 2016, 94, 489–494. [Google Scholar] [CrossRef] [PubMed]
  4. Barnett, D.W.; Barnett, A.; Nathan, A.; Van Cauwenberg, J.; Cerin, E.; Council on Environment and Physical Activity (CEPA)—Older Adults working group. Built environmental correlates of older adults’ total physical activity and walking: A systematic review and meta-analysis. Int. J. Behav. Nutr. Phys. Act. 2017, 14, 103. [Google Scholar] [CrossRef] [PubMed]
  5. Beard, J.R.; Petitot, C. Ageing and Urbanization: Can Cities be Designed to Foster Active Ageing? Public Health Rev. 2010, 32, 427–450. [Google Scholar] [CrossRef]
  6. European Union. COMMUNICATION FROM THE COMMISSION TO THE EUROPEAN PARLIAMENT, THE COUNCIL, THE EUROPEAN ECONOMIC AND SOCIAL COMMITTEE AND THE COMMITTEE OF THE REGIONS The New EU Urban Mobility Framework, COM/2021/811 final. Publications Office of the EU. Available online: https://op.europa.eu/en/publication-detail/-/publication/ad816b47-8451-11ec-8c40-01aa75ed71a1 (accessed on 29 October 2024).
  7. About the Initiative—European Union. Available online: https://new-european-bauhaus.europa.eu/about/about-initiative_en (accessed on 29 October 2024).
  8. Moreno, C. 15-Minutowe Miasto. Jak Uratować Nasz Czas i Planetę [The 15-Minute City: A Solution to Saving Our Time and Our Planet]; Wysoki Zamek: Kraków, Poland, 2024. [Google Scholar]
  9. Moreno, C.; Allam, Z.; Chabaud, D.; Gall, C.; Pratlong, F. Introducing the “15-minute city”: Sustainability, resilience and place identity in future post-pandemic cities. Smart Cities 2021, 4, 93–111. [Google Scholar] [CrossRef]
  10. Han, J.H.; Kim, J.-H. Variations in Ageing in Home and Ageing in Neighbourhood. Aust. Geogr. 2017, 48, 255–272. [Google Scholar] [CrossRef]
  11. Wierzbicka, M. Analiza parametrów czasowo-przestrzennych chodu u słuchaczy Uniwersytetu Trzeciego Wieku. Zesz. Nauk. Coll. Witelona 2022, 4, 59–71. [Google Scholar] [CrossRef]
  12. Ottoni, C.; Sims-Gould, J.; Winters, M.; Heijnen, M.; McKay, H. “Benches become like porches”: Built and social environment influences on older adults’ experiences of mobility and well-being. Soc. Sci. Med. 2016, 169, 33–41. [Google Scholar] [CrossRef]
  13. Gehl, J. Cities for People; Island Press: Washington, DC, USA, 2013. [Google Scholar]
  14. Alexander, C.; Ishikawa, S.; Silverstein, M.; Jacobson, M.; Fiksdahl-King, I.; Angel, S. A Pattern Language: Towns, Buildings, Construction; Oxford University Press: New York, NY, USA, 1977. [Google Scholar]
  15. Mehaffy, M.; Kryazheva, Y.; Rudd, A.; Salingaros, N. A New Pattern Language for Growing Regions: Places, Networks, Processes; Sustasis Press: Portland, OR, USA, 2020. [Google Scholar]
  16. Ptak-Wojciechowska, A. Analiza Wybranych Narzędzi do Ewaluacji Jakości Życia w Mieście w Kontekście Zmian Społeczno-Demograficznych. Ph.D. Thesis, Politechnika Poznańska, Poznań, Poland, 2023. [Google Scholar]
  17. Gawlak, A.; Matuszewska, M.; Ptak, A. Inclusiveness of Urban Space and Tools for the Assessment of the Quality of Urban Life—A Critical Approach. Int. J. Environ. Res. Public Health 2021, 18, 4519. [Google Scholar] [CrossRef]
  18. Ptak-Wojciechowska, A. Zróżnicowanie etykiet i narzędzi służących do oceny i porównywania miast. Zesz. Nauk. Politech. Poznańskiej. Archit. Urban. Archit. Wnętrz 2023, 17, 347–357. [Google Scholar] [CrossRef]
  19. de Souza Moreira, B.; Cristina de Souza Andrade, A.; de Carvalho Bastone, A.; Simone de Souza Vasconcelos, K.; Teixeira, V.B.D.; Xavier, C.C.; Proietti, F.A.; Caiaffa, W.T. Individual characteristics, perceived neighborhood, and walking for transportation among older Brazilian people residing in a large urban area. Int. J. Environ. Health Res. 2022, 12, 2620–2633. [Google Scholar] [CrossRef]
  20. de Lima, M.; da Silva, A.; Santos, R.D.; d ‘Orsi, E.; Bestetti, M.; Perracini, M. How Do Older Adults Living in the Community in Brazil Perceive Walkability in the Context of Sidewalks? J. Aging Environ. 2024, 38, 37–55. [Google Scholar] [CrossRef]
  21. Moran, M.R.; Werner, P.; Doron, I.; HaGani, N.; Benvenisti, Y.; King, A.C.; Winter, S.J.; Sheats, J.L.; Garber, R.; Motro, H.; et al. Exploring the Objective and Perceived Environmental Attributes of Older Adults’ Neighborhood Walking Routes: A Mixed Methods Analysis. J. Aging Phys. Act. 2017, 25, 420–431. [Google Scholar] [CrossRef] [PubMed]
  22. Chen, Y.-J.; Matsuoka, R.H.; Tsai, K.-C. Spatial measurement of mobility barriers: Improving the environment of community-dwelling older adults in Taiwan. J. Aging Phys. Act. 2015, 23, 286–297. [Google Scholar] [CrossRef] [PubMed]
  23. Ruiz-Padillo, A.; Oestreich, L.; Torres, T.; Rhoden, P.; Larranaga, A.; Cybis, H. Weighted assessment of barriers to walking in small cities: A Brazilian case. Transp. Res. Part D Transp. Environ. 2022, 109, 103392. [Google Scholar] [CrossRef]
  24. Yue, Y.; Yang, D.; Owen, N.; Van Dyck, D. The built environment and mental health among older adults in Dalian: The mediating role of perceived environmental attributes. Soc. Sci. Med. 2022, 311, 115333. [Google Scholar] [CrossRef]
  25. Van Holle, V.; Van Cauwenberg, J.; Gheysen, F.; Van Dyck, D.; Deforche, B.; Van de Weghe, N.; De Bourdeaudhuij, I. The Association between Belgian Older Adults’ Physical Functioning and Physical Activity: What Is the Moderating Role of the Physical Environment? PLoS ONE 2016, 11, e0148398. [Google Scholar] [CrossRef]
  26. Yang, C.; Tang, X.; Yang, L. Spatially varying associations between the built environment and older adults’ propensity to walk. Front. Public Health 2022, 10, 1003791. [Google Scholar] [CrossRef]
  27. Van Cauwenberg, J.; De Bourdeaudhuij, I.; Clarys, P.; Nasar, J.; Salmon, J.; Goubert, L.; Deforche, B. Street characteristics preferred for transportation walking among older adults: A choice-based conjoint analysis with manipulated photographs. Int. J. Behav. Nutr. Phys. Act. 2016, 13, 1–17. [Google Scholar] [CrossRef]
  28. Brookfield, K.; Tilley, S. Using virtual street audits to understand the walkability of older adults’ route choices by gender and age. Int. J. Environ. Res. Public Health 2016, 13, 1061. [Google Scholar] [CrossRef]
  29. Tournier, I.; Dommes, A.; Cavallo, V. Review of safety and mobility issues among older pedestrians. Accid. Anal. Prev. 2016, 91, 24–35. [Google Scholar] [CrossRef]
  30. Guo, Y.; Fu, Y.; Xu, Y. Satisfaction with neighbourhood environment moderates the associations between objective neighbourhood environment and leisure-time physical activity in older adults in Beijing, China. Health Soc. Care Community 2021, 29, 206–214. [Google Scholar] [CrossRef]
  31. Gaglione, F.; Gargiulo, C.; Zucaro, F. Where can the elderly walk? A spatial multi-criteria method to increase urban pedestrian accessibility. Cities 2022, 127, 103724. [Google Scholar] [CrossRef]
  32. Van Cauwenberg, J.; Nathan, A.; Barnett, A.; Barnett, D.W.; Cerin, E.; Council on Environment and Physical Activity (CEPA)—Older Adults Working Group. Relationships Between Neighbourhood Physical Environmental Attributes and Older Adults’ Leisure-Time Physical Activity: A Systematic Review and Meta-Analysis. Sports Med. 2018, 48, 1635–1660. [Google Scholar] [CrossRef] [PubMed]
  33. Cerin, E.; Nathan, A.; van Cauwenberg, J.; Barnett, D.W.; Barnett, A.; Council on Environment and Physical Activity (CEPA)—Older Adults working group. The neighbourhood physical environment and active travel in older adults: A systematic review and meta-analysis. Int. J. Behav. Nutr. Phys. Act. 2017, 14, 15. [Google Scholar] [CrossRef] [PubMed]
  34. Moniruzzaman, M.; Paez, A. An investigation of the attributes of walkable environments from the perspective of seniors in Montreal. J. Transp. Geogr. 2016, 51, 85–96. [Google Scholar] [CrossRef]
  35. Ferrer, S.; Ruiz, T.; Mars, L. A qualitative study on the role of the built environment for short walking trips. Transp. Res. Part F-Traffic Psychol. Behav. 2015, 33, 141–160. [Google Scholar] [CrossRef]
  36. Sallis, J.F.; Cain, K.L.; Conway, T.L.; Gavand, K.A.; Millstein, R.A.; Geremia, C.M.; Frank, L.D.; Saelens, B.E.; Glanz, K.; King, A.C. Is your neighborhood designed to support physical activity? A brief streetscape audit tool. Prev. Chronic Dis. 2015, 12, E141. [Google Scholar] [CrossRef]
  37. Cao, Y.; Heng, C.K.; Fung, J.C. Using walk-along interviews to identify environmental factors influencing older adults’ out-of-home behaviors in a high-rise, high-density neighborhood. Int. J. Environ. Res. Public Health 2019, 16, 4251. [Google Scholar] [CrossRef]
  38. Brookfield, K.; Thompson, C.W.; Scott, I. The uncommon impact of common environmental details on walking in older adults. Int. J. Environ. Res. Public Health 2017, 14, 190. [Google Scholar] [CrossRef]
  39. Wysocki, M. Standardy Dostępności dla Miasta Gdyni; Centrum Projektowania Uniwersalnego, Politechnika Gdańska Wydział Architektury: Gdańsk, Poland, 2012. [Google Scholar]
  40. Nowoczesne i Estetyczne Ławki Dla Ulicy Starodworcowej—BO Gdynia. Available online: https://bo.gdynia.pl/projects/nowoczesne-i-estetyczne-lawki-dla-ulicy-starodworcowej/ (accessed on 29 October 2024).
  41. United Nations. The Sustainable Development Goals Report 2019, in the Sustainable Development Goals Report; United Nations: New York, NY, USA, 2019. [Google Scholar] [CrossRef]
  42. Bassett, D.R.; Pucher, J.; Buehler, R.; Thompson, D.L.; Crouter, S.E. Walking, cycling, and obesity rates in Europe, North America, and Australia. J. Phys. Act. Health 2008, 5, 795–814. [Google Scholar] [CrossRef]
  43. World Health Organization. The Global Network for Age-Friendly Cities and Communities: Looking Back Over the Last Decade, Looking Forward to the Next; World Health Organization: Geneva, Switzerland, 2018. [Google Scholar]
  44. World Health Organization. About the Global Network for Age-friendly Cities and Communities—Age-Friendly World. Available online: https://extranet.who.int/agefriendlyworld/who-network/ (accessed on 17 May 2023).
  45. City of Poznan—Age-Friendly World. Available online: https://extranet.who.int/agefriendlyworld/network/city-of-poznan/ (accessed on 2 January 2025).
  46. Browse the Network—Age-Friendly World. Available online: https://extranet.who.int/agefriendlyworld/network/ (accessed on 29 October 2024).
  47. Garcia, D.A.; Cumo, F.; Pennacchia, E.; Pennucci, V.S.; Piras, G.; De Notti, V.; Roversi, R. Assessment of a urban sustainability and life quality index for elderly. Int. J. Sustain. Dev. Plan. 2017, 12, 908–921. [Google Scholar] [CrossRef]
  48. Ptak-Wojciechowska, A. Use of the Analytic Hierarchy Process (AHP) method to assess the urban quality of life of seniors in terms of architectural and urban planning aspects. Architectus 2024, 4, 85–98. [Google Scholar] [CrossRef]
  49. Unnamed Street—Streetmix. Available online: https://streetmix.net/-/2728279/ (accessed on 29 October 2024).
  50. Badii, C.; Bellini, P.; Cenni, D.; Chiordi, S.; Mitolo, N.; Nesi, P.; Paolucci, M. Computing 15MinCityIndexes on the Basis of Open Data and Services. In Computational Science and Its Applications–ICCSA 2021; Gervasi, O., Murgante, B., Misra, S., Garau, C., Blečić, I., Taniar, D., Apduhan, B.O., Rocha, A.M.A.C., Tarantino, E., Torre, C.M., Eds.; Springer International Publishing: Cham, Switzerland, 2021; pp. 565–579. [Google Scholar] [CrossRef]
  51. Barbieri, L.; D’Autilia, R.; Marrone, P.; Montella, I. Graph Representation of the 15-Minute City: A Comparison between Rome, London, and Paris. Sustainability 2023, 15, 3772. [Google Scholar] [CrossRef]
  52. Tota-Stawarczyk, P.; Rymsza, B.; Kasperczak, K.; Miśkowiec, M. Standardy Dostępności Architektonicznej dla Miasta Stołecznego Warszawy, City of Warsaw: Warsaw, Poland, 2022. Available online: https://wsparcie.um.warszawa.pl/dostepnosc-architektoniczna (accessed on 7 March 2024).
  53. Newton, R.; Ormerod, M. ‘Seating’, Inclusive Design for Getting Outdoors (I’DGO). 2012. Available online: https://www.idgo.ac.uk/design_guidance/pdf/DSOPM-Seating-120820.pdf (accessed on 31 March 2025).
  54. Department for Transport. Inclusive Mobility: A Guide to Best Practice on Access to Pedestrian and Transport Infrastructure. 2005. Available online: https://www.gov.uk/government/publications/inclusive-mobility (accessed on 31 March 2025).
  55. Portal Systemu Informacji Przestrzennej Miasta Poznania. Available online: https://sipgeoportal.geopoz.poznan.pl (accessed on 1 April 2025).
  56. World Health Organization. WHO Global Network for Age-Friendly Cities and Communities, WHO Maps ArcGIS. Available online: https://who.maps.arcgis.com/apps/instant/minimalist/index.html?appid=66799d4ec039487e8ef8367f0254a99a (accessed on 10 April 2025).
  57. Bloom, L.B. The 20 Best Cities to Live in the World, Ranked in A 2024 Report, Forbes. Available online: https://www.forbes.com/sites/laurabegleybloom/2024/06/26/the-20-best-cities-to-live-in-the-world-ranked-in-a-2024-report/ (accessed on 3 January 2025).
  58. Department for Transport. Manual for Streets, Thomas Telford Publishing. 2007. Available online: https://www.gov.uk/government/publications/manual-for-streets (accessed on 31 March 2025).
  59. World Health Organization. Global Age-Friendly Cities: A Guide; World Health Organization: Geneva, Switzerland, 2007. [Google Scholar]
  60. Liu, Y.; Guo, Y.; Lu, S.; Chan, O.F.; Chui, C.H.K.; Ho, H.C.; Song, Y.; Cheng, W.; Chiu, R.L.H.; Webster, C.; et al. Understanding the long-term effects of public open space on older adults’ functional ability and mental health. Build. Environ. 2023, 234, 110126. [Google Scholar] [CrossRef]
  61. Hassen, N.; Kaufman, P. Examining the role of urban street design in enhancing community engagement: A literature review. Health Place 2016, 41, 119–132. [Google Scholar] [CrossRef] [PubMed]
  62. Zhu, X.; Lu, Z.; Yu, C.-Y.; Lee, C.; Mann, G. Walkable communities: Impacts on residents’ physical and social health. World Health Des. 2013, 6, 68–75. [Google Scholar]
  63. Barnett, A.; Cerin, E.; Ching, C.S.-K.; Johnston, J.M.; Lee, R.S.Y. Neighbourhood environment, sitting time and motorised transport in older adults: A cross-sectional study in Hong Kong. BMJ Open 2015, 5, e007557. [Google Scholar] [CrossRef]
  64. Verburgt, M.; Asselman, J.; Trakul-Masłowska, M.; Kubecka, M.; Mayer, P.; Panek, P. D2. 3 Requirements of Primary and Secondary End-Users-A Toilet for Me Envisioned, 2021. Available online: https://repositum.tuwien.at/handle/20.500.12708/40489 (accessed on 8 April 2025).
  65. Turel, H.S.; Yigit, E.M.; Altug, I. Evaluation of elderly people’s requirements in public open spaces: A case study in Bornova District (Izmir, Turkey). Build. Environ. 2007, 42, 2035–2045. [Google Scholar] [CrossRef]
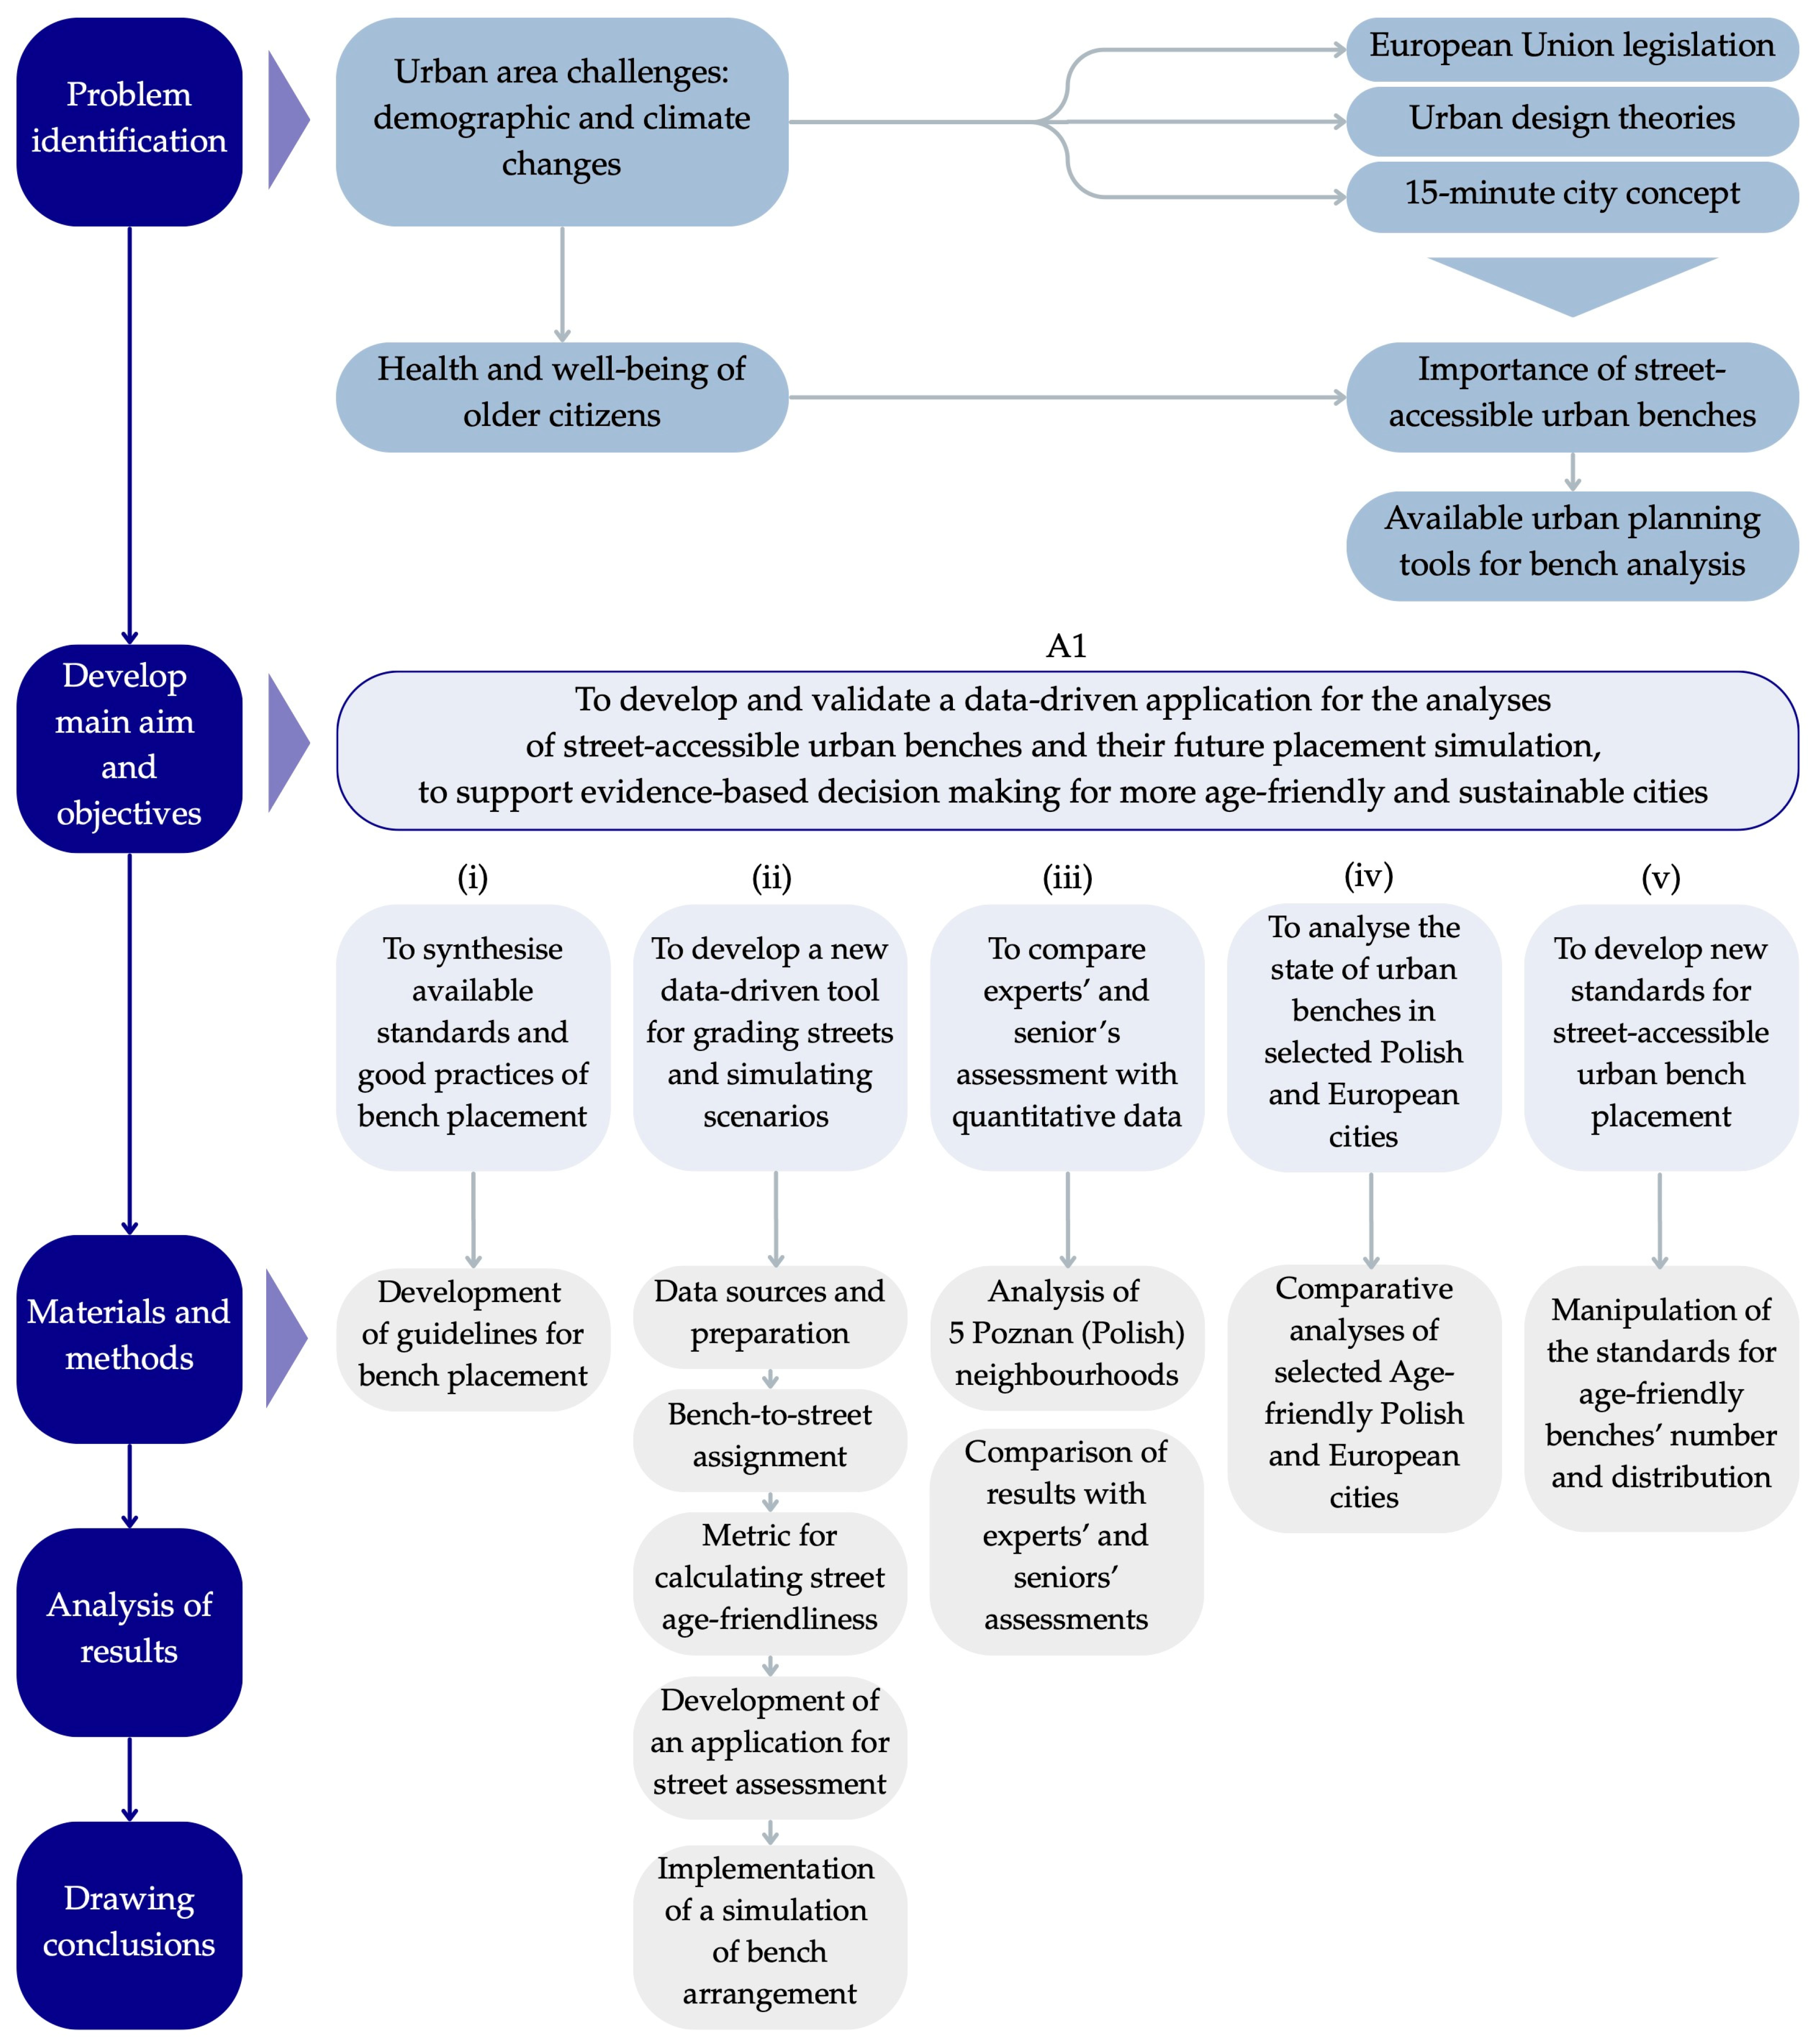
Figure 1. Schematic design of this study.
Sustainability 17 08251 g001
Figure 2. Colour legend: street classifications by their age-friendliness in terms of urban bench placement.
Sustainability 17 08251 g002
Figure 3. User interface of application for assessing age-friendly streets in terms of urban bench placement.
Sustainability 17 08251 g003
Figure 4. Comparison of the current state of benches with the simulation that assumes the addition of 1000 benches. Selected simulated benches (brown colour) are marked in white circle.
Sustainability 17 08251 g004
Figure 5. Dashboard with Advanced Road Options and selected highway types.
Sustainability 17 08251 g005
Figure 6. Spatial distribution of benches in the analysed Poznan neighbourhoods.
Sustainability 17 08251 g006
Figure 7. Expert assessments on urban equipment, grades 0–10.
Sustainability 17 08251 g007
Figure 8. Senior satisfaction with the number of benches, grades 1–5.
Sustainability 17 08251 g008
Figure 9. Spatial distribution of benches in analysed Polish cities from the Age-Friendly Cities Network.
Sustainability 17 08251 g009
Figure 10. Spatial distribution of benches in analysed European cities from the Age-Friendly Cities Network.
Sustainability 17 08251 g010
Figure 11. Street segments defined by Open Street Map.
Sustainability 17 08251 g011
Figure 12. Seat pad with a backrest on existing infrastructure in Evry-Courcouronnes (left), and an edge-mounted bench designed to fit onto a planter in Eindhoven (right). Photos by author.
Sustainability 17 08251 g012
Table 1. Statistical summary and ratings of the analysed urban areas: Poznan neighbourhoods.
ChartowoGrunwald PołudniePiątkowoRatajeŚw. Łazarz
StatisticTotal area (km2)4.473.823.835.173.67
Total street length (km)107.6391.18119.02168.9483.30
Number of street segments581473783918316
Current number of benches9664054671432569
Average distance to the nearest bench (m)20.3418.0118.1818.4620.58
Number of seniors (aged 60+)70536622925585317424
Density (no. of seniors/km2)1576.611732.772415.751649.152023.45
Percentage of Total Length [%]Age-friendly (optimal) streets11.645.676.2510.866.63
Age-friendly (convenient) streets18.698.9410.8018.1811.47
Insufficiently age-friendly (moderate) streets6.355.041.195.448.66
Insufficiently age-friendly (minimal) streets 9.5411.078.987.8912.51
Non-age-friendly streets53.7969.2872.7857.6260.73
IndexOverall Street Age-Friendliness (%)25.1712.6413.2823.3015.98
Benches needed (number) to achieve class:Age-friendly (optimal)18451800242429661528
Age-friendly (convenient)6296579201043512
Insufficiently age-friendly (moderate)523542828881354
Insufficiently age-friendly (minimal)349361595606195
Table 2. Comparison among expert and senior assessments and tool index.
NeighbourhoodSenior Assessments NormalisedExpert Assessments NormalisedTool: “Overall Street-Age Friendliness”
Chartowo66%49%25.17%
Grunwald Południe56%60%12.64%
Piątkowo54%60%13.28%
Rataje64%65%23.30%
Św. Łazarz62%61%15.98%
Table 3. Statistical summary and ratings of analysed urban areas: Polish cities from the Age-Friendly Cities Network.
LocationPoznańGdańskGdyniaKrakówWrocław
StatisticTotal area (km2)261.90258
(749.55)
135
(432.41)
295.22276.75
Total street length (km)2151.322241.95786.452781.302533.33
Number of street segments10,72712,653459615,88515,179
Current number of benches91556549204086576092
Average distance to the nearest bench (m)17.6023.5724.0216.1812.05
Percentage of Total Length (%)Age-friendly (optimal = 50 m) streets5.084.013.284.452.84
Age-friendly (convenient) streets6.447.064.824.872.91
Insufficiently age-friendly (moderate) streets3.183.213.031.730.65
Insufficiently age-friendly (minimal) streets 4.486.005.542.762.07
Non-age-friendly streets80.8279.7283.3886.1991.52
IndexOverall Street Age-Friendliness (%)9.739.026.977.804.79
Benches needed (number) to achieve class:Age-friendly (optimal)43,79946,73216,82758,83755,697
Age-friendly (convenient)16,50617,796653522,97322,258
Insufficiently age-friendly (moderate)13,03014,843555019,32519,333
Insufficiently age-friendly (minimal)886110,490397713,76413,946
Table 4. Statistical summary and ratings of the analysed urban areas—European cities from the Age-Friendly Cities Network.
LocationsPoznańAmsterdamDublinStuttgartVienna
StatisticTotal Area (km2)261.90219.17123.92177.80347.98
StatisticTotal street length (km)2151.321510.831088.34961.983761.54
Number of street segments10,72794764549647120,405
Current number of benches915550121173532011,610
Average distance to the nearest bench (m)17.6022.2731.9923.7016.21
Percentage of Total LengthAge-friendly (optimal) streets5.082.921.082.503.05
Age-friendly (convenient) streets6.446.732.746.154.05
Insufficiently age-friendly (moderate) streets3.182.983.242.802.89
Insufficiently age-friendly (minimal) streets 4.484.332.225.354.64
Non-age-friendly streets80.8283.0590.7283.2085.37
IndexOverall Street Age-Friendliness (%)9.737.583.267.006.11
Benches needed (number) to achieve class:Age-friendly (optimal)43,79932,48623,35821,06680,616
Age-friendly (convenient)16,50612,6568839830131,272
Insufficiently age-friendly (moderate)13,03011,1106127744425,528
Insufficiently age-friendly (minimal)886182634237562918,073
Table 5. Overall street age-friendliness indices of analysed urban areas for two distances: 50 and 100 m.
ChartowoGrunwald PołudniePiątkowoRatajeŚw. Łazarz
IndexOverall Street Age-Friendliness (%) for 50 m25.1712.6413.2823.3015.98
IndexOverall Street Age-Friendliness (%) for 100 m33.3017.3918.3731.2722.84
Benches neededAge-friendly (optimal) for 50 m18451800242429661528
Age-friendly (optimal) for 100 m89593012561456751
PoznańGdańskGdyniaKrakówWrocław
IndexOverall Street Age-Friendliness (%) for 50 m9.739.026.977.804.79
IndexOverall Street Age-Friendliness (%) for 100 m12.8912.779.9110.126.18
Benches neededAge-friendly (optimal) for 50 m43,79946,73216,82758,83755,697
Age-friendly (optimal) for 100 m22,97724,449892931,36430,146
PoznańAmsterdamDublinStuttgartVienna
IndexOverall Street Age-Friendliness (%) for 50 m9.737.583.267.006.11
IndexOverall Street Age-Friendliness (%) for 100 m12.8911.034.8510.458.41
Benches neededAge-friendly (optimal) for 50 m43,79932,48623,35821,06680,616
Age-friendly (optimal) for 100 m22,97717,22312,31611,14942,917
Disclaimer/Publisher’s Note: The statements, opinions and data contained in all publications are solely those of the individual author(s) and contributor(s) and not of MDPI and/or the editor(s). MDPI and/or the editor(s) disclaim responsibility for any injury to people or property resulting from any ideas, methods, instructions or products referred to in the content.