Article

Analysing the Usefulness of Circular Strategies to Improve Supply Chain Resilience Against Demand Changes

Faculty of Engineering and IT, School of Mechanical and Mechatronic Engineering, University of Technology Sydney, Ultimo, NSW 2007, Australia
*
Authors to whom correspondence should be addressed.
Sustainability 2025, 17(18), 8248; https://doi.org/10.3390/su17188248
Submission received: 7 August 2025 / Revised: 10 September 2025 / Accepted: 10 September 2025 / Published: 13 September 2025

Abstract

Demand changes in a supply chain are common events and can hurt its resilience and profitability. It is important to develop appropriate strategies to mitigate demand changes in supply chains. This study develops mathematical modelling and simulation approaches to deal with demand changes using circular strategies. First, a mathematical model is developed to design a supply chain under ideal situations. Then, the model is revised to analyse the impacts of demand changes and further extended to analyse the usefulness of circular strategies to mitigate increased demand. The anyLogistix simulation approach is used to solve the mathematical models and analyse the results of the distribution of an Australian smartphone brand. A sensitivity analysis is also conducted to investigate the impacts of key variables on cost, profit, and demand fulfilment. The results indicate that there will be significant losses in profit and demand fulfilment if the increased demand is not dealt with appropriately. The results also demonstrate a significant benefit of using circular strategies, such as repair and reuse, to improve demand fulfilment and profitability by mitigating the increased demand. This study is unique in the literature as it investigates the usefulness of circular strategies, such as repair and reuse, quantitatively to mitigate increased demand and improve supply chain resilience performance, such as total profit and demand fulfilment. Decision-makers can use the developed models and simulation approaches and the findings to make decisions on how to apply repair and reuse strategies for a smartphone distribution system and to improve its resilience and sustainable performance.

1. Introduction

In this globally interconnected world, supply chains have become very complex as many risks and uncertainties are present. One of the major supply chain risks is changes in product demand [1]. There are many potential reasons behind the changes in demand, such as an increase in population, model, and brand changes, new product introductions, competition, and changes in customer income and choice. Demand changes have major impacts on supply chain planning as supply, production, and distribution need to be updated according to the changes. Otherwise, the supply chain could face numerous financial and reputational losses [2]. One of the effective ways to manage demand changes in supply chains is to develop a more resilient supply chain [2,3,4,5] that can respond to changes and revise supply, production, and distribution plans to manage the changes.
Supply chain resilience is a concept involving restructuring and redesigning the plan so that it can help with preparation, response, and recovery from any unexpected events, such as changes in demand or any other interruptions in any operations [6]. Many studies have suggested that implementing resilience strategies, such as multiple suppliers, supplier development, nearshoring and onshoring, production capacity flexibility, and using safety stock and supply chain coordination, could help improve supply chain resilience [7,8,9,10,11]. However, implementing these strategies requires long-term planning and significant resource investment.
In the literature, very few studies have suggested that implementing circular strategies can help mitigate demand changes in supply chains and potentially improve their resilience [12,13]. The integration of the concept of circular economy (CE) practices in supply chains is known as circular supply chains [14]. CE practices in supply chains include implementing different strategies such as reusing, recycling, repairing, remanufacturing, and leasing existing and used resources, products, and materials [15,16,17]. These practices help ensure sustainable consumption and improve sustainable performance in supply chains. Moreover, they can help increase the stocks of the parts and products, which can further help increase supply and production and the availability of products. This increased availability of products can be used to satisfy increased demand. Ultimately, implementing circular strategies can increase demand fulfilment and resilience in the supply chain. However, studies on how the implementation of circular strategies can mitigate the demand changes in supply chains and their quantitative investigations, such as simulation, are non-existent in the literature. This study takes the first step to fill this significant research gap in the literature and answers the following research questions (RQs):
RQ1: What are the impacts of demand changes on the supply chain?
RQ2: How can circular strategies help mitigate demand changes and improve supply chain resilience?
To answer the above RQs, this study develops the following research objectives (ROs):
RO1: To design a supply chain under ideal situations with known demand.
RO2: To develop a model for analysing the impacts of demand changes on a supply chain.
RO3: To redevelop the model by implementing circular strategies to investigate the improvement of supply chain resilience performance.
To achieve the ROs, this study applies mathematical modelling and simulation approaches to develop models and solve them. Finally, the results obtained from models under different situations are compared to analyse the usefulness of circular strategies to mitigate demand changes and improve resilience in supply chains.
The remainder of the paper is structured as follows: Section 2 presents a literature review on demand changes and the circular supply chain and its resilience. The model development and research methodology are presented in Section 3. The results are analysed in Section 4. Section 5 presents a sensitivity analysis. The practical implications are presented in Section 6. Finally, Section 7 provides the conclusions and future research directions.

2. Literature Review

The literature review consists of several sub-sections, such as demand changes and resilience, circular strategies in supply chains, and circular supply chains and resilience. Research gaps are identified at the end of this section.

2.1. Demand Changes and Resilience in Supply Chains

Supply chain resilience is defined by the level of preparedness, the ability to quickly respond, and how a quick recovery can happen in the case of risk events [6,18]. Demand changes are one of the common risk events in supply chains and they should be dealt with appropriately. A resilient supply chain can help mitigate demand changes and update its supply and distribution plans when necessary.
In the literature, several studies have discussed the usefulness of resilience strategies to mitigate demand changes. For example, Paul et al. [2] applied backorder and lost sales strategies to manage demand fluctuation in a production system. Recently, Lee and Moon [4] used flexibility and redundancy strategies to mitigate demand and supply uncertainties. The other resilience strategies that can be used to mitigate demand changes are the use of safety stock, supplier development, and supply chain collaboration and the increase in production capacity [7,8,10,19]
In many cases, circular strategies could also help mitigate demand changes. For example, repair, reuse, remanufacturing, and recycling help produce extra parts and products which can mitigate increased demand. In the literature, a few studies have considered circular strategies to manage demand–supply issues in supply chains. For example, Wang et al. [20] used circular strategies to balance demand and supply for rare-earth materials. Takimoto et al. [21] considered circular strategies to mitigate rising mining demand. Gaustad et al. [22] applied circular strategies to mitigate critical mineral supply issues. All of these studies are empirical in nature and lack quantitative investigation.

2.2. Circular Concepts in Supply Chains

Several studies have been conducted in the area of circular supply chains. Among them, several systematic literature review articles were found. Taddei et al. [23] reviewed articles that used reuse–recycle–remanufacturing (3Rs) strategies as circular economy strategies. They explored the integration of Industry 4.0 with circular supply chains and proposed a theoretical framework as a future research direction. de Lima et al. [24] reviewed the articles on uncertainty management in circular supply chains. They explored different uncertainty challenges and identified strategies to improve sustainability performance. Sudusinghe & Seuring [25] reviewed different collaboration practices to improve supply chain circularity performance. They found that sharing information was the most significant strategy for improving supply chain circularity performance. Vegter et al. [26] reviewed the studies on a circular business model and found eight processes, such as plan, source, make, deliver, use, return, recover, and enable, that are crucial for circularity performance.
In the literature, previous studies have applied different methods such as quantitative, case study, and empirical methods. The following sub-sections review the studies as per their contributions, findings, methods, and contexts.

2.2.1. Quantitative Studies on Circular Supply Chains

In the literature, several technical studies have been conducted on circular supply chains that applied quantitative methods, such as MCDM, mathematical programming, and game theory methods. Bui et al. [27] applied fuzzy Delphi and fuzzy DEMATEL to explore the relationship between a circular supply chain and total resource management and found that top management support is important for better firm performance. Cao et al. [28] integrated supply chain resilience and a circular supply chain to improve environmental performance and found that assessing product life cycles can improve circular performance. They applied fuzzy set theory integrated with the DEMATEL method.
Stumpf et al. [29] integrated the resource-based view, resources and capabilities, and circular supply chain and applied Delphi and analytic hierarchy process to investigate how coordination could improve knowledge sharing between partners to achieve a circular supply chain. Dwivedi and Paul [30] used the fuzzy best–worst method to analyse barriers to digital supply chains and provided suggestions to increase circular performance. They found that a lack of digital skills is the most significant barrier. Orji et al. [31] applied the best–worst method and evaluation based on distance from the average solution to identify and analyse the enablers of supply chain circularity and found that supplier relationship development is the most important enabler. Sawe et al. [32] analysed the relationship between human resource-related factors and supply chain circularity. They found that training and knowledge sharing were the most important factors.
In the literature, several other quantitative methods such as the Equilibrium model [33], mathematical programming [34], and game theory [35] were applied to explore the impacts of plastic bottles on the circular economy [33], to investigate the role of repair and collection centres in circular supply chains [34], and to analyse green product supply chains and circular economy. The summary of quantitative studies on circular supply chains is presented in Table 1.

2.2.2. Case Studies on Circular Supply Chains

A number of studies have conducted case studies in the context of circular supply chains. For example, Bimpizas-Pinis et al. [37] integrated the concepts of circular economy and environmental performance in the food sector. They identified strategies for producing and processing food to enhance circular performance. Sehnem et al. [38] conducted a case study to analyse critical success factors in supply chain circularity. They found that supply chain circularity and sustainable models could improve business performance.
Two other case studies were conducted in the context of physical retail outlets [39] and the washing machine industry [40]. The first one focused on reusable packaging and emphasised that the concept of reusing can improve sustainability in a circular supply chain. The latter conducted a life-cycle assessment to analyse the four stages of environmental impact assessment: production of materials, manufacturing, waste management, and product recycling. The contributions, findings, and contexts of the case studies applied in circular supply chains can be found in Table 2.

2.2.3. Empirical Studies on Circular Supply Chains

We have found several studies that applied empirical methods in circular supply chains. The empirical methods included structural equation modelling, the multi-cycle model, and the modified balanced scorecard. For example, Stillitano et al. [41] developed a multi-cycle model by integrating the concepts of sustainability and circular economy in agri-food supply chains. They found that the life-cycle assessment approach can improve social and environmental performance in supply chains. Farooque et al. [42] applied a structural equation modelling approach to test circularity in supply chains. They found a significant relationship between financial performance and circular product design in the context of multiple industries. Nayal et al. [43] also applied a structural equation modelling approach to investigate the performance indicators of supply chain flexibility and tested their relationships using the resource orchestration theory. They found that logistics, manufacturing, procurement, marketing, and information flexibility influenced supply chain performance.
Two other studies applied structural equation modelling [44] and modified balanced scorecard [45] approaches to investigate the impacts of eco-innovation strategies on supply chain circularity performance and to analyse key performance indicators in the circular supply chain.
The empirical studies on circular supply chains are summarised in Table 3.

2.3. Circular Supply Chains and Resilience

This section discusses the studies that considered resilience and circular supply chain strategies. A few studies considered both resilience and circular concepts in supply chains. Those studies and their contributions, findings, methods, contexts, strategies, and performance indicators are presented in Table 4.
Recently, Cobra et al. [12] explored how repair strategies can be useful to improve the resilience of health systems and analysed barriers and enablers to implementing them. They found that the adoption of the repair system could increase financial performance. Vimal et al. [46] investigated the relationship between sustainability practices and resilience to increase circular performance. They found that the supply network could be reformed to ensure resilience in adopting supply circularity.
Further, Chari et al. [47] integrated resilience and circular supply chains to improve business capabilities. They found a sustainable advantage with the adoption of the circular economy for improving resilience. Fletcher et al. [48] integrated sustainability and supply chain circularity to enhance resilience and found that supply chain resilience could increase business performance through the adoption of supply chain circularity.
It was observed that most of the studies conducted qualitative analysis, and there was a lack of quantitative investigation analysing the impacts of circular strategies on improving supply chain resilience.
Table 4. Summary of the literature on both circular supply chains and resilience concepts.
ReferenceContributionsFindingsMethods UsedIndustry SectorsRegionsKey StrategiesPerformance Indicators
[46]
  • They integrated sustainability, resilience, and circular networks.
  • They provided an optimal sustainability framework for enhancing resilience in circular networks.
  • They found a relevant relationship between sustainability practices and resilience (optimal solution) for increasing circular performance.
  • The supply network could be reformed to ensure resilience in adopting supply circularity.
Case study,
analytical hierarchy process
Sugar cane, paper industry, cement industryNot specificEnergy optimisation, decarbonisation of operations, secondary material sourcing, material synergy, utility synergy, collaboration with partners, information sharing, real-time monitoringCost reduction
Recovery lead-time
Minimisation of waste generation
[12]
  • They explored repair strategies in a circular supply chain connected to resilience.
  • They also mentioned ventilator availability, supplies, and policies during the COVID-19 pandemic.
  • They found several barriers to repairing ventilators. Some of the barriers were strict regulation, lack of engagement, opportunism, laborious tasks, resource scarcity, lack of trust, and inaccurate information.
  • They also found several enablers, such as comprehensive policies, circular innovation, clear purpose, strong leadership, flat hierarchy, open communication, and repair formalisation.
  • The adoption of the repair system could increase the financial performance.
Case study,
qualitative data analysis
HealthcareBrazilPublic–private volunteer partnership, knowledge transfer, reusing parts, redistributing the demand, volunteer repair services, volunteer training, sharing expertise, collaboration to develop alternatives, consolidating information, online collaboration with partnersNot mentioned
[47]
  • They identified different challenges of collaboration in the context of Industry 4.0.
  • They integrated resilience and circular supply chains to improve business capabilities.
  • They applied two models: dynamic capabilities and causal relationships.
  • They found a sustainable advantage with the adoption of the circular economy for improving resilience.
  • They also found a positive relationship between dynamic capabilities and circular supply chains.
  • Adaptive dynamic capabilities could improve resilience for better circular performance.
Case studyEuropean process industryEuropeStructured design, suitable logistics, urban symbiosis practices, sustainable consumption, electric vehicles, leadership support, cultural mindset, user-centred design, dematerialisation, sharing of reused/recycled materials,
alternative processing techniques, increased product lifetime, and collaboration with suppliers
Environmental footprint
Cost efficiency
[49]
  • They mentioned a circular strategy after the COVID-19 pandemic.
  • They mentioned biodiversity for mitigating carbon footprint.
  • They introduced “the circular premium” as the new expression for adopting the difference between circular and regular prices.
  • They found that sustainability should be focused on improving resilience and circular supply chains.
OpinionsFashion industryNot specificReuse, recycle, recover, redesign, invest in innovation, use sustainable fibre, use biobased materials, increase product lifecycleReduce CO2 emissions
Reduce pollution
Improve product safety
Eliminate harmful chemicals
Reduce toxicity
[48]
  • They integrated sustainability and supply chain circularity to enhance resilience.
  • They provided a supply chain resilience–circularity framework.
  • They found that supply chain resilience could increase business performance through the adoption of supply chain circularity.
  • Resilience practice and circularity adoption could be a solution for mitigating eco-problems.
Qualitative case studySeafood sectorNot specificDiversification, knowledge exchange, dematerialisation, and reducing waste generationNot mentioned
[13]
  • They explored dynamic capabilities for remanufacturing in the adoption of the circular economy.
  • They mentioned two different orientations, namely flexibility and control.
  • They found that management, technical, and market factors have positive effects on dynamic capabilities for remanufacturing.
  • They also found that eco-factors and regulatory factors positively impacted dynamic capabilities for remanufacturing.
  • They found a positive relationship between dynamic remanufacturing capabilities and resilience.
  • Flexible orientation could perform as a positive moderator in the relationship.
Structural equation modellingAutomotive, heavy engineering, and mining equipmentSouth AfricaSkilled workforce, reverse logistics, using advanced technology, recycling, changeover systems, alternative component designOptimise cost
Optimal pricing
Customer demand fulfilment

2.4. Research Gaps

From the literature review, it has been observed that many studies have considered the concepts of supply chain resilience and circular supply chain separately and investigated different strategies and performance indicators. However, the concept of implementing circular strategies to improve supply chain resilience performance against demand changes is limited in the literature.
Only a few studies have qualitatively explored both circular and resilience concepts and argued that implementing circular strategies can improve supply chain resilience [12,13,46,47,48,49]. However, the literature on how supply chain networks can be designed and/or redesigned using circular strategies to manage demand changes and improve resilience is missing. Hence, a quantitative investigation is needed to develop supply chain planning models and to explore the usefulness of circular strategies to improve resilience against demand changes.

3. Model Development and Research Methodology

This study takes the first steps to fulfil this significant research gap by quantitatively modelling the impacts of circular strategies to improve supply chain resilience against demand changes.
In this study, we consider a two-stage supply chain including distribution centres (DCs) and retailers. DCs receive products from their suppliers and send them to retailers, where customers can buy them.
In ideal situations, all retailers’ demands are known. DCs stock the product accordingly and distribute it to retailers as per their demands. Ideally, all demands are met.
However, in real-life situations, demand can be increased due to increased population, changes in prices, and competition. In this situation, the distribution plan needs to be revised according to the changes in demand. Circular strategies, such as repair and reuse, can help to mitigate increased demand for certain products, such as smartphones. In this study, we investigate how implementing circular strategies can be effective in mitigating increased demand and can help businesses improve profitability and demand fulfilment.
As per the problem, we divided the study into three tasks.
Task 1: Developing a model to design a supply chain under ideal situations.
Task 2: Developing the model for supply chain plans under increased demand with no strategies.
Task 3: Extending the model for supply chain plans under increased demand with strategies.
Accordingly, we have developed mathematical models for three different tasks. The mathematical models are presented in the next sections.

3.1. Model 1: Model to Design a Supply Chain Under Ideal Situations

A supply chain consists of DCs and retailers. DCs receive the products as per orders from suppliers and deliver them to retailers as per their demand. A mathematical model is formulated and simulated using the anyLogistix simulation approach to develop supply chain plans under ideal situations.
The following notations are used:
i : set of DCs ( i = 1 , 2 , , I );
j : set of retailers ( j = 1 ,   2 , ,   J );
C i : capacity of DC i ;
D j : demand of retailer j ;
d i j : distance between DC i and retailer j ;
x i j : quantity sent from DC i to retailer j ;
y j : quantity received by retailer j ;
s : selling price per unit at retailers;
b : buying price per unit by DCs;
t : transportation cost per unit per km;
f : fixed operating cost for a DC per period;
h : inventory holding cost at DCs.
Total revenue and costs are calculated as follows:
Total   revenue   =   j = 1 J i = 1 I x i j   × s
Total   transportation   cos t = j = 1 J i = 1 I d i j × x i j × t
Total   buying   cos t = j = 1 J i = 1 I x i j × b
Total   fixed   operating   cos t   of   DCs = I × f
The objective function for Model 1 is to maximise the total profit, which is presented in Equation (5).
T o t a l   p r o f i t = j = 1 J i = 1 I x i j × s j = 1 J i = 1 I x i j × b j = 1 J i = 1 I d i j × x i j × t I × f
It is subject to the following constraints:
y j = i = 1 I x i j ;   j   [balancing sent and received quantity]
j = 1 J x i j C i ;   i   [capacity constraints]
i = 1 I x i j = D j ; j   [demand constraints]
x i j 0 ; i ,   j   [non-negativity constraints]

3.2. Model 2: Model for Supply Chain Plans Under Increased Demand with No Strategies

For Model 2, the mathematical model, presented in Section 3.1, is changed as the penalty cost for not meeting the demand is added to the cost.
Penalty   cos t = p j = 1 J D j j = 1 J i = 1 I x i j
where p is the penalty cost per unit of unmet demand.
The objective function for Model 2 is to maximise the total profit, which is presented in Equation (11).
T o t a l   p r o f i t = j = 1 J i = 1 I x i j × s j = 1 J i = 1 I x i j × b j = 1 J i = 1 I d i j × x i j × t I × f p j = 1 J D j j = 1 J i = 1 I x i j
The constraint (8) is also changed to reflect demand changes as follows:
i = 1 I x i j D j + d j ; j   [demand constraints]
where d j represents demand changes at retailer j .

3.3. Model 3: Model for Supply Chain Plans Under Increased Demand with Strategies

In this model, we apply two circular strategies to mitigate increased demand and to improve supply chain resilience. These strategies are as follows:
  • Use of repair centres: In this study, repair centres are established along with DCs and used mobile phones are collected to repair them. After repair, mobile phones are sold as refurbished at a discounted price.
  • Use of reuse centres: Some used mobile phones can be sold directly without being repaired. They are collected at the reuse centres and are sold at a lower price than the new phones.
We assume that the repair and reuse centres are located at DCs. A new mathematical model is developed to demonstrate the demand changes and incorporate circular strategies. The following new parameters have been used:
C i 1 : quantity repaired in repair centre i ;
b 1 : collection and repair cost per unit in the repair centre;
s 1 : selling price per repaired unit;
x i j 1 : quantity sent from repair centre i to retailer j ;
C i 2 : quantity collected and inspected in reuse centre i ;
b 2 : collection and inspection cost per unit in the reuse centre;
s 2 : selling price per reused unit;
x i j 2 : quantity sent from reuse centre i to retailer j .
Total revenue and costs are calculated as follows:
Total   revenue   =   j = 1 J i = 1 I x i j   × s +   j = 1 J i = 1 I x i j 1   × s 1 + j = 1 J i = 1 I x i j 2   × s 2
Total   transportation   cos t = j = 1 J i = 1 I d i j × ( x i j + x i j 1 + x i j 2 ) × t
Total   buying ,   repair ,   and   reuse   cos t = j = 1 J i = 1 I x i j × b + j = 1 J i = 1 I x i j 1 × b 1 + j = 1 J i = 1 I x i j 2 × b 2
Total   fixed   operating   cos t = I × f
Total   penalty   cos t = p j = 1 J D j j = 1 J i = 1 I x i j + x i j 1 + x i j 2
The objective function for Model 3 is to maximise the total profit as presented in Equation (18). The total profit is determined by subtracting all costs (Equations (14)–(17)) from the revenue (Equation (13)).
T o t a l   p r o f i t = j = 1 J i = 1 I x i j × s + j = 1 J i = 1 I x i j 1 × s 1 + j = 1 J i = 1 I x i j 2 × s 2 j = 1 J i = 1 I d i j × x i j + x i j 1 + x i j 2 × t j = 1 J i = 1 I x i j × b j = 1 J i = 1 I x i j 1 × b 1 j = 1 J i = 1 I x i j 2 × b 2 p j = 1 J D j j = 1 J i = 1 I ( x i j + x i j 1 + x i j 2 I × f
The objective function is subject to the following constraints:
y j = i = 1 I x i j + i = 1 I x i j 1 + i = 1 I x i j 2 ;   j   [balancing sent and received quantity]
j = 1 J x i j C i ;   i   [capacity constraints for new units]
j = 1 J x i j 1 C i 1 ;   i   [capacity constraints for repaired units]
j = 1 J x i j 2 C i 2 ;   i   [capacity constraints for reused units]
i = 1 I x i j + i = 1 I x i j 1 + i = 1 I x i j 2 D j + d j ; j   [demand constraints]
x i j ,   x i j 1 ,   x i j 2 0 ; i ,   j   [non-negativity constraints]

3.4. Solution Methodology

The developed models have been solved using the anyLogistix simulation approach. The methodology is presented in Figure 1.
The steps of the methodologies are described as follows:
Step 1: Designing a supply chain plan under ideal situations (no demand changes).
Step 2: Simulating and optimising the supply chain plan under ideal situations using the anyLogistix simulation approach.
Step 3: Formulating the revised supply chain models under increased demand and with circular strategies.
Step 4: Optimising and simulating the revised supply models using the anyLogistix simulation approach.
Step 5: Comparing the findings under different situations, such as between supply chain plans under ideal situations, with no strategies, and with circular strategies.
Step 6: Conducting a sensitivity analysis to investigate the impacts of key variables on cost, profit, and demand fulfilment in mitigating the increased demand.

4. Result Analysis

In this study, we used the case of the distribution of an Australian smartphone model that can be repaired and reused to mitigate increased demand. We have collected demand and price data from secondary sources. The following data have been collected:
It was reported that 3.98 million smartphones were sold during the first half of 2024 [50]. Hence, the annual demand for smartphones is estimated at 7.96 million units. Assuming a particular smartphone model’s share is 5%, the annual demand for that model is estimated at 7.96 million × 0.05 = 398,000 units.
In this study, we have designed the supply chain with 8 DCs and 80 retailers around Australia. Hence, demand per retailer per period is estimated at 383 units, assuming the first order is on the 1st day of the year with a 30-day order interval.
We have taken the average selling price of new phones to be AUD 1399 per unit [51]. We have estimated the buying price of smartphones to be AUD 874.38.

4.1. Results of Supply Chain Plans Under Ideal Situations

To analyse the results of supply chain plans under ideal situations, we solve the model presented in Section 3.1 using the anyLogistix simulation approach. The supply chain, under ideal situations, satisfies all retailer demands. Hence, we find that the demand fulfilment is 100%. Total profit is maximised to be AUD 195,116,138.02. There is no penalty cost as all demands are satisfied.
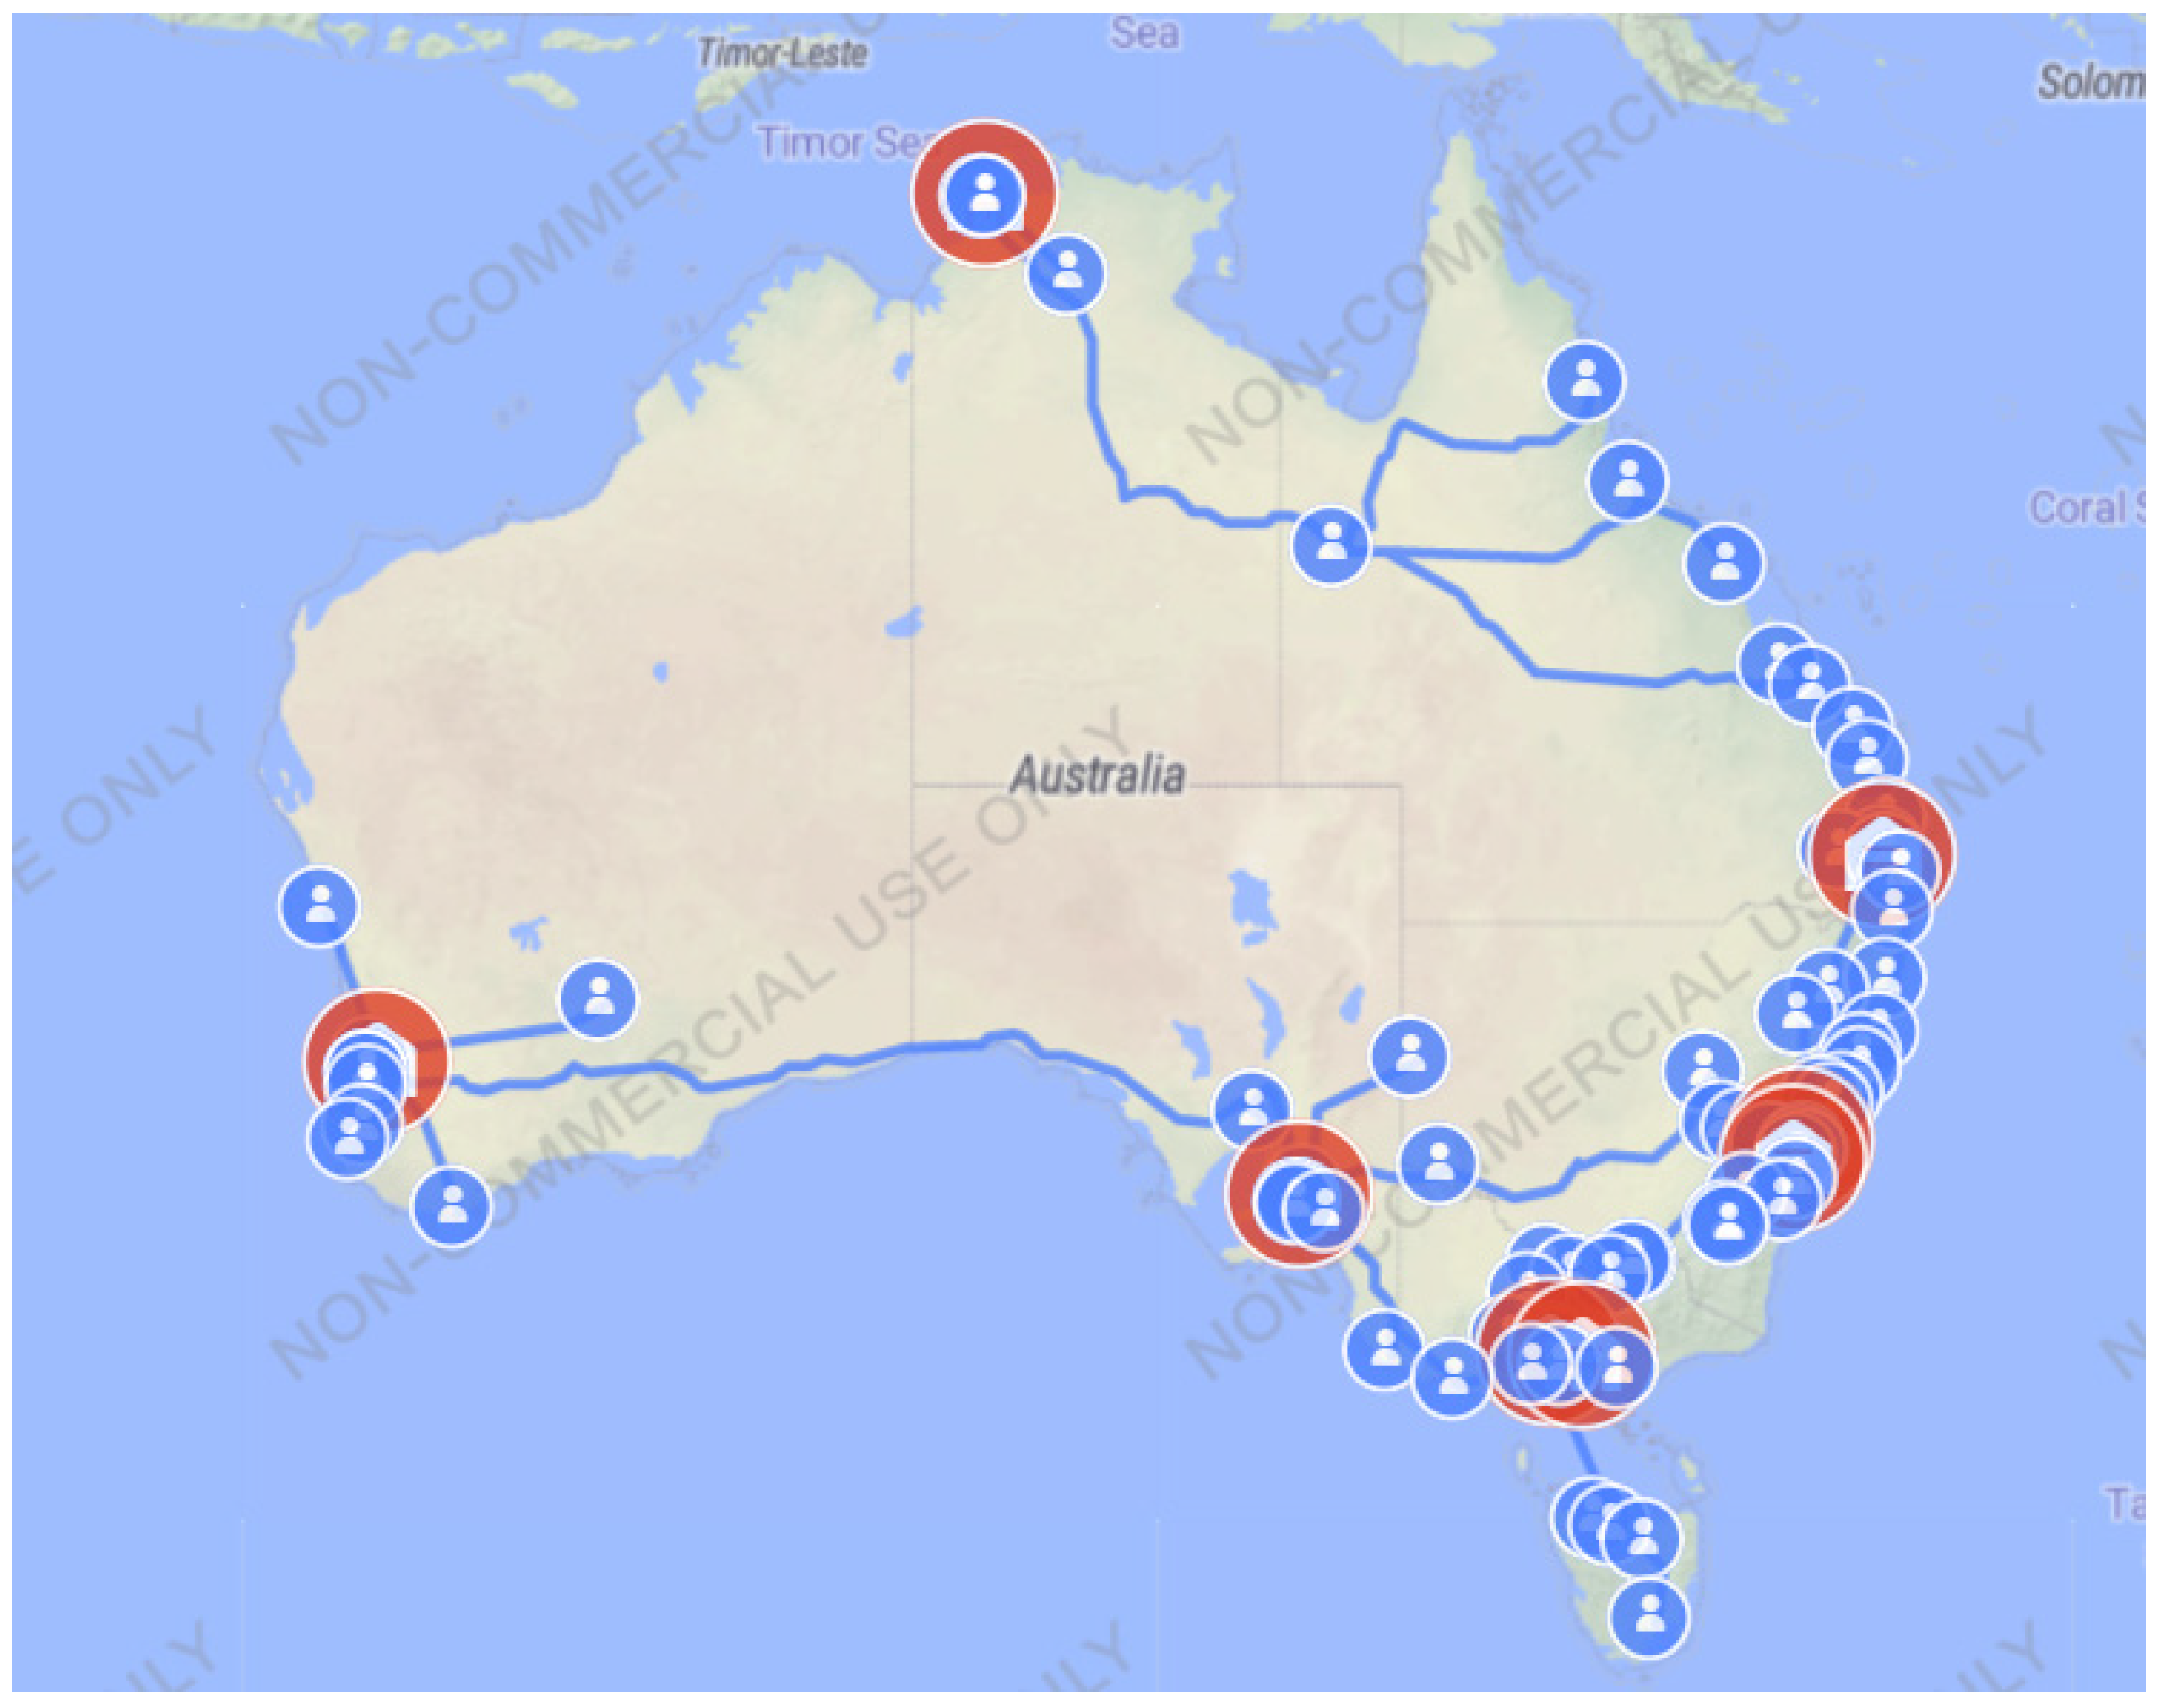
The supply chain map under ideal situations is presented in Figure 2. The product flow is presented in Table 5. We observe that all retailers received the products according to their demands under ideal situations.

4.2. Results for Supply Chain Plans Under Increased Demand with No Strategies

To analyse the impacts of the demand changes, we solved the model presented in Section 3.2. We assumed that the demand increased by 10%. Hence, the annual demand was 438,142 units. We also considered the penalty cost for not meeting the demand, p = 550.
We simulated the model and found that demand fulfilment was reduced to 91.36%. Total profit was also reduced to AUD 176,803,869.98 as a significant penalty cost of AUD 20,812,000 has been imposed in the system. This penalty cost is significant as the system was not capable of meeting the increased demand, and the total profit fell to AUD 176,803,869.98.
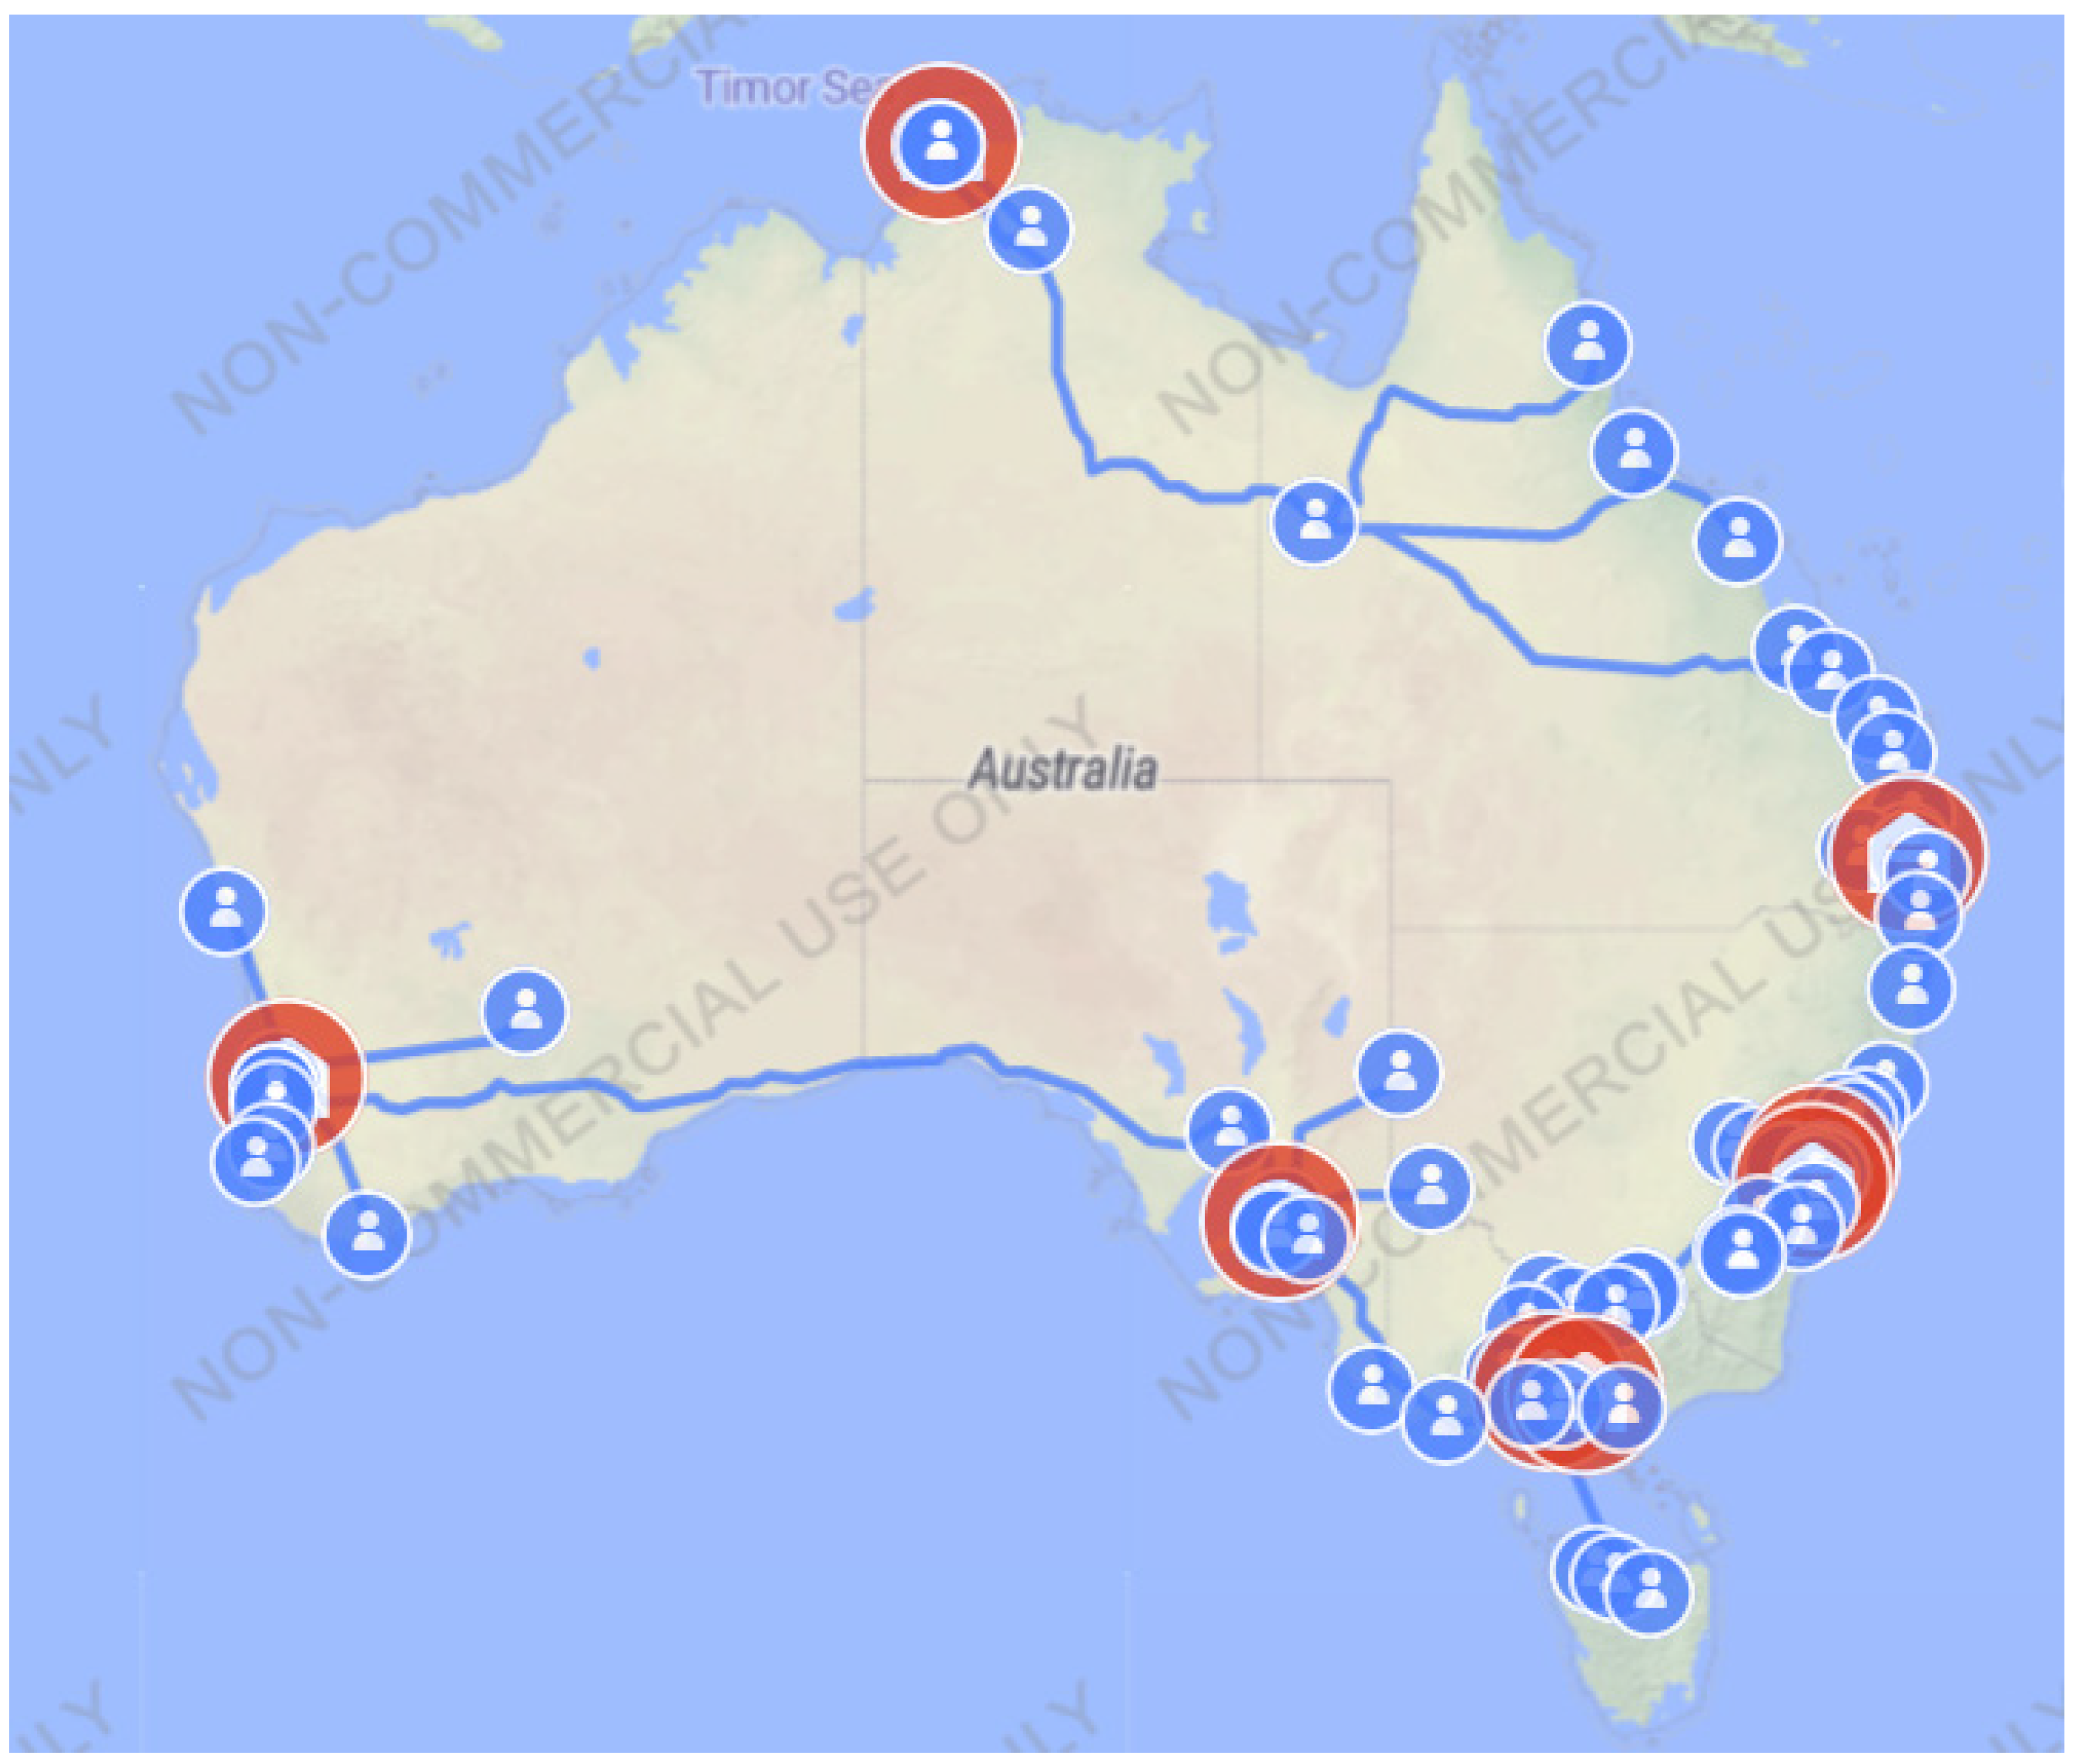
The map of supply chain plans for increased demand with no strategies is presented in Figure 3. The product flow from DCs to retailers is presented in Table A1 of Appendix A. We have observed that retailers located in Port Macquarie, Forster, and Coffs Harbour have received fewer quantities than their demand. Hence, the demand fulfilment is reduced.

4.3. Results for Supply Chain Plans Under Increased Demand with Circular Strategies

To analyse the results for supply chain plans under increased demand and the usefulness of circular strategies, we solve the model presented in Section 3.3. We assume the following data for circular strategies.
We assume that the demand has increased by 10%. The quantity collected and repaired in repair centres is 2500. The quantity collected and inspected in reuse centres is 3500.
After simulating the model, we have observed that the demand fulfilment improves significantly to 99.58% and total profit increases to AUD 231,788,877.017. The penalty cost decreases to AUD 1,012,000 due to an improvement in demand fulfilment. This is because quantities from repair and reuse centres help mitigate the increased demand.
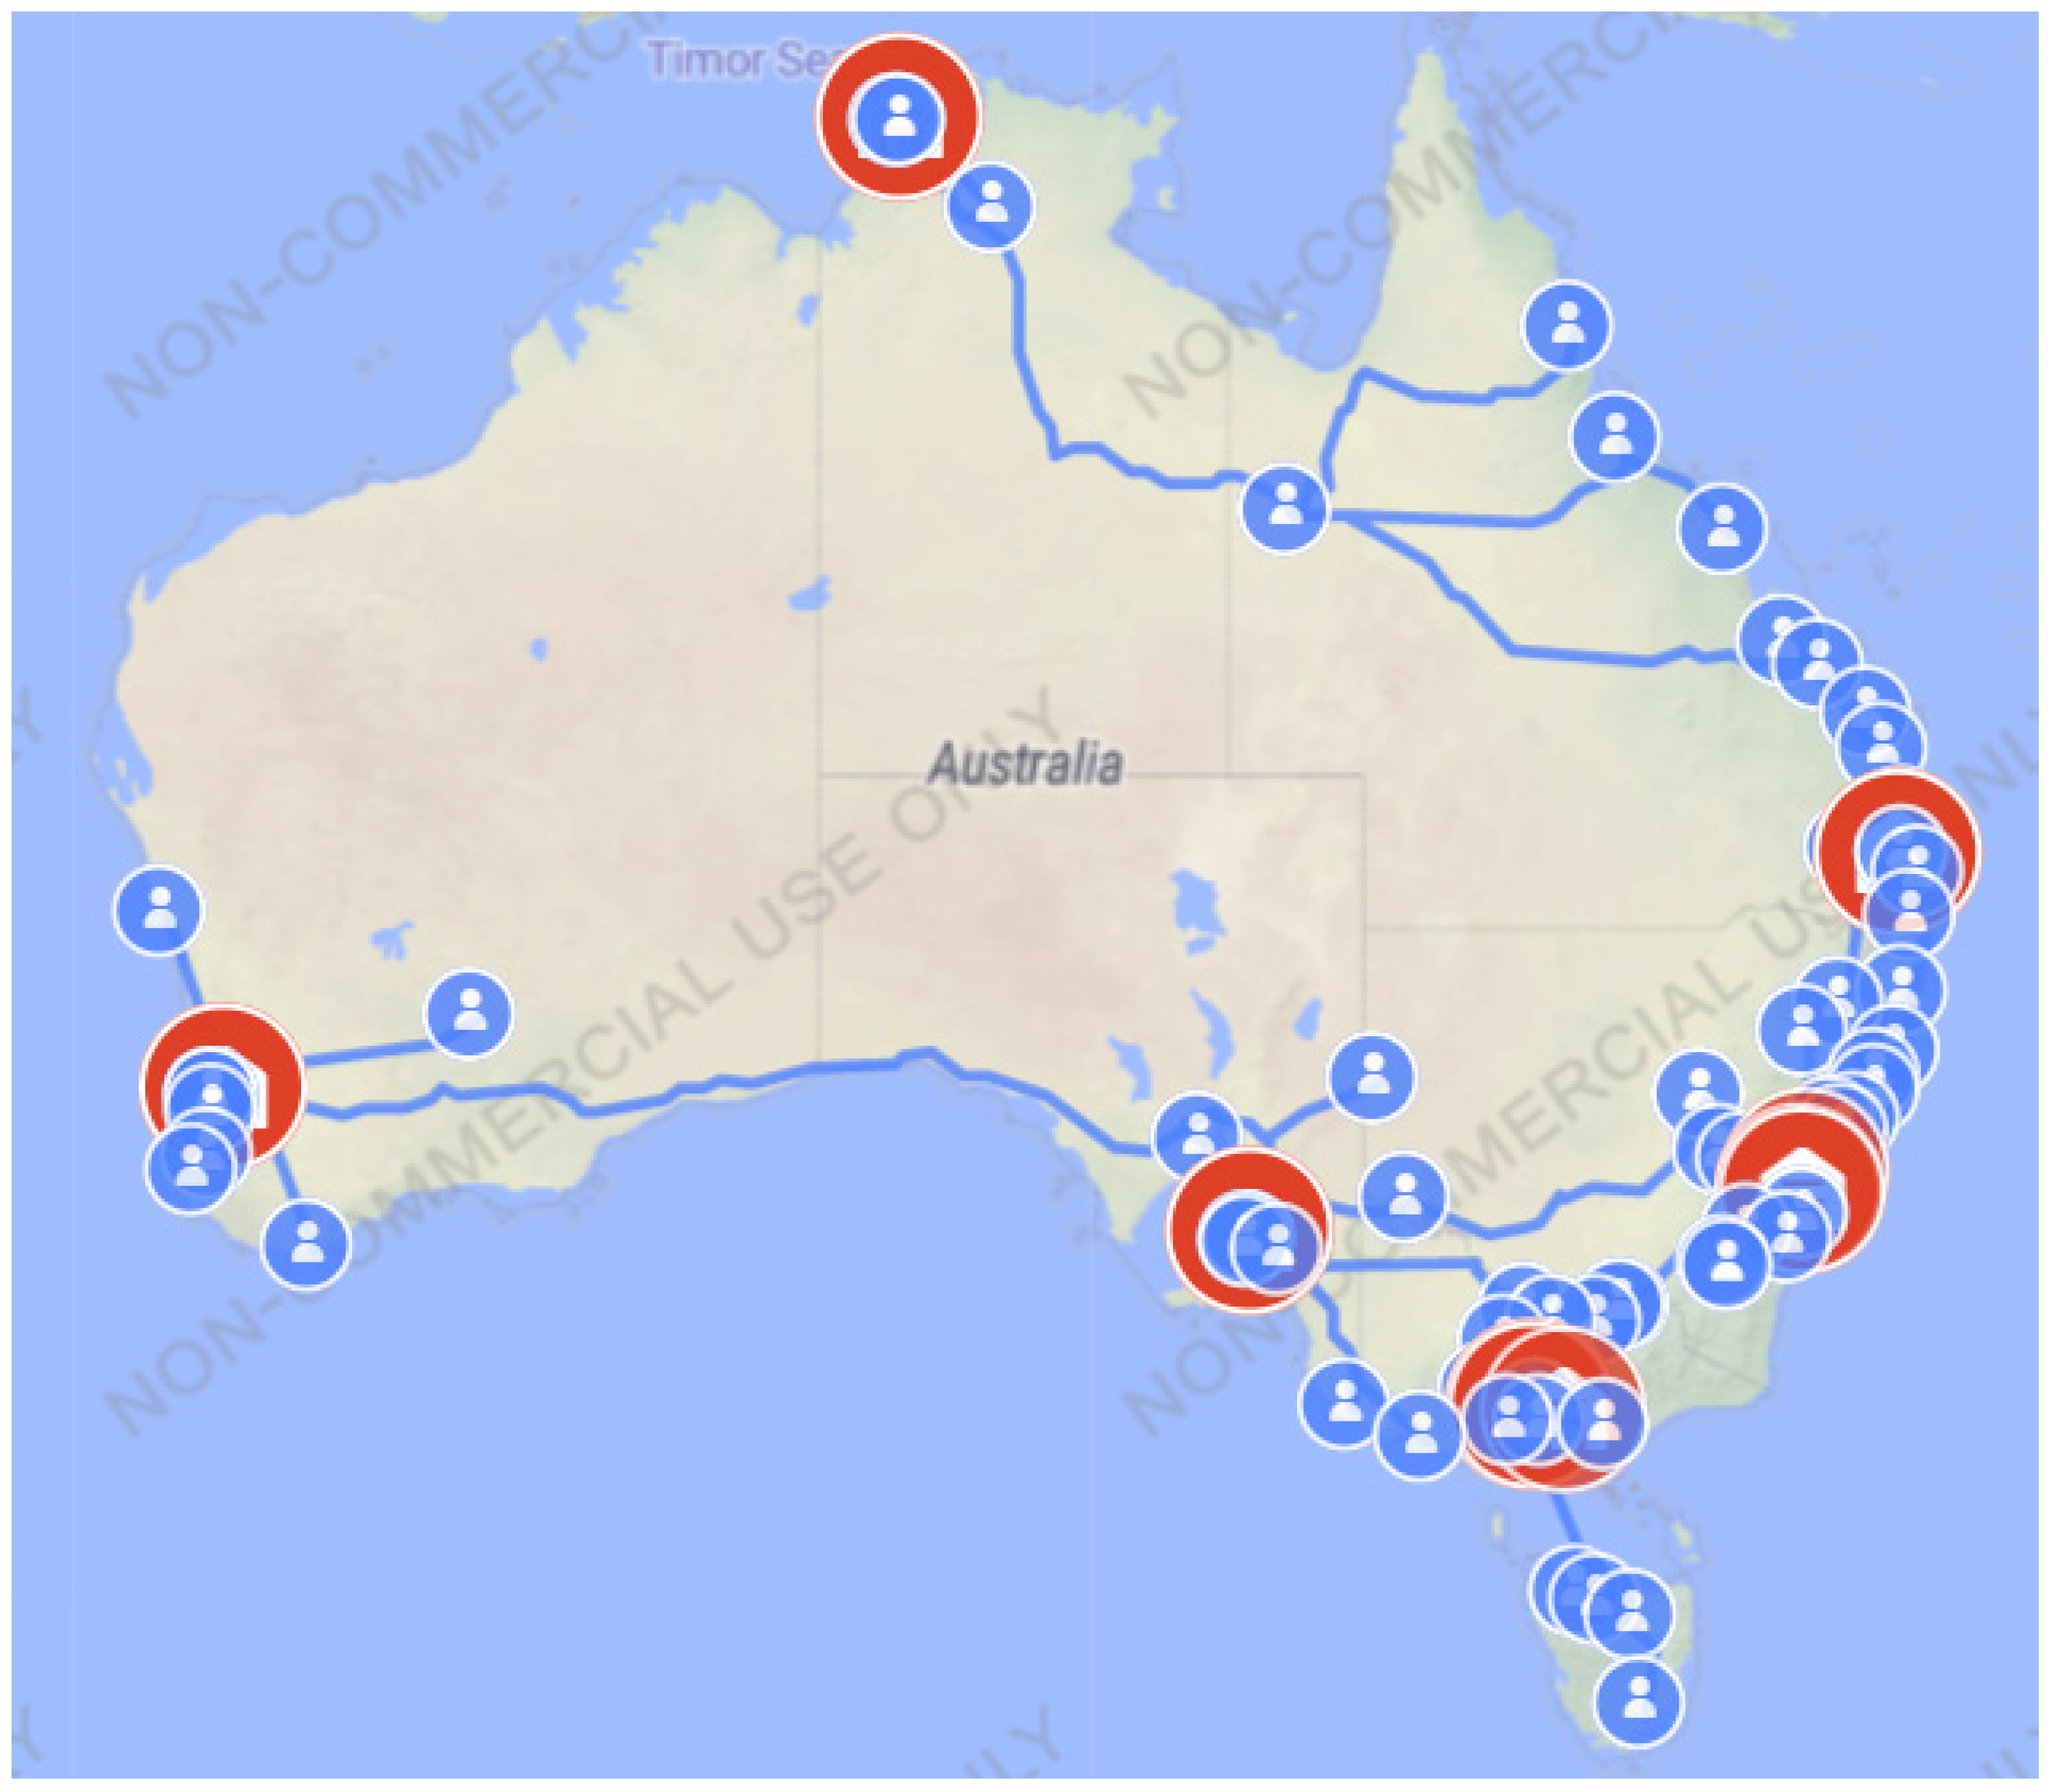
The map of supply chains for increased demand with circular strategies is presented in Figure 4. Table A2 of Appendix A presents the product flow. We have observed that only the retailer at Port Macquarie has received fewer quantities than its demand. Hence, the demand fulfilment is increased compared to the situation with no strategies and the penalty cost is reduced significantly.
Demand fulfilment is a performance indicator of supply chain resilience. Hence, circular strategies help mitigate demand increases and improve resilience by improving demand fulfilment and profitability.

4.4. Comparison of Results

To analyse the usefulness of circular strategies, repair, and reuse, we compare the results obtained from three different models presented in Section 3. The comparative findings are presented in Table 6. From the comparison, it is clear that the impacts of increased demand are significant if not mitigated appropriately. If no strategies are implemented to mitigate the increased demand, the total profit falls to AUD 176,803,869.98 and demand fulfilment falls to 91.36%. Hence, a significant penalty cost (AUD 20,812,000) has been imposed because of not meeting the demand. It is also clear that circular strategies are very effective in mitigating the increased demand, improving demand fulfilment, revenue, and profit, and reducing penalty costs for not satisfying the demand. The implementation of circular strategies improves demand fulfilment to 99.58% and total profit to AUD 231,788,877.02 due to satisfying the increased demand.

5. Sensitivity Analysis

In this section, we conduct a sensitivity analysis for key variables to analyse their impacts on outcomes. We have selected the rate of increased demand, repair quantity, reuse quantity, and buying price to analyse how changing the values of the variables impacts total cost, total profit, and demand fulfilment. For this analysis, we consider the model for the increased demand with circular strategies and change the values of one variable at a time. We keep the other variables’ values constant.

5.1. Sensitivity Analysis for the Rate of Increased Demand

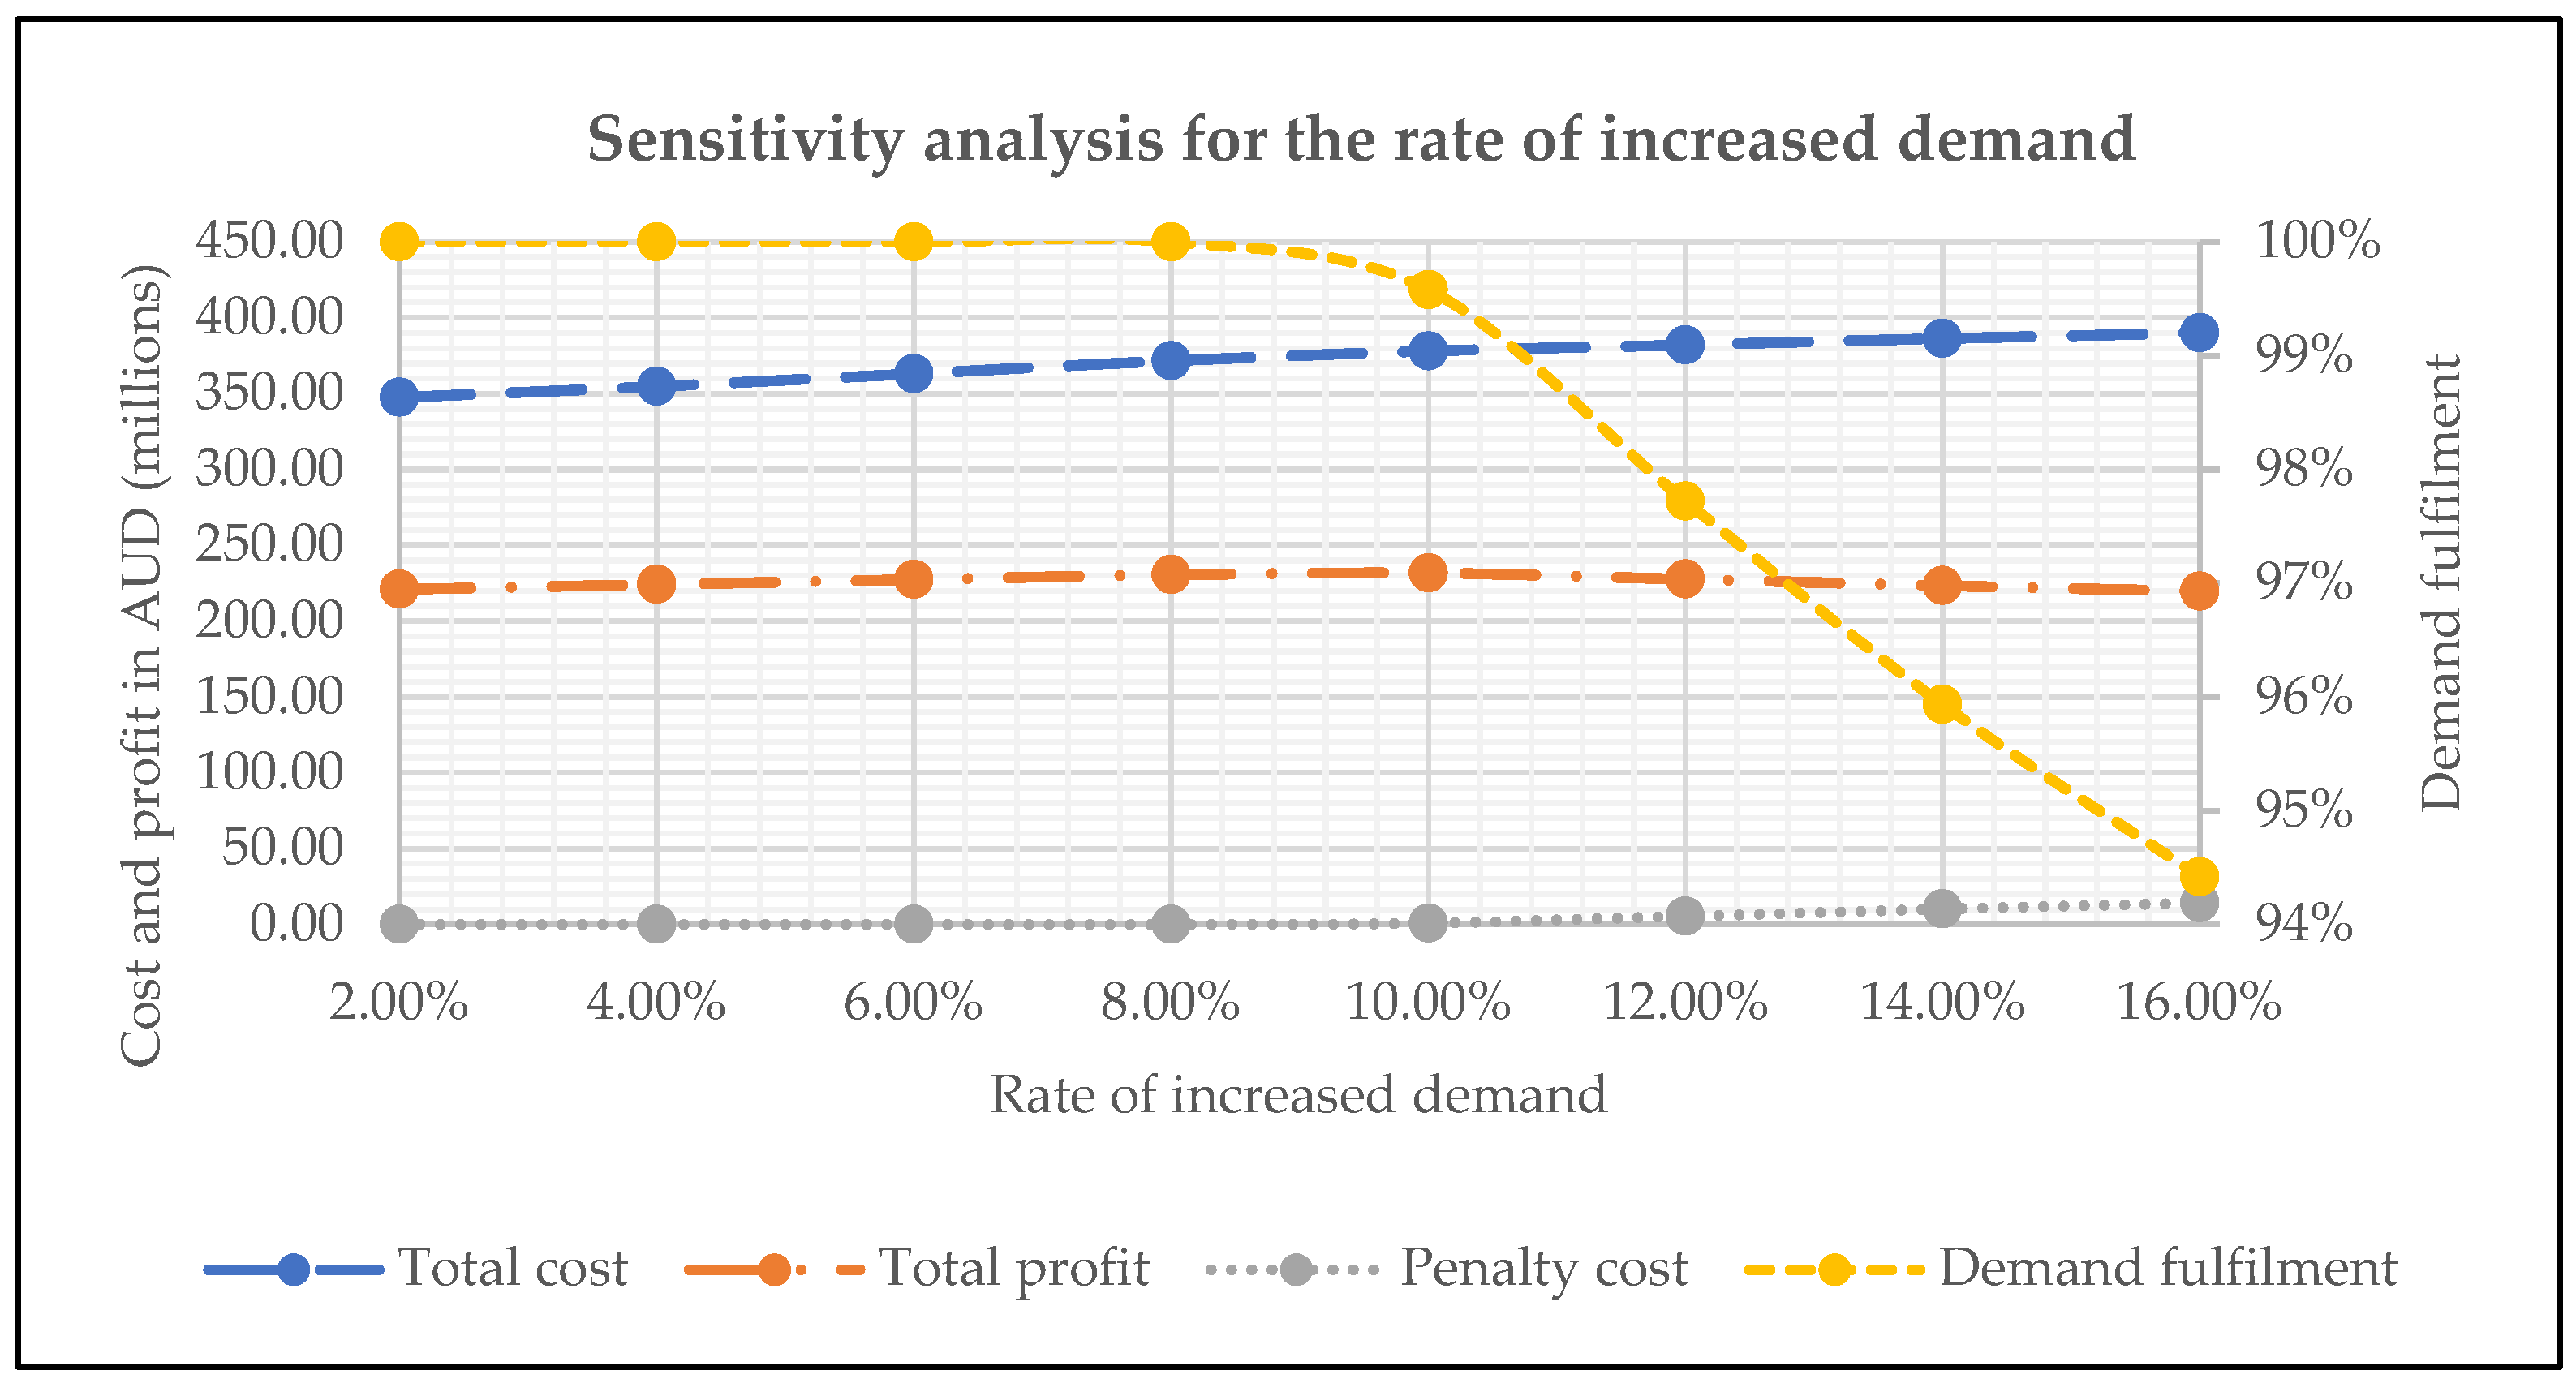
In this section, we analyse the impacts of the rate of increased demand on cost, profit, and demand fulfilment, which is presented in Figure 5.
We have observed that if the demand is increased up to 8%, it can be fully mitigated by repair and reuse quantities. Hence, demand fulfilment remains at 100% and no penalty cost is imposed. Accordingly, the total profit increases.
However, when the rate of increased demand becomes 10%, we have observed that the demand fulfilment decreases to 99.58% and penalty cost is introduced in the system. Hence, the increase in the total profit slows down. In this situation, both repair and reuse quantities are fully utilised to mitigate the increased demand; however, they are not capable of fully mitigating it.
When the rate of increased demand becomes more than 10%, we have observed that the demand fulfilment decreases further and more penalty cost is imposed in the system. Hence, the total profit decreases further due to not fulfilling the demand. In this situation, both repair and reuse quantities are also fully utilised. However, they are useful in mitigating the increased demand partially.

5.2. Sensitivity Analysis for Repair Quantity

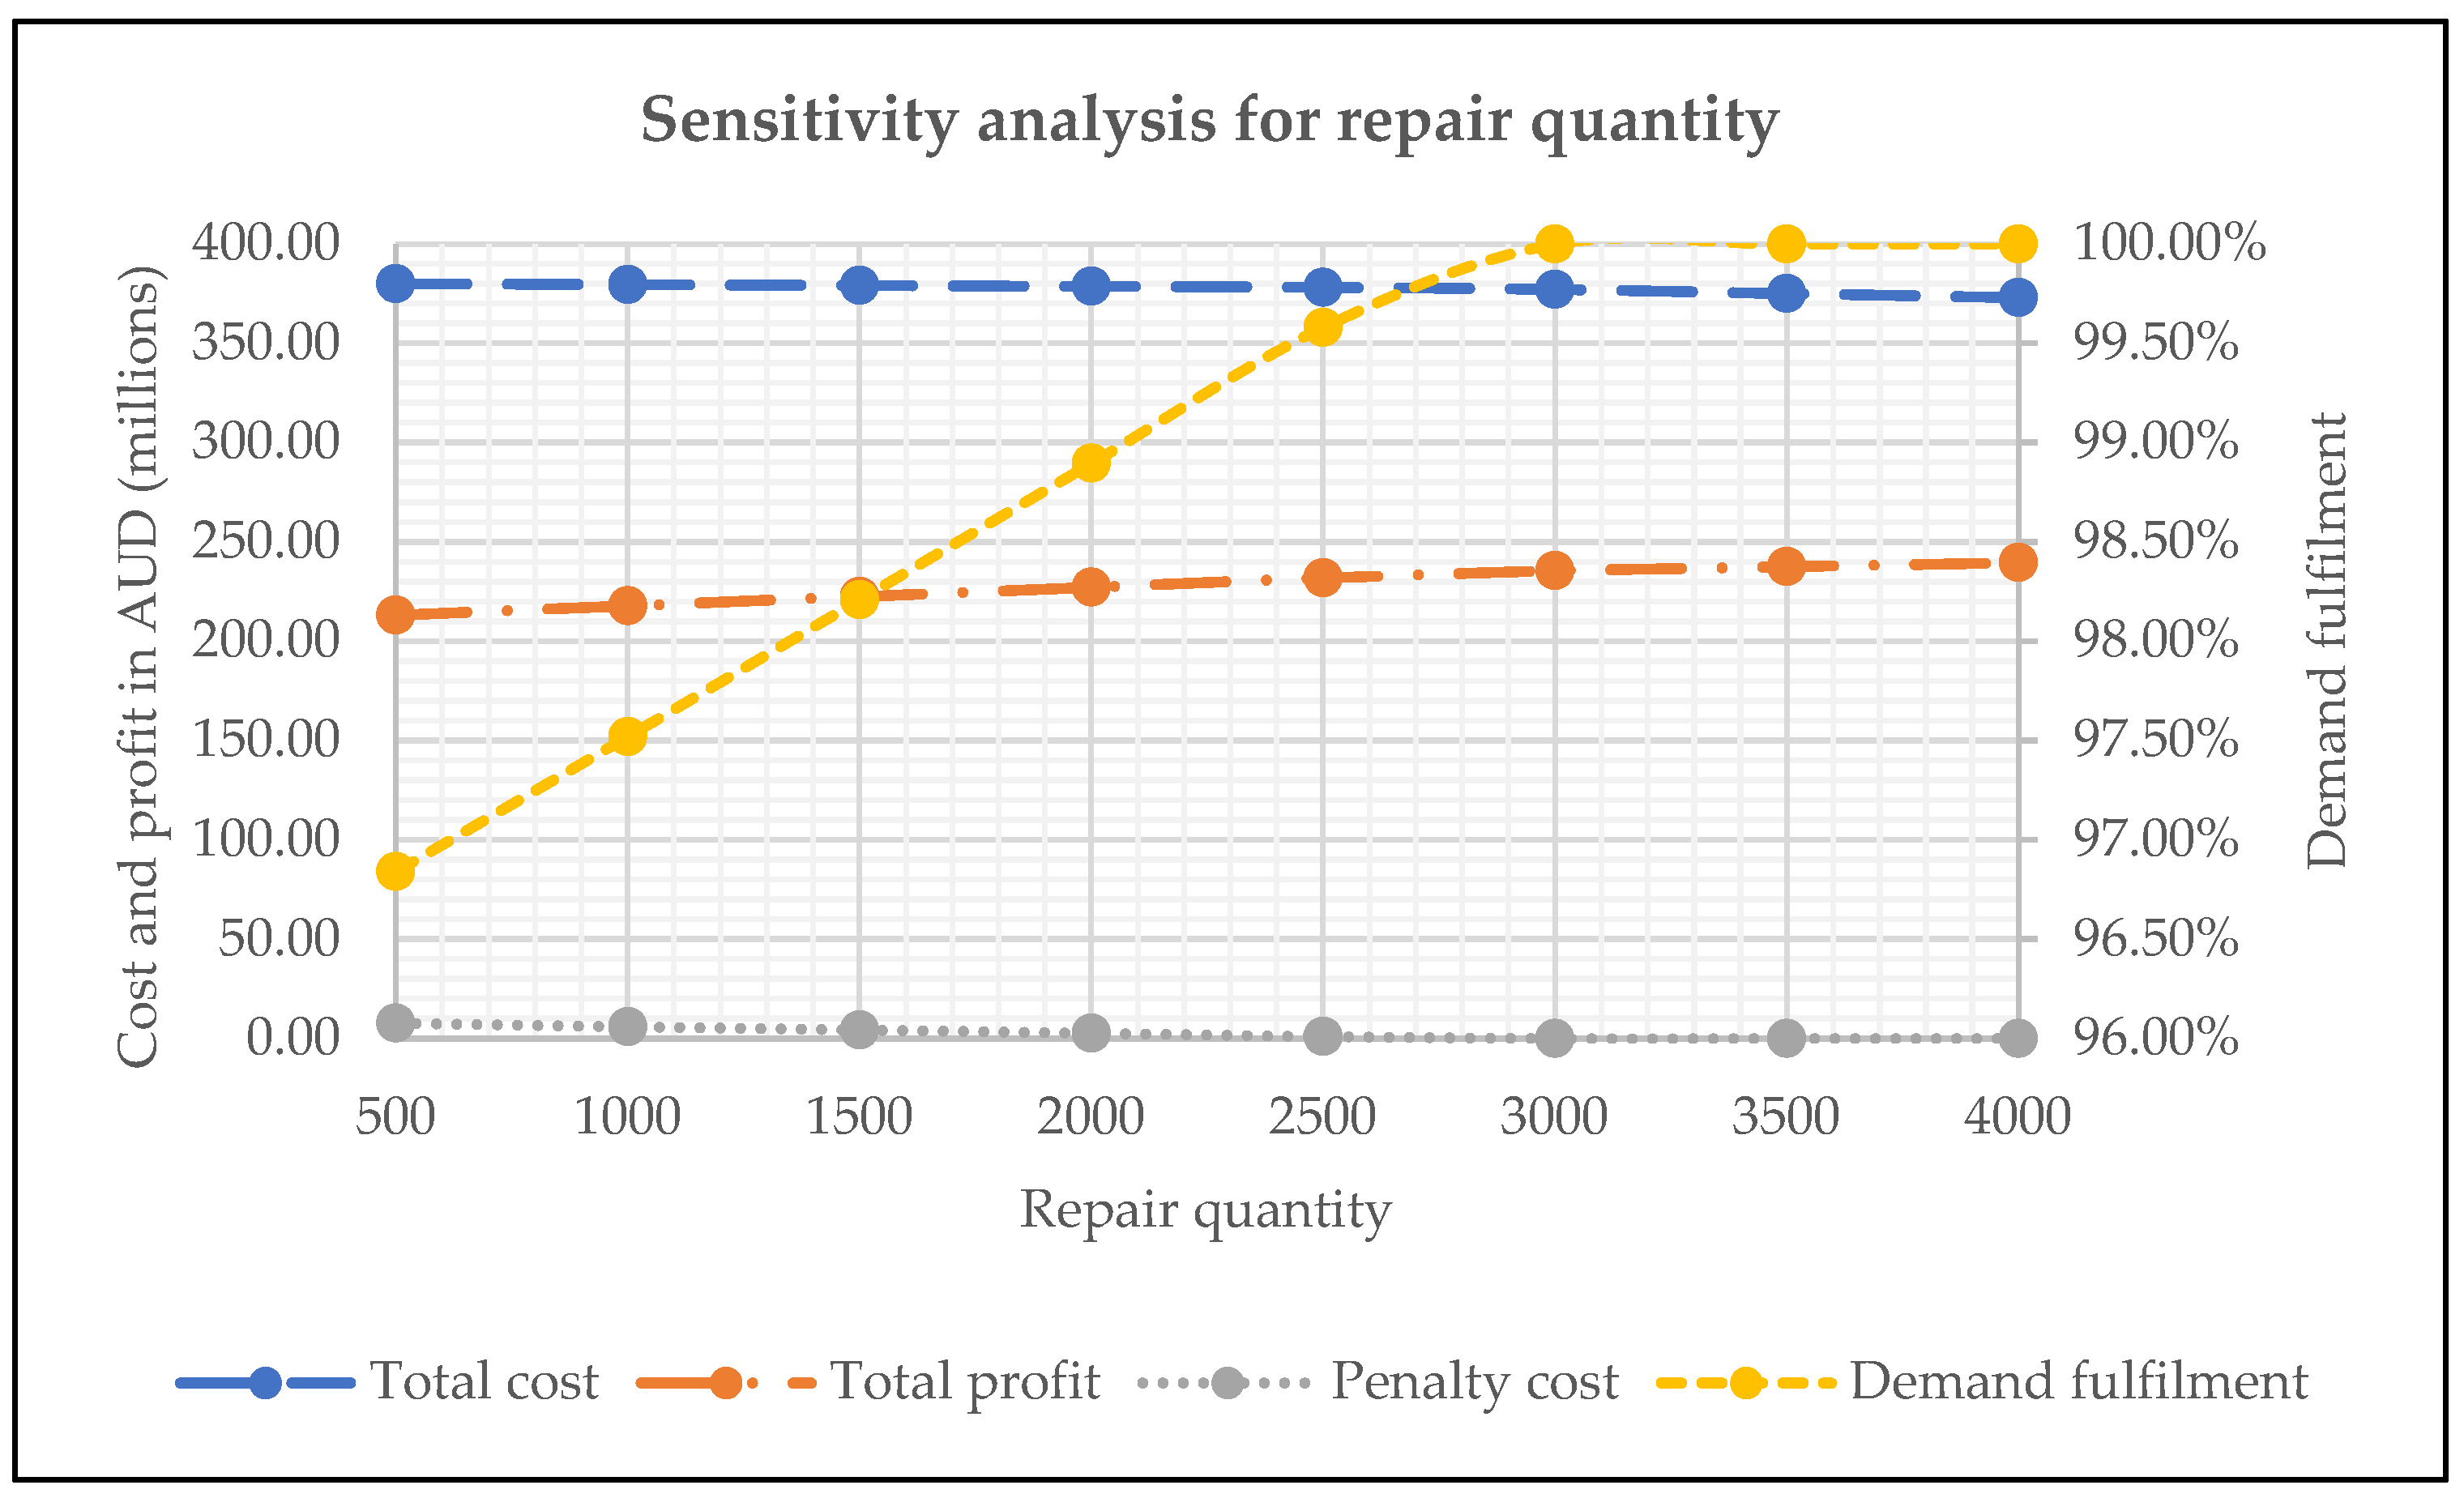
In this section, we explore the impacts of repair quantity on the cost, profit, and demand fulfilment. Figure 6 presents the sensitivity analysis for the repair quantity.
We have observed that if the repair quantities are less than 3000, the demand fulfilment remains less than 100% and a penalty cost is imposed. However, when increasing the repair quantities, the demand fulfilment increases and penalty cost falls. Hence, the total profit increases. In this situation, repair quantities are fully utilised, but they are not capable of mitigating the increased demand fully.
When the repair quantities are more than 3000, we have observed that they are capable of satisfying the increased demand fully. Hence, the demand fulfilment becomes 100% and the penalty cost becomes 0. In this situation, the total profit increases further due to satisfying the demand fully.

5.3. Sensitivity Analysis for Reuse Quantity

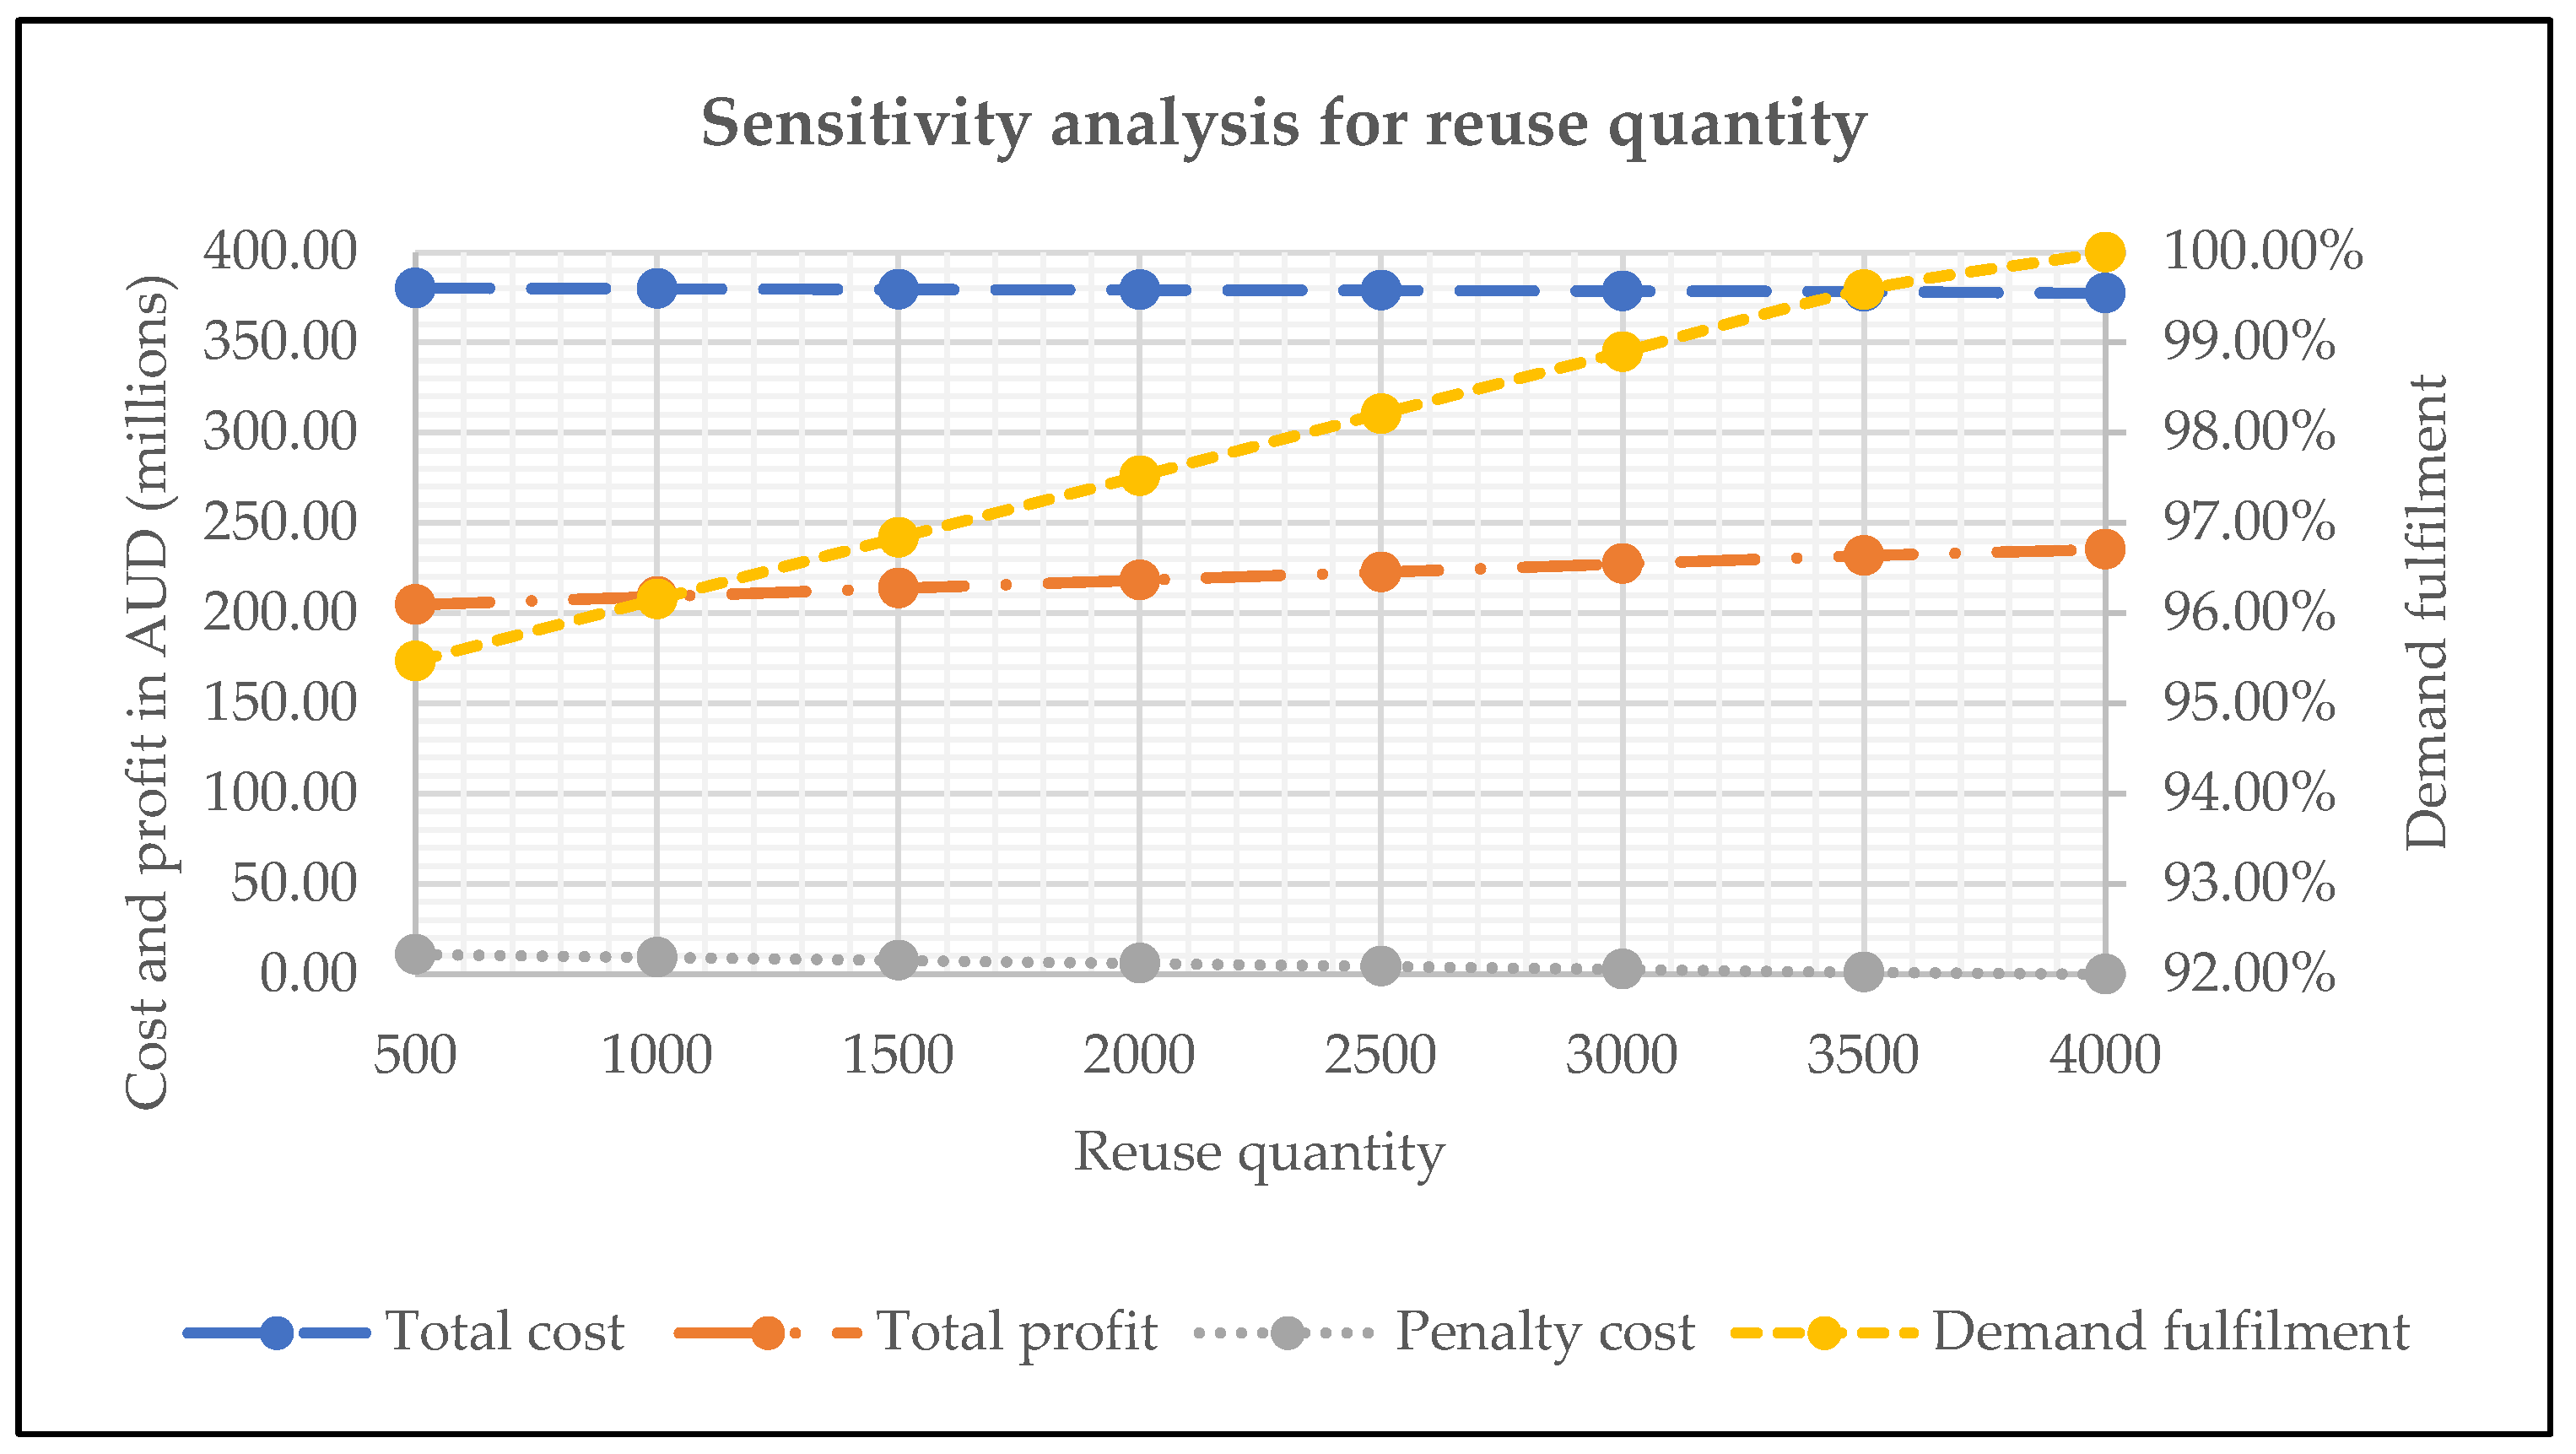
We have observed that the reuse quantities have a positive impact on mitigating the increased demand. Figure 7 presents the impacts of reuse quantities on cost, profit, and demand fulfilment in mitigating the increased demand.
When the reuse quantities are less than 4000, the demand fulfilment is less than 100% and there is a penalty cost in the system due to not satisfying demand fully. However, increasing the repair quantities improves the demand fulfilment and reduces the penalty cost. Hence, the total profit increases with an increase in reuse quantities.
When the reuse quantity becomes 4000, the system is capable of fulfilling the increased demand by 100% using the reuse quantities. Hence, the penalty cost becomes 0. In this situation, the total profit increases further.

5.4. Sensitivity Analysis for the Buying Price

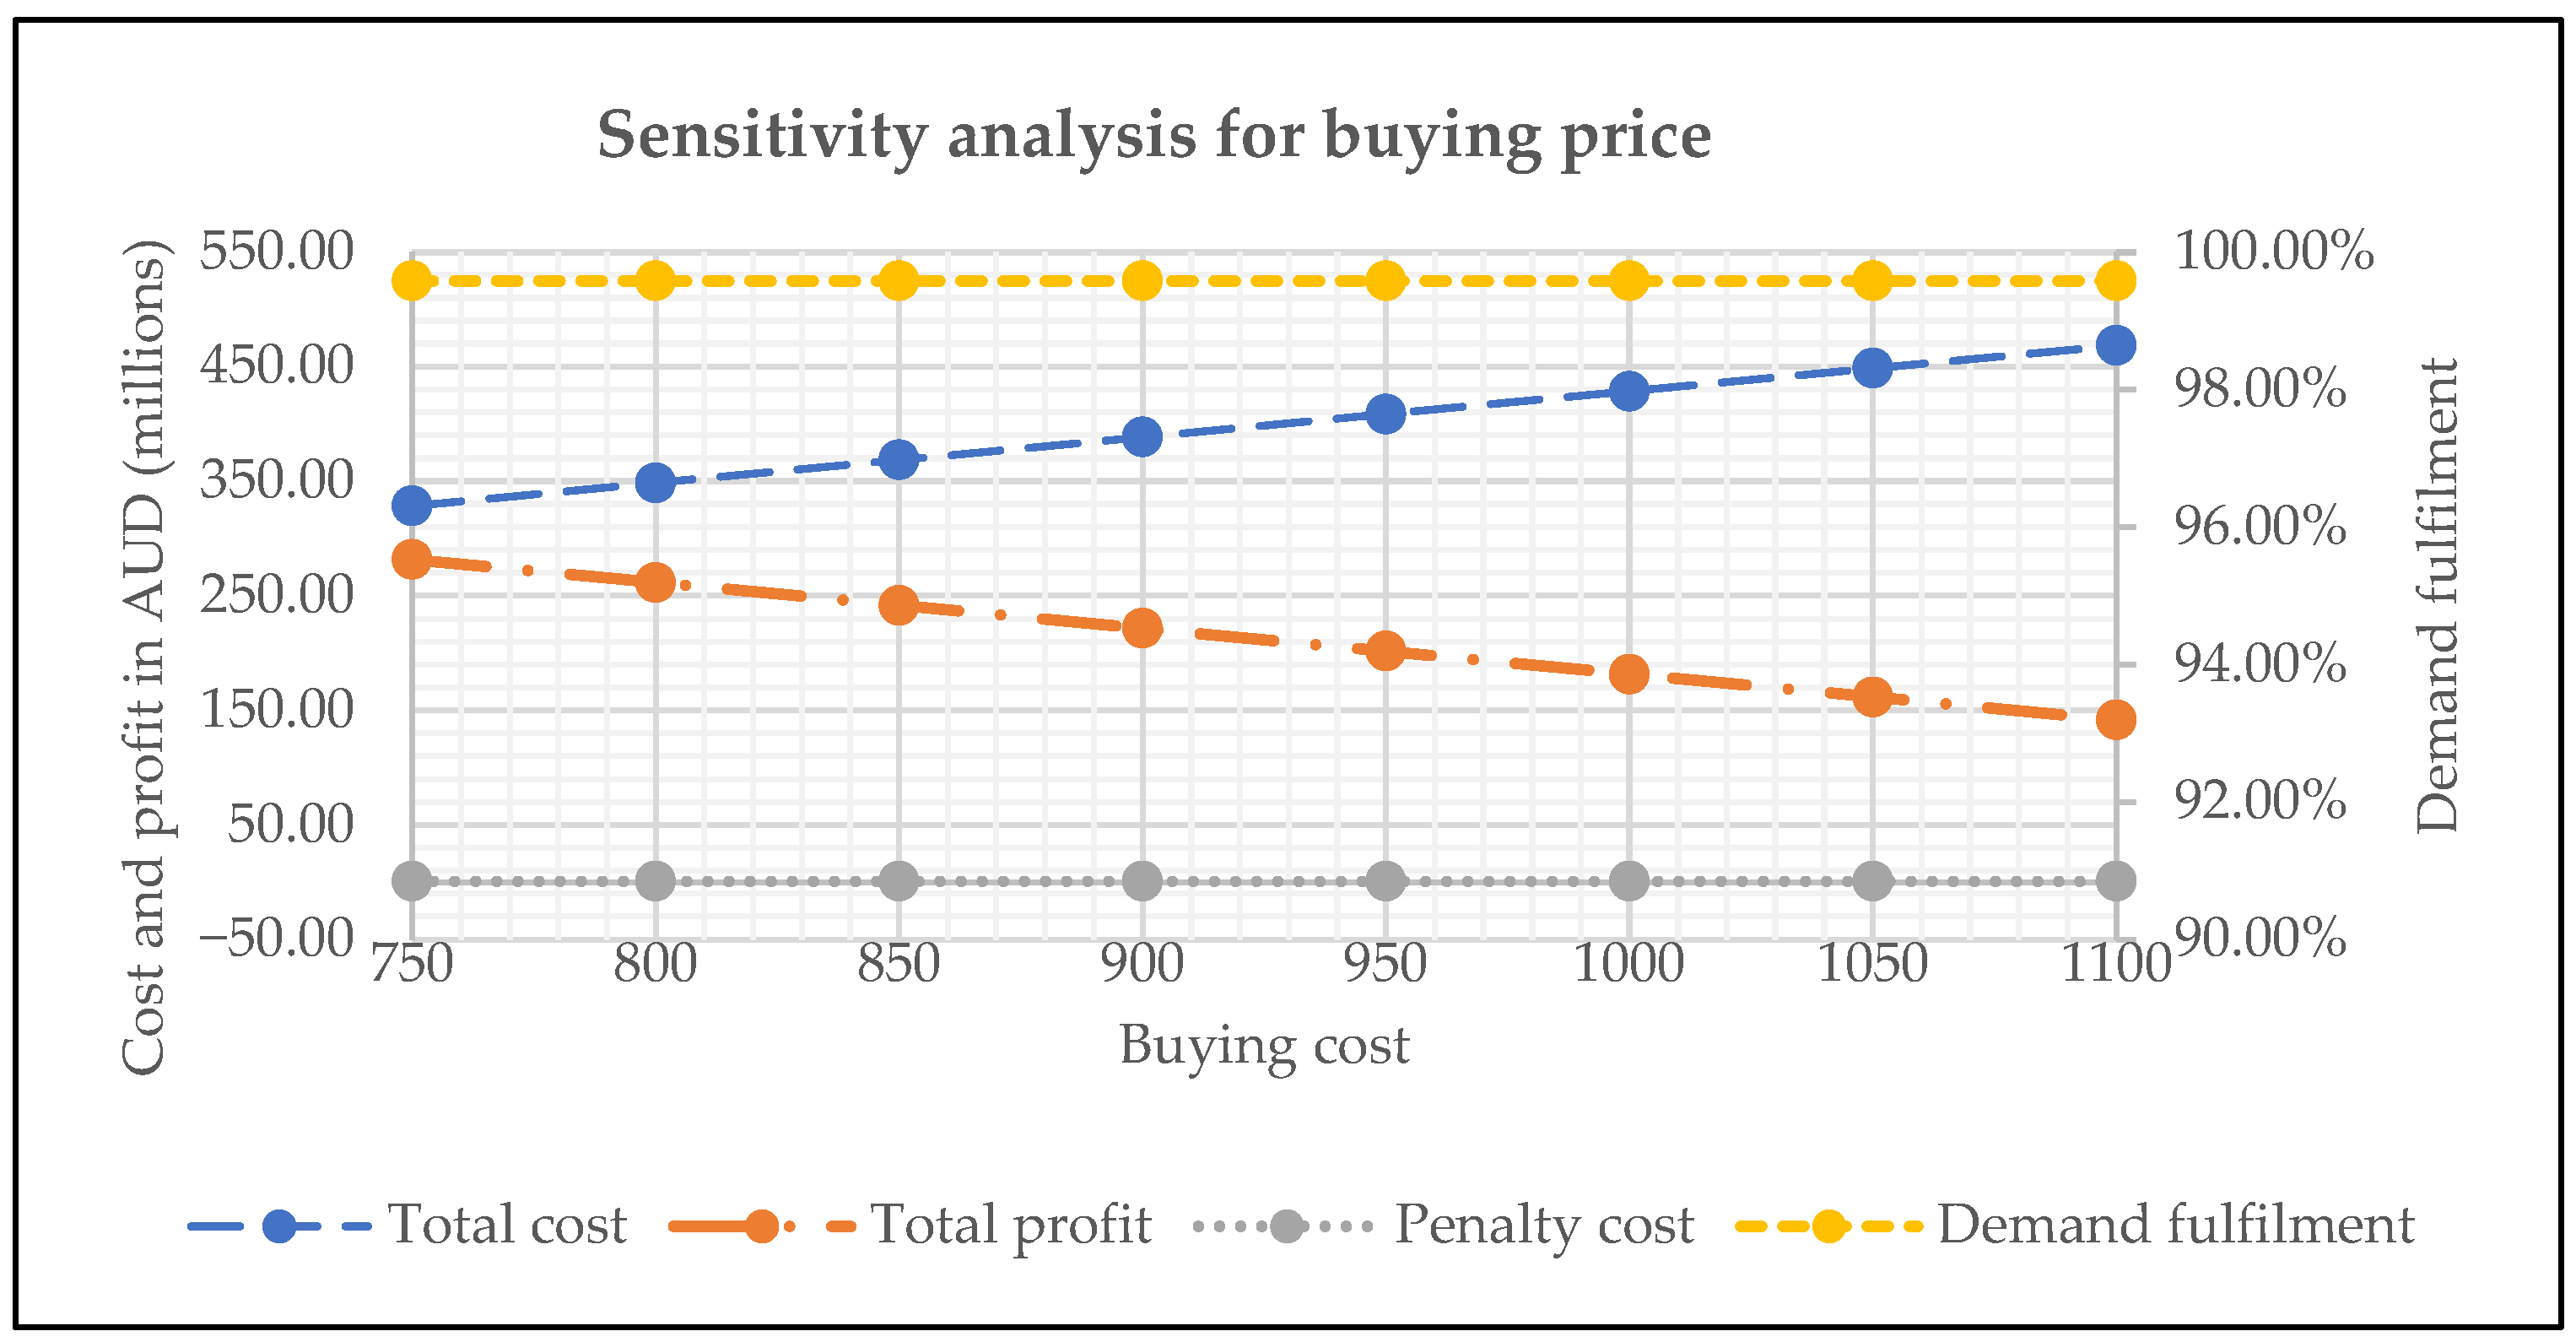
In this section, we investigate the impacts of the buying price on cost, profit, and demand fulfilment. Figure 8 presents the sensitivity analysis for the buying price.
We have observed that the buying price does not impact the demand fulfilment and penalty cost, as it has no role in mitigating the increased demand.
However, the buying price impacts the other costs and the total profit. With an increase in the buying price, the total cost increases and the total profit decreases.

6. Practical Implications

In this study, we consider major circular strategies, repair and reuse, to mitigate increased demand for smartphone distribution in Australia. Repair and reuse strategies are applicable when the used products do not need to be remanufactured from parts and they can be sold as a refurbished item after repair or inspection (reuse). These strategies are well-suited for smartphones. However, how the use of repair and reuse strategies can help improve demand fulfilment and profit and reduce the penalty costs for not meeting demand has not been explored yet. This study took the first steps to quantitatively validate the use of circular strategies for meeting increased demand.
From the results and sensitivity analyses, it is clear that both repair and reuse strategies are effective in mitigating the increased demand for smartphones. In the future, the demand for smartphones will increase over time [52]. It is recommended that practitioners utilise repair and reuse strategies to satisfy some extra demand, which will improve the circular performance of their supply chains and also improve their resilience by fulfilling the increased demand. It is also recommended to establish supporting infrastructures such as collection, repair, and reuse centres and logistics systems for implementing the circular strategies. It will bring long-term financial and reputational benefits to the organisation and, most importantly, it will have a competitive advantage in the market due to having a more resilient plan to mitigate the increased demand.
Decision-makers can also utilise the models we developed in this study to make their decisions on the level of circular strategies. Although both strategies are effective in mitigating the increased demand for smartphones, it may be possible that one strategy is more effective than the other. It also depends on the quality of collected used smartphones. Some collected smartphones may not be repairable, which should be disregarded for the analysis. It is also possible that the costs of repair and inspection become higher over time. Decision-makers should focus on all these scenarios and possible changes and update their models and decisions accordingly.

7. Conclusions and Future Research Directions

The main objective of this study was to investigate the benefit of circular strategies to mitigate increased demand. To achieve this objective, we develop mathematical models and simulation approaches and analyse the results for the distribution of an Australian smartphone. The contribution of this study is significant as it takes the first step to investigate the improvement in demand fulfilment and total profit to mitigate the increased demand by using circular strategies.
The results indicate that if the organisation does not implement any circular strategies to mitigate the increased demand for smartphones, it will lose revenue and profit and demand fulfilment will be hurt. It will also incur significant penalty costs, which will damage the reputation of the organisation. The results also indicate significant benefits of using circular strategies, such as repair and reuse, in improving revenue and profit and demand fulfilment. The major indicator of resilience, demand fulfilment, increases to 99.58% from 91.36% after implementing repair and reuse strategies to mitigate the 10% increase in demand for smartphones. Moreover, implementing circular strategies can help improve the sustainable consumption and performance of supply chains through the use of the repair and reuse of products.
There are a few limitations of this study. First, it considers repair and reuse strategies for the analysis. Second, it considers a single model of smartphone and a two-stage supply chain consisting of DCs and retailers. In the future, these limitations can be overcome by incorporating other circular strategies, such as remanufacturing and recycling, to make the findings more realistic. It can be further extended considering a multi-echelon supply chain with suppliers, manufacturers, distributors, and retailers for multiple types of products.

Author Contributions

Conceptualization, A.P. and S.C.S.; methodology, A.P.; formal analysis, A.P.; writing—original draft preparation, A.P.; writing—review and editing, A.P. and S.C.S.; supervision, S.C.S. All authors have read and agreed to the published version of the manuscript.

Funding

This research received no external funding.

Data Availability Statement

Data is provided within the article.

Acknowledgments

This research is supported by an Australian Government Research Training Program Scholarship.

Conflicts of Interest

The authors declare no conflicts of interest.

Appendix A. Product Flow Under Different Situations

Table A1. Product flow for increased demand with no strategies.
From (DCs)To (Retailers)Quantity
Melbourne 2Retailer Traralgon5473
Melbourne 2Retailer Albury5473
Melbourne 2Retailer Balwyn North5473
Melbourne 2Retailer Wangaratta5473
Melbourne 2Retailer Shepparton5473
Melbourne 2Retailer Canberra2972
Melbourne 2Retailer Glen Iris5473
Melbourne 2Retailer Melbourne3244
Melbourne 2Retailer Wodonga5473
Melbourne 2Retailer Frankston East5473
Sydney 2Retailer Katoomba1758
Sydney 2Retailer Orange5473
Sydney 2Retailer Bathurst5473
Sydney 2Retailer Epping5473
Sydney 2Retailer Hornsby5473
Sydney 2Retailer Port Stephens5473
Sydney 2Retailer Forster4458
Sydney 2Retailer Newcastle5473
Sydney 2Retailer Maitland5473
Sydney 2Retailer City of Parramatta5473
Sydney 1Retailer Wollongong5473
Sydney 1Retailer Liverpool5473
Sydney 1Retailer Nowra5473
Sydney 1Retailer Sydney5473
Sydney 1Retailer Katoomba3715
Sydney 1Retailer Queanbeyan5473
Sydney 1Retailer Canberra2501
Sydney 1Retailer Strathfield5473
Sydney 1Retailer Parramatta5473
Sydney 1Retailer Goulburn5473
Melbourne 1Retailer Devonport5473
Melbourne 1Retailer Launceston5473
Melbourne 1Retailer Burnie5473
Melbourne 1Retailer Ballarat5473
Melbourne 1Retailer Warrnambool3987
Melbourne 1Retailer Echuca5473
Melbourne 1Retailer Melbourne2229
Melbourne 1Retailer Bendigo5473
Melbourne 1Retailer Geelong5473
Melbourne 1Retailer St Albans5473
AdelaideRetailer Prospect5473
AdelaideRetailer Gawler5473
AdelaideRetailer Murray Bridge5473
AdelaideRetailer Adelaide Hills5473
AdelaideRetailer Whyalla4730
AdelaideRetailer Warrnambool1486
AdelaideRetailer Mildura5473
AdelaideRetailer Adelaide5473
AdelaideRetailer Broken Hill5473
AdelaideRetailer Mount Gambier5473
PerthRetailer Kwinana5473
PerthRetailer Rockingham5473
PerthRetailer Albany5473
PerthRetailer Whyalla743
PerthRetailer Busselton5473
PerthRetailer Geraldton5473
PerthRetailer Bunbury5473
PerthRetailer Perth5473
PerthRetailer Kalgoorlie5473
PerthRetailer Mandurah5473
DarwinRetailer Cairns5473
DarwinRetailer Gladstone5473
DarwinRetailer Palmerston5473
DarwinRetailer Alice Springs5473
DarwinRetailer Mackay5473
DarwinRetailer Bundaberg743
DarwinRetailer Mount Isa5473
DarwinRetailer Townsville5473
DarwinRetailer Darwin5473
DarwinRetailer Rockhampton5473
BrisbaneRetailer Coffs Harbour1486
BrisbaneRetailer Maryborough5473
BrisbaneRetailer Lismore5473
BrisbaneRetailer Woodridge5473
BrisbaneRetailer Gold Coast5473
BrisbaneRetailer Brisbane5473
BrisbaneRetailer Caloundra5473
BrisbaneRetailer Toowoomba5473
BrisbaneRetailer Bundaberg4730
BrisbaneRetailer Logan City5473
Table A2. Product flow for increased demand with circular strategies.
From (DCs)To (Retailers)Quantity
Sydney 2Retailer Tamworth5473
Sydney 2Retailer Orange5473
Sydney 2Retailer Hornsby5473
Sydney 2Retailer Taree5473
Sydney 2Retailer Newcastle5473
Sydney 2Retailer Port Stephens5473
Sydney 2Retailer Maitland5473
Sydney 2Retailer Forster5473
Sydney 2Retailer Port Macquarie743
Sydney 2Retailer Bathurst5473
AdelaideRetailer Adelaide5473
AdelaideRetailer Prospect5473
AdelaideRetailer Adelaide Hills5473
AdelaideRetailer Dubbo5473
AdelaideRetailer Murray Bridge5473
AdelaideRetailer Mildura5473
AdelaideRetailer Echuca2540
AdelaideRetailer Gawler5473
AdelaideRetailer Broken Hill4203
AdelaideRetailer Warrnambool5473
AdelaideRetailer Mount Gambier5473
PerthRetailer Geraldton5473
PerthRetailer Busselton5473
PerthRetailer Albany5473
PerthRetailer Mandurah5473
PerthRetailer Whyalla5473
PerthRetailer Rockingham5473
PerthRetailer Kwinana5473
PerthRetailer Kalgoorlie5473
PerthRetailer Broken Hill1270
PerthRetailer Perth5473
PerthRetailer Bunbury5473
Melbourne 1Retailer Burnie5473
Melbourne 1Retailer Devonport5473
Melbourne 1Retailer Bendigo5473
Melbourne 1Retailer St Albans5473
Melbourne 1Retailer Launceston5473
Melbourne 1Retailer Echuca2933
Melbourne 1Retailer Hobart5473
Melbourne 1Retailer Melbourne5473
Melbourne 1Retailer Shepparton3810
Melbourne 1Retailer Geelong5473
Melbourne 1Retailer Ballarat5473
BrisbaneRetailer Brisbane5473
BrisbaneRetailer Armidale5473
BrisbaneRetailer Coffs Harbour5473
BrisbaneRetailer Gold Coast5473
BrisbaneRetailer Woodridge5473
BrisbaneRetailer Caloundra5473
BrisbaneRetailer Logan City5473
BrisbaneRetailer Port Macquarie2540
BrisbaneRetailer Maryborough4203
BrisbaneRetailer Lismore5473
BrisbaneRetailer Toowoomba5473
Melbourne 2Retailer Wangaratta5473
Melbourne 2Retailer Canberra5473
Melbourne 2Retailer Glen Iris5473
Melbourne 2Retailer Traralgon5473
Melbourne 2Retailer Albury5473
Melbourne 2Retailer Queanbeyan4553
Melbourne 2Retailer Frankston East5473
Melbourne 2Retailer Balwyn North5473
Melbourne 2Retailer Shepparton1663
Melbourne 2Retailer Wodonga5473
Sydney 1Retailer Goulburn5473
Sydney 1Retailer City of Parramatta5473
Sydney 1Retailer Parramatta5473
Sydney 1Retailer Liverpool5473
Sydney 1Retailer Epping5473
Sydney 1Retailer Wollongong5473
Sydney 1Retailer Nowra5473
Sydney 1Retailer Queanbeyan920
Sydney 1Retailer Sydney5473
Sydney 1Retailer Katoomba5473
Sydney 1Retailer Port Macquarie350
Sydney 1Retailer Strathfield5473
DarwinRetailer Alice Springs5473
DarwinRetailer Townsville5473
DarwinRetailer Bundaberg5473
DarwinRetailer Cairns5473
DarwinRetailer Gladstone5473
DarwinRetailer Palmerston5473
DarwinRetailer Darwin5473
DarwinRetailer Mount Isa5473
DarwinRetailer Rockhampton5473
DarwinRetailer Maryborough1270
DarwinRetailer Mackay5473

References

  1. Rahman, T.; Paul, S.K.; Shukla, N.; Agarwal, R.; Taghikhah, F. Supply Chain Resilience Initiatives and Strategies: A Systematic Review. Comput. Ind. Eng. 2022, 170, 108317. [Google Scholar] [CrossRef]
  2. Paul, S.K.; Sarker, R.; Essam, D. Managing Real-Time Demand Fluctuation under a Supplier–Retailer Coordinated System. Int. J. Prod. Econ. 2014, 158, 231–243. [Google Scholar] [CrossRef]
  3. Rahman, T.; Paul, S.K.; Agarwal, R.; Shukla, N.; Taghikhah, F. A Viable Supply Chain Model for Managing Panic-Buying Related Challenges: Lessons Learned from the COVID-19 Pandemic. Int. J. Prod. Res. 2024, 62, 3415–3434. [Google Scholar] [CrossRef]
  4. Lee, J.; Moon, I. An Integrated Model of Supply Chain Resilience Considering Supply and Demand Uncertainties. Int. Trans. Oper. Res. 2025, 32, 1834–1860. [Google Scholar] [CrossRef]
  5. Scholten, K.; Stevenson, M.; van Donk, D.P. Dealing with the Unpredictable: Supply Chain Resilience. Int. J. Oper. Prod. Manag. 2020, 40, 1–10. [Google Scholar] [CrossRef]
  6. Paul, S.K.; Sarker, R.; Essam, D. A Quantitative Model for Disruption Mitigation in a Supply Chain. Eur. J. Oper. Res. 2017, 257, 881–895. [Google Scholar] [CrossRef]
  7. Suryadi, A.; Rau, H. Considering Region Risks and Mitigation Strategies in the Supplier Selection Process for Improving Supply Chain Resilience. Comput. Ind. Eng. 2023, 181, 109288. [Google Scholar] [CrossRef]
  8. Hamidu, Z.; Issau, K.; Boachie-Mensah, F.O.; Asafo-Adjei, E. On the Interplay of Supply Chain Network Complexity on the Nexus between Supply Chain Resilience and Performance. Benchmarking 2024, 31, 1590–1610. [Google Scholar] [CrossRef]
  9. Tan, W.J.; Cai, W.; Zhang, A.N. Structural-Aware Simulation Analysis of Supply Chain Resilience. Int. J. Prod. Res. 2020, 58, 5175–5195. [Google Scholar] [CrossRef]
  10. Macdonald, J.R.; Zobel, C.W.; Melnyk, S.A.; Griffis, S.E. Supply Chain Risk and Resilience: Theory Building through Structured Experiments and Simulation. Int. J. Prod. Res. 2018, 56, 4337–4355. [Google Scholar] [CrossRef]
  11. Trabucco, M.; De Giovanni, P. Achieving Resilience and Business Sustainability during COVID-19: The Role of Lean Supply Chain Practices and Digitalization. Sustainability 2021, 13, 12369. [Google Scholar] [CrossRef]
  12. Cobra, R.; Moroni, I.T.; Rodrigues, V.P.; Fradinho, J.M.S.; Mascarenhas, J. Repair as a Circular Strategy for Increasing Resource Availability and Health System Resilience during a Crisis. Health Policy Technol. 2023, 12, 100778. [Google Scholar] [CrossRef]
  13. Bag, S.; Gupta, S.; Foropon, C. Examining the Role of Dynamic Remanufacturing Capability on Supply Chain Resilience in Circular Economy. Manag. Decis. 2019, 57, 863–885. [Google Scholar] [CrossRef]
  14. Zhou, X.; Jiang, J.; Zhou, C.; Li, X.; Yin, M. Circular Supply Chain Management: Antecedent Effect of Social Capital and Big Data Analysis Capability and Their Impact on Sustainable Performance. Sustain. Dev. 2024, 32, 5311–5330. [Google Scholar] [CrossRef]
  15. Lahane, S.; Kant, R.; Shankar, R. Circular Supply Chain Management: A State-of-Art Review and Future Opportunities. J. Clean. Prod. 2020, 258, 120859. [Google Scholar] [CrossRef]
  16. Farooque, M.; Zhang, A.; Thürer, M.; Qu, T.; Huisingh, D. Circular Supply Chain Management: A Definition and Structured Literature Review. J. Clean. Prod. 2019, 228, 882–900. [Google Scholar] [CrossRef]
  17. Triguero, Á.; Moreno-Mondéjar, L.; Sáez-Martínez, F.J. Circular Economy and Firm Performance: The Influence of Product Life Cycle Analysis, Upcycling, and Redesign. Sustain. Dev. 2023, 31, 2318–2331. [Google Scholar] [CrossRef]
  18. Paul, A.; Saha, S.C. A Systematic Literature Review on Flexible Strategies and Performance Indicators for Supply Chain Resilience. Glob. J. Flex. Syst. Manag. 2025, 26, 207–231. [Google Scholar] [CrossRef]
  19. Paul, S.K.; Chowdhury, P. A Production Recovery Plan in Manufacturing Supply Chains for a High-Demand Item during COVID-19. Int. J. Phys. Distrib. Logist. Manag. 2021, 51, 104–125. [Google Scholar] [CrossRef]
  20. Wang, P.; Yang, Y.-Y.; Heidrich, O.; Chen, L.-Y.; Chen, L.-H.; Fishman, T.; Chen, W.-Q. Regional Rare-Earth Element Supply and Demand Balanced with Circular Economy Strategies. Nat. Geosci. 2024, 17, 94–102. [Google Scholar] [CrossRef]
  21. Takimoto, H.; Kosai, S.; Watari, T.; Yamasue, E. Circular Economy Can Mitigate Rising Mining Demand from Global Vehicle Electrification. Resour. Conserv. Recycl. 2024, 209, 107748. [Google Scholar] [CrossRef]
  22. Gaustad, G.; Krystofik, M.; Bustamante, M.; Badami, K. Circular Economy Strategies for Mitigating Critical Material Supply Issues. Resour. Conserv. Recycl. 2018, 135, 24–33. [Google Scholar] [CrossRef]
  23. Taddei, E.; Sassanelli, C.; Rosa, P.; Terzi, S. Circular Supply Chains in the Era of Industry 4.0: A Systematic Literature Review. Comput. Ind. Eng. 2022, 170, 108268. [Google Scholar] [CrossRef]
  24. de Lima, F.A.; Seuring, S.; Sauer, P.C. A Systematic Literature Review Exploring Uncertainty Management and Sustainability Outcomes in Circular Supply Chains. Int. J. Prod. Res. 2022, 60, 6013–6046. [Google Scholar] [CrossRef]
  25. Sudusinghe, J.I.; Seuring, S. Supply Chain Collaboration and Sustainability Performance in Circular Economy: A Systematic Literature Review. Int. J. Prod. Econ. 2022, 245, 108402. [Google Scholar] [CrossRef]
  26. Vegter, D.; van Hillegersberg, J.; Olthaar, M. Supply Chains in Circular Business Models: Processes and Performance Objectives. Resour. Conserv. Recycl. 2020, 162, 105046. [Google Scholar] [CrossRef]
  27. Bui, T.D.; Tseng, J.W.; Aminah, H.; Sulistiawan, J.; Ali, M.H.; Tseng, M.L. Causality of Total Resource Management in Circular Supply Chain Implementation under Uncertainty: A Context of Textile Industry in Indonesia. Ann. Oper. Res. 2023, 1–41. [Google Scholar] [CrossRef]
  28. Cao, Y.; Qu, Y.; Guo, L. Identifying Critical Eco-Innovation Practices in Circular Supply Chain Management: Evidence from the Textile and Clothing Industry. Int. J. Logist. Res. Appl. 2023, 26, 1462–1483. [Google Scholar] [CrossRef]
  29. Stumpf, L.; Schöggl, J.P.; Baumgartner, R.J. Circular Plastics Packaging—Prioritizing Resources and Capabilities along the Supply Chain. Technol. Forecast. Soc. Change 2023, 188, 122261. [Google Scholar] [CrossRef]
  30. Dwivedi, A.; Paul, S.K. A Framework for Digital Supply Chains in the Era of Circular Economy: Implications on Environmental Sustainability. Bus. Strateg. Environ. 2022, 31, 1249–1274. [Google Scholar] [CrossRef]
  31. Orji, I.J.; U-Dominic, C.M.; Okwara, U.K. Exploring the Determinants in Circular Supply Chain Implementation in the Nigerian Manufacturing Industry. Sustain. Prod. Consum. 2022, 29, 761–776. [Google Scholar] [CrossRef]
  32. Sawe, F.B.; Kumar, A.; Garza-Reyes, J.A.; Agrawal, R. Assessing People-Driven Factors for Circular Economy Practices in Small and Medium-Sized Enterprise Supply Chains: Business Strategies and Environmental Perspectives. Bus. Strateg. Environ. 2021, 30, 2951–2965. [Google Scholar] [CrossRef]
  33. Lahcen, B.; Eyckmans, J.; Rousseau, S.; Dams, Y.; Brusselaers, J. Modelling the Circular Economy: Introducing a Supply Chain Equilibrium Approach. Ecol. Econ. 2022, 197, 107451. [Google Scholar] [CrossRef]
  34. Khanduzi, R. Developing a Stackelberg Security Game for Circular Supply Chain Network. Environ. Dev. Sustain. 2022, 1–32. [Google Scholar] [CrossRef]
  35. Li, G.; Wu, H.; Sethi, S.P.; Zhang, X. Contracting Green Product Supply Chains Considering Marketing Efforts in the Circular Economy Era. Int. J. Prod. Econ. 2021, 234, 108041. [Google Scholar] [CrossRef]
  36. Kumar, P.; Singh, R.K.; Kumar, V. Managing Supply Chains for Sustainable Operations in the Era of Industry 4.0 and Circular Economy: Analysis of Barriers. Resour. Conserv. Recycl. 2021, 164, 105215. [Google Scholar] [CrossRef]
  37. Bimpizas-Pinis, M.; Santagata, R.; Kaiser, S.; Liu, Y.; Lyu, Y. Additives in the Food Supply Chain: Environmental Assessment and Circular Economy Implications. Environ. Sustain. Indic. 2022, 14, 100172. [Google Scholar] [CrossRef]
  38. Sehnem, S.; Chiappetta Jabbour, C.J.; Farias Pereira, S.C.; de Sousa Jabbour, A.B.L. Improving Sustainable Supply Chains Performance through Operational Excellence: Circular Economy Approach. Resour. Conserv. Recycl. 2019, 149, 236–248. [Google Scholar] [CrossRef]
  39. Betts, K.; Gutierrez-Franco, E.; Ponce-Cueto, E. Key Metrics to Measure the Performance and Impact of Reusable Packaging in Circular Supply Chains. Front. Sustain. 2022, 3, 910215. [Google Scholar] [CrossRef]
  40. Bracquené, E.; Dewulf, W.; Duflou, J.R. Measuring the Performance of More Circular Complex Product Supply Chains. Resour. Conserv. Recycl. 2020, 154, 104608. [Google Scholar] [CrossRef]
  41. Stillitano, T.; Falcone, G.; Iofrida, N.; Spada, E.; Gulisano, G.; De Luca, A.I. A Customized Multi-Cycle Model for Measuring the Sustainability of Circular Pathways in Agri-Food Supply Chains. Sci. Total Environ. 2022, 844, 157229. [Google Scholar] [CrossRef]
  42. Farooque, M.; Zhang, A.; Liu, Y.; Hartley, J.L. Circular Supply Chain Management: Performance Outcomes and the Role of Eco-Industrial Parks in China. Transp. Res. Part E Logist. Transp. Rev. 2022, 157, 102596. [Google Scholar] [CrossRef]
  43. Nayal, K.; Kumar, S.; Raut, R.D.; Queiroz, M.M.; Priyadarshinee, P.; Narkhede, B.E. Supply Chain Firm Performance in Circular Economy and Digital Era to Achieve Sustainable Development Goals. Bus. Strateg. Environ. 2022, 31, 1058–1073. [Google Scholar] [CrossRef]
  44. Liu, Z.; Wang, M. Improving Circular Supply Chain Performance through Green Innovations: The Moderating Role of Economic Policy Uncertainty. Sustainability 2022, 14, 16888. [Google Scholar] [CrossRef]
  45. Saroha, M.; Garg, D.; Luthra, S. Analyzing the Circular Supply Chain Management Performance Measurement Framework: The Modified Balanced Scorecard Technique. Int. J. Syst. Assur. Eng. Manag. 2022, 13, 951–960. [Google Scholar] [CrossRef]
  46. Vimal, K.E.K.; Shaikh, M.F.; Chouhan, A.P.; Kandasamy, J. Developing a Framework for Achieving Optimal Sustainability and Resilience in Circular Sharing Network. Environ. Dev. Sustain. 2024, 26, 18267–18295. [Google Scholar] [CrossRef]
  47. Chari, A.; Niedenzu, D.; Despeisse, M.; Machado, C.G.; Azevedo, J.D.; Boavida-Dias, R.; Johansson, B. Dynamic Capabilities for Circular Manufacturing Supply Chains—Exploring the Role of Industry 4.0 and Resilience. Bus. Strateg. Environ. 2022, 31, 2500–2517. [Google Scholar] [CrossRef]
  48. Fletcher, C.A.; St Clair, R.; Sharmina, M. Seafood Businesses’ Resilience Can Benefit from Circular Economy Principles. Nat. Food 2021, 2, 228–232. [Google Scholar] [CrossRef]
  49. D’Adamo, I.; Lupi, G. Sustainability and Resilience after COVID-19: A Circular Premium in the Fashion Industry. Sustainability 2021, 13, 1861. [Google Scholar] [CrossRef]
  50. Australia’s Smartphone Sales Bounce Back. Emerging Technology Insights. 2024. Available online: https://www.telsyte.com.au/announcements/2024/10/8/australias-smartphone-sales-bounce-back (accessed on 8 February 2025).
  51. Man, H. The Most Expensive Countries to Buy a Samsung Galaxy. The Burrow. 2025. Available online: https://www.comparethemarket.com.au/home-contents-insurance/features/samsung-price-index-2025/ (accessed on 11 February 2025).
  52. Statista Smartphone Market in Australia—Statistics & Facts. Technology & Telecommunications. 2025. Available online: https://www.statista.com/topics/4605/smartphone-market-in-australia/ (accessed on 18 March 2025).
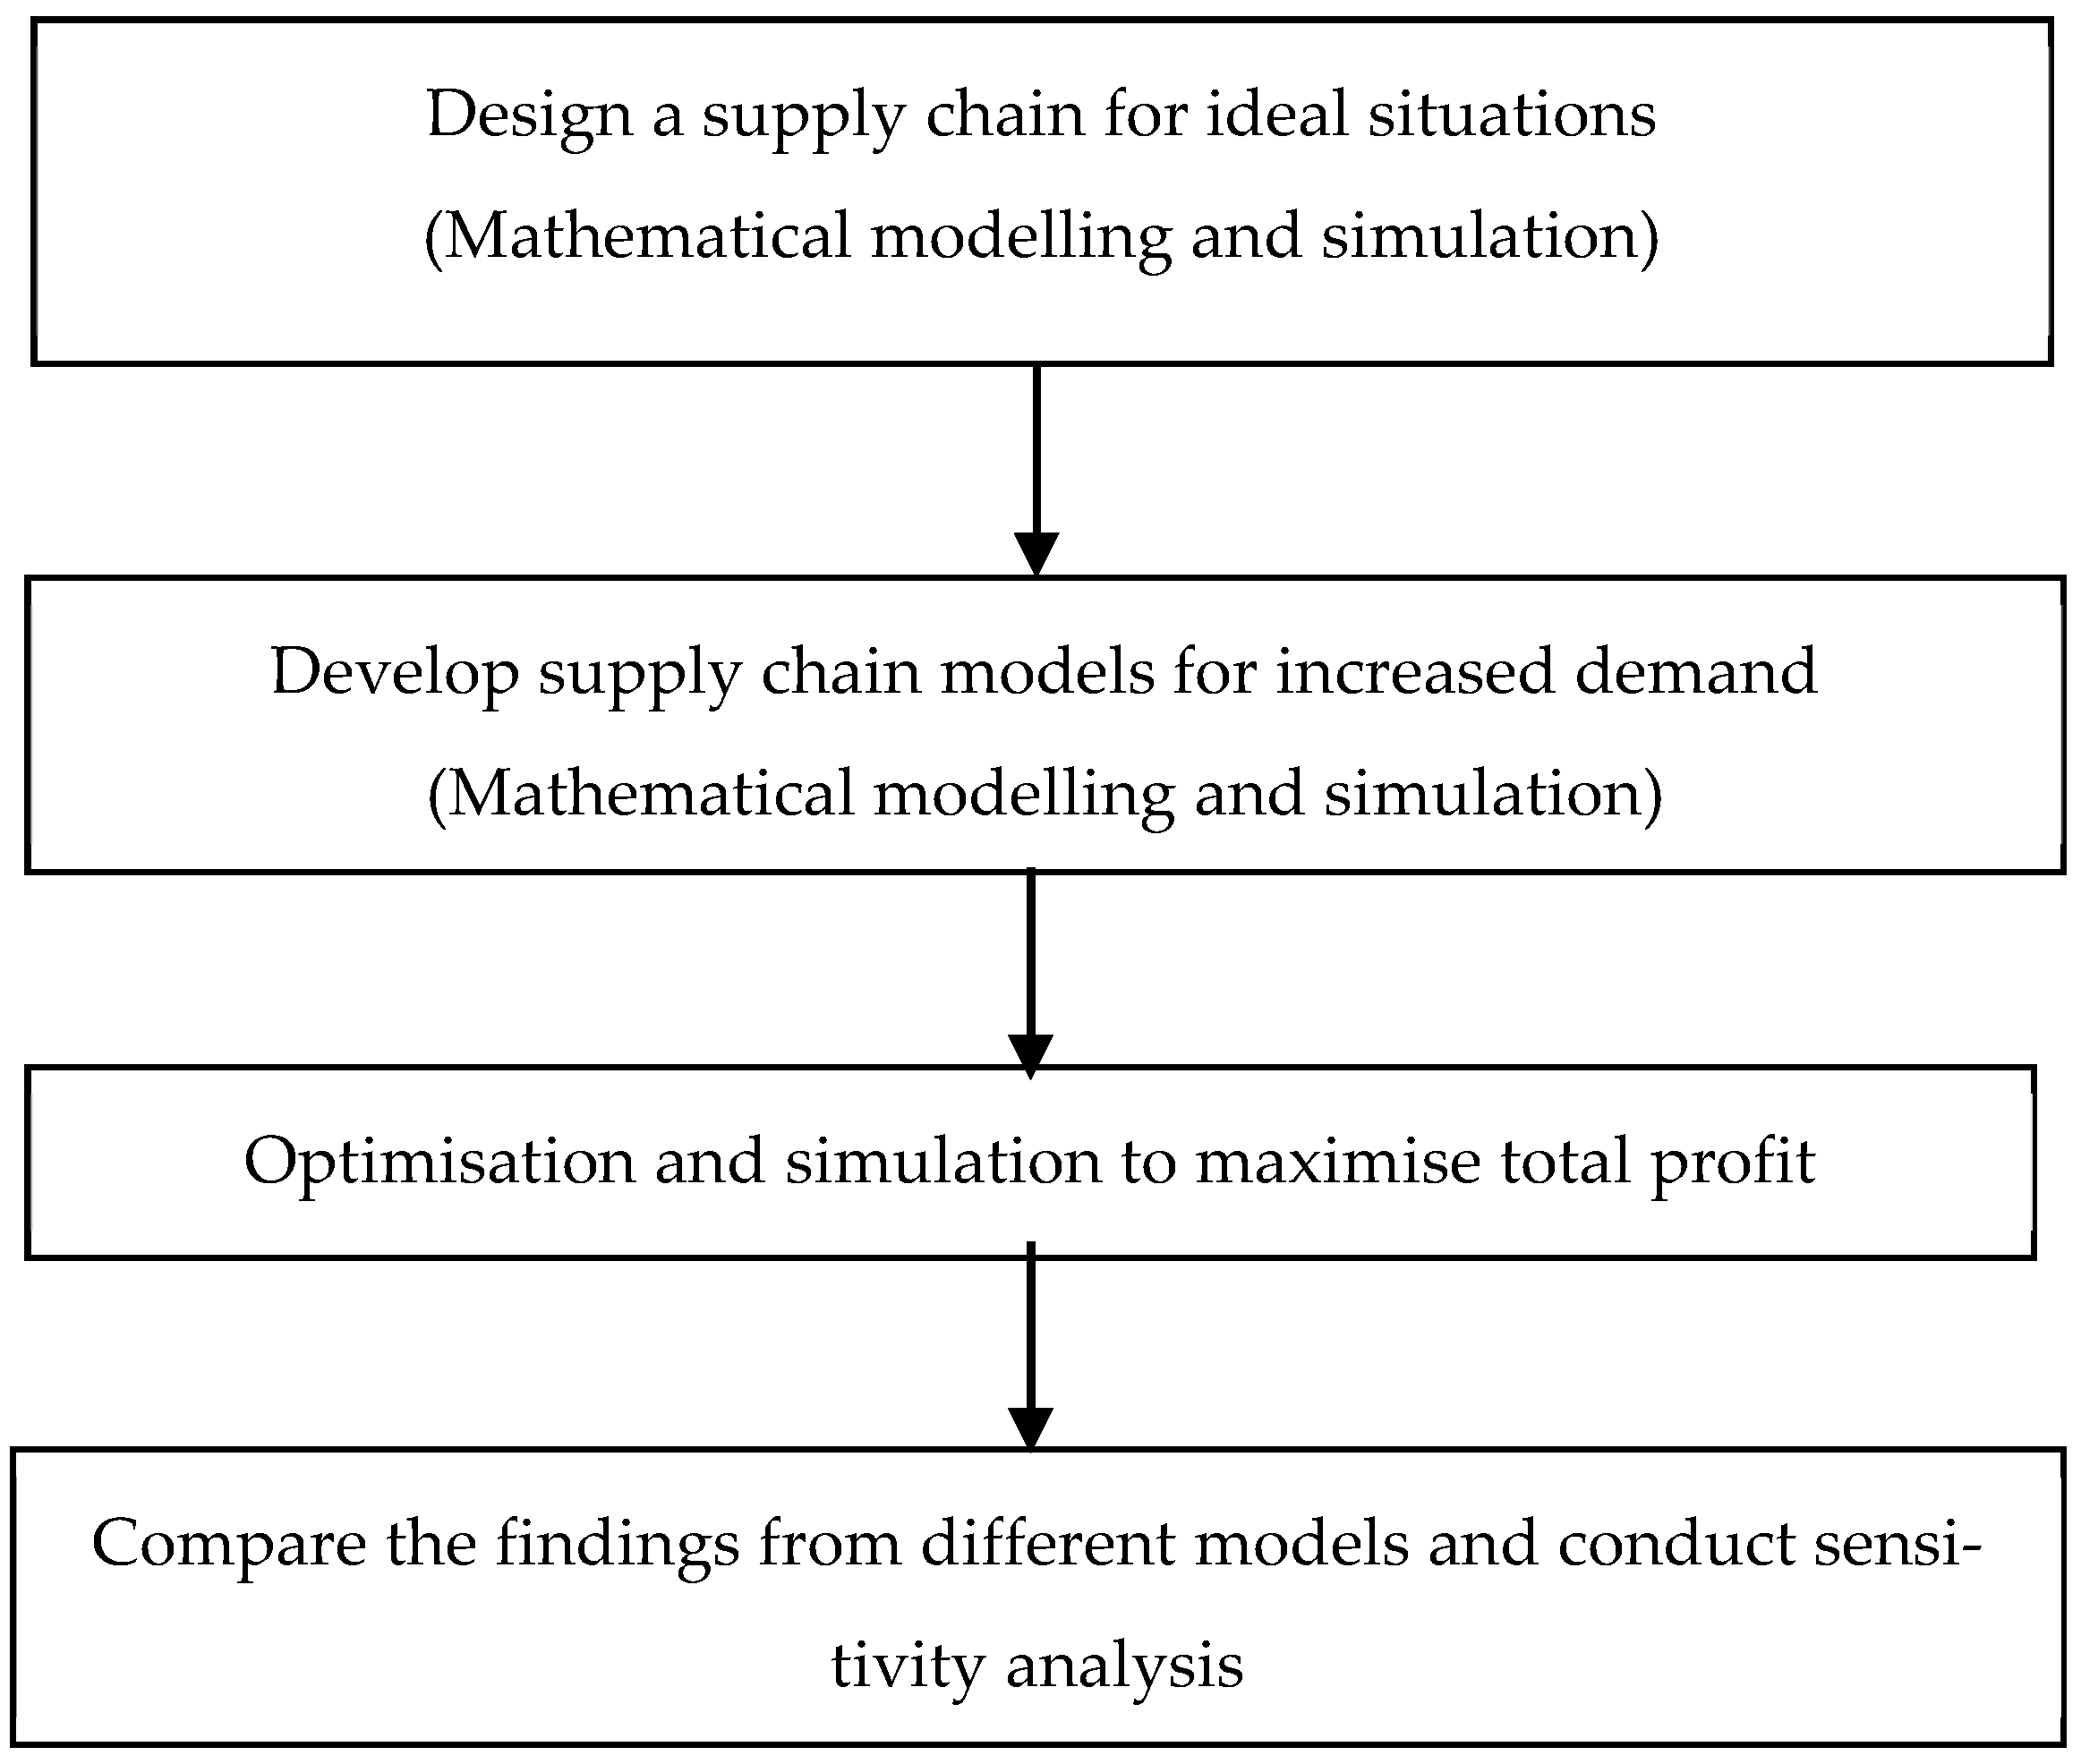
Figure 1. The research methodology.
Sustainability 17 08248 g001
Figure 2. Supply chain map under ideal situations (red circles indicate DCs and blue circles indicate retailers).
Sustainability 17 08248 g002
Figure 3. Supply chain map for increased demand with no strategies (red circles indicate DCs and blue circles indicate retailers).
Sustainability 17 08248 g003
Figure 4. Supply chain map for increased demand with circular strategies (red circles indicate DCs and blue circles indicate retailers).
Sustainability 17 08248 g004
Figure 5. Impacts of the rate of increased demand on cost, profit, and demand fulfilment.
Sustainability 17 08248 g005
Figure 6. Impacts of repair quantities on cost, profit, and demand fulfilment.
Sustainability 17 08248 g006
Figure 7. Impacts of reuse quantities on cost, profit, and demand fulfilment.
Sustainability 17 08248 g007
Figure 8. Impacts of the buying price on cost, profit, and demand fulfilment.
Sustainability 17 08248 g008
Table 1. Quantitative studies on circular supply chains.
ReferenceContributionsFindingsMethods UsedIndustry
Context
Country/Regional Context
[27]
  • They explored the relationship between the circular supply chain and total resource management.
  • They also provided practical implications for firm managers and decision-makers.
  • They found top management support as a top criterion for better firm performance.
  • They also found other criteria for enhancing firms’ performance, such as service design using eco-friendly products, adopting new technology, and different granted funds.
  • Utilising natural resources can help to increase firms’ performance economically.
Fuzzy Delphi method,
Fuzzy DEMATEL
Textile industryIndonesia
[28]
  • They explored the context of the eco-innovation business.
  • They integrated supply chain resilience and circular supply chain to improve environmental performance.
  • They observed that assessing the life cycle can improve circular performance.
  • They found several important factors: eco-innovation establishment, capital control, and life-cycle assessment.
  • They also found eco-monitoring, eco-mindset, eco-innovation, and information sharing to be significant factors in improving circular performance.
Fuzzy set theory, DEMATELTextile and clothing industryChina
[29]
  • They integrated the resource-based view, resources, and capabilities along with a circular supply chain.
  • They explored resources and capabilities and prioritised them quantitatively.
  • They found that coordination could improve knowledge sharing between partners/stockholders to achieve circularity in supply chains.
  • Collaboration is also important to increase the product life cycle.
Delphi method, analytic hierarchy processPlastic packaging industryEuropean Union, mostly Austria and Germany
[30]
  • They explored barriers to the digital supply chain and provided suggestions to increase circular performance.
  • They focused on the environmental sustainability perspective.
  • They found a lack of digital skills and facilities as the most significant barrier.
  • Information exposure risk and lack of strategic orientation were mentioned as the other significant barriers.
  • Unwillingness to take the initiative was also mentioned as a barrier.
Fuzzy best–worst methodNot specificNot specific
[33]
  • They explored the impacts of plastic bottles on the circular economy.
  • They provided significant strategies to improve circular economy performance.
  • They found the importance of well-targeted policies to enhance circular performance.
  • Recycled materials could be used as alternative substitutes for production materials.
Equilibrium model,
product–service system
Plastic industryBelgium
[34]
  • They developed a Stackelberg leadership model for a circular supply chain.
  • They also developed a two-stage tabu search algorithm to solve the problem.
  • They found that repair and collection centres play a significant role in the circular supply chain.
Mathematical programmingPaper industryIndia
[31]
  • They identified the enablers of supply chain circularity.
  • They classified and analysed those enablers to improve the circular economy.
  • They found supplier relationship development is the most important enabler for supply chain circularity.
  • They also found periodic environmental audits to be the second most important enablers.
  • Eco-enablers would be most crucial for improving supply chain circularity goals.
Best–worst method,
evaluation based on distance from the average solution
Not specificNigeria
[35]
  • They integrated a green product supply chain and circular economy.
  • They explored two contracting formats in designing and marketing.
  • They found that product greening level enhancement could be effective for high- or low-marketing efforts.
  • Under the contracting design format, they found that a degree of risk aversion could improve supply chain performance.
Game theoryRetailChina
[32]
  • They analysed their study in the context of small- and medium-sized enterprises.
  • They integrated people-driven factors and a circular economy.
  • They explored the relationship between human resource-related factors and supply chain circularity.
  • They found that training and knowledge sharing were the most important people-driven factors.
  • They also found that employee participation and leadership orientation were significant factors in the supply chain circularity practices.
DEMATELNot specificNot specific
[36]
  • They identified different barriers to supply chain circularity in Industry 4.0.
  • They analysed those barriers for mitigating supply chain circularity challenges.
  • They found that insufficiently skilled employees and an unproductive framework are the barriers to supply chain circularity.
  • The use of technology could be fruitful in circular economy performance.
Analytic hierarchy processAutomobile and electronics industriesIndia
Table 2. Case studies on circular supply chains.
ReferenceContributionsFindingsMethods UsedIndustry
Context
Country/Regional Context
[37]
  • They integrated the circular economy and environmental performance.
  • They identified strategies for producing and processing food to enhance circular performance.
  • They also highlighted social perspectives and life-cycle assessment strategies.
  • They found a relationship between agricultural and chemical processes in food production and concluded that agri-food needs chemical support to increase product life.
  • They focused on different types of reuse processes like remanufacturing, redistribution, repackaging, and promotional sales.
  • Irrelevant use of raw materials could increase performance losses.
Case studyFood industryGreece
[39]
  • They mentioned key metrics in the circular supply chain.
  • They focused on reusable packaging.
  • They highlighted the sustainability impact of a circular supply chain.
  • They categorised reusable packaging as primary, secondary, and tertiary packaging.
  • They mentioned reusable packaging as a solution for not using extra material resources.
  • Reusable packaging could be made more effective by using polypropylene boxes or multi-usable woven-polypropylene bags.
  • Losing reusable packaging could increase packaging costs. A flexible transport system is helpful.
Case studyPhysical retail outletsNot specific
[40]
  • They explored different material circularity indicators in the supply chain.
  • They formulated a product circularity indicator for improving circular economy strategies.
  • They found limitations of plastic recycling improvement.
  • They found fibre-reinforced plastic to be an unrecyclable type of plastic.
  • They mentioned four stages of environmental impact assessment: production of materials, manufacturing, waste management, and product recycling.
Case study,
life-cycle assessment
Washing machine industryBelgium
[38]
  • They analysed critical success factors in supply chain circularity.
  • They focused on enhancing supply chain sustainability performance in the adoption of circularity practices.
  • They found that supply chain circularity and sustainable models could improve business performance.
  • They also found that technical and biological practices in supply chain circularity could increase resilience to sustainability practices.
Case studyAgri-business, packaging, and catering industriesBrazil and Scotland
Table 3. Empirical studies on circular supply chains.
ReferenceContributionsFindingsMethods UsedIndustry
Context
Country/Regional Context
[44]
  • They integrated supply chain circularity performance and eco-innovation strategies.
  • They categorised eco-innovation strategies as eco-product, eco-process, eco-service, and eco-logistics.
  • They found significant impacts of eco-innovation strategies on supply chain circularity performance.
  • Economic policy uncertainty is positively related to eco-innovation strategies.
Structural equation modellingMultiple industries, such as electronics, machinery, and communicationsChina
[41]
  • They integrated sustainability and circular economy concepts into supply chains.
  • They considered the life-cycle assessment perspective.
  • They found that the life-cycle assessment approach can improve social and environmental performance in supply chains.
Multi-cycle modelAgri-food supply chainNot specific
[42]
  • They applied the natural resource-based view to test circularity in supply chain.
  • They integrated material circularity and the circular supply chain.
  • They found a significant relationship between financial performance and circular product design.
  • They found that a firm’s cost and financial performance depend on improving circular supply chain management.
Structural equation modellingMultiple industries, such as metal products, chemicals, automotive, electrical appliances, pharmaceuticals, food, electronics, textiles, and woodChina
[45]
  • They identified key performance indicators in the circular supply chain.
  • They categorised key performance indicators into seven perspectives: internal business, innovation and learning, customer, financial, environmental, social, and cost perspectives.
  • They identified twenty key performance measures that impact circular supply chain implementation.
Modified balanced scorecardNot specificIndia
[43]
  • They identified the performance indicators of supply chain flexibility and tested their relationships using the resource orchestration theory.
  • They integrated flexibility indicators and a circular economy.
  • They found positive impacts of the circular economy on organisational flexibility and AI–IoT.
  • They found unawareness of circular economy adaptation in different manufacturing organisations.
  • Adoption of the AI–IoT system could improve different types of flexibility, where the circular economy could be a moderator.
Structural equation modellingMultiple industries, such as automobile, electronics, plastics and rubber, and metalIndia
Table 5. Product flow under ideal situations.
From (DCs)To (Retailers)Quantity
Melbourne 2Retailer Shepparton4979
Melbourne 2Retailer Wangaratta4979
Melbourne 2Retailer Wodonga4979
Melbourne 2Retailer Balwyn North4979
Melbourne 2Retailer Traralgon4979
Melbourne 2Retailer Glen Iris4979
Melbourne 2Retailer Frankston East4979
Melbourne 2Retailer Canberra4979
Melbourne 2Retailer Queanbeyan4979
Melbourne 2Retailer Melbourne210
Melbourne 2Retailer Albury4979
Sydney 2Retailer Port Macquarie4979
Sydney 2Retailer Maitland4979
Sydney 2Retailer Tamworth4979
Sydney 2Retailer Taree4979
Sydney 2Retailer Newcastle4979
Sydney 2Retailer Port Stephens4979
Sydney 2Retailer Bathurst4979
Sydney 2Retailer Hornsby4979
Sydney 2Retailer Orange4979
Sydney 2Retailer Forster4979
Sydney 2Retailer Armidale210
Sydney 1Retailer Liverpool4979
Sydney 1Retailer Katoomba4979
Sydney 1Retailer Epping4979
Sydney 1Retailer Parramatta4979
Sydney 1Retailer Wollongong4979
Sydney 1Retailer Goulburn4979
Sydney 1Retailer City of Parramatta4979
Sydney 1Retailer Sydney4979
Sydney 1Retailer Nowra4979
Sydney 1Retailer Strathfield4979
Sydney 1Retailer Armidale210
Melbourne 1Retailer Hobart4979
Melbourne 1Retailer Warrnambool420
Melbourne 1Retailer Burnie4979
Melbourne 1Retailer Devonport4979
Melbourne 1Retailer Ballarat4979
Melbourne 1Retailer Geelong4979
Melbourne 1Retailer Launceston4979
Melbourne 1Retailer St Albans4979
Melbourne 1Retailer Bendigo4979
Melbourne 1Retailer Echuca4979
Melbourne 1Retailer Melbourne4769
AdelaideRetailer Dubbo4979
AdelaideRetailer Prospect4979
AdelaideRetailer Mount Gambier4979
AdelaideRetailer Warrnambool4559
AdelaideRetailer Murray Bridge4979
AdelaideRetailer Gawler4979
AdelaideRetailer Adelaide Hills4979
AdelaideRetailer Whyalla630
AdelaideRetailer Broken Hill4979
AdelaideRetailer Adelaide4979
AdelaideRetailer Mildura4979
PerthRetailer Geraldton4979
PerthRetailer Rockingham4979
PerthRetailer Mandurah4979
PerthRetailer Kalgoorlie4979
PerthRetailer Albany4979
PerthRetailer Perth4979
PerthRetailer Whyalla4349
PerthRetailer Busselton4979
PerthRetailer Bunbury4979
PerthRetailer Kwinana4979
DarwinRetailer Rockhampton4979
DarwinRetailer Gladstone4979
DarwinRetailer Darwin4979
DarwinRetailer Alice Springs4979
DarwinRetailer Townsville4979
DarwinRetailer Mackay4979
DarwinRetailer Bundaberg4349
DarwinRetailer Palmerston4979
DarwinRetailer Mount Isa4979
DarwinRetailer Cairns4979
BrisbaneRetailer Gold Coast4979
BrisbaneRetailer Coffs Harbour4979
BrisbaneRetailer Brisbane4979
BrisbaneRetailer Lismore4979
BrisbaneRetailer Maryborough4979
BrisbaneRetailer Woodridge4979
BrisbaneRetailer Logan City4979
BrisbaneRetailer Bundaberg630
BrisbaneRetailer Toowoomba4979
BrisbaneRetailer Caloundra4979
BrisbaneRetailer Armidale4559
Table 6. Comparison of results between three models.
ModelTotal RevenueTotal CostTotal ProfitDemand FulfilmentPenalty Cost
Model under ideal situationsAUD 557,249,680AUD 362,133,541.98AUD 195,116,138.02100%0
Model for increased demand with no strategiesAUD 559,600,000AUD 382,796,130.02AUD 176,803,869.9891.36%AUD 20,812,000
Model for increased demand with circular strategiesAUD 609,964,000AUD 378,175,122.98AUD 231,788,877.0299.58%AUD 1,012,000
Disclaimer/Publisher’s Note: The statements, opinions and data contained in all publications are solely those of the individual author(s) and contributor(s) and not of MDPI and/or the editor(s). MDPI and/or the editor(s) disclaim responsibility for any injury to people or property resulting from any ideas, methods, instructions or products referred to in the content.