Article

Towards Sustainable Airport Operations: Emission Analysis of Taxiing Solutions

by
Marta Maciejewska
and
Paula Kurzawska-Pietrowicz
*
Faculty of Civil and Transport Engineering, Poznan University of Technology, 60-965 Poznan, Poland
*
Author to whom correspondence should be addressed.
Sustainability 2025, 17(18), 8242; https://doi.org/10.3390/su17188242
Submission received: 15 August 2025 / Revised: 4 September 2025 / Accepted: 8 September 2025 / Published: 13 September 2025
(This article belongs to the Special Issue Control of Traffic-Related Emissions to Improve Air Quality)

Abstract

Airport operations significantly contribute to air pollution in their vicinity through various sources, including aircraft activities—particularly taxiing and take-off—as well as ground support equipment, service vehicles, and maintenance work. Since emissions from aircraft engines represent the primary pollution source at airports, it is essential to reduce emissions at every phase of the LTO (landing and take-off) cycle to improve local air quality and promote environmental sustainability. Given the research gap in emission analysis, a comprehensive LCA framework for airport pushback and taxi operations is proposed, integrating tow truck propulsion, a taxiing strategy, and fleet management. Given the complexity of the issue, the authors first decided to investigate emissions from taxiing operations using tow trucks with different powertrains. The analyses performed were considered preliminary and a starting point for exploring emissions during taxiing operations at airports. Typically, aircraft are pushed back from the apron and then taxi under their own power using both engines at approximately 7% of maximum thrust. To substantially reduce exhaust emissions, external towing vehicles can be employed to move aircrafts from the apron to the runway. This study evaluates the potential for emission reductions in CO2 and other harmful compounds such as CO, HC, NOx, and PM by using electric towing vehicles (ETVs). It also compares emissions from different taxiing methods: full-engine taxiing, single-engine taxiing, ETV-assisted taxiing, and taxiing using diesel and petrol-powered tow vehicles. The analysis was conducted for Warsaw and Poznań airports. Three aircraft types—the most commonly operating at these airports—were selected to assess emissions under various taxiing scenarios. The results show that using electric towing vehicles can reduce CO and NOx emissions to nearly zero compared to other methods. Interestingly, CO emissions from full-engine taxiing were lower than those from petrol-powered towing, although the Embraer 195 showed the highest CO emissions among the selected aircrafts. HC emissions were lowest for the A321neo and also relatively low for the diesel towing vehicle. The use of electric tow trucks significantly reduces CO2 emissions: only 2.8–4.4 kg compared to 380–450 kg when taxiing with engines. This research highlights the critical role of sustainable ground operations in reducing harmful emissions and underscores the importance of integrating sustainability into airport taxiing practices.

1. Introduction

As aviation is a rapidly growing sector, the emissions generated by aircrafts and airports have to be significantly reduced in the coming years. Aircraft exhaust is not the only source of the pollution at airports, but regulation in previous years has focused mostly on aircraft engines [1]. Airport operations contribute to air pollution in its vicinity through aircraft operations, especially taxiing and take-off, work of ground support equipment, ground vehicle movement, vehicle traffic, and also maintenance works. The influence of airport operation on the environment is precisely described in ICAO doc 9889, Airport Air Quality Manual, which allows for calculating emissions from every kind of airport operation [2]. Airport-related emission sources described in doc 9889 are divided in four groups: emissions related to aircrafts, emissions related to aircraft handling, emissions related to infrastructure, and stationary sources and emissions from vehicle traffic sources [2]. The first group includes aircrafts’ main engines and auxiliary power units, which are the main source of pollution at the airport. The second group comprises ground support equipment, like ground power units, air climate units, aircraft tugs, cargo loaders, and others, and also airside traffic, aircraft refueling operations, and aircraft de-icing operations [2]. There are not many research projects based on emissions related to ground support equipment, so it is not easy to precisely describe its contribution to air pollution at airports [3,4]. Stationary and infrastructure emission sources include power-generating plants, emergency power generators, aircraft and airport maintenance, and storage and distribution of fuel. The last group that leads to air pollution in the vicinity of airports is vehicle traffic, which contains all vehicles associated with the airport. As the main source of air pollution and noise in the vicinity of airport is aircrafts and their main engines, the biggest emission reduction can be made by implementing changes to engines to more ecological systems, usage of sustainable aviation fuels, or air traffic organization. Reductions in air pollution at airports can also be made by making changes to the type of ground support equipment used, especially more ecological types.
The LTO cycle (landing and take-off) is a standard test for engines to calculate the emissions of harmful exhaust compounds at the airport. The LTO cycle contains four phases below 1000 ft: taxi (duration: 26 min), take-off (duration: 0.7 min), climb (duration: 2.2 min), and landing (duration: 4 min) [5]. The phases are shown in Figure 1. The taxi phase, which can be divided into taxi-in and taxi-out, is the longest of all phases and lasts 26 min, so the total emissions of harmful exhaust compounds near the airport are significant. It should be noted that the taxi phase duration time can differ depending on the airport and is usually much shorter than 26 min [6].
As the emissions from aircraft engines are the main pollution source at the airport, it is crucial to reduce emissions from every phase of the LTO test to improve air quality in the vicinity of the airport. Usually, aircrafts are pushed off the apron and then taxi with use of full engines at approximately 7% of the maximum thrust settings. Based on emission analysis, a comprehensive LCA framework could be proposed for airport pushback and taxi operations, integrating tow truck propulsion, a taxiing strategy, and fleet management. The research can address modes of tow truck propulsion such as diesel, hybrid hydraulic-electric, and battery-electric (ETV), considering fuel/electricity use, maintenance, and life-cycle CO2 emissions. Taxiing strategies can also be taken into account: conventional engine taxiing, ETV-assisted pushback, and hybrid approaches. The number of vehicles, charging strategy (overnight vs. opportunistic), utilization, and peak demand can also significantly influence the total emissions when taxiing at the airport. This framework allows for the quantification of emission reductions, identification of optimal fleet sizes, and assessment of operational efficiency and battery life [7,8]. Given the complexity of the issue, the authors first decided to investigate emissions from taxiing operations using tow trucks with different powertrains. The analyses performed were considered preliminary and a starting point for exploring emissions during taxiing operations at airports, also taking into account the charging strategy, fleet size, and battery life.
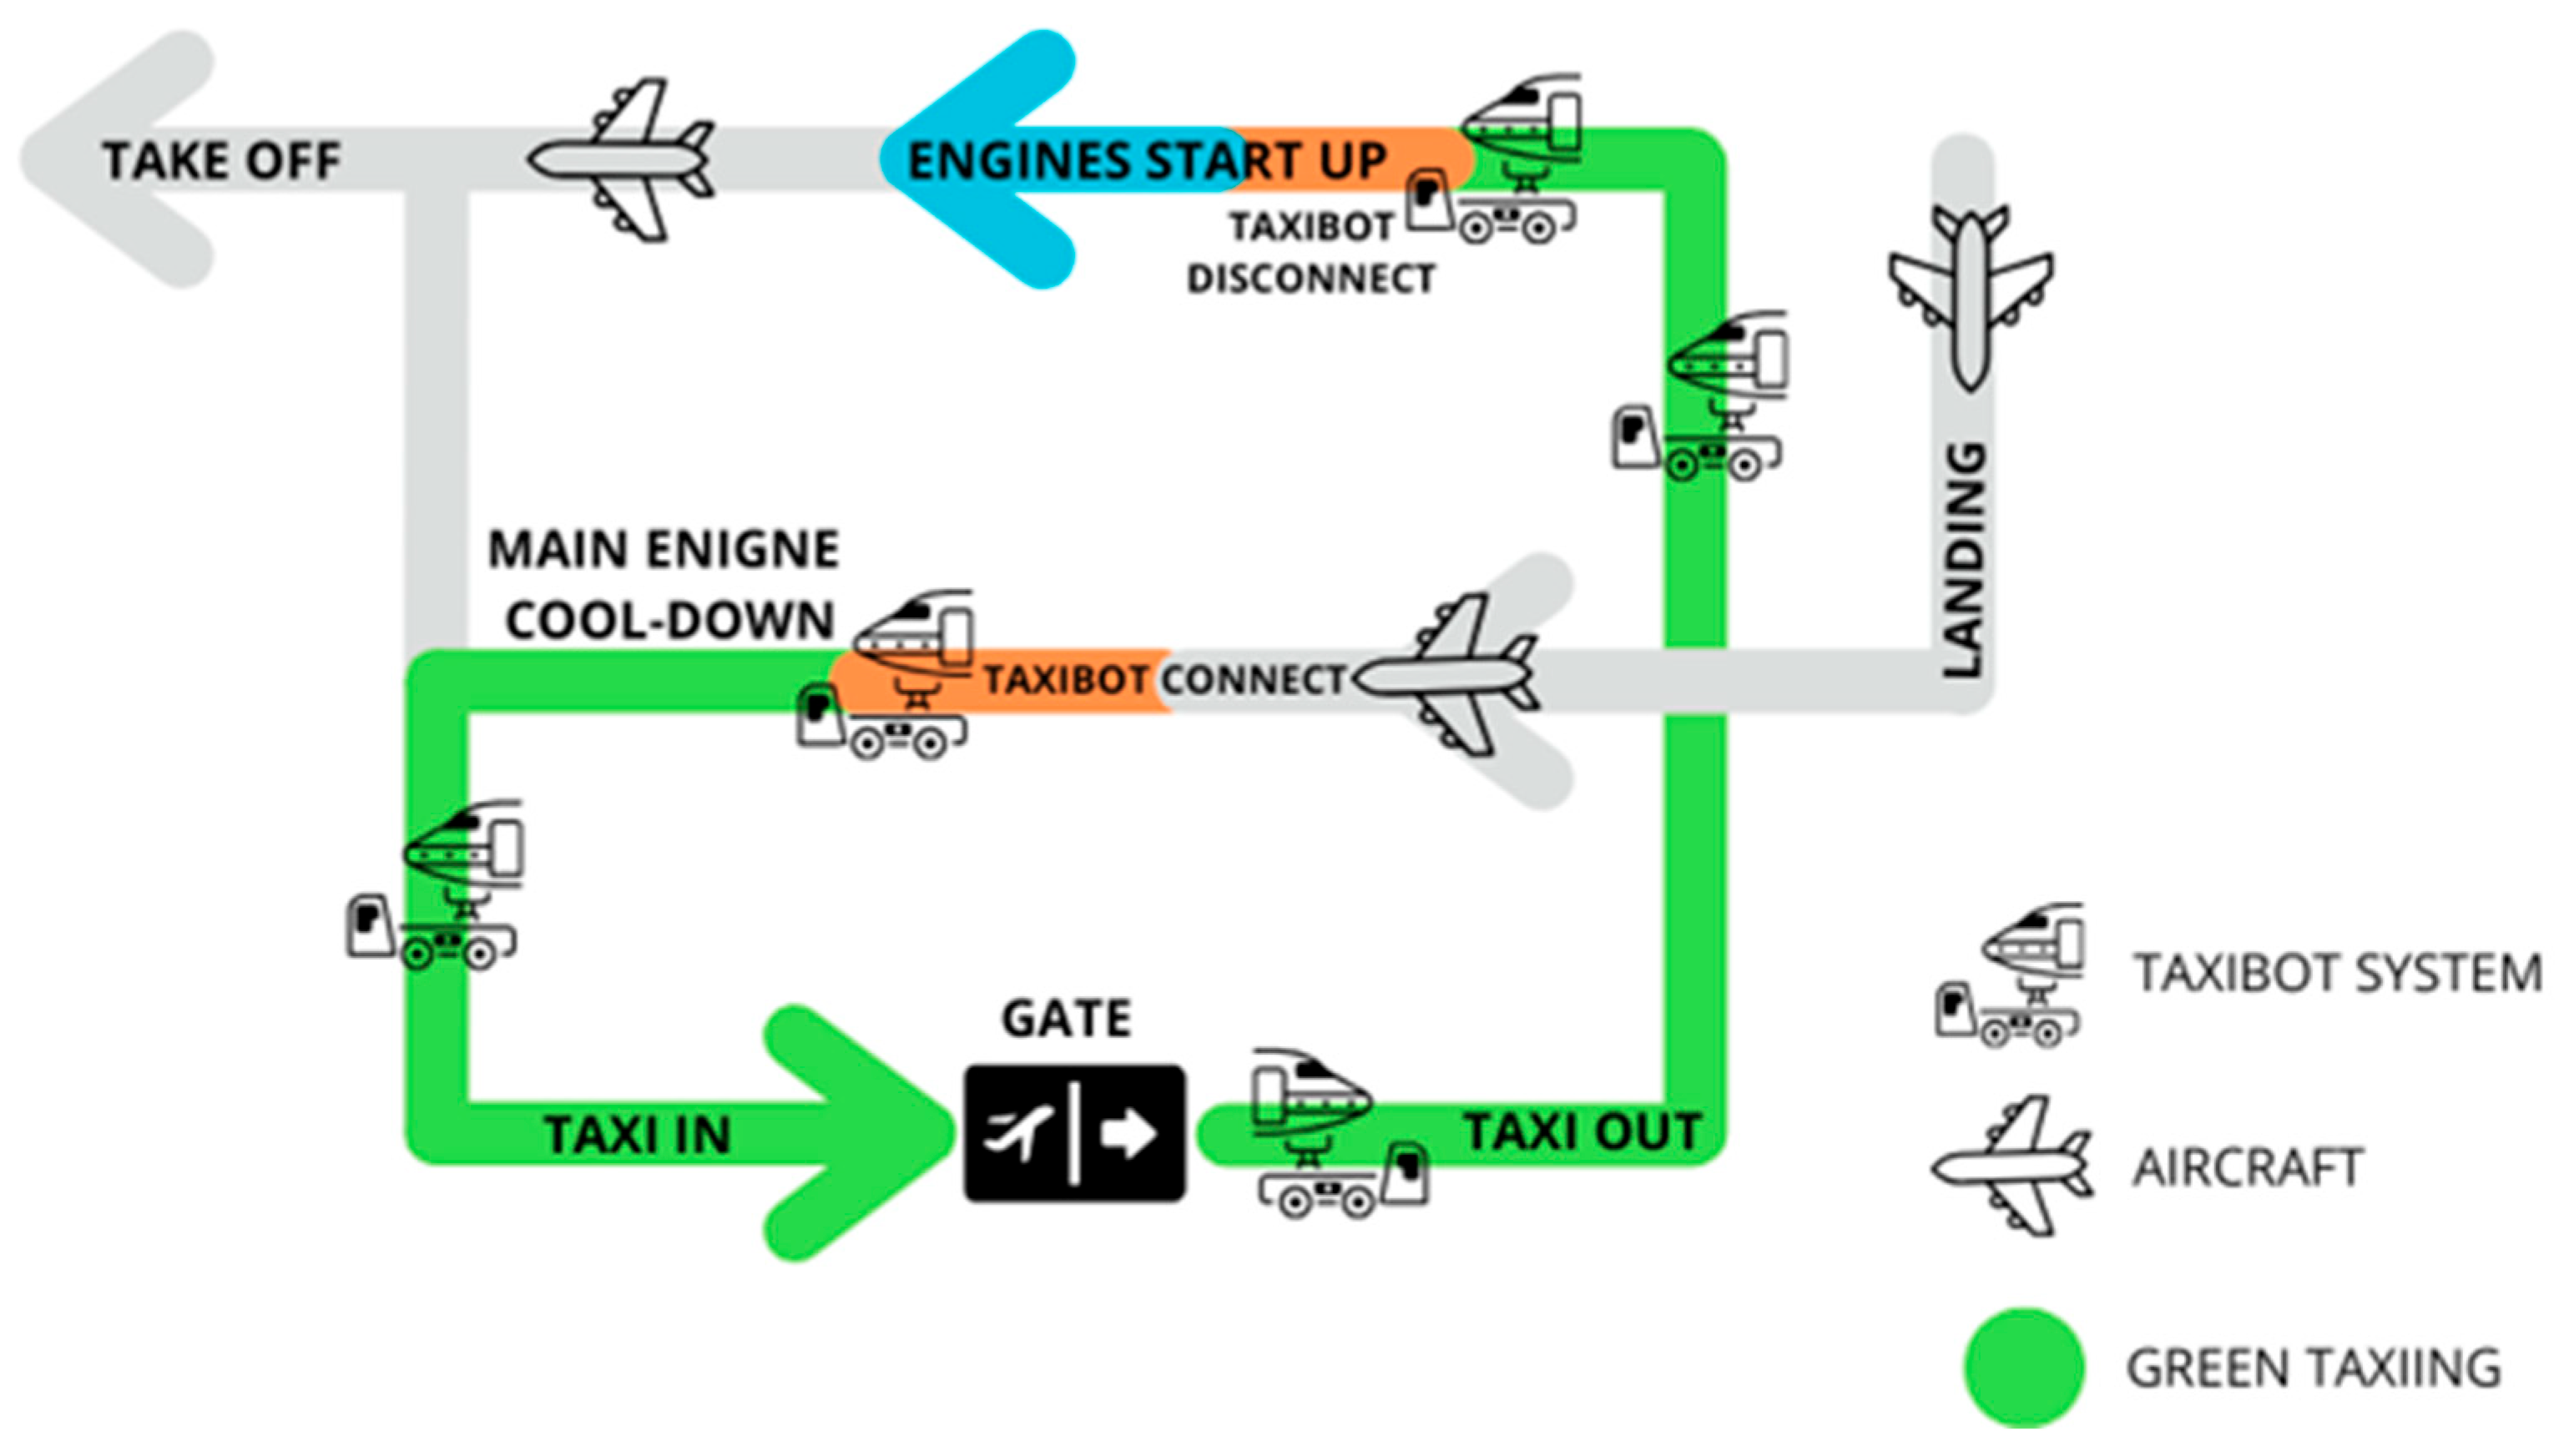
To significantly reduce exhaust emissions from the aircraft, an external towing vehicle can be used to taxi the aircraft from the apron to the runway. Typically, towing vehicles are diesel- or petrol-engined, but now they are also electric-engined [9]. One of the most promising solutions for reducing greenhouse gases from airport operations is the use of electric towing vehicles (ETVs). As many airports are still equipped with conventional tow trucks, which are diesel- or petrol-fueled, the use of electric tow trucks can significantly reduce air pollution thanks to reduced fuel consumption, and they can also slightly reduce noise at the airport. Using an electric towing vehicle can reduce the fuel required for taxiing by up to 80% [10]. However, the transition to electric taxiing operations will notably raise electricity demand at airports. One of the solutions showing the most potential is the Taxibot concept—a semi-robotic tractor that dispatches the aircraft during taxi-out [11]. According to the Taxibot concept [12], a taxi system using Taxibot can reduce jet fuel consumption and CO2 emissions by 85% and noise during taxiing by 60% [12]. The Taxibot system is presented in Figure 2.
This study presents an assessment of the possible reduction in emissions of CO2 and harmful exhaust compounds, such as carbon monoxide (CO), hydrocarbon (HC), nitrogen oxides (NOx), and particulate matter (PM), which can be obtained using electric towing vehicles, and it also compares emissions between different taxiing methods: taxiing on full engines, on one engine, using ETV, and using diesel- or petrol-fueled towing vehicles. The calculations were made for Warsaw Airport and Poznan Airport. Three aircrafts were chosen to compare emissions from different taxiing methods at the selected airports, which are the most frequently operating aircrafts at these airports.

2. Methods

In this paper, a comparison of emissions between different aircraft taxiing methods is presented. Emission calculations were made for full-engine taxi operation, single-engine taxi operation, electric towing vehicles, and diesel- and petrol-fueled towing vehicles. The estimation was performed for Warsaw Chopin Airport (EPWA) and Poznan Airport (EPPO) for three types of aircraft: Airbus A321neo, Boeing B737-8200, and Embraer 195. The choice of these aircrafts was dictated by their share of air traffic at the given airports. Emissions were calculated for CO2, CO, HC, NOx, and PM. The duration of the taxi phase was adopted for the specific airports and was equal to 12 min at EPWA and 10 min at EPPO. The taxi time was based on actual flight data. This approach allowed large calculation errors to be avoided when compared with using the standard taxi time included in the LTO test.
The calculations assume continuous taxiing with constant engine settings and a constant tug speed (for towing solution). Real airport conditions and operational adjustments, such as stop-and-go situations or turning on the taxiway, may therefore introduce some error.

2.1. Full-Engine and Half-Engine Emissions

For full-engine and half-engine taxiing methods, the calculations were made based on the LTO cycle and the emission indices of the specific engines for the taxi phase of the LTO cycle. Emission indices for the taxi phase for specific engines are presented in Table 1. The emission indices for CO, HC, and NOx were extracted from the ICAO Aircraft Engine Emissions Databank [13]. The taxi phase setting for LTO was 7% throttle, which may differ slightly from the actual settings used by pilots at the airport [14].
The emission index for carbon dioxide is equal to 3.16 kg CO2 per kg of fuel [13]. For particulate matter, the emission index was taken as a simplified value equal to 0.001 kg PM per kg of fuel [13].
Emissions calculation of the LTO cycle is described by the following formula [5]:
EPCpol, mode = (TIM/60) ∙ (FFR) ∙ EF ∙ NE,
where
  • EPCpol, mode—emissions per cycle of specified pollutant in selected LTO mode [g/cycle]; TIM—time in mode [min/cycle], with 60 min per hour [min/h]; FFR—fuel flow rate [kg/h]; EF—emission factor [g/kg]; and NE—number of engines on the aircraft.
That formula allowed us to calculate the emissions of harmful exhaust compounds for the taxi phase for full-engine and half-engine taxiing.

2.2. Electric Towing Vehicle Emissions

For the emission calculation for electric towing vehicles, the energy required to move one kilogram of aircraft mass for one minute was obtained from Hospodka and Stloukal [15], which is equal to 8.175 × 10⁻⁶ kWh. Using the maximum take-off weight (MTOW) of the various aircraft types under examination, the overall energy use per minute of towing for each aircraft type was calculated. The results for the energy required to tow the analyzed aircrafts for one minute at 5 m/s is shown in Table 2.
To calculate emissions of CO, NOx, CO2, and PM, the emission indices for energy production in Poland from 2022 were taken into account. The emission index for CO is 0.261 g/kWh, for NOx is 0.456 g/kWh, for CO2 is 685 kg/kWh, and for PM is 0.018 kg/kWh [16].

2.3. Diesel- and Petrol-Fueled Towing Vehicle

For the emission calculations for diesel- and petrol-fueled towing vehicles, specific emission indices for every kind of fuel were taken into consideration. The emission indices for narrow-body aircraft tow trucks using diesel and petrol fuels were taken from Feng Cao et al. [17] and are presented in the Table 3. The emissions were calculated for an 80% load factor.

2.4. Emission Forecast for EPPO and EPWA Airports

In order to perform extended analyses, a 20-year forecast of selected exhaust gas component emissions was developed. The analysis depended on the aircraft analyzed and the solutions considered for taxiing operations. The purpose of the forecast is to quantitatively present how implementing changes in taxiing operations can positively impact the reduction in, above all, CO2 emissions. This will increase awareness of the possibility of using various solutions during taxiing operations and indicate which of them may be the most beneficial, in this case, for two selected airports in Poland. The forecast was made based on the number of flight operations performed each year at the selected airports. Using air traffic data from 2008 to 2023 (the number of regular and charter operations at a given airport per year), a forecast model was prepared for the next 17 years. The first step was to collect 10 different independent variables that could be significant for the number of operations at a given airport (dependent variable). Next, using regression, three statistically significant variables were selected and a model was built based on them. All data for the analyses were collected from the official websites of the Central Statistical Office in Poland and the Civil Aviation Authority.
The model was built based on regression. To build the model, the following statistically significant variables were used: the number of passengers at a given airport (X1), the mobility coefficient for a given urban agglomeration (the number of passengers served divided by the population in a given agglomeration, X2), and the number of aircrafts registered in Poland (X3). Separate linear models were prepared for each airport. The selection of explanatory variables was made using the Hellwig method.
The model form for EPPO is shown below, and its R2 value was 0.88895.
y = 0.082389279 × X1 − 40,182.89288 × X2 − 12.18854116 × X3 + 17,172.75997
In Table 4, the p-value for each variable used in the model is presented.
The forecast for Warsaw Chopin Airport was made in the same way as for the Poznan-Lawica airport. To build the model, the following statistically significant variables were used: the number of passengers at a given airport (X1), the mobility coefficient for a given urban agglomeration (the number of passengers served divided by the population in a given agglomeration, X2), and the number of aircrafts registered in Poland (X3). The model form for EPWA is shown below, and its R2 value was 0.95221.
y = 0.00627538 × X1 − 67.40157734 × X5 + 1275.993658 × X3 + 132,566.3116
In Table 5, the p-values for each variable used are presented. The variables used were the same as in the EPPO model.

3. Results and Discussion

3.1. Emissions of One-Minute Towing

For each of the selected aircrafts, emissions from 1 min of towing were calculated for every towing method, and the results are presented in Table 6. For diesel- and petrol-fueled conventional towing vehicles, the emission indices are the same regardless of the aircraft type, so the harmful exhaust emissions for 1 min are the same for each aircraft considered.
When comparing the aircrafts with each other, it can be noted that for full- and half-engine taxiing methods, CO emissions are the highest for Embraer 195—almost 2.4 times higher than for A321neo and 2.8 times higher than for B737. HC emissions for full- and half-engine taxiing methods are significantly lower for A321neo than for B737 (13 times lower) and for Embraer 195 (108 times lower). For nitrogen oxides, Embraer 195 has the lowest values per 1 min of taxiing, 2.3 times lower than for A321 neo, and 1.6 times lower than for B737. For CO2 and PM emissions, the lowest value per 1 min is also for Embraer 195, almost 1.2 times lower than for A321neo and 1.1 times lower than for B737.
Emissions of CO, NOx, CO2, and PM for an electric towing vehicle per 1 min of towing are the highest for A321neo and the lowest for Embraer 195, which is related to the MTOW of each aircraft and the required energy to tow the aircraft.

3.2. Emissions of Harmful Exhaust Compounds for EPWA and EPPO

When comparing the emissions during the taxi phase at EPPO and EPWA for CO (Figure 3), it can be noted that the highest emissions are for a petrol-fueled towing vehicle for every analyzed aircraft. Differences in emissions between EPWA and EPPO result from different taxi times at these airports, and they are correspondingly lower for EPPO, where the taxi time is 2 min shorter than at EPWA. Results for CO emissions (Figure 3a) from diesel-fueled towing vehicles and electric towing vehicles are very low compared to other towing methods, and they are the lowest for electric towing vehicles. Taxiing on a single engine for every selected aircraft can halve emissions compared to full-engine taxiing. Emissions of petrol-fueled towing vehicles are higher than for full-engine taxiing in every aircraft, which is related to emission indices of petrol-fueled towing vehicles. That shows that taxiing on full-engines can be more ecological than using petrol-fueled towing vehicles during the taxi phase. The smallest difference in emissions of CO for petrol-fueled towing vehicles and full-engine methods is for Embraer 195, but for A321neo and B737, the CO emission reduction is significant when using full-engines.
For HC emissions (Figure 3b), the highest values are for Embraer 195 for every taxing method and are significantly higher for full- and half-engines than conventional towing vehicles. For this aircraft, the lowest values are for diesel-fueled towing vehicles. Emissions of HC for diesel- and petrol-fueled towing vehicles are the same for each aircraft, and for A321neo, the highest HC emissions are for petrol-fueled towing vehicles and the lowest are for half-engine taxiing. For B737, the highest emissions of HC are also for petrol-fueled towing vehicles and the lowest are for diesel-fueled towing vehicles.
The emissions of nitrogen oxides (Figure 3c) are the lowest for every aircraft for electric towing vehicles, and the value is from 1.5 to 2.8 g per taxi. The results for petrol-fueled towing vehicles are the second-lowest for every aircraft. The results for half-engines and diesel-fueled towing vehicles are close for A321neo and B737; for Embraer 195, the differences between these two methods are bigger, with emissions from diesel-fueled towing vehicles 55% higher than for half-engines. The highest emissions are for full-engine taxiing for every aircraft, but the lowest are for Embraer 195 compared to A321neo and B737.
Emissions of carbon dioxide are shown in Figure 3. Emissions from half-engines are half those for full-engines for selected aircrafts (Figure 3e). Emissions of CO2 for towing vehicles (Figure 3d) are the lowest for electric vehicles and are equal to 4.2 kg for A321neo, 4.4 kg for B737, and 2.3 kg for Embraer 195, while the CO2 emissions for diesel towing vehicles are equal to 110.9 kg for each aircraft, and for petrol-fueled towing vehicles, are equal to 82.4 kg for each aircraft. The difference between the diesel- and petrol-fueled towing vehicles is 35% for each aircraft. The reduction in CO2 emissions due to the use of a towing vehicle (diesel, petrol, or electric) is significant compared to full- and half-engine taxiing methods.

3.3. EPPO NOx and CO2 Emission Forecast

Figure 4, Figure 5, Figure 6 and Figure 7 present forecast charts of selected exhaust gas components. Only NOx and CO2 emissions were analyzed, as these are consistently present and measurable in all of the solutions considered. Two pairs of solutions were compared: taxiing with an electric towing vehicle (electric truck) and a petrol-fueled towing vehicle (petrol truck). The other pairwise comparison was taxiing with half of the engines (one engine) and a petrol-fueled towing vehicle (petrol truck).
As can be seen in Figure 4, the use of an electric towing vehicle for taxiing will contribute to a significant reduction in NOx emissions. The difference between NOx emissions in these two solutions is 35 times for B737-800, 37 times for A321neo, and 57 times for Embraer 195. These differences reflect one year of operation. Over an 18-year period (compared to 2022), NOx emissions at EPPO are projected to rise by approximately 30%, which is directly related to the increasing number of flight operations. According to the forecast, the number of operations will increase over 30% by 2040.
Figure 5. NOx emissions during taxi operation with one engine and petrol-fueled towing vehicle at EPPO.
Sustainability 17 08242 g005
As shown in Figure 5, the use of a petrol-fueled towing vehicle for taxiing, compared to taxiing with one engine, will contribute to a significant reduction in NOx emissions. The difference between NOx emissions in these two solutions is almost five times in the case of A321neo, three times for B737-800, and two times when using Embraer 195. These are differences for each year of airport operations.
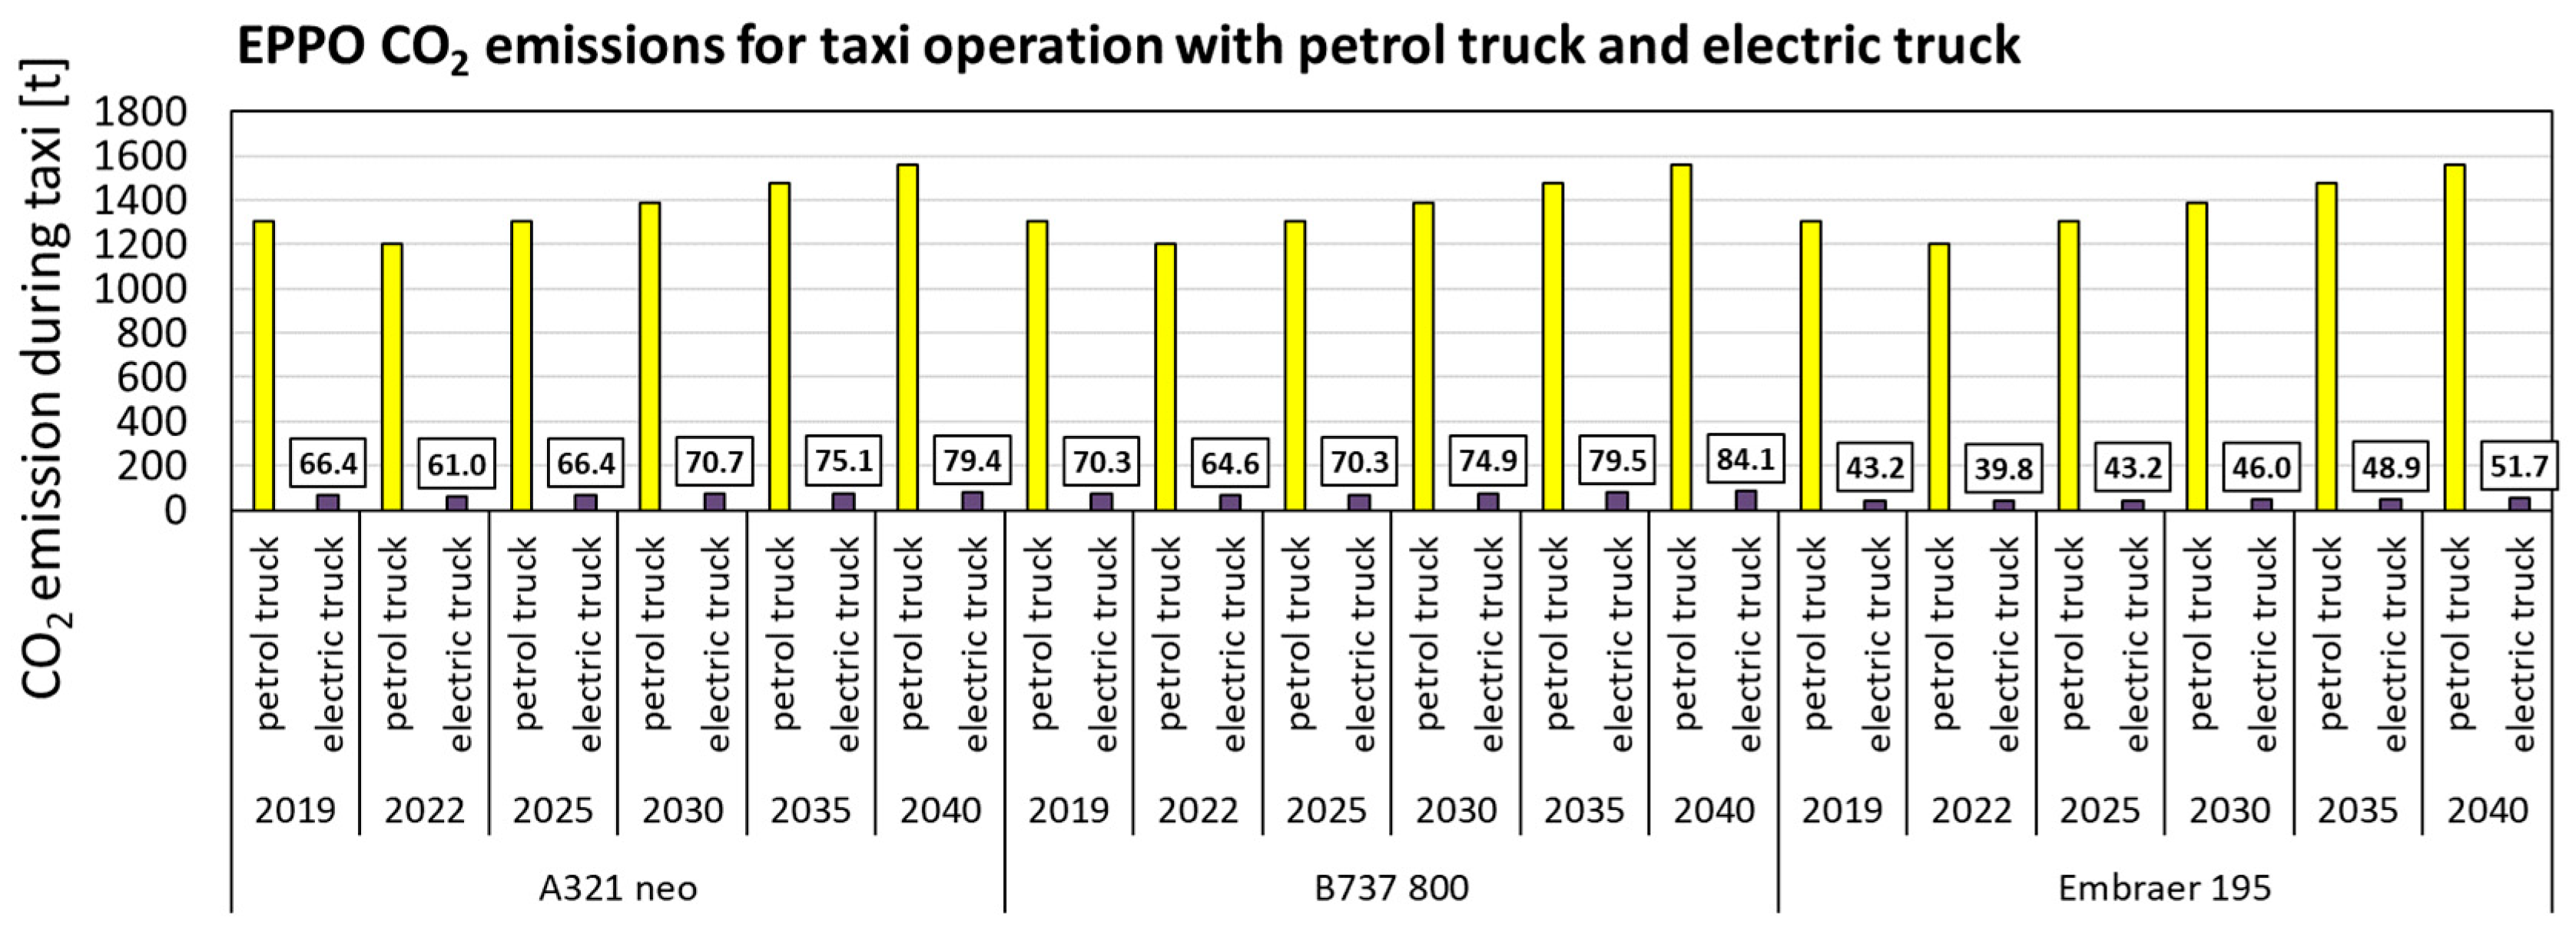
Figure 6. CO2 emissions during taxi operation with electric towing vehicle and petrol-fueled towing vehicle at EPPO.
Sustainability 17 08242 g006
As shown in Figure 6, the use of an electric towing vehicle for taxiing will contribute to a significant reduction in CO2 emissions compared to using a petrol-fueled towing vehicle. Each year, the difference between CO2 emissions in these two solutions is almost 20 times in the case of A321neoeo, 19 times for B737-800 and 30 times when using Embraer 195.
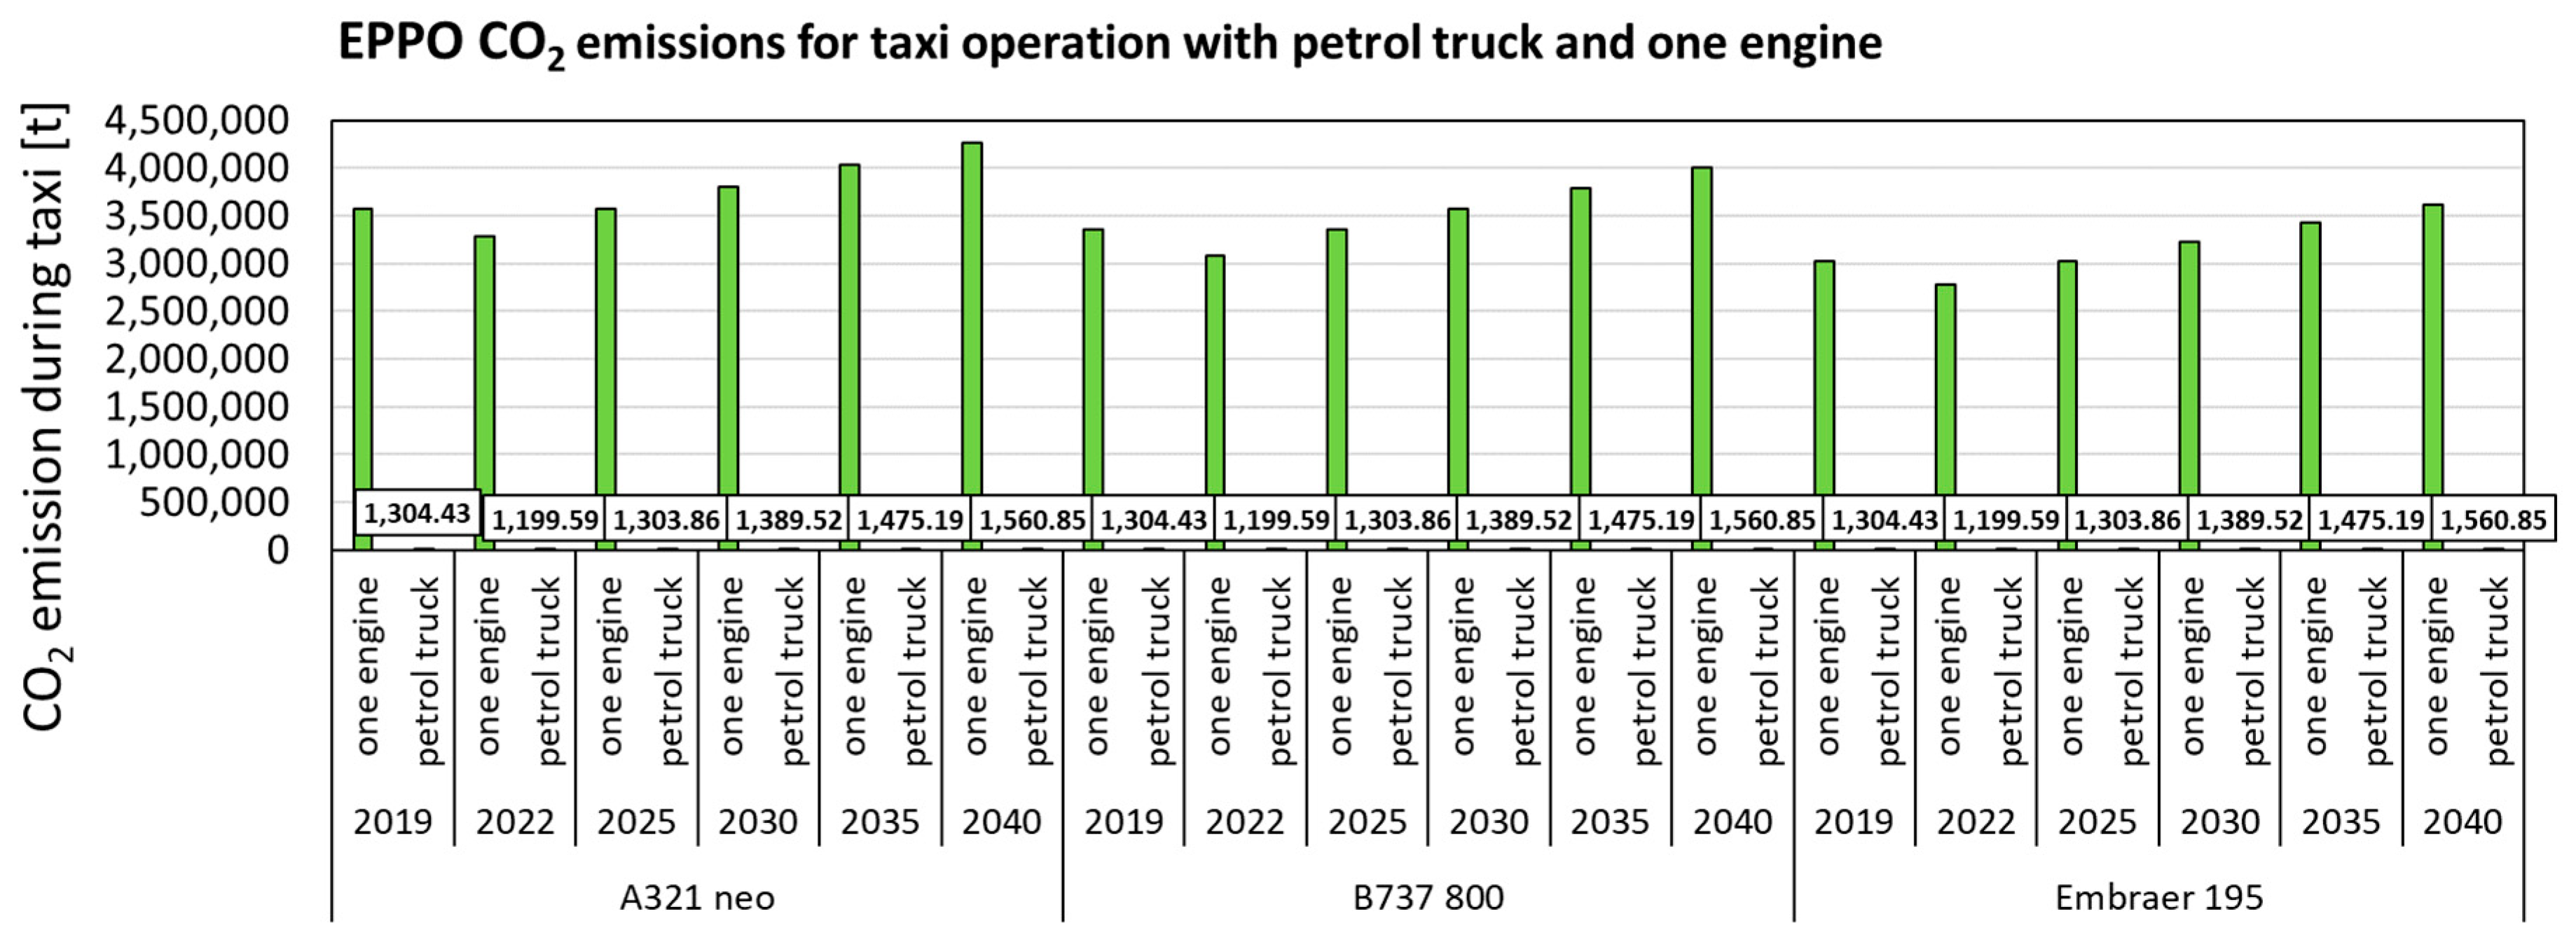
Figure 7. CO2 emissions during taxi operation with half-engines and petrol-fueled towing vehicle at EPPO.
Sustainability 17 08242 g007
As shown in Figure 7, using a petrol-fueled towing vehicle for taxiing will contribute to a significant reduction in CO2 emissions compared to taxiing with one engine turned off. CO2 emissions when using a petrol-fueled towing vehicle for taxiing are 2734 times lower for A321neo than when taxiing with one engine. For the remaining aircrafts, they are 2568 times lower in the case of B737-800 and 2320 times lower for Embraer195. Over an 18-year period (compared to 2022), CO2 emissions at EPPO will increase by 30%, which is directly related to the increasing number of flight operations. According to the forecast, the number of operations will grow by more than 30% by 2040.

3.4. EPWA NOx and CO2 Emission Forecast

Figure 8, Figure 9, Figure 10 and Figure 11 present forecast charts of selected exhaust gas components.
As shown in Figure 8, taxiing with an electric towing truck versus petrol trucks will contribute to a significant reduction in NOx emissions. The difference between NOx emissions in these two solutions is 35 times in the case of B737-800, 37 times for A321neo, and 57 times for Embraer 195. Over an 18-year period (compared to 2022), NOx emissions at Warsaw Chopin Airport are projected to rise by approximately 71%, which is directly related to the increasing number of flight operations. According to the forecast, the number of operations will increase by 71% by 2040.
Figure 9. NOx emissions during taxi operation with one engine and petrol-fueled towing vehicle at EPWA.
Sustainability 17 08242 g009
Figure 8, Figure 9, Figure 10 and Figure 11 present NOx and CO2 emissions at Warsaw Chopin Airport, comparing taxiing with one engine, taxiing with an electric towing vehicle, and taxiing with a petrol-fueled towing vehicle. Since emissions for each were modeled using real data (taxiing time calculated from Flight Radar for each airport) and use of indicators from the ICAO databank, the relative differences between the solutions are the same for both airports. As a result, the absolute emission values are different for each airport, but the comparative differences remain unchanged. Over an 18-year period (compared to 2022), CO2 emissions at Warsaw Chopin Airport will increase by approximately 71%, which is directly related to the increasing number of flight operations. According to the forecast, the number of operations will increase by 71% by 2040.
Figure 10. CO2 emissions during taxi operation with electric towing vehicle and petrol-fueled towing vehicle at EPWA.
Sustainability 17 08242 g010
Taking into account the analyses carried out on the basis of air traffic forecasts, the largest emission differences between individual solutions occur in the case of using drives such as those on Airbus A321neo and Embraer 195 aircrafts. In the case of NOx emissions, the use of an electric towing vehicle during taxiing, compared to a petrol one, will reduce emissions by 57 times each year, while in the case of CO2, this difference is 30 times higher for the power unit used in the Embraer 195 aircraft. When comparing the use of a petrol-fueled towing vehicle with taxiing on one aircraft engine, the largest differences occur for the Airbus A321neo aircraft. The use of a petrol truck will reduce NOx emissions by 5 times each year, and CO2 emissions by almost 2750 times.
Figure 11. CO2 emissions during taxi operation with one engine and petrol-fueled towing vehicle at EPWA.
Sustainability 17 08242 g011

4. Discussion

Many current research studies concern the impact of emissions from aircraft engines in the vicinity of airports [18,19,20]. This is an important topic not only due to the interest of researchers but also, above all, due to numerous European and national projects aimed at reducing emissions of toxic exhaust components from air transport. Emissions of harmful exhaust compounds from taxi phase play a crucial role in the air quality in the vicinity of airports [21,22]. The standard taxi phase described by the LTO cycle takes 26 min, but depending on the infrastructure of a specific airport, this time can be much shorter, and in this research, the actual time of the taxi phase was taken into consideration, based on the data on real flights. Changes in taxiing methods can significantly reduce emissions of harmful exhaust compounds. The use of solutions such as a petrol-fueled towing vehicle can significantly reduce exhaust emissions. In the case of NOx emissions, the differences in the use of individual solutions, compared to taxiing on one aircraft engine, are several times greater each year, and for CO2 emissions, the reduction is up to 2500 times. If an electric towing vehicle is used, emissions in the airport area are close to zero. Life-cycle assessment (LCA) of electric towing vehicles used for aircraft pushback at airports allows for evaluating their environmental impact across production, operation, and disposal stages. Key factors include CO2 emissions associated with battery production and battery lifespan. The production of lithium-ion batteries, used in electric ETVs, results in a significant carbon footprint. Emissions can range from 70 to 75 kg CO2 per kWh of battery capacity, with advanced NMC (nickel–manganese–cobalt) batteries reaching 150–200 kg CO2 per kWh. Emissions can be reduced by using renewable energy during manufacturing [7,23]. Battery longevity is critical for the environmental efficiency of ETVs. Typical lithium-ion batteries retain around 80% of their initial capacity after 1500–2000 charge cycles, equivalent to approximately 300,000–400,000 km. Airport tow truck vehicles typically cover 10,000–15,000 km per year, implying that battery replacement may be required after 20–30 years of use [23]. Despite higher emissions from battery production, electric ETVs have substantially lower operational CO2 emissions compared to diesel counterparts. Studies suggest up to a 90% reduction in operational emissions when electricity is sourced from low-carbon grids [23]. This was also shown and confirmed in the current article’s analysis. LCA of airport electric towing vehicles highlights the need to account for battery production emissions, lifespan, and operational CO2 savings. While battery manufacturing contributes significantly to the carbon footprint, operational benefits outweigh these emissions. Further improvements in battery longevity and the integration of renewable energy into production can enhance environmental performance [7,23]. However, their operational efficiency and environmental benefits depend on the charging strategies and fleet size. Charging strategies significantly affect the availability and utilization of ETVs. Airports with a high operational intensity often require vehicles to be available for continuous or near-continuous operation. Opportunity charging, where vehicles are charged during idle periods between operations, can maintain a higher fleet availability but requires investment in multiple charging stations across the apron. Conversely, overnight charging is simpler to implement but can lead to underutilization during peak operational hours if vehicles are not fully charged at the start of the day [8]. Simulations indicate that airports with high daily aircraft movements (>1000 pushback operations) benefit from mixed charging strategies. For instance, scheduling short 15–30 min opportunistic charging sessions after every 2–3 operations can maintain 90–95% vehicle availability [8]. A smaller fleet may require vehicles to perform multiple trips between gates, increasing the likelihood of downtime due to charging or maintenance. In contrast, a larger fleet ensures that a sufficient number of ETVs are always available for taxi operations, but increases initial capital costs and the complexity of fleet management [10]. Optimizing the fleet size relative to peak traffic periods is essential. For example, during peak morning departures, a small fleet may be insufficient, requiring diesel backup or delays in pushback operations [10]. Benidis et al. indicate that deep learning models, including RNNs and attention-based architectures, enable accurate modeling of nonlinear emission trends [24]. Masini et al. highlight the benefits of hybrid approaches combining traditional statistical methods with machine learning, which can improve forecasts in highly volatile contexts [25]. Spiliotis and Wang suggest integrating various approaches and developing interpretable models to support strategic decisions on emission reduction [26,27].

5. Conclusions

The research clearly shows the importance of reducing emissions of harmful exhaust gases during taxiing operations. The introduction of the analyzed solutions may, in the future, significantly affect emission levels in the vicinity of airports and significantly change the quality of life and work of people living in these areas. Calculation showed that, when using electric towing vehicles, the emissions of CO and NOx are reduced almost to zero compared to other taxiing methods. For CO emissions, full-engine taxiing is more ecological than using petrol-fueled towing vehicles, but emissions from Embraer 195 are the highest from selected aircrafts. HC emissions are the lowest for A321neo, but they are also very low for diesel-fueled towing vehicles. Using electric tow trucks significantly reduces CO2 emissions compared to other methods, where for the electric method, CO2 emissions are equal to 2.8–4.4 kg, while for full-engines, the values are from 380 to 450 kg. Based on the air traffic forecast, it was possible to present the emissions of selected exhaust components during taxiing at two Polish airports. According to the forecast, emissions in the following years (until 2040) will increase at the Poznan-Lawica airport by 30%, and at Warsaw Chopin Airport by 71%. Such dynamically developing air traffic indicates a significant need to reduce exhaust emissions in the vicinity of airports, with a particular emphasis on taxiing operations. It is very important to constantly conduct research and analyses taking into account actual taxiing times at individual airports and to consider which alternative solutions for taxiing operations will be the most beneficial for each of them. To maximize the utilization and environmental benefits of using different solutions and tow trucks, airports should integrate fleet sizing, charging infrastructure, and operational scheduling; battery degradation and CO2 emissions from battery production must be considered in life-cycle assessments to ensure true environmental gains; and decision support tools or simulation models can optimize the trade-offs between availability, battery health, and operational costs.
By adopting these strategies, airports can achieve reliable taxi and pushback operations, reduce diesel usage, and minimize their carbon footprint. Future research should focus on developing transfer machine learning techniques to leverage data across regions and airlines, probabilistic forecasting to quantify uncertainty in emissions, and interpretable AI methods to support regulatory compliance and sustainability planning.

Author Contributions

Conceptualization, M.M. and P.K.-P.; data curation, M.M.; formal analysis, M.M. and P.K.-P.; methodology, M.M. and P.K.-P.; resources, M.M. and P.K.-P.; software, M.M.; supervision, M.M. and P.K.-P.; validation, M.M.; visualization, M.M.; writing—original draft, M.M. and P.K.-P.; writing—review and editing, M.M. and P.K.-P. All authors have read and agreed to the published version of the manuscript.

Funding

This research received no external funding.

Institutional Review Board Statement

Not applicable.

Informed Consent Statement

Not applicable.

Data Availability Statement

The original contributions presented in this study are included in the article. Further inquiries can be directed to the corresponding author.

Conflicts of Interest

The authors declare no conflicts of interest.

References

  1. Masiol, M.; Harrison, R.M. Aircraft engine exhaust emissions and other airport-related contributions to ambient air pollution: A review. Atmos. Environ. 2014, 95, 409–455. [Google Scholar] [CrossRef] [PubMed]
  2. International Civil Aviation Organization (ICAO). Airport Air Quality Manual; Doc. 9889; ICAO: Montreal, QC, Canada, 2020. [Google Scholar]
  3. Webb, S.; Whitefield, P.D.; Miake-Lye, R.C.; Timko, M.T.; Thrasher, T.G. Research Needs Associated with Particulate Emissions at Airports; ACRP Report 6; Transportation Research Board: Washington, DC, USA, 2008. [Google Scholar]
  4. Mazaheri, M.; Johnson, G.R.; Morawska, L. An inventory of particle and gaseous emissions from large aircraft thrust engine operations at an airport. Atmos. Environ. 2011, 45, 3500–3507. [Google Scholar] [CrossRef]
  5. Galant-Gołębiewska, M.; Jasiński, R.; Nowak, M.; Kurzawska, P.; Maciejewska, M.; Ginter, M. Methodical aspects of the LTO cycle use for environmental impact assessment of air operations based on the Warsaw Chopin Airport. Aviation 2021, 25, 86–91. [Google Scholar] [CrossRef]
  6. Nowak, M.; Jasiński, R.; Frąckowiak, A. Adaptation of the LTO test to the local airports infrastructure. Transp. Res. Procedia 2020, 51, 349–356. [Google Scholar] [CrossRef]
  7. Maurizio, C.; Prapti, M.; Mauro, S.; Theo, H. Meta-analysis of life cycle assessments for Li-Ion batteries production emissions. arXiv 2018. [Google Scholar] [CrossRef]
  8. Xiu, W.; Wang, S.; Qi, W.; Li, X.; Wang, C. Charging strategies for electric ground support equipment in airports: A simulation-based analysis. Sustainability 2021, 13, 5032. [Google Scholar] [CrossRef]
  9. Ahmadi, S. Green Airport Operations: Conflict and Collision Free Taxiing Using Electric Powered Towing Alternatives. Ph.D. Thesis, Concordia University, Montréal, QC, Canada, 2019. [Google Scholar]
  10. Zoutendijk, M.; Mitici, M. Fleet scheduling for electric towing of aircraft under limited airport energy capacity. Energy 2024, 294, 130924. [Google Scholar] [CrossRef]
  11. van Baaren, E.; Roling, P.C. Design of a zero emission aircraft towing system. In AIAA Aviation 2019 Forum; AIAA: Reston, VA, USA, 2019. [Google Scholar] [CrossRef]
  12. Taxibot-International. Taxibot International. Available online: http://www.taxibot-international.com (accessed on 3 March 2024).
  13. International Civil Aviation Organization (ICAO). ICAO Aircraft Engine Emissions Databank; ICAO: Montreal, QC, Canada, 2023. [Google Scholar]
  14. European Union Aviation Safety Agency (EASA), ICAO Aircraft Engine Emissions Databank. Available online: https://www.easa.europa.eu/en/domains/environment/icao-aircraft-engine-emissions-databank (accessed on 14 April 2024).
  15. Hospodka, J.; Stloukal, B. Environmental impacts of using electric tow trucks. Transp. Res. Procedia 2023, 75, 161–172. [Google Scholar] [CrossRef]
  16. KOBiZE. CO2, SO2, NOx, CO and Total Dust Emission Indicators for Electricity Based on Information Contained in the National Database on Emissions of Greenhouse Gases and Other Substances for 2022; National Center for Emission Balancing and Management: Warsaw, Poland, 2023. [Google Scholar]
  17. Cao, F.; Tang, T.-Q.; Gao, Y.; You, F.; Zhang, J. Calculation and analysis of new taxiing methods on aircraft fuel consumption and pollutant emissions. Energy 2023, 277, 127618. [Google Scholar] [CrossRef]
  18. Halil, Y.; Akdeniz. Estimation of aircraft turbofan engine exhaust emissions with environmental and economic aspects at a small-scale airport. Aircraft Eng. Aerosp. Technol. 2022, 94, 176–186. [Google Scholar] [CrossRef]
  19. Yang, X.; Chen, S.; Lang, J.; Xu, R.; Lv, Z. Characterization of aircraft emissions and air quality impacts of an international airport. J. Environ. Sci.–China 2018, 72, 198–207. [Google Scholar] [CrossRef] [PubMed]
  20. Seyed, A.T.; Shafabakhsh, G.; Aghayan, I. Evaluation of aircraft emission at Imam Khomeini International Airport and Mehrabad International Airport. Int. J. Environ. Sci. Technol. 2019, 16, 6587–6598. [Google Scholar] [CrossRef]
  21. Di Paola, M.V.; Corazza, N.R.; Rosa, L.M. Optimization of Aircraft Taxiing Strategies to Reduce the Impacts of Landing and Take-Off Cycle at Airports. Sustainability 2022, 14, 9692. [Google Scholar] [CrossRef]
  22. Totakura, B.R.; Khanka, S.; Jagadeesan, A.K.; Khanna, A. Study of Carbon Emission During Taxi-Out Operation at International Airport. In Advances in Environment Engineering and Management; Springer: Cham, Switzerland, 2021; pp. 323–340. [Google Scholar] [CrossRef]
  23. International Council on Clean Transportation (ICCT). Effects of Battery Manufacturing on Electric Vehicle Life-Cycle Greenhouse Gas Emissions. 2018. Available online: https://theicct.org/wp-content/uploads/2021/06/EV-life-cycle-GHG_ICCT-Briefing_09022018_vF.pdf (accessed on 5 August 2025).
  24. Benidis, K.; Rangapuram, S.S.; Flunkert, V.; Wang, Y.; Maddix, D.; Turkmen, C.; Gasthaus, J.; Bohlke-Schneider, M.; Salinas, D.; Stella, L. Deep learning for time series forecasting: Tutorial and literature survey. arXiv 2020. [Google Scholar] [CrossRef]
  25. Masini, R.; Medeiros, M.C.; Mendes, E.F. Machine learning advances for time series forecasting. J. Econ. Surv. 2021, 35, 2070–2109. [Google Scholar] [CrossRef]
  26. Wang, Q.; Liu, Q.; Ma, Z.; Wang, J.; Ni, Y.; Ren, W.; Wang, H. Data interpretation and forecasting of SHM heteroscedastic measurements under typhoon conditions enabled by an enhanced Hierarchical sparse Bayesian Learning model with high robustness. Measurement 2024, 230, 114509. [Google Scholar] [CrossRef]
  27. Spiliotis, E. Time series forecasting with statistical, machine learning, and deep learning methods: Past, present, and future. In Forecasting with Artificial Intelligence; Springer: Cham, Switzerland, 2023; Available online: https://www.researchgate.net/publication/374080047 (accessed on 5 August 2025).
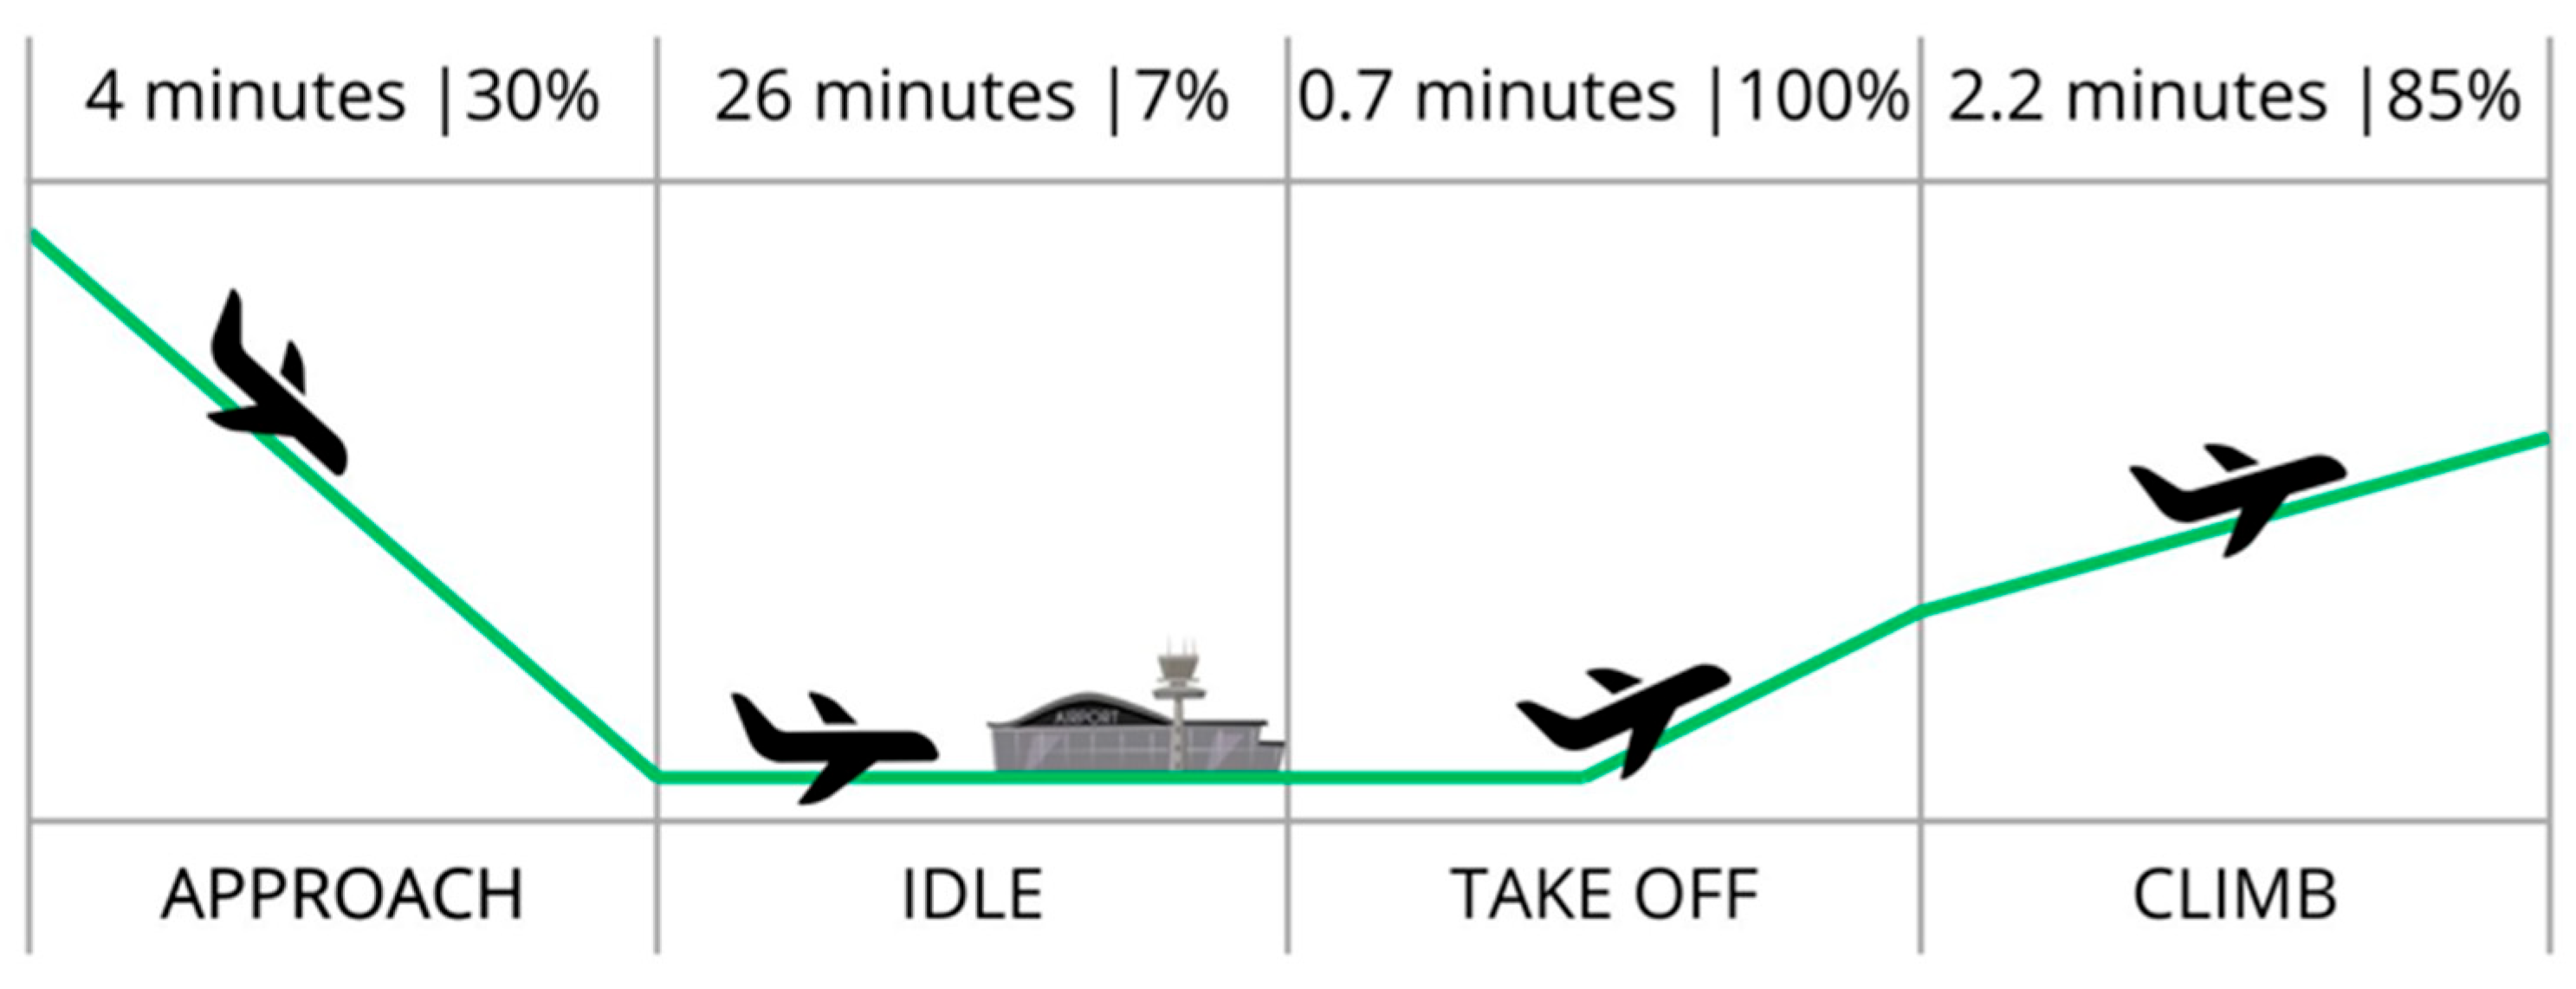
Figure 1. Phases of LTO cycle.
Sustainability 17 08242 g001
Figure 2. Taxi system using Taxibot [12].
Sustainability 17 08242 g002
Figure 3. Total emissions from different methods of aircraft towing for EPWA and EPPO: (a) CO emissions, (b) HC emissions, (c) NOx emissions, (d) CO2 emissions for electric and diesel- and petrol-fueled towing vehicles, (e) CO2 emissions for full- and half-engines.
Sustainability 17 08242 g003
Figure 4. NOx emissions during taxi operation with electric towing vehicle and petrol-fueled towing vehicle at EPPO.
Sustainability 17 08242 g004
Figure 8. NOx emissions during taxi operation with electric towing vehicle and petrol-fueled towing vehicle at EPWA.
Sustainability 17 08242 g008
Table 1. Emission indices for selected engines [13].
Aircraft TypeEngine ModelNumber of EnginesEI CO [g/kg]EI HC [g/kg]EI NOx [g/kg]EI CO2 [kg/kg]EI PM [kg/kg]
A321neoPW1133G-JM217.890.056.983.160.001
B737 8200LEAP-1B25216.010.744.943.160.001
Embraer 195GE CF34-10E5249.986.393.513.160.001
Table 2. Energy required to tow aircraft for one minute.
Aircraft TypeMTOWRequired Energy in kWh for 100% MTOWRequired Energy in kWh for 80% MTOW
A321neo78,0000.6380.510
B737 820082,6000.6750.540
Embraer 19550,7900.4150.332
Table 3. Emission indices of towing vehicles for narrow-body aircraft [17].
Fuel TypeFuel Consumption [kg/bhp-h]HC [g/bhp-h]CO [g/bhp-h]NOx [g/bhp-h]CO2 [g/bhp-h]
Diesel0.01611.24113169
Petrol0.0235424043169
Table 4. p-values for variables used in EPPO forecast model.
Variablep-Value
X10.0008352
X20.0012721
X30.0030019
Table 5. p-value for variables used in EPWA forecast model.
Variablep-Value
X10.0682770
X20.0080732
X30.0059066
Table 6. Emissions per one-minute towing.
CO [g/min]HC [g/min]NOx [g/min]CO2 [kg/min]PM [kg/min]
A321neofull engines212.5330.59482.92237,540.8011,880
half engines106.2670.29741.46118,770.405940
electric0.133-0.2330.350.0092
diesel11.6673.532.0839.24-
petrol5208.6678.6676.87-
B737 8200full engines178.6728.25855.13035,265.6011,160
half engines89.3364.12927.56517,632.805580
electric0.141-0.2460.370.0097
diesel11.6673.532.0839.24-
petrol520.0008.6678.6676.87-
Embraer 195full engines503.79864.41135.38131,852.8010,080
half engines251.89932.20617.69015,926.405040
electric0.087-0.1510.230.0060
diesel11.6673.532.0839.24-
petrol5208.6678.6676.87-
Disclaimer/Publisher’s Note: The statements, opinions and data contained in all publications are solely those of the individual author(s) and contributor(s) and not of MDPI and/or the editor(s). MDPI and/or the editor(s) disclaim responsibility for any injury to people or property resulting from any ideas, methods, instructions or products referred to in the content.