Abstract
This study investigates the drivers of older adult loyalty (OAL) in Thailand’s rail passenger transport sector. Using structural equation modeling (SEM), data from 625 older rail passengers were analyzed to examine the direct and indirect pathways shaping loyalty. The results demonstrate that service innovation (SI) exerted the strongest overall effect on OAL, both directly and through its influence on service quality (SQ) and passenger satisfaction (PS). Interaction-oriented innovations and accessible delivery technologies emerged as particularly influential, highlighting the importance of human-centered innovation in aging societies. Perceived value (PV) also significantly predicted SQ, PS, and OAL, with price fairness, emotional reassurance, and reliability as key sub-dimensions. SQ was confirmed as a central mediator, translating SI and PV into satisfaction and loyalty outcomes, while PS, although significant, played a secondary role. The findings extend existing theories by demonstrating that innovation and value outweigh satisfaction as loyalty drivers in this context. They advance the SERVQUAL, Value–Attitude–Behavior, and Expectancy–Disconfirmation frameworks by showing that satisfaction is a necessary but insufficient condition for loyalty. The study emphasizes aligning innovation, value, and quality to build inclusive, sustainable loyalty strategies for older rail passengers.
1. Introduction
The loyalty of older adults in public transport has been progressively recognized as a strategic concern for public transport operators and policymakers. In the context of rail travel, retaining the loyalty of older adults is essential to ensure continued ridership and to support inclusive and equitable mobility in fast-aging societies. As populations age, older adults’ travel behavior increasingly impacts the financial sustainability of rail networks and motivates the development of more equitable urban mobility systems for all.
OAL (older adult loyalty) has traditionally been defined as the intention and willingness of older passengers to repeatedly choose rail over other alternative modes. Various factors determine it, including service quality perceptions, personal experiences, and demographic influences [1,2,3]. Population aging makes understanding these processes more essential as more European and Asian nations move quickly to ‘super-aged’ societies.
Exacerbating the issue is that demographic change that many countries in East Asia and Europe have transitioned rapidly to ‘super-aged’ societies (≥20% population aged 65+) [4]. For instance, Thailand reached this threshold in 2005, Japan in 2006, and Korea in 2018. According to Leenoi [4], Thailand is the second fastest-aging country in ASEAN (Association of Southeast Asian Nations), after Singapore.
Specifically, in 2024, it was estimated that 13.2 million people in Thailand, or 20% of the population, were over 60 [4], which indicates the Kingdom has reached the demographic milestone of becoming an ‘aged society’. Unfortunately, this demographic is expected to grow to 30% by 2037 [5]. Governments and institutions must ensure everyone can access public services equitably and inclusively [6], especially in transportation systems [7,8].
On the other hand, the transformation of social patterns has influenced family settings with younger people paying more attention to their careers or wanting to start their own families. Simultaneously, Pirzada et al. [9] have reported that older people live alone or separate from joint households more often, making seniors more dependent on public transport systems to maintain their independence and mobility [10,11].
Thailand’s economic development has taken place alongside its demographic revolution, creating the growing need for inclusive mobility and public infrastructure. Existing scholarship has also drawn attention to the need for mobility transport systems (MTS) for older people and people with disabilities [11,12,13,14].
By 2021, close to three million Thais (around 3% of the total population) had registered with government authorities as a person with disability, highlighting the urgent necessity to improve transport infrastructure that fosters equality and improves quality of life [15,16].
Fortunately, Thailand’s government has started implementing Universal Design (UD) across various sectors of society, including transportation and public space. This then facilitates equal access for older adults and persons with disabilities [17,18,19]. According to Carney [20], these interventions aim to decrease socially exclusive practices through upgrading infrastructure, setting policy, working with other agencies, and introducing new services.
Pilot UD projects have already been installed in central transport nodes (e.g., Hua Lamphong Railway Station) with MTS facilities that offer ramps, lifts, accessible toilets, wide doorways, and bilingual Braille signage. Plans for other UD and mobility projects have been outlined across the Thai transportation networks, including several provincial airports [21], which are intended to foster better mobility for all [22].
Although the importance of older adults for the sustainability of public transport systems has gained growing attention, research focusing on ASEAN remains fragmented. Prior studies have focused mainly on a single perspective (e.g., service quality or satisfaction), while service innovation and perceived value have been overlooked. No framework has comprehensively and systematically explored the underlying processes in which these factors collectively shape older rail passengers’ loyalty.
The present study fills this research gap by developing and empirically examining a comprehensive loyalty formation model in Thailand, with extended implications for other super-aged societies experiencing continuous demographic aging, such as Japan, South Korea, and Western Europe. As such, our study makes a broader contribution to the scholarship in both ASEAN and other contexts that have and will continue to experience aging. Our study further extends ongoing theoretical debates around the loyalty of the aging population.
It should be noted that the present study concentrates on older adults who are active users of Thailand’s rail services. As such, the perspectives of seniors with severe mobility impairments—who may face greater barriers to access—are not directly captured, a limitation we acknowledge and return to in the discussion of future research.
This study is also the first systematic ASEAN investigation to jointly examine service innovation, perceived value, service quality, and satisfaction as determinants of older adult rail loyalty using structural equation modeling (SEM). Beyond this methodological contribution, our novelty lies in the cultural adaptation of measurement tools: for example, aligning empathy with the Buddhist concepts of metta (loving-kindness) and karuna (compassion), and tailoring social value to Thailand’s evolving family structures. Together, these theoretical and cultural adaptations extend the literature on loyalty in aging societies.
2. Literature Review and Hypotheses Development
Scholarship on older adult loyalty in public transportation has grown considerably globally [8,11,23], but remains relatively underdeveloped in Southeast Asia compared to Europe and East Asia [24]. Since ASEAN countries are rapidly aging [25] and have diverse mobility infrastructures, bridging this research gap is crucial. This study examines Thailand’s case within the broader ASEAN mobility context [26,27], drawing on existing studies while identifying unique regional characteristics.
2.1. Service Innovation (SI)
Service innovation (SI) refers to creating or improving services, delivery processes, and user interactions that enhance customer experience and organizational competitiveness [28,29]. SI is increasingly critical in the railway sector as operators adapt to demographic change, especially rising older ridership.
In Southeast Asia, research from Singapore and Malaysia shows that technology-enabled innovations, such as mobile ticketing, smart cards, and automated kiosks, enhance older adults’ confidence in public transport systems [30,31,32,33,34]. Studies in Vietnam highlight the role of real-time information systems and bundled innovations in motivating senior ridership. These findings underscore that innovations are not solely technological but cultural, requiring design sensitivities tailored to older users’ needs [35]. In Asia, Universal Design principles are gradually being integrated into transportation systems to improve accessibility and age-friendliness [17,36]. Moreover, post-pandemic innovations have emphasized health safety protocols, which older passengers particularly value [37].
H1.
Higher service innovation (SI) levels are positively associated with improved service quality (SQ).
H2.
Enhanced service innovation (SI) is positively related to increased passenger satisfaction (PS).
H3.
Greater service innovation (SI) is positively associated with higher loyalty among older adult rail service users (OAL).
2.2. Perceived Value (PV)
Perceived value (PV) reflects the benefits passengers derive compared to the costs incurred, encompassing both functional and emotional aspects [38,39]. PV extends beyond price fairness in aging societies to include reliability, emotional reassurance, and dignity.
Regional studies suggest that in Singapore, older MRT users value emotional security and reliability as key determinants of loyalty [32,40]. In Malaysia, seniors’ willingness to continue rail use is shaped by affordability and dignity during service encounters [34]. It was also noted by the study’s authors that the importance of epistemic value as a predictor of rail passenger satisfaction. Hence, clear signage, informative announcements, and accessible digital resources enhance passengers’ knowledge and overall experience.
These findings parallel Thailand’s demographic shift, where many older adults live independently and rely heavily on rail mobility. Thus, PV integrates functional (e.g., affordability) and emotional (e.g., dignity and reassurance) dimensions, both critical for fostering loyalty.
H4.
Higher perceived value (PV) is positively associated with improved service quality (SQ).
H5.
Greater perceived value (PV) is positively related to increased passenger satisfaction (PS).
H6.
Higher perceived value (PV) is positively associated with greater loyalty among older adult rail service users (OAL).
2.3. Service Quality (SQ)
Ample evidence from the ASEAN region shows that older passengers positively correlate with significantly greater reliability, responsiveness, and empathy prioritization when assessing service quality than younger cohorts. Case studies in Kuala Lumpur [24,26] and Manila [41] found that senior passengers relied more on interpersonal respect and feelings of security when using public transport [11]. These expectations in Thailand are heavily culturally rooted in long-standing traditions of adulthood, most notably Buddhist prescriptions of metta (empathy) and interdependent community care that frame service encounters as moral and functional relationships [42,43].
In transport studies, service quality has most commonly been conceptualized through the SERVQUAL (or RATER) framework of reliability, assurance, tangibles, empathy, and responsiveness [44,45,46]. While sometimes seen as an overly generic template, this framework continues to dominate transport studies since it encapsulates the service’s functional and experiential dimensions. For older passengers, each of the dimensions acquires unique salience.
Reliability, which includes predictable schedules and resilient operations, has consistently been the most influential factor shaping both satisfaction and loyalty [47,48,49], as regularity reduces uncertainty and anxiety for those less tolerant to unexpected variation.
Assurance is also understood as employee competence, and courtesy speaks to the need for trust and security that is well documented among seniors [50,51], with older and access-challenged passengers tending to attach great value to the reassurance that staff provide in stations and on board [52].
Tangibles, namely the built environment of stations, the physical accessibility of vehicles, and the intelligibility of wayfinding systems, are accorded disproportionate importance by elderly users. Studies on universal design have shown that age-friendly layouts and barrier-free settings shape public transport systems’ perceived usability and fairness [17,18,19].
Empathy has commonly been associated with a cultural ethos of respect for elders. Several studies in Asian contexts report that the courteous behavior of staff and sensitive attention to age-specific needs are particularly salient loyalty drivers for senior passengers [53].
Responsiveness further reinforces this association, insofar as the willingness of staff to offer timely support, be it in connection with ticket purchase, navigation, or service delays, exerts a direct positive effect on satisfaction [54]. Delay in support, or poor communication and explanation of services, creates a strong effect of disutility among older adults who are generally less tolerant of uncertainty [55]. These findings suggest that while all five dimensions of SERVQUAL continue to matter to perceived service quality [56], their relative weights for older passengers shift considerably, with reliability, empathy, and responsiveness often predominating. From this evidence, the following hypotheses are proposed:
H7.
The increased service quality (SQ) levels are positively related to passengers’ satisfaction (PS).
H8.
More enhanced SQ positively relates to higher loyalty among OAL rail service providers.
2.4. Passenger Satisfaction (PS)
Passenger satisfaction (PS) is not formed through instances alone, but through a combination of experiences over prolonged periods. Studies in Singapore [30,33,50,57] and Malaysia [34] suggest that satisfaction is built up through the sustained experience that reliability and safety are consistent across repeated journeys, and not through fleeting moments of comfort or courtesy [2]. This highlights how satisfaction is grounded in consistency and surety, which breeds certainty and contributes to the sense of security in journeys.
The post-pandemic context has also changed the meaning of satisfaction for older passengers. It has been documented that hygiene, sanitation, and health safety measures have become central determinants of perceived quality, with older passengers being susceptible to the security provided by these measures [3,37]. In other words, service quality today usually takes a broader, more comprehensive meaning that transcends punctuality or courteousness of staff and extends to public health issues.
In turn, the expectations of culture frame the interpretation of satisfaction. For example, in ASEAN contexts, satisfaction as a response to service quality reflects collective dispositions to respect, trust, and fairness in service encounters that respond to social norms of caring for elders and being a responsible community member. Satisfaction is, therefore, undoubtedly a valuable metric to gauge passengers’ experiences. Nevertheless, growing evidence shows that it is a necessary but insufficient condition for loyalty in older adults. Rather, loyalty results from the concurrence of satisfaction with passenger innovation, value, and quality that are subjectively experienced and, as such, are partially grounded in culture.
H9.
Increased PS positively relates to older adult rail service users’ loyalty.
2.5. Older Adult Loyalty (OAL)
Older adult loyalty (OAL) can thus be understood in both behavioral and attitudinal terms: seniors’ regular use of rail services and their intention to recommend those services to others. Loyalty is not simply about repeat travel but a greater emotional commitment that ties passengers to specific providers. In Thailand, which is well on its way to being a “super-aged” society—one where more than 28 percent of the population is older than 60—by 2030 [21], this sort of loyalty will be crucial for maintaining the long-term demand for public transport and for shaping the design of more accessible mobility systems. Tactile guiding tools, improved signage, and barrier-free terminals help develop trust and connection habits.
Older people’s loyalty is cultivated over multiple occasions [23]. If seniors experience safe, guaranteed, and comfortable journeys over several instances, trust and satisfaction will be built accordingly. Previous experiences are important for older passengers. Older people greatly rely on their past experiences to make decisions. These emotions come from the familiarity with a specific service provider, which provides psychological comfort [8] and deters them from switching to alternatives. Habitual loyalty may impede older people in their evaluation of journeys. Older people can be habitually loyal to a particular provider, i.e., senior passengers stick to a provider even if their experience of each journey does not match their expectations, as emotions and habitual behavior are integrated. The motivation to continue using transportation systems combines emotional connection and repetitive behavior. One aspect is the maintenance of emotional ties, and the other is the preservation and accumulation of repeated behavior [58,59].
Accessibility and psychological comfort supplement this loyalty. Many older adults have impaired mobility or are at risk of becoming socially isolated (from friends or family) if accessible and reliable transport systems are not available, which would otherwise enable them to continue living as independently as possible and engaging with their communities. Studies conducted in urban ASEAN contexts have found that crowded stations, complicated service networks, and a lack of seating pose barriers for older users, ultimately decreasing loyalty by causing greater stress and discomfort. Age-friendly and (transport) equity-conscious service features (such as priority seating, straightforward wayfinding and signage, and attentive service response by employees) directly shape loyalty by providing accessible and emotionally reassuring attributes. These findings provide evidence that a commitment to transport equity and inclusivity is not an elective matter but a central pillar for building a capable and reliable public transport system for the ongoing aging of society [12].
2.6. Research Objectives and Research Gaps
While previous studies in the ASEAN region have contributed significant knowledge in quality, satisfaction, and access, the works tend to be fragmented and often do not systematically draw these factors together to offer holistic loyalty models. To the best of our knowledge, extant research in Southeast Asia has not systematically analyzed the complementarity of service innovation (SI), perceived value (PV), service quality (SQ), and passenger satisfaction (PS) and their combined effects on older rail customers’ loyalty using structural equation modeling (SEM). On the contrary, the lack of systematization and their (dis)integration of the SI, PV, SQ, and PS factors has resulted mainly in ignoring innovation and value, with studies tending to concentrate only on quality or satisfaction.
This study closes these gaps by providing a consolidated loyalty formation model for the Thai rail sector, where demographic change makes the stakes especially acute. By integrating innovation, value, quality, and satisfaction, the study offers a more holistic account of loyalty formation in aging societies. Outside Thailand, these findings contribute to the global literature by showing how innovation and value are important in maintaining loyalty among older passengers. They offer additional relevance for other “super-aged” contexts like Japan, South Korea, and Western Europe, where demographic pressures similarly push transport systems to adapt. In this way, the research shows why moving past short-term satisfaction measures toward integrated strategies that enable sustainable and inclusive public transport is necessary.
2.7. Research Objectives (ROs) and Research Questions (RQs)
The purpose of this study is to identify the key determinants of older adult loyalty (OAL) in Thailand’s rail sector [31,32,46]. Specifically, the study evaluates how SI and PV influence perceptions of SQ and PS [60,61], and how these constructs, in turn, shape loyalty outcomes. A further aim is to develop and test a structural equation model (SEM) that captures the loyalty formation process, thereby enriching theoretical understanding and practical strategies for aging ASEAN societies.
Guided by these objectives, the study addresses four main research questions. First, to what extent does SI enhance SQ and PS, thereby strengthening OAL? Second, how does PV contribute to SQ and PS, and does it also directly affect loyalty? Third, do SI and PV influence satisfaction and loyalty primarily through their impact on SQ, highlighting the mediating role of quality? Finally, does PS remain the most influential predictor of loyalty, or does it function more as an intermediate outcome shaped by innovation and quality? Together, these questions frame a comprehensive inquiry into loyalty dynamics among older passengers in rail transport. To ground these objectives theoretically, each latent variable is anchored in established frameworks.
3. Materials and Methods
This section presents the research design, sampling strategy, measurement instruments, and analytical procedures used to test the proposed SEM. Methodological rigor, transparency, and reproducibility are core, so the findings on older adult loyalty (OAL) to rail services can be interpreted confidently.
3.1. Conceptual Framework
Figure 1 illustrates the hypothesized inter-relationships of constructs and indicators. The number of items per construct, their names, and item abbreviations are also noted.
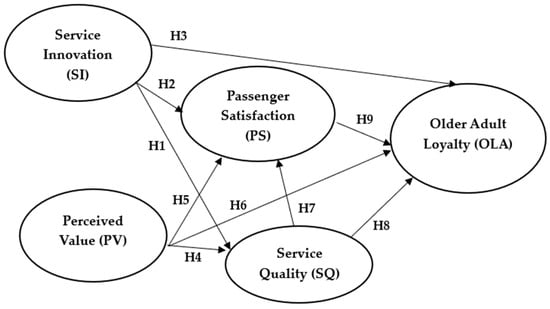
Figure 1.
The study’s conceptual model. Source: the authors.
3.2. Sample and Sampling Procedures
The study targeted Thai SRT rail passengers aged 60 years or older who had completed at least two previous train trips. Following SEM guidelines of ≥20 cases per observed variable [62], 21 observed variables required a minimum of 420 participants. However, the final sample included 625 respondents to improve stability and generalizability. A multi-stage random sampling approach was employed during the multi-stage collection effort.
During Stage 1, SRT’s 25 train stations out of its enormous rail infrastructure were chosen randomly (5 stations each from Northern, Northeastern, Eastern, Southern, and Mae Klong lines) [31,32]. In Stage 2, passengers that was qualified to sample were recruited systematically in five 2 h time durations during the peak ridership (06:00 to 08:00, 09:01 to 11:00, 11:01 to 13:00, 13:01 to 15:00, 15:01 to 17:00) so that various travel patterns would be captured [46]. Based on the survey of passengers from 25 train stations, 625 responses were usable. Each of the person-to-person surveys took approximately 5–10 min.
A further limitation was that only elderly passengers who in fact did actively use the stations were recruited, which excluded elderly passengers having severe mobility problems who try to refrain from riding trains, more likely to be older. This resulted in potential sampling bias, missing the opinions of less mobile older adults who may face greater difficulties with accessibility. Therefore, the findings mainly represent elderly passengers who are already able and willing to use the train services, presenting potential challenges to the generalizability of the findings to the general elderly population.
While this approach improved the representativeness of active older rail passengers, it necessarily excluded seniors with severe mobility limitations who were unable or unwilling to access the stations. As a result, the findings primarily reflect the perceptions of relatively mobile older passengers and may understate the challenges more vulnerable groups face [63].
Although the multi-stage design improved representativeness of active older rail passengers, it necessarily excluded severely mobility-limited seniors who may avoid station use. Furthermore, peak-hour windows may have disproportionately captured frequent travelers. Nonresponse was extremely low (<3%) due to on-site face-to-face surveys, but potential over-representation of regular riders and under-coverage of less-mobile seniors is acknowledged. Future research should address this by applying post-stratification weights, reporting nonresponse more systematically, and extending recruitment beyond stations (e.g., through senior centers and disability organizations).
3.3. Measures
A structured questionnaire, adapted from validated international instruments, measured SI, PV, SQ, PS, and OAL using 5-point Likert scales (5 = strongly agree, 1 = strongly disagree) [64]. To ensure suitability for the Thai context, we implemented a rigorous translation/back-translation process and consulted local experts in transportation and gerontology. Content validity was confirmed by an expert review (IOC = 0.80–1.00), and a pilot test with 30 elderly rail users yielded excellent reliability (Cronbach’s α = 0.96). To ensure suitability for the Thai context, we implemented a rigorous translation/back-translation process and consulted local experts in transportation and gerontology.
Content validity was confirmed by expert review (IOC = 0.80–1.00), and a pilot test with 30 elderly rail users yielded excellent reliability (Cronbach’s α = 0.96), demonstrating strong internal consistency prior to the main survey.
Particular attention was given to construct validity and cultural adaptation. For example, the empathy (SQ5) dimension of SERVQUAL [44] was rephrased to align with the Buddhist concept of metta (loving-kindness) and karuna (compassion) [42,43], which strongly influence interpersonal expectations in Thai service encounters. Similarly, items capturing social value (PV4), adapted from the Value–Attitude–Behavior framework, were adjusted to reflect evolving Thai family structures in which many older adults now travel alone [65]. Service innovation (SI) items were drawn from recent transport and service innovation studies [28,46], and passenger satisfaction (PS) was operationalized using scales consistent with Expectancy–Disconfirmation Theor. Older adult loyalty (OAL) was measured through behavioral intention and attitudinal items commonly used in loyalty research.
Regarding Likert scale adaptation, pretests confirmed that Thai respondents understood the gradations of agreement, but additional examples were provided to ensure clarity for seniors less familiar with survey formats. For instance, researchers illustrated scale use with everyday service experiences (e.g., evaluating cleanliness or staff helpfulness). This process helped minimize response bias and improved measurement accuracy among older adults [66].
Measurement reliability and validity were rigorously assessed. All constructs demonstrated Cronbach’s α ≥ 0.78 and composite reliability (CR) ≥ 0.70. Convergent validity was confirmed with all AVEs ≥ 0.50, and discriminant validity was established using the Fornell–Larcker criterion. Together, these tests confirm the adequacy of the measurement model.
A structured questionnaire, adapted from validated international instruments, measured SI, PV, SQ, PS, and OAL using 5-point Likert scales (5 = strongly agree, 1 = strongly disagree). To ensure suitability for the Thai context, we implemented a rigorous translation/back-translation process and consulted local experts in transportation and gerontology. Content validity was confirmed by expert review (IOC = 0.80–1.00). A pilot test with 30 older rail users further demonstrated strong reliability: Cronbach’s alpha values ranged from 0.83 (OAL) to 0.89 (PS), with an overall reliability of 0.96. These findings confirm the internal consistency of the instrument prior to full deployment.
Empathy items in service quality were aligned with the Buddhist principles of metta (loving-kindness) and karuna (compassion), while social value items were tailored to account for Thailand’s changing family patterns, where many seniors travel independently. This ensured both theoretical fidelity and contextual appropriateness of the measures.
Reliability and validity were further tested with the full sample. All constructs demonstrated Cronbach’s α ≥ 0.78 and composite reliability (CR) ≥ 0.70. Convergent validity was confirmed with AVEs ≥ 0.50, and discriminant validity was established using the Fornell–Larcker criterion. Together, these results support the adequacy of the measurement model.
Each construct was operationalized using measurement items adapted from well-established prior studies. For service innovation (SI), we adopted items from Martin et al. [67], which emphasize new delivery processes, technologies, and interaction channels. Perceived value (PV) was measured following Klepek [68], capturing use, price, emotional, and social value. Service quality (SQ) items drew on Fazal-e-Hasan et al. [69], aligning with SERVQUAL’s core dimensions. Passenger satisfaction (PS) and older adult loyalty (OAL) were adapted from Sukhu et al. [70], which operationalized satisfaction and loyalty outcomes in a service context. Together, these validated scales ensured that the observed items accurately represented the intended latent constructs in this study.
3.4. Common Method Bias Checks
To address potential common method bias (CMB), Harman’s single-factor test was conducted [71]. The largest single factor accounted for 38% of the variance, below the 50% threshold, suggesting that CMB was not a major concern. In addition, a CFA marker variable test confirmed that inclusion of a theoretically unrelated marker variable did not significantly alter factor loadings, further supporting the absence of problematic CMB [72].
3.5. Data Collection
Data were collected between March and June 2024, during which train operations were stable with no significant disruptions to services or policies that might impact the accessibility of older rail users. Our choice of collection period minimizes the likelihood of temporal bias in consumer judgments. The survey was conducted face-to-face by trained researchers. The completeness of onsite checks on survey records promoted the collection of high-quality data. Detailed written and verbal instructions on how to complete the survey, paired with assurances of confidentially and the social value of the study, further encouraged participation. Consequently, missing data in our study was extremely rare, and responses were highly quality.
3.6. Analysis
SPSS v23.0 and LISREL v9.2 were used to conduct the data analysis, with descriptive statistics being used to summarize demographic characteristics and construct means. Pearson correlations (p < 0.05) assessed bivariate associations [73], while an SEM was used to test hypothesized relationships among SI, PV, SQ, PS, and OAL. Model fit was evaluated using multiple indices, including χ2/df, RMSEA, RMR, CFI, GFI, and AGFI, all meeting accepted thresholds. Standardized direct effects (DE), indirect effects (IE), and total effects (TE) were computed, with statistical significance set at p < 0.01.
A bias-corrected bootstrapping procedure with 5000 resamples was employed to test mediation formally [66]. Indirect pathways (e.g., SI → SQ → OAL, PV → PS → OAL) were evaluated with standardized coefficients, 95% confidence intervals (CIs), and p-values. Mediation was considered significant if the CI did not include zero. This approach provides more substantial evidence for indirect effects than traditional Sobel tests and enhances the reliability of mediation findings.
4. Results
The results of the SEM are presented in this section. Analyses include the sample’ descriptive characteristics, latent construct correlations, and tests of the hypothesized relationships. Model adequacy and validity are first established, followed by detailed reporting of the DE, IE, and TE of SI, PV, SQ, and PS on OAL.
4.1. Sample Group Personal Characteristics
The older respondents who reported using Thai SRT train services more than once were nearly even divided between men and women (54.56% vs. 45.44%) (Table 1). Nearly half of the respondents were 60–65 (48.64%), with over half indicating they were married (57.76%).

Table 1.
Sample group personal characteristics (n = 625).
As for the education levels, 52.32% of the passengers had less than a BA/BS degree. Another 36.96% indicated they had completed an undergraduate degree, while another indicated a master’s degree or higher (10.72%). The most common occupational status was an entrepreneur/trader (45.28%). The largest income group had a monthly income between $270–$540 (54.08%).
Concerning train usage, most respondents reported SRT passenger trains as their primary public transport, having used one at least 3–5 times per week (53.92%). The next most frequently cited were less than 3 times per week (23.04%), 6 to 8 times per week (14.24%), eight to ten times per week (5.92%), and more than ten times per week (2.88%).
4.2. Descriptive Statistics
Table 2 presents the descriptive statistics for the latent constructs, assessed on a 5-point Likert scale (4.21–5.00 = highest agreement; 3.41–4.20 = high agreement). The constructs showed high agreement, with M scores ranging from 4.20 (OAL) to PV’s highest score (M = 4.38, SD = 0.46), driven by price value (M = 4.43), supporting the Value–Attitude–Behavior model. Service quality (M = 4.34, SD = 0.76) excelled in reliability (M = 4.50), aligning with the SERVQUAL Model [44,74]. Service innovation (M = 4.30, SD = 0.68) was most assertive in passenger interaction processes (M = 4.32), reflecting TAM principles [13]. Passenger satisfaction (M = 4.23, SD = 0.78) and OAL (M = 4.20, SD = 0.68) showed strong ratings, particularly in convenience (M = 4.32) and repeat behavior (M = 4.43), consistent with Expectancy-Disconfirmation and Loyalty Theories [1,24].
Table 2.
Descriptive statistics, kurtosis, and skewness values for the variables.
Standard deviations (0.46–0.89) indicated consistent responses. Negative skewness (−6.75 to −2.53) suggested predominantly positive ratings, with some lower scores for empathy (M = 4.14) and service channels (M = 4.15). Kurtosis values (−1.97 to 1.54) indicated platykurtic distributions, reducing outlier risk. Satorra-Bentler adjusted maximum likelihood in LISREL addressed non-normality, ensuring robust analysis. Lower scores in empathy and service channels suggest that targeted personalized communication and access improvements could enhance older rail service experiences.
4.3. Reliability, Validity, and Correlation Analysis
Table 3 reports the pilot test of 30 older rail passengers, including content validity (IOC) and internal consistency reliability (Cronbach’s α) for each construct. All constructs achieved IOC values between 0.80 and 1.00 and Cronbach’s α values ranging from 0.83 to 0.89, with an overall reliability of 0.86. These results demonstrate excellent content validity and internal consistency reliability.
Table 3.
Pilot test reliability and content validity of measurement constructs (n = 30).
Table 4 presents the Pearson correlation coefficients among the five latent variables (SI, PV, SQ, PS, and OAL). All ten pairwise correlations were significant at the 0.01 level, confirming meaningful associations between the constructs. Passenger satisfaction and perceived value (r = 0.75) held the strongest positive correlation, followed by perceived value and service innovation (r = 0.73). Service quality and innovation (r = 0.40) had the weakest but still significant positive correlation. No coefficient exceeded 0.80, indicating limited multicollinearity and supporting discriminant validity.
Table 4.
Pearson correlation coefficients (r) among the latent variables.
Sample adequacy was also confirmed with a KMO value of 0.855, exceeding the recommended 0.50 threshold, and Bartlett’s test of sphericity was significant (χ2 = 493.736, df = 10, p < 0.001). Together, these results verify that the correlation matrix was suitable for factor analysis and subsequent SEM.
4.4. Confirmatory Factor Analysis (CFA)
The confirmatory factor analysis (CFA) and full SEM estimation indicated excellent model fit: χ2 = 202.53, df = 176, p = 0.68; χ2/df = 1.15; RMSEA = 0.001, 90% CI [0.000–0.015]; RMR = 0.002; CFI = 0.99; GFI = 0.99; AGFI = 0.99. Reporting decimals and 90% confidence intervals for RMSEA ensures transparency. These indices exceed conventional thresholds, confirming robust measurement validity and supporting the adequacy of the proposed measurement model.
4.5. Factor Loadings and R2
All observed variables loaded strongly and significantly on their respective latent constructs, with bsc (standardized factor loading) ranging from 0.78 to 0.87 (Table 5). Service innovation’s (SI) passenger interaction processes (SI4) had the highest loading (0.87), emphasizing the importance of relational and interactive elements of innovation. Additionally, perceived value (PV) and price value (PV2) had the highest score value (0.85), which reaffirmed the cost sensitivity characteristic’s effect on the value of elderly passengers. Responsiveness (SQ3) had the highest significant contribution (0.86) among the service quality (SQ) characteristics, which was expected for an accessibility-sensitive population. As expected, passenger satisfaction (PS) characteristics, physical characteristics (PS1), and convenience (PS2) were elements with dominant contribution, in line with the aforementioned Universal Design characteristics [17,18,19]. Furthermore, recommendations (OAL4) and repeat behavior (OAL3) had a high impact (both ≥ 0.83) on the older adult loyalty, suggesting behavioral significance. Finally, R2 for the observed variables (OV) ranged from 0.31 to 0.37, supporting that the model explains a large portion of item-level variance.
Table 5.
Factor loadings and coefficients of determination (R2).
4.6. Theoretical Implications and Model Validity
Since all the latent variables showed a significance correlation (p < 0.01), this indicates the correlations among the five constructs were theoretically strong. The strongest correlation was confirmed between PV and PS (r = 0.75), consistent with Biao et al. [38], who suggested that PV was a major driver for PS. The positive correlation between SQ and OAL (r = 0.75) also confirmed that SQ is necessary to maintain a long-term relationship with loyal consumers.
Finally, apart from these correlations, the overall validity of each model was also verified with high KMO values (0.855), statistically significant results of Bartlett’s Test of Sphericity. The SEM fit indices of each model were checked to ensure that the integrated framework’s specification (hypothesized structure) is statistically adequate and theoretically meaningful. These observations supported the validity of the validated integrated framework and justified the subsequent interpretation of the SEM findings.
4.7. DE, IE, and TE Statistical Analysis
Table 6 presents the SEM’s standardized DE, IE, and TE. The SEM explained 72% of the variance in OAL (R2 = 0.72), 65% of the variance in PS (R2 = 0.65), and 44% of the variance in SQ (R2 = 0.44). All structural paths were positive and statistically significant (p < 0.01).
Table 6.
DE, IE, and TE on Rail Service OAL.
To formally test mediation, a bias-corrected bootstrapping procedure with 5000 resamples was conducted [66]. Table 7 reports the indirect pathways with standardized coefficients, 95% confidence intervals (CI), and significance levels.
Table 7.
Bootstrapped the IE of mediation paths.
The results confirm multiple significant mediation pathways. Specifically, service quality (SQ) mediated both SI and PV in their effects on OAL, while passenger satisfaction (PS) served as an additional mediator for both SI and PV. SQ also mediated the effect of SI and PV on PS, which influenced OAL. These findings highlight a multi-step loyalty formation process in which SI and PV enhance perceptions of SQ, which subsequently drives PS and ultimately strengthens OAL.
4.8. Interpretation of Effects
The mediation analysis reinforces the central role of SQ as the primary mediator, with the most substantial indirect effect observed in the path SI → SQ → OAL (β = 0.23, p < 0.001). PS also functioned as a partial mediator with more minor indirect effects than SQ. These findings suggest that innovation and value do not influence older adult loyalty (OAL) solely through direct effects but operate through a layered mechanism involving service quality and satisfaction, confirming the conceptual model.
4.8.1. Direct Effects on OAL
The most substantial direct pathway was SQ → OAL (DE = 0.65), followed closely by SI → OAL (DE = 0.62), underscoring that reliable service delivery and innovation-driven features are the strongest drivers of loyalty. PV → OAL showed a moderate direct effect (DE = 0.47), while PS → OAL exhibited the weakest direct effect (DE = 0.34), reflecting its role as a downstream outcome in the causal chain.
4.8.2. Indirect Effects on OAL
SI produced the most significant indirect effect on loyalty (IE = 0.34), primarily through its impact on SQ and PS, confirming its foundational role in the service system [75]. PV also demonstrated a meaningful indirect influence (IE = 0.30), highlighting the importance of perceived fairness, emotional attachment, and value transmission in strengthening loyalty. SQ generated an indirect effect (IE = 0.24) via its influence on PS, supporting the notion that quality improvements raise satisfaction, which enhances loyalty. Collectively, these results validate a multi-step loyalty mechanism in which innovation and value enhance service quality, fostering satisfaction and ultimately sustaining older adults’ commitment to rail services.
4.9. Hypothesis Testing Results
Table 8 and Figure 2 display the summary results of hypothesis testing according to the final SEM. All hypothesized paths are statistically significant at 0.01, suggesting that the model displays theoretical consistency and empirical validity. Every hypothesis examines the directionality of the influence of one latent construct on another. It is supported by corresponding path coefficients and t-values that exceed standard cut-off values for statistical significance.
Table 8.
Summary of research hypotheses.
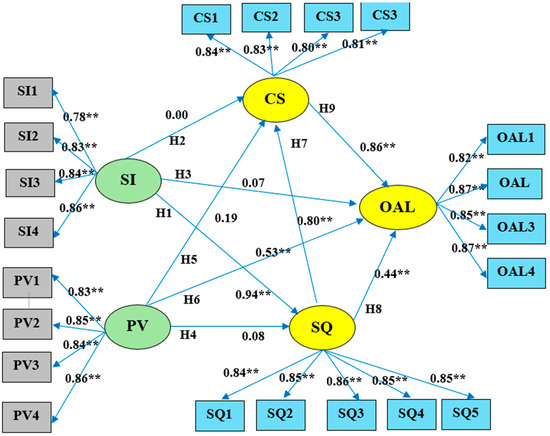
Figure 2.
Results of the validity of the linear SEM affecting rail service OAL. Note: Chi-Square = 202.53, df = 176, p = 0.68, χ2/df = 0.15, RMSEA = 0.00, RMR = 0.00, CFI = 0.99, GFI = 0.99, AGFI = 0.99. Source: the authors. ** p < 0.01.
Service innovation (SI) had a direct and substantial effect on all three dependent constructs: service quality (SQ) (β = 0.64, t = 14.62), passenger satisfaction (PS) (β = 0.58, t = 13.24), and OAL (β = 0.62, t = 14.21). These results highlight the importance of innovation in influencing the perceptions and behaviors of elderly passengers.
Perceived value (PV) also had a significant influence on SQ (β = 0.43, t = 12.11), PS (β = 0.34, t = 10.36), and OAL (β = 0.47, t = 13.05). The results validate the VAB model with PV as a key component in driving passenger satisfaction and loyalty.
Service quality (SQ) had significant positive effects on both PS (β = 0.40, t = 13.94) and OAL (β = 0.65, t = 14.74). These findings further support the contention of SERVQUAL that consistent delivery of high service quality enhances customers’ loyalty.
Passenger satisfaction (PS) also has a direct effect on OAL (β = 0.34, t = 10.41), confirming expectations from Expectancy-Disconfirmation Theory and loyalty frameworks [24,26]. These results validate the SEM and illustrate the interdependence between service innovation, value perception, quality, satisfaction, and loyalty, especially within the context of aging public transport users.
All hypothesized paths were significant (p < 0.01), and no sign reversals occurred, demonstrating statistical consistency. Bootstrapped mediation analysis with 5000 samples further confirmed robustness of indirect pathways. The results also underscore that service innovation (SI) exerted the strongest overall influence on older adult loyalty (OAL), while passenger satisfaction (PS), although significant, played a secondary role. This reinforces our central claim that innovation outweighs satisfaction in shaping loyalty.
To further test the robustness of the structural model, multi-group measurement invariance analyses were conducted across gender (male vs. female) and age (<70 vs. ≥70 years). Configural, metric, and scalar invariance were assessed by comparing unconstrained and constrained models. The chi-square difference tests are reported in Table 9.
Table 9.
Multi-group measurement invariance tests across gender and age groups.
4.10. Robustness Tests: Multi-Group Invariance
To evaluate the robustness of the structural model, multi-group SEM analyses were conducted for gender (male vs. female) and age (<70 vs. ≥70 years). Configural, metric, and scalar invariance were tested by comparing unconstrained and constrained models. As shown in Table 8, no significant chi-square differences were observed, supporting full measurement invariance across these groups. This indicates that the structural model is stable across gender and age subpopulations. While trip-frequency strata were requested, insufficient balance across categories prevented a reliable test; we note this as a direction for future research.
The measurement model demonstrated excellent fit (χ2 = 202.53, df = 176, p = 0.68, χ2/df = 1.15, RMSEA = 0.000, 90% CI [0.000, 0.031], RMR = 0.000, CFI = 0.990, GFI = 0.990, AGFI = 0.990; see Table 4). The hypothesized structural model also showed acceptable fit (χ2/df = 2.41, CFI = 0.947, TLI = 0.938, RMSEA = 0.056, 90% CI [0.048–0.063], SRMR = 0.042).
5. Discussion
The structural equation modeling results confirm that service innovation (SI) is the strongest driver of older adult loyalty (OAL), followed by perceived value (PV). Service quality (SQ) functions as a pivotal mediator, while passenger satisfaction (PS), though significant, plays a more limited role. These findings refine conventional loyalty frameworks and carry both theoretical and practical implications.
5.1. RQ1–RQ3: Effects of SI, PV, and SQ on OAL
SI’s strong influence on OAL highlights innovation’s centrality in shaping seniors’ rail experiences in Thailand and across ASEAN contexts [61,74]. Research in Singapore and Malaysia confirms that technology-enabled innovations, such as mobile ticketing and kiosks with assistive interfaces, substantially enhance confidence among older passengers [30]. Our findings reinforce this evidence by showing that SI directly and indirectly drives loyalty through its effects on quality and satisfaction. This aligns with ASEAN-focused work demonstrating that innovations anchored in universal design and inclusivity significantly reduce psychological and physical barriers for older users [17].
PV also proved influential, extending beyond price fairness to trust, reliability, and emotional reassurance. Wahab et al. [34] emphasize that older adults’ loyalty is reinforced when services acknowledge dignity and equality in encounters. Our results corroborate this, suggesting that PV incorporates cultural expectations of reciprocity and fairness in Thailand’s aging society. This orientation distinguishes ASEAN settings from Western ones, where cost–benefit considerations are often foregrounded [38].
SQ served as a key mediator, consistent with prior transport studies highlighting the enduring role of reliability, tangibles, empathy, and assurance in shaping satisfaction and loyalty [53,76]. In Thailand, cultural expectations amplify this effect: Buddhist metta (loving-kindness) and traditions of community care [77] encourage passengers to value interpersonal respect and empathy from staff [43,75,78]. Thus, SQ bridges innovation and perceived value into loyalty by anchoring services in dependable and culturally resonant interactions.
5.2. RQ4: The Role of Passenger Satisfaction in Loyalty
Passenger satisfaction (PS) had a significant effect on OAL (DE = 0.34) but was the weakest overall predictor compared with SI, PV, and SQ. This supports the expectancy–disconfirmation model, confirming that satisfaction contributes positively but functions more as a proximate mediator than as a dominant antecedent of loyalty.
Comparative evidence strengthens this interpretation. In Japan and Korea, seniors often maintain long-term loyalty despite occasional dissatisfaction, sustained instead by habit formation and institutional trust [47,57,79]. Similarly, Singapore’s MRT shows loyalty reinforced more by reliability, inclusivity, and trust than by single episodes of satisfaction [50]. Our findings in Thailand mirror these trends: satisfaction fosters positive affect but cannot guarantee loyalty, which depends more heavily on quality, innovation, and habitual reliance on rail services [80].
Viewed through a cultural lens, this dynamic also reflects wider Asian patterns of relational rather than transactional loyalty. Buddhist concepts such as metta and social norms of elder respect encourage passengers to value reassurance, dignity, and continuity—factors more closely tied to loyalty than satisfaction alone [42,43,78]. In this way, PS plays a meaningful but conditional role within a broader framework shaped by innovation, quality, and cultural rootedness.
5.3. Perceived Value and Its Influence on Loyalty
PV emerged as a strong predictor of SQ, PS, and OAL, with key dimensions including fairness, emotional reassurance, and reliability. These results expand the Value–Attitude–Behavior model by demonstrating that loyalty is shaped not only by cost–benefit calculations but also by social and emotional value. In Thailand, as in many Asian contexts, filial responsibility and Buddhist values reinforce perceptions of dignity and respect as integral to value judgments [42,43,78].
International evidence supports this expanded view. In China, PV has been shown to drive willingness to pay for shared mobility by incorporating emotional and experiential dimensions [81,82]. Similarly, studies in Southeast Asia report that SQ [83] and online servicescape design influence satisfaction and loyalty primarily through PV [84,85]. Within ASEAN transport systems, mature riders in Singapore and Malaysia likewise assess value in terms of fairness, emotional security, and dignity, consistent with Thai cultural norms.
Taken together, these findings position PV not only as an economic assessment but also as a moral and cultural judgment. For older adults, perceived value provides the foundation for long-term loyalty, sustaining patronage through both practical benefits and the assurance of fairness, dignity, and social recognition [86].
5.4. Theoretical Contributions
This study makes three interrelated theoretical contributions. First, it relocates SI’s role in the loyalty chain. Classical frameworks highlighted satisfaction as the principal predictor of loyalty, but our results document SI wielding an even more robust effect, especially in an aging society. Innovations breaking boundaries, improving accessibility, and mainstreaming inclusiveness serve not as additive increments, but dominant drivers of passengers’ long-term allegiance [28,29,80,87,88].
Second, it extends the Value–Attitude–Behavior (VAB) model by showing that perceived value (PV) is not just a utilitarian evaluation of cost and benefit, to includes aspects of fairness, emotional reassurance, and relational confidence. In Thailand and other Asian societies, cultural traditions of filial duty and respect for elders (and specifically in Thailand, Buddhist values such as metta or loving-kindness) elevate PV to a social and moral value, confirming evidence in transport and service research that cultural heritage is a significant source of experiential value [42,43,78,85,87].
Third, it reconceptualizes PS as a proximate intermediary rather than an overarching antecedent of loyalty. Expectancy–Disconfirmation Theory may still be justified, yet satisfaction operates in conjunction with innovation, quality, and habit formation. Comparing Japan, Korea, and Singapore, corroborative evidence indicates that older people’s loyalty is sustained more by trust, inclusivity, and cultural recognition than by episodic satisfaction alone [23,27,79]. Thus, this reconceptualization also suggests cultural contingencies, i.e., in Asian societies, heightened importance is attached to emotional assurance and cultural recognition compared to Western ones that continue to prioritize functional efficiency and reliability.
These contributions enrich transport loyalty theory by relocating innovation, expanding the notion of value, and recasting satisfaction. They show the need to recalibrate models developed in younger or Western demographic settings to reflect better aging Asian societies, where loyalty is forged as much through cultural value and inclusivity as through traditional quality–satisfaction linkages.
5.5. Practical Implications
The findings offer practical recommendations for railway operators and policy-makers who aim to develop older passengers’ loyalty in aging societies.
First, this study establishes service innovation (SI) as the most significant determinant of loyalty, indicating that innovation should be harnessed not for novelty but for advancing access and inclusivity in practice. For instance, human-centered implementation of new technologies, such as the introduction of intuitive ticketing apps, provision of voice-assisted guidance on self-service kiosks, and the customization of online booking systems for seniors, can enhance the confidence of older passengers. By removing barriers to entry and alleviating the sense of anxiety, these practice interventions help build enduring trust in the value of rail travel.
Next, perceived value (PV) must be reevaluated as something beyond affordability. Elderly consumers value fairness, consistency, and dignity in addition to the price. As a result, transparent pricing, bundled-value packages (e.g., fare plus service assistance), and offers for senior privileges are not merely monetary mechanisms but also indicators of appreciation, reinforcing equity and psychological security.
Third, SQ remains the integrating factor that binds innovation and value together. Even the coolest or cheapest system cannot create loyalty if unreliable or neglected. Schedule reliability, empathic and age-appropriate frontline service, and responsive support services should be prioritized by managers to consolidate the positive impact of innovation and perceived value into lasting loyalty.
Fourth, PS, although not the strongest determinant, remains a valuable monitoring tool. Continuous, senior-oriented satisfaction measurement (e.g., via surveys) can serve as an early-warning system, signaling poor innovation, value, or quality delivery before these deficiencies erode loyalty.
Finally, universal design (UD) should be prioritized as a sustainable measure. Barrier-free design elements, easy way-signs, and intergenerational travel support benefit aging riders with various mobility needs and enhance the accessibility and inclusivity of the system as a whole. By integrating the design concept and practical solutions throughout the planning and operation of the railway system, the railway industry can gradually shift from a single satisfaction-oriented approach to an integrated innovation–value–quality strategy that can guarantee sustainable patronage of older adults in a super-aged society.
6. Conclusions
This study investigated the drivers of OAL in Thailand’s rail industry, incorporating SI and PV into the conventional SQ–Satisfaction–Loyalty model. The results confirmed SI as the strongest determinant of loyalty, both directly and indirectly, and supported the importance of PV as a strong driver of quality perceptions, satisfaction, and loyalty. SQ also played a pivotal mediating role in translating innovation and value into sustained loyalty. In contrast, while still significant, PS only serves as a secondary outcome of other variables rather than the dominant predictor of loyalty reported by prior studies.
Theoretically, this study contributes to the loyalty literature in three ways. First, it complements and extends existing loyalty frameworks by revealing the key role that service innovation plays in framing the pathway to loyalty, especially for the aging rail cohort. Second, it finetunes the VAB and extends our understanding of how value influences loyalty directly and indirectly through its effect on SQ. Third, it supports the Expectancy–Disconfirmation Theory (EDT) and advances the current loyalty literature by positing satisfaction as an intermediate (vs. ultimate) determinant of loyalty. These theoretical contributions enrich our understanding of the loyalty formation process in rapidly aging ASEAN contexts and offer transferable lessons for other societies undergoing demographic transitions.
From a practical standpoint, the results suggest that rail operators should go beyond satisfaction-oriented approaches and implement an integrated strategy that combines accessible service innovations, a fair and reassuring value platform, and constantly high levels of service quality. Accordingly, this should instill loyalty among older passengers to achieve inclusive and sustainable public transport systems.
Finally, future research should build upon the present findings in at least three ways: (i) longitudinal research on loyalty trajectories, (ii) cross-national comparative studies within ASEAN and beyond to assess their generalizability, and (iii) qualitative work on mobility-impaired seniors who were not fully captured by this study. Intergenerational travel and the influence of social value on loyalty also merit further exploration. In so doing, future research will cast additional light on how inclusiveness, innovation, and cultural context interact in shaping public transport’s sustainable loyalty outcomes.
7. Limitations and Directions for Future Research
This research fills an important gap in understanding the predictors of rail loyalty among older adults in Thailand. Nevertheless, several limitations should be acknowledged.
The first limitations are sampling constraints. Although a multi-stage random sampling design across 25 stations and 625 respondents exceeded SEM requirements, the frame comprised only active rail users. As a result, seniors with severe mobility impairments who may avoid stations altogether were under-represented. The findings, therefore, best generalize to relatively mobile older passengers.
The second issue is peak-hour bias. Sampling was conducted during stratified peak-hour windows to ensure sufficient sample size and travel pattern heterogeneity. This design, however, may have disproportionately captured frequent riders while undersampling infrequent or mobility-constrained seniors. Nonresponse was rare (<3%), but in-station recruitment may have introduced subtle selection bias. Future studies should systematically report nonresponse, apply post-stratification weighting, and incorporate recruitment beyond stations (e.g., through senior centers, disability groups, or home-based surveys).
The third issue is design constraints. The cross-sectional nature of the study restricts causal inference. Although the SEM provides robust evidence of structural relationships, longitudinal or panel designs would enable the observation of loyalty trajectories over time and test whether innovation- versus satisfaction-driven effects are temporally stable.
The fourth issue relates to contextual and cultural generalizability. While the Thai context provides valuable insights, ASEAN countries differ in demographics, infrastructure, and policy. Cross-national comparisons (e.g., Singapore, Malaysia, Vietnam, versus non-ASEAN cases such as Japan, South Korea, or Western Europe) would clarify cultural and structural contingencies in loyalty formation. Similarly, while our measurement instruments were carefully translated, back-translated, and pilot-tested, subtle cultural differences in Likert scale interpretation may persist. Mixed-method approaches—combining SEM with qualitative strategies such as focus groups or interviews—would help capture cultural nuance in how older adults construe service quality, value, and satisfaction.
The fifth issue is represented by climate-specific challenges. Thailand’s weather conditions—extreme heat, heavy rainfall, and flooding—can exacerbate accessibility barriers but were not explicitly modeled. Future research integrating climate-adaptive infrastructure variables would enhance contextual validity and policy relevance.
Finally, there are language considerations. The manuscript was edited by a native English-speaking academic and rechecked with Grammarly Premium, but the authors accept responsibility for any remaining imperfections.
Future research directions are as follows:
Expanding sampling frames to capture less mobile and non-user populations;
Employing longitudinal or panel designs to track loyalty processes;
Conducting comparative cross-national studies to explore cultural contingencies;
Integrating climate-adaptive and environmental design factors into loyalty models;
Applying multi-method approaches to link statistical evidence with the lived experiences of seniors.
By addressing these gaps, future studies can strengthen theoretical foundations and provide more inclusive, culturally sensitive, and sustainable strategies for transport equity in aging societies.
Author Contributions
Conceptualization, R.L., N.R. and S.C.; methodology, N.R. and S.C.; software, N.R.; validation, N.R.; formal analysis, N.R.; investigation, R.L.; resources, R.L., N.R. and S.C.; data curation, N.R.; writing—original draft preparation, R.L.; writing—review and editing, R.L., N.R. and S.C.; visualization, N.R.; supervision, S.C.; project administration, N.R. and S.C.; funding acquisition, N/A. All authors have read and agreed to the published version of the manuscript.
Funding
This research received no external funding.
Institutional Review Board Statement
Ethical review and approval were exempted for this study in accordance with Thailand’s Guidelines for Conducting Human Subjects Research in Behavioral Science, Social Sciences, and Humanities. Moreover, additional ethics review was undertaken by the Research Ethics Committee of King Mongkut’s Institute of Technology Ladkrabang. The study’s exemption was issued under Certificate No. EC-KMITL_68_040. As the study was classified as exempt, no continuing review was required.
Informed Consent Statement
Informed consent was obtained from all participants involved in the study.
Data Availability Statement
The data presented in this study are available on request from the corresponding author.
Acknowledgments
In preparing this manuscript, the authors utilized Scholar GPT to assist in translating the work from Thai to English. Grammarly AI Premium was also used to review grammar and structure refinement. It is important to emphasize that AI detection tools consistently return false positive results (inaccurate results) when applied to translations, as demonstrated by the author’s analysis. In addition to using AI tools for translation and language correction, all the content underwent a thorough review and editing by a native English speaker working in collaboration with the authors. Therefore, the authors assert full responsibility for the final manuscript’s accuracy, originality, and quality.
Conflicts of Interest
The authors declare no conflicts of interest.
Abbreviations
The following abbreviations are used in this manuscript:
| List of Abbreviations | |
| χ2/df | Chi-square/degrees of freedom |
| AGFI | adjusted goodness-of-fit index |
| AI | artificial intelligence |
| ASEAN | Association of Southeast Asian Nations |
| CFA | confirmatory factor analysis |
| CFI | Comparative Fit Index |
| EDT | Expectancy–Disconfirmation Theory |
| GFI | Goodness-of-Fit Index |
| IOC | Index of Item-Objective Congruence |
| MTS | mobility transport systems |
| NFI | Normed Fit Index |
| OAL | Older Adult Loyalty |
| PS | Passenger Satisfaction |
| PV | Perceived Value |
| RATER | reliability, assurance, tangibles, empathy, and responsiveness |
| RMR | Root Mean Square Residual |
| RMSEA | Root Mean Square Error of Approximation |
| SEM | Structural Equation Modeling |
| SERVQUAL | Service Quality Framework |
| SI | Service Innovation |
| SQ | Service Quality |
| TAM | Technology Acceptance Model |
| VAB | Value–Attitude–Behavior (model) |
References
- Habib, K.N.; Hasnine, M.S.; El-Assi, W. The role of station accessibility, multimodal competitions and contextual variables in retaining customer base of urban commuter rails. Case Stud. Transp. Policy 2019, 7, 404–414. [Google Scholar] [CrossRef]
- Ragab, H.; Polo-Peña, A.I.; Mahrous, A.A. The effect of airline service quality, perceived value, emotional attachment, and brand loyalty on passengers’ willingness to pay: The moderating role of airline origin. Case Stud. Transp. Policy 2024, 18, 101313. [Google Scholar] [CrossRef]
- Wisutwattanasak, P.; Champahom, T.; Jomnonkwao, S.; Aryuyo, F.; Se, C.; Ratanavaraha, V. Examining the impact of service quality on passengers’ intentions to utilize rail transport in the post-pandemic era: An integrated SERVQUAL and health belief model approach. Behav. Sci. 2023, 13, 789. [Google Scholar] [CrossRef] [PubMed]
- Leenoi, P. Aged Society: Embracing Challenges and Unlocking Opportunities. Available online: https://www.krungsri.com/en/research/research-intelligence/silver-economy (accessed on 2 September 2025).
- NESDC Report an Eye-Opener on Thailand’s Ageing Population. The Nation. Available online: https://tinyurl.com/4zw4txb8 (accessed on 2 September 2025).
- Cepiku, D.; Mastrodascio, M. Equity in public services: A systematic literature review. Public Adm. Rev. 2021, 81, 1019–1032. [Google Scholar] [CrossRef]
- Cho, H.; Choi, J.; No, W.; Oh, M.; Kim, Y. Accessibility of welfare facilities for elderly people in Daejeon, South Korea, considering public transportation accessibility. Transp. Res. Interdiscip. Perspect. 2021, 12, 100514. [Google Scholar] [CrossRef]
- Ravensbergen, L.; Van Liefferinge, M.; Isabella, J.; Merrina, Z.; El-Geneidy, A. Accessibility by public transport for older adults: A systematic review. J. Transp. Geogr. 2022, 103, 103408. [Google Scholar] [CrossRef]
- Lin, D.; Cui, J. Transport and mobility needs for an ageing society from a policy perspective: Review and implications. Int. J. Environ. Res. Public Health 2021, 18, 11802. [Google Scholar] [CrossRef]
- Pirzada, P.; Wilde, A.; Doherty, G.H.; Harris-Birtill, D. Ethics and acceptance of smart homes for older adults. Inform. Health Soc. Care 2022, 47, 10–37. [Google Scholar] [CrossRef]
- Ravensbergen, L.; Newbold, K.B.; Ganann, R.; Sinding, C. Mobility work: Older adults’ experiences using public transportation. J. Transp. Geogr. 2021, 97, 103221. [Google Scholar] [CrossRef]
- Jahangir, S.; Bailey, A.; Hasan, M.M.U.; Hossain, S. Inequalities in accessing public transportation and social exclusion among older adults and people with disabilities in Bangladesh: A scoping review. Transp. Res. Interdiscip. Perspect. 2024, 26, 101138. [Google Scholar] [CrossRef]
- Xie, Z. Intention of BTS Skytrain Passengers to Use QR Ticket for Metro Mass Transit System in Bangkok. Ph.D. Thesis, Huachiew Chalermprakiet University, Samut Prakan, Thailand, 2023. Available online: https://has.hcu.ac.th/xmlui/bitstream/handle/123456789/2912/Intention-of-BTS-Skytrain-Passengers-to-Use-QR-Ticket.pdf?sequence=1&isAllowed=y (accessed on 2 September 2025).
- Burton, M. Disability and Poverty in Thailand. Available online: https://borgenproject.org/disability-and-poverty-in-thailand/ (accessed on 2 September 2025).
- Department of Older Persons. Department of Empowerment of Persons with Disabilities. Ministry of Social Development and Human Security—Thai Aging Research and Development Institute. Available online: https://www.dop.go.th/th/know/15/926 (accessed on 2 September 2025).
- Peoples, M., Jr. Addressing Transportation Equity for Local Populations Using Emerging Technologies. Ph.D. Thesis, University of the Incarnate Word, San Antonio, TX, USA, 2024. Available online: https://www.proquest.com/openview/6df010cb38ebcfbe8ffeebc233831394/1?pq-origsite=gscholar&cbl=18750&diss=y (accessed on 2 September 2025).
- Beyond Accessibility: Rethinking Universal and Inclusive Design in Bangkok’s Public Parks. Buildings 2025, 15, 2839. [CrossRef]
- Thailand Ready for Universal Design Adjustments, Forum Hears. The Nation. Available online: https://www.nationthailand.com/in-focus/40013291 (accessed on 2 September 2025).
- Carney, F. Linking loyalty card data to public transport data to explore mobility and social exclusion in the older population. Sustainability 2021, 13, 6217. Available online: https://www.mdpi.com/2071-1050/13/11/6217 (accessed on 2 September 2025). [CrossRef]
- Zhang, M.; Pan, Y. Design of sustainable senior-friendly community transportation services. Sustainability 2021, 13, 13078. [Google Scholar] [CrossRef]
- ONESDC. Action Plan on Thailand Logistics Development 2023–2027; Office of the National Economic and Social Development Council: Bangkok, Thailand, 2023. Available online: https://tinyurl.com/muur87u3 (accessed on 2 September 2025).
- Nwachi, C.C.; Ogbonna, C.G.; Wushishi, M.A. Usability of road infrastructure for persons with mobility impairment. Trans. Transp. Sci. 2023, 14, 32–47. [Google Scholar] [CrossRef]
- dos Reis Silveira, T.C.; Romano, C.A.; Gadda, T.M.C. Loyalty and public transit: A quantitative systematic review of the literature. Transp. Rev. 2021, 42, 362–383. [Google Scholar] [CrossRef]
- Ibrahim, A.N.H.; Borhan, M.N.; Md Yusoff, N.I.; Ismail, A.; Mat Yazid, M.R.; Mhd Yunin, N.A.; Yukawa, S. Gender and age do matter: Exploring the effect of passengers’ gender and age on the perception of light rail transit service quality in Kuala Lumpur, Malaysia. Sustainability 2021, 13, 990. [Google Scholar] [CrossRef]
- Trong, N.T.; Dong, N.T.; Ly, P.T. Population aging and economic growth: Evidence from ASEAN countries. Cogent Bus. Manag. 2024, 11, 2298055. [Google Scholar] [CrossRef]
- Ibrahim, A.N.H.; Borhan, M.N.; Mat Yazid, M.R.; Rahmat, R.A.; Yukawa, S. Factors influencing passengers’ satisfaction with the light rail transit service in alpha cities: Evidence from Kuala Lumpur, Malaysia using structural equation modelling. Mathematics 2021, 9, 1954. [Google Scholar] [CrossRef]
- Zakaria, H.; Rohani, M.M.; Ibrahim, A.; Ling, F.N.L.; Samsudin, N.; Kasno, S.F.; Jablan, N.A. Exploring Passenger Loyalty: A Perspective Through Expectancy Theory in Public Transport Usage. J. Techno-Soc. 2025, 17, 1–10. Available online: https://penerbit.uthm.edu.my/ojs/index.php/JTS/article/view/20830 (accessed on 2 September 2025).
- Gremyr, I.; Witell, L.; Löfberg, N.; Edvardsson, B.; Fundin, A. Understanding new service development and service innovation through innovation modes. J. Bus. Ind. Mark. 2014, 29, 123–131. [Google Scholar] [CrossRef]
- Lowe, B. Service innovation: How to go from customer needs to breakthrough services. J. Prod. Brand Manag. 2011, 20, 557–567. [Google Scholar] [CrossRef]
- Cho, W.; Wonglakorn, P.; Sa-ngiamwibool, A. Technology-enabled service innovations and older adults’ confidence in public transport: A study of Singapore and Malaysia. Transp. Res. Part A Policy Pract. 2021, 152, 112–126. [Google Scholar] [CrossRef]
- Wonglakorn, N.; Ratanavaraha, V.; Karoonsoontawong, A.; Jomnonkwao, S. Exploring passenger loyalty and related factors for urban railways in Thailand. Sustainability 2021, 13, 5517. [Google Scholar] [CrossRef]
- Wonglakorn, N.; Chantaratang, A.; Suksiripattanapong, C.; Na Sritha, K.; Aunphoklang, W.; Ninjinda, N.; Keerakittisakul, W. The Development of Service Metrics Indicators of a Public Transportation Service Case Study: Intercity Trains in Nakhon Ratchasima Province, Thailand. Sustainability 2023, 15, 11739. [Google Scholar] [CrossRef]
- Zheng, H. Comparison of Transportation Accessibility Policy Among Elderly in Hong Kong and Singapore, TPG Capstone Project, Lingnan Univ. Hong Kong, 2023. Available online: https://commons.ln.edu.hk/soc605_stdwork/19 (accessed on 2 September 2025).
- Wahab, S.N.; Hamzah, M.I.; Suki, N.M.; Chong, Y.S.; Kua, C.P. Unveiling passenger satisfaction in rail transit through a consumption values perspective. Multimodal Transp. 2025, 4, 100196. [Google Scholar] [CrossRef]
- Ryu, H.S.; Lee, J.N. Identifying service innovation patterns from the service-oriented perspective. In Proceedings of the Pacific Asia Conference on Information Systems (PACIS), Ho Chi Minh City, Vietnam, 11–15 July 2012; p. 60. Available online: https://aisel.aisnet.org/pacis2012/60 (accessed on 2 September 2025).
- Zhao, P.; Xie, J. Population Aging and Age-Friendly Transport in China; Springer: Berlin/Heidelberg, Germany, 2022. [Google Scholar]
- Rotaris, L.; Scorrano, M.; Campisi, B.; Rossi, P. Corporate social responsibility and passengers’ behavioral intentions: A case study on railway services. Res. Transp. Bus. Manag. 2023, 47, 100951. [Google Scholar] [CrossRef]
- Biao, L.; Liru, L.; Ying, S. Understanding the influence of consumers’ perceived value on energy-saving products purchase intention. Front. Psychol. 2021, 12, 640376. [Google Scholar] [CrossRef]
- Gan, C.; Wang, W. The influence of perceived value on purchase intention in social commerce context. Internet Res. 2017, 27, 772–785. [Google Scholar] [CrossRef]
- Zhang, N.; Yang, Q. Public transport inclusion and active aging: A systematic review on elderly mobility. J. Traffic Transp. Eng. (Engl. Ed.) 2024, 11, 312–347. [Google Scholar] [CrossRef]
- Pettersson, P.; Schmöcker, J.D. Active ageing in developing countries?—Trip generation and tour complexity of older people in Metro Manila. J. Transp. Geogr. 2010, 18, 613–623. [Google Scholar] [CrossRef]
- Griffin, K.K. Living Kindness: Metta Practice for the Whole of Our Lives; Shambhala Publications: Boulder, CO, USA, 2022. [Google Scholar]
- Tongsupachok, S.; Pannavaravuddhi, P.; Mahatthanadull, S. Application of Buddhist loving kindness (Metta) to the learning process in modern education in Buddhist universities. J. Sirindhornparidhat 2024, 25, 633–651. Available online: https://so06.tci-thaijo.org/index.php/jsrc/article/view/264797 (accessed on 2 September 2025).
- Berry, L.L.; Bolton, R.N.; Bridges, C.H.; Meyer, J.; Parasuraman, A.; Seiders, K. Opportunities for innovation in the delivery of interactive retail services. J. Interact. Mark. 2010, 24, 155–167. [Google Scholar] [CrossRef]
- Chaichinarat, P.; Ratanaolarn, T.; Kiddee, K.; Pimdee, P. Thailand’s automotive service quality customer satisfaction: A SERVQUAL model CFA of Suzuki Motor. Asia-Pac. Soc. Sci. Rev. 2018, 18, 8. [Google Scholar] [CrossRef]
- Lieophairot, C.; Rojniruttikul, N. Factors affecting state railway of Thailand (SRT) passenger train service use decision: A structural equation model. Heliyon 2023, 9, e15660. [Google Scholar] [CrossRef]
- Asgharpour, S.; Askari, S.; Mohammadian, A.K. Dependence or preference? Navigating public transit loyalty across heterogeneous levels of transit dependence. Transp. Policy 2025, 171, 821–837. [Google Scholar] [CrossRef]
- Morales, R.R.L.; Canto, M.P.B.; Singson, C.T.; Yao, S.K.M.; Zshornack, E.A.W.; Tanpoco, M.A.W.; Caminong, J.A.W. Destination, future loyalty: A journey through service quality and customer satisfaction in Philippine bus services. Rev. Integr. Bus. Econ. Res. 2025, 14, 317–330. Available online: https://buscompress.com/uploads/3/4/9/8/34980536/riber_14-2_22_b24-119_317-330.pdf (accessed on 2 September 2025).
- Saeidi, T.; Mesbah, M.; Habibian, M.; Soltanpour, A.; Sahraei, M.; Mehran, B. Passenger satisfaction across multiple public transit modes. Transp. Res. Procedia 2025, 82, 1637–1653. [Google Scholar] [CrossRef]
- Bautista, J.V., Jr.; Cahigas, M.M.L.; Fernandez, J.R. Assessing commuters’ behavioral intention to use Singapore Mass Rapid Transit (MRT): The role of service quality and commuters’ satisfaction. Res. Transp. Bus. Manag. 2025, 61, 101419. [Google Scholar] [CrossRef]
- Twaha, I.; Taifa, I.W. Quality of logistics service assessment for multinational railway transportation: Results from an empirical study. TQM J. 2025. [Google Scholar] [CrossRef]
- Gumasing, M.J.J.; Del Castillo, T.R.P.; Palermo, A.G.L.; Tabino, J.T.G.; Gatchalian, J.T. Enhancing accessibility in Philippine public bus systems: Addressing the needs of persons with disabilities. Disabilities 2025, 5, 45. [Google Scholar] [CrossRef]
- dell’Olio, L.; Eboli, L.; Fotino, M.P.; Mazzulla, G. Passengers’ perception of airlines’ services: Addressing systematic and random variation in tastes. Transp. Res. Part A: Policy Pract. 2025, 191, 104329. [Google Scholar] [CrossRef]
- Aziz, Z.A.; Nik Hussin, N.S.; Mukhtar, D.; Nordin, N.; Nordin, N. Factors influencing the service quality for customer satisfaction on parcel service safety in the postal and courier industry: Analysis using structural equation modelling. Pertanika J. Soc. Sci. Humanit. 2025, 33, 587–617. [Google Scholar] [CrossRef]
- Dzreke, S.S. Developing holistic customer experience frameworks: Integrating journey management for enhanced service quality, satisfaction, and loyalty. Front. Res. 2025, 2, 90–115. [Google Scholar] [CrossRef]
- Hussain, R.; Sullivan Mort, G. Analyzing public bus services in Dubai: Insights from passengers’ perspectives. J. Nonprofit Public Sect. Mark. 2025, 37, 270–301. [Google Scholar] [CrossRef]
- Liu, S.; Putro, U.S. Passenger service satisfaction evaluation of Jakarta-Bandung high-speed railway. Eur. J. Bus. Manag. Res. 2024, 9, 115–126. Available online: https://www.ejbmr.org/index.php/ejbmr/article/view/2432 (accessed on 2 September 2025). [CrossRef]
- Pan, M.; Ryan, A. Promoting sustainable transportation modes: A systematic review of behavior-change strategies. Transp. Res. Rec. 2025, 2679, 1993–2012. [Google Scholar] [CrossRef]
- Sogbe, E.; Susilawati, S.; Pin, T.C. Scaling up public transport usage: A systematic literature review of service quality, satisfaction and attitude towards bus transport systems in developing countries. Public Transp. 2025, 17, 1–44. [Google Scholar] [CrossRef]
- Champahom, T.; Chonsalasin, D.; Theerathitichaipa, K.; Watcharamaisakul, F.; Jomnonkwao, S.; Ratanavaraha, V.; Kasemsri, R. Exploring Behavioral Intentions and Sustainability Perspectives for the China–Laos High-Speed Rail Service Among Thai People: A Comparative Study of Urban and Rural Zones. Infrastructures 2025, 10, 116. [Google Scholar] [CrossRef]
- Nguyen, T.H.; Le, A.D. Motivating senior ridership through affordable innovation bundles: Evidence from Vietnam’s public transport sector. J. Transp. Health 2022, 25, 101385. [Google Scholar] [CrossRef]
- Legate, A.E.; Ringle, C.M.; Hair, J.F., Jr. PLS-SEM: A method demonstration in the R statistical environment. Hum. Resour. Dev. Q. 2024, 35, 501–529. [Google Scholar] [CrossRef]
- Azmi, N.A.; Isa, H.M.; Nor, O.M.; Utama, W.P. Key Accessibilities Issues (KAIs) for People with Disabilities (PwDs) at Electric Train Service (ETS) Station. Int. J. Sustain. Constr. Eng. Technol. 2023, 14, 353–365. Available online: https://publisher.uthm.edu.my/ojs/index.php/IJSCET/article/view/15034 (accessed on 2 September 2025). [CrossRef]
- Pimdee, P.; Wuttikamonchai, O.; Sukkamart, A.; Meedee, C.; Meekhobtong, S. Improving Thai undergraduate students’ web design skills for smartphones through a collaborative blended learning approach. Front. Educ. 2025, 10, 1522793. [Google Scholar] [CrossRef]
- Thaithatkul, P.; Chalermpong, S.; Laosinwattana, W.; Kato, H. Mobility, activities, and happiness in old age: Case of the elderly in Bangkok. Case Stud. Transp. Policy 2022, 10, 1462–1471. [Google Scholar] [CrossRef]
- Podsakoff, P.M.; Podsakoff, N.P.; Williams, L.J.; Huang, C.; Yang, J. Common method bias: It isn’t good, it is complex, it is widespread, and it is not easy to fix. Annu. Rev. Organ. Psychol. Organ. Behav. 2024, 11, 17–61. [Google Scholar] [CrossRef]
- Martin, D.; Gustafsson, A.; Choi, S. Service innovation, renewal, and adoption/rejection in dynamic global contexts. J. Bus. Res. 2016, 69, 2397–2400. [Google Scholar] [CrossRef]
- Klepek, M. Determinants of customer engagement on Facebook brand pages. Sci. Pap. Univ. Pardubice. Ser. D Fac. Econ. Adm. 2018, 44, 127–138. Available online: https://dk.upce.cz/items/202aebc2-3cd9-42ce-b16e-8a11a9378ea9 (accessed on 2 September 2025).
- Fazal-e-Hasan, S.M.; Ahmadi, H.; Mortimer, G.; Grimmer, M.; Kelly, L. Examining the role of consumer hope in explaining the impact of perceived brand value on customer–brand relationship outcomes in an online retailing environment. J. Retail. Consum. Serv. 2018, 41, 101–111. [Google Scholar] [CrossRef]
- Sukhu, A.; Bilgihan, A.; Seo, S. Willingness to pay in negative restaurant service encounters. Int. J. Hosp. Manag. 2017, 65, 11–19. [Google Scholar] [CrossRef]
- Pan, Y.; Froese, F.; Liu, N.; Hu, Y.; Ye, M. The adoption of artificial intelligence in employee recruitment: The influence of contextual factors. In Artificial Intelligence and International HRM; Routledge: Abingdon, UK, 2023; pp. 60–82. [Google Scholar] [CrossRef]
- Leonard, S.; Simmering, M.J.; Wall, A.E. A metacognitive approach to understanding what marker variables measure. Curr. Psychol. 2024, 43, 31222–31240. [Google Scholar] [CrossRef]
- Pimdee, P.; Ridhikerd, A.; Moto, S.; Siripongdee, S.; Bengthong, S. How social media and peer learning influence student-teacher self-directed learning in an online world under the “New Normal”. Heliyon 2023, 9, e13769. [Google Scholar] [CrossRef]
- Ratchford, B.; Gauri, D.K.; Jindal, R.P.; Namin, A. Innovations in retail delivery: Current trends and future directions. J. Retail. 2023, 99, 547–562. [Google Scholar] [CrossRef]
- Geng, J.; Shi, Q.; Dong, R.K. A Systematic Review of Government Measures to Improve Age-Friendly Transportation in the US, UK, Japan, and China. Sustainability 2025, 17, 2989. [Google Scholar] [CrossRef]
- Hizam, S.M.; Ahmed, W.; Akter, H.; Sentosa, I. Understanding the public rail quality of service towards commuters’ loyalty behavior in Greater Kuala Lumpur. Transp. Res. Procedia 2021, 55, 370–377. [Google Scholar] [CrossRef]
- Ikels, C. Filial Piety: Practice and Discourse in Contemporary East Asia; Stanford University Press: Redwood City, CA, USA, 2004. [Google Scholar]
- Ayinaddis, S.G. The relationship between service innovation, passenger satisfaction, and loyalty intention in emerging economies: An evidence from Ethio Telecom. J. Knowl. Econ. 2023, 14, 4045–4063. [Google Scholar] [CrossRef]
- Hsu, W.C.; Liao, P.S.; Hu, S.C. Active Transportation and Well-Being Across the Life Course: A Network Analysis Approach in Taiwan. SSRN 2025, 5239739. [Google Scholar] [CrossRef]
- Hamzah, M.I.; Wahab, S.N.; Abd Rashid, M.H.; Voon, B.H. Switching intention, WOM and quality of public transport services: A case of the Kuala Lumpur conurbation. Multimodal Transp. 2023, 2, 100082. [Google Scholar] [CrossRef]
- Ansory, S.M.; Safira, A.S.A. Age segmentation for predicting behavioural intention of using railway services in Indonesia. Asian J. Bus. Account. 2018, 11, 229–264. [Google Scholar] [CrossRef]
- Rahmi, N.A.; Ridhaningsi, F. Service Quality and Innovation as Drivers of Customer Loyalty: The Mediating Role of Customer Satisfaction in the Context of Indonesian Railways. Gold. Ratio Mark. Appl. Psychol. Bus. 2026, 6, 202–216. [Google Scholar] [CrossRef]
- Etuk, A.; Anyadighibe, J.A.; James, E.E.; Mbaka, R. Service quality and passengers’ loyalty of public transportation companies. Br. J. Manag. Mark. Stud. 2021, 4, 82–92. [Google Scholar] [CrossRef]
- Zhang, N.; Liu, R.; Zhang, X.Y.; Pang, Z.L. The impact of consumer perceived value on repeat purchase intention based on online reviews: By the method of text mining. Data Sci. Manag. 2021, 3, 22–32. [Google Scholar] [CrossRef]
- Hu, Y. An improvement or a gimmick? The importance of user-perceived values, previous experience, and industry context in human-robot service interaction. J. Destin. Mark. Manag. 2021, 21, 100645. [Google Scholar] [CrossRef]
- Widyawati, R.; Widowati, A.S. Effect of service quality and online servicescape toward passenger satisfaction and loyalty mediated by perceived value. IOP Conf. Ser. Earth Environ. Sci. 2021, 704, 012011. [Google Scholar] [CrossRef]
- Ahmed, N.; Khan, M.W.A.; Pattal, M.M.I.; Rana, F.; Khan, A. National economic benefits through high-speed train services: The role of service quality and quality pursuer on client satisfaction. J. Infrastruct. Policy Dev. 2024, 8, 3112. [Google Scholar] [CrossRef]
- Ali, A.S.M.; Junaini, S.N.; Masron, T.; Kimura, Y.; Ahmad, A. Urbanization and aging in ASEAN: A comparative demographic analysis from 1970 to 2023. Geografia 2025, 21, 34–53. [Google Scholar] [CrossRef]
Disclaimer/Publisher’s Note: The statements, opinions and data contained in all publications are solely those of the individual author(s) and contributor(s) and not of MDPI and/or the editor(s). MDPI and/or the editor(s) disclaim responsibility for any injury to people or property resulting from any ideas, methods, instructions or products referred to in the content. |
© 2025 by the authors. Licensee MDPI, Basel, Switzerland. This article is an open access article distributed under the terms and conditions of the Creative Commons Attribution (CC BY) license (https://creativecommons.org/licenses/by/4.0/).