1. Introduction
Mobility has long been linked to quality of life, with numerous studies showing that limited mobility can have a direct impact on health and wellbeing, most notably when this results in a lack of physical activity or restricts social interactions [
1]. Access to transportation, both public and private, is vital for individuals to maintain high levels of mobility. Current transport facilities are often built around efficiency and meeting the needs of the commuting population and can therefore struggle to provide services suited to some of the most vulnerable members of society, for example, those that are older or disabled [
2]. The potential negative impacts of a lack of public transport access have meant that achieving an inclusive transport system that is accessible for the entire population is a fundamental element in tackling the many wider social issues that affect some of the most vulnerable groups of the population. This has become a major policy goal for many local transport authorities and operators throughout the UK.
For transport authorities and operators, understanding how public transport services are used by different groups of the population and the impact that access to these services has on mobility is imperative to be able to provide services that meet mobility needs. The activity patterns emanating from neighbourhoods can provide insight into these mobility needs. Accurate study of these activity patterns can help us to understand how they are shaped by the demographic and socioeconomic characteristics of residents, the availability of public transportation and the accessibility of key facilities.
This study examined whether inadequate public transport services constrain the activity spaces of older residents. The specific aim of these analyses was to quantify the relationship between the activity patterns emanating from neighbourhoods, public transport provision and the accessibility of retail areas. The resulting relationships shed new light on the importance of efficient public transport services in allowing for greater and more varied travel. With an ageing population in the UK, achieving high levels of mobility in the older population is vital for tackling social exclusion and the subsequent impacts on health and wellbeing.
These spatial activity patterns were extracted from a large high street retailer’s (HSR) loyalty card data, using the locations at which transactions were conducted as a proxy for cardholders’ activity spaces. The factors that impact these activity spaces, including the provision of public transport services and the accessibility of high street retailer stores via the public transport network, were analysed using regression models. Understanding this influence through a large-scale case study provided novel evidence of the impact of public transport services on mobility as well as an evaluation of the utility of the current public transport system.
Additionally, these insights can provide evidence of the importance of other public transport initiatives, such as park and ride systems. Park and ride systems are usually located near peripheral public transport stops and allow people to, after parking their vehicle, continue their journey into large retail areas and urban centres via public transport [
3,
4]. Understanding the role that public transport plays in the mobility of populations can inform local authorities on the utility and potential expansion of such systems to provide better access to central urban areas.
Section 2 of this paper outlines the previous research that has been undertaken in this area of research, and
Section 3 provides an overview of the case study area and population that were analysed.
Section 4 then presents an overview of the data that were used, and
Section 5 outlines the methods that were applied.
Section 6 presents the results, and
Section 7 discusses them in terms of the insights and conclusions that can be drawn before the concluding remarks are presented in
Section 8.
2. Previous Research
Numerous studies have shown that limited opportunity to travel can have direct implications for health and wellbeing, in particular when this results in a lack of physical activity, unmet social needs, and inadequate access to key services, such as retail opportunities and healthcare facilities [
1,
5]. Older residents may be particularly vulnerable to restricted mobility as life-course events, such as the loss of the ability to drive or physical restrictions, often reduce access to private transport modes [
6,
7]. Research by Age UK [
8] found that over 600,000 older people in the UK do not leave their homes more than once a week, with 1 in every 20 members of the older population facing isolation and loneliness. If public transport services are not providing adequate service for older residents, the risk of social exclusion and isolation increases. Gaining an understanding of the relationship between mobility, social exclusion and wellbeing as well as how this relates to public transport services, is therefore vital for transport authorities aiming for an inclusive transport system.
The accessibility of both public transport services and key facilities can greatly influence the social exclusion of individuals and populations. This concept relates to the idea that social exclusion is not the result of a lack of opportunities but rather a lack of access to opportunities. This idea was first conceptualised by Sen [
9] in relation to poverty and famines, in which it was argued that famines are not caused by a lack of food but instead a lack of access to food. This concept can be applied to transport-related social exclusion, with the idea that transport disadvantage and social exclusion not only are a result of a lack of public transport services but also are due to the barriers and difficulties that individuals encounter when attempting to access these services.
Shopping opportunities represent an important element of social wellbeing and inclusion. However, until recently, the links between wellbeing and the geography of retailing had not been extensively explored [
10]. Physical accessibility to retail facilities impacts wellbeing by minimising both the cost and time taken to travel to shopping opportunities, which in turn releases a greater proportion of both time and household income for recreational activities. In addition, having access to a number of retail facilities allows for greater choice, a concept that has been linked to wellbeing in a number of studies [
11,
12]. Given the importance of access to shopping opportunities and retail services for social inclusion objectives, the availability of detailed transaction records can provide valuable insight into shopping habits and subsequently the social inclusion of individuals.
Smart travel card data has widely been identified as a potential resource for understanding urban mobility and travel behaviours as well as the social issues that are related to these concepts [
13,
14]. However, other consumer data sources, such as loyalty card transactions, have received little attention in this arena. In a study on mobility and social participation, Farber and Paez [
15] stated that “activity analyses require large quantities of disaggregated travel and activity behaviour data”. Due to the now ubiquitous nature of consumer data [
16], it was hypothesised that non-traditional, non-transport-related consumer datasets can provide valuable insights into mobility and activity patterns. At the time of writing, there has been no research published that specifically focuses on understanding mobility and activity patterns using loyalty card transaction data. This study therefore demonstrates a novel application of these data.
For this study, spatial store-visiting patterns extracted from loyalty card transaction data were used to describe cardholders’ activity spaces. Activity spaces are a measure of spatial behaviour used to summarise mobility patterns [
17] and have been defined as “a set of geographically distributed locations which are physically contacted by individuals” [
18] (p. 37). Activity spaces have been applied in a wide range of research, including transportation research, geography and public health. More recently, there has been a growing body of research on the links between the characteristics of activity spaces and wellbeing, with these being used as an alternative measure of social exclusion [
19,
20].
Activity spaces have been widely used in research as they go beyond residential neighbourhoods to provide a more comprehensive view of social structure [
21] and how people use and move about space [
22]. Previous research has found that adults spend a large proportion of their activity time outside of their residential neighbourhood and that activity spaces and residential buffers have poor spatial overlap [
23]. Activity spaces can therefore provide a better indication of the areas that populations visit and spend time in than residential information and have been used widely in health research due to their relationship with health behaviours and wellbeing [
23,
24]. Using consumer data to understand the factors that impact the characteristics of activity spaces can therefore provide insight into wellbeing and social inclusion. Additionally, they can help identify the factors that can constrain activity spaces and provide insight into the impact and utility of public transport services.
3. Case Study
This study focused on the older population (aged 65 and over) in the West Midlands, UK. The West Midlands is a metropolitan county and combined authority located in west-central England and is made up of seven metropolitan boroughs: Birmingham, Coventry, Dudley, Sandwell, Solihull, Walsall and Wolverhampton. The overall population as of 2014 was 2,805,891, with the 65 plus population making up around 16% of this.
Public transport services in the West Midlands are the responsibility of Transport for West Midlands (TfWM), the transport arm of the West Midlands Combined Authority (WMCA). Although TfWM do not operate bus, tram or train services, they are responsible for maintaining bus stations and shelters as well as for working in partnership with transport operators to improve public transport services and to deliver major public transport schemes throughout the county. Although public transport in this area consists of bus, train and metro services, this study focused solely on the bus network. Bus trips made up around 80% of all public transport trips in the study area [
25] and therefore represented the majority of these journeys. Smart travel cards, called ‘Swift’ cards, are used for ticketing on the bus network, in addition to smart English National Concessionary Travel Scheme (ENCTS) travel cards for older and disabled passengers. The West Midlands has experienced declining bus patronage over recent years, which has brought about questions as to whether the ENCTS and current bus network are meeting older travellers’ needs and increasing concerns around social exclusion in the older population [
26].
The high street retailer was a large national retailer, with over 100 stores located across the West Midlands metropolitan area. The primary dataset used in this study was their loyalty card transaction dataset, with data available from April 2012 to September 2014. ‘Loyalty card data’ refers to the data produced when a transaction is conducted using a card linked to a retailer’s loyalty card scheme. In their most basic form, these schemes reward customer loyalty by awarding points when a purchase is made, which can then be redeemed as discounts on future purchases. The data are firstly collected through an application process, where a cardholder provides basic demographic information, for example age, sex and home address. Customers are then provided with a loyalty card that records their purchasing habits at the point of sale. These loyalty cards therefore provide retailers with a detailed understanding of their customers, through both their transaction behaviour and their demographics.
These data were limited to shopping transactions undertaken at a single retailer. However, as these stores were located within central urban locations, major retail areas and out-of-town retail parks, these gave a good indication of the retail opportunities available in the study area. Additionally, over 30% of trips made by the older population are for shopping purposes [
27], the highest of all recorded trip purposes, and these trips could therefore be seen as the most important to older residents.
4. Data
The data provided by the high street retailer comprised of loyalty card transactions between 1 April 2012 and 30 September 2014, i.e., all transactions where a loyalty card was used either to collect points or to redeem a discount. These data included the date and time of each transaction, the ID of the store at which the transaction took place and an account ID to link transactions to customers. Additional data were provided for customers (account ID, sex, year of birth and postcode) and stores (store ID, store location and retail structure descriptions). These data were anonymised by the retailer prior to being shared so that no customers were identifiable.
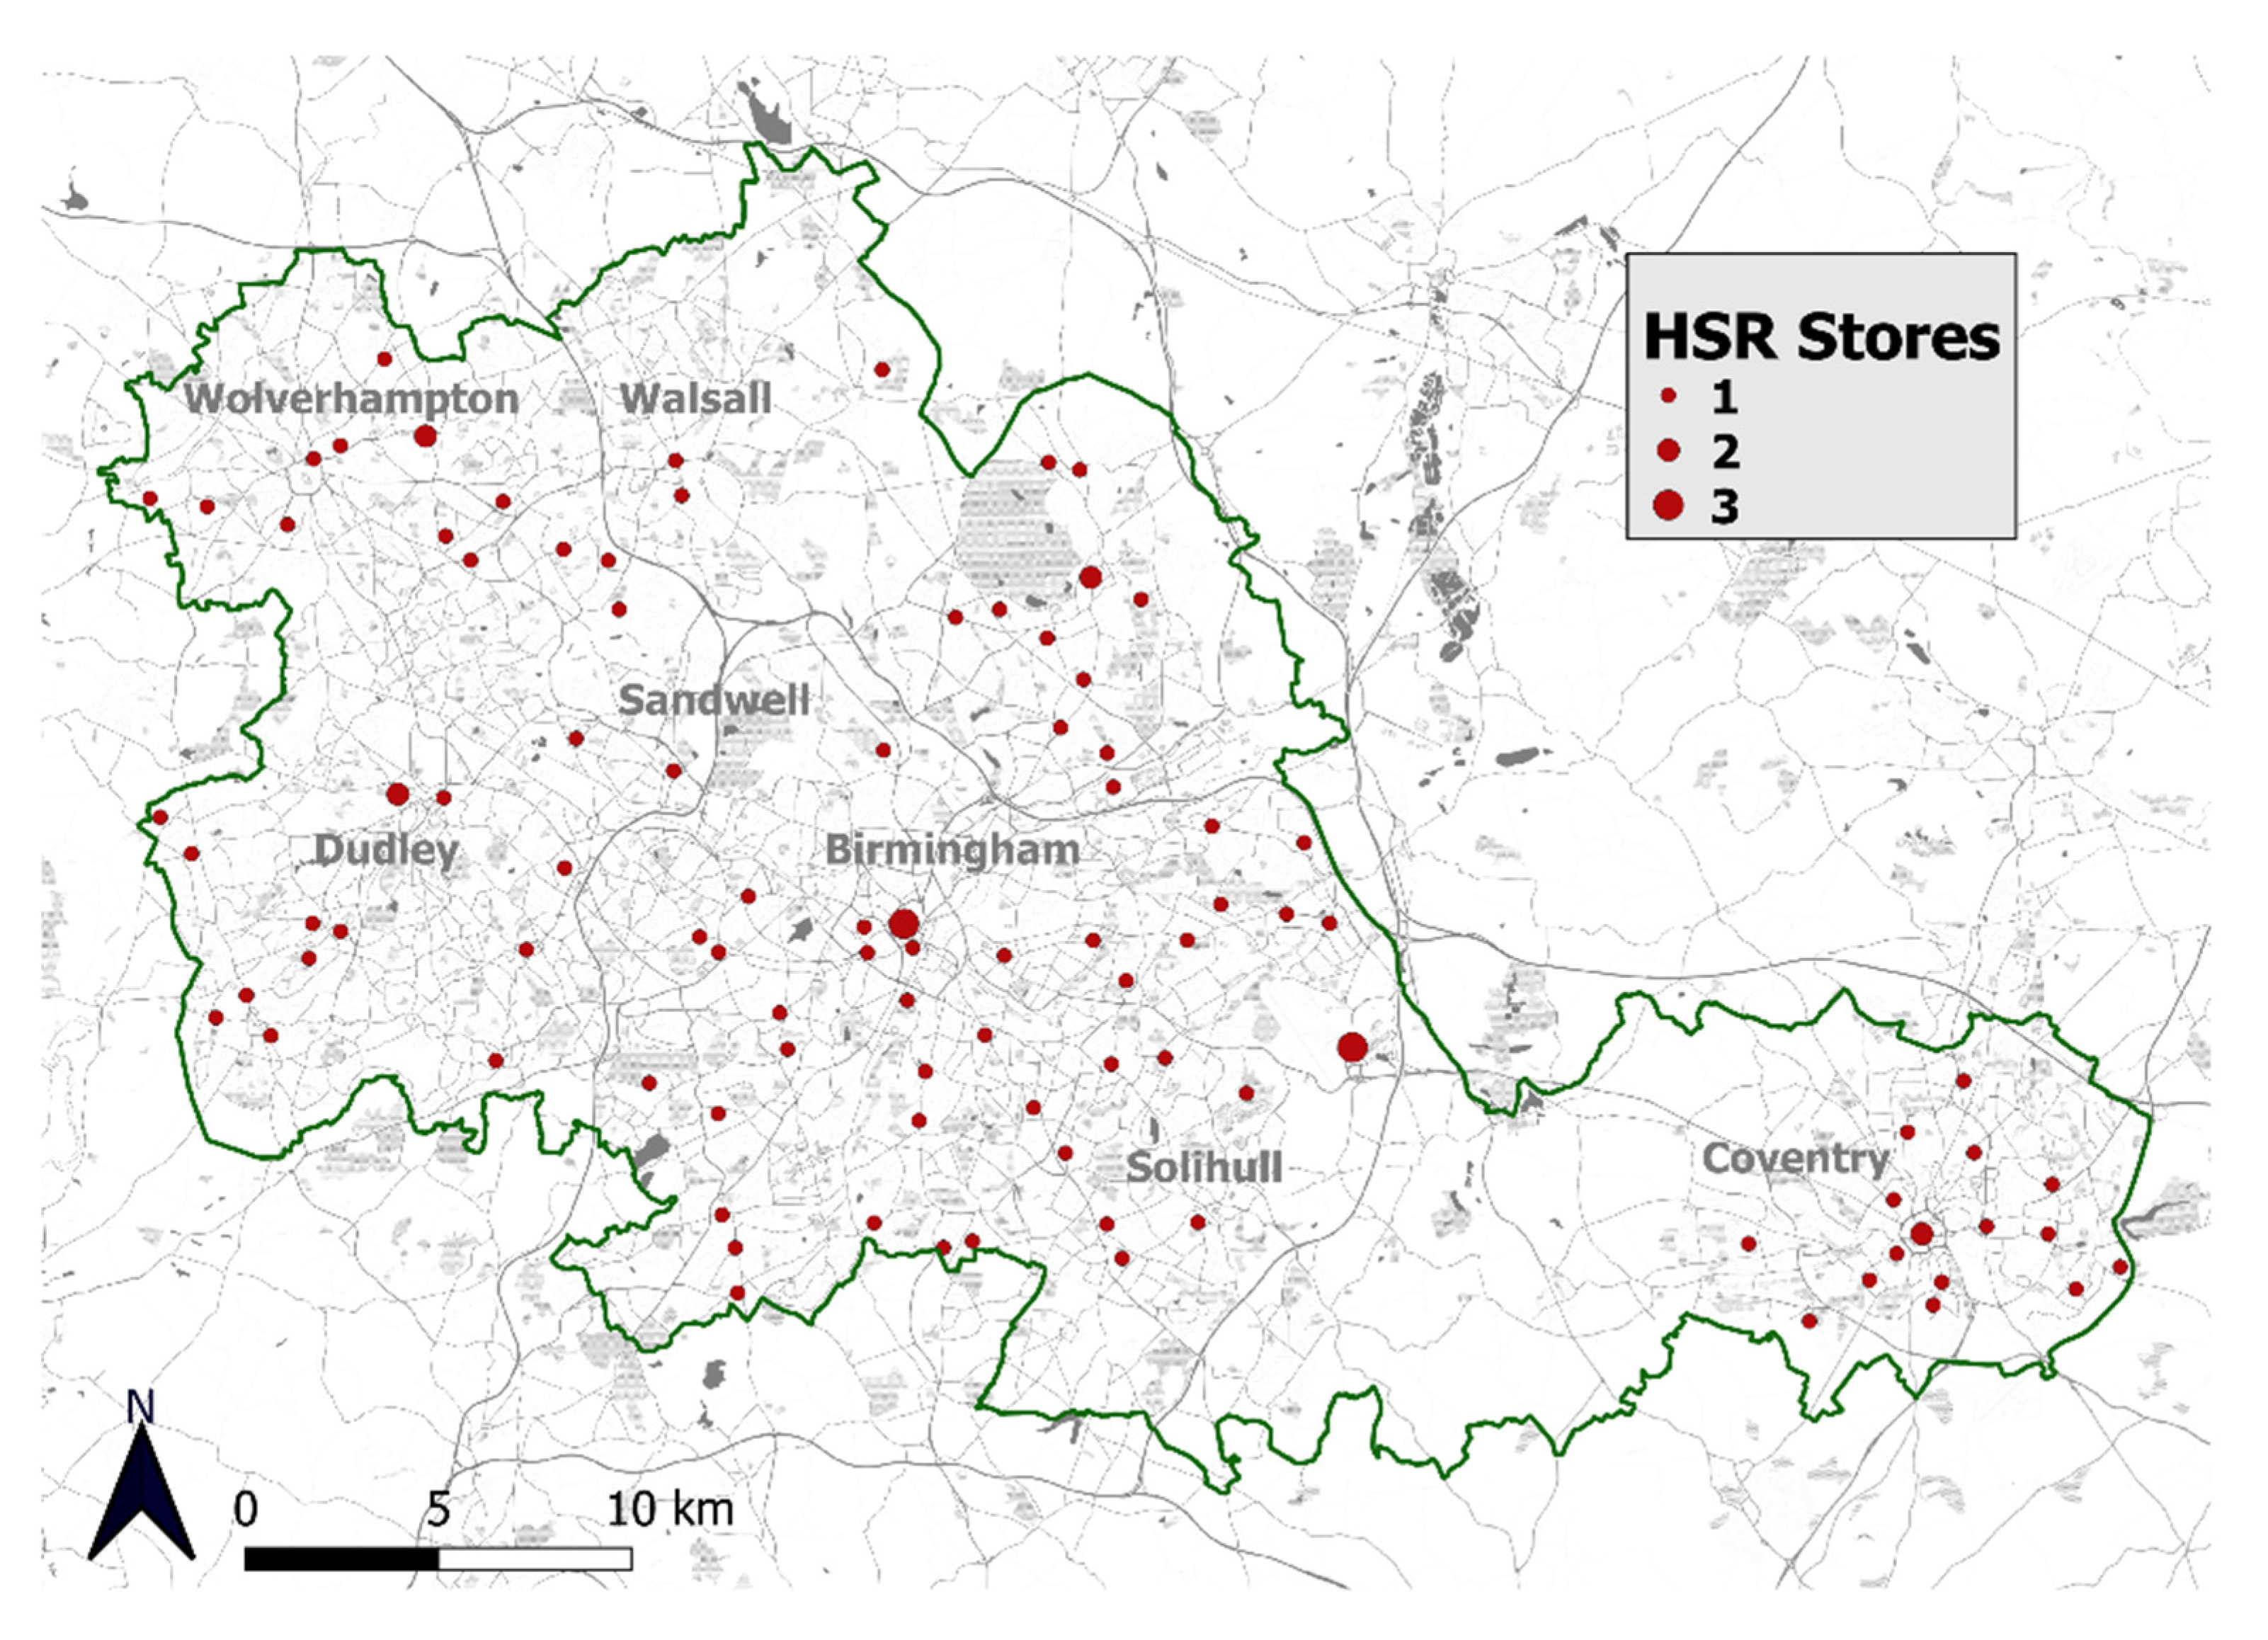
There were over 100 HSR stores located in the West Midlands metropolitan area. Stores could be broadly separated into four distinct store types, which provided diverse services and were also located in distinct retail areas, including small and large high streets, edge-of-town retail parks and major transport hubs. Whilst the data used for this study were limited to a single retailer, this diversity in both the services provided and the location of stores meant that this data could be used as a proxy for the retail opportunities that can be accessed by cardholders.
Figure 1 shows the location of stores throughout the West Midlands. Store locations are shown at LSOA centroids, with points proportional to the number of stores located within each LSOA, to protect the anonymity of the data provider.
The HSR data were filtered to only include those with registered postcodes located within the West Midlands metropolitan area and for those age 65 and over. This resulted in a dataset consisting of 136,772 individuals and 3,242,592 transactions. On average, cardholders made 23.7 transactions and visited 3.9 different HSR stores.
As the HSR transaction data only captured a proportion of cardholders’ retail transactions, in order to maximise how representative these were of the activity of the population, these activity patterns were only derived from those that actively made use of the loyalty card scheme. This prevented the aggregate results of any analyses being biased towards the large proportion of cardholders that have made little use of the loyalty card scheme. Identifying ‘active’ cardholders considered two factors: the number of transactions that had been undertaken and the period over which these transactions were made. This method therefore considered the longitudinal activity of cardholders rather than relied solely on transaction frequency. In order to quantify this longitudinal activity, a new variable was created in the data representing the number of ‘active weeks’ of each cardholder, i.e., the total number of weeks that each cardholder undertook at least one transaction. In order to maintain a suitable level of minimum transactions and a suitable number of cardholders for analysis, a threshold of 10 ‘active weeks’ was implemented. This meant that any cardholders who had not made at least 10 transactions and transacted during at least 10 weeks over the study period were removed from future analyses. This resulted in 28,217 inactive cardholders being removed from the analysis, with 108,555 cardholders remaining.
TfWM provided the bus timetable data for the study period. These data contained information on the order of the stop along the route (‘n’); the route number and direction (‘I’ for inbound or ‘O’ for outbound) toward which each bus runs; the NaPTAN code, i.e., the bus stop code for each scheduled stop,; the journey start time; scheduled arrival and departure times; and the day of the week for which the service was scheduled. An extract of these data is shown in
Table 1.
The demographic and socioeconomic characteristics of cardholders also showed influence on the retail activity and transaction behaviour and therefore were also included in the final regression models. These data were selected due to their established relationships with mobility. Deprivation data were included in the form of an Index of Multiple Deprivation (IMD) score for each area. These data were included as deprivation has been shown to constrain mobility and therefore understanding the relationship between deprivation and use of the public transport network could aid local transport authorities in the targeting of resources [
28]. The links between mobility and health are well documented, for example, the relationship between improved travel opportunities and increased health [
7], and improved health through better access to healthcare services [
29]. Information relating to the general health of cardholders was therefore included in the models to account for this relationship. In addition, it was important to include data relating to the availability of private transport modes as this can have a significant impact on both public transport usage and the types of trips undertaken using public transport services [
30]. Ethnicity was also included as differences have been found in the travel behaviours of different ethnic groups, including the number of public transport trips undertaken and the purpose of these trips [
31]. Finally, the average age of the cardholder population was included due to the aforementioned relationship between mobility and age [
6,
7].
Table 2 provides a brief description of these variables and an overview of the measures used, and
Table 3 outlines some descriptive statistics of each variable as it relates to both the West Midlands study area and to England and Wales for comparison. All variables were recorded at the Lower Super Output Area (LSOA) level, a geography for reporting small area statistics in England and Wales.
Whilst these variables were generally comparable between the study area, and England and Wales, on average, the West Midlands tended to be more deprived and to have a higher proportion of residents with ‘bad’ or ‘very bad’ health. Private transport availability was also generally lower, with an average of 60.6% of LSOA residents with access to a private car or van compared to an average of 70.4% in England and Wales. The West Midlands had a higher proportion of residents from a non-white ethnic background and a younger population on average.
5. Methods
5.1. Research Outline
To assess the relationship between public transport provision, accessibility and the activity spaces of cardholders, this study employed regression analyses. For this study, where the impact that a number of factors has on the activity spaces of cardholders was analysed, multiple regression models were implemented as these allowed for more than one independent variable to be included.
One of the issues with basic multiple regression is the potential presence of spatial autocorrelation. Spatial autocorrelation describes the presence of systematic spatial variation in a variable, for example, areas of high or low values may cluster together rather than being randomly distributed throughout the study area [
34]. This causes an issue when conducting regression analyses as linear regression models rely on the assumption that observations are independent from one another. To test for spatial autocorrelation in the residuals of the multiple regression model, a Moran’s index (Moran’s I) was calculated, which measures spatial autocorrelation based on both feature locations and feature values simultaneously [
35].
If spatial autocorrelation was present in the model residuals, a spatial regression model was conducted to account for spatial dependence. This study considered spatial error models and spatial lag models, the two most commonly used in research [
36]. To test whether a spatial error or spatial lag model produced the best fit, a Lagrange Multiplier (LM) test was conducted. This test was conducted on the residuals of the spatial regression models and was employed to determine whether, and in which form, spatial correlation is present [
34]. A high LM value and a significant (<0.05)
p-value indicated that that spatial regression model produced the best fit.
Once it was determined whether a spatial error or spatial lag model produces the best fit, this was implemented as the ‘final model’ and run on the data. For this study, the independent variables in each model were the demographic, public transport provision and travel time variables, with the dependent variables consisting of the activity space variable.
5.2. Independent Variables
The independent variables included in the regression models consisted of both the demographic and socioeconomic characteristics outlined in
Table 2 and a number of variables related to both the public transport network and the HSR store network. These variables were selected as they provide an overview of the efficiency of the public transport network and the accessibility of HSR stores via public transport services.
To understand the relationship between the provision of public transport and the activity spaces of cardholders, the average number of buses servicing each LSOA in the study area was included as an independent variable in the models. Weekday service provision was selected due to the large variation between Saturday and Sunday services that would skew any mean service provision calculations. Off-peak service provision was chosen due to two inter-related factors: the propensity of the older population to undertake journeys during off-peak hours and the fact that the ENCTS travel pass does not allow for travel during the morning peak period.
To calculate the average service provision in each LSOA, bus timetable data were used. The timetable data were filtered to contain only the journeys that were scheduled to arrive at each stop on a weekday and during off-peak hours, using the ‘
Day of week’ and ‘
Arrive’ variables. The data could then be grouped by the ‘
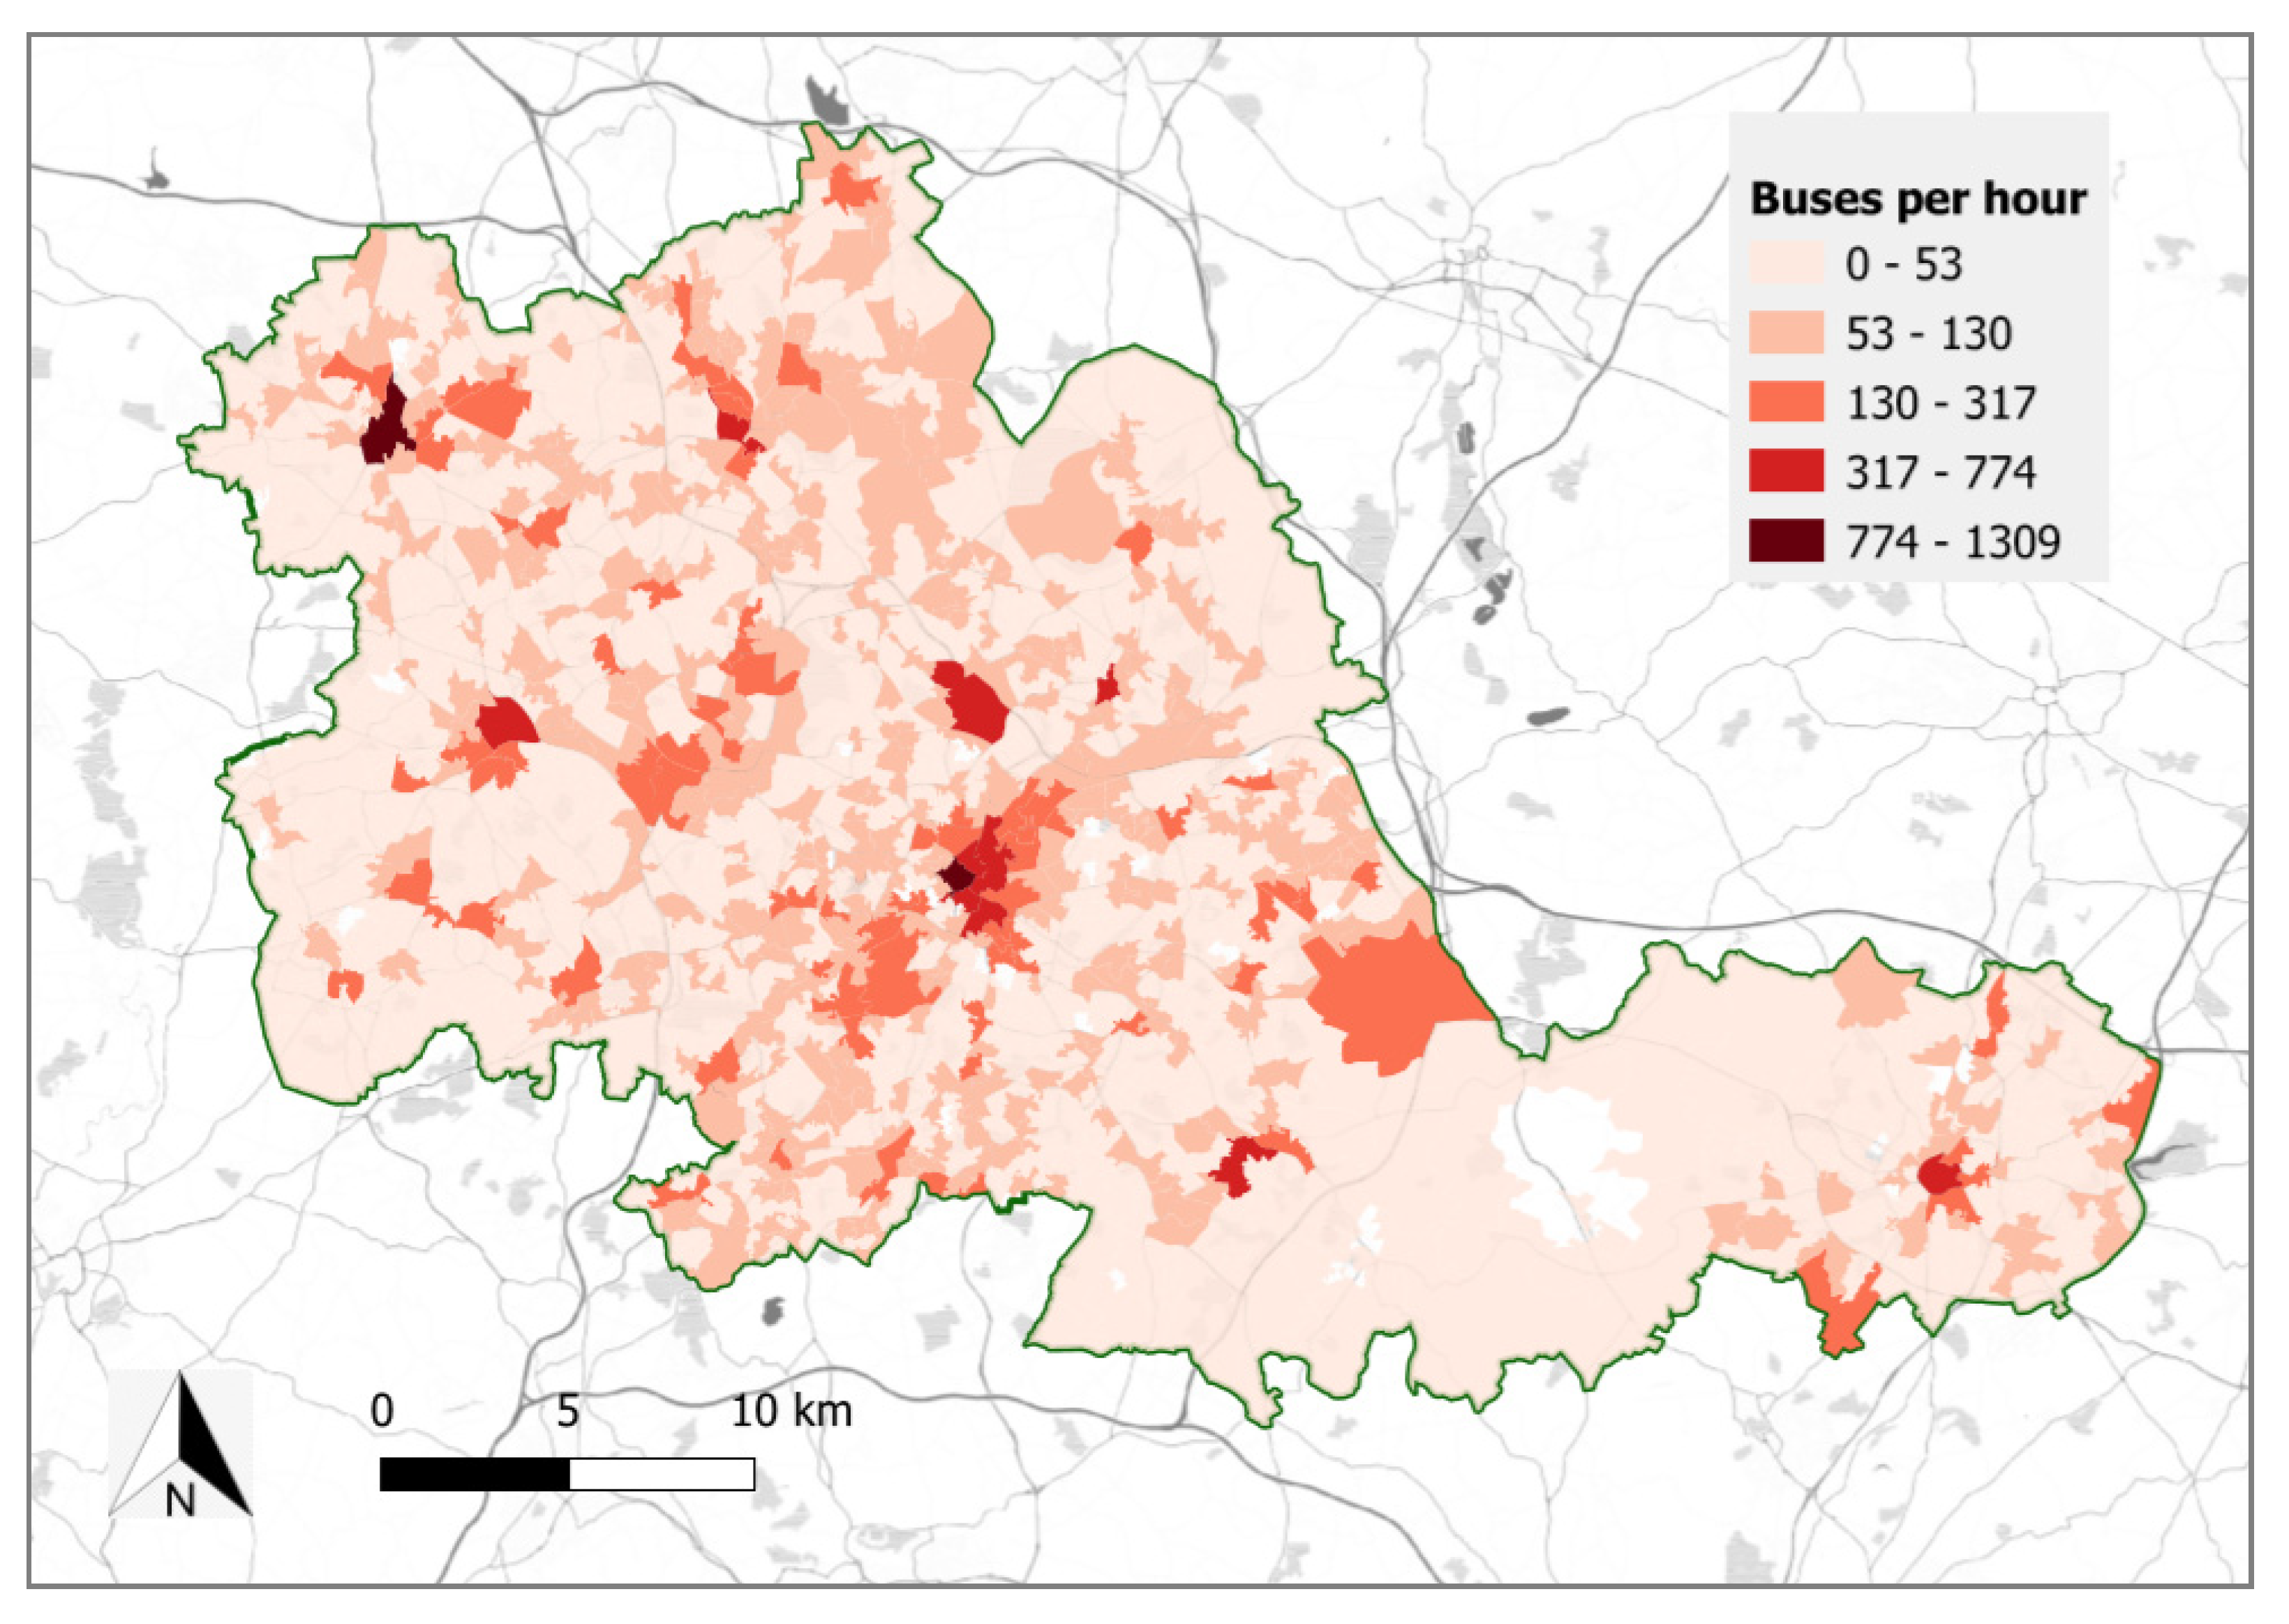
NaPTAN code’ variable, and the number of buses scheduled to visit each stop were calculated. The average hourly service provision was then calculated as the mean number of buses that visit each stop per hour. These bus stops were then aggregated to LSOA, with the total number of buses that visit each LSOA per hour calculated, as shown in
Figure 2.
Areas with the most service provision were generally located in central urban areas and around main transport hubs, including Birmingham Airport. More rural areas, including large areas of Solihull, had significantly less service provision. These service provision values were included in the final spatial regression models to gain an understanding of the impact that service provision has on activity behaviour and to account for varying levels of service provision when assessing the impact of the other variables included in the models.
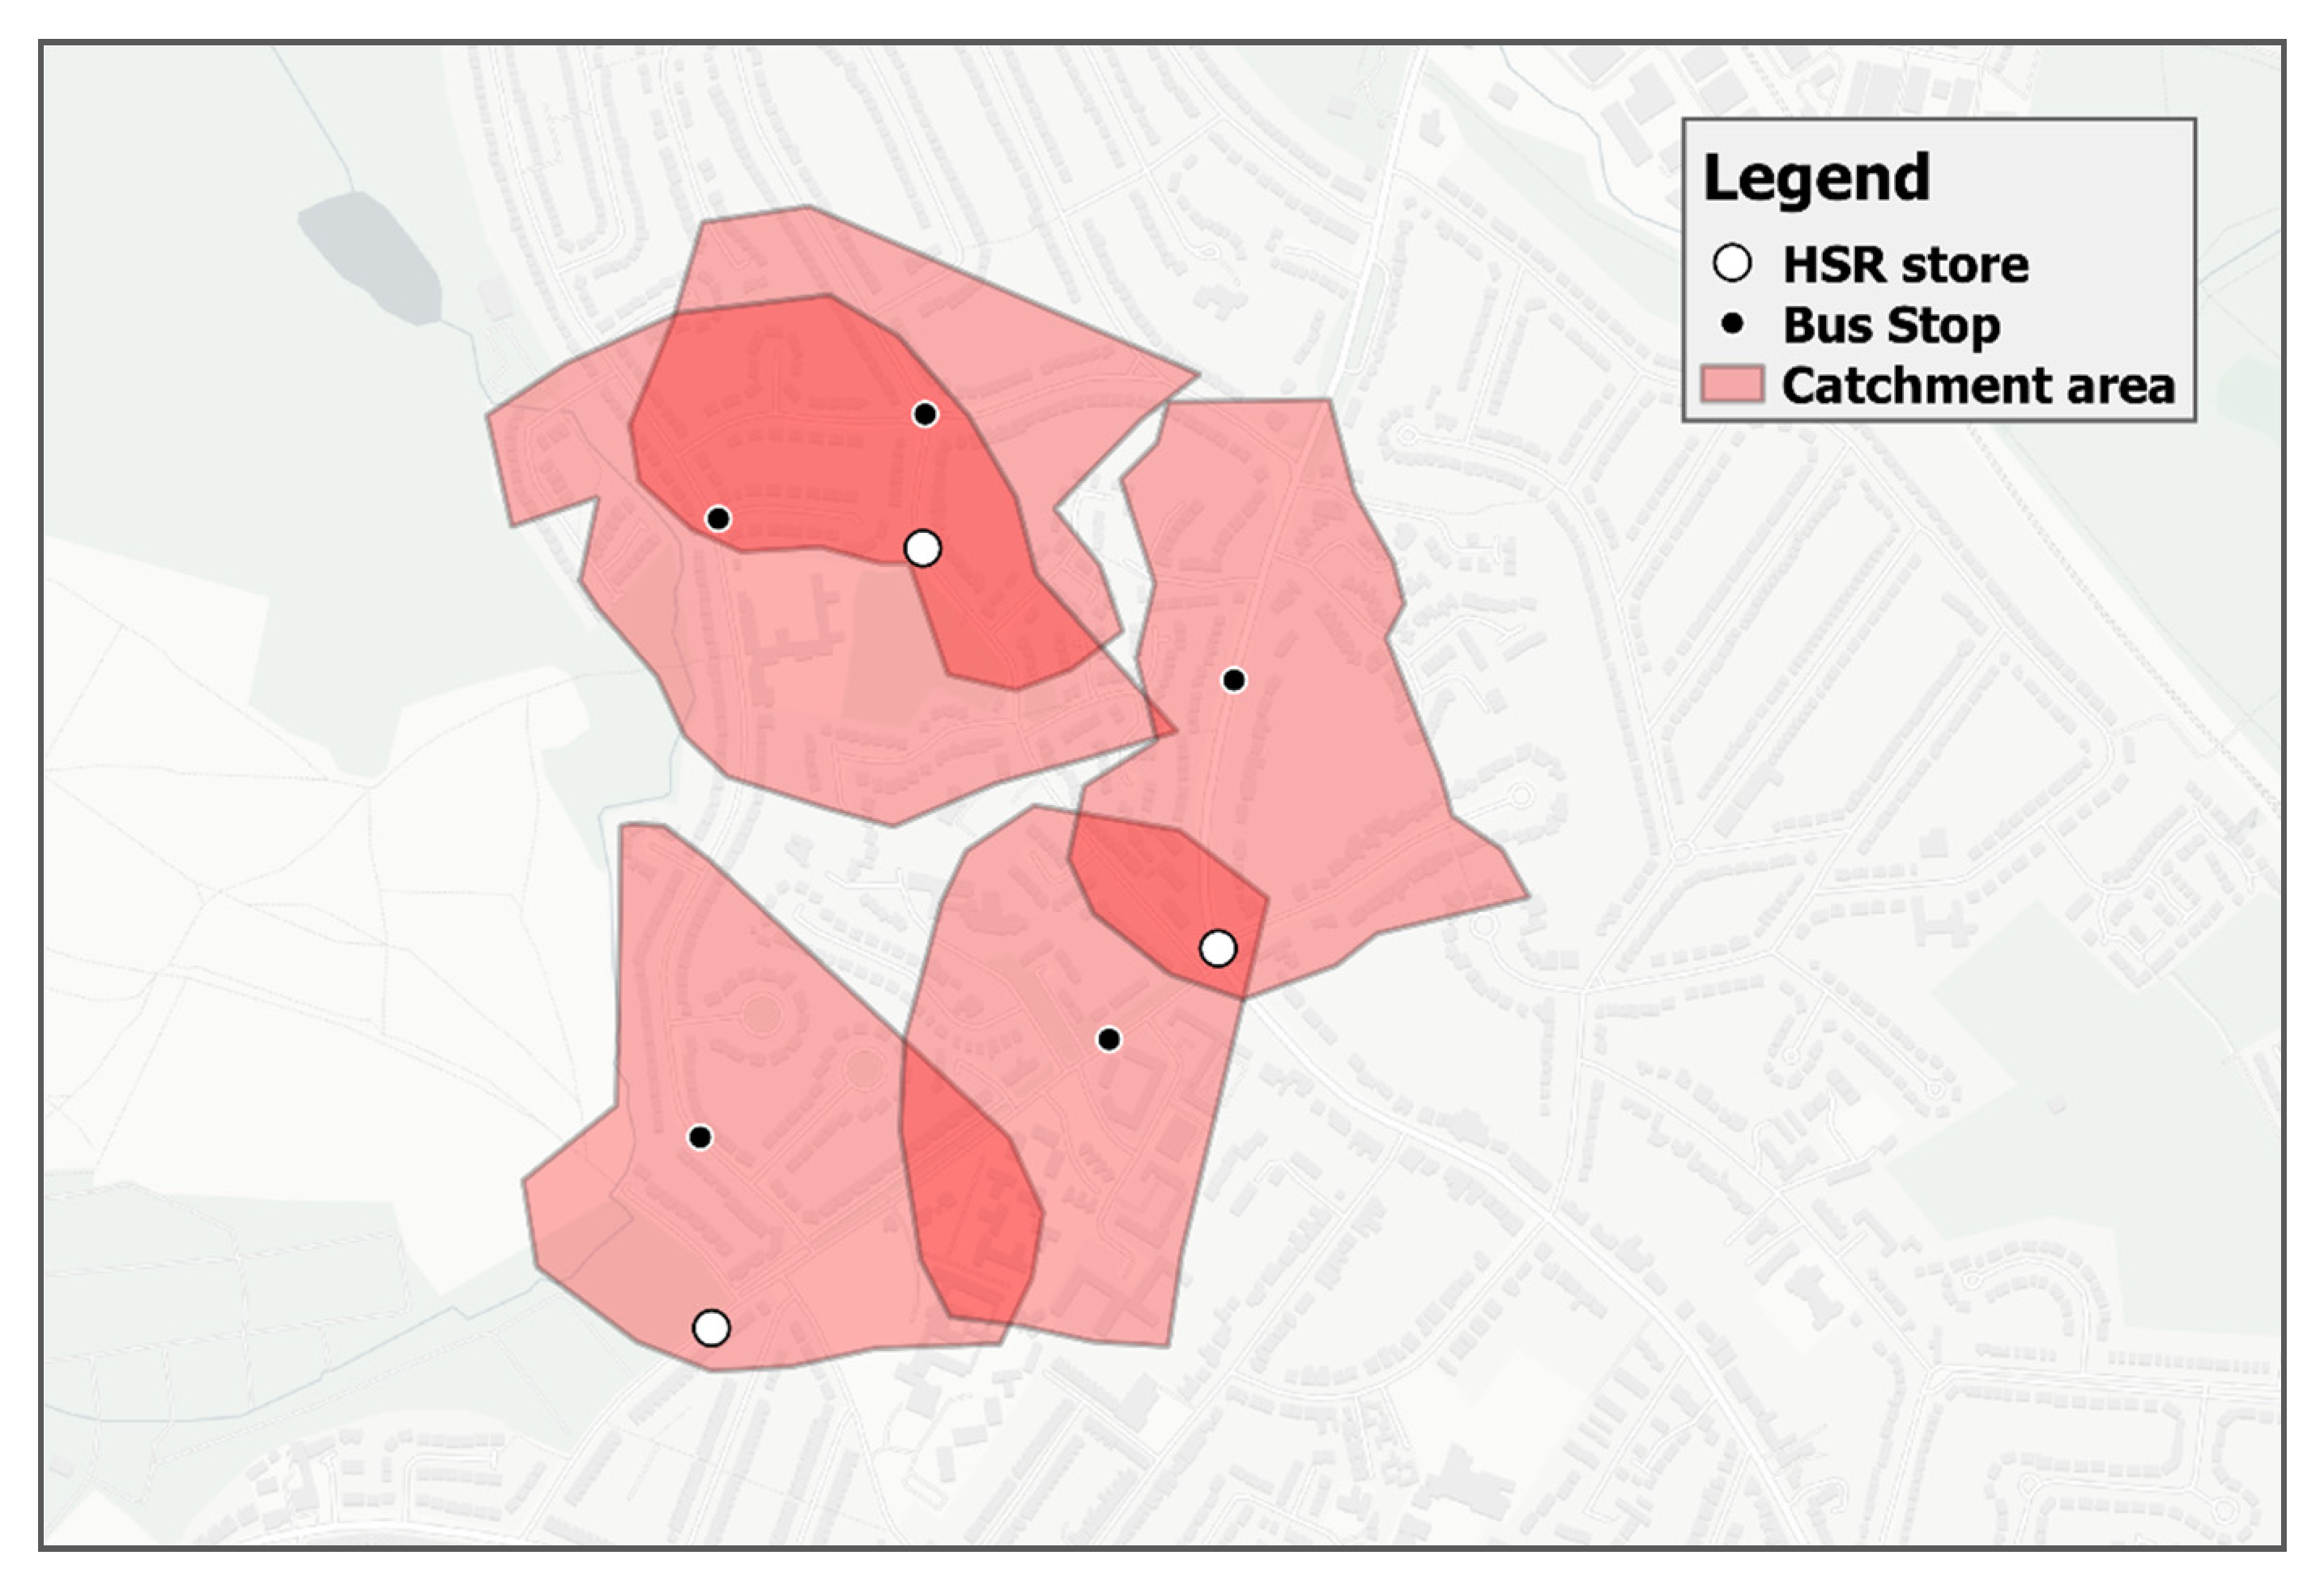
To calculate average travel times to HSR stores, bus timetable data were once again utilised. For consistency, the same off-peak, weekday time periods that were selected for the service provision analysis were used. The first step in calculating travel times was to identify the bus stops that service HSR stores. To achieve this, bus stop catchment areas were constructed. These catchments consisted of 400 m service areas built along the road network, which correspond to an average 5 min walk time. A distance of 400 m was chosen as this distance is the general ‘rule of thumb’ used in transport service planning [
37]. For this analysis, a spatial join was conducted between the HSR store locations and the bus stop catchments, and if an HSR store was located within the catchment of a bus stop, then this stop was determined to service that store. This resulted in a table containing all bus stops that service at least one HSR store as well as the departure and arrival times of all buses that service these stops.
Figure 3 shows a simplified example of this analysis.
Combining this dataset with the original timetable data via the ‘route’ and ‘journey scheduled’ variables then resulted in a dataset that contained the departure time of each service from every bus stop along each route and the subsequent arrival time at the stops that service HSR stores along the same route. The time difference between these departure and arrival times was then calculated, and the minimum time was retained. This final dataset therefore contained the minimum time it would take to reach a bus stop that services an HSR store from every other bus stop along the same route, i.e., the ‘direct access time’.
Table 4 outlines this method.
As only 302 of the 314 routes in the study area directly serviced an HSR store, an additional analysis was conducted to account for transfers between services. The same method used for direct routes was applied but instead of bus stops that service HSR stores, ‘transfer’ bus stops, i.e., stops that service more than one route, were used. The minimum time that it takes to access a ‘transfer’ stop and the subsequent minimum time it would take to then access an HSR store from this transfer stop were calculated. This method also considers wait times at these transfer bus stops by calculating the average wait time between the arrival time of the first service and the departure time of the next service.
Once the direct access times and the access times including one transfer had been calculated, the minimum for each stop was retained as the ‘optimal’ access time. When aggregating the results to the LSOA level, the average access time to the three closest HSR stores were calculated as this acknowledges that individuals may not always wish to transact at their closest store.
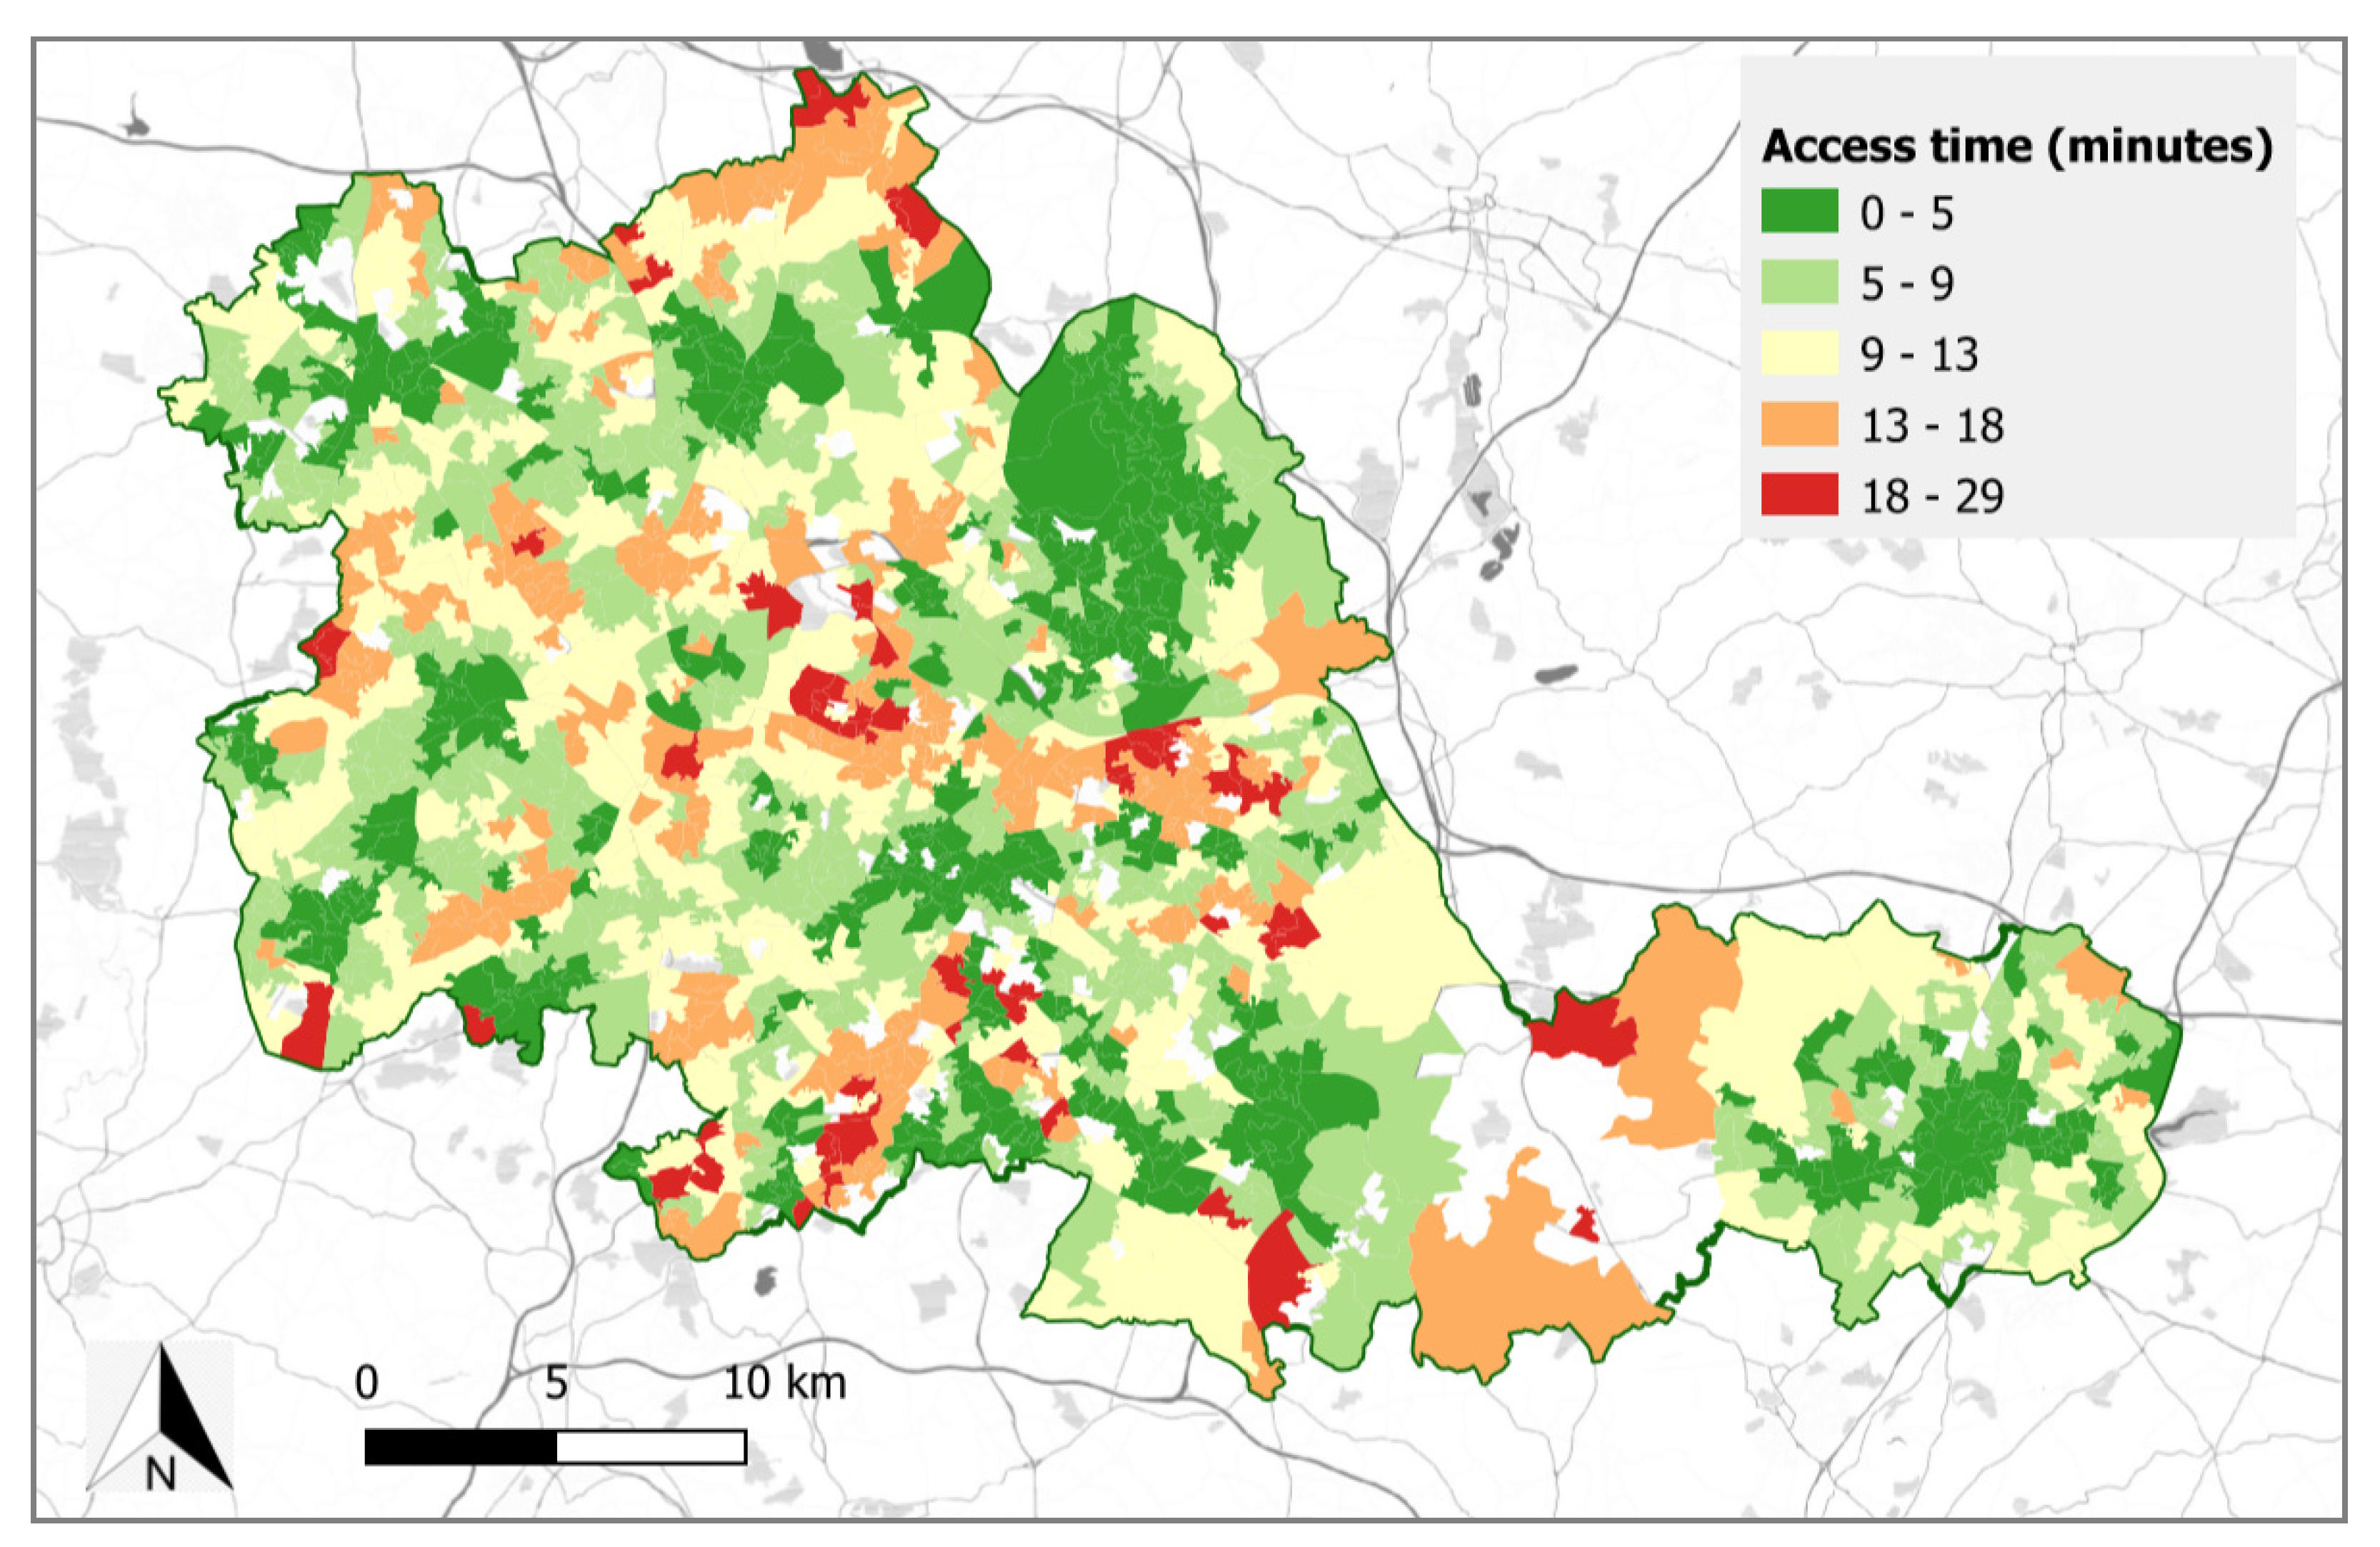
Figure 4 shows the average access time to the closest 3 HSR stores for each LSOA. To protect the anonymity of the data provider, the locations of these stores cannot be displayed. For those areas that do not have an access time value, it was found that 3 HSR stores were not able to be accessed with only one transfer between bus services. These areas were primarily located in the most rural parts of Solihull as well as isolated LSOAs throughout the study area. Similar to the bus service provision analysis, the access time variable was included in the regression models. By including this variable in the final models and by accounting for other variables such as distance to HSR stores and the availability of private transport, insights into the impact that bus service efficiency has on the activity of the older population could be generated.
The structure of the HSR store network was determined to influence the retail behaviours of cardholders. For example, those living in close proximity to an HSR store might be expected to transact more often and at fewer stores than those living further away. To obtain a clear view of the impact of public transport provision and accessibility on retail activity, it was therefore important to account for the structure of the store network in the regression models.
To gain a general view of the structure of the store network in terms of the location of HSR stores in relation to a cardholder’s home residence, the average road network distance to the nearest three stores was calculated for each LSOA centroid in the study area. The road network distance from each LSOA centroid to each HSR store was determined using the Closest Facility tool in ArcMap, and the average value of the three nearest stores was calculated.
5.3. Dependent Variable
The area of an individual’s activity space is related to how mobile they are and the number of opportunities that they are able to access. An individual with a limited activity space may be determined to be disadvantaged; however, it must be acknowledged that there is a difference between those that choose to travel locally due to an amenable local environment and those that travel locally due to a lack of choice [
20]. The previous analyses into public transport access and the HSR store network were conducted to account for this.
Many studies have implemented different methods to measure the size of an individual’s activity space. The most commonly used methods are to measure the area of a minimum convex polygon (MCP) covering all locations visited by an individual [
20,
38,
39] or to generate a standard deviational ellipse (SDE) calculated using location coordinates [
40,
41]. For this analysis, the area of each individual’s activity space was calculated as the size of an MCP covering all HSR stores visited by each individual. This was chosen over the SDE method as it results in a more accurate measure of activity space area, only covering those locations that a cardholder is known to have visited.
The method for constructing activity spaces firstly involved allocating each cardholder a regular store network. Only stores that were visited regularly were used to construct activity spaces as these were indicative of the areas and, therefore, opportunities that were readily available to cardholders. A proportional threshold was used as this allowed for cardholders to have different numbers of regular stores, which is an important factor in this analysis and allows for the consideration of store-network density, i.e., some areas may have several stores in close proximity whereas others may be limited to only one local store. Firstly, the number of times that a cardholder transacted at each store was determined and the proportion of a cardholder’s total transactions was calculated. After an analysis of the distribution of these proportions, regular stores were defined as those that made up at least 20% of a cardholder’s transactions. This resulted in a list of regular stores for each active cardholder. The average number of regular stores allocated to each cardholder was 2.1.
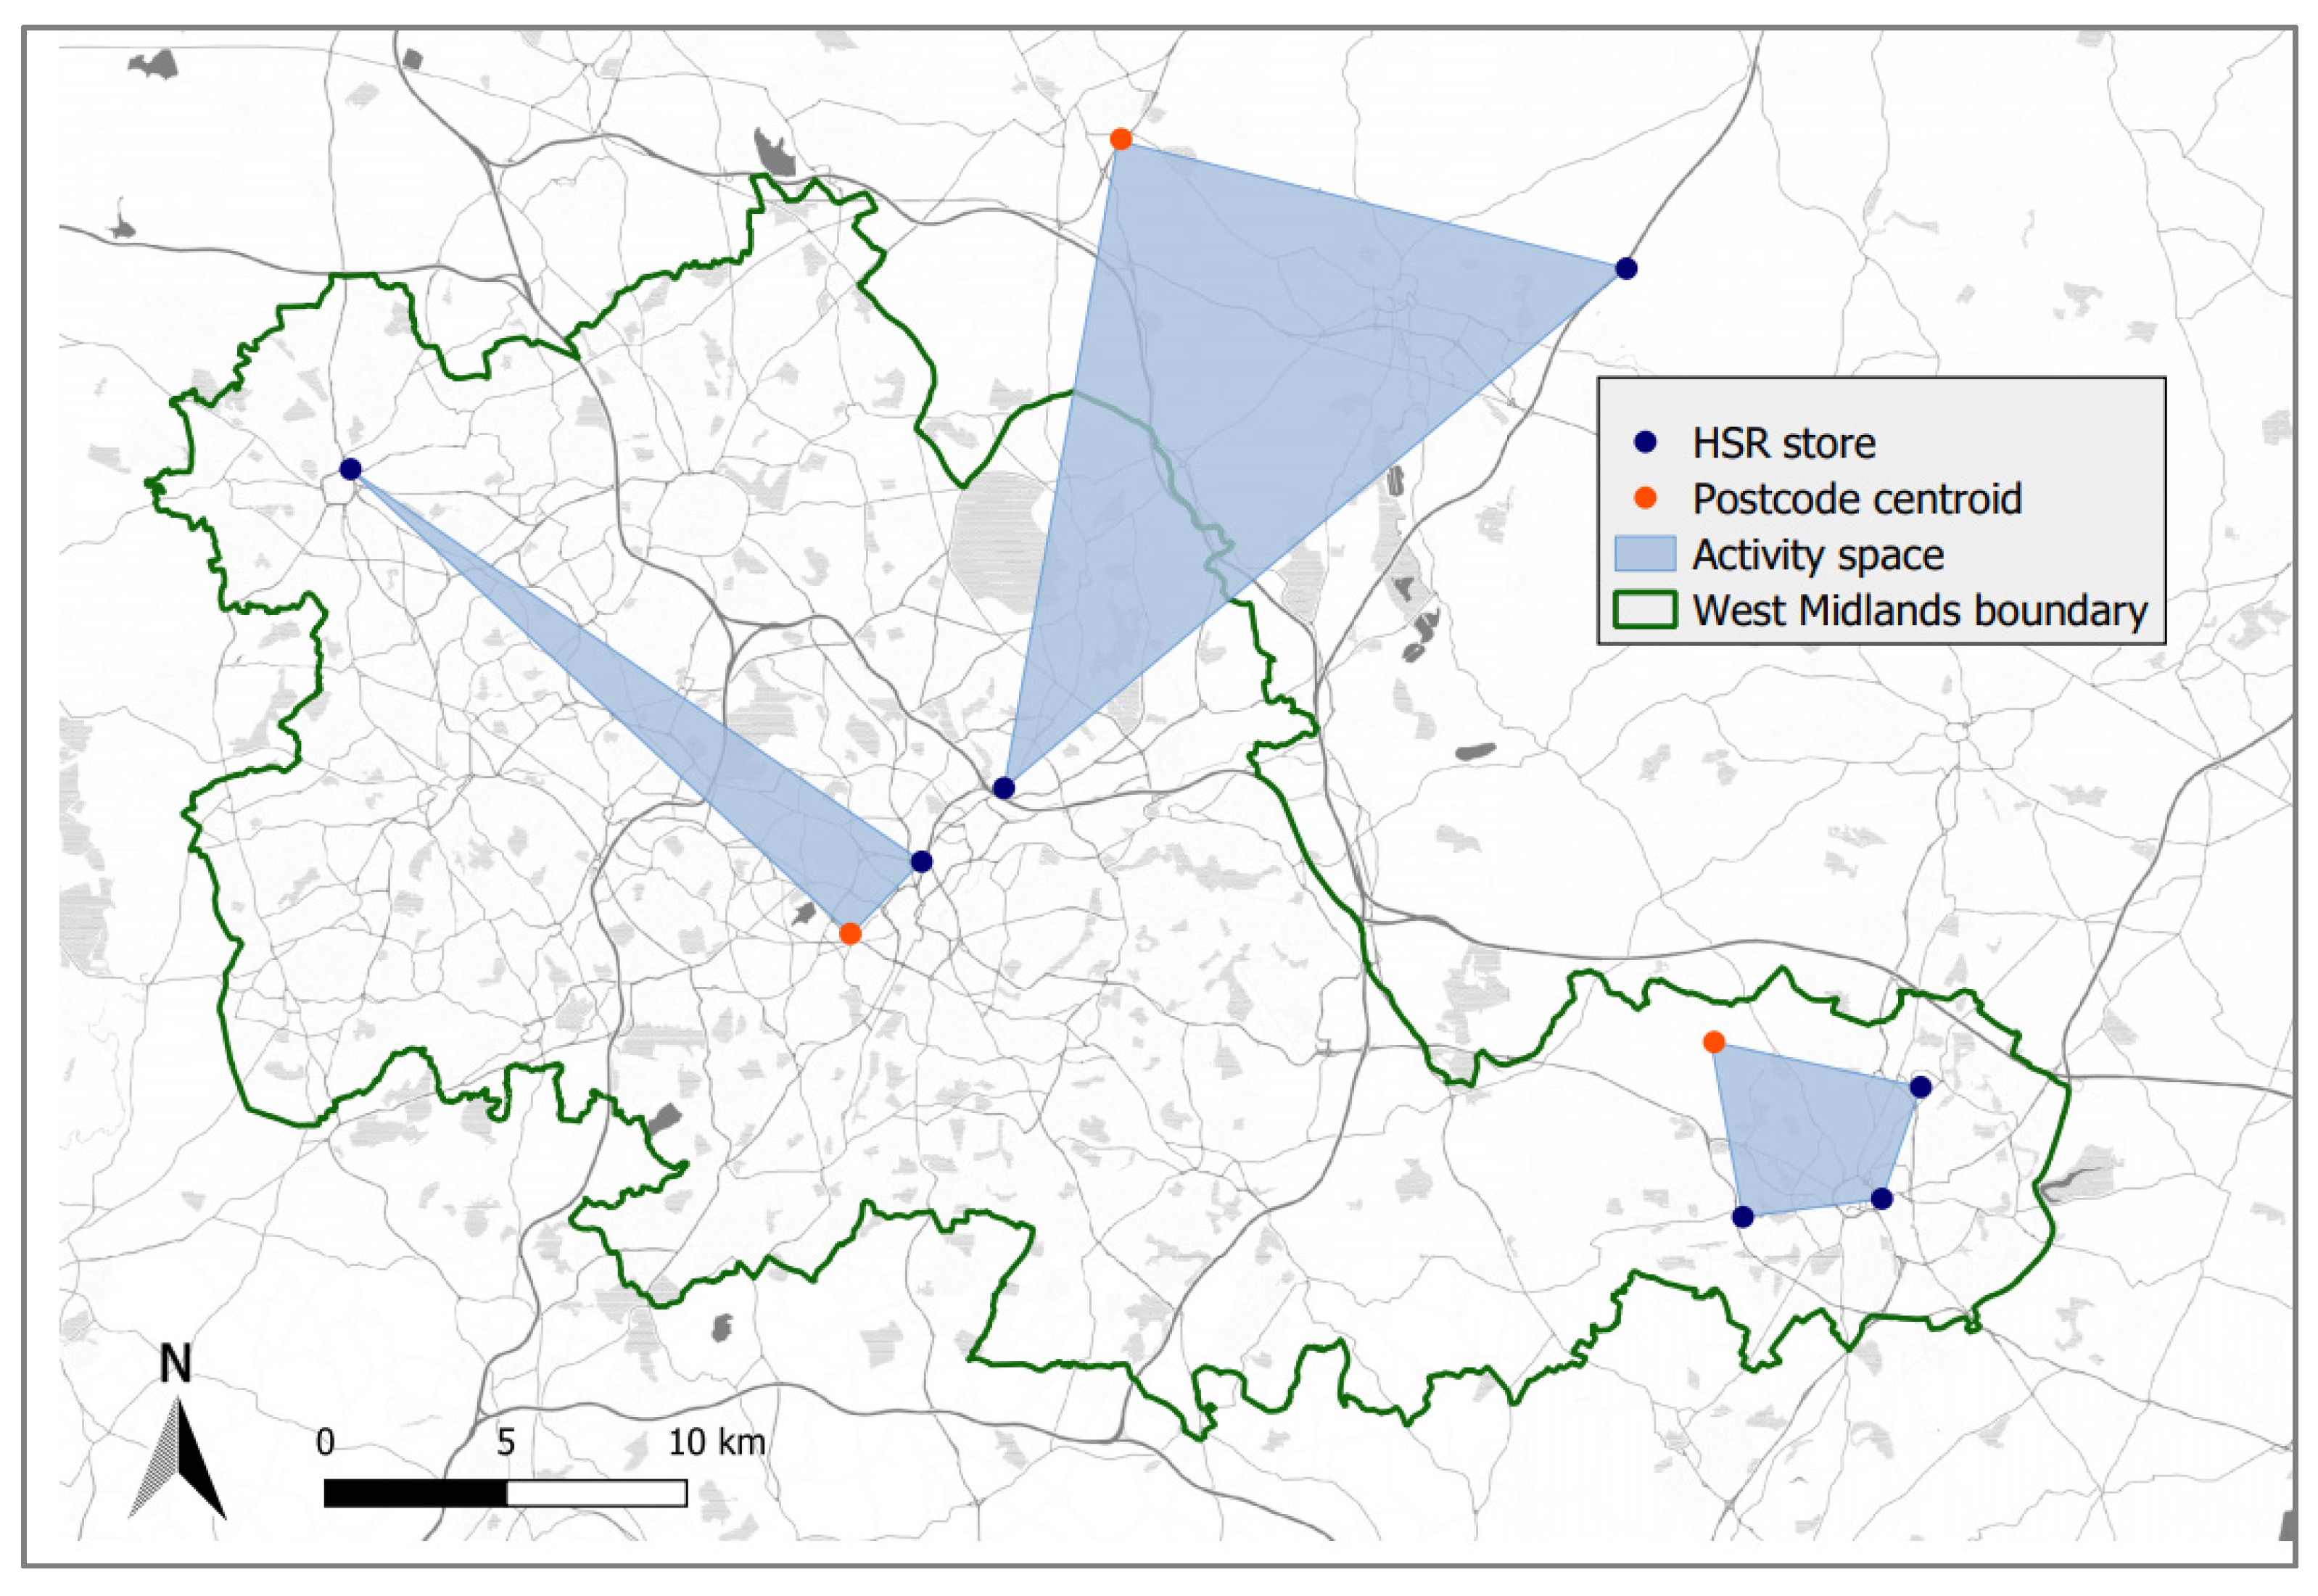
To construct the MCPs, firstly the latitude and longitude of each regular store visited by each cardholder were extracted, along with the latitude and longitude of the centroid of each cardholders’ registered LSOA. These data were then imported into ArcMap, and an MCP was generated for each cardholder using the Minimum Bounding Geometry toolbox. The area of the resulting MCPs were then calculated for each cardholder, and an average area was calculated for each LSOA. For those cardholders with a single regular store, this was instead calculated as the distance from the centroid of the cardholders’ registered LSOA to the store location. This average activity space area was implemented as the dependent variable in the regression models.
Figure 5 shows three example activity spaces, with dummy locations for cardholders’ registered postcodes and the locations of HSR stores. The average number of regularly visited stores for each cardholder was just below two, with the average distance travelled to a regular store around 10 km.
5.4. Data Standardisation
Both the dependent and independent variables were rescaled to ensure that the results were easily comparable. This refers to the process of rescaling data measured in different units or on different scales to a notionally common scale. This study used z-score normalisation, converting both the dependent and independent variables to the same scale and therefore allowing for the coefficient estimates to be easily compared between variables.
6. Results
The independent variables related to economic wellbeing and health (‘IMD score’, ‘poor health’ and ‘age’) were hypothesised to negatively impact activity space area. The variables related to transport and the HSR store network (‘car or van availability’, ‘network distance’, ‘service provision’ and ‘travel time’) were expected to have positive relationships with activity space area. Areas with high private transport availability and bus service provision were predicted to contain residents with larger activity spaces due to the higher levels of mobility afforded by transportation access. Higher network distances and travel times were hypothesised to have the opposite effect, with the greater cost of travelling to HSR stores decreasing the area of cardholders’ activity spaces.
Table 5 shows the results of the multiple regression model.
IMD score was shown to have the greatest impact on activity space area. An increase in score and, therefore, deprivation of an LSOA resulted in a decrease in the average activity space area for cardholders residing in that LSOA. Similarly, an increase in the number of residents with poor health also resulted in limited activity spaces. The average age of cardholders residing in each LSOA was also found to correspond with a decrease in the average size of activity spaces, suggesting that older cardholders may have constrained activity spaces.
‘White ethnic group’, ‘car or van availability’ and ‘service provision’ all had significant positive coefficient estimates, meaning that, as these variables increased, so did activity space area. The proportion of the population that was of a white ethnic background was found to have the largest impact on activity space area. This therefore suggested that a higher proportion of residents from a white ethnic background in an LSOA resulted in a larger average activity space. ‘Car or van availability’ referred to the proportion of the LSOA population that had access to a private car or van, and therefore, the positive coefficient for this variable suggested that, the higher the proportion of the population with access to private transportation, the larger the average activity spaces of the cardholders residing in these areas.
In terms of the public transport, only service provision was found to have a significant impact on activity space area. An increase in the hourly provision of buses in an area was found to result in a slight increase in the average activity space of cardholders, which suggested that reliable public transport services allowed for greater travel.
Both ‘travel time’ and ‘network distance’ were not found to have a significant impact on the size of a cardholder’s activity space. The lack of a significant relationship between these variables and the average size of a cardholder’s activity space area therefore meant that the average time taken to visit HSR stores did not significantly impact the average size of cardholders’ activity spaces.
The R2 value of 0.22 meant that 22% of the variation in activity space area could be explained by variations in the independent variables, and the p-value of the overall model meant that this was statistically significant. This relatively low R2 value was likely the result of the aggregation of variables to LSOA levels.
To check for the presence of spatial autocorrelation in the residuals, a Moran’s I test was conducted on the residuals of the multiple regression model. The results of this are shown in
Table 6.
The positive z-value and significant
p-value suggested the presence of spatial autocorrelation. The relatively small z-value suggested that this spatial autocorrelation was not great; however, as this was still found to be significant, a spatial regression model was conducted. Again, a Lagrange Multiplier test was run to determine whether to select a spatial error or spatial lag regression to account for this spatial autocorrelation.
Table 7 shows the results of the Lagrange Multiplier analysis.
The values and
p-values for the LMerr and LMlag tests showed that the LMerr produced the highest value and the only significant
p-value. This meant that spatial autocorrelation was present in the error terms and that, therefore, a spatial error model would produce the best fit. It was hypothesised that similar coefficient estimates would be found by the spatial error model but that these may be of a lower magnitude.
Table 8 shows the results of the spatial error model.
Similar to the multiple regression model, all independent variables with the exception of ‘network distance’ and ‘travel time’ were found to be statistically significant. The estimates of the spatial error model showed similar relationships as found using multiple regression, with ‘IMD score’, ‘poor health’ and ‘age’ being the only variables having negative relationships with the average area of activity spaces. These variables are related to both disposable income and physical mobility, and therefore, it is suggested that these factors, rather than those related to the accessibility of HSR stores, constrained the activity and mobility of cardholders the most. The significant positive relationship with the provision of bus services also highlighted the importance of access to public transport services in allowing for greater travel.
The significance of the ʎ value and the likelihood ratio suggested that the inclusion of spatial error dependence improved the models when compared to a standard multiple regression model. The Wald statistic and the p-values also showed that a number of the explanatory variables were significant and, therefore, had a significant impact on the average area of cardholders’ activity spaces.
7. Discussion
7.1. The Impact of Public Transport Provision and Access
Inequalities in the provision of public transport and the accessibility of both public transport services and key facilities can impact wellbeing and can reduce social cohesion [
42]. Public transport provision plays a key role in the sustainability of urban areas and the quality of life of residents. Therefore, poor service provision or poor links to opportunity destinations can contribute to social isolation and exclusion and can prevent full participation in life-enhancing opportunities [
43].
In terms of the impact that service provision was found to have on the spatial activity patterns of cardholders, higher public transport service provision was found to correspond with larger activity spaces. Accounting for private transport availability using the ‘car and van availability’ variable and for the HSR store network using the ‘network distance’ variable meant that the impact of service provision could be largely isolated from other influencing factors. These results therefore substantiate the hypothesis that access to reliable public transport services can increase the mobility of the older population and allows for a wider range of opportunities to be accessed.
Large variations in service provision throughout the study area may therefore be of concern to transport authorities, with low levels of service in many suburban and rural areas potentially leading to constrained activity spaces of older residents in these areas. With questions surrounding the suitability of the ENCTS scheme [
7], the impact of bus service provision evidenced the benefits of this scheme for maintaining high levels of mobility within the older population, with knock-on implications for social inclusion and wellbeing [
44].
These results highlight the impact that public transport services can have on the activity spaces of individuals and the role that these services can play in determining the opportunities that individuals can reach. The transport disadvantage caused by a lack of access to efficient public transport services can lead to increased social exclusion and decreased wellbeing, in particular for populations that do not have access to key services and facilities in their local areas [
43].
Quantifying the impact of public transport on activity patterns is important for local transport authorities aiming to understand the influence that changes to current services and routes, or policy changes may have on the activity of different population groups. The insights produced in this study demonstrate how the triangulation of retail data and public transport data can help both transport authorities and retailers to understand the utility and function of current services.
7.2. Sociodemographics
Losing the ability to drive with age can impact wellbeing and social inclusion [
6,
7]. Focusing on the ‘car or van availability’ variable, it was clear that access to private transportation had a significant impact on activity, with an increase in the proportion of the population with access to private transportation found to correspond with an increase in activity space area. The positive relationship with the average area of cardholders’ activity spaces highlights the importance of access to private transportation in allowing for high levels of mobility. In turn, this also emphasises how those that rely on public transport services may be constrained in terms of their spatial activity patterns and the retail opportunities that can be accessed.
Current transport policies are often focused on encouraging individuals to move away from private transportation towards public transport services, both for environmental reasons and to ease congestion on roads. The significant relationship between private transport access and spatial activity suggests that current public transport services may not be able to provide the level of mobility that private transport can, with public transport users being constrained by the current, predetermined transport network. Encouraging a move towards public transport would therefore require transport authorities to ensure that mobility needs are met and that individuals are able to maintain the high levels of mobility currently afforded by private transportation when making the move to public transport services in the future.
IMD score was found to have a negative relationship with the average area of cardholders’ activity spaces, suggesting that those that reside in deprived areas may be constrained in terms of the retail opportunities that they are able to access. The idea that poorer groups of the population lack access to a wide range of retail opportunities has been widely researched [
12]. Quantifying this relationship and showing that those residing in more deprived areas suffer from disadvantages in terms of their spatial activity patterns further evidences these insights. This disadvantage can lead to a reduction in quality of life, with less opportunities for social interaction and increased social exclusion [
12].
The ‘poor health’ variable included in the models referred to the proportion of the population recorded as having ‘bad’ or ‘very bad’ health. The negative relationship found with spatial activity therefore suggests that those with poor health exhibit spatially constrained patterns of shopping behaviour. Although this is unsurprising, with the relationship between health and mobility widely researched [
1], the significant relationship found highlights the role that health can play in the mobility of individuals. This emphasises the need for transport services to have the capacity to meet the needs of different groups of the population in addition to the working age, commuting populations that public transport systems are often designed around [
45].
7.3. Limitations
This study used HSR store locations as proxies for retail opportunities. Although the HSR stores in the study area were located on many high streets and in all urban centres, these locations were unlikely to encapsulate all retail opportunities available throughout the study area. Similarly, HSR transactions only captured one dimension of a cardholder’s transaction records and were unlikely to be fully representative of their transaction behaviour across all retail stores. Individual choice and the role that HSR stores play in an individual’s full spending habits could not be accounted for. This restriction to only one retailer is one of the disadvantages of novel consumer data when compared to traditional data collection methods, such as surveys and questionnaires, which have the ability to capture an individual’s full retail behaviour. This is a trade-off that is often encountered when working with large consumer data, capturing only a dimension of all cardholders’ retail behaviour rather than gaining a full view of a select number of individuals’ behaviour [
46].
Rather than focusing on individual transaction behaviour, this study looked at the mobility patterns emanating from neighbourhoods with all variables aggregated to LSOA level. Gaining a general view of retail behaviour and mobility through aggregate patterns addresses some of the issues that arise when only utilising data from one retailer and reduces the impact that individual choice would have on the analyses. With a minimum of 143 HSR loyalty cardholders per LSOA, the overall patterns emanating from these neighbourhoods were determined to provide a more accurate view of exclusion than had this study focused on individual behaviours.
Additionally, this analysis could have been expanded to include more than one transfer between services. However, due to the computational cost associated with this, it was deemed unnecessary for the scope of this study. As this analysis focused on minimum travel times, transferring between two or more services whilst considering wait times at stops in many cases would not have resulted in shorter travel times. The aggregation of these travel times to LSOA levels would also have minimised the impact that any outliers had on the overall results of the regression models. The unavailability of data relating to other modes of transport may also have limited the accuracy of the estimated travel times, with some stores that have high bus travel times being easily accessible by metro or train services. The inclusion of these data in future analyses would undoubtedly improve the overall accuracy of the public transport travel time distributions shown in
Figure 4.
8. Conclusions
This study explored the potential for non-transport-related consumer data to provide insight into the mobility of the older population and their demand for services. The results of these analyses were promising, demonstrating how differences in activity behaviours can provide insight into the efficiency of public transport services and the ability of the transport network to meet mobility needs and demands.
Much current research and policy are focused around encouraging a shift from private transportation to public transportation for both environmental and social reasons [
47,
48]. For this to be achieved, public transport services must be able to meet the demands and mobility needs of different population groups. The significant relationship between service provision and activity space area suggests that inadequate provision of transport services can constrain activity spaces and can limit the number of retail opportunities that can be reached by individuals. For public transport services to provide a viable alternative to private transportation, it is imperative that adequate, efficient services are provided to a range of destinations. With shopping trips making up over 30% of all trips made by the older population [
27], ensuring that a range of retail areas, including small and large high streets, edge-of-town retail parks and large urban centres, can be reached via the public transport network will be vital for transport authorities that wish to encourage the use of public transport services.
There has been much discussion around the ‘death of the high street’ due to a combination of the 2008 financial crisis, a move to out-of-town shopping, an increase in e-commerce and more recently the COVID-19 pandemic [
49,
50,
51]. It has been found that those on a lower income, those living in more deprived areas and those that lack access to private transportation are more likely to shop locally than at out-of-town retail parks [
52]. Disadvantage arising from this is contingent on the retail mix in the areas in which cardholders reside. Those that have access to adequate local retail facilities are less likely to be negatively impacted by the inaccessibility of other retail opportunities. However, as discussed in
Section 2, having access to a number of retail facilities allows for greater choice in where to shop, which has been strongly linked to wellbeing [
11,
12]. The results of this study evidenced that the provision of adequate public transport services increased the average size of cardholders’ activity spaces. This impacts the number of retail opportunities that can be accessed, which in turn has potential implications for the wellbeing and inclusion of those that rely on public transport services.
Although this study presented a thorough analysis and highlighted a significant relationship between activity and public transport, the ongoing growth in the collection of these data and their increasing availability for research purposes present a scope to expand upon the analyses and insights presented in this study. Much of this future research relies on the availability of additional and complementary data, whether these are more granular transport network data or additional consumer data. The increasing collection and availability of these data is promising for future research in this area.


