Abstract
The sustainability of regional development in Europe is deeply influenced by heterogeneous globalization processes, yet the divergent long-term trajectories of these processes remain poorly quantified, hindering the design of targeted policies. This study aims to identify and characterize clusters of European countries with similar patterns of overall globalization development in order to assess implications for sustainable and cohesive growth. A novel clustering algorithm is developed that integrates Dynamic Time Warping with k-means to account for temporal misalignments and capture similarities in development dynamics rather than just static levels. Analysis based on the KOF Globalization Index for 40 countries reveals four distinct clusters: highly globalized and stable Western European economies, converging Central and Eastern European countries, microstates with niche integration models, and a peripheral group of Southeastern European nations facing significant challenges. The results demonstrate a persistent core–periphery divergence in globalization paths across Europe. This divergence presents a major obstacle to achieving territorial cohesion and equitable sustainable development outcomes. Methodologically, this study provides a robust framework for analyzing longitudinal socioeconomic processes. The main conclusion is that a one-size-fits-all EU cohesion policy is insufficient; instead, cluster-specific strategies are necessary in order to mitigate regional inequalities, enhance resilience, and ensure that the benefits of globalization contribute to the goals of sustainable development. The findings offer a quantitative basis for such targeted policy interventions.
1. Introduction
Looking around, it is hard not to notice that both we and our surroundings are significantly influenced by phenomena and processes originating from distant places and regions of the world. Moreover, this influence is intensifying and is largely beyond our control. One might argue that the world has shrunk considerably in recent decades. Information from any corner of the globe reaches us in an instant through television, radio, and the internet, while people are migrating more frequently between countries and continents and the goods we purchase come from various parts of the world. People living in different societies wear similar fashionable clothing, listen to music by the same artists, and often eat dishes originating from other parts of the world. Thus, we are dealing with the globalization of our lives in all its dimensions. It is worth remembering that all aspects of globalization are interconnected. Globalization is simply the increasing interdependence and interaction among countries, firms, and people worldwide. It is a highly significant process, which is why this article undertakes a discussion on the topic. The aim of this article is to analyze the countries of the European continent in terms of their similarities and differences in the pace and trends of globalization development. The KOF overall globalization index was selected as the measure of globalization. Based on an original algorithm, the article identifies groups of countries most similar to each other in terms of globalization development and highlights any anomalies.
Research on globalization describes it as a multidimensional process encompassing economic, social, political, and cultural dimensions. A typical analytical tool is the KOF Globalisation Index, the recent revision of which highlights the differences between its de facto and de jure components [1]. Comparative analyses indicate that Central–Eastern and Western European countries exhibit distinct globalization trajectories, with post-communist nations catching up economically but lagging behind in institutional and cultural aspects [2,3].
The literature on country similarity is dominated by clustering methods, typically (k-means [4]) and modern dynamic approaches (e.g., dynamic programming for tracking globalization trajectories [5]). These methods are often combined with trade and innovation network analyses to capture the structure of international collaboration in globalization.
Regarding social and political aspects, Rodrik’s studies [6,7] demonstrate that pressures from uneven globalization pathways may fuel populist support, particularly in countries with relatively lower global integration. Conversely, Gozgor [8] showed that globalization often correlates with rising income inequality and labor market restructuring.
In European regional studies, Barbara Jankowska and Cezary Główka [9] identified economic clusters in Central–Eastern Europe based on trade diversification and participation in global value chains, while Vedres and Nordlund [10] applied network analysis. The works of Bergh and Nilsson [11] and Martens and Zywietz [12] emphasized the need to integrate ecological and cultural dimensions into globalization analysis within sustainable development frameworks.
Furthermore, Hadaś-Dyduch [13] proposed a methodological approach proposed based on wavelet transformations and dynamic classification of socioeconomic signals to identify similarities and changes among European countries. The aforementioned studies provide a significant contribution to the development of tools for nonlinear modeling of globalization trajectories and clustering countries based on their development profiles.
In light of this literature review, there is a solid theoretical and empirical foundation for applying a combination of cluster analysis and dynamic programming to examine similarities among European countries in the context of overall globalization. This method captures both static similarities and dynamic changes over time while incorporating institutional, cultural, and economic aspects. Such an approach is innovative, well grounded in the literature, and appropriate for discussing the diversity and convergence of globalization processes in Europe.
However, while these studies provide a strong foundation for methodological and comparative analysis, a critical gap remains in explicitly linking these divergent globalization trajectories to the overarching framework of sustainable development. The sustainability of socioeconomic systems, encompassing economic resilience, social cohesion, and the reduction of regional inequalities, is intrinsically linked to the patterns and pace of global integration. Understanding whether globalization paths are converging or diverging is not merely an academic exercise; rather, it is a prerequisite for crafting effective policies that ensure long-term stability, inclusive growth, and balanced regional development within the European Union. Persistent divergence, as suggested by the literature, could undermine the EU’s cohesion and broader sustainability agenda, including the European Green Deal, which requires a unified and equitable transition. Therefore, quantifying these trajectories and their implications is vital for assessing progress towards sustainable development. This study contributes to this effort by providing a nuanced, and dynamic clustering of globalization patterns with results that are directly interpreted through the lens of sustainable development, offering a new perspective for policymakers aimed at fostering a more resilient and equitable European project.
2. Materials and Methods
This study aims to identify European countries exhibiting similar patterns of overall globalization development. For this purpose, an algorithm is developed based on the KOF Globalisation Index by utilizing nonlinear dynamic programming and the k-means clustering method. The KOF Globalisation Index “measures the economic, social and political dimensions of globalisation. Globalisation in these fields has been on the rise since the 1970s, receiving a particular boost after the end of the Cold War” [14]. The algorithm is described in detail below, with its output being clusters of countries grouped by similar globalization development trajectories during the examined period.
The proposed original algorithm employs nonlinear dynamic programming through a Dynamic Time Warping (DTW) methodology to align historical trajectories, which is combined with a time-series-adapted k-means clustering approach. The resulting clusters reflect temporal similarities in globalization levels rather than static point-in-time resemblances which proves crucial for understanding long-term patterns of convergence or divergence.
Traditional (e.g., Euclidean) distance metrics demonstrate sensitivity to temporal shifts. Two countries may exhibit similar globalization trends but with temporal lags (e.g., one implementing reforms earlier than the other). The DTW method resolves this issue through optimal time series alignment with local warping constraints.
The DTW-based clustering approach identifies characteristic globalization trajectories rather than fixed annual values, thereby capturing the dynamic structure of economic integration. The developed algorithm combines the classical k-means method with DTW distance metrics. This offers several substantive advantages, particularly for clustering time-series data of globalization indicators:
- Accounting for the temporal dimension of globalization processes
- Preserving the dynamic nature of economic integration
- Providing more nuanced comparative analyses
- Enabling detection of both structural similarities and temporal disparities
The conventional k-means algorithm relies on Euclidean distance, which presupposes strict temporal alignment of data points. For time series data, where temporal misalignments or heterogeneous rates of change (e.g., delayed responses to globalization shocks) may occur, Dynamic Time Warping (DTW) offers a robust alternative by enabling elastic alignment, thereby minimizing the distance metric even in the presence of phase differences or temporal distortions.
A critical advantage of DTW lies in its capacity to accommodate sequences of unequal lengths or irregular temporal perturbations, a prerequisite for rigorous long-term time series analysis. By deriving cluster barycenters through DTW, the resulting centroids capture a characteristic trajectory representative of the cluster, a feature that is unattainable with Euclidean distance due to its sensitivity to rigid temporal synchronization.
It bears emphasis that correlation- and Euclidean-based metrics frequently fail to account for temporal lags or adequately address nonlinear temporal dynamics. Parametric models (e.g., ARIMA), while useful for forecasting, impose stringent assumptions and are ill-suited for direct clustering applications. Conversely, deep learning approaches (e.g., variational autoencoders) demand extensive datasets and sacrifice interpretability. Thus, the DTW-based clustering framework emerges as the methodologically superior choice for the present analysis, balancing flexibility, robustness, and analytical tractability.
This superiority becomes evident when contrasting the approach with other common time series methodologies. Selection of the DTW-enhanced k-means algorithm over alternative time series clustering methodologies is driven by its unique ability to address the specific challenges inherent in analyzing globalization trajectories. Traditional parametric models such as ARIMA are primarily designed for forecasting, and impose stringent assumptions such as linearity and stationarity that are often violated by long-term socioeconomic processes such as globalization, which are characterized by structural breaks, non-stationarity, and heterogeneous responses to external shocks such as financial crises and geopolitical events. While ARIMA models can capture temporal dependencies, they are ill-suited for direct clustering applications, as they do not provide a natural similarity metric for grouping entire series based on overall shape and dynamics.
Conversely, non-parametric deep learning approaches such as Variational Autoencoders (VAEs) and Recurrent Neural Networks (RNNs) offer high flexibility in capturing complex patterns. However, they typically require very large datasets to generalize effectively and avoid overfitting, a condition that is not met by the panel of 40 countries over 53 years. More critically, these “black-box” models sacrifice interpretability, making it difficult to extract clear explainable prototypes (centroids) of globalization paths, which is a central goal of this study.
The DTW-based clustering framework elegantly bridges this methodological gap. Its core advantage lies in performing elastic alignment of time series before measuring their similarity. This is crucial for comparing countries that may follow similar development patterns but with inherent time lags, for instance, a Central European nation undergoing economic liberalization a decade after a Western European counterpart. By minimizing the warping path distance, DTW captures the similarity in the trajectory shape rather than penalizing temporal misalignment as a rigid Euclidean distance would.
Integrating DTW with k-means capitalizes on the strengths of both methods, that is, the temporal flexibility of DTW and the computational efficiency and centroid-based interpretability of k-means. The resulting centroids represent prototypical characteristic paths of development for each cluster which are intuitively understandable and analytically valuable (e.g., “a rapid catch-up trajectory” or “a stable high-level path”). This combination provides a robust, transparent, and fit-for-purpose tool to address the exploratory analysis of globalization patterns while balancing methodological sophistication with practical interpretability.
Algorithm
- Input: A given data matrix , where:
n = 40 European countries
T = 53 years (1970–2022)
= globalization index value for country i in year t
- Output:
Cluster assignments
Anomaly flags
- Step 1: Data input
The input data consist of a matrix
where:
n—number of countries
T—number of observation years (1970–2022)
Each row is a time series trajectory of the globalization index. Missing values (if any) are imputed using linear interpolation to maintain temporal continuity.
Initial condition:
where is defined.
- Step 2: Distance Calculation using DTW
For each pair of countries, we compute the :
with the following constraints:
- Monotonicity: is a monotonically increasing path
- Boundary: ’, i.e., the path starts at and ends at
- Step: ’
- Warping window: , i.e., local warping to prevent pathological alignments
DTW allows for comparison of trajectories regardless of phase shifts (e.g. delayed reforms or delayed globalization shocks).
- Step 3: Normalize DTW
This transforms all pairwise distances to the interval.
- Step 4: Optimal Cluster Number
We compute the silhouette score:
where:
is the average DTW distance of country i to its own cluster
is the minimum average distance to other clusters
We then select
This step reflects the internal cohesion vs. external separation of clusters.
- Step 5: Clustering
We assign each country to the nearest centroid (trajectory with the smallest DTW). Centroids are initialized via k-means++ using DTW distances.
Iterative process:
The centroids are updated using DTW barycenter averaging (DBA) until convergence:
Each centroid represents a prototypical globalization path for a group of countries.
- Step 6: Cluster Validation
For each cluster, we compute the following:
- Average trajectory:
- Volatility (intra-cluster variation):
- Trend estimation:
where is interpreted as the speed of globalization in the cluster. The trend coefficient is estimated from regression of on time t.
- Step 7: Cluster Assignment Criteria
Country belongs to cluster if all of the following conditions hold:
- Minimum DTW distance:
- Mean absolute deviation is moderate:
- DTW variance within cluster:
- Step 8: Anomaly Detection
For each country i in cluster j, we calculate the global anomaly score:
and point anomalies for year t:
Anomalies are flagged if or .
- Step 9: Type of Anomaly
- Global Anomalies:
- Point Anomalies:
3. Results
The aim of the conducted analysis was to identify groups of European countries with similar levels of overall globalization development during the examined period based on the KOF Overall Globalization Index. This index constitutes a comprehensive measure of economic, social, and political integration, enabling multidimensional assessment of a country’s degree of globalization.
For this analysis, a proprietary algorithm combining dynamic nonlinear programming with the k-means method was employed, allowing for the incorporation of both dynamic changes over time and the data structure in the feature space. This algorithm enabled the identification of four clusters grouping countries with similar levels of globalization development during the studied period.
The subsequent part of this chapter presents and discusses the obtained results in detail.
3.1. Cluster Analysis Results Presentation
The cluster analysis resulted in a division of 42 European countries into four distinct groups (clusters) differing in both the level and dynamics of globalization development during the examined period (Figure 1). The size and composition of each cluster are as follows:
- Cluster 0 (fifteen countries): Bulgaria, Croatia, Cyprus, Estonia, Greece, Hungary, Iceland, Latvia, Lithuania, Malta, Poland, Portugal, Slovenia, Spain, Ukraine
- Cluster 1 (five countries): Albania, Andorra, Liechtenstein, Monaco, San Marino
- Cluster 2 (fifteen countries): Austria, Belgium, Czech Republic, Denmark, Finland, France, Germany, Ireland, Italy, Luxembourg, Netherlands, Norway, Sweden, Switzerland, United Kingdom
- Cluster 3 (seven countries): Belarus, Bosnia and Herzegovina, Moldova, Montenegro, North Macedonia, Romania, Serbia
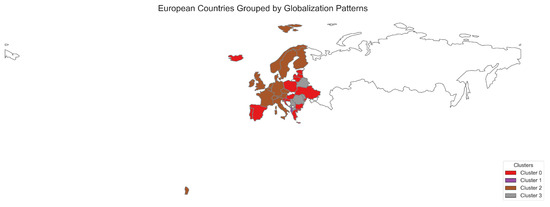
Figure 1.
A fragment of the map with clusters marked.
Cluster 0 comprises fifteen countries with a moderate level of globalization (see Figure 2). These nations exhibit diversified development across globalization components, with most demonstrating stable yet moderate growth in economic and social integration. Geographically, this cluster primarily encompasses Central and Eastern European countries along with selected nations from Southern and Northern Europe.
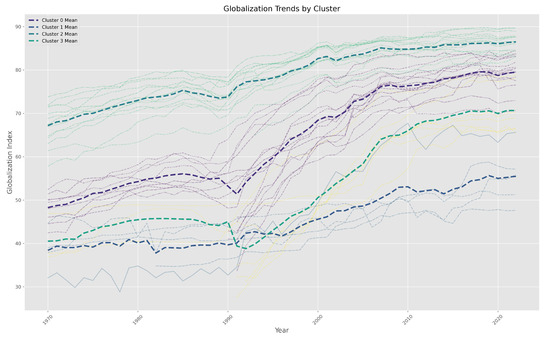
Figure 2.
Globalization trend by cluster.
Cluster 1 represents a small group of micro- and small-sized states such as Andorra and Monaco which exhibit unique characteristics in globalization development, including high capital mobility and intensive local-level economic integration (see Figure 3). The globalization index for this cluster displays the highest variability, likely attributable to the distinctive economic and political status of the countries within this cluster.
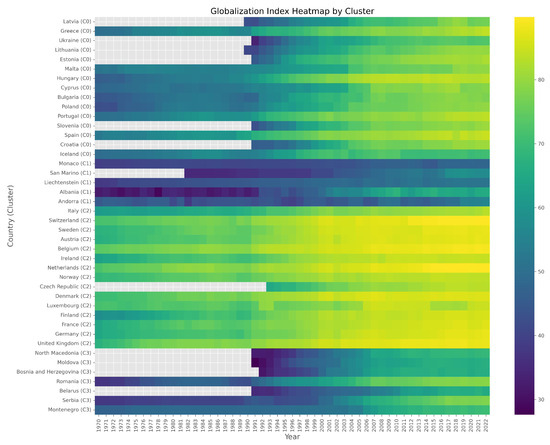
Figure 3.
Globalization index heatmap by cluster.
Cluster 2 comprises the most globalized European countries (see Figure 3). These nations exhibit the highest values in both the overall globalization index and its components, particularly in terms of economic and political integration. This group primarily consists of Western and Northern European countries that have long functioned as hubs of global exchange and international cooperation.
Cluster 3 aggregates countries with the lowest globalization levels, which often face economic and political challenges (see Figure 3). These are mainly Eastern European and Balkan nations where integration processes progress more slowly and less stably. The overall globalization indicators reveal significant disparities compared to other clusters, particularly in political and social dimensions.
The obtained clusters demonstrate varying levels of globalization across Europe, indicating clear groupings of countries with similar degrees of global integration. A detailed analysis in this context is presented in the following subsections. It should be noted that numerous anomalies in the development of overall globalization indicators across Europe could be observed during the examined period (see Figure 4).
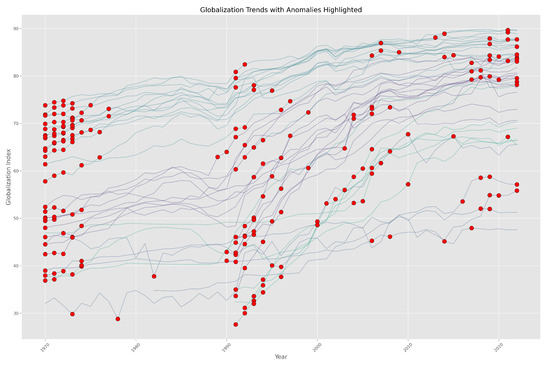
Figure 4.
Anomalies. Red circles indicate anomalies.
3.2. Cluster Coherence and Stability
The optimal number of clusters was determined to be 4, as confirmed by cluster quality metrics. The average Silhouette score of 0.560 indicates moderate cluster cohesion and separation. This value suggests that elements assigned to each group are relatively well-matched, though some cluster boundaries may exhibit partial overlap.
Additionally, the Davies–Bouldin index value of 0.564 demonstrates a relatively good cluster partitioning, indicating relatively low intra-cluster diversity while maintaining clear inter-cluster distinctiveness.
To evaluate algorithm stability, we conducted sensitivity tests for parameter variations and input data variance. The results confirmed that the classification remains robust against minor disturbances, with cluster composition maintaining consistency across a wide range of model parameters.
In conclusion, the implemented approach provides a reliable and stable grouping of European countries by similar globalization development levels, establishing a solid foundation for further analysis and interpretation. The methodology demonstrates both statistical validity and practical applicability for comparative globalization studies.
3.3. Cluster Characteristics
The identified clusters exhibit distinct patterns in both globalization levels and development dynamics during the analyzed period. Below, a synthetic characterization is presented for each cluster.
3.3.1. Cluster 0 Profile
Cluster 0 comprises fifteen countries with moderate globalization levels and showing geographic, historical, and economic diversity (see Figure 5). This group includes:
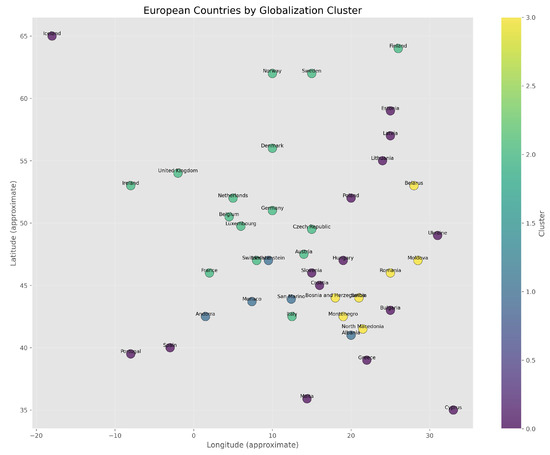
Figure 5.
Map of globalization index by cluster.
- Central–Eastern European nations (Poland, Hungary, Latvia, Lithuania, Estonia, Ukraine)
- Southern European countries (Greece, Cyprus, Malta, Portugal, Spain)
- Island and Northern states (Iceland, Croatia, Slovenia, Bulgaria)
This cluster demonstrates balanced development across all globalization dimensions (economic, social, political), though with slower integration dynamics compared to more advanced economies. Member states share transitional characteristics from their post-communist legacy while showing convergence with Western European standards.
As mentioned earlier, the countries in Cluster 0 are characterized by a moderate level of globalization, resulting from their specific geographic, historical, and socioeconomic positions. This cluster mainly includes Central and Eastern European countries, Southern European nations, and island states with varying degrees of development and integration into global processes. Many of these countries, such as Poland, Hungary, and the Baltic states, have undergone economic and political transformations in recent decades, which influences their dynamic yet still moderate pace of integration into the global economy. Most countries in this cluster are members of the European Union, which fosters their political and economic integration, although their levels of infrastructure development, human capital, and political stability vary. Southern European countries such as Greece, Spain, and Portugal show strong dependence on tourism and the service sector, shaping their globalization characteristics; on the other hand, island states such as Malta, Cyprus, and Iceland exhibit different integration patterns due to their geographic isolation, and are often constrained by limited market access or logistical challenges. Political, economic, and social differences, as are observed in Ukraine or Bulgaria, affect the pace and scope of globalization processes, which progress more slowly in these countries and are more susceptible to external factors. Despite these differences, the countries in Cluster 0 share a moderate level of engagement in global economic and social exchange networks, placing them at a medium level of globalization in Europe. As such, this cluster represents countries in a phase of development and adaptation to global trends, combining elements of EU integration with unique challenges stemming from their regional and historical specificities.
Statistical analysis of the countries grouped in Cluster 0 reveals significant patterns in their globalization development trajectories. The average globalization index for the cluster ranges between 62.35 and 72.11 points, with median values oscillating between 58.53 and 81.18 points, indicating moderate within-group variation. It is worth noting that the Baltic states (Estonia—72.11, Latvia—64.96, Lithuania—67.29) and Southern European countries (Spain—70.32, Portugal—68.57) exhibit higher central values compared to other cluster members. Distribution analysis using skewness coefficients (−1.27 to 0.37) and kurtosis (−1.68 to 0.61) reveals diverse asymmetry patterns. For Estonia (−1.27) and Ukraine (−1.19), strong left-skewness is observed, suggesting a concentration of higher index values in recent years. In contrast, positive skewness values for Cyprus (0.37) and Malta (0.36) indicate right-tailed distribution deviations.
Coefficients of Variation (CV) ranging between 13.30–20.88% confirm moderate stability of globalization processes in this country group. Estonia shows the lowest variability (14.26%) while Poland (19.87%) and Hungary (20.88%) exhibit the highest, potentially reflecting differing socioeconomic transformation dynamics in these nations.
Quartile analysis reveals that 25% of cluster countries score below 50.90–68.30 points (Q1), while 75% exceed 70.62–80.10 points (Q3). Hungary presents a particularly interesting case, with the median (71.95) significantly surpassing Q1 (53.48), suggesting rapid improvement in indicators over recent decades (Figure 6).
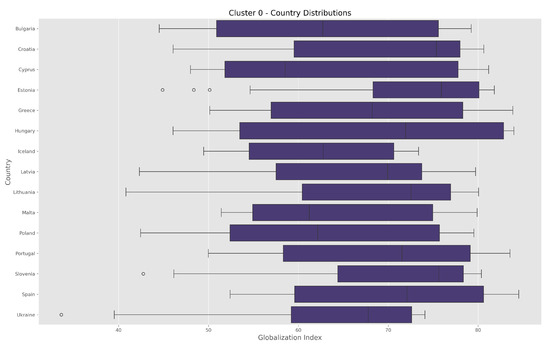
Figure 6.
Box plot for Cluster 0.
Regarding change dynamics, decile analysis demonstrates that countries such as Estonia and Slovenia had already reached levels close to the current cluster median during the 1990s (D3: 70.16 and 67.87 respectively), while Ukraine and Bulgaria required substantially more time to achieve comparable levels.
In summary, Cluster 0 represents a group of countries with moderate yet stable globalization growth, showing distinct differences in transformation pace between members. Intra-cluster heterogeneity is particularly evident in distribution parameters, mirroring the complexity of transitional and integration processes in this European region.
3.3.2. Cluster 1 Profile
Cluster 1 includes five countries: Albania, Andorra, Liechtenstein, Monaco, and San Marino. These countries are characterized by a specific globalization profile resulting from their unique geographic, demographic, and economic conditions. Most of them are microstates with small territory and population whose economies are strongly oriented towards services, particularly the financial sector, tourism, and international trade. Despite their limited economic scale, some of these countries, such as Liechtenstein and Monaco, play an important role in global financial networks, which increases their level of integration with global processes. Albania, as a country with a larger population and different economic structure, shows a relatively lower level of globalization, which is related to its transitional nature and specific socioeconomic development. A common feature of these countries is high political stability and well-developed infrastructure; however, their integration in classical dimensions of globalization such as trade exchange and mobility of people is limited compared to larger and more developed European countries. Thus, this cluster represents a group of countries with a niche and specific model of participation in global processes, the characteristics of which reflect their particular historical, political, and economic conditions.
Cluster 1 represents a group of countries with a relatively low but diverse level of globalization. Intra-group heterogeneity is particularly visible in distribution parameters and variability measures. This reflects the complexity of globalization processes in this group of countries, where small states (Andorra, Monaco, Liechtenstein) are characterized by stability while larger ones (Albania, San Marino) show more pronounced dynamics of change. Iteresting is the case of Albania, where the difference between Q1 (33.33) and Q3 (63.31) is almost 30 points, indicating a particularly large spread of indicator values (see Figure 7).
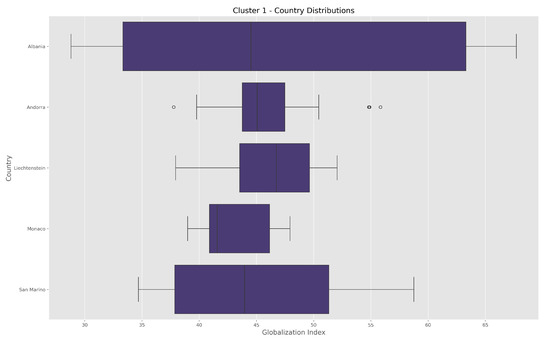
Figure 7.
Box plot for Cluster 1.
The countries belonging to Cluster 1 share several common characteristics:
- Countries in Cluster 1 have significantly lower overall globalization indices compared to countries in Clusters 0 and 2.
- The average overall globalization index for Cluster 1 ranges between 45–47 points, while for Cluster 2 (developed Western European countries) it reaches 75–82 points.
- Even the highest maximum values in Cluster 1 (e.g., Albania: 67.72) remain below the average values of Cluster 2.
- Four out of five countries in Cluster 1 are microstates (Andorra, Liechtenstein, Monaco, and San Marino); Albania is the only larger country in Group 1, but its economy is also relatively small and poorly diversified.
- None of the countries classified in Cluster 1 are EU members, although Monaco and San Marino maintain close ties with the Union through customs unions with France and Italy, and Liechtenstein participates in the EEA.
Thus, Cluster 1 represents a group of European “outsiders” in the context of globalization, either by choice (microstates) or necessity (Albania).
3.3.3. Cluster 2 Profile
Cluster 2 comprises fifteen countries from Western and Northern Europe, including Austria, Belgium, the Czech Republic, Denmark, Finland, France, Germany, Ireland, Italy, Luxembourg, the Netherlands, Norway, Sweden, Switzerland, and the United Kingdom (see Figure 5).
The countries belonging to Cluster 2 are characterized by a high level of globalization within Europe, as confirmed by the statistics calculated for these states:
- High mean and median values (Figure 8): The average globalization index ranges from approximately 77 to 83 while the median falls between 77 and 84, indicating a stable and advanced degree of economic, social, and political integration Cluster 2 brings together fifteen countries from Western and Northern Europe, including Austria, Belgium, the Czech Republic, Denmark, Finland, France, Germany, Ireland, Italy, Luxembourg, the Netherlands, Norway, Sweden, Switzerland, and the United Kingdom (see Figure 5).
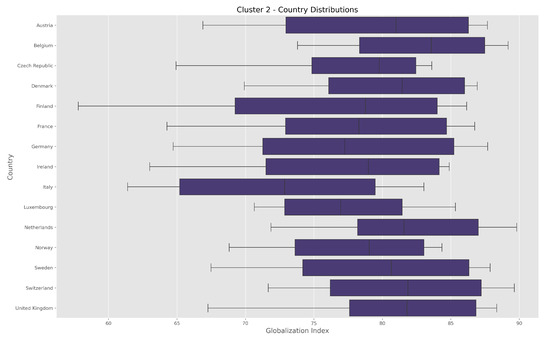 Figure 8. Box plot for cluster 2.
 - Low variability: Low coefficients of variation (CV≈6–12%) and narrow interquartile ranges (Q1–Q3) indicate the homogeneity of the group.
- Left-skewed distribution: Negative skewness (e.g., Belgium: −0.23) suggests a concentration of values above the mean, typical of highly developed countries.
- Stability: High kurtosis (close to −1 to 0) reflects a moderate clustering of data around the mean, without extreme values.
- Minimal fluctuations: The minimum values (e.g., 64.7 in Germany) remain relatively high, confirming the sustained development of globalization.
As previously noted, the countries comprising Cluster 2 are characterized by a high level of globalization (see Figure 9) stemming from their advanced economic development, strong trade linkages, and extensive political and social integration on the international stage. The membership of most of these countries in the European Union along with their well-developed transport, communication, and technological infrastructure facilitates the free movement of capital, goods, services, and people. The economies of these countries are marked by significant sectoral diversification, with strong presence of advanced technologies, industry, and high value-added services. Moreover, the Cluster 2 countries play a key role in global production and financial networks, often serving as hubs of innovation, scientific research, and development. Political stability, a high level of human capital, and well-developed education and healthcare systems further reinforce their position on the global stage. As a result, these countries represent the most advanced model of globalization in Europe, distinguished by intensive integration across multiple dimensions and strong resilience to global economic fluctuations.
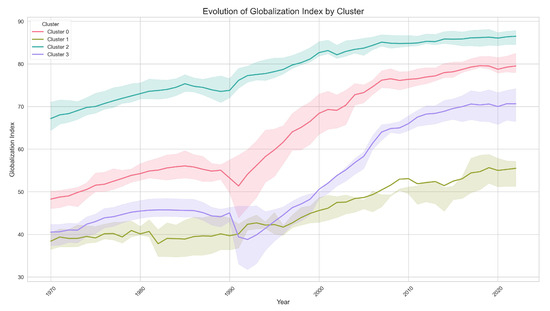
Figure 9.
Evolution of globalization index by cluster.
Cluster 2 stands out from the other clusters. In comparing Cluster 0, Cluster 1, and Cluster 2, the following aspects highlight the differences between Cluster 2 and the other two clusters:
- Statistical homogeneity: The coefficient of variation (CV) in Cluster 2 ranges from 6–12%, whereas in Cluster 0 it reaches 13–20% and in Cluster 1 as high as 30%, indicating significantly greater internal cohesion among highly globalized economies (Figure 10).
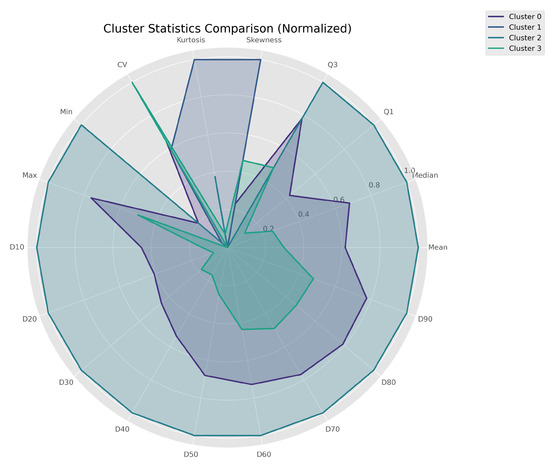 Figure 10. Cluster statistics comparison.
 - Dominance of left-skewness: The distribution of values in Cluster 2 (e.g., Belgium: skewness 0.23) shows a concentration of countries above the mean, whereas Cluster 0 exhibits distributions close to symmetric (Poland: 0.01) and Cluster 1 right-skewness (Albania: +0.19), suggesting the presence of countries with a delayed globalization process.
- Higher temporal stability: The narrow interquartile range (IQR) in Cluster 2 (e.g., Denmark: 76.1–86.0) contrasts with the wider range in Cluster 0 (Poland: 52.4–75.7) and the widest in Cluster 1 (San Marino: 37.9–51.3), confirming lower susceptibility to fluctuations in advanced economies.
- Extreme minimum values: Even the lowest observations in Cluster 2 (Italy: 72.4) exceed the median of Cluster 0 (Poland: 62.2) and the entirety of Cluster 1, underscoring the development gap between the groups.
- Kurtosis close to 1: Negative kurtosis in Cluster 2 (e.g., Austria: 1.45) indicates a flat distribution with mild tails, whereas lower values in Cluster 0 (Bulgaria: 1.64) and Cluster 1 (Monaco: 1.25) suggest a greater likelihood of outliers associated with instability.
In summary, Cluster 2 is distinguished by deep economic integration built upon advanced institutional structures, manifested in full membership in organizations such as the EU and EFTA as well as strong embedding within global value chains. By contrast, the countries in Cluster 0 are characterized by a more fragmented model of integration, often relying on offshoring and external sources of growth, typical of Central European economies. Meanwhile, Cluster 1 primarily consists of microstates that have developed specialized, niche models of economic development, for instance Monaco, which is dominated by the financial services sector, or Liechtenstein, which has high industrial specialization.
In terms of social capital and innovation, Custer 2 demonstrates a remarkable synergy between various development factors. A high level of Foreign Direct Investment (FDI) per capita (amounting to USD 14,642 in the case of Ireland, compared with USD 1230 in Poland) is paired with an advanced knowledge economy index (averaging 7.8 points) and substantial expenditures on research and development (R&D), exceeding 2.5% of GDP. In contrast, the countries of Cluster 3 allocate less than 1.5% of their GDP to R&D.
The institutional architecture of Cluster 2 rests on a solid foundation of effective collaboration between the academic sector, business, and public administration, commonly referred to as the triple helix model. The stability of regulatory institutions is reflected in a high regulatory quality index of 1.78, whereas in Cluster 0 this value drops to 0.92. A long-term and coherent pro-globalization policy is further evidenced by a trade openness index exceeding 150%.
Geopolitical conditions further strengthen Cluster 2’s position, which benefits from the so-called core effect stemming from its geographical proximity to major markets and decision-making centers. By contrast, countries in Cluster 0 often operate in a semi-peripheral position, making them dependent on external decision-making centers, while Cluster 1 constitutes a mosaic of economic niches, ranging from tourism in Andorra to philatelic issues in San Marino. This multidimensional analysis demonstrates that Cluster 2’s advantage is systemic in nature, arising from the complex interaction of institutional, economic, and geopolitical factors.
3.3.4. Cluster 3 Profile
Cluster 3 comprises seven countries from Eastern Europe and the Balkans: Belarus, Bosnia and Herzegovina, Moldova, Montenegro, North Macedonia, Romania, and Serbia (see Figure 5). These countries are characterized by a moderate level of globalization shaped by historical, political, and economic factors. Most of these countries are undergoing or have undergone economic transition following the collapse of communist systems, which determines their specific path of integration into global structures.
Despite progress in modernizing their economies and increasing openness to foreign trade and investment, challenges such as limited infrastructure, political instability, and administrative or regulatory barriers contribute to a relatively lower level of integration compared with Western European countries. Nevertheless, Cluster 3 countries are intensifying their regional and international linkages while striving to increase their participation in global value chains, as evidenced by growing exports and inflows of foreign direct investment.
The socioeconomic diversity and development disparities among these countries result in varying speeds and scopes of globalization; however, the cluster’s common feature remains the prospect of integration and gradual convergence towards EU and global standards.
It can be argued that the countries grouped in Cluster 3 share a characteristic peripheral model of integration into the global economy that is shaped by common institutional and geopolitical challenges. Statistical data analysis reveals several key similarities:
- Low level of globalization advancement: The average KOF index for these countries ranges from 52.7 to 58.9, representing a significantly lower level compared with other clusters. In particular, Belarus (52.7) and Serbia (52.8) occupy the lowest positions, while Romania (58.9) and Bosnia and Herzegovina (56.3) record slightly higher values.
- Weak public institutions: The average governance quality index (World Bank Governance Indicators) for these countries is only 0.48, indicating significant challenges in public administration efficiency and regulatory quality. By comparison, in Cluster 2 this value reaches 1.78.
- Dependence on external decision-making centers: These countries are characterized by relatively low inflows of foreign direct investment (3.2% of GDP on average, compared to 5.8% in Cluster 2) and limited capacity to generate innovation (R&D expenditures average 0.8% of GDP).
- Peripherality in global value chains: The share of high-tech products in these countries’ exports is significantly lower (7% on average) than in Cluster 2 (23%), reflecting their limited ability to compete in advanced sectors of the economy.
- Internal diversity: Despite common features, there are significant differences within the cluster. Romania and Montenegro exhibit higher globalization indices (58.9 and 55.1, respectively), while Belarus and Serbia lag behind (52.7 and 52.8). These differences stem mainly from divergent political and economic trajectories after the fall of communism.
Cluster 3, comprising Belarus, Bosnia and Herzegovina, Moldova, Montenegro, North Macedonia, Romania, and Serbia, stands out among other European globalization clusters due to its distinctive model of peripheral integration. While Cluster 2 countries (e.g., Germany, Switzerland) actively shape globalization processes and Cluster 0 nations gradually integrate with them, Cluster 3 remains largely a passive participant in these dynamics, as evidenced by significantly lower KOF indices (52.7–58.9, compared to 77–83 in Cluster 2 and 62–70 in Cluster 0).
The defining feature of Cluster 3 is its chronic institutional weakness, reflected in a low governance quality index (0.48) and limited capacity to absorb the benefits of globalization. This manifests in minimal R&D expenditures (0.8% of GDP), a small share of high-tech exports (7%), and relatively low FDI inflows (3.2% of GDP). Unlike the relatively homogeneous Clusters 2 and 0, Cluster 3 exhibits exceptional internal heterogeneity, encompassing both EU-aspiring countries and states that are stalled in transition or under authoritarian regimes.
The uniqueness of Cluster 3 also stems from its geopolitical position as a buffer zone between the EU and Russia, leading to political instability and fragmented integration models. Compared to the more stable economies of Cluster 2, these countries show greater vulnerability to shocks and crises, as indicated by their higher volatility indices (CV 20–28%) and distinctive globalization value distribution (Figure 11).
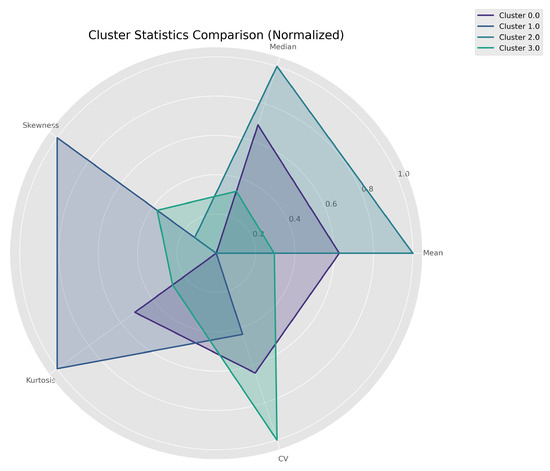
Figure 11.
Cluster statistics comparison.
In summary, Cluster 3 differs from other groups not only quantitatively (lower globalization indicators) but also qualitatively through a specific combination of institutional weaknesses, geopolitical constraints, and internal diversity. This peripherality is systemic and structural, requiring different development strategies than those applied in more advanced European economies.
4. Conclusions
This study successfully employed the Dynamic Time Warping (DTW) algorithm and k-means clustering method to identify four distinct clusters of European countries with similar globalization development trajectories. The obtained results confirm significant disparities in economic, social, and political integration processes across Europe, revealing a clear core–periphery structure.
The analysis delineates a group of core globalization countries (Cluster 2) comprising highly developed Western and Northern European economies. These nations exhibit the highest globalization indices (77–83 points), a stable endogenous development model, strong positions in global value chains, and advanced institutional frameworks supporting innovation. In contrast, a group of peripheral countries is identified (Cluster 3), primarily in Eastern Europe and the Balkans. These countries exhibit the lowest scores (52.7–58.9 points) and follow a peripheral integration model characterized by institutional weaknesses, limited innovative capacity, and significant internal disparities, hindering their ability to fully benefit from globalization.
Between these poles, the research also reveals two additional groups. The first consists of moderately globalized countries (Cluster 0), primarily in Central and Southern Europe, which show intermediate integration levels (62–70 points). Their development follows an adaptive model that combines domestic transformation with partial reliance on foreign direct investment, demonstrating visible though not yet fully-realized convergence with more advanced economies. The second group encompasses microstates (Cluster 1), which achieve relatively low but stable globalization levels (43–47 points) by developing through specialized niche economic models, albeit constrained by their small scale (Figure 12).
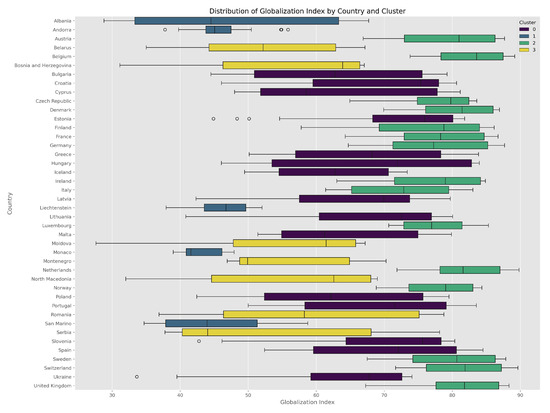
Figure 12.
Box plot.
Statistical analysis confirms the significance of these inter-cluster differences (significance tests, ANOVA), validating both the clustering approach and the usefulness of the algorithm for the multidimensional analysis of globalization development. The findings underscore that globalization is not a uniform process; rather, its outcomes are fundamentally shaped by local institutional, economic, and geopolitical conditions. The persistent divergence in European globalization paths highlighted in this study has profound implications for understanding economic convergence as well as for designing cluster-specific targeted regional development policies, particularly for transition economies in Central and Eastern Europe.
5. Limitations and Future Research
While this study provides a robust framework for analyzing globalization trajectories, several limitations should be acknowledged, which also present avenues for future research.
The primary limitation stems from its reliance on a single composite index, the KOF Globalisation Index. Although comprehensive, any index is a simplification of complex realities. Future studies could enhance the profiling of clusters by incorporating additional granular indicators, particularly those capturing institutional quality (e.g., rule of law, control of corruption) or specific economic dimensions (e.g., GVC participation indexes). This would be especially valuable for explaining the internal heterogeneity observed within clusters, particularly in the peripheral group (Cluster 3).
While representing a key contribution, the methodological approach also has its constraints. DTW-based clustering is computationally intensive for large datasets ( complexity), which may limit its application to very large panels of countries or extremely long time series without high-performance computing resources. Furthermore, the algorithm requires a predefined warping window constraint; while preventing pathological alignments, this introduces a subjective parameter that may influence the results.
Other than these limitations, the proposed method’s utility extends far beyond the analysis of the KOF index. The DTW-enhanced clustering framework utilized in this research is a versatile tool for comparative longitudinal analysis in the social sciences. Future research could fruitfully apply this method for several purposes:
- Analyzing patterns of economic development using GDP per capita, productivity, or innovation indexes over time.
- Clustering countries based on environmental performance or climate policy adoption trajectories.
- Identifying groups with similar demographic transitions (e.g., aging population, fertility rates) or public health outcomes.
- Studying the convergence of institutional quality or governance indicators across regions.
Finally, a compelling longitudinal research agenda would be to track countries’ positional evolution over time to examine whether and how states transition between clusters as they develop. Such dynamic analysis could yield valuable insights into the effectiveness of integration policies and the catalysts for moving from peripheral to convergent development paths.
Funding
This research was co-financed by the Polish Ministry of Science under the “Regional Initiative of Excellence” programme.
Institutional Review Board Statement
Not applicable.
Informed Consent Statement
Not applicable.
Data Availability Statement
All calculations on time series contained in the article are original.
Conflicts of Interest
The author declares no conflicts of interest; the funders had no role in the design of the study, in the collection, analysis, or interpretation of data, in the writing of the manuscript, or in the decision to publish the results.
References
- Gygli, S.; Haeg, F.; Potrafke, N.; Sturm, J.-E. The KOF Globalisation Index—Revisited. Rev. Int. Organ. 2019, 14, 543–574. [Google Scholar] [CrossRef]
- Potrafke, N. The evidence on globalization. World Econ. 2015, 38, 509–552. [Google Scholar] [CrossRef]
- Dreher, A. Does globalization affect growth? Evidence from a new index of globalization. Appl. Econ. 2006, 38, 1091–1110. [Google Scholar] [CrossRef]
- Likas, A.; Vlassis, N.; Verbeek, J.J. The global k-means clustering algorithm. Pattern Recognit. 2003, 36, 451–461. [Google Scholar] [CrossRef]
- Sun, W.W.; Li, L. Dynamic tensor clustering. J. Am. Stat. Assoc. 2019, 114, 1894–1907. [Google Scholar] [CrossRef]
- Rodrik, D. Populism and the economics of globalization. J. Int. Bus. Policy 2018, 1, 12–33. [Google Scholar] [CrossRef]
- Rodrik, D. Why Does Globalization Fuel Populism? Economics, Culture, and the Rise of Right-Wing Populism; Harvard University Press: Cambridge, MA, USA, 2021. [Google Scholar]
- Gozgor, G.; Ranjan, P. Globalisation, inequality and redistribution: Theory and evidence. World Econ. 2017, 40, 2704–2751. [Google Scholar] [CrossRef]
- Jankowska, B.; Główka, C. Clusters on the road to internationalization—Evidence from a CEE economy. Compet. Rev. 2016, 26, 395–414. [Google Scholar] [CrossRef]
- Vedres, B.; Nordlund, C. Disembedded Openness: Inequalities in European Economic Integration at the Sectoral Level. Stud. Comp. Int. Dev. 2018, 53, 169–195. [Google Scholar] [CrossRef]
- Bergh, A.; Nilsson, T. Is globalization reducing absolute poverty? World Dev. 2014, 59, 35–45. [Google Scholar] [CrossRef]
- Martens, P.; Raza, M. Is Globalisation Sustainable? Sustainability 2010, 2, 280–293. [Google Scholar] [CrossRef]
- Hadas-Dyduch, M. Modelowanie procesów finansowych, gospodarczych i społecznych z zastosowaniem analizy wielorozdzielczej [Modeling Financial, Economic, and Social Processes Using Multivariate Analysis]. Pr. Nauk. Univ. Ekon. Katowic. 2019, 244, 23–38. [Google Scholar]
- KOF Swiss Economic Institute. KOF Globalisation Index. Technical Report; ETH Zurich: Zurich, Switzerland, 2022. [Google Scholar]
Disclaimer/Publisher’s Note: The statements, opinions and data contained in all publications are solely those of the individual author(s) and contributor(s) and not of MDPI and/or the editor(s). MDPI and/or the editor(s) disclaim responsibility for any injury to people or property resulting from any ideas, methods, instructions or products referred to in the content. |
© 2025 by the author. Licensee MDPI, Basel, Switzerland. This article is an open access article distributed under the terms and conditions of the Creative Commons Attribution (CC BY) license (https://creativecommons.org/licenses/by/4.0/).