A Life Cycle Assessment of Snack Bar Prototypes Created with Ingredients Compatible with the Mediterranean Diet
Abstract
1. Introduction
2. Materials and Methods
2.1. Goal and Scope Definition
2.2. Production of Bar Prototypes
2.3. Life Cycle Inventory Analysis
Transport of Raw Materials
2.4. Life Cycle Impact Categories
3. Results
4. Discussion
5. Conclusions
Author Contributions
Funding
Institutional Review Board Statement
Informed Consent Statement
Data Availability Statement
Conflicts of Interest
References
- Farzana, T.; Mohajan, S.; Saha, T.; Hossain, M.N.; Haque, M.Z. Formulation and Nutritional Evaluation of a Healthy Vegetable Soup Powder Supplemented with Soy Flour, Mushroom, and Moringa Leaf. Food Sci. Nutr. 2017, 5, 911–920. [Google Scholar] [CrossRef] [PubMed]
- Vignesh, A.; Amal, T.C.; Sarvalingam, A.; Vasanth, K. A Review on the Influence of Nutraceuticals and Functional Foods on Health. Food Chem. Adv. 2024, 5, 100749. [Google Scholar] [CrossRef]
- Ingram, J. Perspective: Look beyond Production. Nature 2017, 544, S17. [Google Scholar] [CrossRef] [PubMed]
- Ciurzyńska, A.; Cieśluk, P.; Barwińska, M.; Marczak, W.; Ordyniak, A.; Lenart, A.; Janowicz, M. Eating Habits and Sustainable Food Production in the Development of Innovative “Healthy” Snacks. Sustainability 2019, 11, 2800. [Google Scholar] [CrossRef]
- Almoraie, N.M.; Saqaan, R.; Alharthi, R.; Alamoudi, A.; Badh, L.; Shatwan, I.M. Snacking Patterns throughout the Life Span: Potential Implications on Health. Nutr. Res. 2021, 91, 81–94. [Google Scholar] [CrossRef]
- Bes-Rastrollo, M.; Sanchez-Villegas, A.; Basterra-Gortari, F.J.; Nunez-Cordoba, J.M.; Toledo, E.; Serrano-Martinez, M. Prospective Study of Self-Reported Usual Snacking and Weight Gain in a Mediterranean Cohort: The SUN Project. Clin. Nutr. 2010, 29, 323–330. [Google Scholar] [CrossRef]
- Astrup, A.; Bovy, M.W.L.; Nackenhorst, K.; Popova, A.E. Food for Thought or Thought for Food?—A Stakeholder Dialogue around the Role of the Snacking Industry in Addressing the Obesity Epidemic. Obes. Rev. 2006, 7, 303–312. [Google Scholar] [CrossRef]
- Durazzo, A.; Lucarini, M.; Federici, G.; Marcotrigiano, V.; Bino, E.; Lovat, A.; Padoin, A.; Salerno, G.; D’incà, P.; Napoli, C.; et al. Healthy Snack Project: Improving Healthy Choices through Multidisciplinary Food Educ. Actions. Nutrients 2024, 16, 255. [Google Scholar] [CrossRef]
- Vermeulen, S.J.; Campbell, B.M.; Ingram, J.S.I. Climate Change and Food Systems. Annu. Rev. Environ. Resour. 2012, 37, 195–222. [Google Scholar] [CrossRef]
- Poore, J.; Nemecek, T. Reducing Food’s Environmental Impacts through Producers and Consumers. Science 2018, 360, 987–992. [Google Scholar] [CrossRef]
- Michel, M.; Eldridge, A.L.; Hartmann, C.; Klassen, P.; Ingram, J.; Meijer, G.W. Benefits and Challenges of Food Processing in the Context of Food Systems, Value Chains and Sustainable Development Goals. Trends Food Sci. Technol. 2024, 153, 104703. [Google Scholar] [CrossRef]
- Environmental Impacts of Food Production—Our World in Data. Available online: https://ourworldindata.org/environmental-impacts-of-food (accessed on 23 March 2025).
- Balasundram, S.K.; Shamshiri, R.R.; Sridhara, S.; Rizan, N. The Role of Digital Agriculture in Mitigating Climate Change and Ensuring Food Security: An Overview. Sustainability 2023, 15, 5325. [Google Scholar] [CrossRef]
- Crippa, M.; Solazzo, E.; Guizzardi, D.; Monforti-Ferrario, F.; Tubiello, F.N.; Leip, A. Food Systems Are Responsible for a Third of Global Anthropogenic GHG Emissions. Nat. Food 2021, 2, 198–209. [Google Scholar] [CrossRef]
- García-Herrero, L.; Gibin, D.; Damiani, M.; Sanyé-Mengual, E.; Sala, S. What Is the Water Footprint of EU Food Consumption? A Comparison of Water Footprint Assessment Methods. J. Clean. Prod. 2023, 415, 137807. [Google Scholar] [CrossRef]
- Sanyé, M.E.; Sala, S. Consumption Footprint and Domestic Footprint: Assessing the Environmental Impacts of EU Consumption and Production; Publications Office of the European Union: Luxembourg, 2023. [Google Scholar] [CrossRef]
- Mustafa, M.A.; Mabhaudhi, T.; Avvari, M.V.; Massawe, F. Transition toward Sustainable Food Systems: A Holistic Pathway toward Sustainable Development. Food Secur. Nutr. 2021, 33–56. [Google Scholar] [CrossRef]
- De Marchi, E.; Scappaticci, G.; Banterle, A.; Alamprese, C. What Is the Role of Environmental Sustainability Knowledge in Food Choices? A Case Study on Egg Consumers in Italy. J. Clean. Prod. 2024, 441, 141038. [Google Scholar] [CrossRef]
- Manzoor, S.; Fayaz, U.; Dar, A.H.; Dash, K.K.; Shams, R.; Bashir, I.; Pandey, V.K.; Abdi, G. Sustainable Development Goals through Reducing Food Loss and Food Waste: A Comprehensive Review. Future Foods 2024, 9, 100362. [Google Scholar] [CrossRef]
- Grosso, M.; Falasconi, L. Addressing Food Wastage in the Framework of the UN Sustainable Development Goals. Waste Manag. Res. 2018, 36, 97–98. [Google Scholar] [CrossRef]
- Tang, M.; Miri, T.; Soltani, F.; Onyeaka, H.; Al-Sharify, Z.T. Life Cycle Assessment of Plant-Based vs. Beef Burgers: A Case Study in the UK. Sustainability 2024, 16, 4417. [Google Scholar] [CrossRef]
- Fernández-Ríos, A.; Laso, J.; Aldaco, R.; Margallo, M. Life Cycle Assessment and Energy Return of Investment of Nutritionally-Enhanced Snacks Supplemented with Spanish Quinoa. Sci. Total Environ. 2024, 954, 176542. [Google Scholar] [CrossRef]
- Mazac, R.; Järviö, N.; Tuomisto, H.L. Environmental and Nutritional Life Cycle Assessment of Novel Foods in Meals as Transformative Food for the Future. Sci. Total Environ. 2023, 876, 162796. [Google Scholar] [CrossRef] [PubMed]
- Rai, P.; Mehrotra, S.; Sharma, S.K. Potential of Sensing Interventions in the Life Cycle Assessment of Fruits and Fruit Juices. Trends Food Sci. Technol. 2024, 151, 104614. [Google Scholar] [CrossRef]
- Kheiralipour, K.; Rafiee, S.; Karimi, M.; Nadimi, M.; Paliwal, J. The Environmental Impacts of Commercial Poultry Production Systems Using Life Cycle Assessment: A Review. Worlds Poult. Sci. J. 2024, 80, 33–54. [Google Scholar] [CrossRef]
- Finnveden, G.; Hauschild, M.Z.; Ekvall, T.; Guinée, J.; Heijungs, R.; Hellweg, S.; Koehler, A.; Pennington, D.; Suh, S. Recent Developments in Life Cycle Assessment. J. Environ. Manag. 2009, 91, 1–21. [Google Scholar] [CrossRef]
- Heller, M.C.; Keoleian, G.A.; Willett, W.C. Toward a Life Cycle-Based, Diet-Level Framework for Food Environmental Impact and Nutritional Quality Assessment: A Critical Review. Environ. Sci. Technol. 2013, 47, 12632–12647. [Google Scholar] [CrossRef]
- Sala, S.; Amadei, A.M.; Beylot, A.; Ardente, F. The Evolution of Life Cycle Assessment in European Policies over Three Decades. Int. J. Life Cycle Assess. 2021, 26, 2295–2314. [Google Scholar] [CrossRef]
- Glavič, P.; Krajnc, D.; Cristina Rada, E. Evolution and Current Challenges of Sustainable Consumption and Production. Sustainability 2021, 13, 9379. [Google Scholar] [CrossRef]
- Peano, C.; Girgenti, V.; Sciascia, S.; Barone, E.; Sottile, F. Dietary Patterns at the Individual Level through a Nutritional and Environmental Approach: The Case Study of a School Canteen. Foods 2022, 11, 1008. [Google Scholar] [CrossRef]
- Trolle, E.; Nordman, M.; Lassen, A.D.; Colley, T.A.; Mogensen, L. Carbon Footprint Reduction by Transitioning to a Diet Consistent with the Danish Climate-Friendly Dietary Guidelines: A Comparison of Different Carbon Footprint Databases. Foods 2022, 11, 1119. [Google Scholar] [CrossRef]
- Veliz, K.; Chico-Santamarta, L.; Ramirez, A.D. The Environmental Profile of Ecuadorian Export Banana: A Life Cycle Assessment. Foods 2022, 11, 3288. [Google Scholar] [CrossRef]
- Abad-González, J.; Nadi, F.; Pérez-Neira, D. Energy-Water-Food Security Nexus in Mung Bean Production in Iran: An LCA Approach. Ecol. Indic. 2024, 158, 111442. [Google Scholar] [CrossRef]
- Berry, E.M.; Dernini, S.; Burlingame, B.; Meybeck, A.; Conforti, P. Food Security and Sustainability: Can One Exist without the Other? Public Health Nutr. 2015, 18, 2293–2302. [Google Scholar] [CrossRef] [PubMed]
- Burlingame, B.; Dernini, S. Sustainable Diets: The Mediterranean Diet as an Example. Public Health Nutr. 2011, 14, 2285–2287. [Google Scholar] [CrossRef] [PubMed]
- Germani, A.; Vitiello, V.; Giusti, A.M.; Pinto, A.; Donini, L.M.; Del Balzo, V. Environmental and Economic Sustainability of the Mediterranean Diet. Int. J. Food Sci. Nutr. 2014, 65, 1008–1012. [Google Scholar] [CrossRef] [PubMed]
- Bôto, J.M.; Rocha, A.; Miguéis, V.; Meireles, M.; Neto, B. Sustainability Dimensions of the Mediterranean Diet: A Systematic Review of the Indicators Used and Its Results. Adv. Nutr. 2022, 13, 2015–2038. [Google Scholar] [CrossRef]
- Castaldi, S.; Dembska, K.; Antonelli, M.; Petersson, T.; Piccolo, M.G.; Valentini, R. The Positive Climate Impact of the Mediterranean Diet and Current Divergence of Mediterranean Countries towards Less Climate Sustainable Food Consumption Patterns. Sci. Rep. 2022, 12, 8847. [Google Scholar] [CrossRef]
- Aboussaleh, Y.; El Bilali, H.; Bottalico, F.; Cardone, G.; Ottomano Palmisano, G.; Capone, R. Mediterranean Food and Environmental Impacts. In The Mediterranean Diet: An Evidence-Based Approach; Academic Press: Cambridge, MA, USA, 2020; pp. 103–110. [Google Scholar] [CrossRef]
- Tepper, S.; Kissinger, M.; Avital, K.; Shahar, D.R. The Environmental Footprint Associated with the Mediterranean Diet, EAT-Lancet Diet, and the Sustainable Healthy Diet Index: A Population-Based Study. Front. Nutr. 2022, 9, 870883. [Google Scholar] [CrossRef]
- Halpern, B.S.; Frazier, M.; Verstaen, J.; Rayner, P.E.; Clawson, G.; Blanchard, J.L.; Cottrell, R.S.; Froehlich, H.E.; Gephart, J.A.; Jacobsen, N.S.; et al. The Environmental Footprint of Global Food Production. Nat. Sustain. 2022, 5, 1027–1039. [Google Scholar] [CrossRef]
- Smol, M.; Marcinek, P.; Duda, J. Circular Business Models (CBMs) in Environmental Management—Analysis of Definitions, Typologies and Methods of Creation in Organizations. Sustainability 2024, 16, 1209. [Google Scholar] [CrossRef]
- Serra-Majem, L.; Tomaino, L.; Dernini, S.; Berry, E.M.; Lairon, D.; de la Cruz, J.N.; Bach-Faig, A.; Donini, L.M.; Medina, F.X.; Belahsen, R.; et al. Updating the Mediterranean Diet Pyramid towards Sustainability: Focus on Environmental Concerns. Int. J. Environ. Res. Public Health 2020, 17, 8758. [Google Scholar] [CrossRef]
- Khatri, P.; Kumar, P.; Shakya, K.S.; Kirlas, M.C.; Tiwari, K.K. Understanding the Intertwined Nature of Rising Multiple Risks in Modern Agriculture and Food System. Environ. Dev. Sustain. 2024, 26, 24107–24150. [Google Scholar] [CrossRef]
- Bandekar, P.A.; Putman, B.; Thoma, G.; Matlock, M. Cradle-to-Grave Life Cycle Assessment of Production and Consumption of Pulses in the United States. J. Environ. Manag. 2022, 302, 114062. [Google Scholar] [CrossRef]
- Saxe, H.; Okkels, S.L.; Jensen, J.D. How to Obtain Forty Percent Less Environmental Impact by Healthy, Protein-Optimized Snacks for Older Adults. Int. J. Environ. Res. Public Health 2017, 14, 1514. [Google Scholar] [CrossRef] [PubMed]
- ISO 14040; Environmental Management—Life Cycle Assessment—Principles and Framework. International Organization for Standardization: Geneva, Switzerland, 2006.
- ISO 14044; Environmental Management—Life Cycle Assessment—Requirements and Guidelines. International Organization for Standardization: Geneva, Switzerland, 2006.
- Liu, R.H. Dietary Bioactive Compounds and Their Health Implications. J. Food Sci. 2013, 78, A18–A25. [Google Scholar] [CrossRef] [PubMed]
- Anumudu, C.K.; Onyeaka, H.; Ekwueme, C.T.; Hart, A.; Isaac-Bamgboye, F.; Miri, T. Advances in the Application of Infrared in Food Processing for Improved Food Quality and Microbial Inactivation. Foods 2024, 13, 4001. [Google Scholar] [CrossRef] [PubMed]
- Gürsu, H. Reusable Smart Lids for Improving Food Safety at Household Level with Programmable UV-C Technology. Sustainability 2024, 16, 5370. [Google Scholar] [CrossRef]
- Nainggolan, E.A.; Banout, J.; Urbanova, K. Recent Trends in the Pre-Drying, Drying, and Post-Drying Processes for Cassava Tuber: A Review. Foods 2024, 13, 1778. [Google Scholar] [CrossRef]
- Tang, J.; Xiao, X.; Han, M.; Shan, R.; Gu, D.; Hu, T.; Li, G.; Rao, P.; Zhang, N.; Lu, J. China’s Sustainable Energy Transition Path to Low-Carbon Renewable Infrastructure Manufacturing under Green Trade Barriers. Sustainability 2024, 16, 3387. [Google Scholar] [CrossRef]
- Jamal, T.; Chen, G.; Zheng, L.; Duan, H.; Muddassir, M.; Jamal, R.; Khan, N.H. Innovative Food Packaging Techniques for Space Exploration: Ensuring Safety and Sustainability. Food Eng. Rev. 2025, 1–24. [Google Scholar] [CrossRef]
- Waste Statistics, TÜİK. Available online: https://data.tuik.gov.tr/bulten/index?p=atik-istatistikleri-2022-49570 (accessed on 23 September 2024).
- Andreasi Bassi, S.; Biganzoli, F.; Ferrara, N.; Amadei, A.; Valente, A.; Sala, S.; Ardente, F. Updated Characterisation and Normalisation Factors for the Environmental Footprint 3.1 Method; Publications Office of the European Union: Luxembourg, 2023; p. JRC130796. [Google Scholar] [CrossRef]
- Carlsen, M.H.; Bjøntegaard, M.M.; van Oort, B.; Jafarzadeh, S.; Mehta, S.; Wright, E.C.; Andersen, L.F. Environmental Impact of Norwegian Food and Beverages: Compilation of a Life Cycle Assessment Food Database. Food Nutr. Res. 2025, 69, 10645. [Google Scholar] [CrossRef]
- Foster, C.; Green, K.; Bleda, M.; Dewick, P.; Evans, B.; Flynn, A.; Mylan, J. Environmental Impacts of Food Production and Consumption Final Report to the Department for Environment Food and Rural Affairs; Defra: London, UK, 2006. [Google Scholar]
- Nemecek, T.; Jungbluth, N.; i Canals, L.M.; Schenck, R. Environmental Impacts of Food Consumption and Nutrition: Where Are We and What Is Next? Int. J. Life Cycle Assess. 2016, 21, 607–620. [Google Scholar] [CrossRef]
- Luksta, I.; Pakere, I.; Vamža, I.; Liberova, V.; Blumberga, D. Comparative Analysis of Agricultural Emissions Across European Countries. Environ. Clim. Technol. 2024, 28, 738–748. [Google Scholar] [CrossRef]
- Woodruff, T.J. Health Effects of Fossil Fuel–Derived Endocrine Disruptors. N. Engl. J. Med. 2024, 390, 922–933. [Google Scholar] [CrossRef] [PubMed]
- Machin Ferrero, L.M.; Araujo, P.Z.; Nishihara Hun, A.L.; Valdeón, D.H.; Mele, F.D. Water Footprint Assessment of Lemon and Its Derivatives in Argentina: A Case Study in the Province of Tucumán. Int. J. Life Cycle Assess. 2021, 26, 1505–1519. [Google Scholar] [CrossRef]
- Jungbluth, N.; Ulrich, M.; Muir, K.; Meili, C.; Solin, S. Analysis of Food and Environmental Impacts as a Scientific Basis for Swiss Dietary Recommendations; ESU-Services GmbH: Schaffhausen, Switzerland, 2022. [Google Scholar]
- Tuydes-Yaman, H.; Dalkic-Melek, G.; Chakarova, K.; Ozcelik, A.S. Barriers and Opportunities (B&O) for Developing Low Carbon Transportation (LCT) Policies in Turkey. J. Transp. Geogr. 2024, 118, 103903. [Google Scholar] [CrossRef]
- Fulton, J.; Norton, M.; Shilling, F. Water-Indexed Benefits and Impacts of California Almonds. Ecol. Indic. 2019, 96, 711–717. [Google Scholar] [CrossRef]
- Vinci, G.; Maddaloni, L.; Prencipe, S.A.; Ruggeri, M.; Di Loreto, M.V. A Comparison of the Mediterranean Diet and Current Food Patterns in Italy: A Life Cycle Thinking Approach for a Sustainable Consumption. Int. J. Environ. Res. Public Health 2022, 19, 12274. [Google Scholar] [CrossRef]
- Naja, F.; Itani, L.; Hamade, R.; Chamieh, M.C.; Hwalla, N. Mediterranean Diet and Its Environmental Footprints Amid Nutrition Transition: The Case of Lebanon. Sustainability 2019, 11, 6690. [Google Scholar] [CrossRef]
- Álvarez-Álvarez, L.; Rubín-García, M.; Vitelli-Storelli, F.; García, S.; Bouzas, C.; Martínez-González, M.Á.; Corella, D.; Salas-Salvadó, J.; Malcampo, M.; Martínez, J.A.; et al. Effect of a Nutritional Intervention Based on an Energy-Reduced Mediterranean Diet on Environmental Impact. Sci. Total Environ. 2024, 928, 172610. [Google Scholar] [CrossRef]
- Pairotti, M.B.; Cerutti, A.K.; Martini, F.; Vesce, E.; Padovan, D.; Beltramo, R. Energy Consumption and GHG Emission of the Mediterranean Diet: A Systemic Assessment Using a Hybrid LCA-IO Method. J. Clean. Prod. 2015, 103, 507–516. [Google Scholar] [CrossRef]
- Belgacem, W.; Mattas, K.; Arampatzis, G.; Baourakis, G. Changing Dietary Behavior for Better Biodiversity Preservation: A Preliminary Study. Nutrients 2021, 13, 2076. [Google Scholar] [CrossRef] [PubMed]
- Arfelli, F.; Ciacci, L.; Cespi, D.; Vassura; Passarini, F. The “SQUIID Claim”: A Novel LCA-Based Indicator for Food Dishes. J. Clean. Prod. 2024, 434, 140241. [Google Scholar] [CrossRef]
- Webb, J.; Williams, A.G.; Hope, E.; Evans, D.; Moorhouse, E. Do Foods Imported into the UK Have a Greater Environmental Impact than the Same Foods Produced within the UK? Int. J. Life Cycle Assess. 2013, 18, 1325–1343. [Google Scholar] [CrossRef]
- Aleksandrowicz, L.; Green, R.; Joy, E.J.M.; Smith, P.; Haines, A. The Impacts of Dietary Change on Greenhouse Gas Emissions, Land Use, Water Use, and Health: A Systematic Review. PLoS ONE 2016, 11, e0165797. [Google Scholar] [CrossRef]
- Tucci, M.; Martini, D.; Del Bo’, C.; Marino, M.; Battezzati, A.; Bertoli, S.; Porrini, M.; Riso, P. An Italian-Mediterranean Dietary Pattern Developed Based on the EAT-Lancet Reference Diet (EAT-IT): A Nutritional Evaluation. Foods 2021, 10, 558. [Google Scholar] [CrossRef]
- Tilman, D.; Clark, M. Global Diets Link Environmental Sustainability and Human Health. Nature 2014, 515, 518–522. [Google Scholar] [CrossRef]
- McClements, D.J.; Grossmann, L. A Brief Review of the Science behind the Design of Healthy and Sustainable Plant-Based Foods. NPJ Sci. Food 2021, 5, 17. [Google Scholar] [CrossRef]
- Ahmed, S.; Byker Shanks, C. Supporting Sustainable Development Goals Through Sustainable Diets; Springer: Berlin/Heidelberg, Germany, 2019; pp. 1–13. [Google Scholar] [CrossRef]
- Raman, R.; Lathabai, H.H.; Nedungadi, P. Sustainable Development Goal 12 and Its Synergies with Other SDGs: Identification of Key Research Contributions and Policy Insights. Discov. Sustain. 2024, 5, 150. [Google Scholar] [CrossRef]
- Jacob-John, J.; D’souza, C.; Marjoribanks, T.; Singaraju, S. Synergistic Interactions of SDGs in Food Supply Chains: A Review of Responsible Consumption and Production. Sustainability 2021, 13, 8809. [Google Scholar] [CrossRef]
- Castellano, R.; De Bernardo, G.; Punzo, G. Sustainable Well-Being and Sustainable Consumption and Production: An Efficiency Analysis of Sustainable Development Goal 12. Sustainability 2024, 16, 7535. [Google Scholar] [CrossRef]
- Ingrassia, M.; Altamore, L.; Columba, P.; Raffermati, S.; Lo Grasso, G.; Bacarella, S.; Chironi, S. Mediterranean Diet, Sustainability, and Tourism—A Study of the Market’s Demand and Knowledge. Foods 2023, 12, 2463. [Google Scholar] [CrossRef]
- Godos, J.; Guglielmetti, M.; Ferraris, C.; Frias-Toral, E.; Domínguez Azpíroz, I.; Lipari, V.; Di Mauro, A.; Furnari, F.; Castellano, S.; Galvano, F.; et al. Mediterranean Diet and Quality of Life in Adults: A Systematic Review. Nutrients 2025, 17, 577. [Google Scholar] [CrossRef]
- Barber, T.M.; Kabisch, S.; Pfeiffer, A.F.H.; Weickert, M.O. The Effects of the Mediterranean Diet on Health and Gut Microbiota. Nutrients 2023, 15, 2150. [Google Scholar] [CrossRef] [PubMed]
- Çakmakçı, R.; Salık, M.A.; Çakmakçı, S. Assessment and Principles of Environmentally Sustainable Food and Agriculture Systems. Agriculture 2023, 13, 1073. [Google Scholar] [CrossRef]
- Boakes, E.; De Voogd, J.K.; Wauters, G.; Van Caneghem, J. The Influence of Energy Output and Substitution on the Environmental Impact of Waste-to-Energy Operation: Quantification by Means of a Case Study. Clean. Technol. Environ. Policy 2023, 25, 253–267. [Google Scholar] [CrossRef]

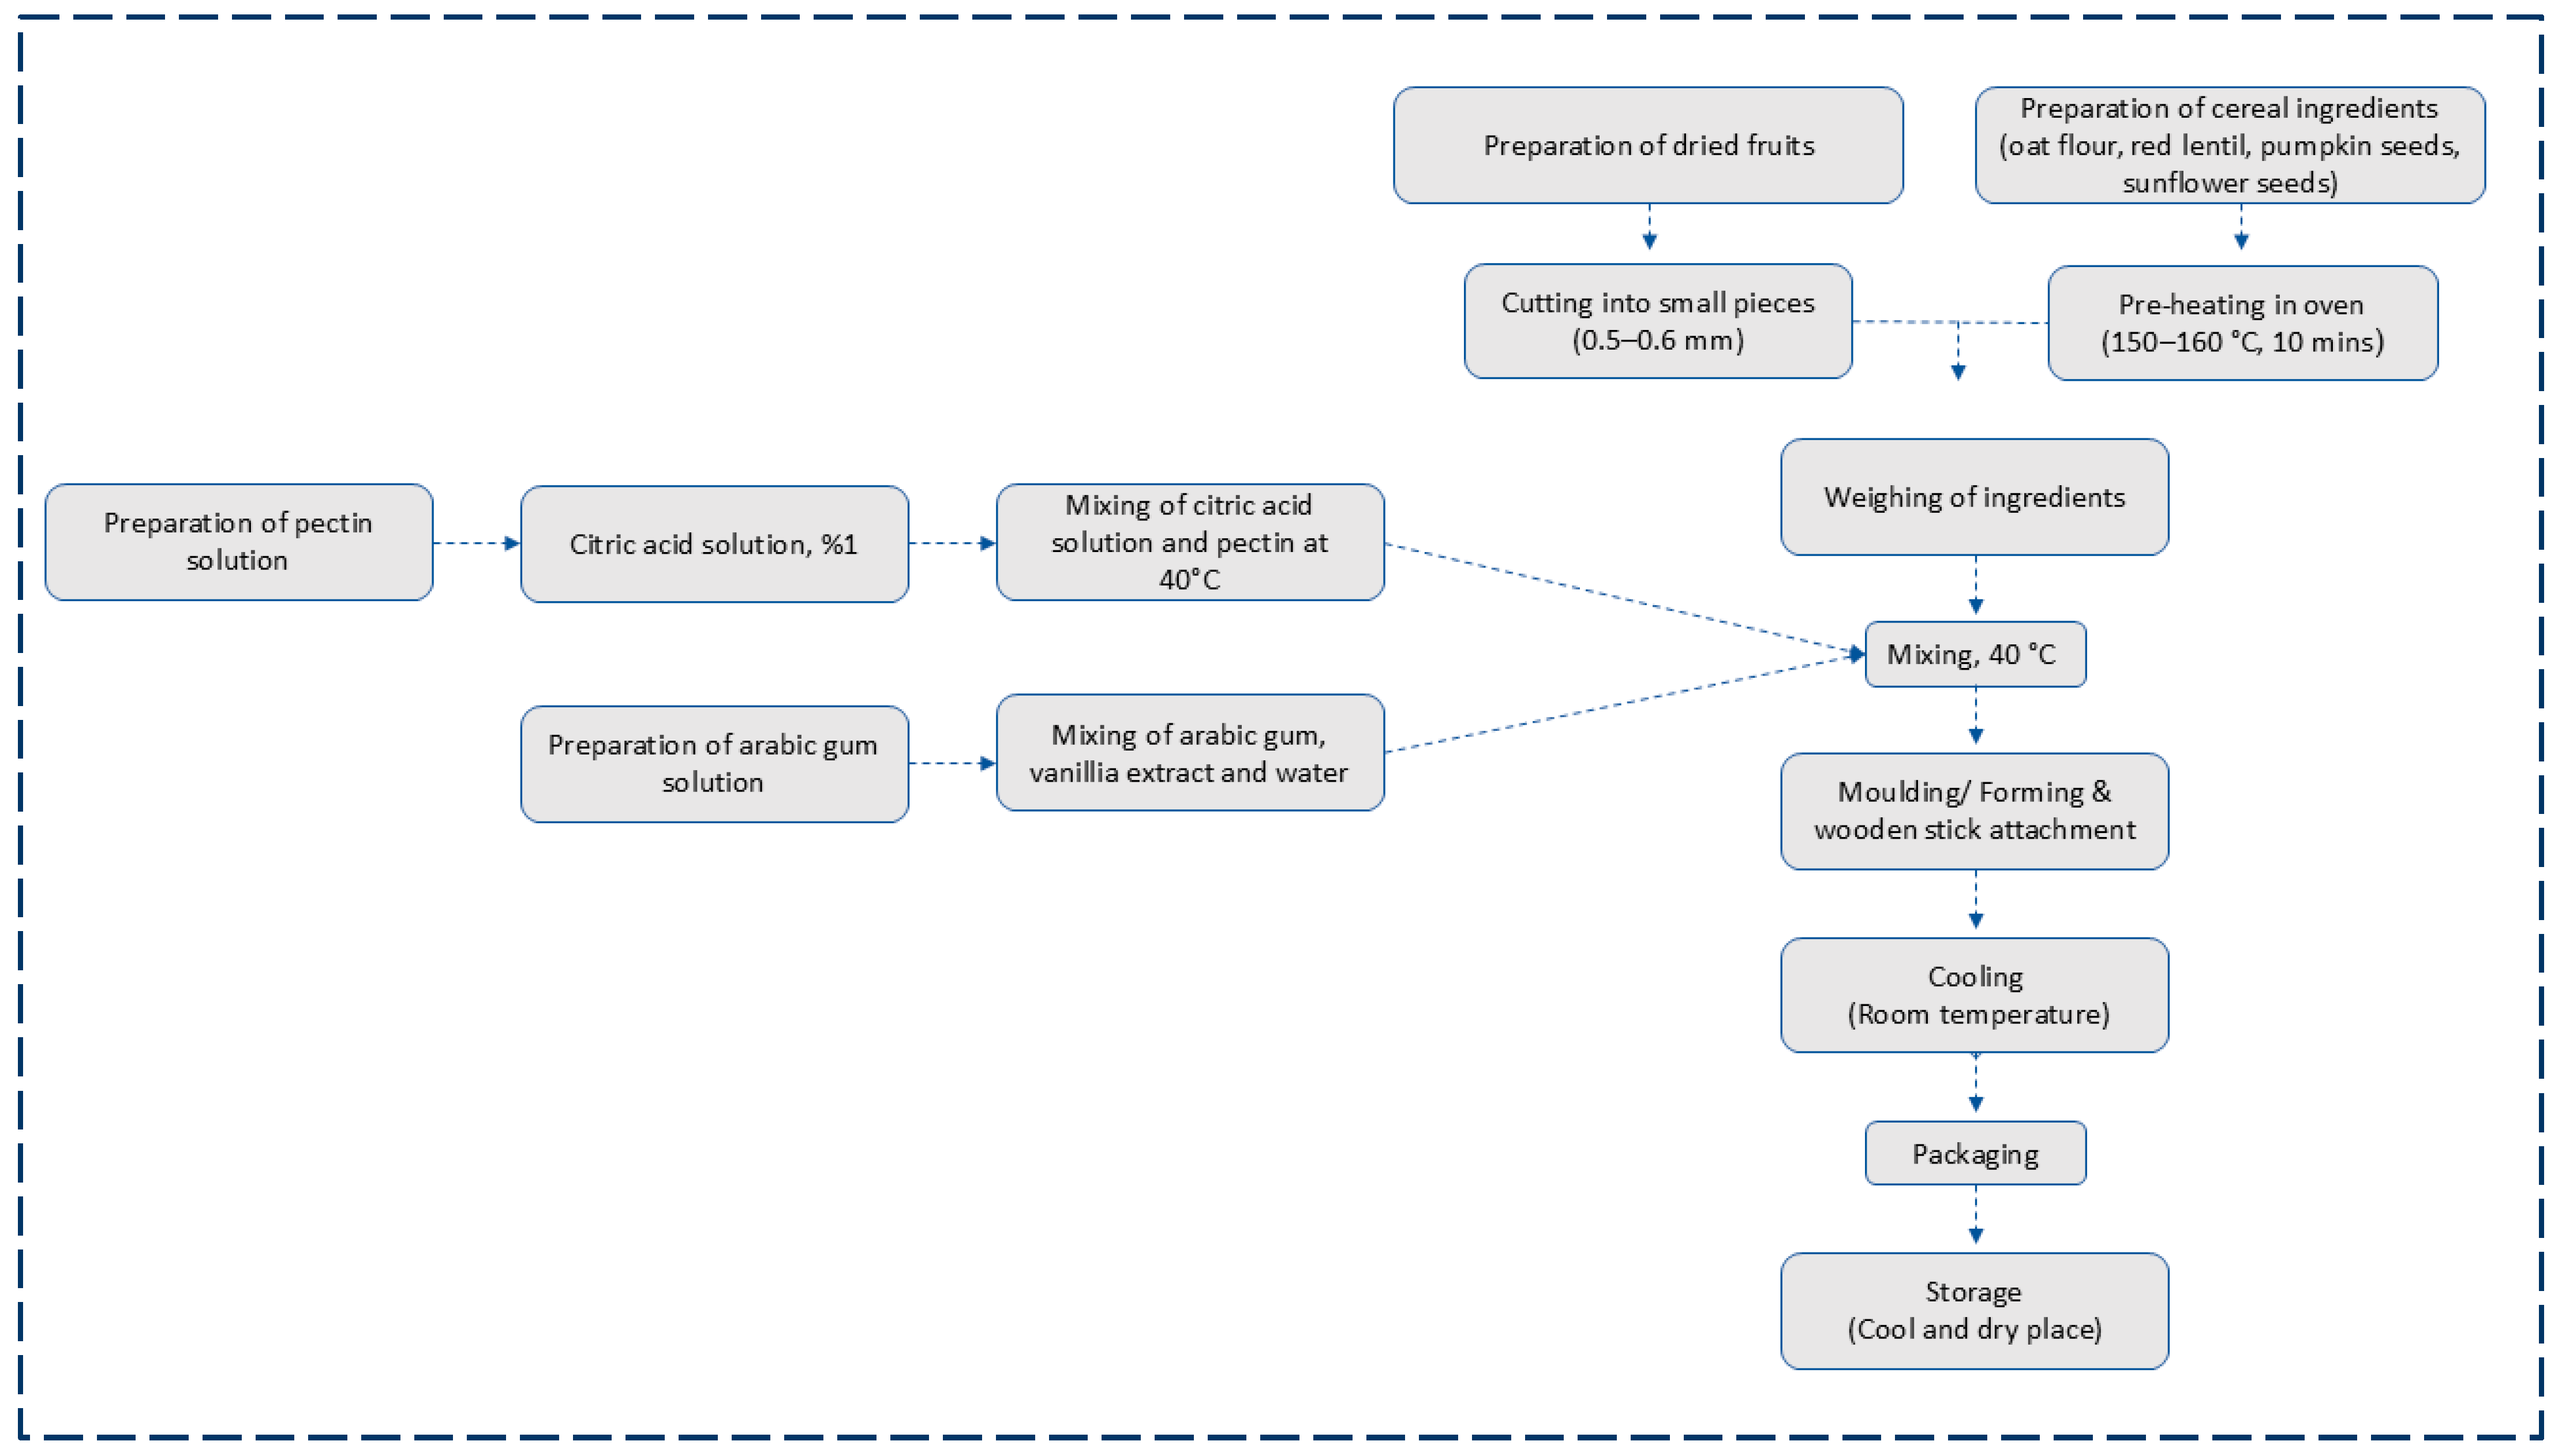
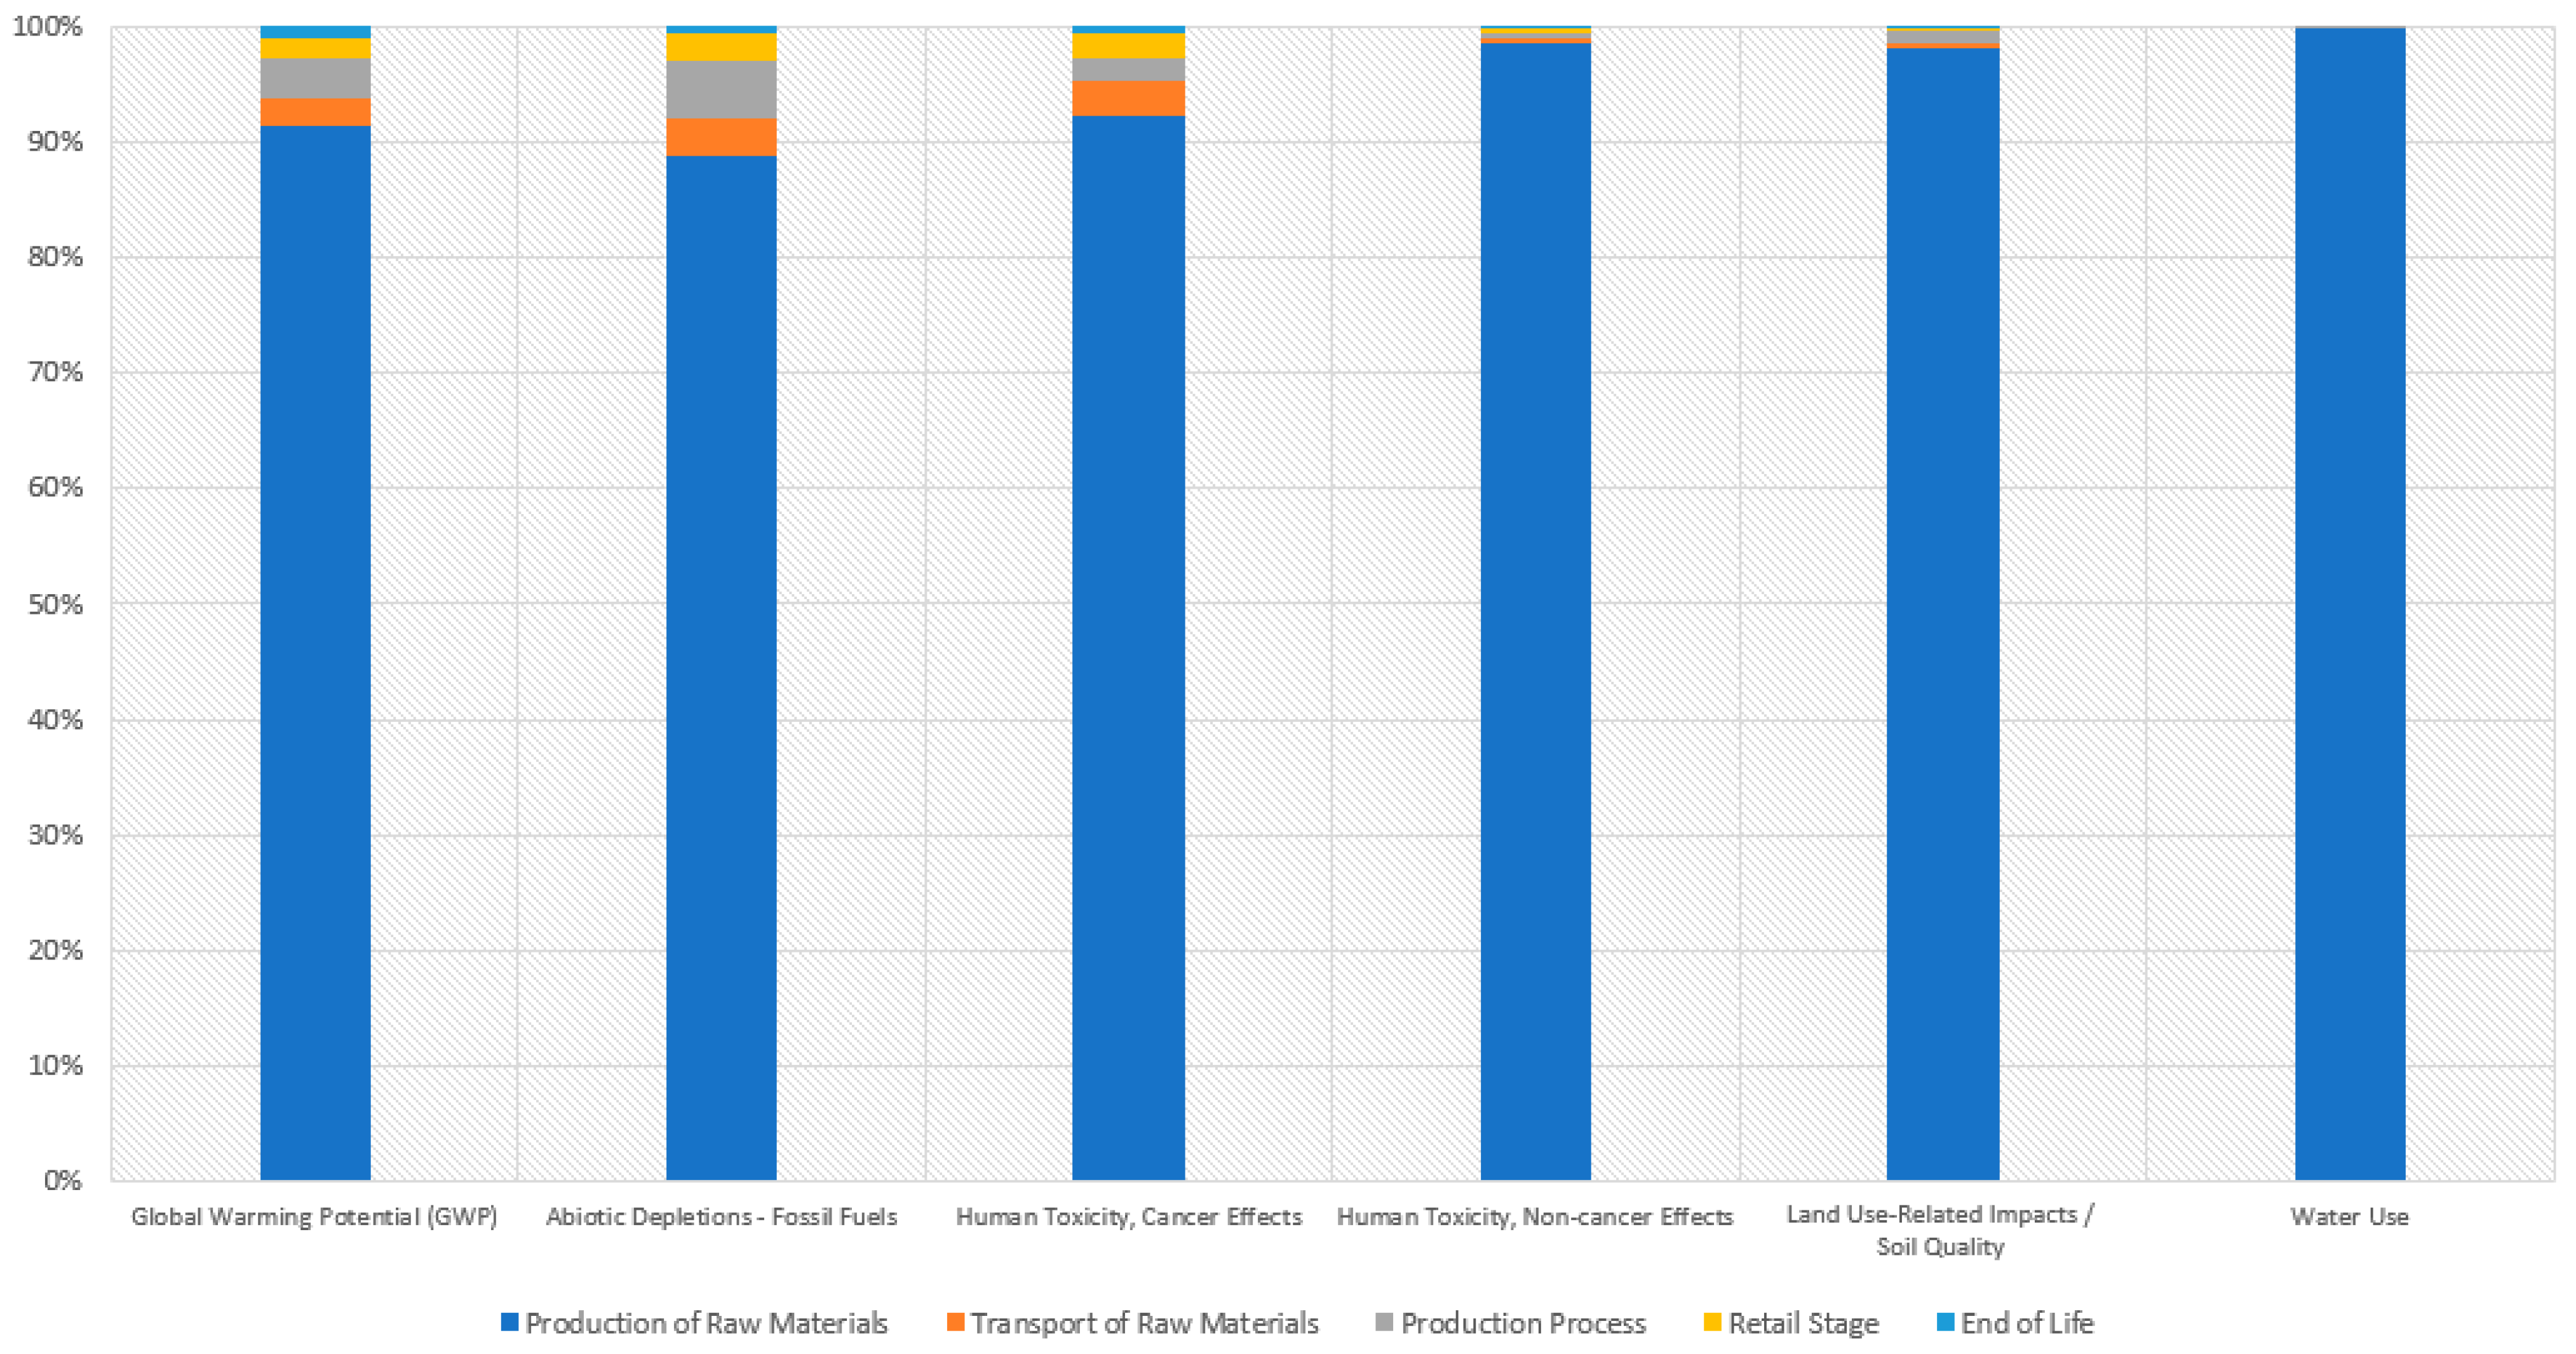
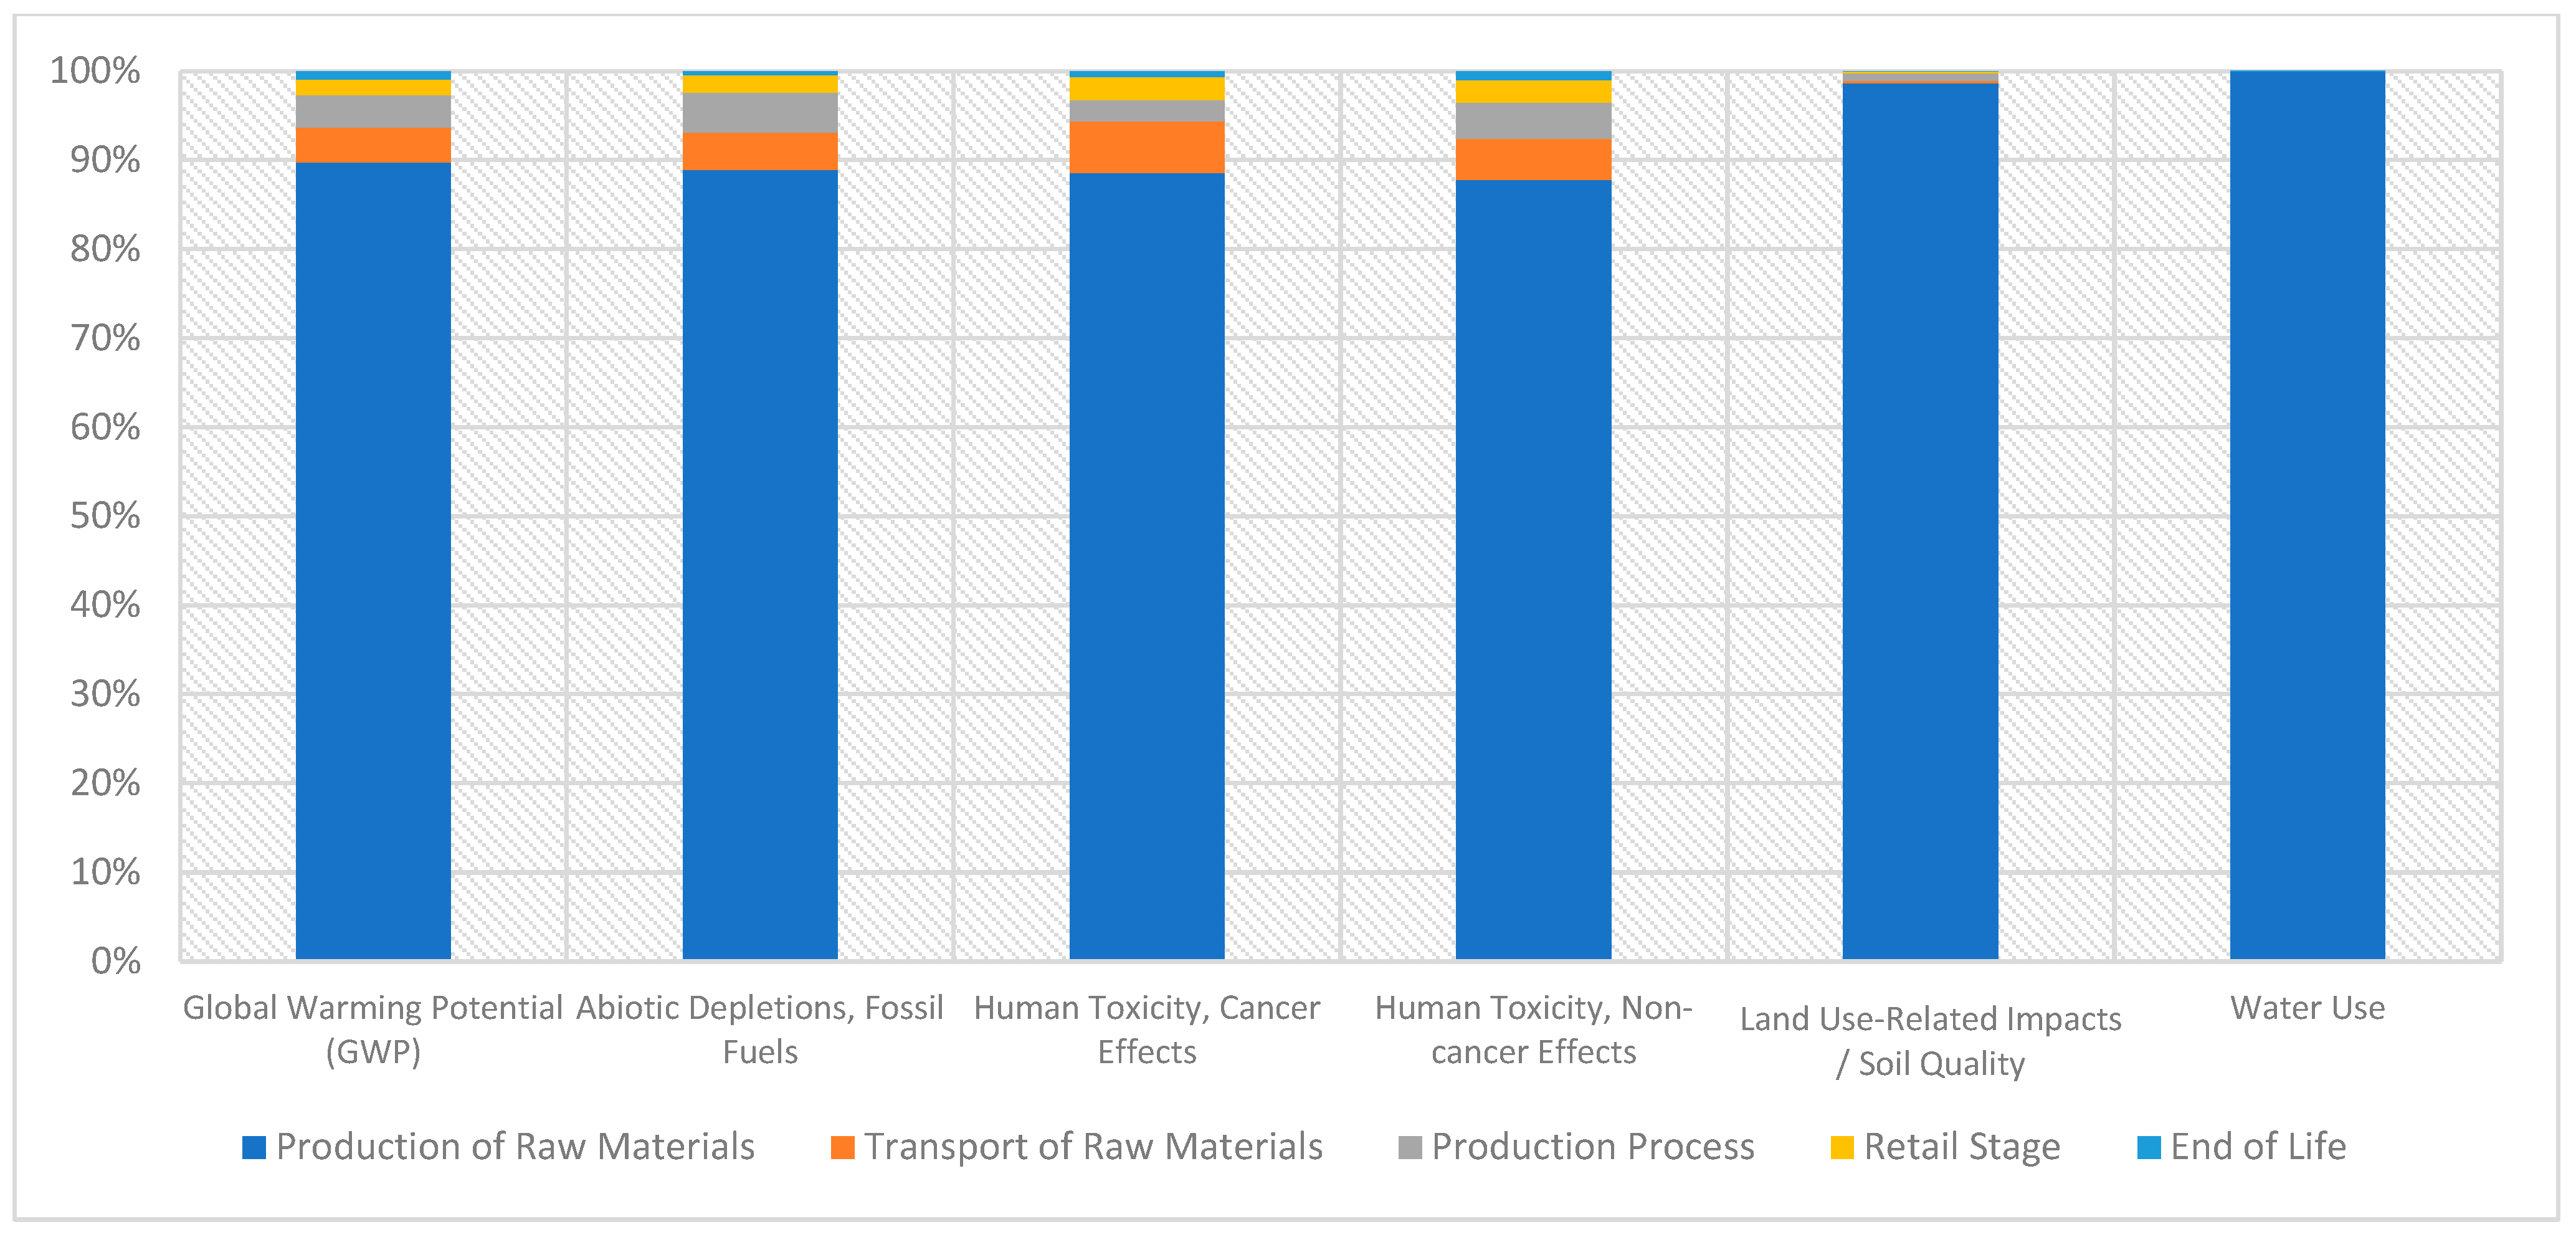
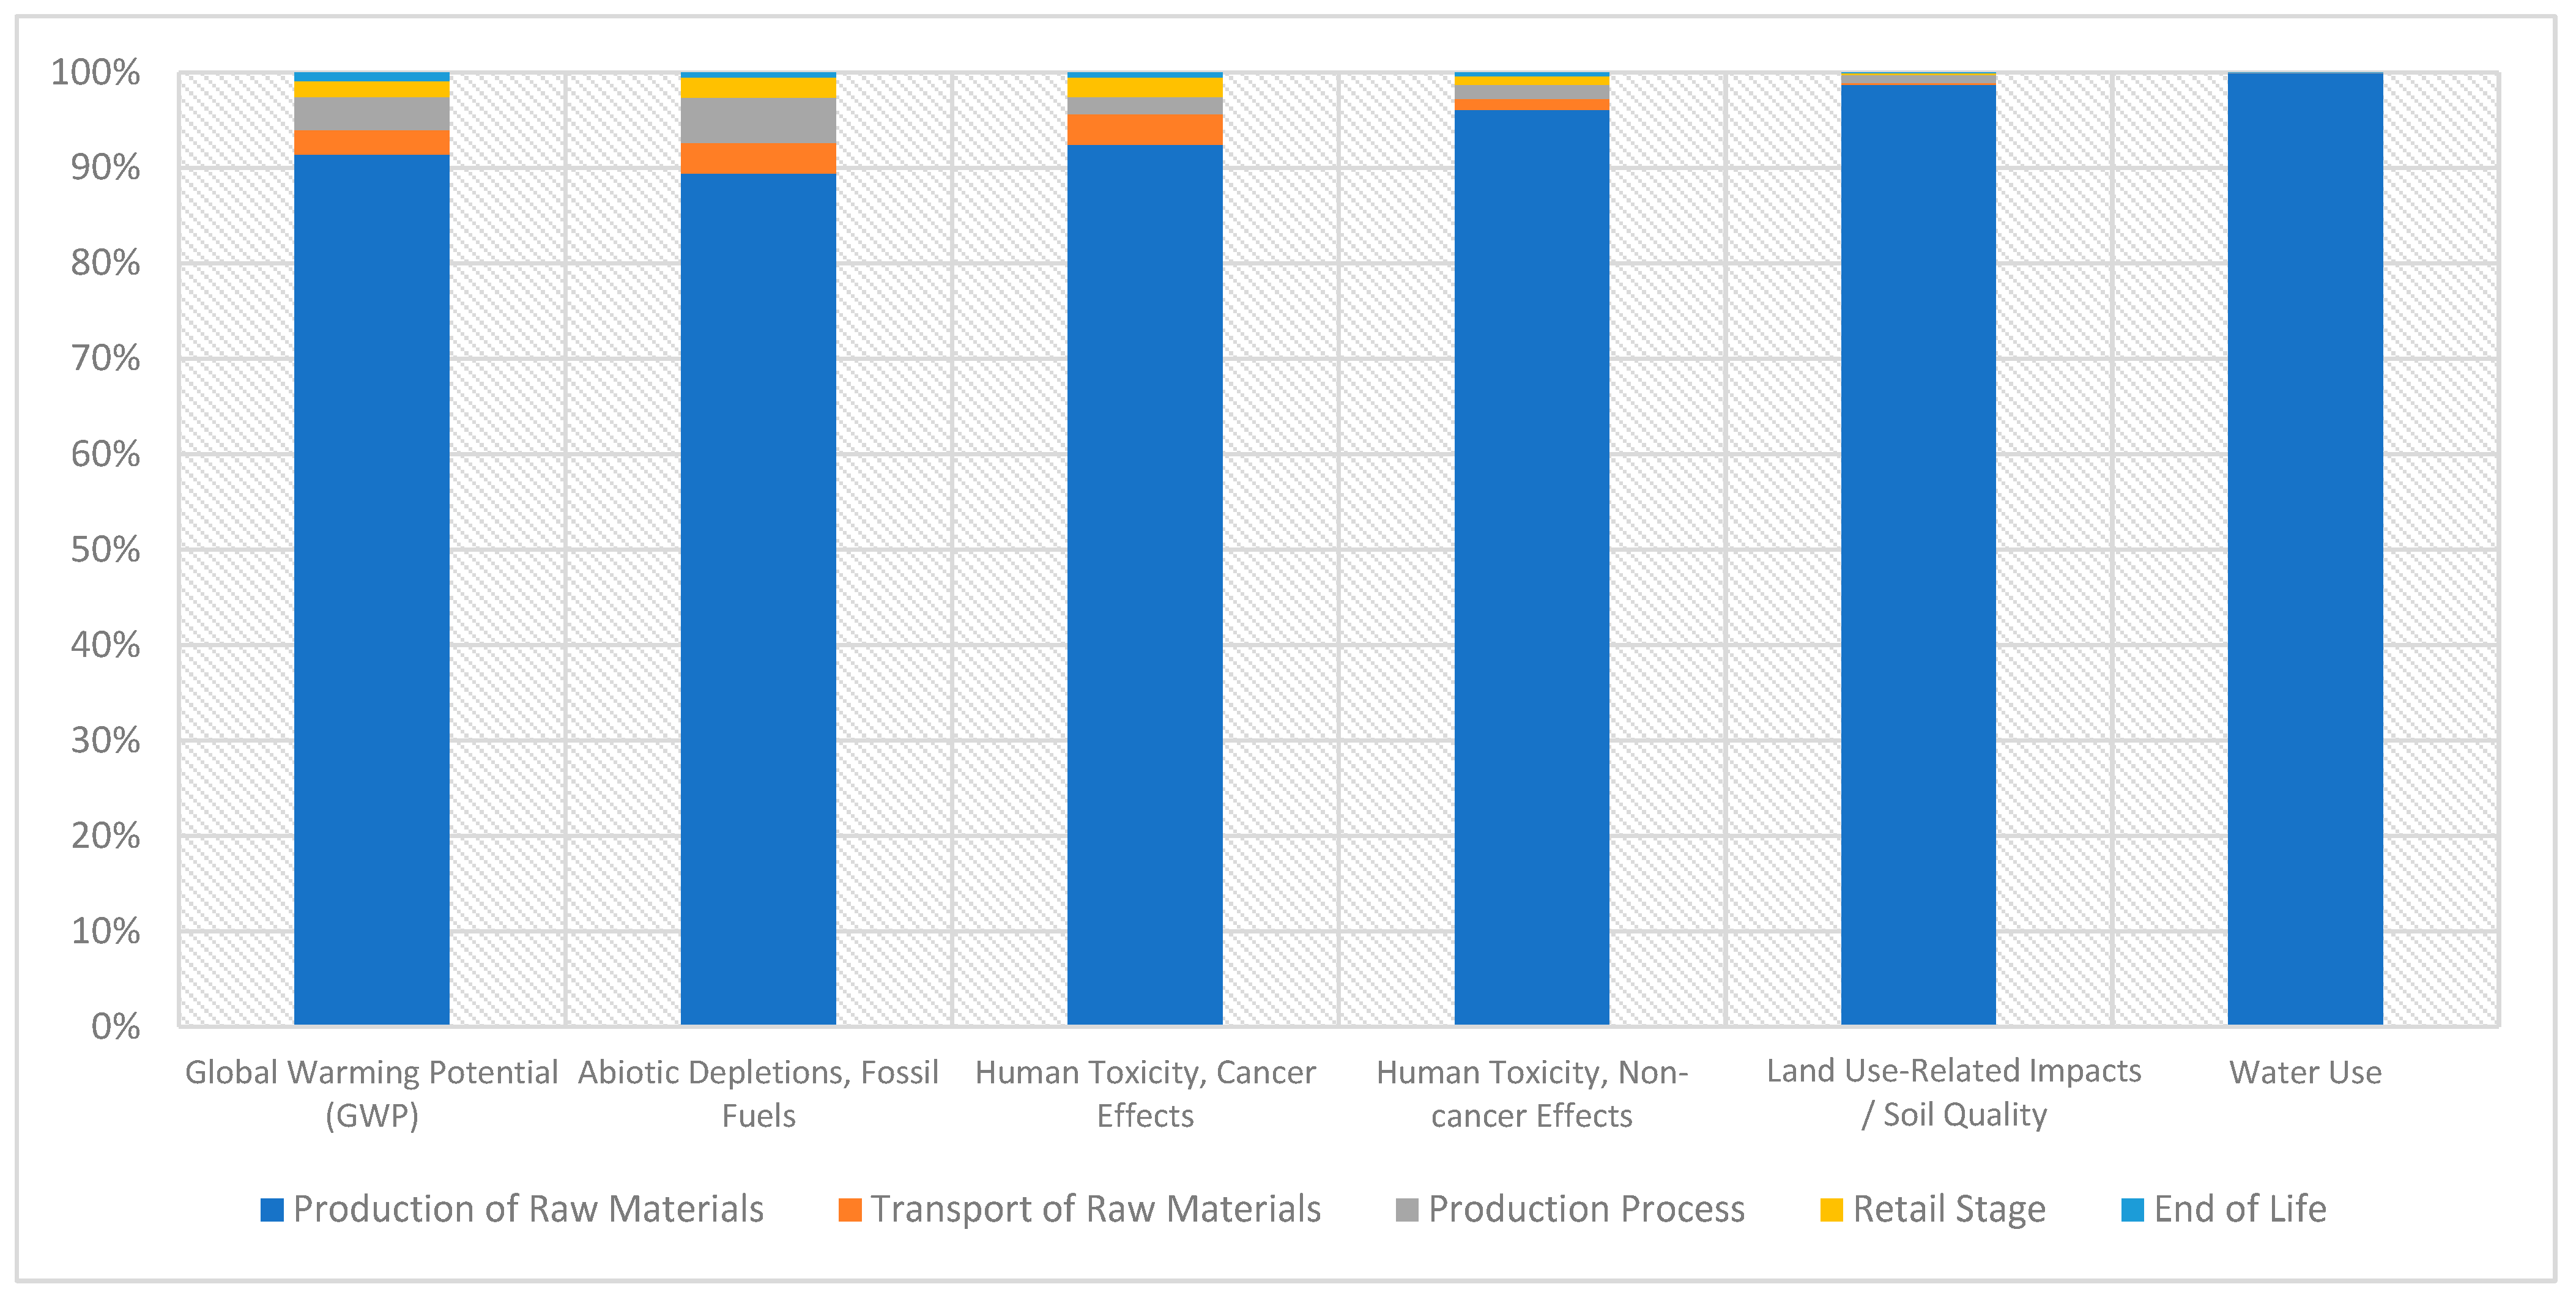
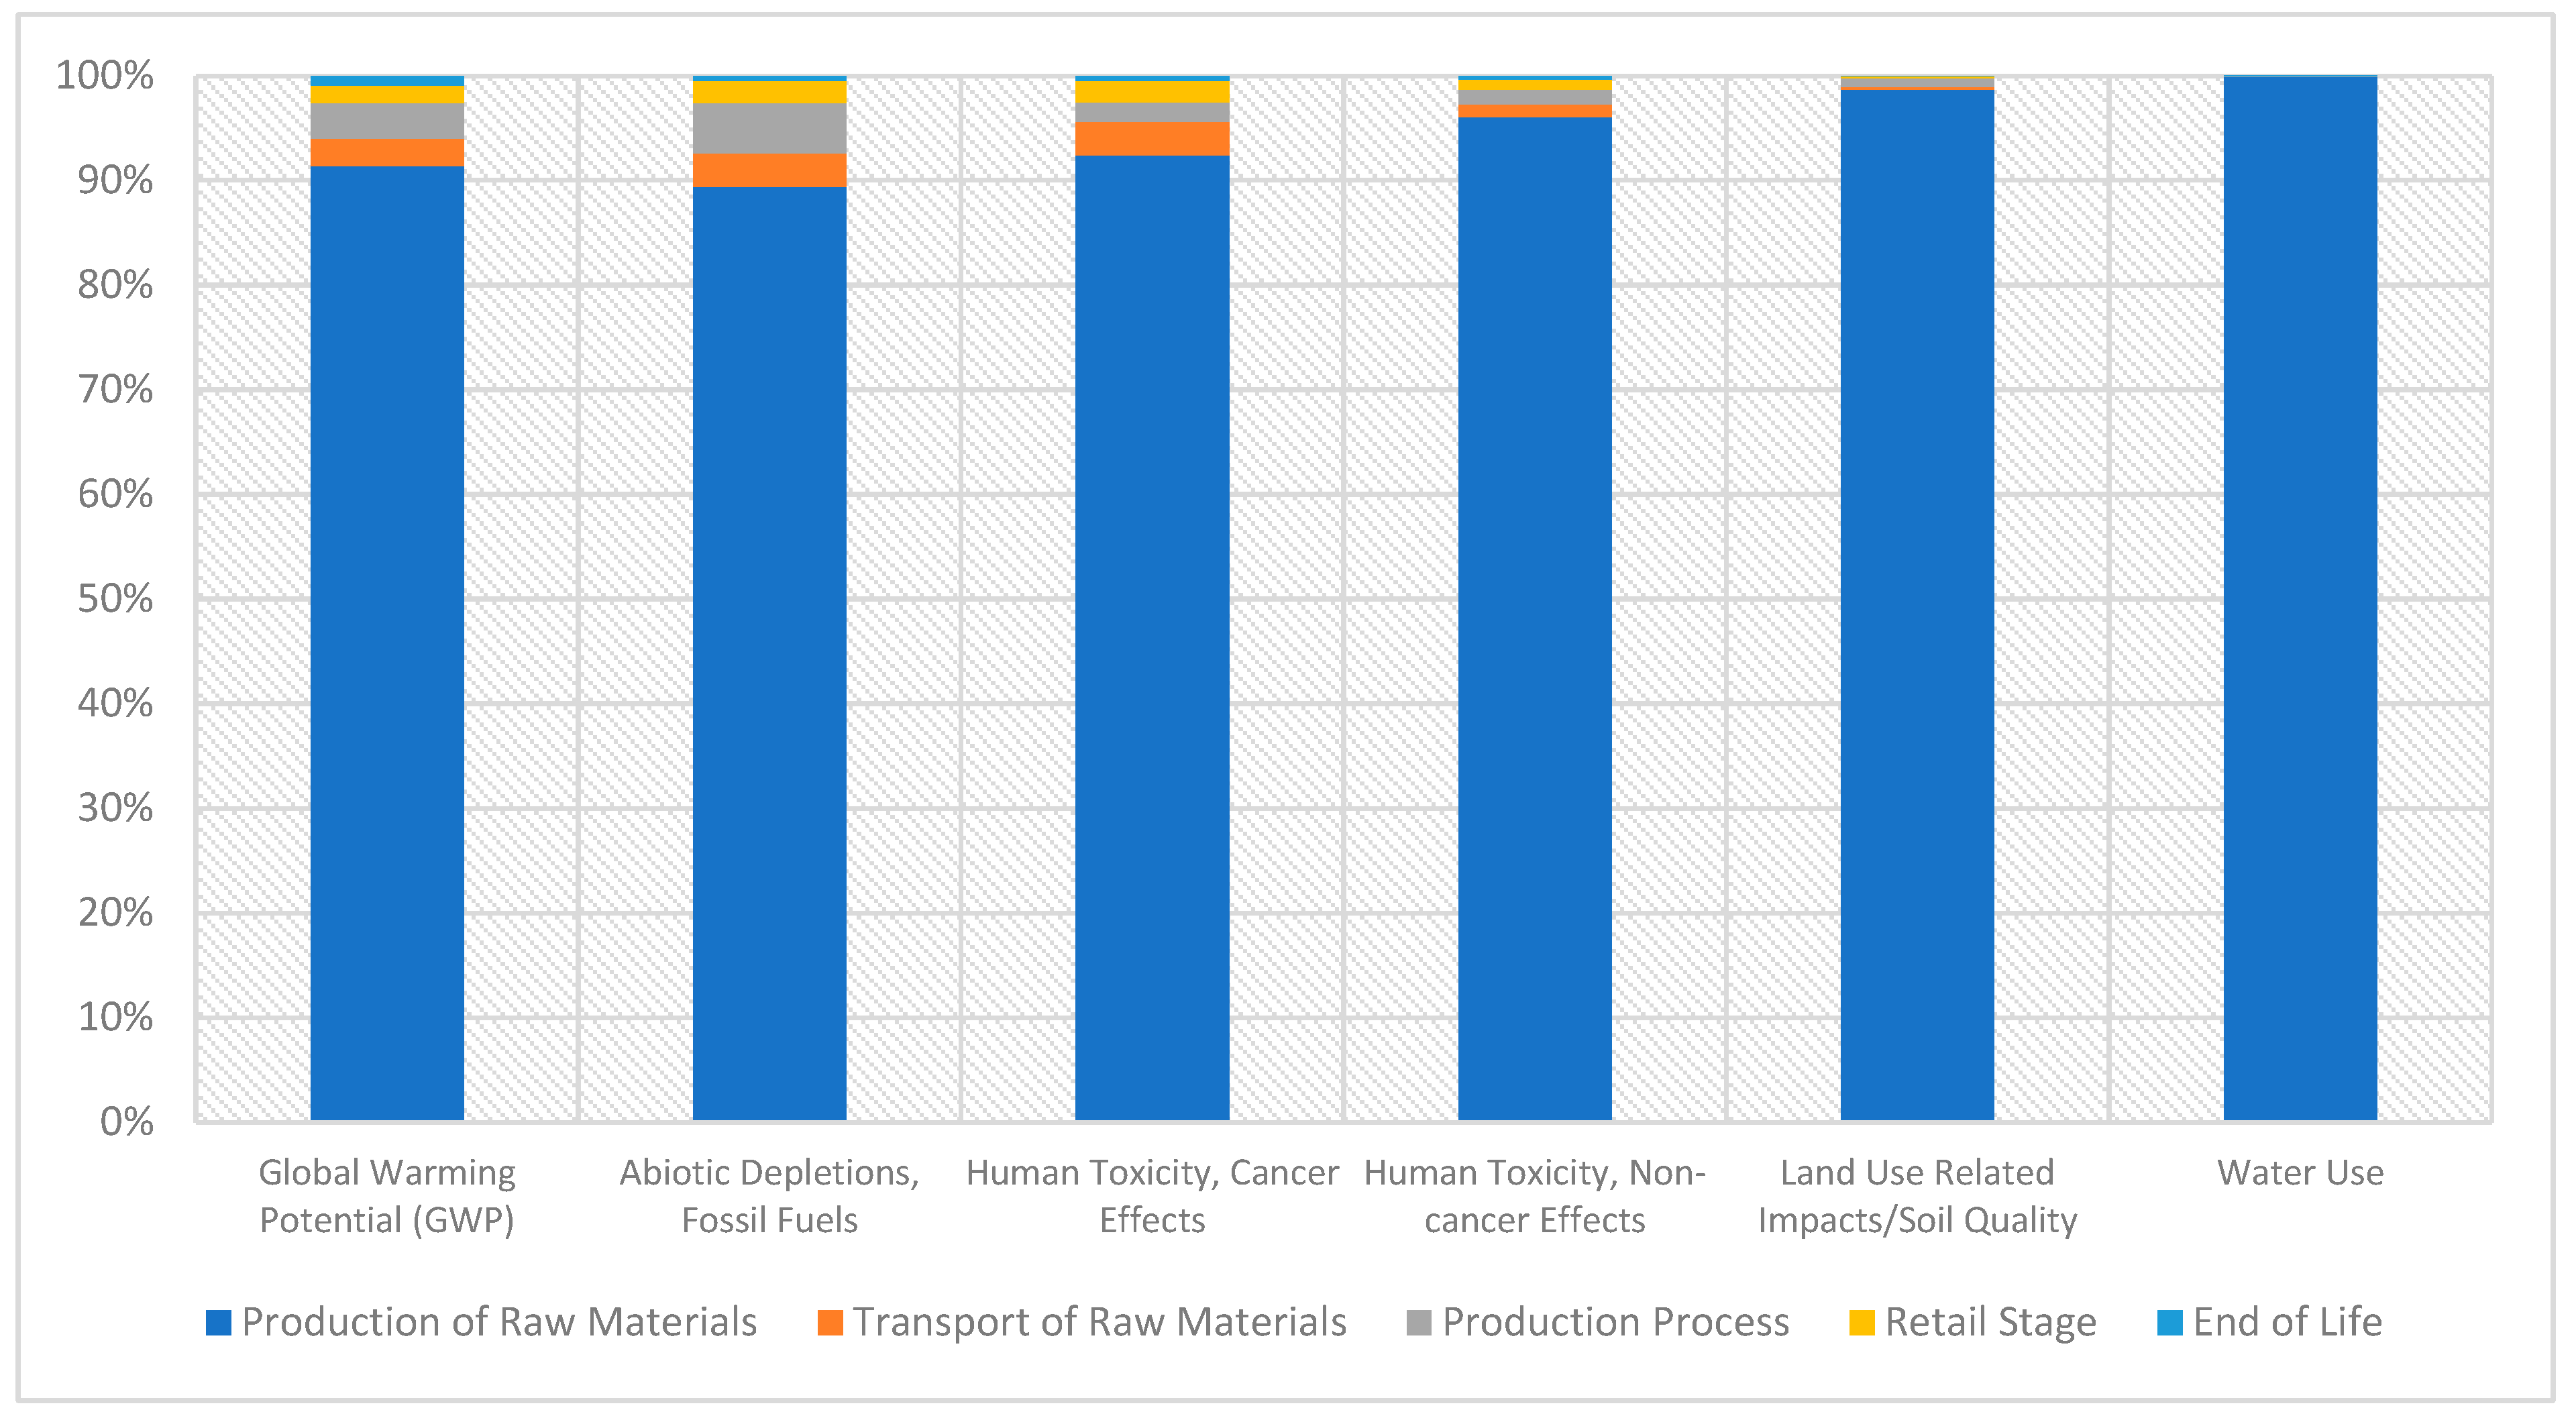
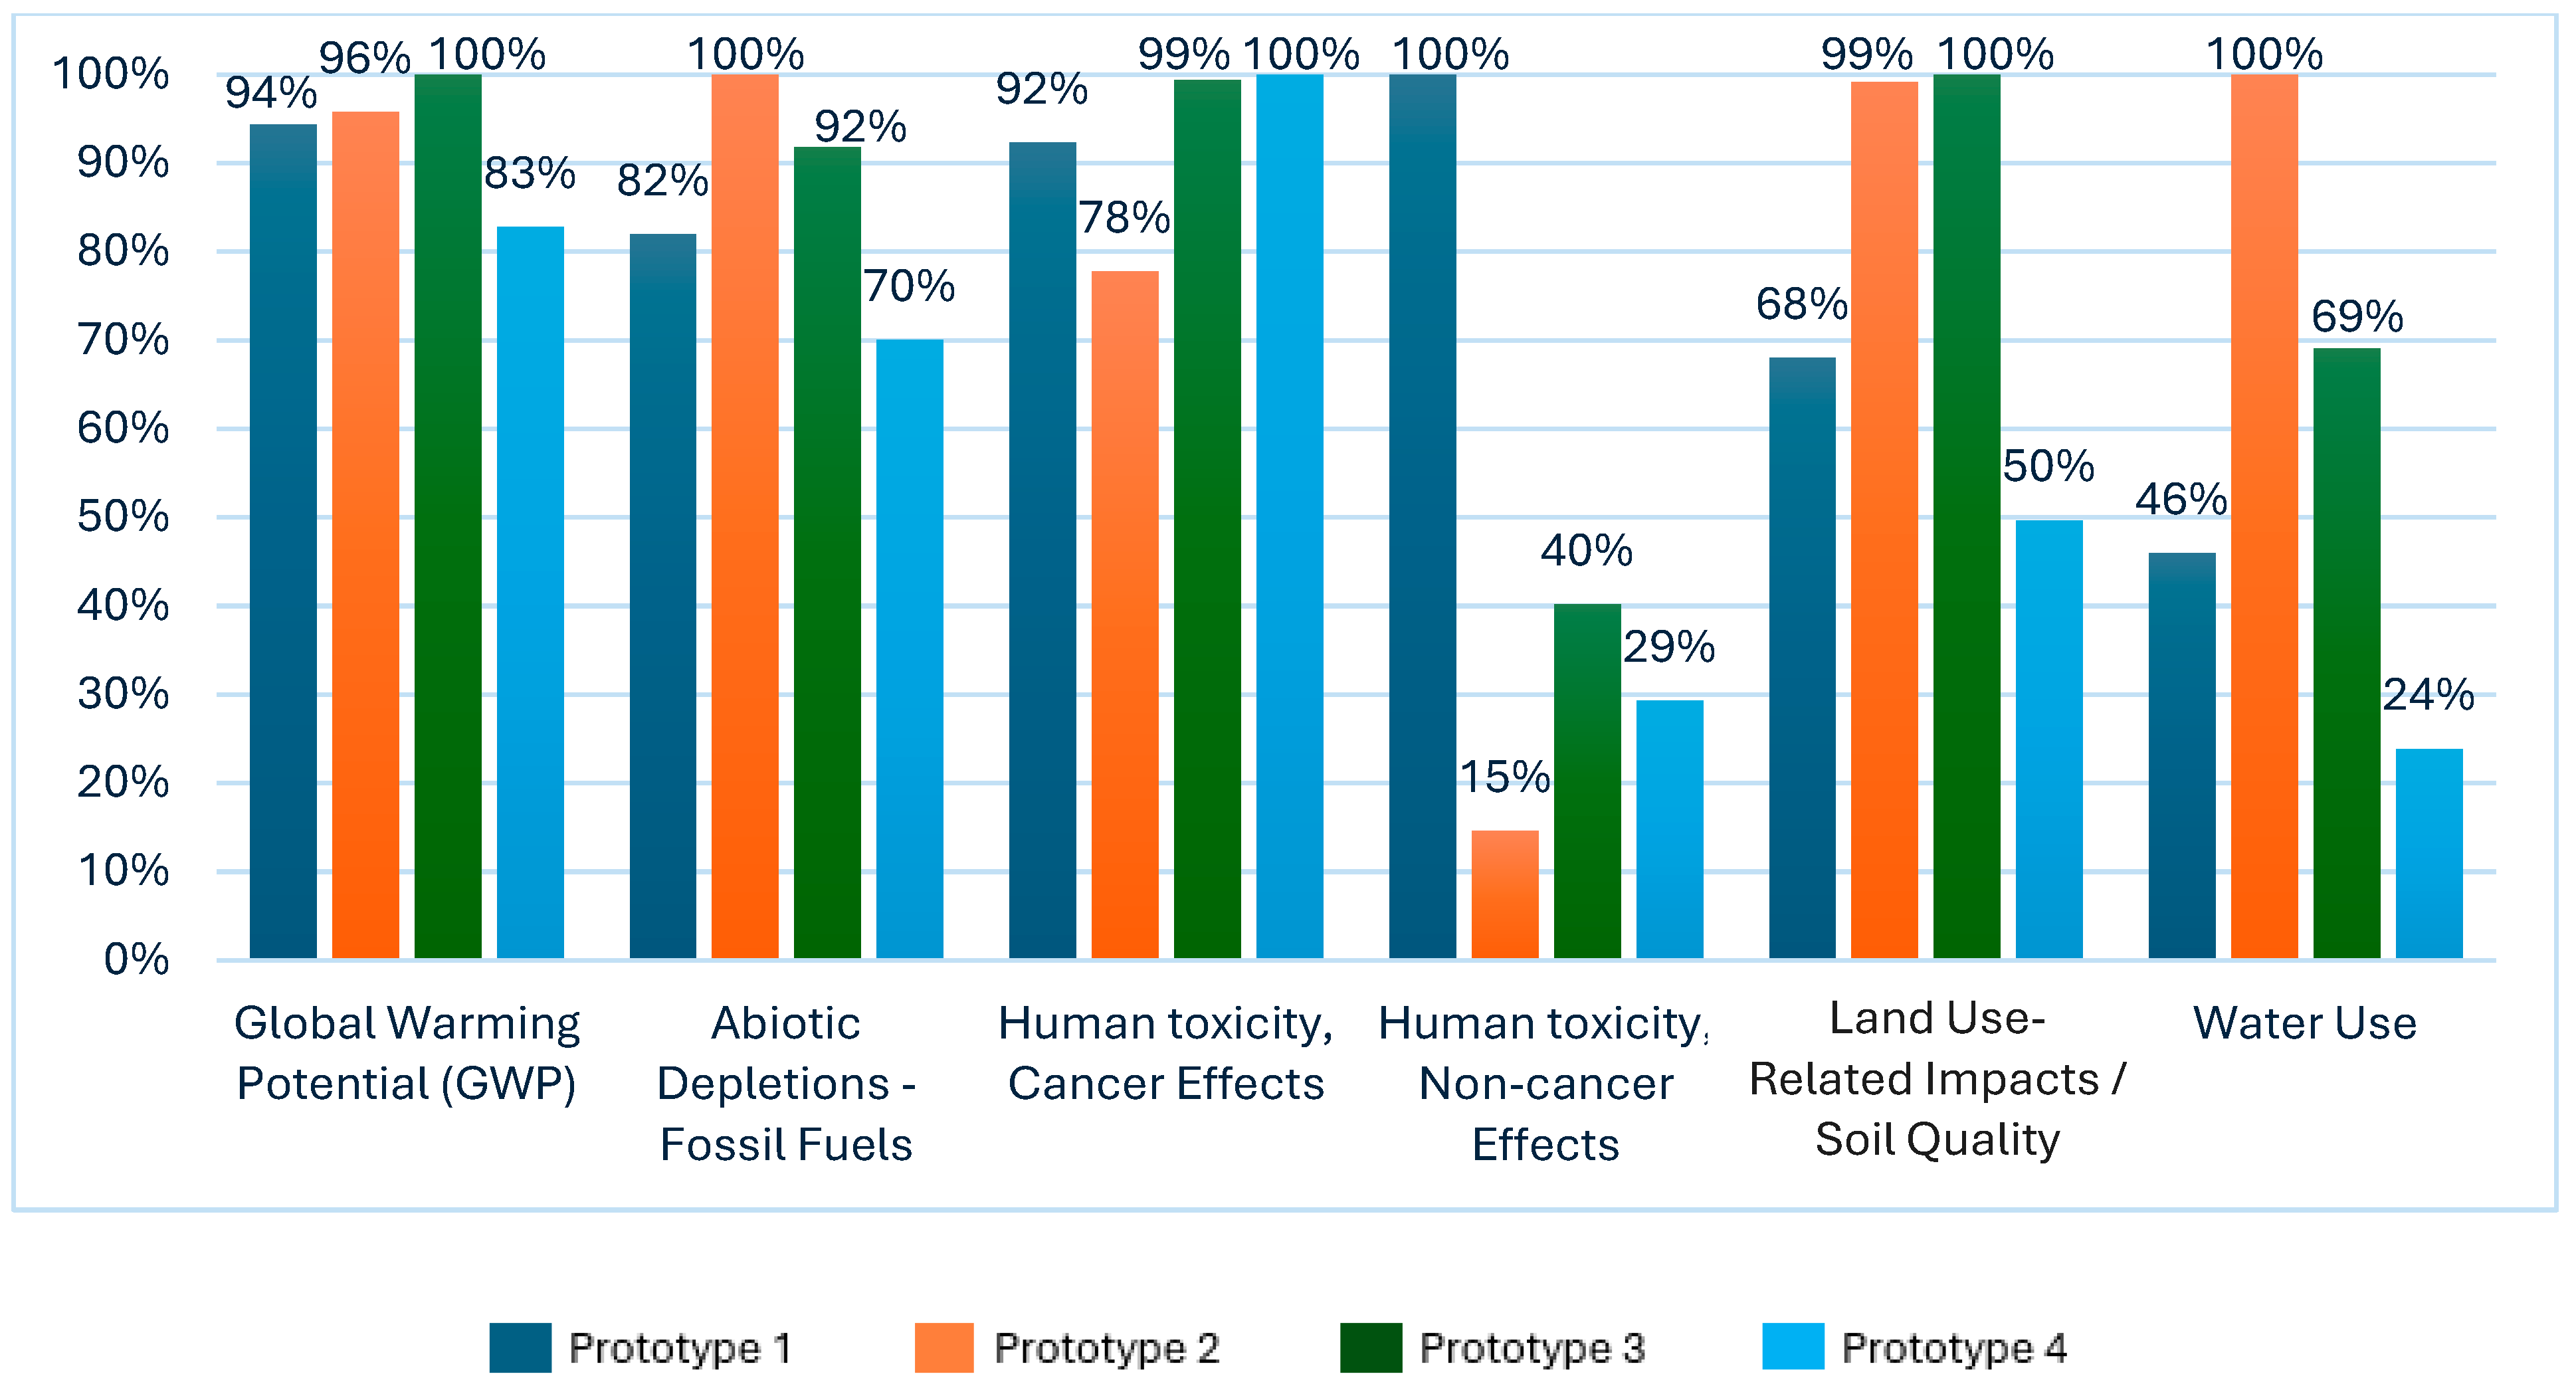
| Ingredient List | Amount (g) | |||
|---|---|---|---|---|
| Prototype 1 | Prototype 2 | Prototype 3 | Prototype 4 | |
| Oat flour | 25 | 22 | 22 | 26 |
| Almond flour | 21 | 7.2 | ||
| Walnut flour | 12 | |||
| Walnut particles | 14 | 10 | ||
| Silverberry powder | 3 | |||
| Pumpkin seeds | 9 | 7 | ||
| Sunflower seeds | 7 | |||
| Sesame seeds | 8.5 | |||
| Red lentils flour | 5 | 5 | ||
| Dried apricot | 26 | |||
| Silverberry powder | 4 | |||
| Dried orange powder | 3 | |||
| Ground mulberry leaf powder | 0.7 | |||
| Dried mulberry | 7 | 10 | ||
| Dried persimmon | 8 | |||
| Dried fig | 12 | |||
| Date | 22 | 10 | ||
| Inulin (Chicory) | 1.5 | 1.848 | 1.8 | 1.498 |
| Vanilla extract | 0.002 | 0.002 | 0.002 | |
| Cinnamon powder | 0.748 | 0.4 | 0.3 | |
| Arabic gum | 10 | 10 | 10 | 10 |
| Water | 7 | 7 | 7 | 7 |
| Pectin powder | 1 | 1 | 1 | 1 |
| Acidized water (for pectin solubilization) | 3.75 (50 water:0.5 citric acid 1%) | 3.75 (50 water:0.5 citric acid 1%) | 3 (50 water:0.5 citric acid 1%) | 3 (50 water:0.5 citric acid 1%) |
| Raw Food Material | Region | Transport Type and Distance (Average km) |
|---|---|---|
| Almond | Mediterranean Sea Region in Türkiye | 600 (Road) |
| Arabic Gum | Senegal | 5850 (Sea) |
| Cinnamon | Indonesia | 13100 (Sea) |
| Palm Date | Saudi Arabia | 3000 (Road) 2500 (Sea) |
| Orange | Mediterranean Sea Region in Türkiye | 600 (Road) |
| Apricot | Around Marmara Region in Türkiye | 250 (Road) |
| Fig | Around Bursa Region in Türkiye | 100 (Road) |
| Mulberry | Around Bursa Region in Türkiye | 100 (Road) |
| Inulin | Around Marmara Region in Türkiye | 250 (Road) |
| Oat | Inner Anatolia Region in Türkiye | 600 (Road) |
| Pectin | Around Marmara Region in Türkiye | 250 (Road) |
| Persimmon | Around Bursa Region in Türkiye | 100 (Road) |
| Pumpkin Seed | Inner Anatolia Region in Türkiye | 600 (Road) |
| Red Lentil | South-East Region of Anatolia in Türkiye | 1200 (Road) |
| Sesame Seed | Aegean, Mediterranean, and South-East Anatolia Region in Türkiye | 600 (Road) |
| Silverberry | Around Marmara Region in Türkiye | 250 (Road) |
| Sunflower Seed | Around Bursa Region in Türkiye | 100 (Road) |
| Vanilla | Around Marmara Region in Türkiye | 250 (Road) |
| Walnut | Around Bursa Region in Türkiye | 100 km (Road) |
| Impact Category | Indicator | Unit | Model |
|---|---|---|---|
| Global Warming Potential (GWP) | Global Warming Potential total (GWP-total) | kg CO2 eq. | Baseline model of 100 years of the IPCC based on IPCC 2013 |
| Abiotic Depletions, Fossil Fuels (AD) | Abiotic Depletion potential (ADP-fossil) for fossil resources | MJ, net calorific value | CML 2002 |
| Human Toxicity, Cancer (HTC), and Non-Cancer (HTNC) Effects | Potential Comparative Toxic Unit for humans (HTP-c) and (HTP-nc) | CTUh | Usetox version 2 |
| Land Use-Related Impacts/Soil Quality (LU) | Potential Soil Quality Index (SQP) | dimensionless | Soil quality index based on LANCA |
| Water Use (WU) | Use of water | m3 | Inventory calculation |
| Impact Category | Unit | Production of Raw Materials | Transport of Raw Materials | Production Process | Retail Stage | End of Life | Total Impact |
|---|---|---|---|---|---|---|---|
| GWP | kg CO2 eq | 2.02 × 10⁻¹ | 5.54 × 10⁻³ | 7.63 x10⁻³ | 3.91 × 10⁻³ | 2.11 × 10⁻³ | 2.21 × 10⁻¹ |
| AD | MJ | 2.09 | 7.66 × 10⁻² | 1.19 × 10⁻¹ | 5.56 × 10⁻² | 1.31 × 10⁻² | 2.35 |
| HTC | CTUh | 8.42 × 10⁻¹⁰ | 2.84 × 10⁻¹¹ | 1.73 × 10⁻¹¹ | 2.02 × 10⁻¹¹ | 4.93 × 10⁻¹² | 9.13 × 10⁻¹⁰ |
| HTNC | CTUh | 1.02 × 10⁻⁸ | 4.47 × 10⁻¹¹ | 6.03 × 10⁻¹¹ | 3.81 × 10⁻¹¹ | 1.52 × 10⁻¹¹ | 1.03 × 10⁻⁸ |
| LU | Pt | 1.46 × 101 | 4.18 × 10⁻² | 1.82 × 10⁻¹ | 4.16 × 10⁻² | 1.08 × 10⁻² | 1.48 × 101 |
| WU | m3 | 1.32 × 10⁻¹ | 1.13 × 10⁻¹ | 1.26 × 10⁻⁴ | 9.51 × 10⁻⁶ | 2.61 × 10⁻⁶ | 1.32 × 10⁻¹ |
| Impact Category | Unit | Production of Raw Materials | Transport of Raw Materials | Production Process | Retail Stage | End of Life | Total Impact |
|---|---|---|---|---|---|---|---|
| GWP | kg CO2 eq | 2.01 × 10⁻¹ | 8.75 × 10⁻³ | 8.23 × 10⁻³ | 3.91 × 10⁻³ | 2.11 × 10⁻³ | 2.24 × 10⁻¹ |
| AD | MJ | 2.55 | 1.21 × 10⁻¹ | 1.29 × 10⁻¹ | 5.56 × 10⁻² | 1.31 × 10⁻² | 2.87 |
| HTC | CTUh | 6.81 × 10⁻¹⁰ | 4.46 × 10⁻¹¹ | 1.84 × 10⁻¹¹ | 2.02 × 10⁻¹¹ | 4.93 × 10⁻¹² | 7.69 × 10⁻¹⁰ |
| HTNC | CTUh | 1.32 × 10⁻⁹ | 6.99 × 10⁻¹¹ | 6.15 × 10⁻¹¹ | 3.81 × 10⁻¹¹ | 1.52 × 10⁻¹¹ | 1.51 × 10⁻⁹ |
| LU | Pt | 2.13 × 101 | 6.52 × 10⁻² | 1.82 × 10⁻¹ | 4.16 × 10⁻² | 1.08 × 10⁻² | 2.16 × 101 |
| WU | m3 | 2.86 × 10⁻¹ | 1.78 × 10⁻⁵ | 1.27 × 10⁻⁴ | 9.51 × 10⁻⁶ | 2.61 × 10⁻⁶ | 2.87 × 10⁻¹ |
| Impact Category | Unit | Production of Raw Materials | Transport of Raw Materials | Production Process | Retail Stage | End of Life | Total Impact |
|---|---|---|---|---|---|---|---|
| GWP | kg CO2 eq | 2.14 × 10⁻¹ | 6.11 × 10⁻³ | 8.08 × 10⁻³ | 3.91 × 10⁻³ | 2.11 × 10⁻³ | 2.34 × 10⁻¹ |
| AD | MJ | 2.35 | 8.42 × 10⁻² | 1.26 × 10⁻¹ | 5.56 × 10⁻² | 1.31 × 10⁻² | 2.63 |
| HTC | CTUh | 9.08 × 10⁻¹⁰ | 3.12 × 10⁻¹¹ | 1.81 × 10⁻¹¹ | 2.02 × 10⁻¹¹ | 4.93 × 10⁻¹² | 9.82 × 10⁻¹⁰ |
| HTNC | CTUh | 3.99 × 10⁻⁹ | 4.88 × 10⁻¹¹ | 6.12 × 10⁻¹¹ | 3.81 × 10⁻¹¹ | 1.52 × 10⁻¹¹ | 4.16 × 10⁻⁹ |
| LU | Pt | 2.15 × 101 | 4.55 × 10⁻² | 1.82 × 10⁻¹ | 4.16 × 10⁻² | 1.08 × 10⁻² | 2.18 × 101 |
| WU | m3 | 1.98 × 10⁻¹ | 1.24 × 10⁻⁵ | 1.27 × 10⁻⁴ | 9.51 × 10⁻⁶ | 2.61 × 10⁻⁶ | 1.98 × 10⁻¹ |
| Impact Category | Unit | Production of Raw Materials | Transport of Raw Materials | Production Process | Retail Stage | End of Life | Total Impact |
|---|---|---|---|---|---|---|---|
| GWP | kg CO2 eq | 1.74 × 10⁻¹ | 6.19 × 10⁻³ | 8.23 × 10⁻³ | 3.91 × 10⁻³ | 2.11 × 10⁻³ | 1.94 × 10⁻¹ |
| AD | MJ | 1.73 | 8.58 × 10⁻² | 1.29 × 10⁻¹ | 5.56 × 10⁻² | 1.31 × 10⁻² | 2.01 |
| HTC | CTUh | 9.13 × 10⁻¹⁰ | 3.19 × 10⁻¹¹ | 1.84 × 10⁻¹¹ | 2.02 × 10⁻¹¹ | 4.93 × 10⁻¹² | 9.88 × 10⁻¹⁰ |
| HTNC | CTUh | 2.86 × 10⁻⁹ | 5.08 × 10⁻¹¹ | 6.15 × 10⁻¹¹ | 3.81 × 10⁻¹¹ | 1.52 × 10⁻¹¹ | 3.03 × 10⁻⁹ |
| LU | Pt | 1.05 × 101 | 4.78 × 10⁻² | 1.82 × 10⁻¹ | 4.16 × 10⁻² | 1.08 × 10⁻² | 1.08 × 101 |
| WU | m3 | 6.83 × 10⁻² | 1.29 × 10⁻⁵ | 1.27 × 10⁻⁴ | 9.51 × 10⁻⁶ | 2.61 × 10⁻⁶ | 6.84 × 10⁻² |
| Country | Foods/Diets | LCA Boards and Methods | Environmental Impact Categories | Highlights | Reference |
|---|---|---|---|---|---|
| Italy | meat, fish, eggs, milk and derivatives, tubers, cereals/derivatives, legumes, seasoning fats, fruit, vegetables, and random foods (sweets, snacks, sugary drinks, sugar, and alcoholic beverages) | cradle-to-gate ReCiPe 2016 Endpoint method | GWP, Ozone formation, Acidification; Eutrophication; Ecotoxicity, LU, WU, Stratospheric ozone depletion; Ionizing radiation; Fine particulate matter formation; HTC, HTNC |
| [66] |
| Lebanese | fruits, vegetables, legumes, olive oil, burghul (crushed whole wheat), milk and dairy products, starchy vegetables, and dried fruits, eggs | NA | GHG, Energy use, WU |
| [67] |
| Spain | fruits, vegetables, pulses, potatoes, whole grains, fish, olive oil, poultry, red meat, dairy products with fat, and alcohol | NA | GHG, LU, Energy use, Acidification, Eutrophication |
| [68] |
| Italy | bread, pasta, and flour products, potatoes, vegetables and fruits, meat and meat products, dairy products, and fish | NA | GHG |
| [69] |
| Greece | meat, fish, dairy products, eggs, cereal-based products, sugar, oils, tubers, vegetables, legumes, fruits, and nuts | NA | LU, WU, GHG, Eutrophication |
| [70] |
| Türkiye | dried fruits, legumes, cereal-based products, and random foods (pectin powder, Arabic gum, and spices) | cradle-to-grave Environmental Footprint (EF) 3.1 method | GWP, AD, HTC, HTNC, LU, WU |
| This study |
Disclaimer/Publisher’s Note: The statements, opinions and data contained in all publications are solely those of the individual author(s) and contributor(s) and not of MDPI and/or the editor(s). MDPI and/or the editor(s) disclaim responsibility for any injury to people or property resulting from any ideas, methods, instructions or products referred to in the content. |
© 2025 by the authors. Licensee MDPI, Basel, Switzerland. This article is an open access article distributed under the terms and conditions of the Creative Commons Attribution (CC BY) license (https://creativecommons.org/licenses/by/4.0/).
Share and Cite
Üstün, G.E.; Güldaş, M. A Life Cycle Assessment of Snack Bar Prototypes Created with Ingredients Compatible with the Mediterranean Diet. Sustainability 2025, 17, 8195. https://doi.org/10.3390/su17188195
Üstün GE, Güldaş M. A Life Cycle Assessment of Snack Bar Prototypes Created with Ingredients Compatible with the Mediterranean Diet. Sustainability. 2025; 17(18):8195. https://doi.org/10.3390/su17188195
Chicago/Turabian StyleÜstün, Gökhan Ekrem, and Metin Güldaş. 2025. "A Life Cycle Assessment of Snack Bar Prototypes Created with Ingredients Compatible with the Mediterranean Diet" Sustainability 17, no. 18: 8195. https://doi.org/10.3390/su17188195
APA StyleÜstün, G. E., & Güldaş, M. (2025). A Life Cycle Assessment of Snack Bar Prototypes Created with Ingredients Compatible with the Mediterranean Diet. Sustainability, 17(18), 8195. https://doi.org/10.3390/su17188195


