Article

Impact of Airflow Rate and Supply-Exhaust Configuration on Displacement Ventilation in Airborne Pathogen Removal

1
Graduate School of System Informatics, Kobe University, Kobe 657-8501, Japan
2
RIKEN Center for Computational Science, Kobe 650-0047, Japan
*
Author to whom correspondence should be addressed.
Sustainability 2025, 17(18), 8193; https://doi.org/10.3390/su17188193
Submission received: 14 July 2025 / Revised: 1 September 2025 / Accepted: 8 September 2025 / Published: 11 September 2025
(This article belongs to the Section Air, Climate Change and Sustainability)

Abstract

Displacement ventilation systems can offer healthy indoor air quality (IAQ) by maintaining stratified flows that transport and expel airborne contaminants through the upper region of indoor spaces. Using large eddy simulation (LES), we investigate displacement ventilation in a generic indoor space under varying ventilation flow rates and supply–exhaust configurations. Assessing the ventilation system requires quantitative evaluation of airborne contaminants, for which CO2 concentration is typically used as a proxy. However, in this study, we show that there is both a qualitative and quantitative correlation between CO2 and airborne respiratory particles using computational particle fluid dynamics simulations. The role of the ventilation flow rate in ventilation efficacy is investigated for low values ranging from 0.01 to 0.06 m3/s, and the role of supply–exhaust configuration is assessed by considering in-line and staggered layouts. At low flow rates (0.01 to 0.04 m3/s), the ventilation system maintains a stable stratified layer within the room. Within this regime, the CO2 level in the occupied zone is inversely proportional to the ventilation rate. At higher flow rates, the ventilation transitions to a mixing regime, effectively nullifying the intended design of the system. Interestingly, the two opening configurations produce nearly identical trends, suggesting that jet strength and room geometry dominate over modest opening shifts in this setup.

1. Introduction

The influence of indoor air quality (IAQ) on human health and productivity has been widely studied, confirming headaches, dizziness, loss of concentration, and fatigue, among others, as a consequence of poor indoor environmental conditions [1,2]. It is well established that ventilation systems directly shape IAQ, and a comprehensive assessment must consider factors like respiratory emissions of pathogens, CO2 accumulation, and various chemical pollutants [3,4]. The most recent SARS-CoV-2 pandemic, as well as other epidemic breakouts—H1N1 in 2009, SARS in 2003, tuberculosis in 1990, and measles in 1985—underscore the need to control IAQ and the spread of airborne contaminants to mitigate the impact on human health [5].
Mechanical ventilation systems serve as a primary defense against indoor contaminant build-up by decreasing concentration levels to a safe threshold; therefore, selecting the appropriate system for indoor spaces is essential to maintain healthy IAQ. Displacement ventilation has been used in both industrial and non-industrial settings in recent decades because it provides both good thermal comfort and an improved ventilation efficiency when compared to traditional mixing ventilation systems [6]. In displacement ventilation, cool air is supplied through inlets near the floor, which moves upward due to a buoyant plume that generates vertical gradients of air velocity, temperature, and pollutant concentration, reducing inhalation and infection risk in the occupied zone [7,8,9]. Several studies have suggested that increasing the ventilation airflow rate decreases the infection risk, especially in the case of mixing ventilation [10,11,12]. This has not been quantitatively established, while other studies suggest evidence to the contrary [13,14,15]. For example, Buonanno et al. [16] reported that a reasonable airflow pattern can reduce viral indoor accumulation, while Dietz et al. suggested a hybrid mechanical-natural ventilation interaction to dilute viral load [17].
The efficacy of a ventilation system can only be assessed when the airborne contaminant concentration or level can be quantified. Detailed quantification is possible when airborne particle dynamics such as deposition, inactivation, and filtration are understood. However, in most studies, CO2 has been used as a proxy indicator for overall ventilation efficiency and thus, aerosol viral load. Justification used for this is that both the aerosolized virus and the CO2 have the same exhalation source—the mouth when speaking or coughing, or the nose when breathing or sneezing—wherein an implicit assumption is made that the dispersion and diffusion mechanisms of CO2 and respiratory aerosols are the same and that they can be removed from indoor spaces through ventilation systems [18,19,20]. However, the correlation between the physics of particle dynamics and the distribution of gas-phase CO2 has yet to be directly analyzed.
To clarify these issues, we employ large eddy simulation (LES) to study displacement ventilation in a prototypical room across a range of supply flow rates; LES is chosen for its ability to effectively capture unsteady plume interactions, stratification, and particle-laden flows [21,22]. A standing virtual manikin is introduced in the room, which acts as a source of heat, respiratory particles, and CO2 in order to evaluate inhalation risk and IAQ. The core objective of this work is twofold: (1) to compare the transport physics of viral aerosols and respiratory CO2 clouds and confirm whether the use of CO2 as a proxy indicator for indoor viral particle distribution is a viable option, and (2) to quantitatively assess the impact of ventilation rate on contaminant mitigation when using displacement.

2. Methodology

2.1. Governing Equations

This study utilized the Complex Unified Boundary Element (CUBE) framework for fluid flow analysis, a fully compressible solver for high-performance computing applications previously validated [23,24]. The LES approach ensured a realistic reproduction of indoor flows, considering human occupancy, overcoming the mean flow consideration of the computationally less demanding RANS approach. An Eulerian approach was used for the flow, while the particles were modelled through a discrete Lagrangian approach. The sub-grid turbulence scale was solved by an implicit method with a convective numerical scheme [25,26]. The three-dimensional, compressible governing equations are given below.
Q t + F 1 x 1 + F 2 x 2 + F 3 x 3 = S
Q = ρ ρ u 1 ρ u 2 ρ u 3 ρ e ρ C
F i = ρ u i ρ u i u 1 + P δ i 1 μ A i 1 g u 1 ρ u i u 2 + P δ i 2 μ A i 2 ρ u i u 3 + P δ i 3 μ A i 3 ρ e + P u i μ A i j u j λ T x i ρ u i C ρ u ^ i C , ( i , j = 1 , 2 , 3 )
A i j = u i x j + u j x i 2 3 · u δ i j ,   δ i j = 1   ( i = 1 ) 0   ( o t h e r w i s e )
S = 0 0 0 ρ ρ 0 g ( ρ ρ 0 ) g u 3 0
p = ρ R T
where Q denotes the conservation quantity vector, Fi represents the flux vector, t stands for time, xi is the i-direction coordinate, ρ signifies density, p is pressure, µ indicates the viscosity coefficient, u and ui are the velocity vector and its i-direction component, respectively, and e denotes the internal energy. λ is the thermal conductivity, T signifies temperature, and C and ûi denote the scalar value and its diffusion velocity, respectively. The gas constant R is given by R = 287 J/K·kg. The one-way scalar calculations are performed post-flow field computation. µ and λ at temperature T are evaluated according to Sutherland’s equation:
μ T = μ 0 = T T 0 3 2 T 0 + 110 T + 110
T = μ ( T ) γ R γ 1 P r
where µ0 = 1.85 × 10⁻⁵ N·s/m2, T0 = 295 K, γ = 1.4 and Pr = 0.72.

2.2. Droplet Model

Sputum particles generated from the virtual manikin’s mouth were analyzed through the single droplet model using a one-way approach, where other forces were neglected due to particle density (1000 kg/m3) and size. Direct turbulence fluctuations were predicted through LES, avoiding the use of stochastic methods to simulate particle interactions [27]. The equations below describe the particle velocity ud, particle temperature Td, and particle rate of position change:
d x d d t = u d
d u d d t = f 1 τ d u u d + g
d T d d t = N u 3 P r c p c l f 2 τ d ( T T d ) 1 m d d m d d t L v c p , d
where md represents the mass of the particle, Lv is the latent heat of vaporization at the particle’s temperature, cl signifies the liquid specific heat of the particle, cp is the specific heat of the gas at constant pressure, τd denotes the particle response time, f1 and f2 are corrections for the Stokes drag force and heat transfer due to evaporation, respectively, and, Nu and Pr are the Nusselt and Prandtl numbers [28,29,30]. τd and Nu are given by:
τ d = ρ d d d 2 18 μ
N u = 2 + 0.552 R e s 1 / 2 P r 1 / 3
where ρd represents the particle density and Res denotes the Reynolds number based on the slip velocity of the particle with respect to the velocity of the flow:
u s l i p = m a x ( u u d )
R e s = ρ u s l i p d d μ
Particle evaporation was modeled through the non-equilibrium Langmuir–Knudsen model [31] and the change rate of particle mass md is expressed by:
d m d d t = m d τ d S h 3 S c ln 1 + B M
where BM is the mass transfer number, Sh denotes the Sherwood number, and Sc signifies the Schmidt number, expressed by:
B M = Y V , s Y V 1 Y V , s
S h = 2 + 0.552 R e s 1 / 2 S c 1 / 3
S c = μ ρ D
where D is the diffusion coefficient of air, Yv denotes the vapor mass fraction in the far-field condition of the particle, and Yv,s represents the vapor mass fraction at the surface. Yv,s is given by:
Y V , s = X V , s X V , s + ( 1 X V , s ) W ¯ / W v
where W ¯ represents the gas-phase average molecular weight, and Wv is the molecular weight of water vapor. The mass fractions of liquid-vapor water at the particle surface are given by:
X V , s = P s a t P
where Psat denotes the saturation vapor pressure. Further details have been published by Bale et al. [24,32]. The droplet evaporation model used for this simulation has been previously validated again the experiments of Ranz [29] and published in prior works [33].

2.3. Speaking Model and Exhaled Contaminants

As a source of respiratory droplets and CO2, this study used a speaking virtual manikin with an integrated talking model proposed by Gupta et al. [34], based on a 1-to-10 count in English, shown in Figure 1a, where positive flow rates indicate speaking and negative flow rates indicate inhalation. The respiratory droplets were injected into the simulation domain at the mouth during the peak flow rate of each utterance of the talking model. The particle diameter distribution at exhalation is depicted in Figure 1b. The CO2 concentration of the exhalated air was assumed to be 40,000 ppm. The initial ambient concentration in the room was set to 400 ppm, which is also the concentration of the ventilation inflow.

2.4. Case Set-Up

This study has applied displacement ventilation to a room with dimensions of 3.0 × 3.5 × 2.5 (L × W × H) meters. In this type of system, a stratified flow is created using the buoyancy forces in the room, creating a better IAQ when compared to traditional mixing ventilation systems. Displacement ventilation presents the opportunity to improve both temperature and ventilation effectiveness because the air is separated into layers due to air density, creating an upper polluted zone and a lower, clean occupied zone [35]. Although it has been used in industrial buildings and, recently, in non-industrial settings such as gyms, meeting rooms, classrooms, and tall rooms (convention centers, arenas, and museums), its design criterion has been primarily temperature-based instead of IAQ-based [6]. Therefore, this research has focused on displacement ventilation used for IAQ control, aiming its design to mitigate respiratory contaminants concentration in the occupied zone.
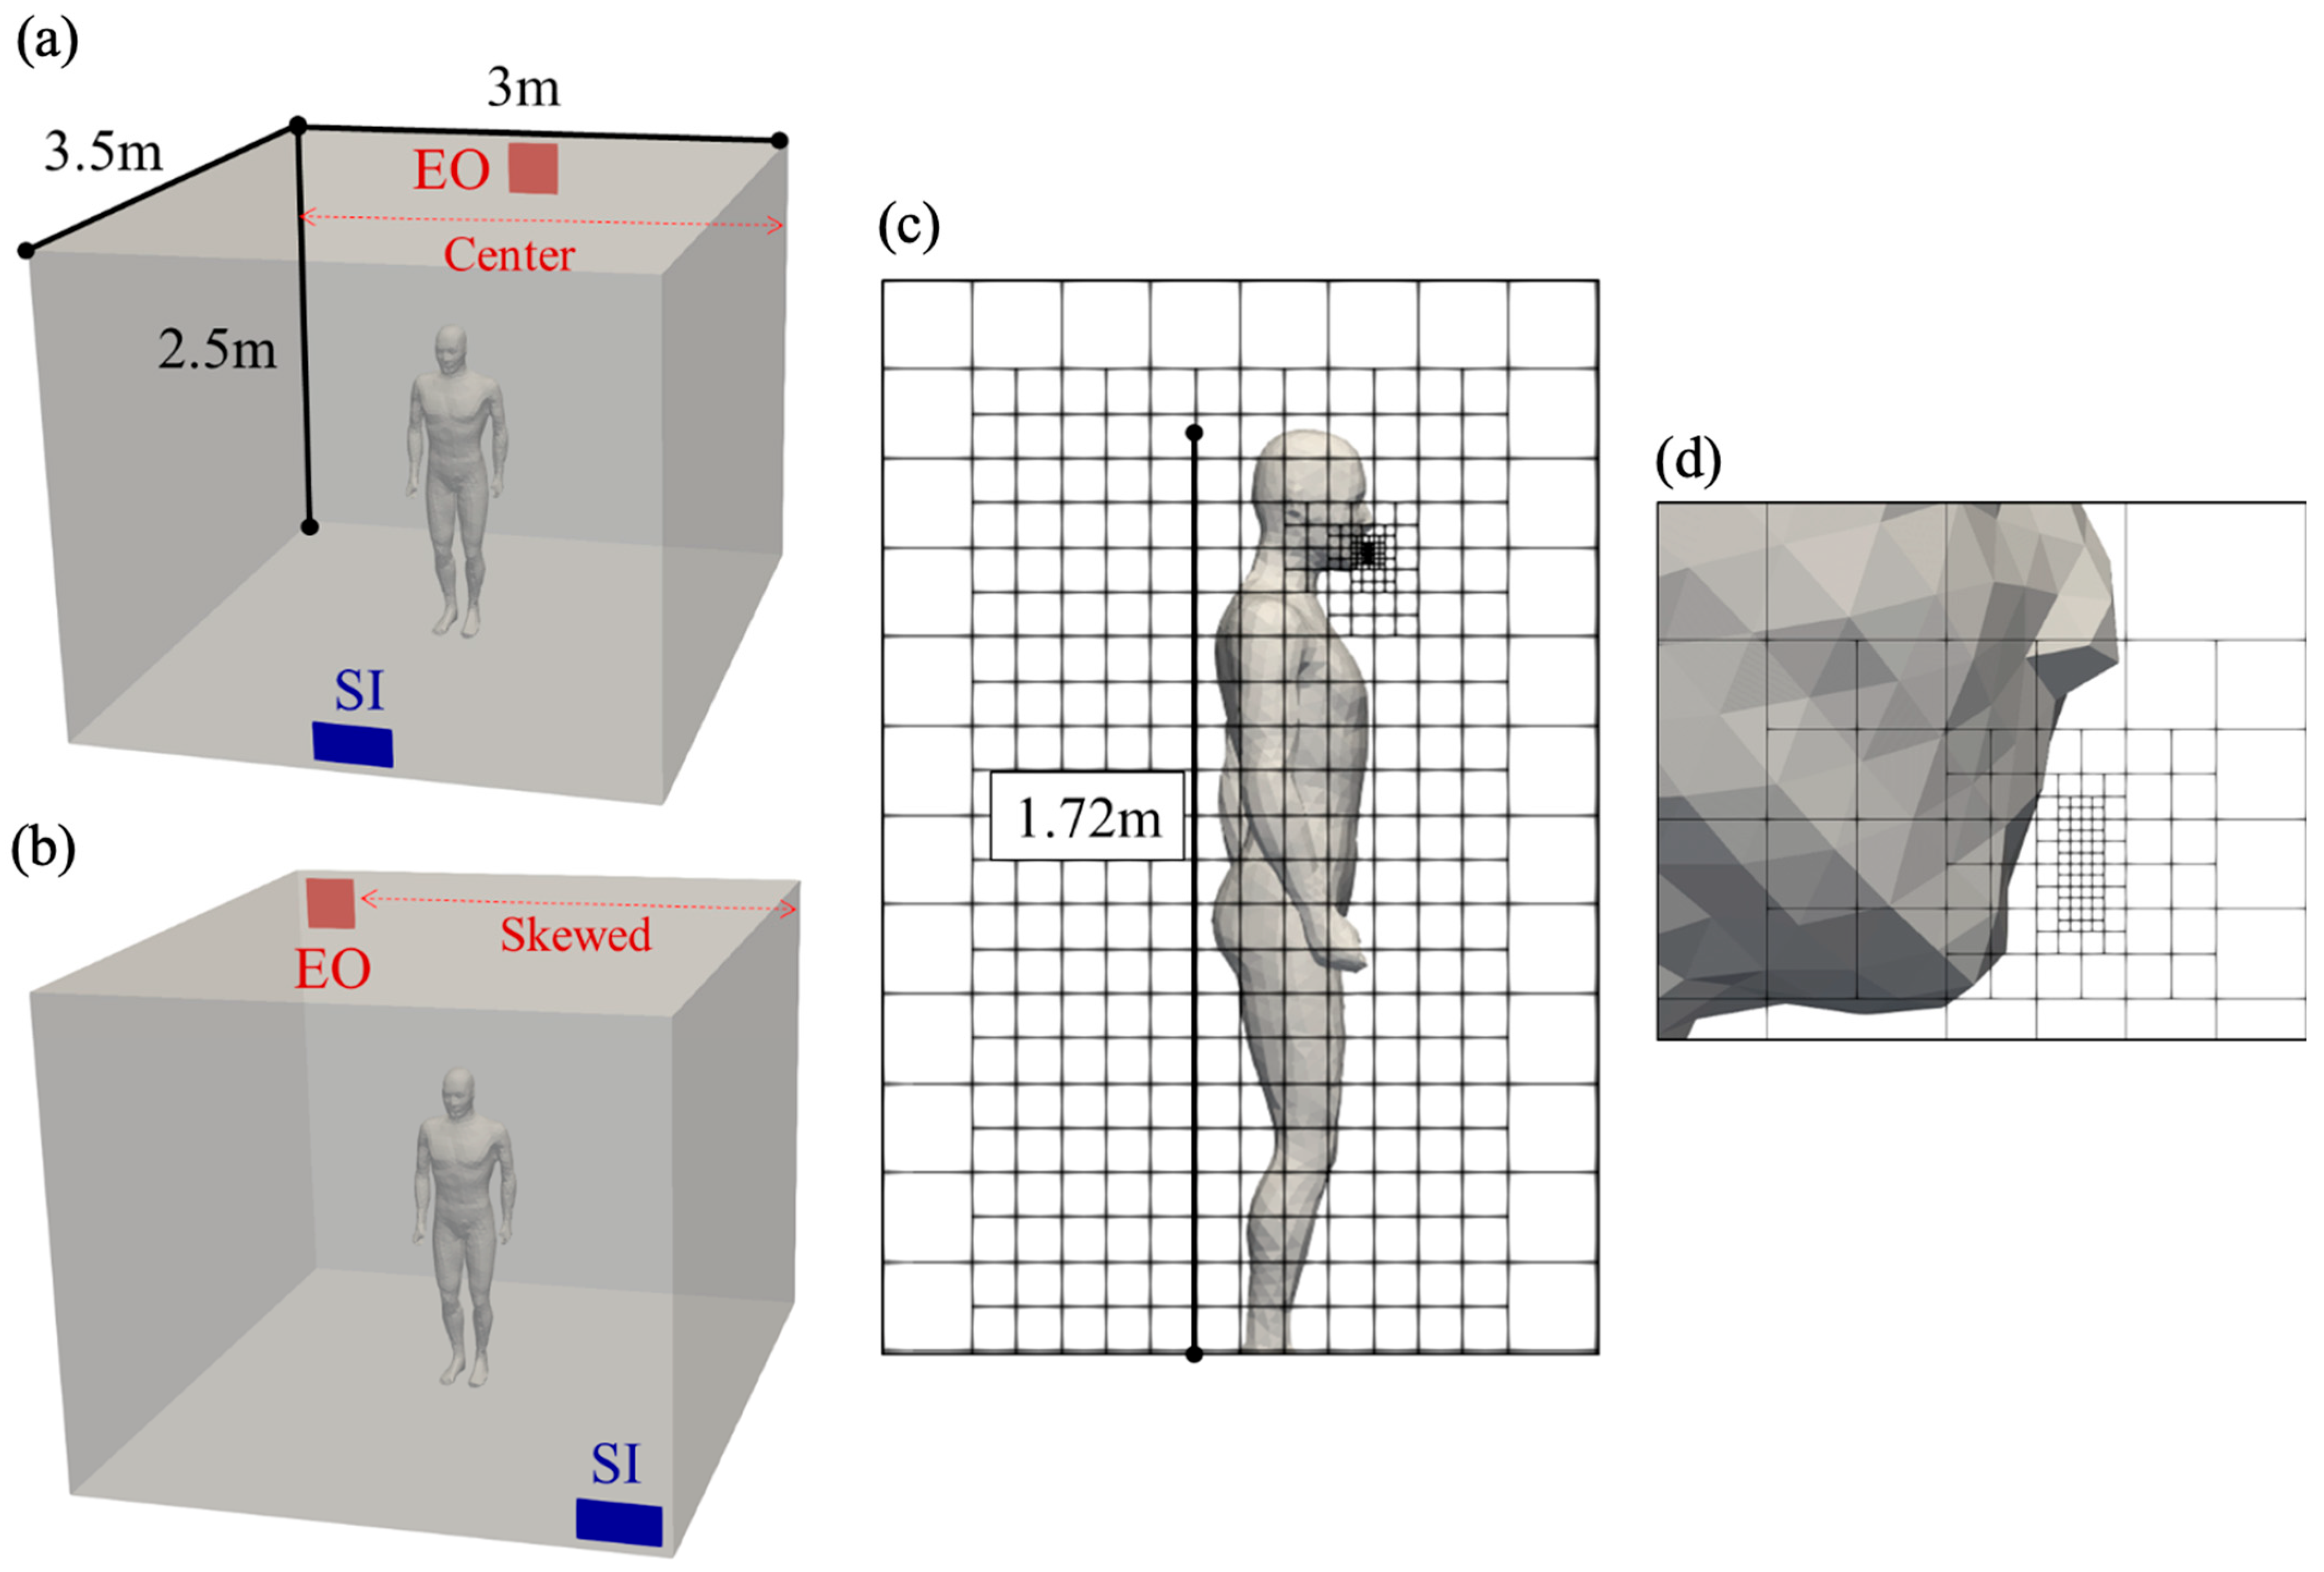
A standing, virtual manikin [33] was introduced in the middle of the room as a heat and contaminant source, as depicted in Figure 2a,b, where SO and EO denote air supply and exhaust openings, respectively. Two cases in terms of supply/exhaust opening positions have been considered to study the non-symmetric introduction and removal of fresh air into the room: (1) a centered distribution as in Case 1 (Figure 2a) and (2) a skewed distribution as in Case 2 (Figure 2b). The air supply opening had a transversal area of 0.08 m2, while the exhaust opening was 0.09 m2.
An immersed boundary (IB) method was used to model all geometries, which were “immersed” in the fluid. The IB was discretized into Lagrangian marker particles every Eulerian fluid cell with which it intersects [36,37,38]. The Roe scheme was used in the advective term to introduce numerical diffusion [25]. The numerical dissipation of the Roe-scheme [25] used for the convective fluxes in our solver enable us to carry out implicit large eddy simulations (ILES) [25].

2.5. Mesh Design and Boundary Conditions

The Building Cube Method (BCM) was used to discretize the Eulerian computational domain into blocks, known as cubes. These cubes were further subdivided into finer cubes, with better resolution, such as around IB, as shown in Figure 2c,d. The BCM mesh subdivided all cubes into identical cells, resulting in identical computational loads for both coarse and fine cubes, making the domain decomposition straightforward for parallel simulations. Further details can be found in the work of Nakahashi and Kim (2004) [39].
The initial room temperature was set at 22 °C, and the humidity was set at 60% to simulate wide geographical conditions for indoor spring, spring-to-summer transition, and summer. Human skin temperature, mouth temperature, and mouth humidity were 28 °C, 29 °C, and 95%, respectively, considering a lightly clothed person. The minimum ventilation rate considered was 0.01 m3/s according to the requirement of 10 L/s per person suggested by ASHRAE [40]. Thereafter, airflow rate was increased to 0.02, 0.04, and 0.06 m3/s for each case, resulting in a total of eight scenarios to study how increasing the ventilation rate affects the concentration of respiratory pathogens and exhaled CO2 concentration. Corresponding to the flow rate of 0.01 m3/s, the flow velocity at the supply inlets was 0.25 m/s, which increased linearly with the flow rate, reaching 0.75 m/s when the flow rate was 0.06 m3/s. Similarly, the air velocity at the exhaust outlet was 0.1111 m/s and 0.67 m/s for flow rates corresponding to 0.01 m3/s and 0.06 m3/s.
To ensure that the statistics of the simulation results are reliable, the cases with the lowest flow rate were run to ensure at least one full air exchange. As all the simulations carried out up to the same physical end time, the cases with higher flow rates had proportionally more air exchanges. Furthermore, to ensure that the simulations reached a steady state, the invariance of the thermal stratification was ensured.

2.6. Validation

This study used an implicit LES solver with a minimum cell size of less than 2 mm near the mouth of the virtual manikin, 32 mm near the virtual manikin, and 64 mm in the room in all cases, for a total of roughly 71.37 million Cartesian elements. High-performance computing was used to ease the computational burden.
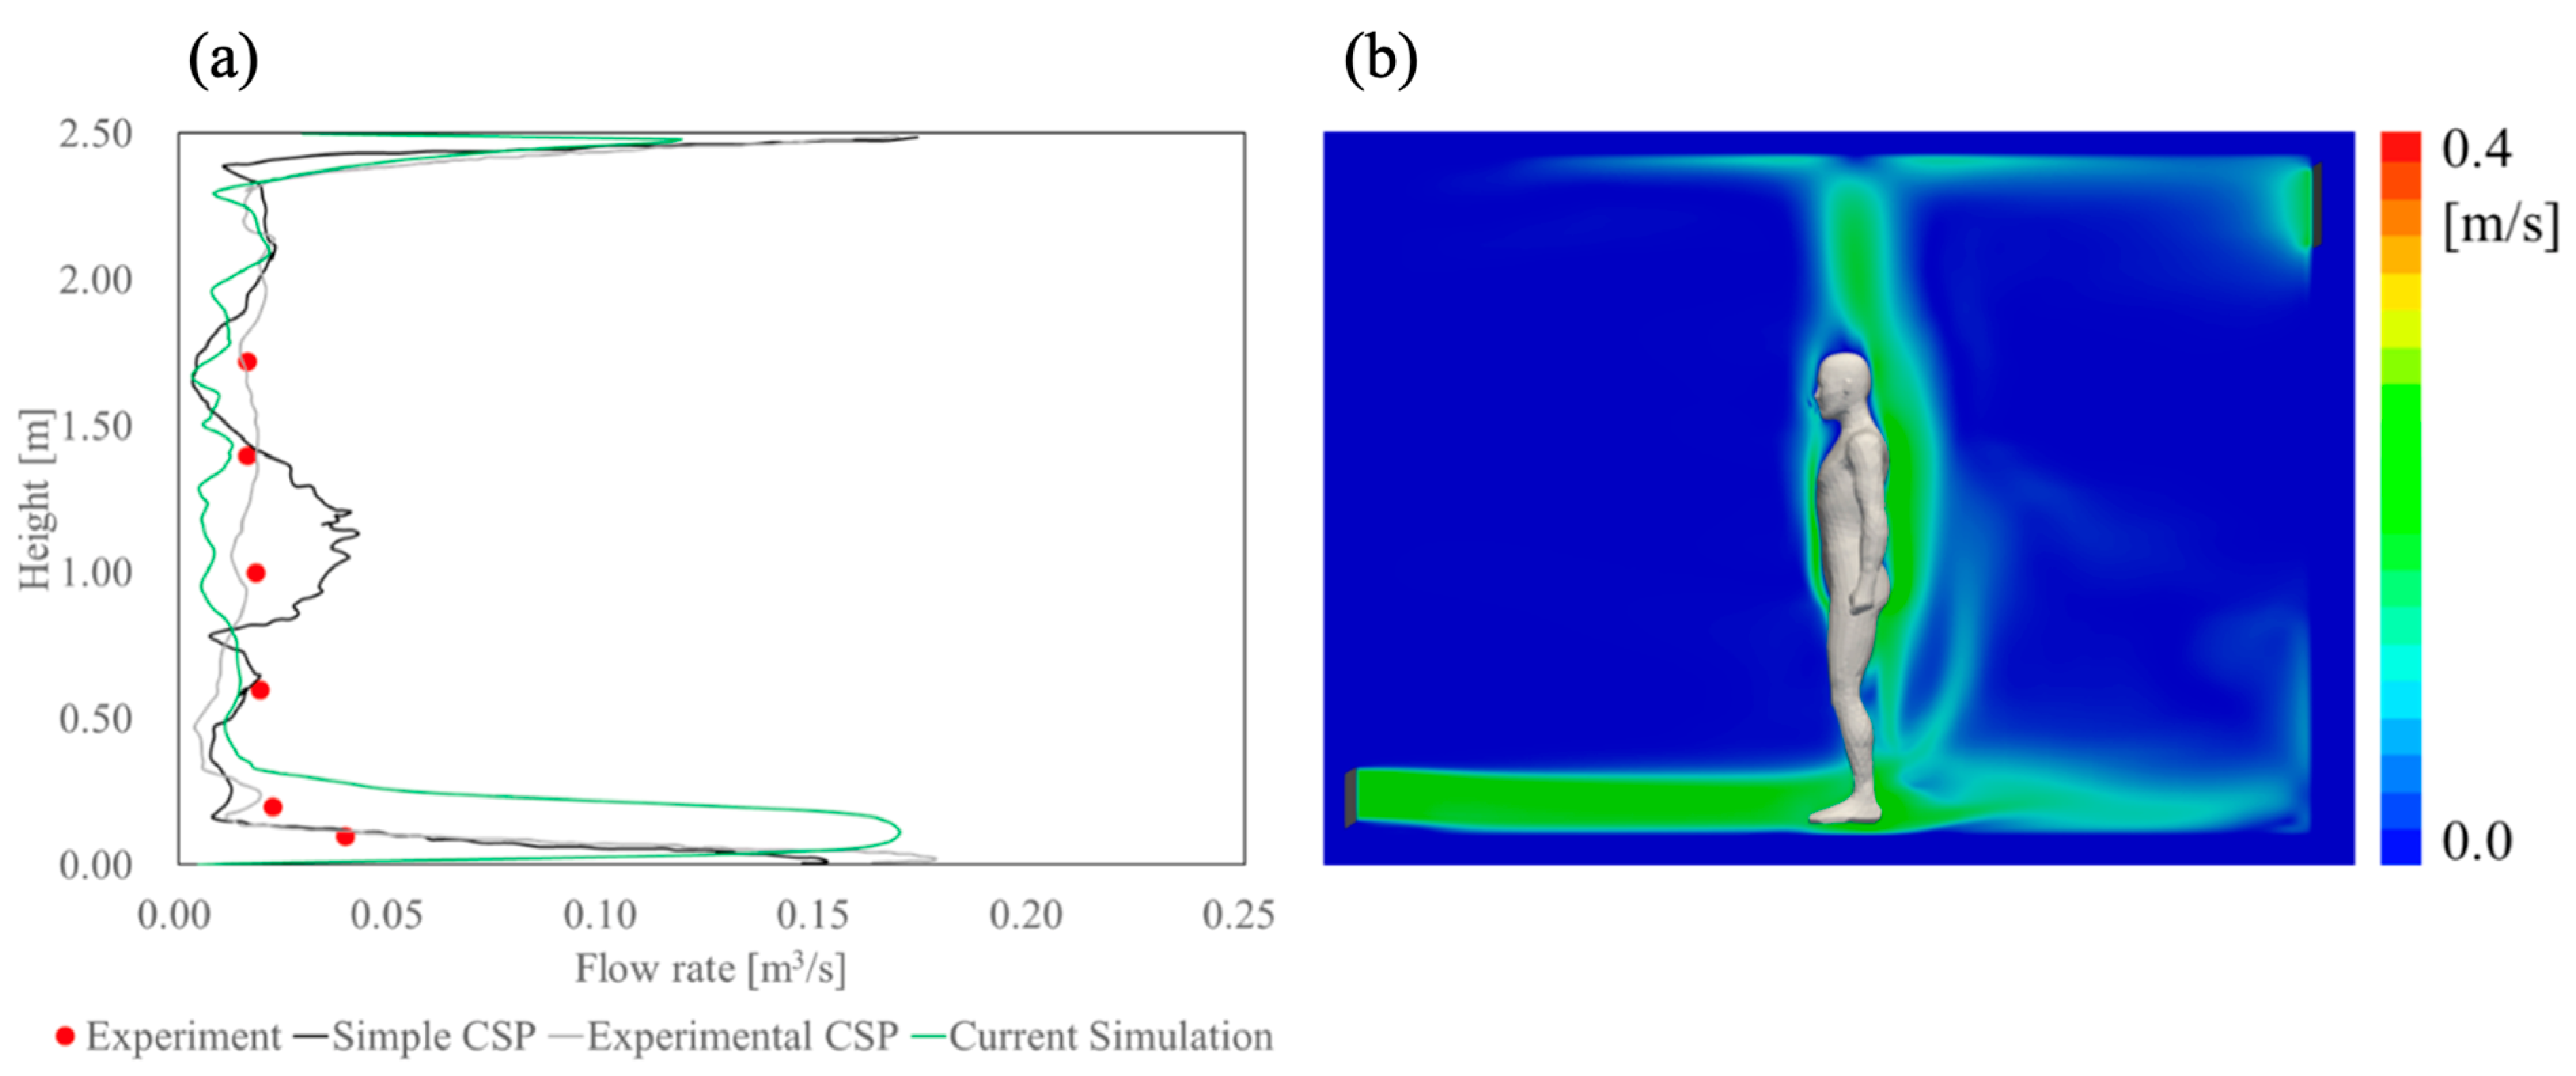
Prediction accuracy of the flow inside the room was confirmed by comparing the present results to previously reported numerical data by Deevy (2006) and Yoo and Ito (2022) [41,42]. Results were also compared to those of Nielsen et al., who reported experimental velocity measurements in an environmental chamber with a thermal manikin [43]. Figure 3 summarizes the comparison of the velocity profile for line L1 (Figure 1a), centered in front of the virtual manikin at (X, Y) = (1.5, 0.2) m. Good concordance between the published experimental data reported by Nielsen et al. (2003) [43], the simple virtual manikin geometry, the complex virtual manikin geometry reported by Deevy 2006 [41] and Yoo and Ito (2022) [42], and the current simulation results was confirmed. The found discrepancies can be explained due to the geometrical differences between the thermal (experiment) and virtual manikins (simulations). This benchmarking aimed to predict the accuracy of the flow field because it determines the transport of respiratory contaminant—either particles or gas-phase—in indoor spaces.

3. Results

3.1. Indoor Flow, Temperature, and CO2 Fields

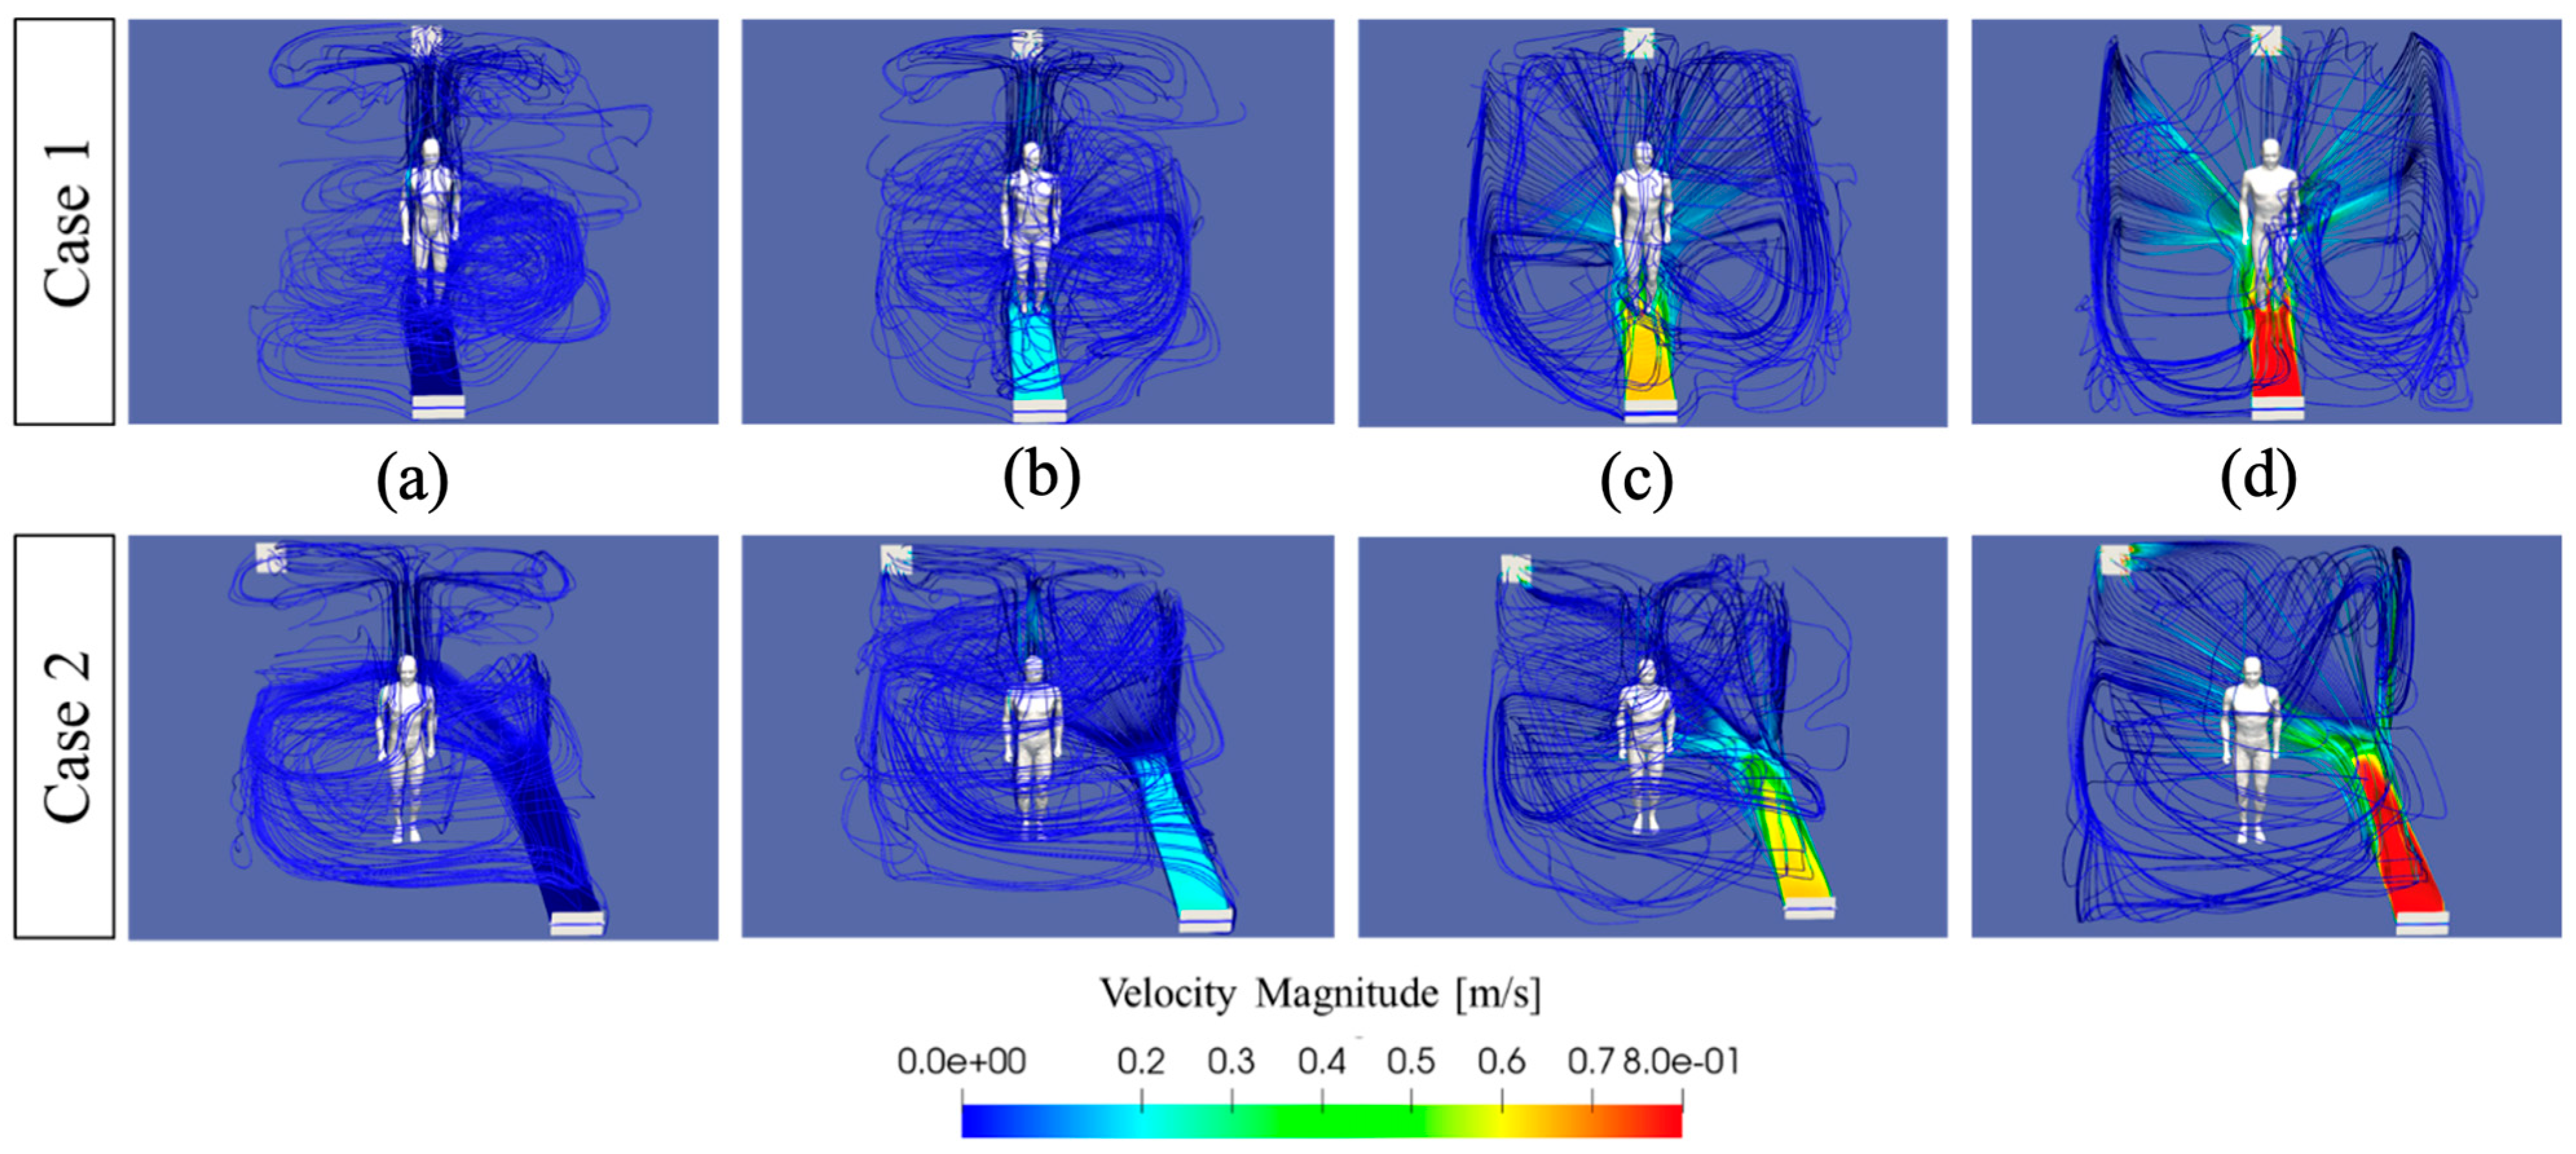
Figure 4 shows the streamlines of airflow around the room occupant for Case 1 and Case 2 under all ventilation rates, where the non-uniformity of the velocity distribution could be confirmed. Here, blue streamlines represent velocities close to 0 m/s, where air is mostly stagnant, and red streamlines show high velocities up to 0.8 m/s, portraying zones with high air movement. The virtual manikin, or occupant, acts as an obstacle to the airflow while the heat emitted from the occupant contributes to the buoyancy effects in the domain. The air supplied by the SO enters the room in a horizontal jet, which strengthens as the ventilation rate increases. Two trends of flow were revealed for both the centered and skewed openings distribution. The first trend is seen for the ventilation rates 0.01 m3/s and 0.02 m3/s. In case 1, the inflow jet impinges on the occupant’s feet and partially gets entrained in the occupant’s vertical plume, rising up, while somewhat getting dispersed behind the occupant. The mechanism in Case 2 is markedly different due to the staggered location of the SO. The unobstructed inflow jet impinges on the rear wall, which then creates a room-wide swirling, gradually twirling toward the occupant and merging with the vertical thermal plume. The vertical plume in both Case 1 and Case 2 splits horizontally after reaching the ceiling, partly exiting through the EO. When the ventilation rate is 0.01 m3/s and 0.02m3/s, the strength of the plume is relatively higher compared to the higher ventilation rates.
The second trend is seen for the higher ventilation rates of 0.04 and 0.06 m3/s. Due to the higher velocity, the inflow jet, not being significantly disturbed by the feet of the occupant, continues unimpeded to the rear wall in Case 1. Again, due to higher flow rate and velocity, the flow reflected from the rear wall destructively interacts with the thermal plume of the occupant, lowering the plume’s intensity. While the mechanism of the inflow jet reflection at the rear wall is different, the destructive interference with the thermal plume is partially similar. Another key characteristic of the second trend is that part of the flow reaching the rear wall gets directed/sucked toward the EO, creating a short-circuit flow where part of the injected directly exits the room without interacting with the occupant or the fluid in the upper regions of the room. The higher velocities in the domain increase draught sensation and break the thermal stratification, a key factor for displacement ventilation, as seen in the following sections.
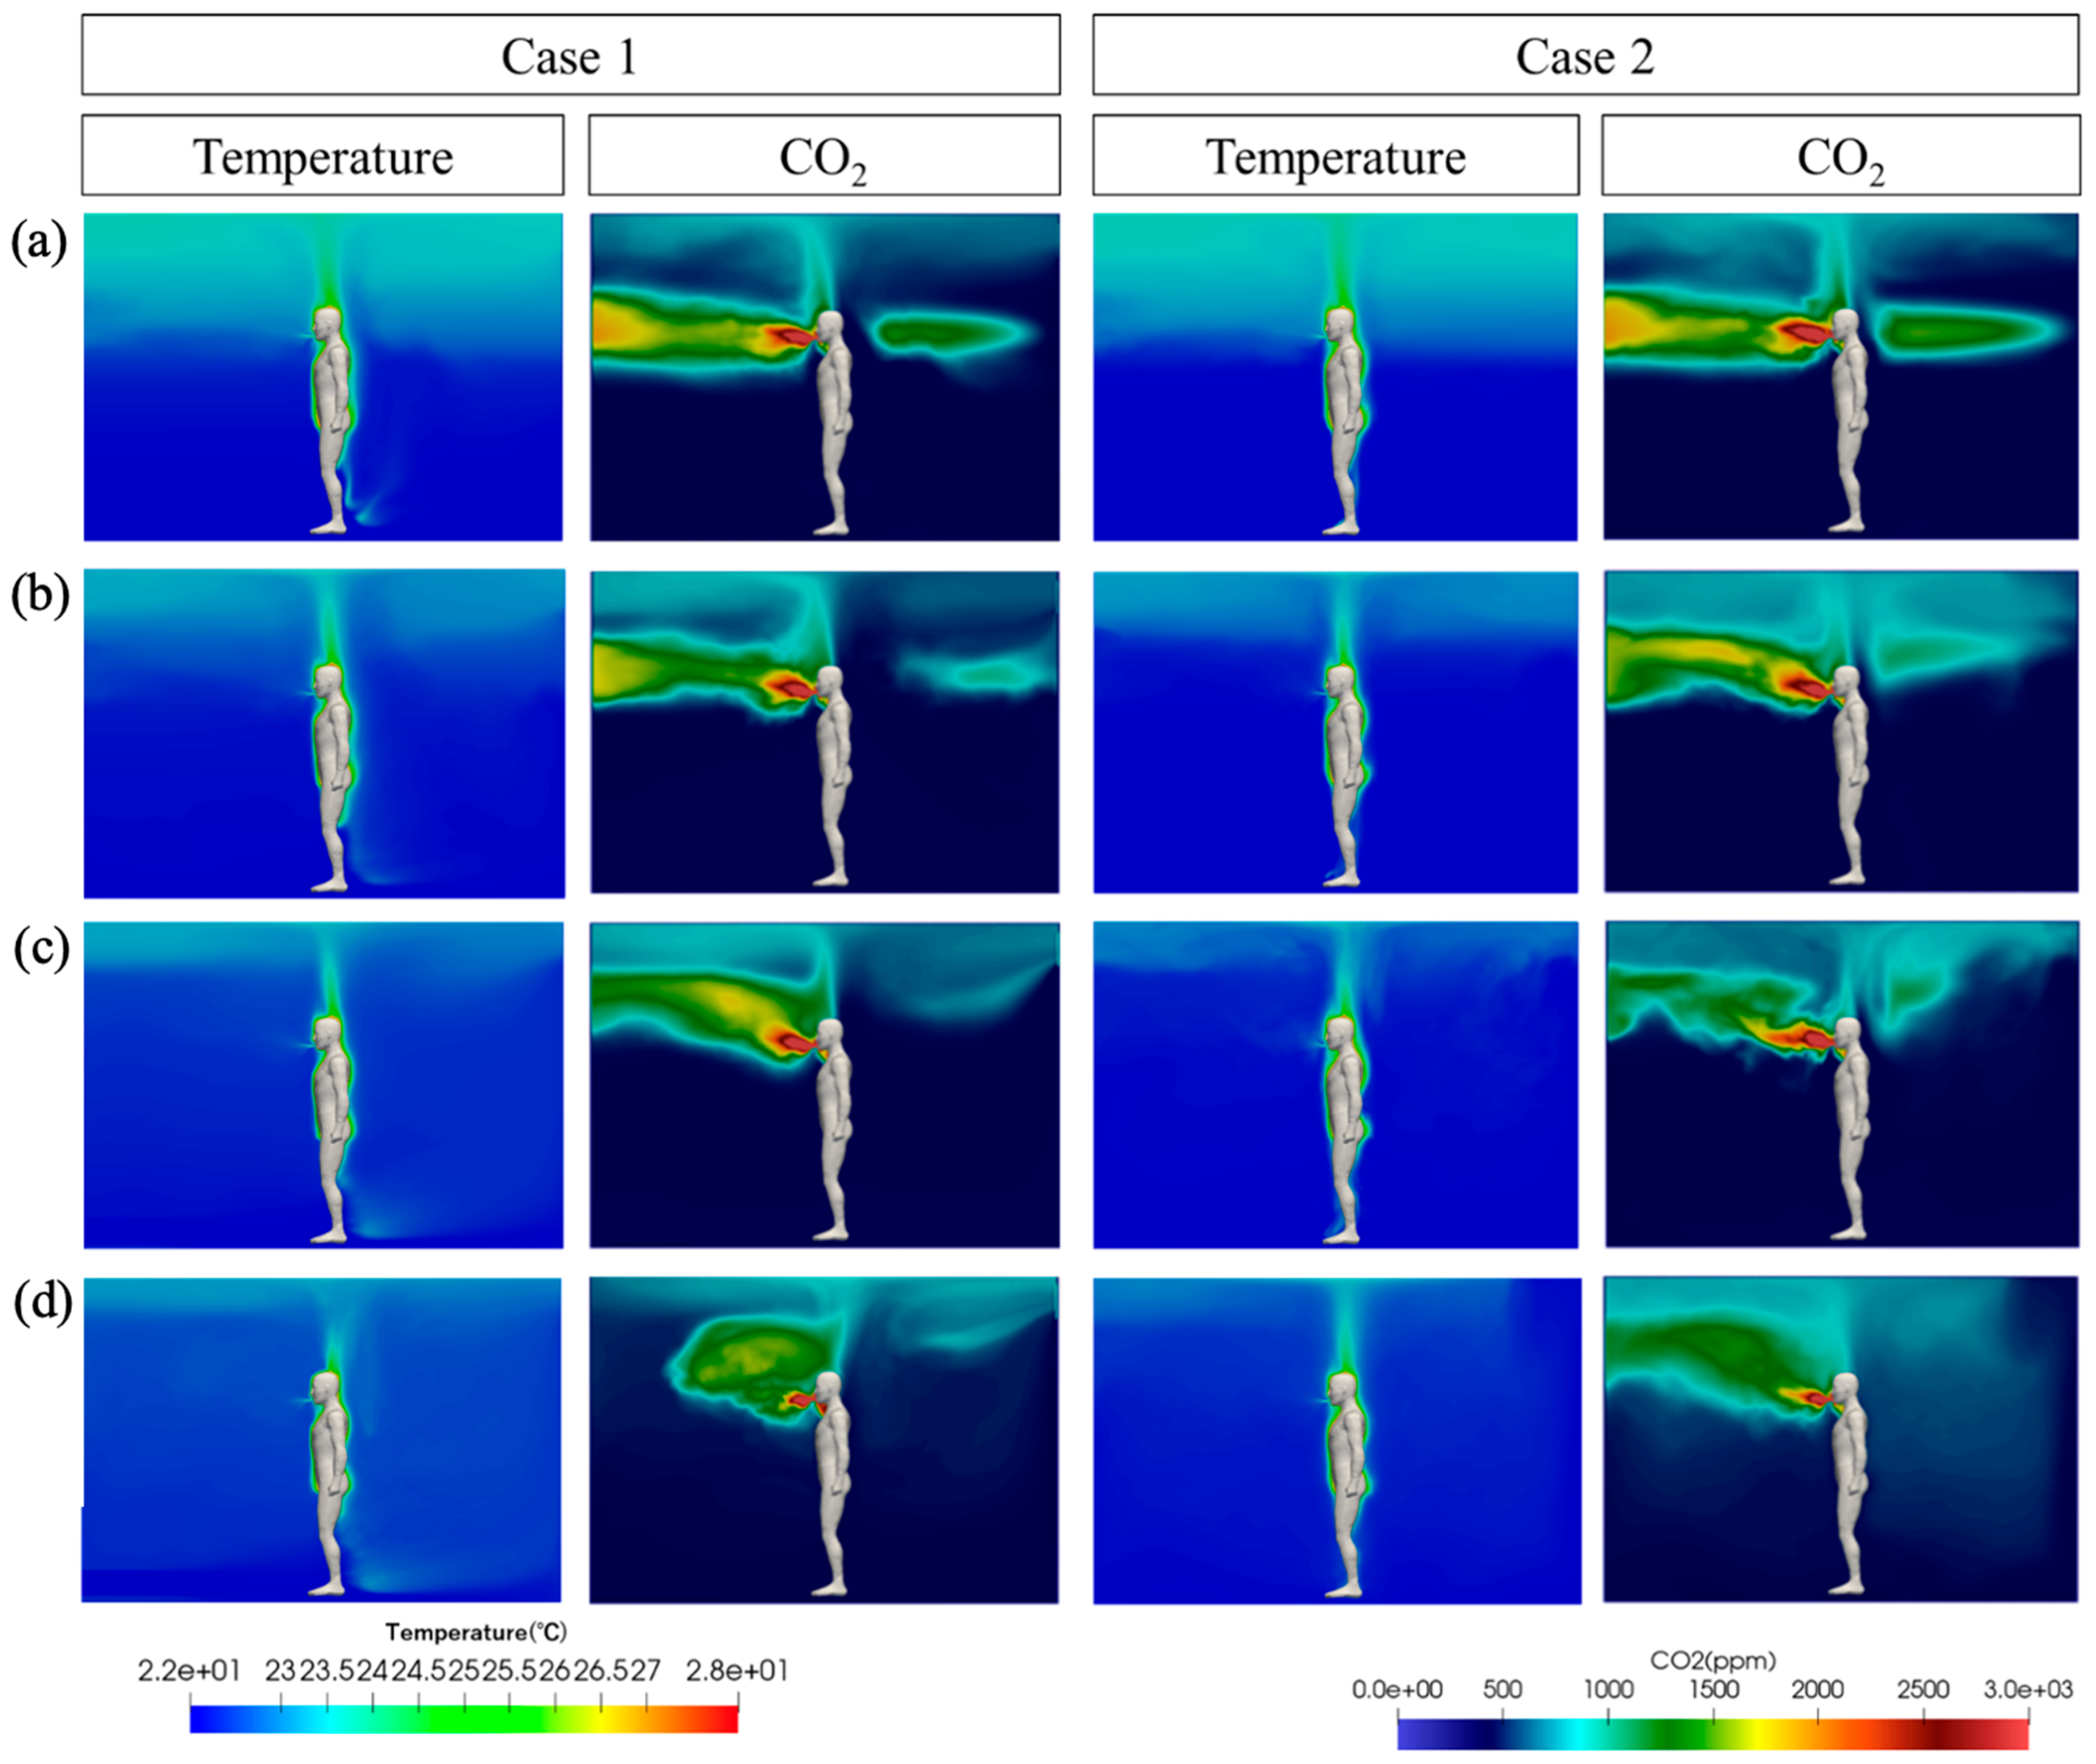
Figure 5 presents the temperature and CO2 distributions on the sagittal plane for Case 1 and Case 2 under all ventilation rates, from 0.01 m3/s (a) to 0.06 m3/s (d). To portray temperature, contours have been colored from blue, representing the lowest in the room at 22 °C, to red, signifying 28 °C, body surface temperature near the virtual manikin. The supply air entered the room at the same temperature, creating an almost uniform distribution in the lower zone. This air was primarily moved and heated by the thermal plume emitted from the occupant, moving upward and above the virtual manikin, as especially seen in Figure 5a,b, where the ventilation rate was lowest. A strong temperature stratification, characteristic of a displacement system, is formed when low values of airflow rate are used, i.e., 0.01 m3/s and 0.02 m3/s. On the other hand, the thermal stratification becomes weaker as the inflow air becomes stronger due to the increase in ventilation rate, as seen in the cases of 0.04 m3/s and 0.06 m3/s, creating a more uniform temperature distribution and transitioning the ventilation type from displacement to mixing ventilation.
The thermal plume due to the occupant, visible in the visualization plane, becomes less pronounced as the airflow rate increases for both cases, but especially for Case 1, where the occupant is directly in the path of the supply-exhaust flow path. Because the supply air was injected at room temperature, the lowest temperature near the feet of the occupant remains at 22 °C while the region near the head reaches 25 °C, keeping the thermal difference within 3 °C. However, according to Yuan et al. (1999), a cool-air sensation might be felt by the occupant when this difference is present [44].
The CO2, ppm distribution on the same sagittal plane for Case 1 and Case 2 under all ventilation rates is also shown. Here, contour distributions show values from 0 ppm (in blue) to 3000 ppm (in red) due to mouth exhalations. Differences between Case 1 and Case 2 show the impact of SO and EO location on CO2 transport within the room. A high concentration in front of the occupant due to respiratory activities was found in all cases. As the airflow rate increases from 0.01 m3/s to 0.02 m3/s and 0.04 m3/s, the CO2 cloud changes direction from horizontal to a vertical trend and accumulates above the head of the occupant. This phenomenon occurs when a pollutant source—in this case, the exhaled air from the occupant’s mouth—is also a heat source, as confirmed by the concordant temperature and CO2 distributions in Figure 5, and the contaminant flows from the lower to the upper zone via thermal plumes, creating a clean “occupied” zone [45]. However, a “lock-up” effect, where the contaminants stay in the occupied zone, not crossing the interface to the upper area, occurs when the airflow rate is increased to 0.06 m3/s. As thermal stratification is lost, the CO2 is no longer captured by the thermal plumes, resulting in a horizontal dispersion of the pollutant at lower heights in a mixed distribution, as seen especially in Figure 5d (Case 2) and explained in the following section.

3.2. Transition from Displacement to Mixing Ventilation

As previously reported by Yang et al. (2021) [46], the transition from displacement to mixing ventilation can be explained by examining the kinetic energy due to the inflow, E k = 1 / 2 u 2 , and potential energy resulting from stable stratification, within the domain.
E p = β T g d T / d z m a x ( H ω h ) 2
Here, u is the air supply velocity, β T is the thermal expansion coefficient, g is the gravitational acceleration, H is the total room height, ω is the height of EO and h is the height of the clean zone.
Figure 6 compares the residual potential energy E p and kinetic energy E k for all studied flow rates in Case 1 (a)) and Case 2 (b)). When the flow rates were 0.01 m3/s and 0.02 m3/s, thermal stratification was strong and air supply was weak, resulting in higher potential energy for both Case 1 and Case 2. In contrast, when the flow rate was increased to 0.04 m3/s and 0.06 m3/s, the influence and strength of the supply jet increased progressively, eventually disrupting the stratified layer near the outlet. This led to the kinetic energy growing larger than the potential energy. At higher flow rates (0.04 m3/s and 0.06 m3/s), further increases did not thin the upper stratified layers but, instead, introduced excess kinetic energy, shifting the ventilation mode from displacement ventilation with stratified layers to traditional mixing ventilation, where the indoor flow is dominated by the supply jet. The precise flow rate at which this transition occurs was not determined in this study, but the results suggest short-circuiting of the ventilation system at around 0.03 m3/s. Furthermore, while Yang et al. (2021) [46] indicated that this short-circuiting threshold—as well as the overall residual potential and kinetic energy values—depend greatly on the positions of the supply and exhaust openings, the present study found no significant differences between the centered configuration in Case 1 (Figure 6a) and the skewed configuration in Case 2 (Figure 6b). This suggests that the position of the supply and exhaust openings might have less impact than room layout and opening size due to their direct relation to flow rate and orientation. However, further research is needed in this aspect.

3.3. Impact of Increased Airflow Rate on Volume-Averaged CO2

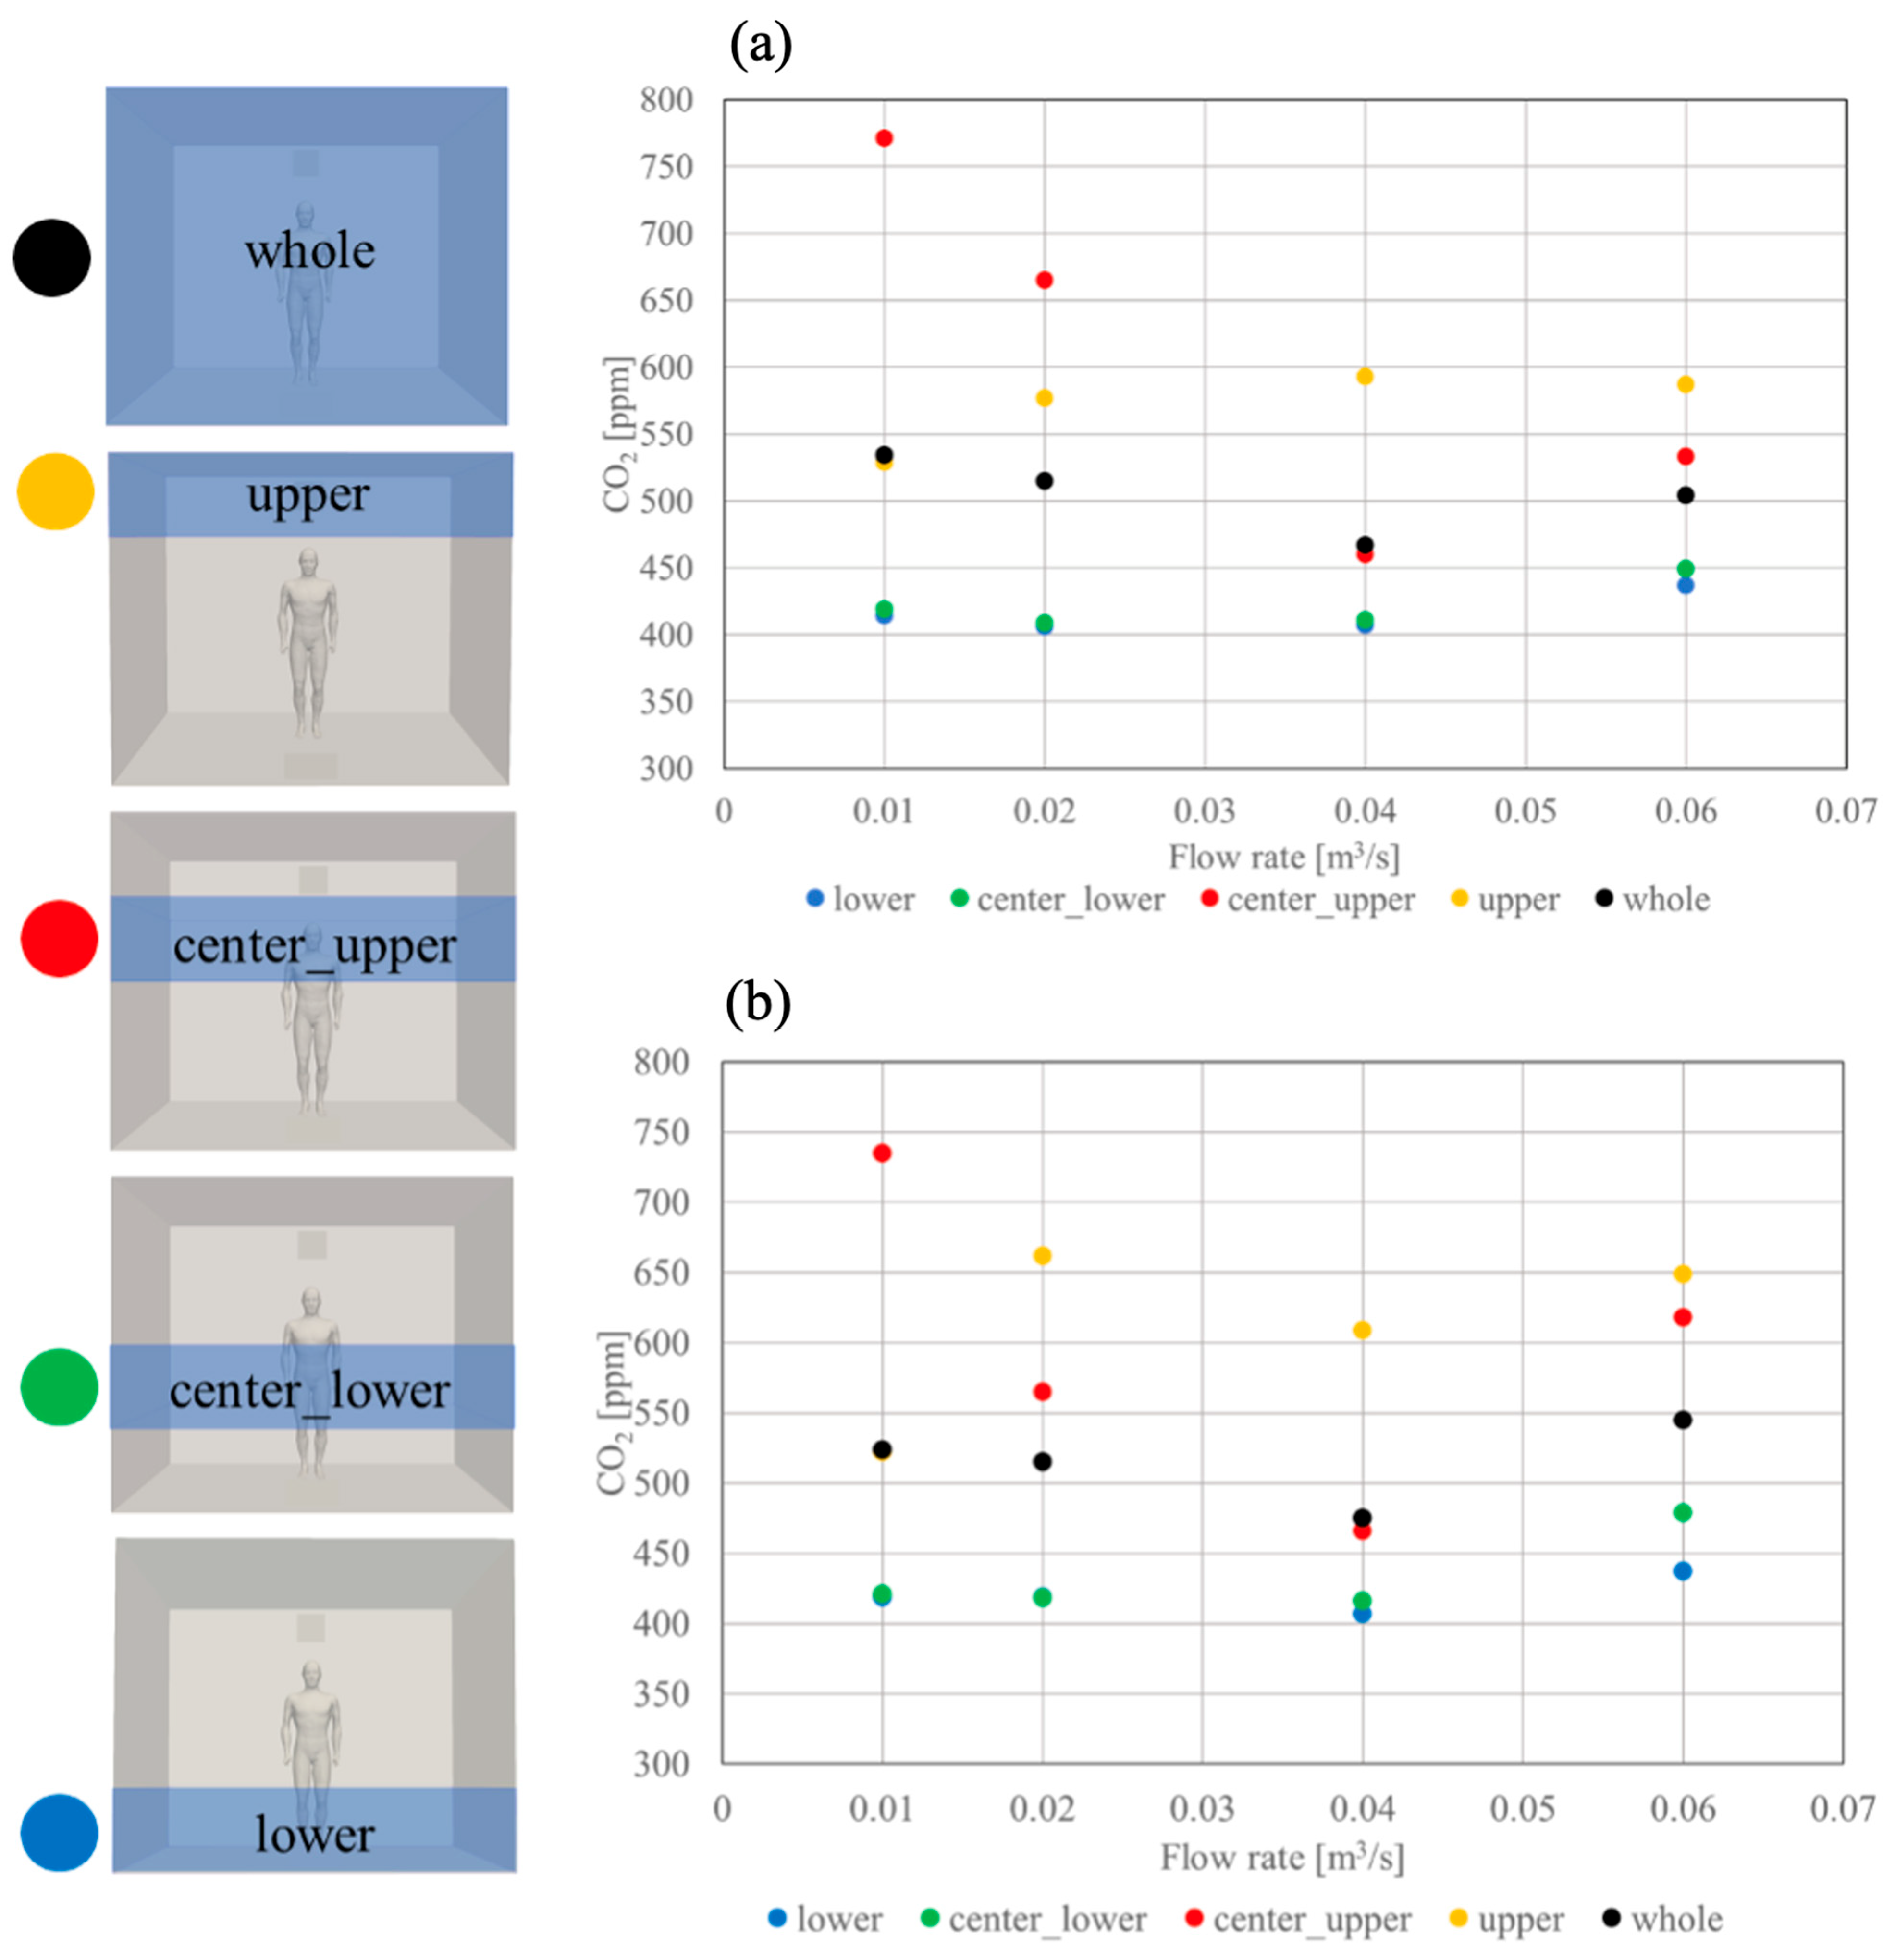
To understand which parts of the room offer greater protection in a displacement ventilation system, we examined volume-averaged CO2 levels in several regions of interest and tracked how these levels evolve as the supply flow rate increases. The 5 evaluation zones are shown in Figure 7, and CO2 concentrations for Case 1 and Case 2 (Case 1 in panel (a), Case 2 in panel (b)) are also summarized in the same figure. The rationale behind the choice of the evaluation regions follows below.
Center lower and center upper zones: These correspond, respectively, to the breathing zones of seated and standing occupants. Since human exposure is tied directly to the CO2 concentration in these occupied layers, monitoring these zones provides a first-order indication of relative safety.
Lower and upper layers: By separately tracking the “lower” and “upper” portions of the room, we capture the effect of the stratified temperature layers characteristic of displacement ventilation. A strong stratification tends to trap contaminants (e.g., exhaled CO2) in upper layers, leaving the lower breathing zone relatively clean.
Whole-room average: Including the volume-averaged CO2 over the entire enclosure offers a completeness check, ensuring that localized trends are consistent with the overall ventilation performance.
At low flow rates (0.01 and 0.02 m3/s), the center upper region exhibits the highest CO2 values among all zones, reflecting accumulation in the upper stratified layer when the supply jet is too weak to disrupt it. The whole-room average is also elevated, though somewhat moderated by the cleaner lower layers. As the flow rate increases toward ~0.04 m3/s, CO2 in the center, upper, and the whole-room average drops steadily. This decline indicates that the supply jet is gaining enough momentum to thin the stratified layer: exhaled CO2 in the upper zone is progressively entrained and removed more effectively. Beyond ~0.04 m3/s, however, both the center upper and whole-room averages begin to rise again. This uptick signals that the system has crossed from displacement-dominated behavior into a transitional or mixing regime, in which the stratification starts to break down and contaminants are more readily mixed back into the breathing zones.
Across the low-to-moderate flow range (0.01 to 0.04 m3/s), CO2 levels in the lower and center lower zones remain close to ambient (outdoor) concentrations, showing minimal sensitivity to the increasing flow. In other words, even a relatively weak displacement jet maintains a clean breathing layer for seated occupants. At the highest tested flow (0.06 m3/s), there is a slight rise in CO2 in these lower regions. This marginal increase coincides with the transition toward mixing ventilation: once stratification is sufficiently disturbed, some of the CO2 that would otherwise remain aloft begins to re-enter the lower breathing space.
The CO2 concentration in the upper layer increases with flow rate up to about 0.04 m3/s. This behavior reinforces the notion that, as supply momentum grows, the CO2 accumulated in the upper region is rapidly removed. Past the approximate 0.04 m3/s threshold, further flow-rate increases no longer reduce the upper-layer CO2; instead, the concentration plateaus or even climbs, marking the onset of mixing-like behavior.
Interestingly, despite testing two markedly different layouts of supply and exhaust (centered vs. staggered), the CO2–flow relationships are nearly identical in Case 1 (Figure 7a) and Case 2 (Figure 7b). This suggests that, within the geometry studied, the gross behavior of displacement-to-mixing transition—and the consequent safety implications for seated and standing occupants—is governed more strongly by overall room layout, and flow rates than by small shifts in opening positions.
The results show that for flow rates up to roughly 0.03–0.04 m3/s, displacement ventilation effectively maintains low CO2 in the occupied (lower) regions while gradually reducing upper-layer buildup. This range defines a “safe window” in which stratification works in the occupants’ favor. At 0.06 m3/s, where the flow rate has crossed the displacement–mixing barrier, CO2 concentrations are slightly higher in all zones. Yang et al. (2021) [46] similarly reported an initial rise in contaminant levels after the barrier, followed by a subsequent decline at still higher flow rates—indicating that vigorous mixing can eventually restore cleanliness if flow is sufficiently large.

3.4. Respiratory CO2 Distribution Correlated to Respiratory Airborne Particles

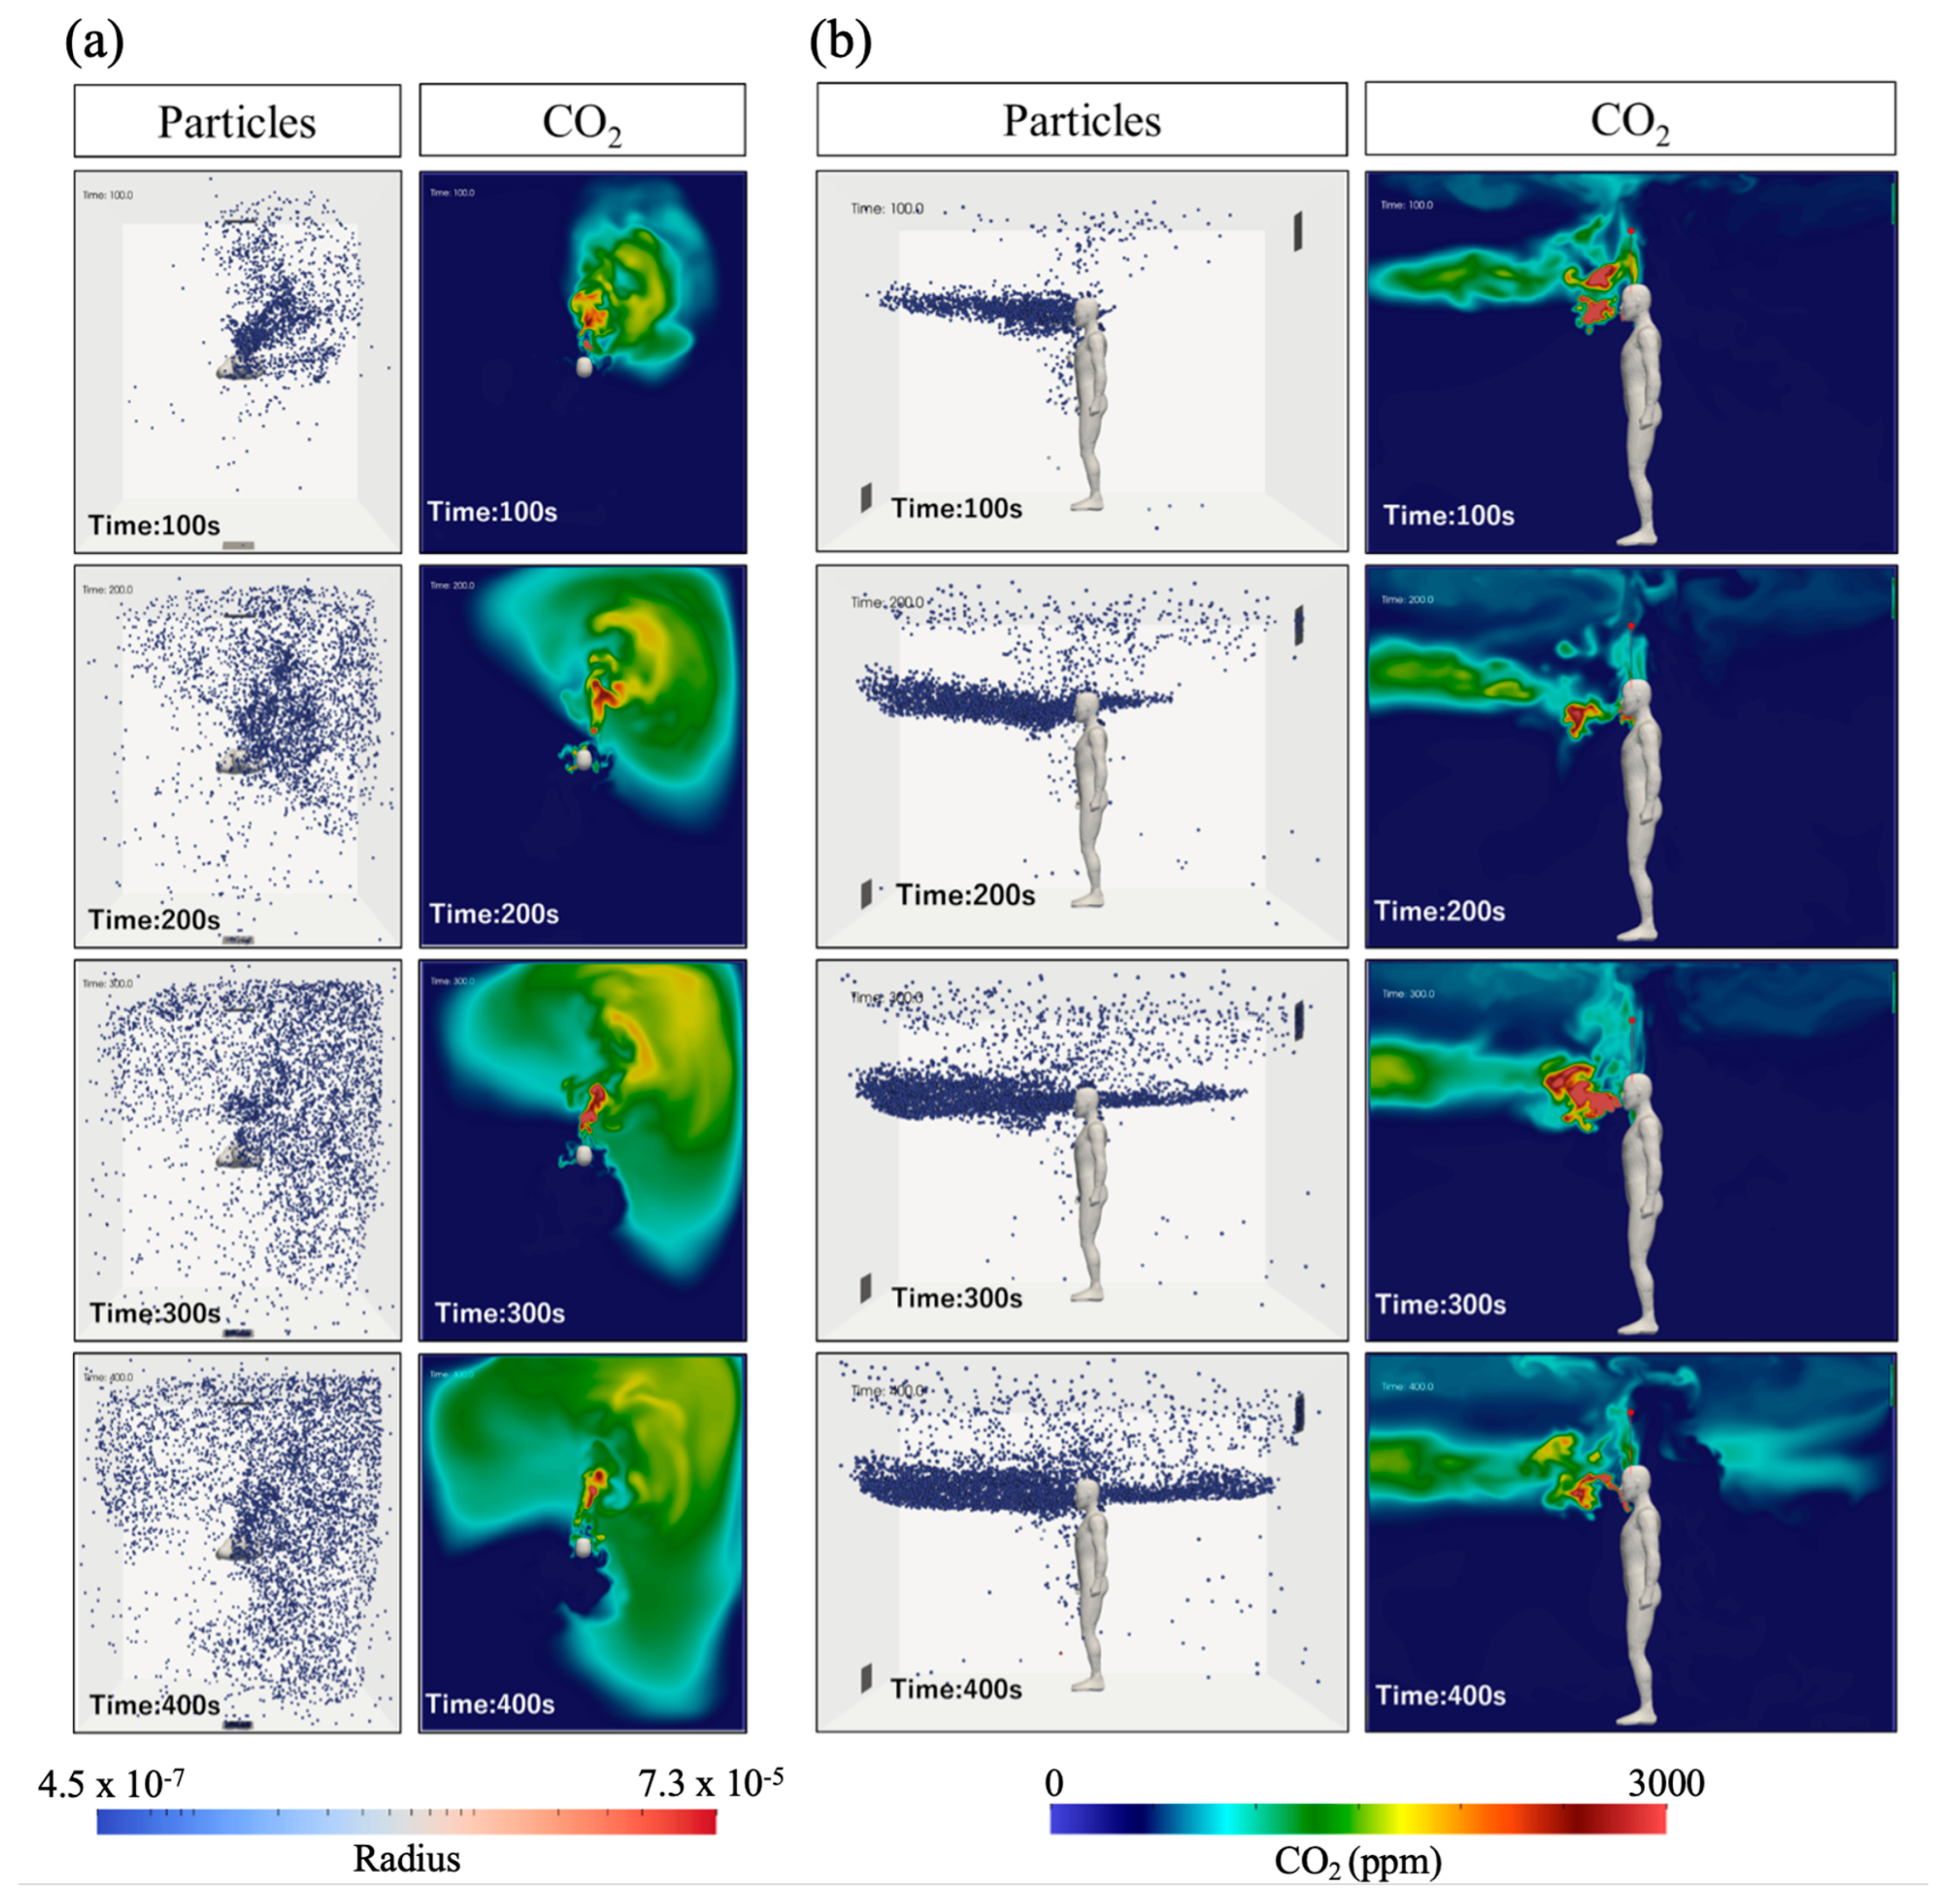
The previous sections have elucidated on the influence of airflow rate on CO2 behavior, highly studied as a surrogate of exhaled droplet nuclei—airborne particles in this article—for transmission risk in the built environment [47,48,49]. However, a correlation between CO2 concentration and airborne particle distribution has yet to be made, although some volume-averaged values have been studied by Kappelt et al. [50]. Aiming to increase the knowledge of this relationship, Figure 8 shows airborne particle distribution over time and the corresponding CO2 concentrations at a horizontal plane (1.5 m above the ground, talking level) (Figure 8a) and the sagittal plane (1.5 from the right wall with respect to the virtual mannequin) (Figure 8b) when the flow rate was 0.02 m3/s for Case 1. These results present detailed information in the room before the short-circuiting point occurs.
Qualitatively, particle dispersion is spatially similar to CO2 distribution, especially in the talking plane (Figure 8a), portraying general pollutant dispersion information at each timestamp. This is particularly true in places with dense particle residence, such as in front of the occupant, where a high CO2 concentration in front of the mouth can be seen because particles were also accumulated due to the respiratory activity. However, in other locations with minimal particle residence, no CO2 concentration was present. Further clarification is shown in the sagittal plane (Figure 8b), where CO2 distribution accurately describes particle dispersion in front of the occupant at talking height due to high particle density. Yet, behind the occupant, where particle residence is less, scarce-to-no information is learned by CO2 distribution. These results indicate that CO2 distribution can be qualitatively correlated to airborne particle distribution in cases of high particle residence, but this correlation is insufficient when particle number is minimal because it does not represent its dispersion accurately enough.

3.5. Respiratory CO2 Distribution Correlated to Airborne Viral Density

An understanding of viral airborne transmission is essential to establish better infection control mechanisms. However, to date, accurate experimental determination of airborne viruses is challenging due to technological deficiencies, although ample samples and detection methodologies are being used [47]. To solve these shortcomings, CFD-resolved aerosol fields, as the ones presented in Figure 8, can be used to estimate viral mass concentration or density, following previous studies that couple size-resolved aerosol transport to viral exposure and infection risk models [48,49,50]. Furthermore, experimental air-sampling studies show that airborne viruses, especially SARS-CoV-2, are commonly reported as RNA copies/m3 based on particle number [49,50].
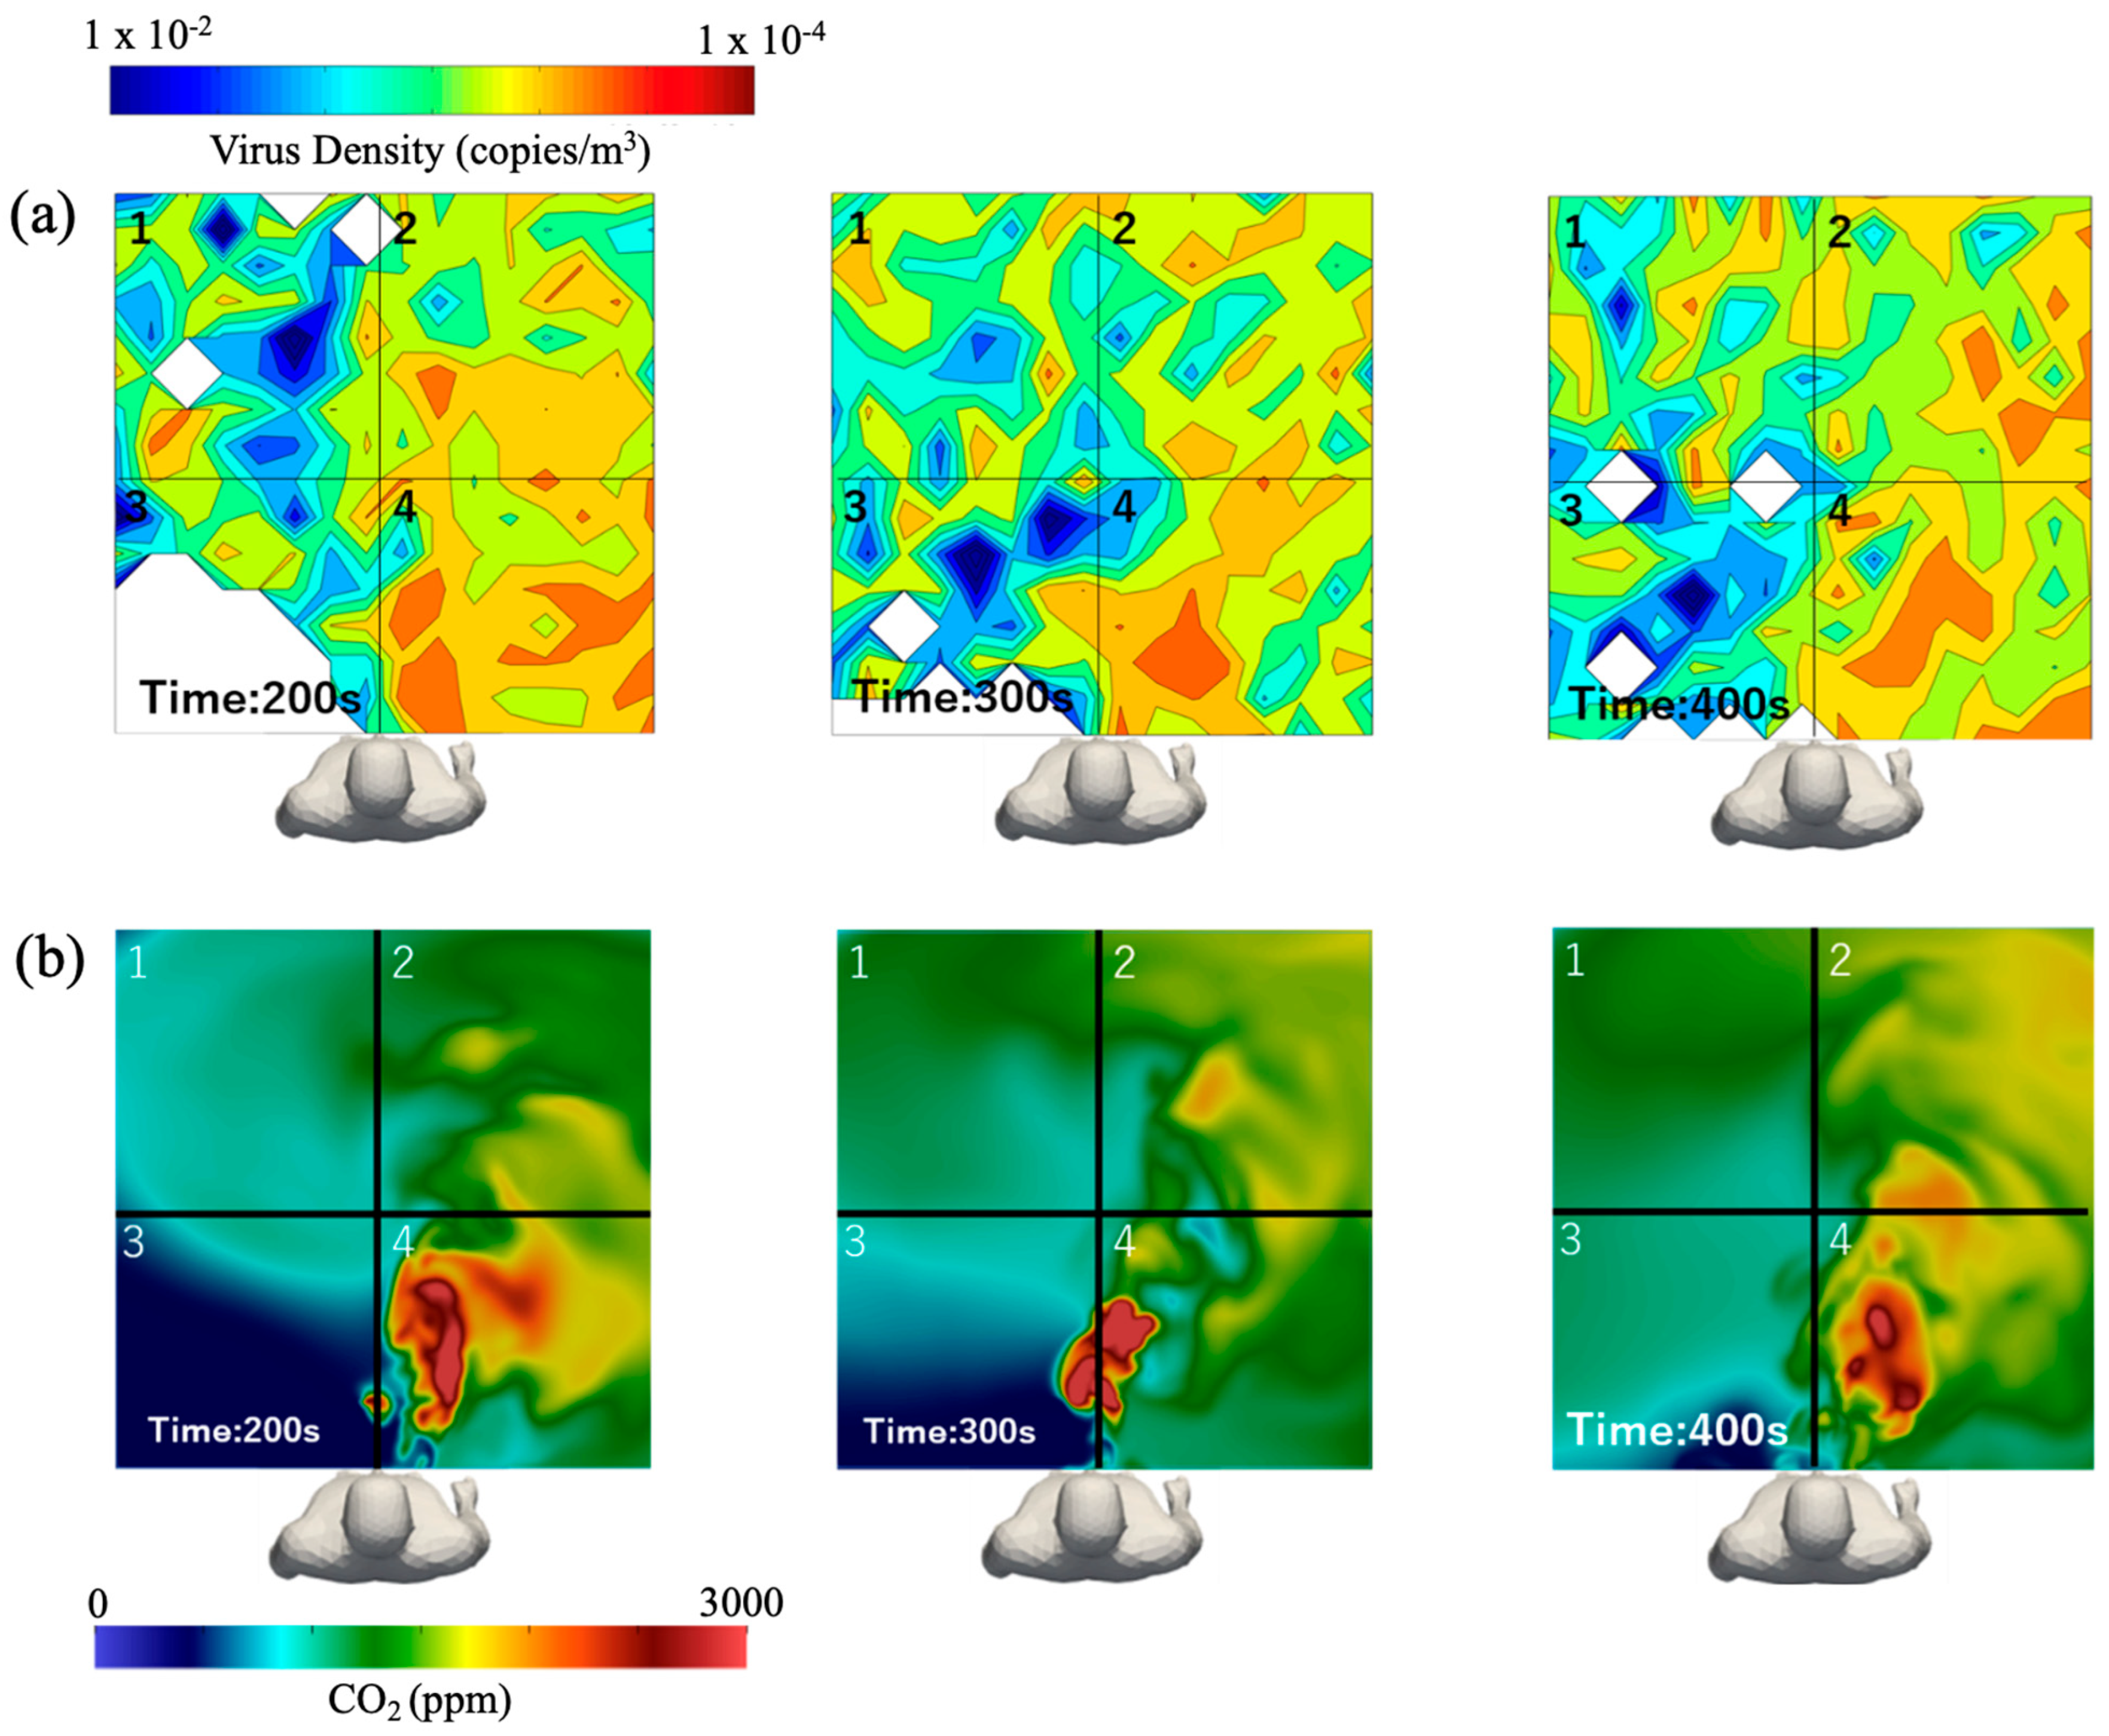
Therefore, this study has calculated virus density for a quantitative analysis, grounded in both experimental and numerical precedent, where virus density was defined as the time-averaged number of viral particles in the immediate talking volume (Figure 9a), as an inhalation risk indicator. This approach provides a bridge between mechanistic aerosol fields resolved by CFD and airborne experimental measurements used in exposure assessments. Here, the immediate talking volume had dimensions of (1.6 × 1.6 × 0.5) meters, centered at the mouth and was discretized into cuboids of volume (0.1 × 0.1 × 0.5) meters to compute the virus density ρ:
ρ = ρ V D ρ s a l i v a ρ p
where ρ V D is the particle density per unit volume within the immediate talking volume (kg/m3), ρ s a l i v a is the virus density within the particles (1013 copies/m3) and ρ p is the mass per unit volume within the particles (1000 kg/m3).
As previously stated, since CO2 is commonly used as a proxy for airborne risk assessment, we evaluated whether its spatial distribution aligns with virus-laden aerosols under the same indoor conditions. Virus density (Figure 9a) was compared to CO2 concentration (Figure 9b) at different timestamps through four regions of interest within the immediate talking zone, numbered 1 to 4, as shown in the figure. Regions 2 and 4 resulted in high virus density because of the increased particle number reported in Figure 8, while regions 1 and particularly 3 had minimal-to-no inhalation risk. When compared to the CO2 results, region 4 showed roughly the same level of infection, given the concentration. In region 2, CO2 also portrayed a similar distribution trend; however, in regions 1 and 3, small distribution discrepancies between virus density and CO2 were evident. Results showed that CO2 concentration can be comparable to virus density and, therefore, inhalation risk due to respiratory activities, when particle residency is high, but this comparison becomes less accurate when particle residence is low.

4. Conclusions

First, this study quantitatively assessed the impact of increasing ventilation rate on contaminant mitigation when using displacement ventilation. We showed that a transition occurs when the flow rate is increased, which directly affects temperature stratification. This transition was numerically explained by the flow kinetic energy surpassing the stratification potential energy. We have also demonstrated that this transition regime affects localized and room CO2 concentration, confirming that after a short-circuit point where the displacement system reaches a mixing state, the increase in ventilation flow rate does not contribute to the decrease of CO2 and therefore does not enhance the removal of indoor pollutants. Then, the claim that increasing the ventilation rate in a room will decrease infection risk made by previous studies becomes untrue in the case of displacement ventilation, where the system must be kept from reaching the transition point in order to be effective. Nevertheless, other parameters such as number of occupants, inlet/outlet location and size, supply temperature, and such should be further studied to completely understand the minutiae of this assertion.
Second, since this study relied on CO2 as a tracer gas to express inhalation risk in a room, we compared the transport physics of viral aerosols and respiratory CO2 to confirm whether the use of CO2 as a proxy indicator for indoor viral particle distribution is indeed a viable option. We showed that, generally, CO2 results can accurately represent viral transmission in the absence of infectious virus sampling, particularly when a high number of respiratory particles are present in a room or a local zone. On the other hand, CO2 underpredicts infection risk when the number of airborne particles is low in a determined volume, which may increase the possibility of transmission when using CO2 concentration as an infection risk indicator.
As a broad implication, since the aerosolized virus and CO2 have the same source, i.e., the human mouth, CO2 can be used as a proxy for viral transmission to provide general ventilation guidelines in a room. However, CO2 prediction may not be enough to predict in detail the processes of respiratory viral infections, and, when possible, infectious viral sampling or particle tracking analysis should be used to indicate infection risk.
Finally, the main limitation of this study is the absence of validation for the simultaneous distribution of CO2 and virus-laden droplets due to the lack of an experimental dataset providing spatially resolved measurements of both parameters under the same controlled indoor conditions as our simulations. Consequently, our analysis relies on established physical principles, validated airflow and droplet models, and prior CFD studies as benchmarks. This limitation does not affect the main objective of this study, which was: (1) to confirm if increasing airflow rate improves air quality by analyzing the validated flow, and (2) to evaluate whether CO2 can effectively serve as a proxy for virus distribution under realistic indoor airflow conditions.

Author Contributions

Conceptualization, R.B. and A.M.; methodology, R.B. and A.M.; software, R.B.; validation, R.B., A.M., H.Y.; formal analysis, R.B., A.M., H.Y. and M.T.; investigation, R.B., A.M., H.Y. and M.T.; resources, M.T.; data curation, A.M.; writing—original draft preparation, R.B., A.M., H.Y.; writing—review and editing, R.B., A.M., H.Y. and M.T.; visualization, H.Y.; supervision, R.B., A.M., and M.T.; project administration, M.T.; funding acquisition, R.B., and M.T. All authors have read and agreed to the published version of the manuscript.

Funding

This work was supported by MEXT as “Program for Promoting Researches on the Supercomputer Fugaku” (JPMXP1020210316) and used computational resources of supercomputer Fugaku provided by the RIKEN Center for Computational Science (Project ID: hp240205, hp250232). This work used computational resources of the Supercomputer “Fugaku” through the HPCI System Research Project (Project ID: hp240204, hp250239). This work is supported in part by Japan Society for the Promotion of Science Grant Number 22K10596.

Institutional Review Board Statement

Not applicable.

Informed Consent Statement

Not applicable.

Data Availability Statement

The original contributions presented in this study are included in the article. Further inquiries can be directed to the corresponding author.

Conflicts of Interest

The authors declare no conflicts of interest.

References

  1. Sze To, G.N.; Chao, C.Y.H. Review and comparison between the Wells–Riley and dose-response approaches to risk assessment of infectious respiratory diseases. Indoor Air 2010, 20, 2–16. [Google Scholar] [CrossRef]
  2. Domingo, J.L.; Marquès, M.; Rovira, J. Influence of airborne transmission of SARS-CoV-2 on COVID-19 pandemic. A review. Environ. Res. 2020, 188, 109861. [Google Scholar] [CrossRef] [PubMed]
  3. Chen, W.; Zhang, N.; Wei, J.; Yen, H.L.; Li, Y. Short-range airborne route dominates exposure of respiratory infection during close contact. Build. Environ. 2020, 176, 106859. [Google Scholar] [CrossRef]
  4. Al-Rikabi, I.J.; Karam, J.; Alsaad, H.; Ghali, K.; Ghaddar, N.; Voelker, C. The impact of mechanical and natural ventilation modes on the spread of indoor airborne contaminants: A review. J. Build. Eng. 2024, 85, 108715. [Google Scholar] [CrossRef]
  5. Cao, G.; Awbi, H.; Yao, R.; Fan, Y.; Sirén, K.; Kosonen, R.; Zhang, J.J. A review of the performance of different ventilation and airflow distribution systems in buildings. Build. Environ. 2014, 73, 171–186. [Google Scholar] [CrossRef]
  6. Yang, B.; Melikov, A.K.; Kabanshi, A.; Zhang, C.; Bauman, F.S.; Cao, G.; Awbi, H.; Wigö, H.; Niu, J.; Cheong, K.W.D.; et al. A review of advanced air distribution methods—Theory, practice, limitations and solutions. Energy Build. 2019, 202, 109359. [Google Scholar] [CrossRef]
  7. Cheong, K.W.D.; Yu, W.J.; Tham, K.W.; Sekhar, S.C.; Kosonen, R. A study of perceived air quality and sick building syndrome in a field environment chamber served by displacement ventilation system in the tropics. Build. Environ. 2006, 41, 1530–1539. [Google Scholar] [CrossRef]
  8. Tomasi, R.; Krajčík, M.; Simone, A.; Olesen, B.W. Experimental evaluation of air distribution in mechanically ventilated residential rooms: Thermal comfort and ventilation effectiveness. Energy Build. 2013, 60, 28–37. [Google Scholar] [CrossRef]
  9. Nielsen, P.V. Velocity distribution in a room ventilated by displacement ventilation and wall-mounted air terminal devices. Energy Build. 2000, 31, 179–187. [Google Scholar] [CrossRef]
  10. Zhang, Y.; Shankar, S.N.; Vass, W.B.; Lednicky, J.A.; Fan, Z.H.; Agdas, D.; Makuch, R.; Wu, C.-Y. Air Change Rate and SARS-CoV-2 Exposure in Hospitals and Residences: A Meta-Analysis. Aerosol. Sci. Technol. 2024, 58, 217–243. [Google Scholar] [CrossRef]
  11. Ding, J.; Yu, C.W.; Cao, S.-J. HVAC systems for environmental control to minimize the COVID-19 infection. Indoor Built Environ. 2020, 29, 1195–1201. [Google Scholar] [CrossRef]
  12. Li, Y.; Leung, G.M.; Tang, J.W.; Yang, X.; Chao, C.Y.H.; Lin, J.Z.; Lu, J.W.; Nielsen, P.V.; Niu, J.; Qian, H.; et al. Role of ventilation in airborne transmission of infectious agents in the built environment—A multidisciplinary systematic review. Indoor Air 2007, 17, 2–18. [Google Scholar] [CrossRef]
  13. Morawska, L.; Afshari, A.; Bae, G.N.; Buonanno, G.; Chao, C.Y.H.; Hänninen, O.; Hofmann, W.; Isaxon, C.; Jayaratne, E.R.; Pasanen, P.; et al. Indoor aerosols: From personal exposure to risk assessment. Indoor Air 2013, 23, 462–487. [Google Scholar] [CrossRef] [PubMed]
  14. Tellier, R. Review of aerosol transmission of influenza A virus. Emerg. Infect. Dis. 2006, 12, 1657–1662. [Google Scholar] [CrossRef]
  15. Nicas, M.; Nazaroff, W.W.; Hubbard, A. Toward understanding the risk of secondary airborne infection: Emission of respirable pathogens. J. Occup. Environ. Hyg. 2005, 2, 143–154. [Google Scholar] [CrossRef] [PubMed]
  16. Buonanno, G.; Stabile, L.; Morawska, L. Estimation of airborne viral emission: Quanta emission rate of SARS-CoV-2 for infection risk assessment. Environ. Int. 2020, 141, 105794. [Google Scholar] [CrossRef]
  17. Dietz, L.; Horve, P.F.; Coil, D.A.; Fretz, M.; Eisen, J.A.; Van Den Wymelenberg, K. 2019 Novel Coronavirus (COVID-19) Pandemic: Built Environment Considerations to Reduce Transmission. mSystems 2020, 5, e00245-20. [Google Scholar] [CrossRef]
  18. Park, S.; Song, D. CO2 concentration as an indicator of indoor ventilation performance to control airborne transmission of SARS-CoV-2. J. Infect. Public Health 2023, 16, 1037–1044. [Google Scholar] [CrossRef]
  19. Di Gilio, A.; Palmisani, J.; Pulimeno, M.; Cerino, F.; Cacace, M.; Miani, A.; de Gennaro, G. CO2 concentration monitoring inside educational buildings as a strategic tool to reduce the risk of Sars-CoV-2 airborne transmission. Environ. Res. 2021, 202, 111560. [Google Scholar] [CrossRef]
  20. Rudnick, S.N.; Milton, D.K. Risk of indoor airborne infection transmission estimated from carbon dioxide concentration. Indoor Air 2003, 13, 237–245. [Google Scholar] [CrossRef] [PubMed]
  21. van Hooff, T.; Blocken, B.; Tominaga, Y. On the accuracy of CFD simulations of cross-ventilation flows for a generic isolated building: Comparison of RANS, LES and experiments. Build. Environ. 2017, 114, 148–165. [Google Scholar] [CrossRef]
  22. Bale, R.; Li, C.; Fukudome, H.; Yumino, S.; Iida, A.; Tsubokura, M. Characterizing infection risk in a restaurant environment due to airborne diseases using discrete droplet dispersion simulations. Heliyon 2023, 9, e20540. [Google Scholar] [CrossRef]
  23. Jansson, N.; Bale, R.; Onishi, K.; Tsubokura, M. CUBE: A scalable framework for large-scale industrial simulations. Int. J. High Perform. Comput. Appl. 2019, 33, 678–698. [Google Scholar] [CrossRef]
  24. Bale, R.; Wang, W.H.; Li, C.-G.; Onishi, K.; Uchida, K.; Fujimoto, H.; Kurose, R.; Tsubokura, M. A Scalable Framework for Numerical Simulation of Combustion in Internal Combustion Engines. In Proceedings of the Platform for Advanced Scientific Computing Conference, in PASC 20, New York, NY, USA, 5–8 July 2021; Association for Computing Machinery: New York, NY, USA, 2020. [Google Scholar] [CrossRef]
  25. Grinstein, F.F.; Margolin, L.G.; Rider, W.J. Implicit Large Eddy Simulation—Computing Turbulent Fluid Dynamics, 1st ed.; Cambridge University Press: Cambridge, UK, 2007. [Google Scholar]
  26. Roe, P.L. Approximate Riemann solvers, parameter vectors, and difference schemes. J. Comput. Phys. 1981, 43, 357–372. [Google Scholar] [CrossRef]
  27. Mofakham, A.A.; Ahmadi, G. On random walk models for simulation of particle-laden turbulent flows. Int. J. Multiph. Flow 2020, 122, 103157. [Google Scholar] [CrossRef]
  28. Ranz, W.E. Evaporation from drops: Part I. Chem. Eng. Prog. 1952, 48, 141–146. [Google Scholar]
  29. Ranz, W.E. Evaporation from drops: Part II. Chem. Eng. Prog. 1952, 48, 173–180. [Google Scholar]
  30. Nakamura, M.; Nishioka, D.; Hayashi, J.; Akamatsu, F. Soot formation, spray characteristics, and structure of jet spray flames under high pressure. Combust. Flame 2011, 158, 1615–1623. [Google Scholar] [CrossRef]
  31. Miller, R.S.; Harstad, K.; Bellan, J. Evaluation of equilibrium and non-equilibrium evaporation models for many-droplet gas-liquid flow simulations. Int. J. Multiph. Flow 1998, 24, 1025–1055. [Google Scholar] [CrossRef]
  32. Bale, R.; Li, C.-G.; Yamakawa, M.; Iida, A.; Kurose, R.; Tsubokura, M. Simulation of Droplet Dispersion in COVID-19 Type Pandemics on Fugaku. In Proceedings of the Platform for Advanced Scientific Computing Conference, in PASC 21, New York, NY, USA, 5–9 July 2021; Association for Computing Machinery: New York, NY, USA, 2021. [Google Scholar] [CrossRef]
  33. Bale, R.; Iida, A.; Yamakawa, M.; Li, C.-G.; Tsubokura, M. Quantifying the COVID19 infection risk due to droplet/aerosol inhalation. Sci. Rep. 2022, 12, 11186. [Google Scholar] [CrossRef]
  34. Gupta, J.K.; Lin, C.-H.; Chen, Q. Characterizing exhaled airflow from breathing and talking. Indoor Air 2010, 20, 31–39. [Google Scholar] [CrossRef]
  35. Nielsen, P.V. Displacement Ventilation. In Rehva Guidebook; no. 23; Federation of European Heating and Air-Conditioning Associations: Brussels, Belgium, 2017. [Google Scholar]
  36. Bale, R.; Patankar, N.A.; Jansson, N.; Onishi, K.; Tsubokura, M. Stencil Penalty approach based constraint immersed boundary method. Comput. Fluids 2020, 200, 104457. [Google Scholar] [CrossRef]
  37. Mittal, R.; Iaccarino, G. Immersed Boundary Methods. Annu. Rev. Fluid Mech. 2005, 37, 239–261. [Google Scholar] [CrossRef]
  38. Li, C.-G.; Tsubokura, M.; Bale, R. Framework for simulation of natural convection in practical applications. Int. Commun. Heat Mass Transf. 2016, 75, 52–58. [Google Scholar] [CrossRef]
  39. Nakahashi, K.; Kim, L. Building-Cube Method for Large-Scale, High Resolution Flow Computations. In Proceedings of the 42nd AIAA Aerospace Sciences Meeting and Exhibit, Reno, NV, USA, 5–8 January 2004; American Institute of Aeronautics and Astronautics: Reston, VA, USA, 2004. [Google Scholar] [CrossRef]
  40. ANSI/ASHRAE Standard 62.I-2022; Ventilation and Acceptable Indoor Air Quality. ASHRAE: Atlanta, GA, USA, 2022. Available online: https://www.ashrae.org/technical-resources/bookstore/standards-62-1-62-2 (accessed on 7 September 2025).
  41. Deevy, M. CFD Modelling of the Benchmark Displacement Ventilation Test Case; Health and Safety Laboratory: Derbyshire, UK, 2006. [Google Scholar]
  42. Yoo, S.-J.; Ito, K. Validation, verification, and quality control of computational fluid dynamics analysis for indoor environments using a computer-simulated person with respiratory tract. Jpn. Archit. Rev. 2022, 5, 714–727. [Google Scholar] [CrossRef]
  43. Nielsen, P.V.; Murakami, S.; Kato, S.; Topp, C.N.; Yang, J.H. Benchmark Test for a Computer Simulated Person; Aalborg University: Aalborg, Denmark, 2003. [Google Scholar]
  44. Yuan, X.; Chen, Q.; Glicksman, L.; Hu, Y.; Yang, X. Measurements and computations of room airflow with displacement ventilation. ASHRAE Trans. 1999, 105, 340–352. [Google Scholar]
  45. Li, Y.; Nielsen, P.V.; Sandberg, M. Displacement ventilation in hospital environments. ASHRAE J. 2011, 53, 86–88. [Google Scholar]
  46. Yang, R.; Ng, C.S.; Chong, K.L.; Verzicco, R.; Lohse, D. Do increased flow rates in displacement ventilation always lead to better results? J. Fluid Mech. 2022, 932, A3. [Google Scholar] [CrossRef]
  47. Yang, J.; Sekhar, C.; Cheong, D.K.W.; Raphael, B. A time-based analysis of the personalized exhaust system for airborne infection control in healthcare settings. Sci. Technol. Built Environ. 2015, 21, 172–178. [Google Scholar] [CrossRef]
  48. Villafruela, J.M.; Olmedo, I.; San José, J.F. Influence of human breathing modes on airborne cross infection risk. Build. Environ. 2016, 106, 340–351. [Google Scholar] [CrossRef]
  49. Ai, Z.; Hashimoto, K.; Melikov, A.K. Influence of pulmonary ventilation rate and breathing cycle period on the risk of cross-infection. Indoor Air 2019, 29, 993–1004. [Google Scholar] [CrossRef] [PubMed]
  50. Kappelt, N.; Russell, H.S.; Kwiatkowski, S.; Afshari, A.; Johnson, M.S. Correlation of Respiratory Aerosols and Metabolic Carbon Dioxide. Sustainability 2021, 13, 12203. [Google Scholar] [CrossRef]
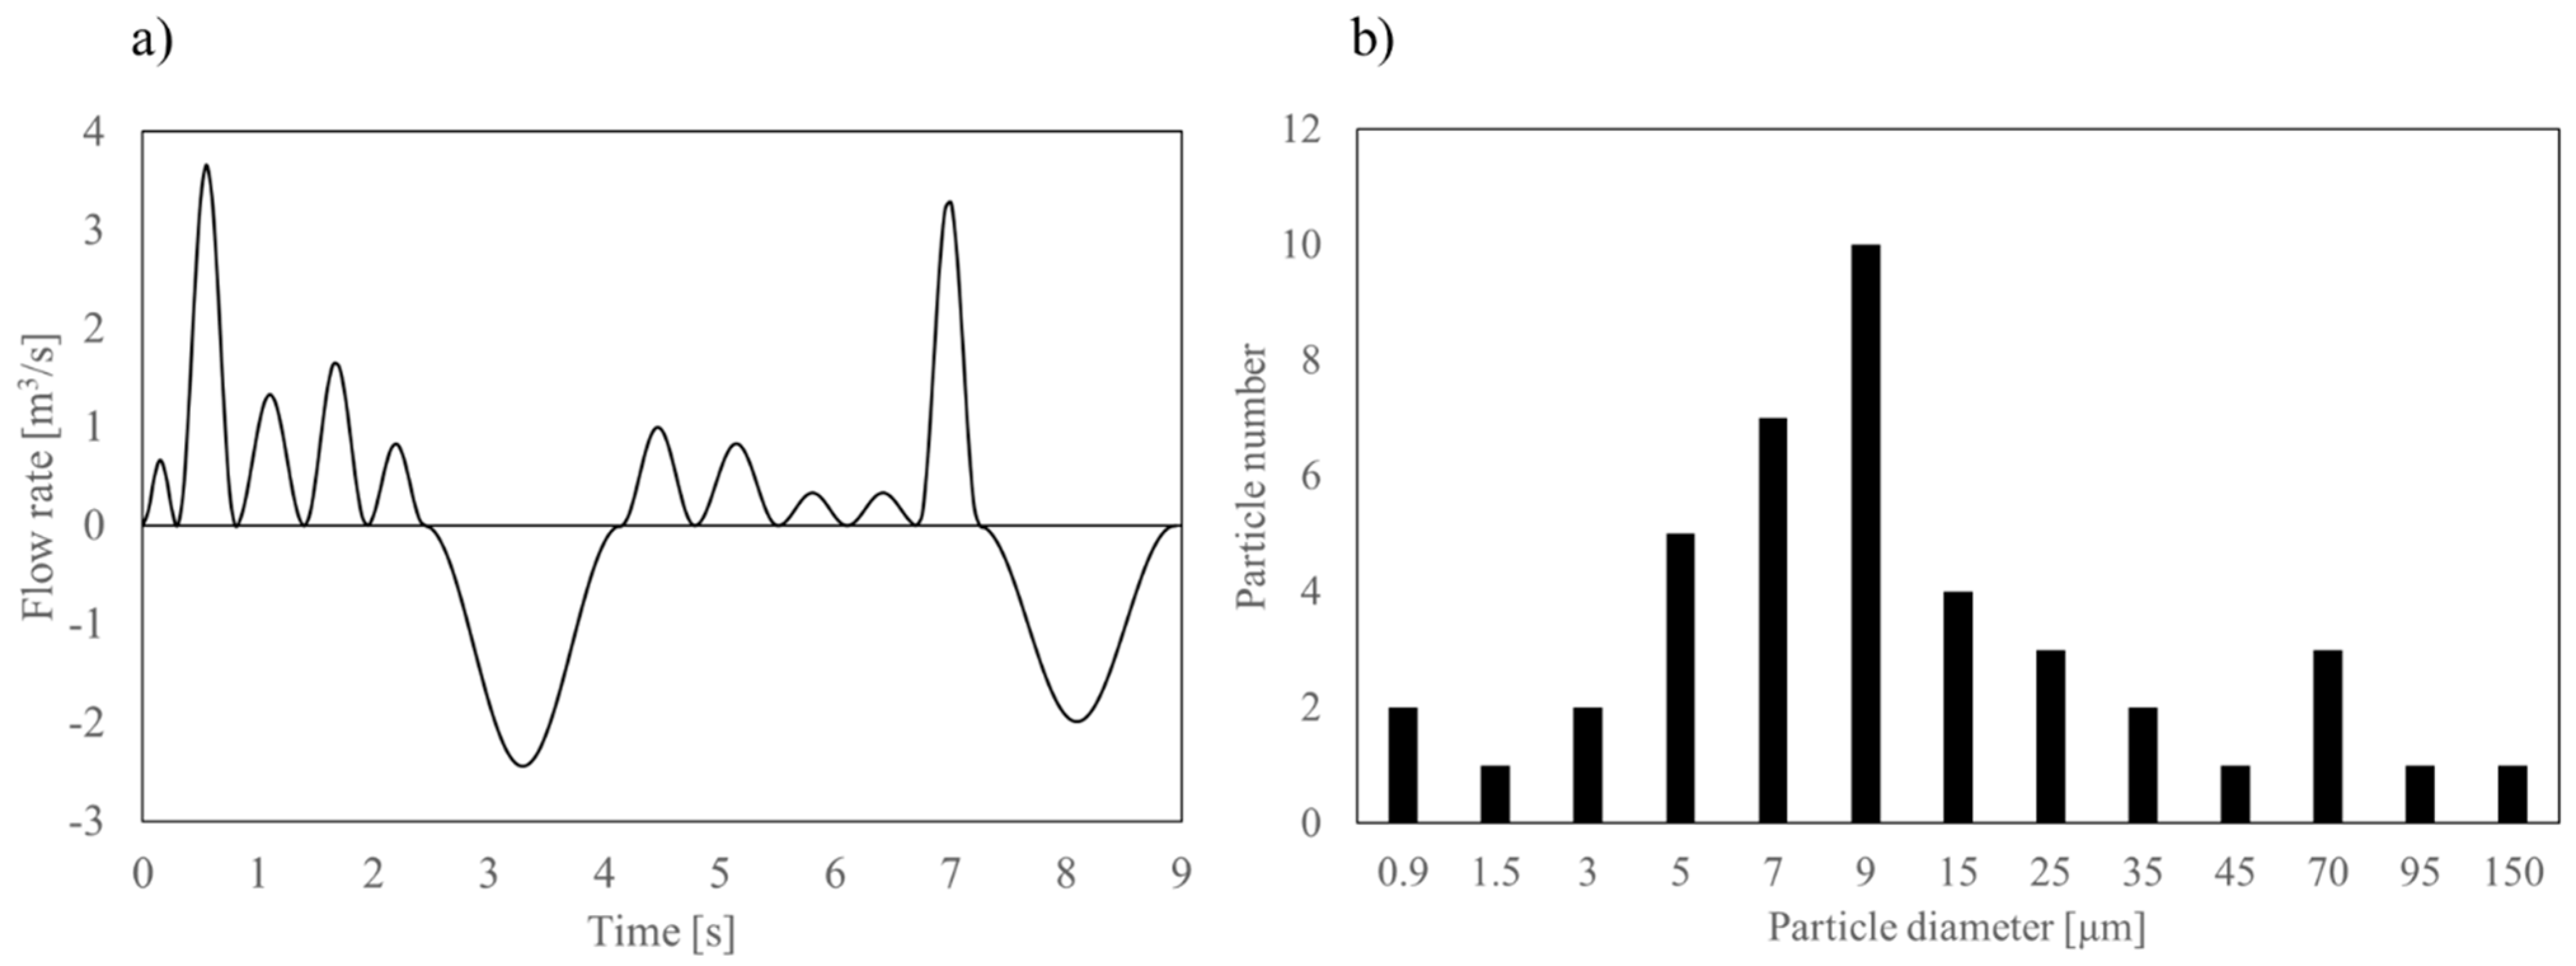
Figure 1. Speaking model for respiratory source: (a) Flow rate profile and (b) Initial particle distribution.
Sustainability 17 08193 g001
Figure 2. Domain design for (a) Case 1 centered distribution, (b) Case 2 skewed distribution, (c) Mesh design near virtual manikin, (d) Mesh design near mouth-source.
Sustainability 17 08193 g002
Figure 3. (a) Experimental and CFD analysis-based velocity profiles comparison for line L1, and (b) Velocity magnitude distribution in the sagittal plane inside the room.
Sustainability 17 08193 g003
Figure 4. Velocity streamlines around occupant in cases 1 and 2 for ventilation rates (a) 0.01, (b) 0.02, (c) 0.04, and (d) 0.06 m3/s.
Sustainability 17 08193 g004
Figure 5. Temperature and CO2 distributions in the room in the sagittal plane in cases 1 and 2 for ventilation rates (a) 0.01, (b) 0.02, (c) 0.04, and (d) 0.06 m3/s.
Sustainability 17 08193 g005
Figure 6. Plot of potential (Ep) and kinetic energy (Ek) against all ventilation rates for (a) Case 1 and (b) Case 2.
Sustainability 17 08193 g006
Figure 7. Plot of volume-averaged CO2 concentrations against all flow rates: (a) Case 1 and (b) Case 2.
Sustainability 17 08193 g007
Figure 8. Comparison of particle distribution and CO2 concentration (in ppm) over time at (a) the horizontal, talking plane (1.5 m above the ground) and (b) the sagittal plane (1.5 m from the right wall with respect to the mannequin) for Case 1, ventilation rate=0.02 m3/s.
Sustainability 17 08193 g008
Figure 9. Comparison between (a) virus density (copies/m3) and (b) CO2 concentration (ppm) in the immediate talking zone.
Sustainability 17 08193 g009
Disclaimer/Publisher’s Note: The statements, opinions and data contained in all publications are solely those of the individual author(s) and contributor(s) and not of MDPI and/or the editor(s). MDPI and/or the editor(s) disclaim responsibility for any injury to people or property resulting from any ideas, methods, instructions or products referred to in the content.