Article

New Energy Logistics Vehicle Promotion: A Tripartite Evolutionary Game Perspective

1
School of Economics and Management, Inner Mongolia University of Technology, Hohhot 010051, China
2
School of General Education, Inner Mongolia University of Technology, Hohhot 010051, China
*
Author to whom correspondence should be addressed.
Sustainability 2025, 17(18), 8164; https://doi.org/10.3390/su17188164
Submission received: 9 June 2025 / Revised: 17 July 2025 / Accepted: 26 July 2025 / Published: 10 September 2025

Abstract

In the severe context of global warming and the energy crisis, the low-carbon economy has become an inevitable trend in global development. This paper focuses on the logistics industry, a significant domain of carbon emissions, and regards the promotion of new energy logistics vehicles as a crucial breakthrough for the industry to achieve energy savings and emission reductions. From the perspective of an evolutionary game involving the government, logistics vehicle enterprises, and logistics enterprises, a practical and feasible strategy for promoting new energy logistics vehicles is proposed. Firstly, a tripartite evolutionary game model was developed under the dual-credit policy and auxiliary policies, and its strategy of asymptotic stability and Jacobian matrix analysis was conducted. Then, system dynamics (SD) was employed to simulate the model, aiming to explore the impact of key decision variables on the evolutionary outcomes. The results show that: (1) Appropriate auxiliary policy support can encourage logistics vehicle enterprises to produce new energy logistics vehicles and promote the transformation of the logistics industry to a low-carbon direction; (2) Through the optimization of the dual-credit policy and the enhancement of the value of points trading, logistics enterprises can be motivated to produce more new energy vehicles; (3) The promotion of cost reduction of new energy logistics vehicles and the enhancing of market competitiveness can improve the willingness of logistics enterprises to use new energy logistics vehicles; (4) The government should encourage logistics enterprises to use new energy logistics vehicles in multiple dimensions.

1. Introduction

In the face of escalating global warming and the deepening energy crisis, a low-carbon economy and energy conservation have emerged as a universal objective globally [1]. As the world’s largest developing nation, China is key in driving the shift toward sustainability and reduced emissions [2]. The China Green Logistics Development Report (2023) reveals that logistics-related emissions comprise around 9% of the country’s total carbon output, indicating that the logistics industry substantially contributes to China’s overall carbon footprint [3]. Data on the development status of China’s new energy logistics vehicle industry in 2023 show that, compared with fuel logistics vehicles (FVs), new energy logistics vehicles (NEVs) can reduce approximately 85% of tailpipe emissions and 67.5% of air pollutant emissions [4]. Consequently, leveraging NEVs, which possess remarkable advantages such as environmental friendliness and low-carbon characteristics, as the principal means of cargo transportation and distribution in China can effectively mitigate carbon emissions within the logistics industry. This approach facilitates the logistics industry’s green transformation and promotes sustainable development, aligning seamlessly with the global trend towards environmental protection.
In promoting NEVs, the government, logistics vehicle enterprises, and logistics enterprises are propelling the industry’s development [5]. The government plays an indispensable role, utilizing a dual approach of policy guidance and regulatory optimization to chart the course for the new energy logistics industry [6]. Globally, numerous countries have already embarked on initiatives in this domain. Through proactive measures, they promote NEVs, demonstrating high attention and support for this field [7]. Germany, Norway, and Sweden are promoting the development of new energy vehicles through strategies such as subsidies, tax incentives, and the construction of charging infrastructure. Applying new energy vehicles in the commercial sector is widespread and growing rapidly. In 2020, Germany registered 3401 electric postal trucks (a year-on-year increase of 7.1%) [8]. Norway registered approximately 5000 electric trucks in 2023 (accounting for 30% of logistics vehicles), while Sweden aims for new energy vehicles to account for over 50% of the market share by 2030. From 2010 to 2015, the government enhanced its support for new energy vehicles in China by implementing financial subsidies and tax incentives to facilitate their widespread application in logistics [9]. In April 2019, the Ministry of Transport, the National Development and Reform Commission, and thirteen other departments, in the “Opinions on Accelerating the Transformation and Upgrading of the Road Freight Transport Industry to Promote High-Quality Development”, proposed actively promoting the standardization of freight transport models and expediting the adoption of new energy or clean energy for urban light logistics and distribution vehicles. Although the lenient fiscal policy has gradually increased the utilization rate of NEVs in China, the overall market penetration remains relatively low, failing to be commensurate with the scale of the vast logistics market [10]. As the industry matures, the role of fiscal subsidies diminishes. Long-term reliance on subsidies imposes a financial burden on the government and leads to enterprises’ over-dependence on such support, dampening their motivation for technological innovation and eroding their market competitiveness. Considering these factors, China officially implemented the dual-credit policy (DCP) on 1 January 2021, and terminated the subsidy policy on 31 December 2022 [11]. Consequently, logistics vehicle enterprises and logistics enterprises no longer receive government subsidies, marking the transition of the new energy automobile industry from a policy-driven to a market-driven model. To mitigate the impact of subsidy withdrawal, the Ministry of Finance issued the “Notice on Improving the Financial Subsidy Policy for the Popularization and Application of New Energy Vehicles”, which explicitly proposed adjusting the subsidy mechanism from direct purchase subsidies to demonstration-based applications [12]. Additionally, in June 2023, the Ministry of Finance, the Ministry of Industry and Information Technology, and the State Taxation Administration extended the new energy vehicle purchase tax reduction and exemption policy for an additional four years, without setting specific limitations for NEVs, which constitutes the significant central segment of new energy commercial vehicles [13]. In summary, within the global context of active advocacy for low-carbon environmental protection and the promotion of new energy vehicles, coupled with China’s early-stage adjustments to its new energy policies, an in-depth investigation of how the core stakeholders respond to government policies aimed at promoting NEVs in the Chinese market is of great significance. Such a study can provide valuable insights and references for future policy implementation.
Logistics vehicle enterprises play the role of manufacturers in the promotion of NEVs, and their core operations encompass a broad spectrum of activities, including supply chain management (such as raw material procurement, parts manufacturing, and vehicle assembly), vehicle design and production, technological research and development, and quality control [14]. Government policies and the demands of logistics enterprises influence the strategic decisions made by these enterprises. During substantial government subsidies, logistics vehicle enterprises accelerated technological research and development efforts and intensified product promotion activities. This impetus led to the explosive growth of NEVs within the logistics industry, attracting numerous enterprises, such as Geely, Dongfeng, and Kerry, to enter the market [15]. Nevertheless, with the phasing out of subsidy policies and the implementation of the DCP, the competition in China’s NEV market has become increasingly fierce. An ever-growing number of vehicle brands are entering a highly competitive landscape characterized by intense rivalry [16]. How can the production of FVs and NEVs be balanced in logistics vehicle enterprises in this environment? How can we cope with the impact of the cost increase after the subsidy cancellation? Knowing how to occupy a place in the fierce market competition has become worthy of study.
On the other hand, logistics enterprises act as consumers in promoting NEVs. In recent years, the rapid expansion of the e-commerce and express delivery industries, spearheaded by major platforms such as JD.com and Taobao, has been accompanied by the widespread adoption of NEVs [17]. In 2022, China further relaxed the traffic restrictions for NEVs. Regions including Beijing, Guangdong, Henan, Jiangsu, and Shandong introduced preferential policies that grant these vehicles priority access [18]. However, the termination of the government subsidy policy means that logistics enterprises no longer receive subsidies for purchasing NEVs, leading to a significant increase in acquisition costs. As a result, government policy adjustments, the pricing strategies and R&D capabilities of logistics vehicle enterprises, and logistics enterprises’ comprehensive cost–benefit analyses collectively influence their choices between new energy and fuel-powered logistics vehicles.
In this paper, we use a combination of the evolutionary game theory (EGT) and SD to study the strategic choices of logistics vehicle enterprises systematically, the purchasing choices of logistics enterprises under the DCP, and the auxiliary policy of replacing subsidies with incentives and regulating the market with penalties. The objectives of this paper are as follows: (1) It endeavors to explore the behavioral strategies of the government, logistics vehicle enterprises, and logistics enterprises under different ratios of market factors through simulation analysis. (2) It aims to discern how government policies, in conjunction with the operational behaviors of logistics vehicle enterprises, can be optimized to enhance the effectiveness of promoting NEVs.
The study is structured as follows: Section 2 focuses on the literature review, deeply analyzes the relevant research in the field of carbon emission reduction in the logistics industry, and systematically sorts out the current application status and progress of EGT in the research of new energy vehicles. Subsequently, Section 3 constructs an EGT model involving three parties: the government, logistics vehicle enterprises, and logistics enterprises. Through mathematical derivation and demonstration, it deeply solves and analyzes the stability of the model and reveals the dynamic evolution laws of the strategic choices of the three parties. Section 4, based on the principles of SD, builds a corresponding simulation model and conducts numerical simulations on the key parameters in the model to intuitively present the influence mechanism of each variable on the system evolution results. Finally, in Section 5, this article summarizes the research results, extracts research conclusions, and puts forward suggestions for developing the logistics industry.

2. Literature Review

2.1. Research on Carbon Emission Reduction in the Logistics Industry

In recent years, academics locally and abroad have performed substantial research on improving carbon emission reduction within the logistics business. Some researchers have utilized improved heuristic algorithms to investigate the low-carbon vehicle routing problem (VRP) in logistics and distribution. For instance, a model for cold chain vehicle route optimization was developed by Ren Teng et al. [19]. This model aimed to minimize carbon emissions within the customer service time frame, which is susceptible to limitations like cold chain product degradation rate, client time windows, and vehicle loading capacity. The authors employed an improved ant colony algorithm to solve the model, and subsequent verification demonstrated its efficacy in optimizing carbon emissions. Yin et al. [20] designed a multi-objective path optimization model using the NSGA-II algorithm within the framework of the multi-factor evolutionary algorithm. This model effectively reduces carbon emissions while meeting customers’ cargo demand and time requirements.
Likewise, several academics have explored the impact of collaborative distribution on low-carbon logistics, focusing on common distribution and joint distribution. Common distribution involves multiple enterprises sharing distribution vehicles and routes, thereby reducing costs and carbon emissions for logistics enterprises. Wang Yong et al. [21] established a multi-center vehicle-sharing distribution model with the objectives of minimizing costs and vehicle usage. By applying an improved Shapley value method, they analyzed the benefits of multi-center distribution and the stability of the cooperative alliance among different logistics enterprises. Through case studies, they ultimately demonstrated that this distribution model can reduce both economic and environmental costs and enhance the stability of cooperation among collaborators. On the other hand, joint distribution refers to the utilization of multiple transportation modes, including rail, road, waterway, and air, by different logistics enterprises to achieve multimodal transportation and reduce resource consumption during the transportation process. Liu et al. [22] proposed a model for the joint distribution of drones and vehicles and employed genetic algorithms to optimize delivery routes. Comparative analysis of the drone and vehicle-only delivery modes revealed that the joint delivery mode may successfully cut down on the overall delivery distance, thereby decreasing costs and resource consumption.
Government regulation also serves as a pivotal factor in lowering the release of carbon within the logistics sector. It involves the government leveraging regulations and market mechanisms to advance the green and low-carbon transformation of the logistics sector. Zhang et al. examined the effect of carbon quotas and government subsidies on lowering carbon emissions in logistics [23]. Considering the framework of governmental regulations, they developed a decision model for the cold chain logistics system utilizing a two-level programming technique. Applying the chaotic particle swarm optimization method, they conducted a case study on cold chain logistics in Wuhan, Hubei Province, China. The study’s results indicated that the government’s carbon emission reduction subsidies and carbon quota settings significantly influenced enterprises’ carbon emission reduction efforts. Zhang et al. [24] adopted grounded theory as a research methodology to summarize the key factors affecting the effectiveness of green logistics policies. Their findings suggested that the level of government regulation and governance substantially impacts the development of green logistics, thereby confirming the positive role of government regulation in reducing carbon emissions within the logistics industry.
In summary, the green VRP in the distribution process has been the primary focus of present research on energy efficiency and emission reduction in the logistics sector, collaborative distribution issues, and low-carbon logistics under government supervision. However, despite transportation and distribution being the most energy-intensive segments of the logistics industry, the selection of distribution tools has received relatively little attention. Therefore, this paper proposes promoting energy preservation and release control in the logistics industry by advocating the adoption of NEVs.

2.2. Application of Evolutionary Games in the Study of New Energy Vehicles

Domestic and international research on new energy vehicles encompasses diverse perspectives and methodologies. Some scholars have delved into the supply chain of new energy vehicles. For instance, Han et al. [25] employed mathematical modeling to examine the influence of declining subsidies on the cooperation models among new energy vehicle suppliers. The research findings indicate that the cooperation strategies between automakers and battery suppliers vary with the degree of subsidy reduction. Hu et al. [26] explored the impact of two types of contracts on supply chain members’ interests, accounting for members’ innovation levels within the new energy vehicle supply chain. Additionally, other researchers have investigated issues related to the practical utilization of new energy vehicles, such as charging demand, battery lifespan, and the design of charging station networks. Shanmuganathan et al. [27] utilized a deep learning recursive neural network predictor model with long short-term memory to forecast the charging demand of new energy vehicles. The simulation results demonstrate that the LSTM model fully exhibits its effectiveness in predicting indicators and has effectively reduced charging costs. Swain et al. [28] applied advanced machine learning techniques, including random forests and support vector machines, to predict the remaining useful life of lithium-ion batteries. Furthermore, the analysis incorporates real-time variables—including temperature fluctuations and usage cycles—to investigate their impacts on battery capacity. Yang et al. [29] adopted a data-driven approach to optimize the charging network for new energy vehicles. This method was also applied to Wuhan, China, with results showing it effectively eliminates redundant stations, boosts utilization, and identifies congested charging areas. Xu et al. [30] proposed a novel framework (CDOD) incorporating both continuous-time and discrete-time representations, which achieved state-of-the-art performance in origin-destination demand prediction tasks. This framework can also be applied to optimize new energy vehicle charging networks. Nevertheless, these previous studies typically explored the impact of a single mechanism on developing new energy vehicles, neglecting to consider the intricate interactions and relationships among various stakeholders during the development process.
EGT examines the interaction processes among individuals within a group, assuming that participants do not need to possess perfect rationality or complete information. It emphasizes dynamic equilibrium and focuses on the evolution of strategies within the group. Given that new energy vehicles are currently in rapid transformation and development, the dynamic perspective of EGT can more effectively simulate this dynamic process and predict the long-term evolutionary trends of different strategies. Wu et al. [31] established a low-carbon strategy evolution model based on the game between the government and enterprises in complex network environments, analyzing the influence of government incentive measures on enterprises and providing a theoretical foundation for understanding their interactions. Building on this work, Zhou Ye et al. [32] established an EGT model to address the low-carbon decision-making of logistics enterprises under government supervision, exploring the effects of varying regulatory parameters on adopting low-carbon strategies in logistics operations. The results revealed that government supervision and policy frameworks are essential drivers for implementing low-carbon initiatives; Li Lihua et al. [33] developed a tripartite game system for developing green logistics, with the government, enterprises, and third-party monitoring entities as the key interest subjects based on the orientation of carbon tax policies. Their research findings offered insights into the strategic behavior choices of green logistics stakeholders. Zheng et al. [34] explored the game model between new energy vehicle manufacturers and local governments under diverse carbon tax regimes, specifically within the new energy vehicle industry, providing suggestions for government policies to foster industry development. On the other hand, Cai et al. [35] further expanded the participants’ scope by constructing a tripartite EGT model involving the government, automobile enterprises, and consumers. By integrating static and dynamic punishment mechanisms, they optimized the strategies of the three parties, thereby taking the refined analysis of inter-subject interactions a step further; Liu et al. [36] constructed an EGT model between the government and automobile manufacturers. By exploring the stable strategies under different combinations of subsidy and carbon tax policies, they aim to find a reasonable policy path for developing the new energy vehicle industry. Building on this, Liao et al. [37] further focused on carbon tax mechanisms. By constructing an EGT model between manufacturers and the government and integrating empirical analysis, they compared the specific effects of different carbon tax mechanisms on the popularization of new energy vehicles. Liu et al. [38] tackled the problem of “environmental claim fraud” in the global electric vehicle industry by constructing a tripartite evolutionary game model among manufacturers, certification bodies, and governments, seeking to reveal the regulatory loopholes underlying cross-border collusive practices. In turn, Jin et al. [39] specifically examined scenarios following adjustments to subsidy policies. They analyzed how to promote the development of new energy vehicles with low regulatory costs. Their research provided strategic guidance for the government to maintain industrial vitality after subsidies are phased out.
Existing studies confirm that optimizing low-carbon pathways via advanced heuristic algorithms and adopting collaborative distribution can reduce emissions. Government regulation aids logistics decarbonization, and evolutionary game theory (EGT) has revealed how government incentives and carbon taxes influence enterprises’ low-carbon decisions. However, research gaps remain: insufficient focus on tool selection in high-energy-consuming transportation and distribution; lack of studies centered on governments, logistics vehicle enterprises, and logistics enterprises as core game players—especially under the DCP framework post-subsidy cancellation; and the need for further exploration into promoting NEVs to meet emission reduction targets and establishing a government mechanism integrating the Ministry of Finance’s “subsidy replacement with rewards and market regulation via penalties” policies [12].
Therefore, this study employs an EGT model to explore the strategic dynamics among governments, logistics vehicle enterprises, and logistics enterprises. Specifically, EGT models are useful for quantitative analysis of policy-making criteria. Meanwhile, the SD model can be used to analyze the impact of specific parameters on game outcomes. This model investigates the relationships between various factors in complex networks. Combining EGT and SD mathematical functions enables precise quantitative analysis of different social issues, providing scientific support for policy making and strategic optimization. This combination leverages EGT to capture the dynamic logic of stakeholder strategic interactions and SD to depict the temporal evolution of system variables, making quantitative analysis of complex issues more in-depth and systematic.
This study explores how government policy adjustments affect logistics vehicle enterprises and their decision-making behavior. The ultimate goal is to provide reference recommendations to the government on effectively utilizing DCP and supporting policies to promote the development of the NEV industry and its widespread application.

3. Evolutionary Game Model of New Energy Logistics Vehicles

3.1. Problem Description

In this study, the government, logistics vehicle enterprises (manufacturers), and logistics enterprises (consumers) are taken as the subjects of the tripartite game under the official regression of the subsidy policy-DCP. Among them, the set of strategies that the government can choose is {supervision; no supervision}, the set of methods that the logistics vehicle enterprises can choose is {producing NEVs; producing FVs}, and the set of strategies that the logistics enterprises can choose is {using NEVs; using NVs}. The main factors for logistics vehicle enterprises to choose to produce NEVs include adjusting government policies, changes in market demand, and changes in economic benefits. Logistics enterprises’ choice to buy NEVs is subject to government subsidies, tax policies, social opinion, financial benefits, and other factors. If the government wants to promote NEVs, it must consider the supervision cost and the environmental benefits [40]. The relationship between these three parties is shown in Figure 1.

3.2. Basic Assumptions

This study uses the government, logistics vehicle enterprises, and logistics enterprises as research objects while establishing the following assumptions to build the game model of various stakeholders in the promotion process of NEVs.
Assumption 1.
Let x denote the probability of the government’s decision to implement supervision, where x ∈ [0, 1], and (1 − x) represents the probability of not implementing supervision. For logistics vehicle enterprises, the probability of producing NEVs is denoted by y, with y ∈ [0, 1], while (1 − y) indicates the probability of producing FVs. Regarding logistics enterprises, the probability of opting to use NEVs is defined as z, where z ∈ [0, 1], and the probability of using FVs is given by (1 − z).
Assumption 2.
Under the premise of bounded rationality [41], the government, logistics vehicle enterprises, and logistics enterprises constitute the three players in the game. Each makes decisions aimed at maximizing their respective interests [42]. They consistently adapt their strategies in response to changes in the game dynamics, thereby shaping the evolutionary outcome.
Assumption 3.
When the government decides to implement supervision, it will impose a fine L on enterprises manufacturing FVs and provide an incentive S (encompassing tax exemptions, special allowances for negative points related to new energy, transfer, and carry-over mechanisms, etc.) to enterprises producing NEVs. Additionally, this supervision decision incurs a regulatory cost, M. Conversely, if the government chooses not to supervise, it avoids the supervisory cost; however, this decision leads to a decline in public satisfaction and incurs environmental governance costs, denoted as G. When the government opts for supervision, it will rigorously enforce the right-of-way system, with the associated cost of implementing this system is N.
Assumption 4.
The cost of producing FVs for logistics vehicle enterprises is C1, due to the official subsidy policy, logistics vehicle enterprises are no longer entitled to government subsidies, according to the existing market analysis, the cost of producing NEVs for logistics vehicle enterprises will become higher [43], assuming that it is C1 + ΔC; the cost of purchasing FVs for logistics enterprises is R1, similarly, logistics enterprises as consumers are no longer entitled to the government subsidies for purchasing vehicles, so that the cost of purchasing NEVs for logistics enterprises will become higher as well. The cost of NEVs also becomes higher, and according to the fact that the price of NEVs on the market is generally higher than that of FVs [44], the cost of purchasing NEVs is R1 + ΔR.
Assumption 5.
According to the DCP [45], new energy-positive points can be sold to other enterprises but cannot be carried forward across years; while average fuel points need to be obtained by fuel vehicle energy saving and emission reduction, and negative fuel points can be offset by purchasing positive points, or enterprises can be self-sufficient through energy saving and emission reduction. Logistics vehicle enterprises producing new energy vehicles will obtain new energy positive points, assuming that the gain from trading the points obtained is S1. In contrast, logistics vehicle enterprises producing fuel vehicles will generate average negative fuel points (CAFC), assuming that the cost of purchasing positive points is S2.
Assumption 6.
In conjunction with the current situation, to make the DCP binding on fuel vehicle production, it is assumed that fuel vehicle production by logistic vehicle enterprises generates negative CAFC points.
Assumption 7.
The direct benefit of logistics enterprises using NEVs is Q1, while the indirect benefit of social reputation due to energy saving and emission reduction is represented by ΔQ. The use of new energy vehicles will gain a part of the right of way compared to fuel vehicles, which is converted to the indirect benefit of D; and the direct benefit of using FVs is Q1.
Assumption 8.
When the logistics vehicle enterprises choose to produce NEVs, the cost savings due to scale production are K.
According to the previous description and assumptions of the tripartite game involving the government, logistics vehicle enterprises, and logistics enterprises, the setup variables in this paper are shown in Table 1.

3.3. Model Development

Considering those previous assumptions, we calculate the total revenue of the government, logistics vehicle enterprises, and logistics enterprises under different strategies using the parameters mentioned in Table 1, and establish revenue matrices, as shown in Table 2.
The total income of the government, logistics vehicle enterprise, and logistics enterprise under various strategy combinations is shown in Table 2, which is separated into two sections, each with three rows. For example, −S – M − N represents the total government revenue from {government supervises, logistics vehicle enterprise produces NEV, and logistics enterprise uses NEV} in the first row of the first portion of Table 2. The formula S + S1 + (R1 + ΔR) − (C1 + ΔC) in the first column of the first section represents the logistics vehicle enterprise’s total income in this strategy combination. The formula Q1 + ΔQ − (R1 + ΔR) + D − K in the first column of the first section represents the logistics enterprise’s total revenue in this strategy combination, and so on.

3.4. Analysis of the Tripartite Evolutionary Game Model

3.4.1. The Expected Returns of the Three Parties Involved in the Game

The expected benefit function and average benefit function for each subject are obtained from the benefit matrix as follows:
(1)
For the government, the expected and average benefits of choosing to supervise and not supervise are, respectively:
E11 = yz(−S − M − N) + y(1 − z)(−S − M − N) + (1 − y)z(L − M − N) + (1 − y)(1 − z)(L − M − N),
E12 = yz * 0 + y(1 − z) (−G) + (1 − y)z * 0 + (1 − y)(1 − z)(−G),
E1 = xE11 + (1 − x)E12.
E11 and E12 are the expected benefit functions for the government’s choice of supervising and no-supervising strategies, respectively, and E1 is the average expected benefit function for the government.
(2)
For logistics vehicle enterprises, the expected and average benefits of choosing to produce NEVs and FVs are, respectively.
E21 = xz[S + S1 + (R1 + ΔR) − (C1 + ΔC)] + x(1 − z)[S − (C1 + ΔC) + S1] + (1 − x)z[S1 + (R1 + ΔR) − (C1 + ΔC)]
+ (1 − x)(1 − z)[S1 − (C1 + ΔC)],
E22 = xz(−C1 − S2 − L) + x(1 − z)(R1 − C1 − S2 − L) + (1 − x)z(−C1 − S2) + (1 − x)(1 − z)(R1 − C1 − S2),
E2 = yE21 + (1 − y)E22.
E21 and E22 are the expected benefit functions of logistics vehicle enterprises choosing to produce NEVs and FVs, respectively, and E2 is the average expected benefit function of logistics vehicle enterprises.
(3)
For logistics enterprises, the expected and average benefits of choosing to use NEVs and FVs are, respectively:
E31 = xy[(Q1 + ΔQ) − (R1 + ΔR) + D − K] + x(1 − y)[(Q1 + ΔQ) − (R1 + ΔR) + D] + (1 − x)y[(Q1 + ΔQ) − (R1 + ΔR) − K]
+(1 − x)(1 − y)[(Q1 +ΔQ) − (R1 + ΔR)],
E32 = xy(Q1 − R1) + x(1 − y)(Q1 − R1) + (1 − x)y(Q1 − R1) + (1 − x)(1 − y)(Q1 − R1),
E3 = zE31 + (1 − z)E32.
E31 and E32 are the expected benefit functions of logistics enterprises choosing to use NEVs and FVs, respectively, and E2 is the average expected benefit function of logistics vehicle enterprises.

3.4.2. The Replication Dynamic Equation of the Three Parties

Based on the expected benefit functions of the government, logistics vehicle enterprises, and logistics enterprises:
(1)
The replication dynamic equation of the government is obtained as:
F1(x) = dx/dt = x(E11 − E1) = x(1 − x)(E11 − E12) = x(1 − x)[ (–L − S) * y + (1 − z) * G + L − M − N],
(2)
The replication dynamics equation for logistic vehicle enterprises is:
F2(y) = dy/dt = y(E21 − E22) = y(1 − y)(E21 − E22) = y(1 − y)(Lx + 2R1z − R1 + Sx + S1 + S2 + zΔR − ΔC),
(3)
The replication dynamics equation for logistics enterprises is:
F3(z) = dz/dt = z(E31 − E32) = z(1 − z)(E31 − E32) = z(1 − z)(Dx − Ky + ΔQ − ΔR),
Thus, the replicated dynamic equation system of government, logistics vehicle enterprises, and logistics enterprises is:
F 1 x   =   x 1     x E 11   E 12   =   x 1     x L     S     y   +   1     z     G   +   L     M     N F 2 y   =   y 1     y Lx   +   2 R 1 z     R 1   +   Sx   +   S 1   +   S 2   +   z Δ R     Δ C F 3 z   =   z 1     z Dx     Ky   +   Δ Q     Δ R ,
Let F1(x) = F2(x) = F3(x) = 0. According to the literature [46] and the literature [47], it can be concluded that the stable solution evolution game is a kind of strict Nash equilibrium, which is also known as a pure strategy. As a result, the local stable equilibrium points are E1 (0, 0, 0), E2 (0, 0, 1), E3 (0, 1, 0), E4 (0, 1, 1), E5 (1, 0, 0), E6 (1, 0, 1), E7 (1, 1, 0), and E8 (1, 1, 1), which constitute the boundaries of the domain of solutions to the EGT. In addition, there is also an equilibrium point for this equation, which is denoted as E(x*, y*, z*), which satisfies the following conditions:
L S y + 1 z G   + L     M     N = 0 L x + 2 R 1 z R 1 + S x + S 1 + S 2 + z Δ R Δ C = 0 D x K y + Δ Q Δ R = 0
Calculated with Maple (2024) software to obtain:
x = Δ Q Δ R K y D ,
y = ( D Δ C G       D Δ R G       D Δ R L + D Δ R M + D Δ R N       DGR 1       DGS 1     DGS 2       2 DLR 1 + 2 DMR 1   + 2 DNR 1 + Δ Q G L + Δ Q G S       Δ R G L       Δ R G S       G K y L       G K y S ) D ( 2 L R 1 + L Δ R + 2 R 1 S + S Δ R ) ,
z = D R 1 D S 1 D S 2 + D Δ C + L Δ Q L Δ R + S Δ Q S Δ R L K y S k y 2 R 1 + Δ R D .

3.4.3. Strategy Asymptotic Stability Analysis

According to the EGT, when F1′(x) < 0, F2′(y) < 0, F3′(z) < 0, (x*, y*, z*) is the stable strategy (ESS) of the tripartite EGT among the government, logistics vehicle enterprises, and logistics enterprises.
F 1 ( x ) = d F 1 x d x = ( 1 2 x ) ( G ( 1 z ) + L M N + y ( L S ) ) ,
F 2 y = d F 2 y d y = ( 1 2 y ) ( Δ C + Δ R z + L x + 2 R 1 z R 1 + S x + S 1 + S 2 ) ,
F 2 ( z ) = d F 3 z d z = ( 1 2 z ) ( D x K y + Δ Q Δ R ) .
The asymptotic stability of each subject’s strategy is discussed below in separate cases.
(1)
Asymptotic stability analysis of the government’s gaming strategy
It follows from F1′(x) = 0 that
When (G(1 − z) + L − M − N + y(−L − S) = 0.
Boundary lines indicate the steady state of the government’s gaming strategy. Let y* = N + M L G ( 1 z ) ( L S ) and the following cases are considered.
i.
If y = y*, F1(x) = 0 is constant. No matter how x changes, it will not affect the value of F1(x); that is, the government’s choice of game strategy is stable.
ii.
If y > y*, according to d F 1 x d x | x = 0 < 0 and d F 1 x d x | x = 1 > 0 , we can solve that x = 0 is an evolutionary stable point (ESP), that is, the government chooses not to supervise in a stable state and chooses to supervise in an unstable state.
iii.
If y < y*, according to d F 1 x d x | x = 0 > 0 and d F 1 x d x | x = 1 < 0 , we can solve that x = 1 is an ESP, that is, the government chooses to supervise in a stable state and chooses not to supervise in an unstable state. The replication dynamic phase diagram of the government is shown in Figure 2.
When y falls on the surface, all x are steady state; when y is in the lower half of the surface, x tends to 0, which means that the government tends not to regulate; when y is in the upper half of the surface, x tends to 1, which means that the government tends to regulate.
(2)
Asymptotic Stability Analysis of Game Strategies of Logistics Vehicle Enterprises
From F2′(y) = 0, it follows that
When (−ΔC + ΔRz + Lx + 2R1z − R1 + Sx + S1 + S2) = 0, it indicates the cutoff of the stable state of the game strategy of the logistics carriers. Let x* = Δ C Δ R z 2 R 1 z + R 1 S 1 S 2 S + L , the following cases are considered.
i.
If x = x*, F2(y) = 0 is constant, so no matter how y changes, it will not affect the value of F2(y). That is, the game strategy choice of logistics vehicle enterprises is in a stable state.
ii.
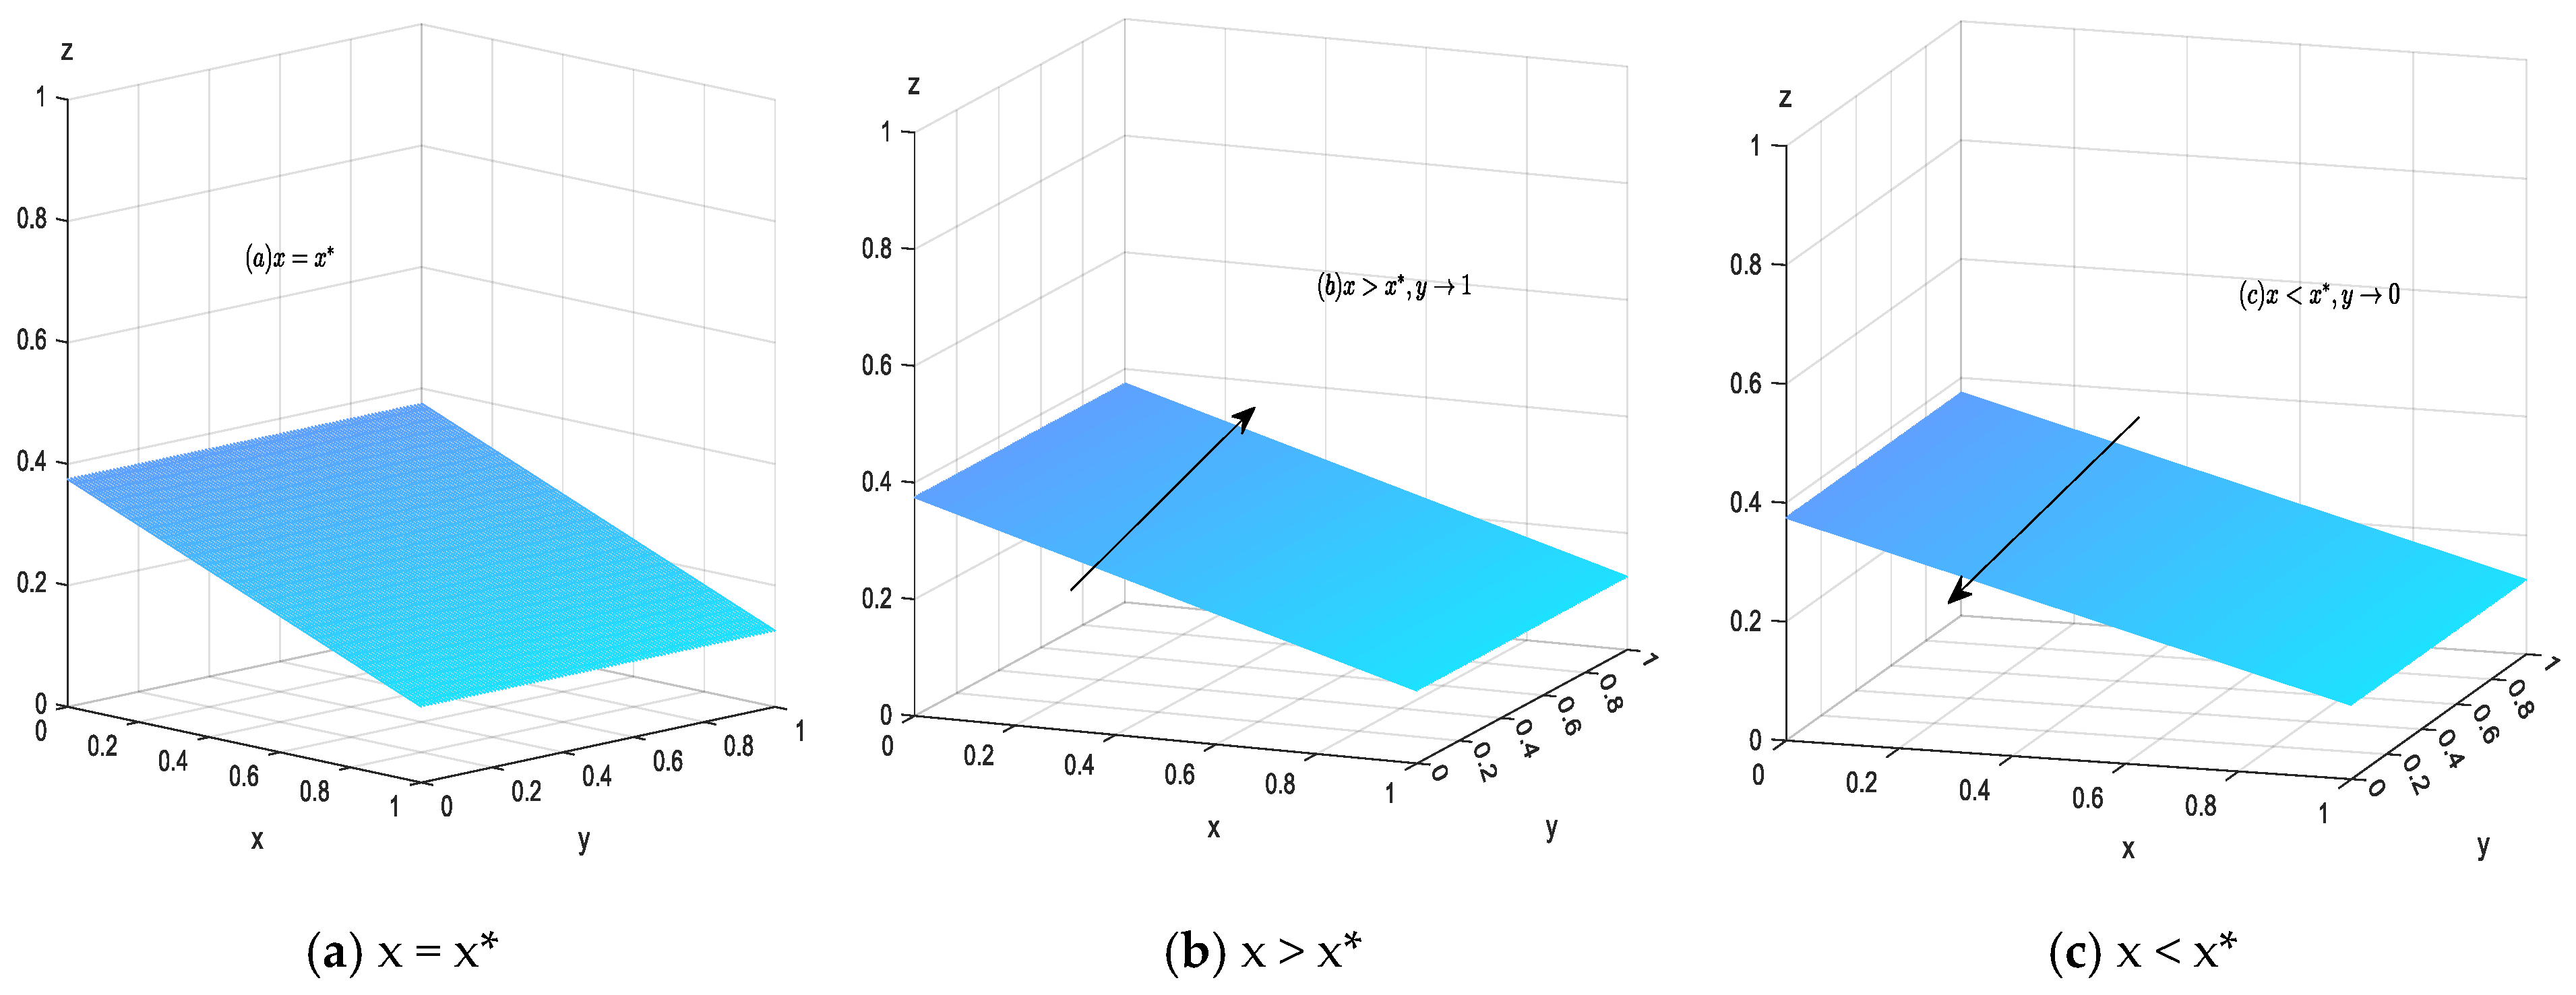
If x > x*, according to d F 2 y d y | y = 0 > 0 and d F 2 y d y | y = 1 < 0 , we can solve that y = 1 is an ESP, that is, the logistics vehicle enterprises choose to produce NEVs in a stable state and choose to produce FVs in an unstable state.
iii.
If x < x*, according to d F 2 y d y | y = 0 < 0 and d F 2 y d y | y = 1 > 0 , we can solve that y = 0 is an ESP, that is, the choice of logistics vehicle enterprises to produce FVs in a stable state, and the choice of producing NEVs in an unstable state.
The replicated dynamic phase diagram of the logistic vehicle enterprises is (Figure 3):
When x falls on the plane, all y is steady state; when x is in the lower half of the plane, y tends to 0, which means that the logistics vehicle enterprises choose to produce FVs; when x is in the upper half of the plane, y tends to 1, which means that the logistics vehicle enterprises choose to produce NEVs. Let x* = Δ R   Δ Q   K y D , the following cases are considered.
(3)
Asymptotic Stability Analysis of Game Strategies of Logistics Enterprises
i.
If x = x*, F3(z) = 0 is constant. No matter how z changes, it will not affect the value of F3(z); that is, the game strategy selection of logistics enterprises is in a stable state.
ii.
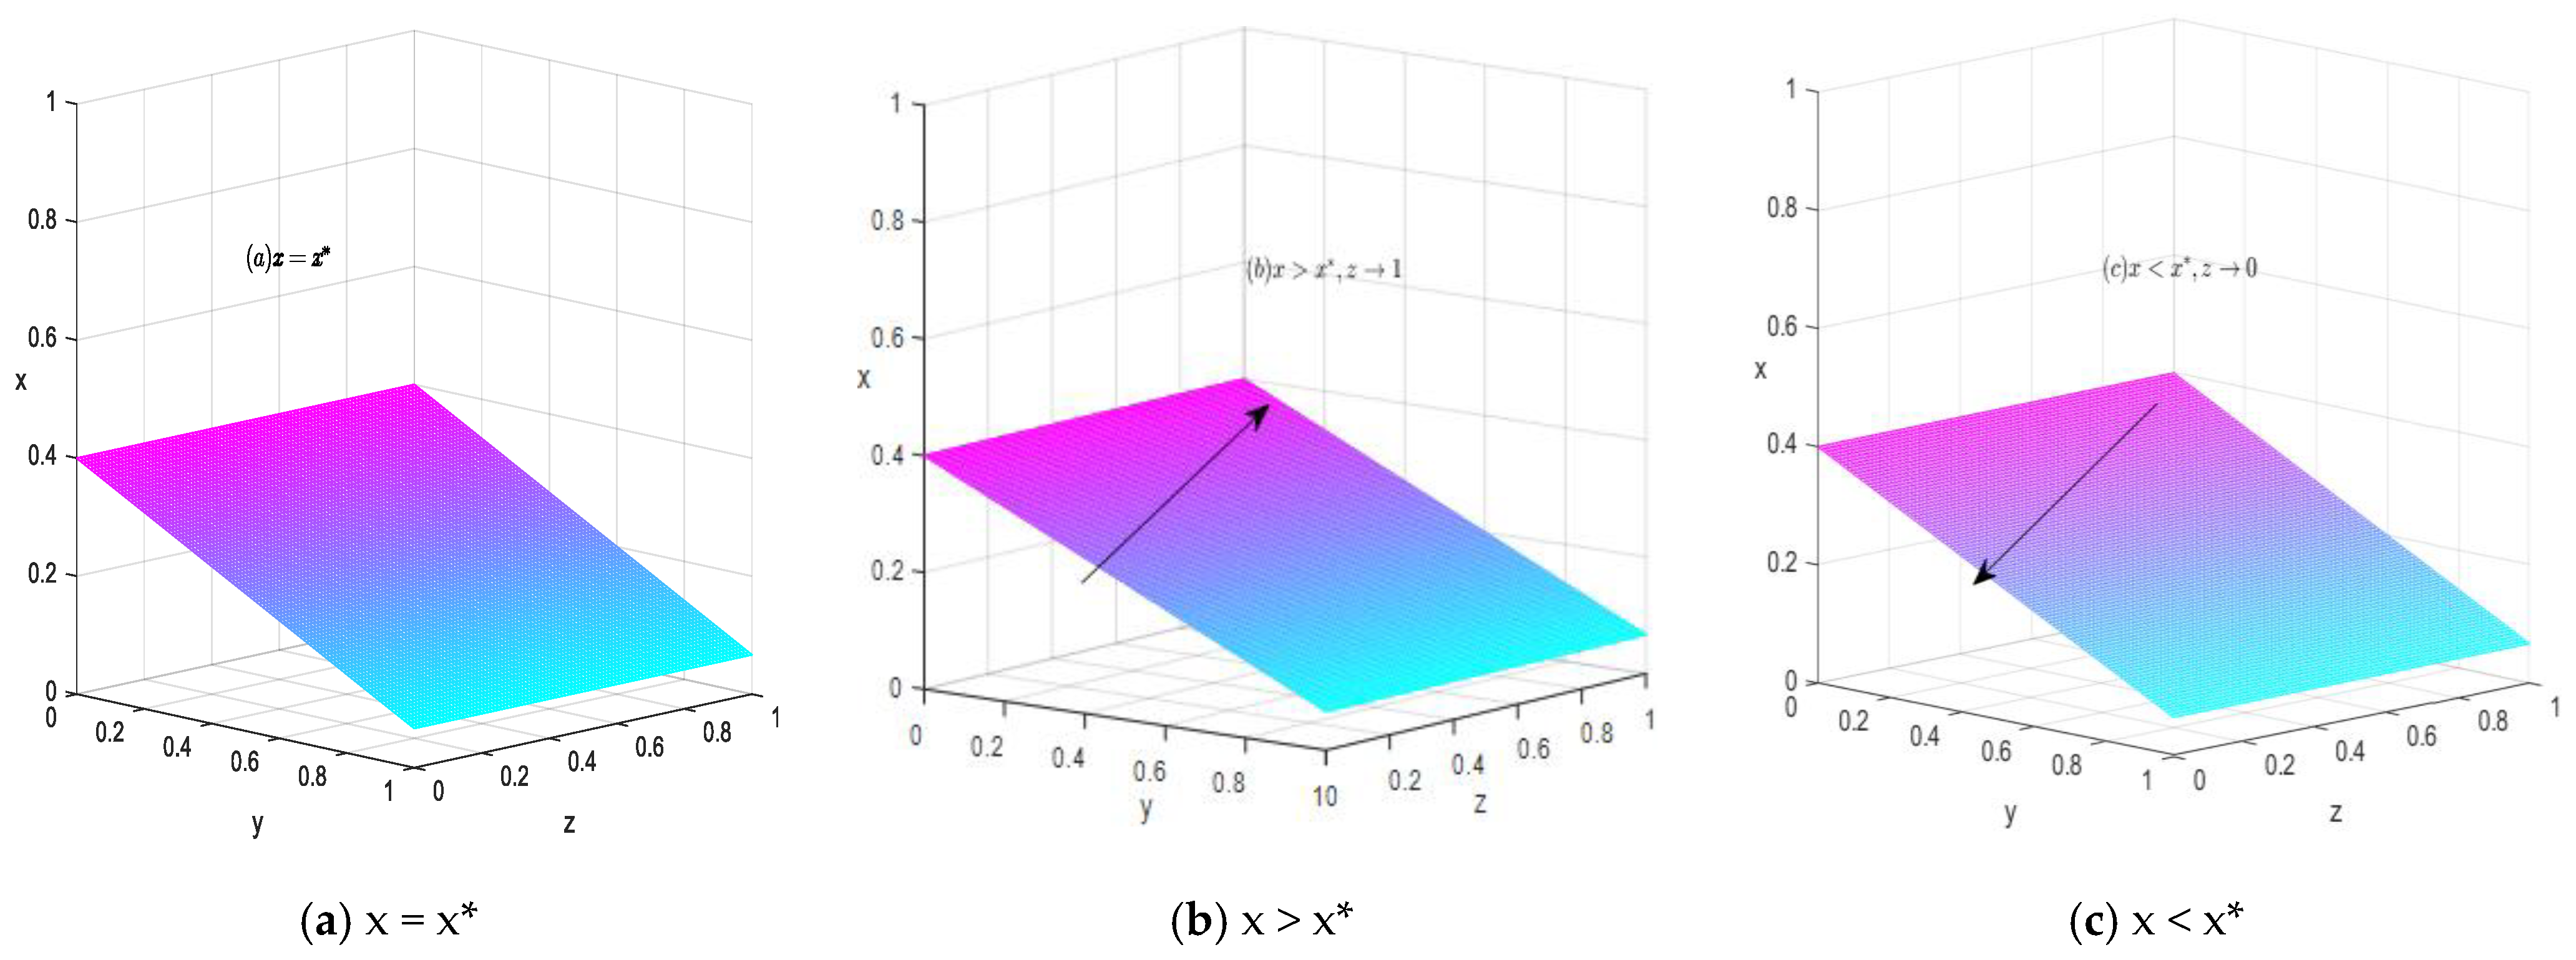
If x > x*, according to d F 3 z d z | z = 0 > 0 and d F 3 z d z | z = 1 < 0 , we can solve that z = 1 is an ESP, that is, the logistics enterprises choose to use NEVs in a stable state and choose to use FVs in an unstable state.
iii.
If x < x*, according to d F 3 z d z | z = 0 < 0 and d F 3 z d z | z = 1 > 0 , we can solve that z = 0 is an ESP, that is, it is a stable state for logistics enterprises to choose to use FVs, and it is an unstable state to choose to use NEVs.
The dynamic replication phase diagram for logistics enterprises is (Figure 4):
When x falls on the plane, all z is steady state; when x is in the lower half of the plane, z tends to 0, which means that the logistics enterprises choose to use FVs; when y is in the upper half of the plane, z tends to 1, which means that the logistics enterprises choose to use NEVs.

3.4.4. Jacobi Matrix Analysis

The stability of evolutionary equilibria can be determined through local stability analysis of the system’s Jacobian matrix. In a tripartite EGT, an equilibrium solution represents an evolutionary stable strategy (ESS) when all eigenvalues (λi) of the Jacobian matrix associated with it are negative. If only some eigenvalues are negative, the equilibrium point functions as a saddle point; conversely, when all eigenvalues are non-negative, the equilibrium point is deemed unstable [48]. The Jacobi matrix is computed based on the replicated dynamic equation systems of the government, logistics vehicle enterprises, and logistics firms as follows (Table 3):
F 1 x x F 1 x y F 1 x z   F 2 y x F 2 y y F 2 y z F 3 z x F 3 z y F 3 z z .
Place E1 (0, 0, 0), E2 (0, 0, 1), E3 (0, 1, 0), E4 (0, 1, 1), E5 (1, 0, 0), E6 (1, 0, 1), E7 (1, 1, 0), E8 (1, 1, 1)
Substituting into the Jacobi matrix, respectively, yields the Jacobi matrix eigenvalues as shown in Table 4.
To analyze the positives and negatives of the eigenvalues at the equilibrium point, the following assumptions are made in the rational case:
(1)
ΔQ − ΔR > 0, that is, the incremental benefit of using NEVs is greater than the incremental cost of using NEVs.
(2)
R1 + ΔR > ΔC, that is, the selling price of NEVs sold by logistics vehicle enterprises is greater than the incremental cost of producing NEVs.
The stability of the equilibrium points is analyzed as shown in Table 5.
As presented in the table, there are cases of non-negative eigenvalues in E1(0, 0, 0), E2(1, 0, 1), E4(0, 0, 1), E6(1, 0, 1), E8(1, 1, 1), which do not satisfy the theory of stability, and will not be considered. The stability of E3(0, 1, 0), E5(1, 1, 0), E7(0, 1, 1) is discussed below.
The stabilization strategy of the game is discussed below in these cases:
(1)
Scenario 1: When ΔQ − ΔR − K < 0, ΔC + R1 − S1 − S2 < 0, and G < M + N − L, the ESP of the system is E3(0, 1, 0); that is, the incremental gain from the use of NEVs by logistics enterprises minus the cost saved from mass production is less than the incremental cost, logistics enterprises choose to use FVs; if the sum of the credit income obtained by logistics vehicle manufacturing enterprises from producing NEVs and the cost of purchasing positive credits that they don’t need to pay is greater than the income from selling FVs and the incremental cost of producing NEVs that they don’t need to pay, the logistics vehicle manufacturing enterprises will choose to produce NEVs. If the cost loss caused by the government’s non-supervision is less than the sum of the supervision cost, the road access right cost, and the fine revenue, the government will choose not to conduct supervision.
(2)
Scenario 2: when ΔQ − ΔR − K + D < 0, ΔC − L + R1 − S − S1 − S2 < 0 and G > M + N − L, the ESP of the system is E5(1, 1, 0); that is, the incremental revenue of logistics enterprises from using NEVs minus the cost saved by mass production plus the indirect revenue of road access rights is less than the incremental cost paid, so logistics enterprises choose to use FVs. When the credit income obtained by logistics vehicle manufacturing enterprises from producing NEVs, plus the government’s rewards to new energy vehicle manufacturing enterprises, minus the incremental cost of producing NEVs, is greater than the revenue from selling FVs minus the government’s fines for selling FVs minus the cost of purchasing positive credits, logistics vehicle manufacturing enterprises choose to produce NEVs. Since the cost loss caused by the government’s non-supervision is greater than the total supervision cost, the government chooses to conduct supervision.
(3)
Scenario 3: When ΔQ − ΔR − K > 0, the ESP of the system is E7(0, 1, 1); that is, the incremental revenue of logistics enterprises from using NEVs minus the cost saved through mass production is greater than the incremental cost. Therefore, logistics enterprises will also choose to use NEVs.

4. Numerical Simulation

The game analysis shows that the stabilization point of the game may be the three cases of (no supervision, producing FVs, not purchasing NEVs), (no supervision, producing NEVs, not purchasing NEVs), and (no supervision, producing NEVs, purchasing NEVs). In this section, the SD method is applied to simulate the tripartite evolution process, and the impact on the game model is analyzed by assigning values to key parameters to propose strategies beneficial to all three stakeholders.
After analyzing the tripartite evolution model described above, an SD simulation model is established as shown in Figure 5.

4.1. Stability Point Simulation Analysis

Based on the model in Figure 4, the Vensim platform simulates the evolutionary process of the three parties’ behavioral strategies. The simulation cycle is set to (1), the unit is months, and the step size is 0.001. The initial values of (government active supervision, logistics vehicle enterprises producing NEVs, logistics enterprises using NEVs) are (0.7, 0.1, 0.2), and the three parties involved in the game are simulated. The results are shown in Figure 6.
It is not difficult to see from the chart that under the environment of national subsidy, sloping back, and DCP, the logistics vehicle market has gradually changed from government supervision to market regulation. After the government chose not to supervise, logistics vehicle enterprises produced NEVs simultaneously, and after about 10.5 cycles, logistics enterprises used NEVs. Compared with logistics vehicle enterprises, logistics enterprises have a significant time lag. After several cycles, the logistics vehicle market stabilizes at (0, 1, 1), that is, (no government supervision, logistics vehicle enterprises produce NEVs, logistics enterprises use NEVs), which is in line with scenario 3 in the previous analysis of the stabilization point, and this is the ideal state, that is, without the government’s participation, relying solely on the market to make the new energy vehicles in the logistics industry to be applied.
The parameter settings in this paper mainly refer to China’s [49] “New Energy Vehicle Industry Development Plan (2021–2035)”, annual reports of the government and enterprises, the quantitative methods of national policies in reference [50], and the parameter settings in the paper by the literature [51]. Table 6 displays the values of the primary parameters.

4.2. Analysis of Key Parameters

Under the initial parameter settings, this study conducts an in-depth examination of four pivotal parameters: the incremental production cost for vehicle enterprises (ΔC), the credit revenue for vehicle enterprises (S1), the incremental procurement cost for logistics enterprises (ΔR), and the government-imposed fine (L). The aim is to explore how these critical factors influence the system’s evolutionary trajectory.

4.2.1. The Impact of Incremental Costs (ΔC) of Logistics Vehicle Enterprises on System Evolution

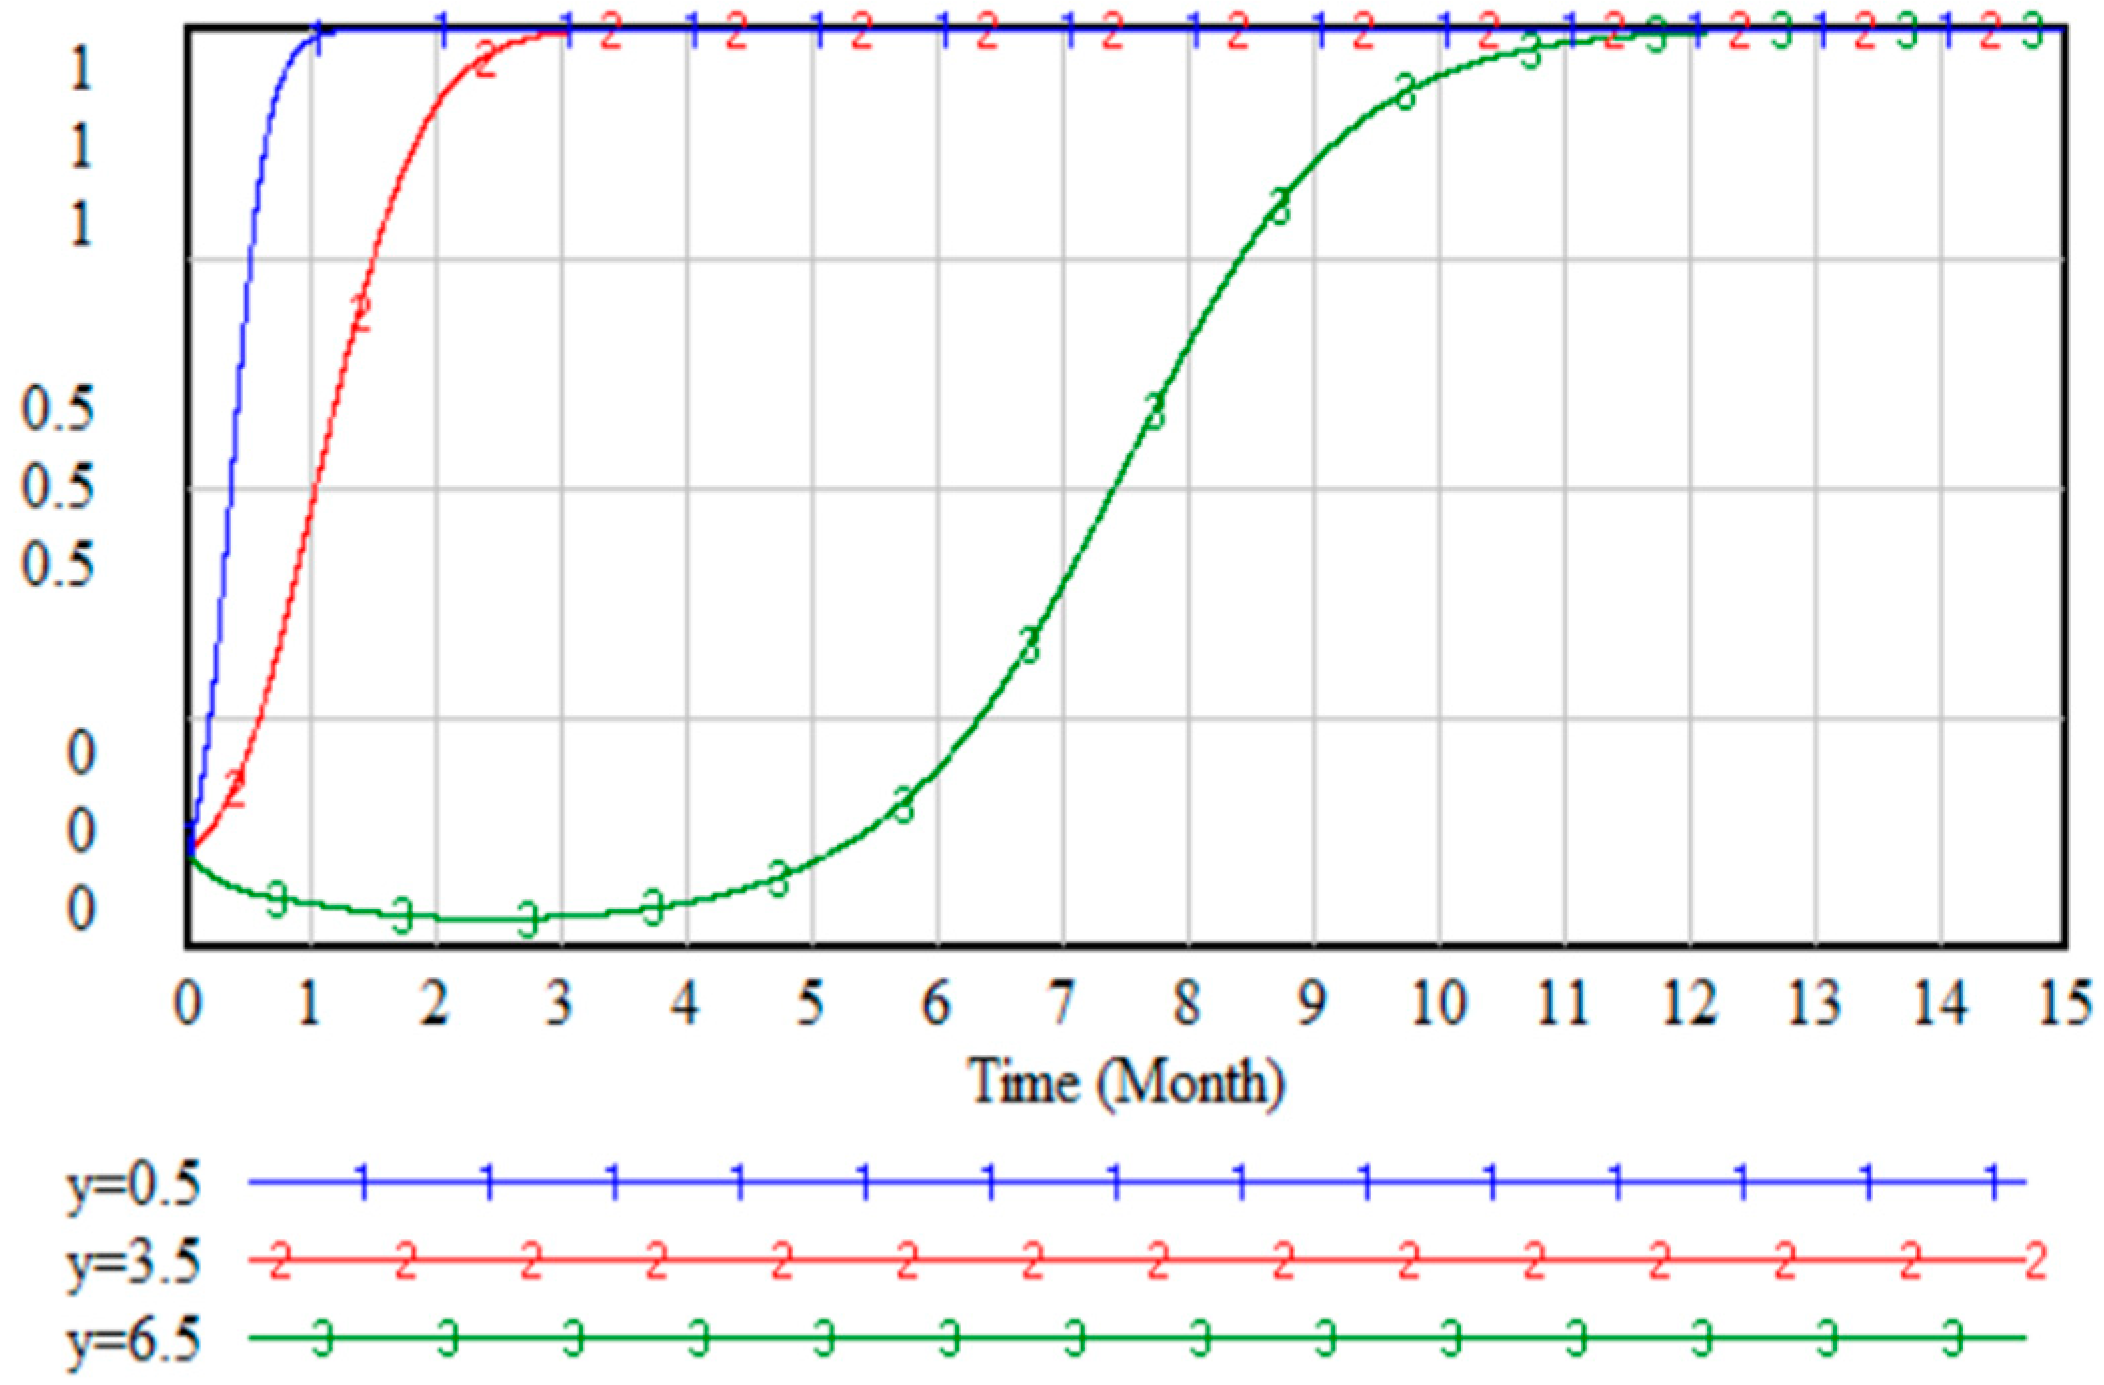
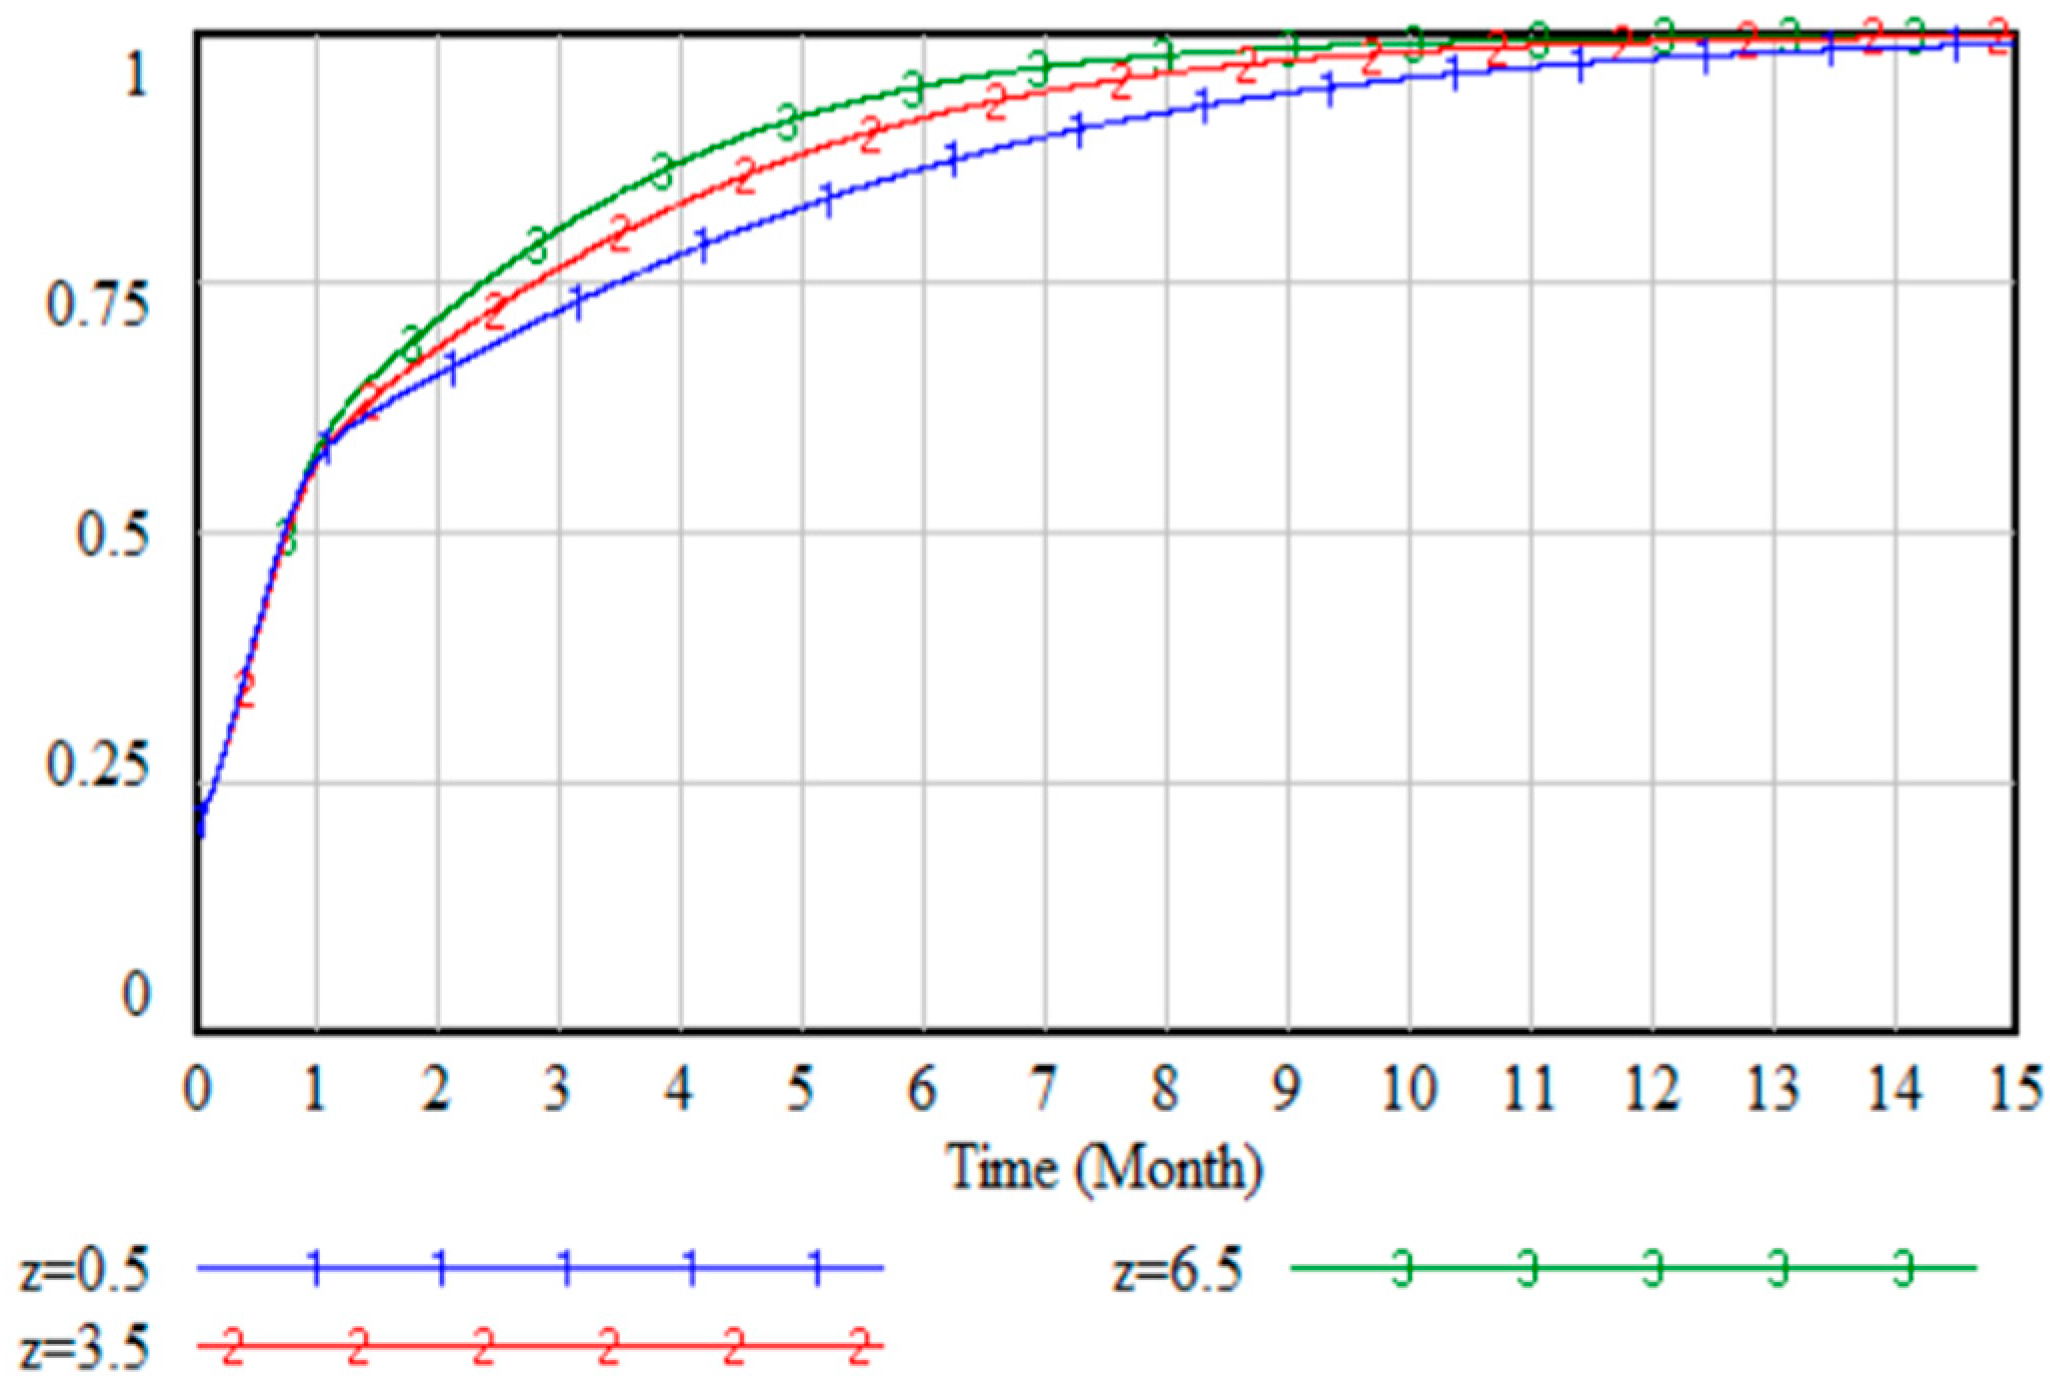
The incremental cost ΔC of NEVs is set for three scenarios: a low scenario (0.5, projected for 2030) [52], a baseline scenario (3.5, projected for 2027) [53], and a high scenario (6.5, set for 2025) [54]. The effects of the increase in this incremental cost on the evolutionary trajectories of the government, logistics vehicle enterprises, and logistics enterprises are shown in Figure 7, Figure 8 and Figure 9.
The graphical analysis reveals that when the incremental cost (ΔC) for logistics vehicle enterprises in producing NEVs remains within a specific threshold, it does not alter the ultimate evolutionary outcome. Specifically, the government still tends not to supervise logistics vehicle enterprises, predominantly favors the production of NEVs, and logistics enterprises continue to prefer the utilization of NEVs. However, as (ΔC) increases, subtle yet discernible changes occur: the probability of the government opting for supervision experiences a marginal rise; in the pre-evolutionary phase, the likelihood of logistics vehicle enterprises producing FVs escalates significantly; and the probability of logistics enterprises adopting NEVs increases marginally.
This phenomenon suggests that with the elevation of production costs, a segment of logistics vehicle enterprises will deviate toward producing FVs. Nevertheless, given the dominant regulatory influence of the DCP on logistics vehicle enterprises, the overall probability of government supervision only moderately increases, and most logistics vehicle enterprises persist in their choice to produce NEVs. Logistics enterprises, being sensitive to government regulatory actions, are inclined to utilize NEVs to capitalize on indirect right-of-way advantages, thereby aligning with the overarching trends of the EGT.

4.2.2. The Impact of Logistics Vehicle Enterprises Points Gain (S1) on System Evolution

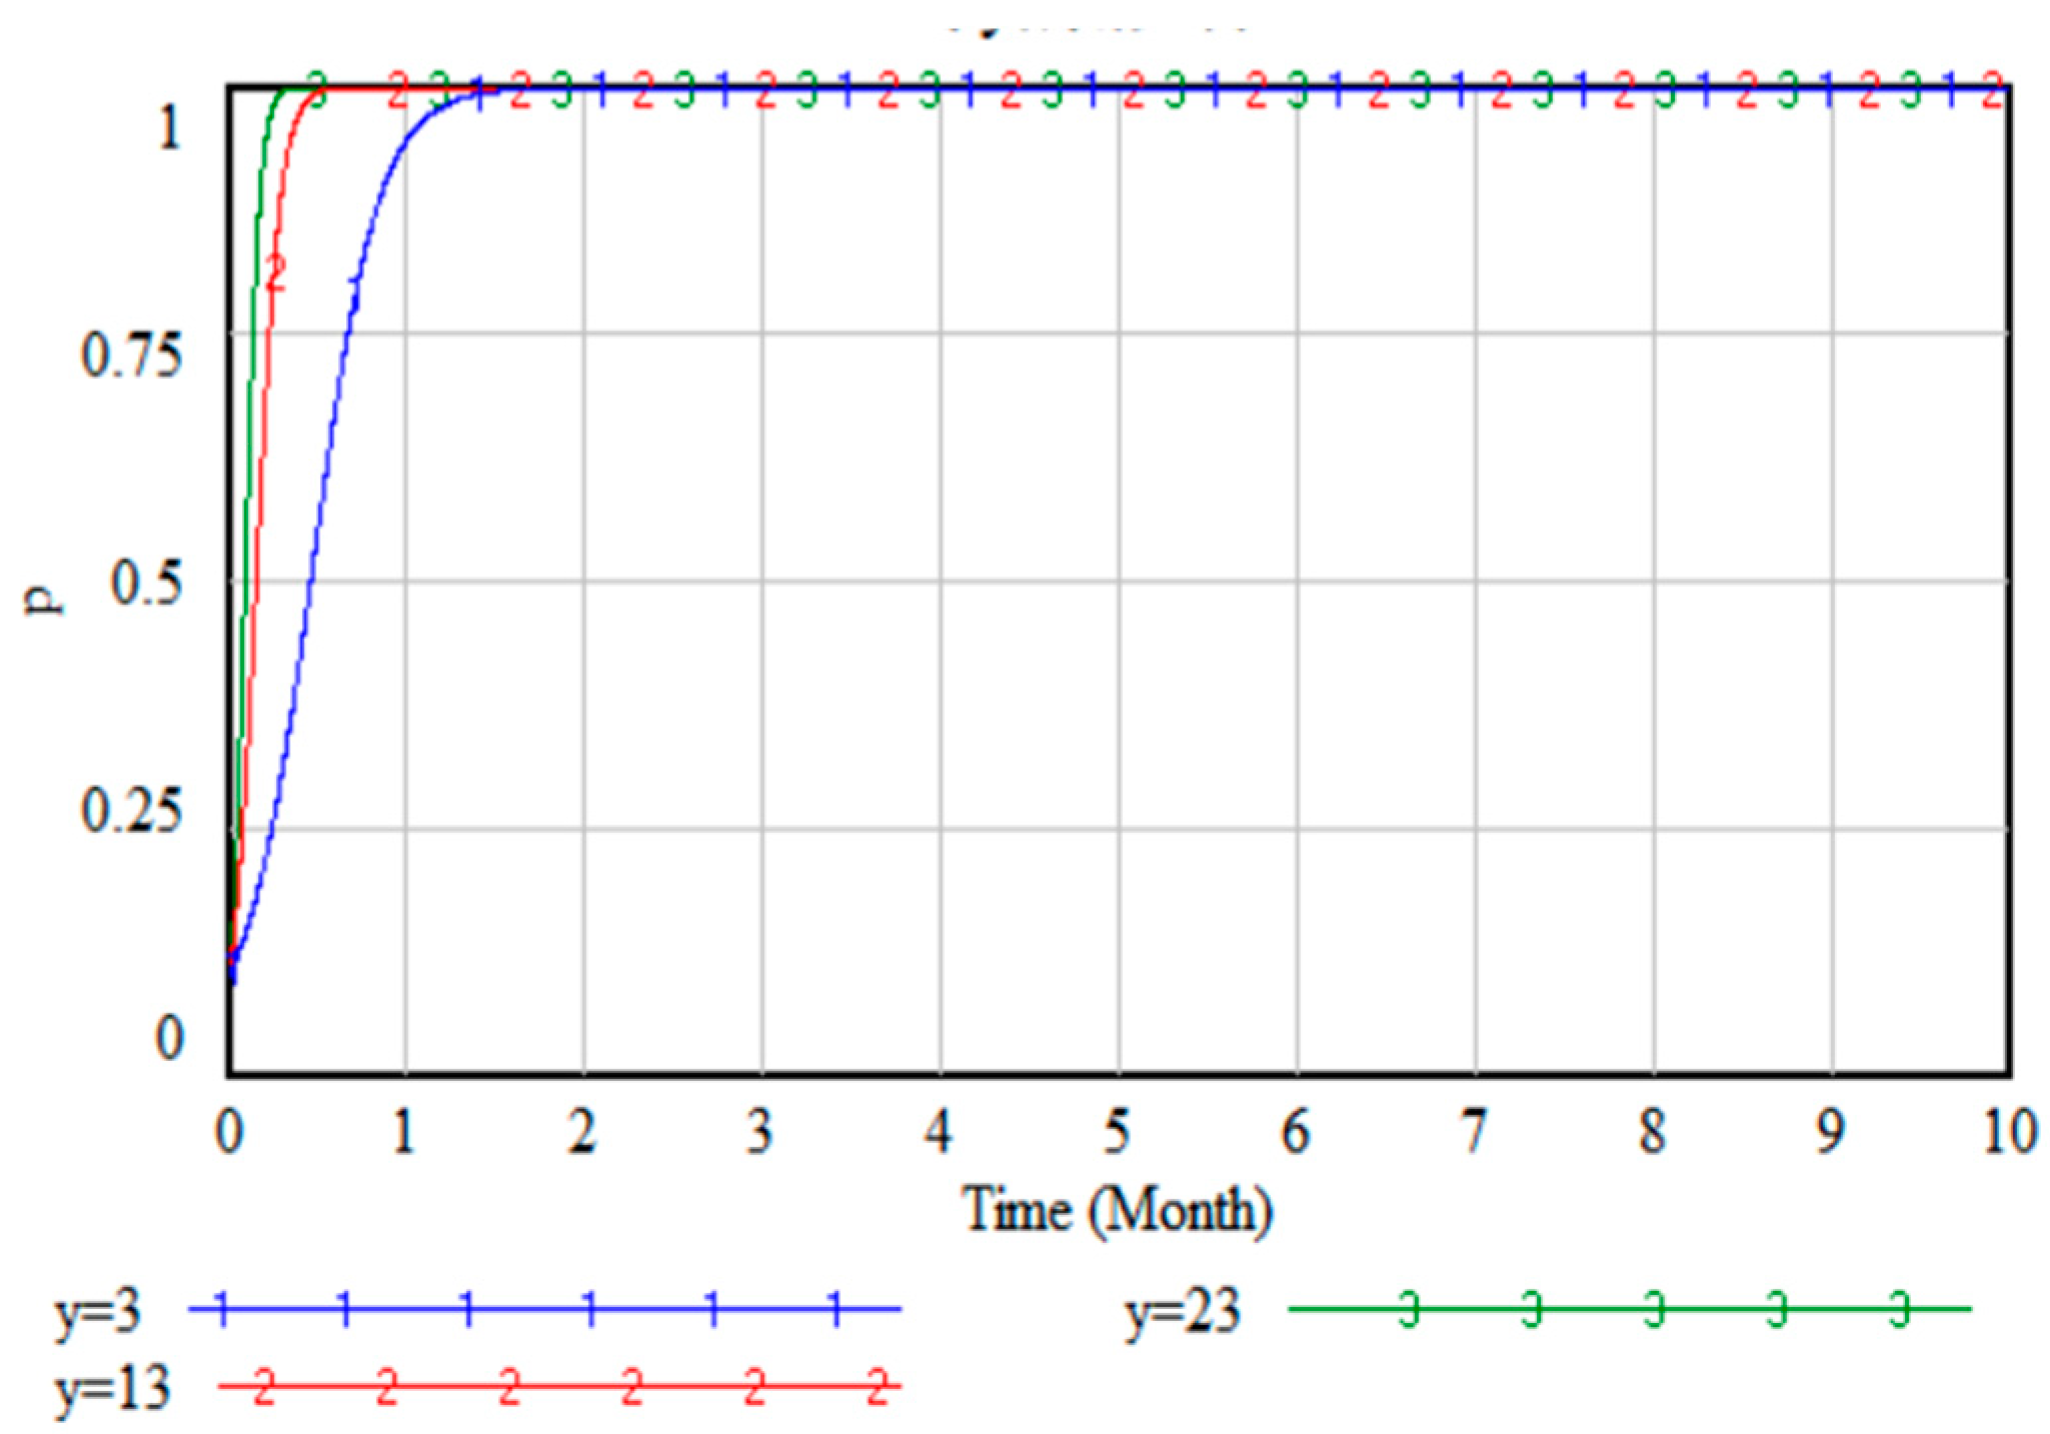
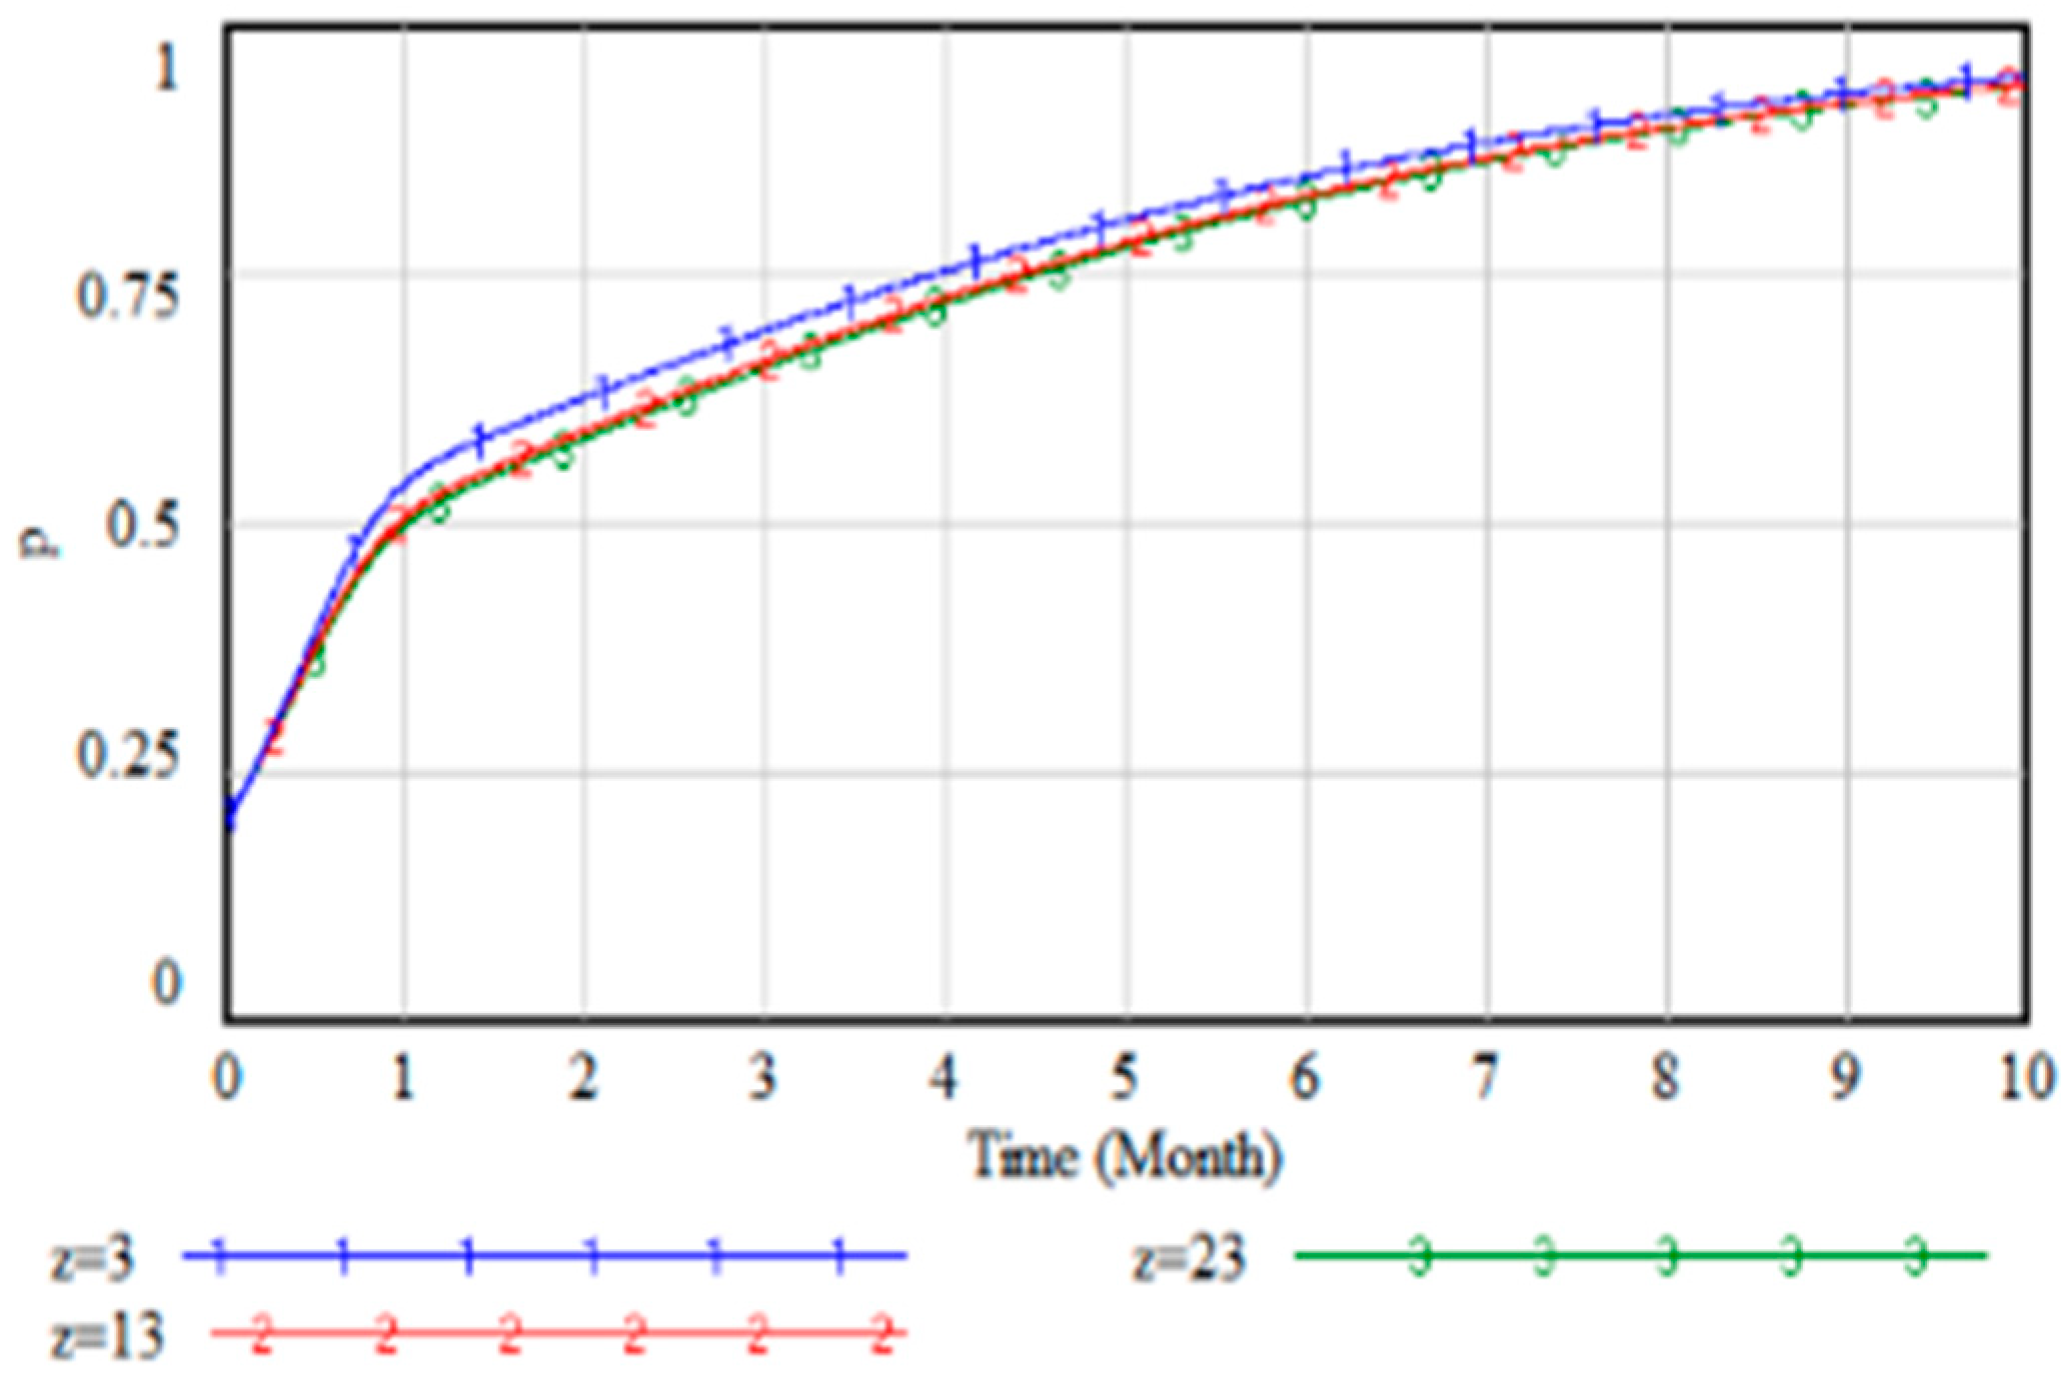
The point gain (S1) for logistics vehicle enterprises producing NEVs is set to 3, 13, and 23, respectively. As the point gain increases, the impact on the evolution paths of the government, logistics vehicle enterprises, and logistics enterprises is shown in Figure 10, Figure 11 and Figure 12.
The graphical analysis demonstrates that when logistics vehicle enterprises are engaged in producing NEVs, an increase in vehicle credit gain (S1) does not alter the long-term evolutionary equilibrium. Specifically, the government still exhibits a proclivity towards non-supervision, logistics vehicle enterprises maintain their preference for producing NEVs, and logistics enterprises continue to favor the utilization of NEVs. However, as the credit gain increases, notable changes in the evolutionary dynamics are observed: the government’s transition towards supervision accelerates, logistics vehicle enterprises evolve more rapidly towards the production of NEVs, and logistics enterprises’ convergence towards adopting NEVs decelerates.
These findings suggest that augmenting the revenue from credit trading can, to a certain degree, offset the elevated production costs associated with NEVs, thereby enhancing the willingness of logistics vehicle enterprises to engage in their production. Moreover, the government can effectively promote the market penetration of NEVs by fine-tuning the DCP, reducing the government’s supervision costs. The decision-making process of logistics enterprises regarding the adoption of NEVs is influenced by a multitude of factors. Among these, cost considerations emerge as the most critical determinant, which will be further explored in the subsequent analysis of its impact on logistics enterprises.

4.2.3. The Impact of Incremental Costs (ΔR) of Logistics Enterprises on System Evolution

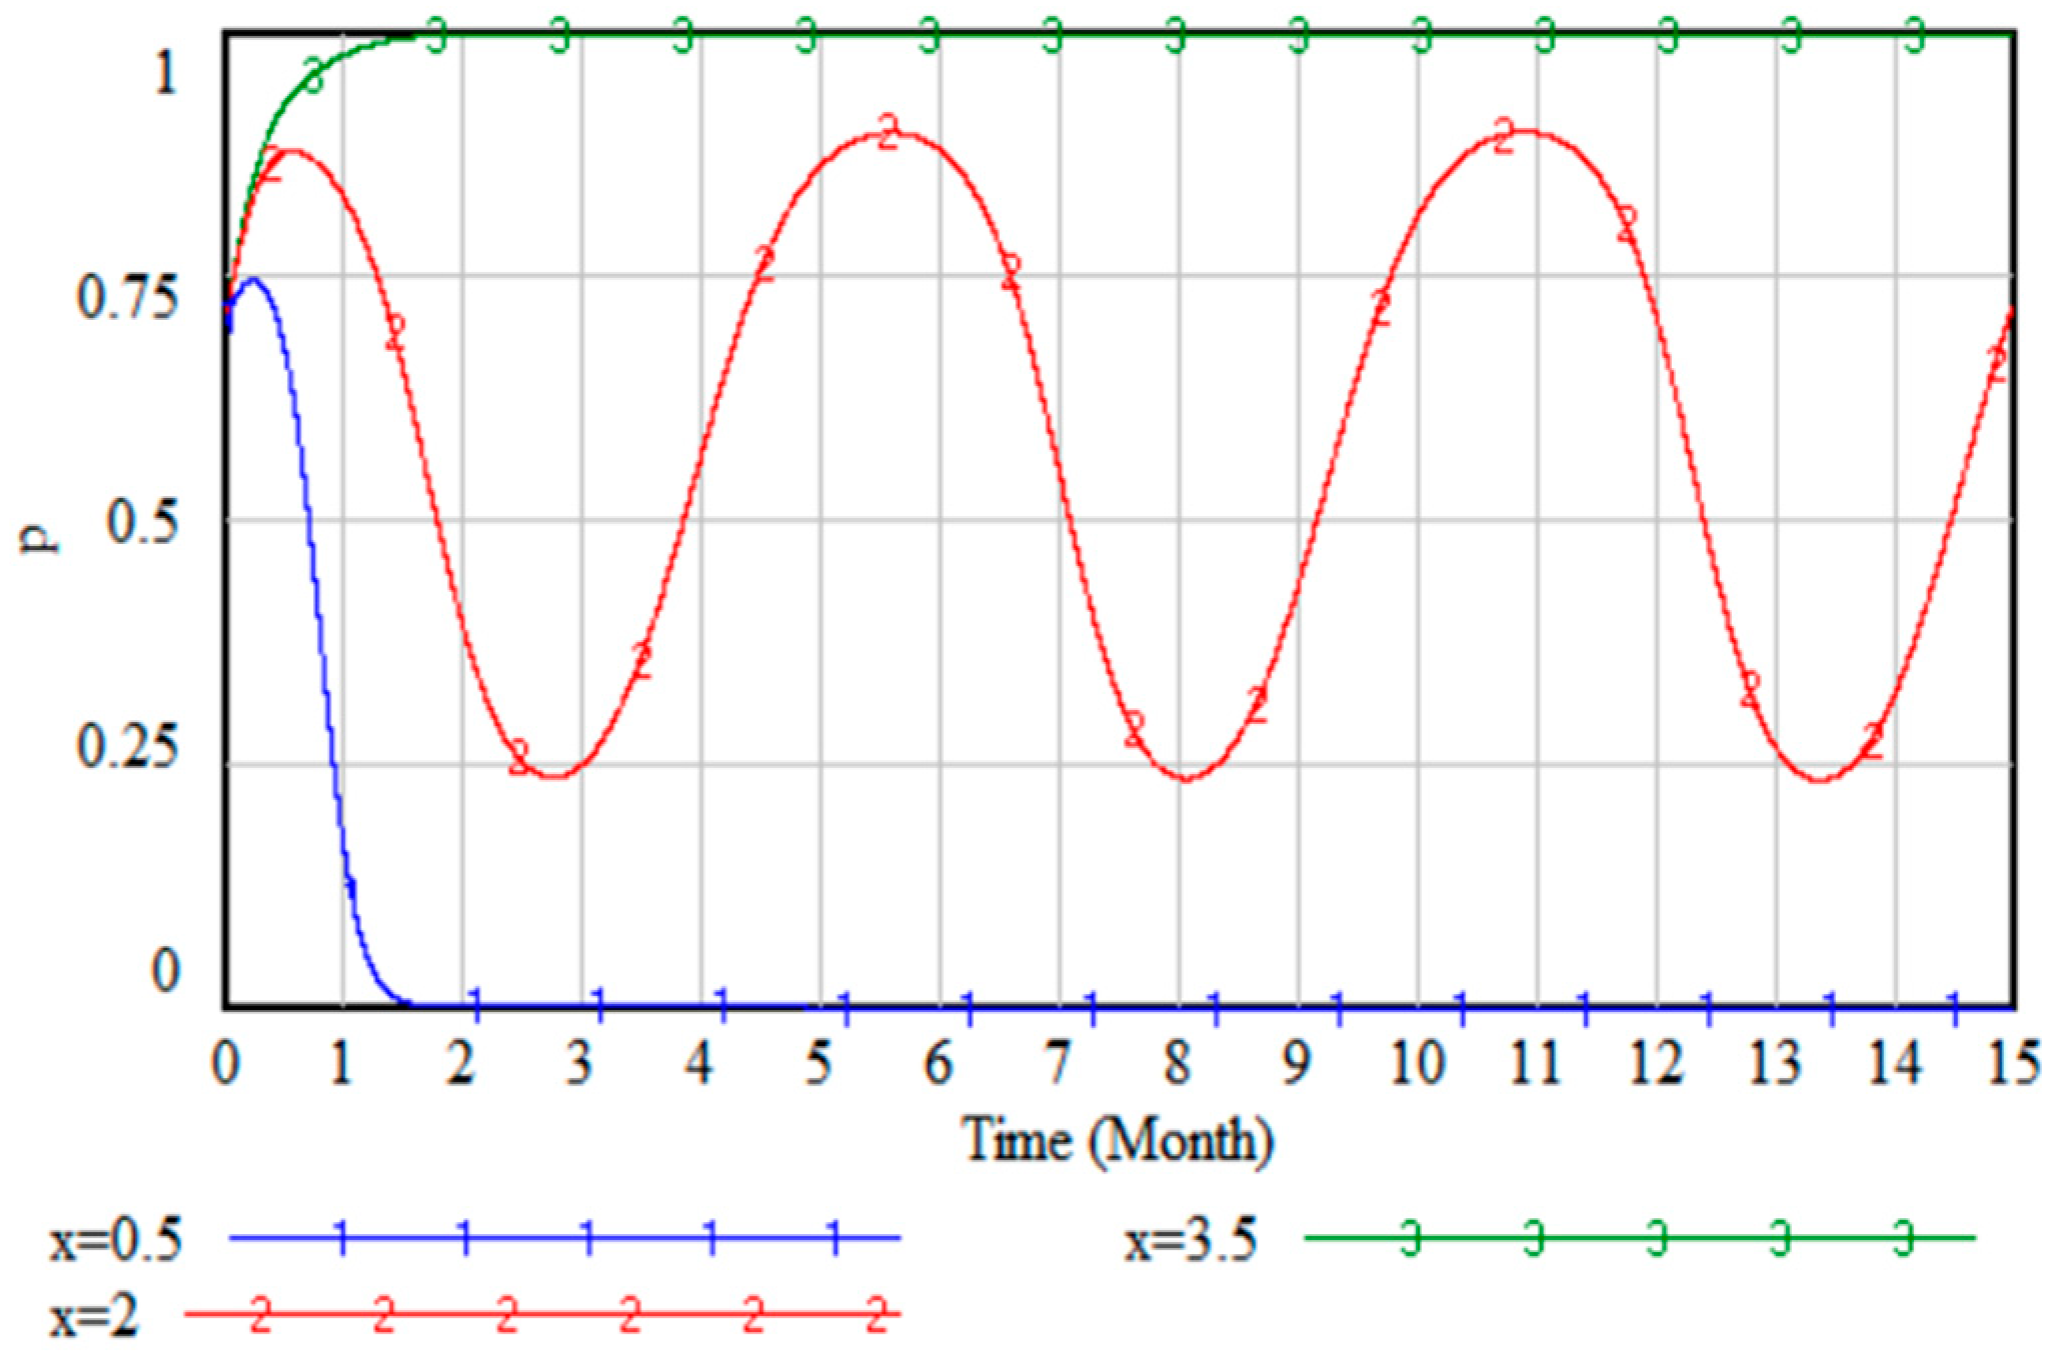
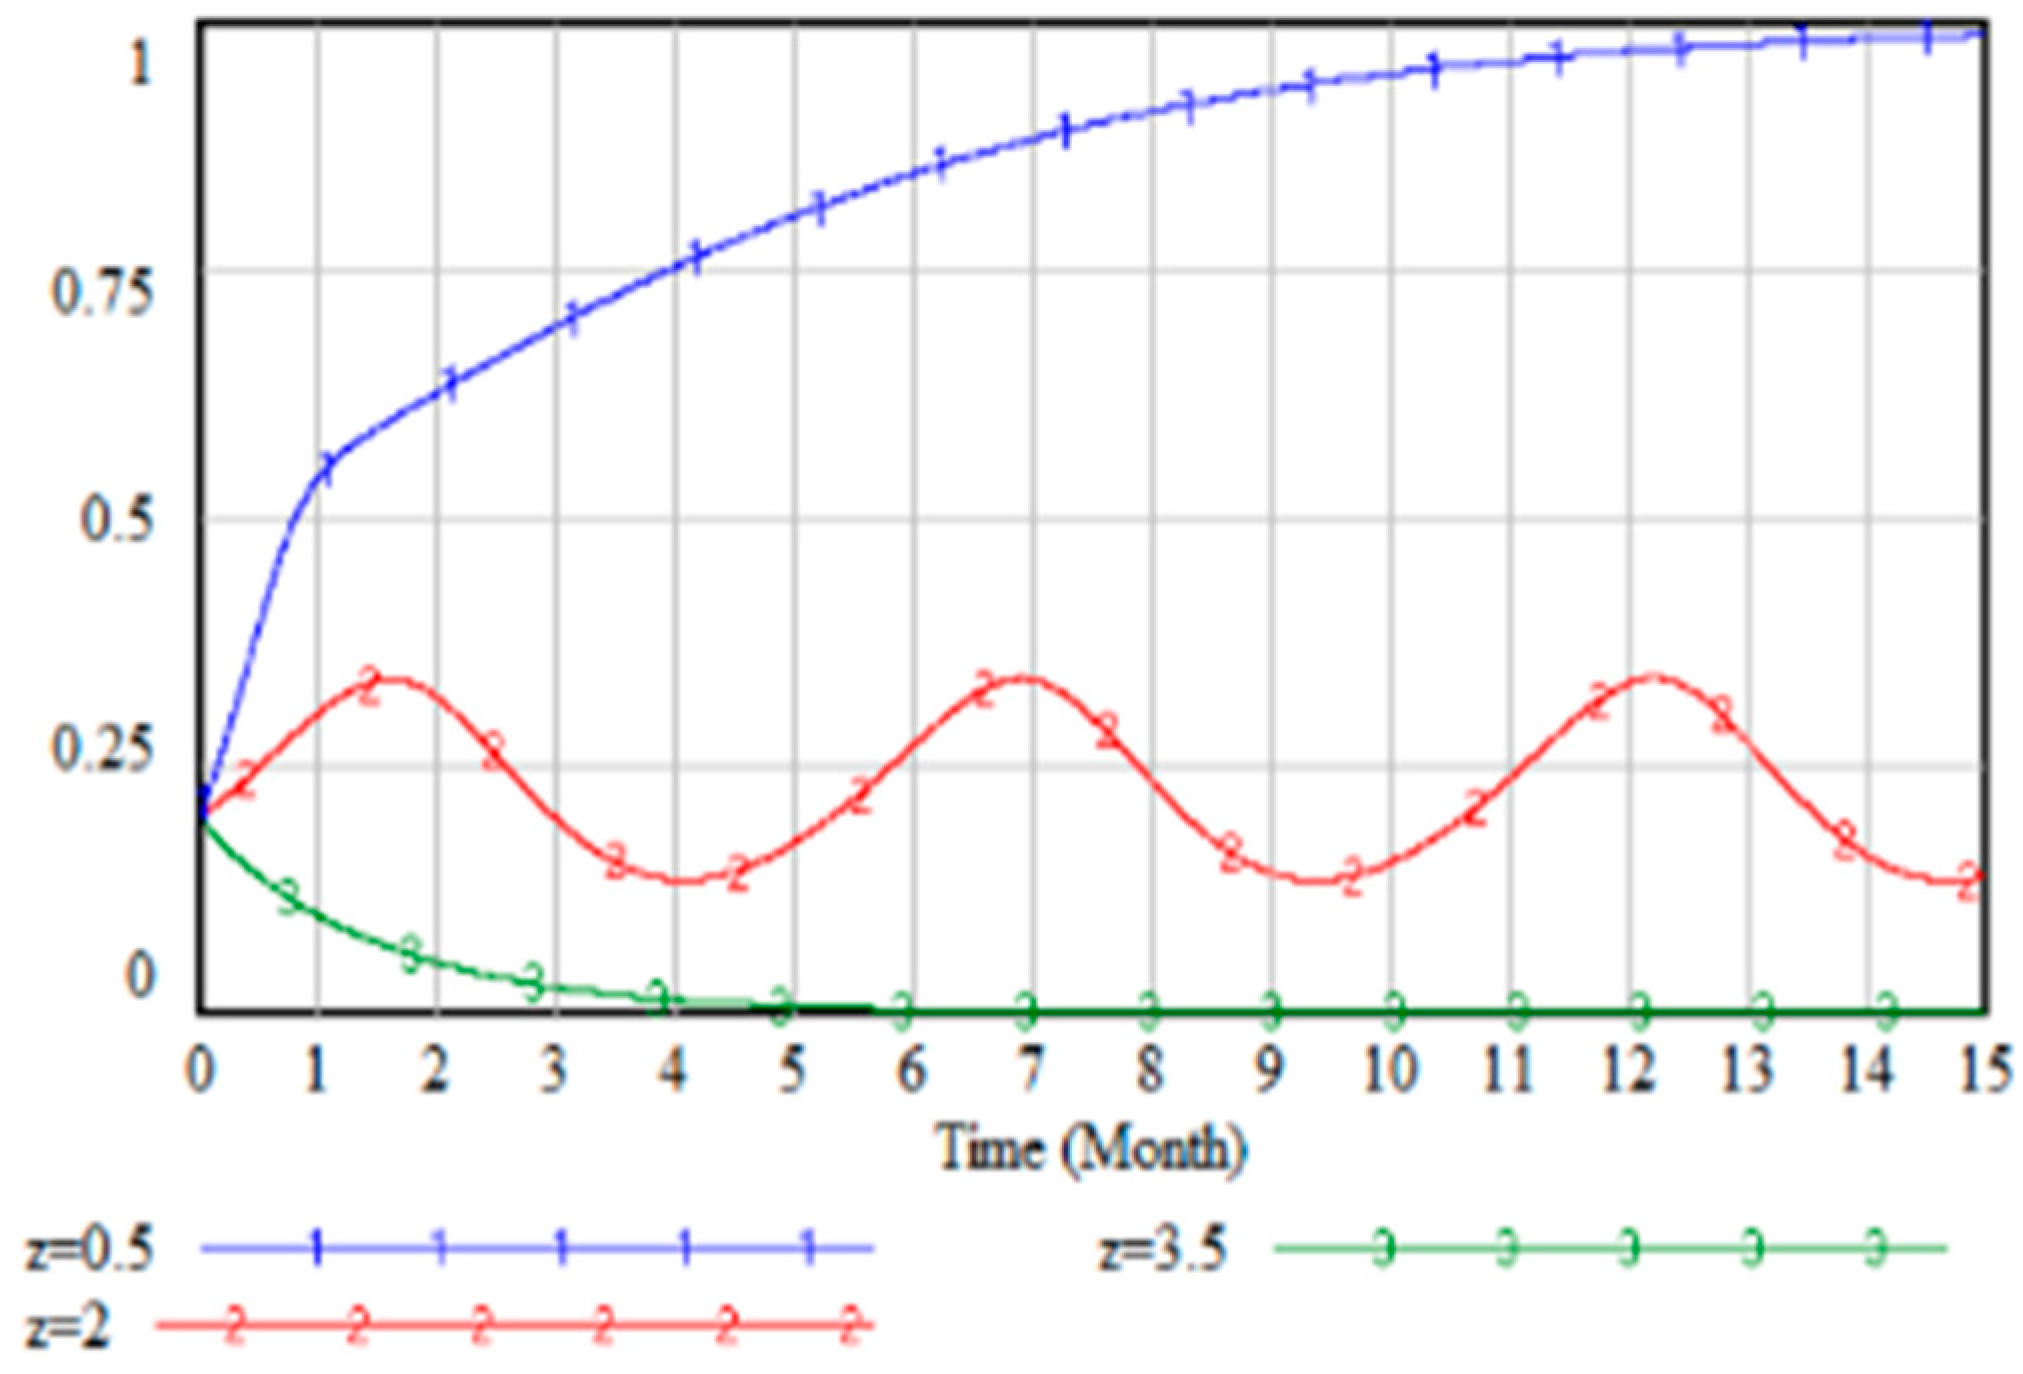
The incremental cost (ΔR) for logistics enterprises to use NEVs is set to 0.5, 2, and 3.5. As the incremental cost increases, the impact on the evolution paths of the government, logistics vehicle enterprises, and logistics enterprises is shown in Figure 13, Figure 14 and Figure 15.
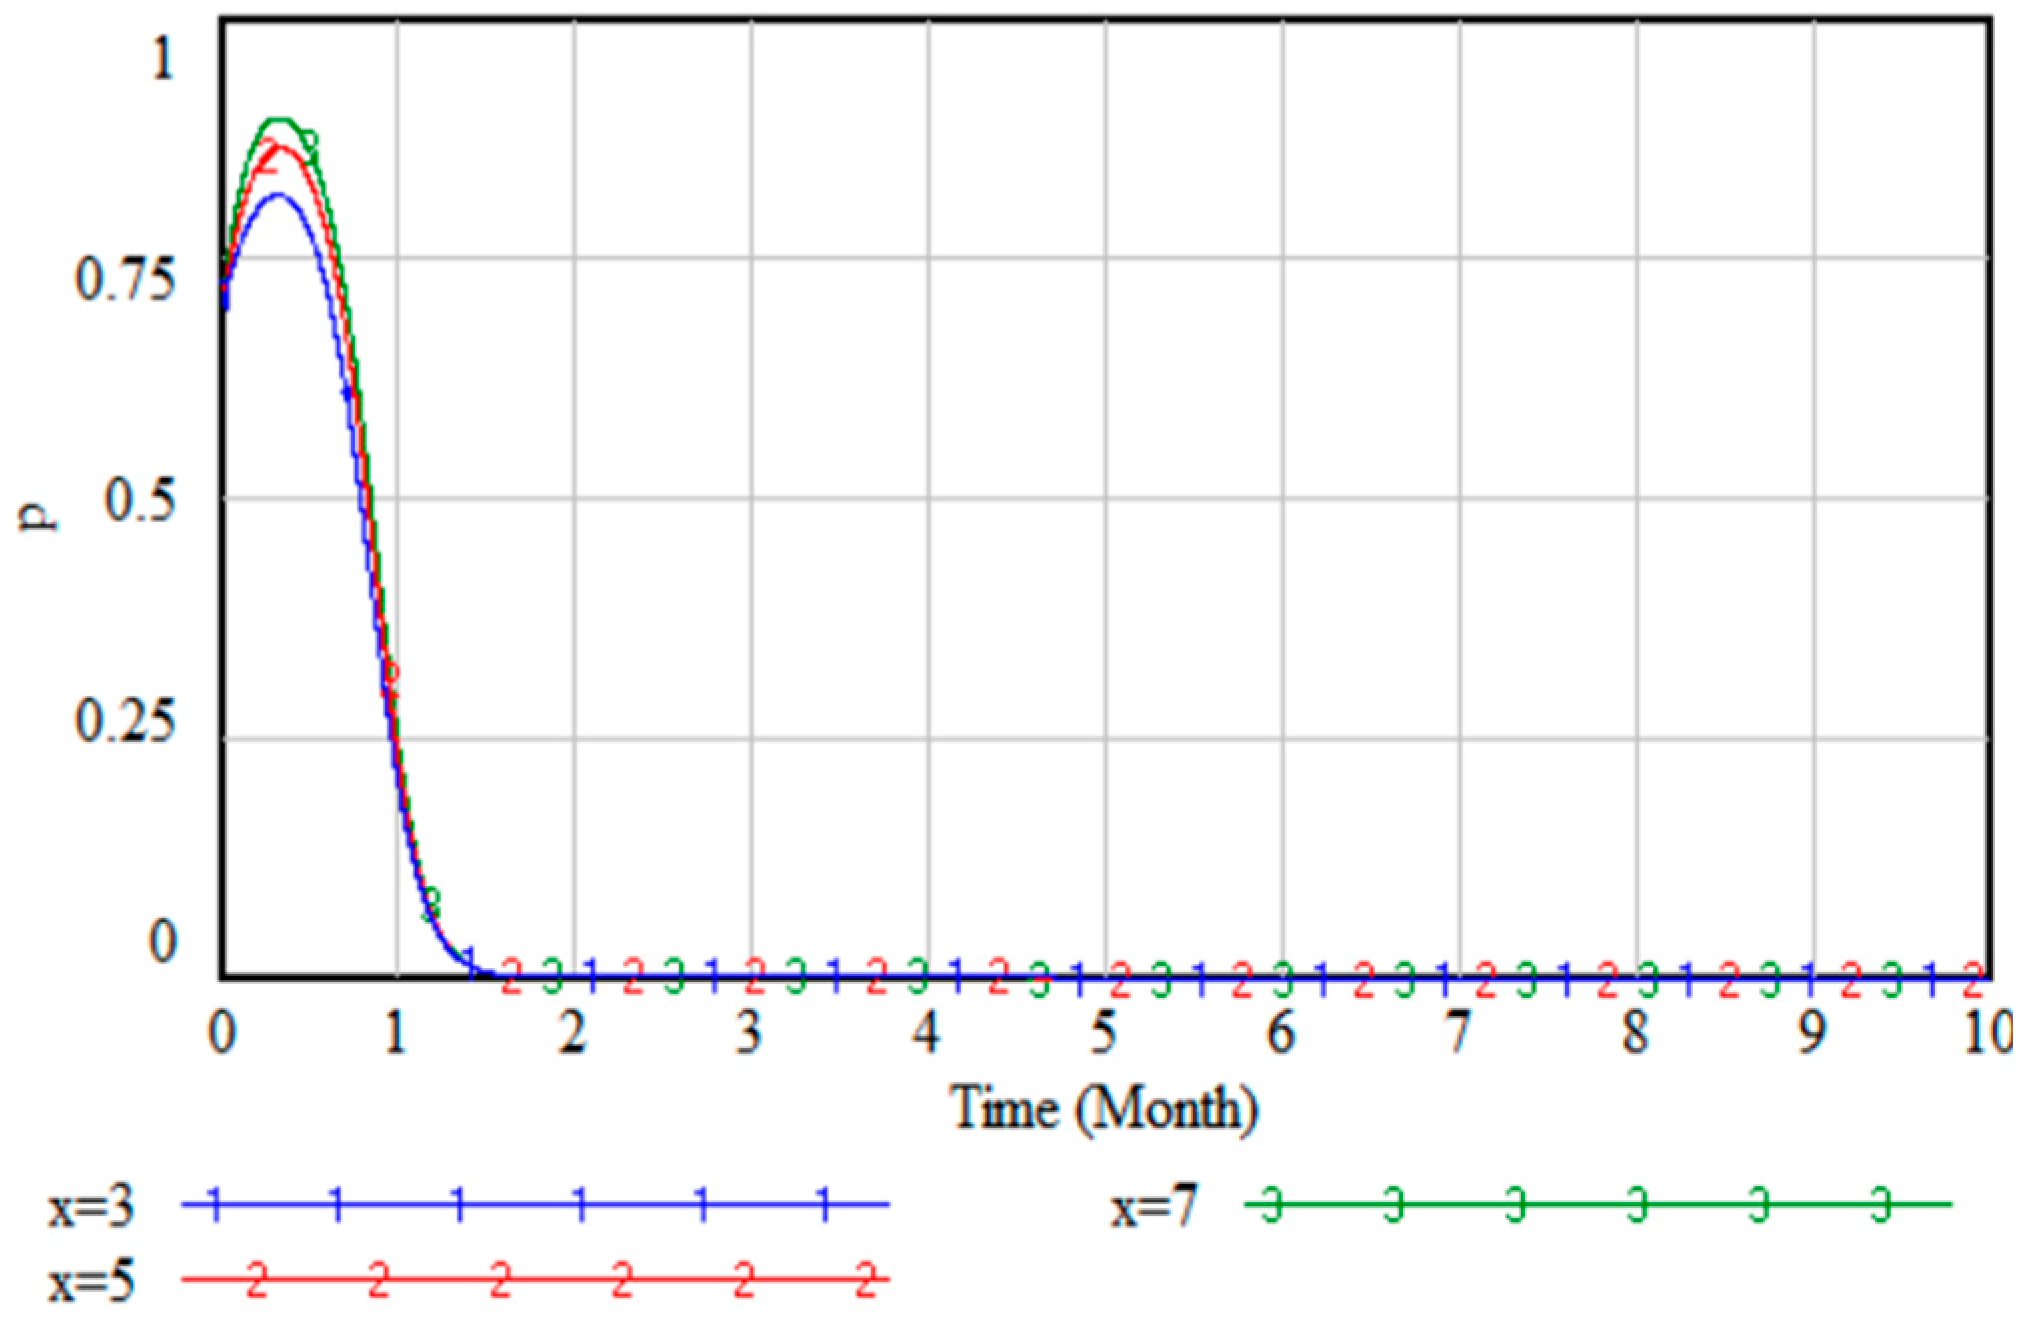
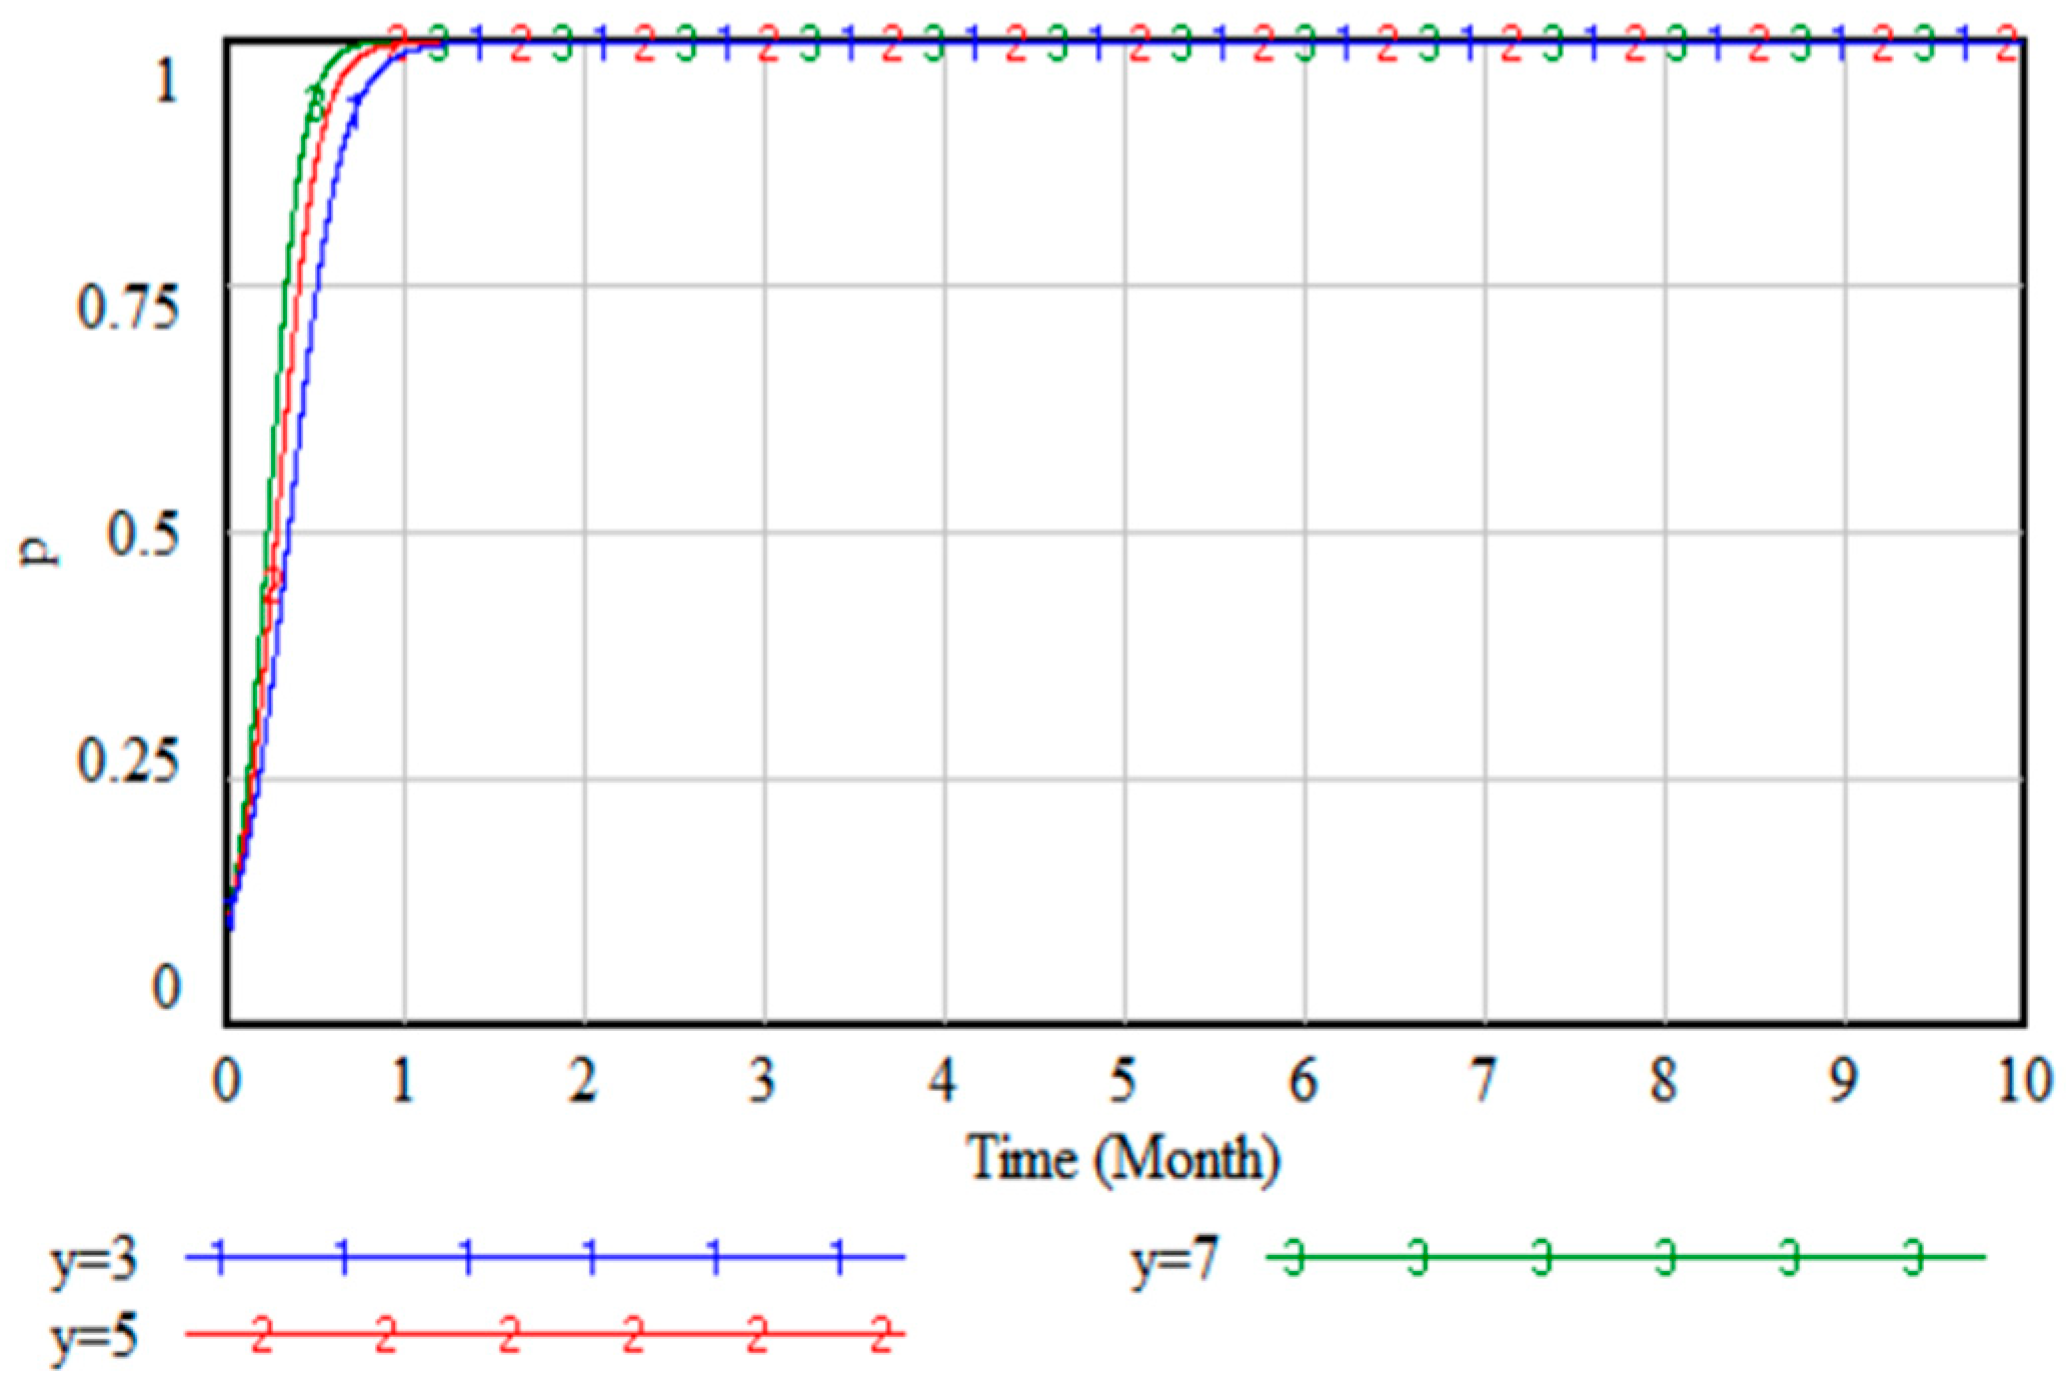
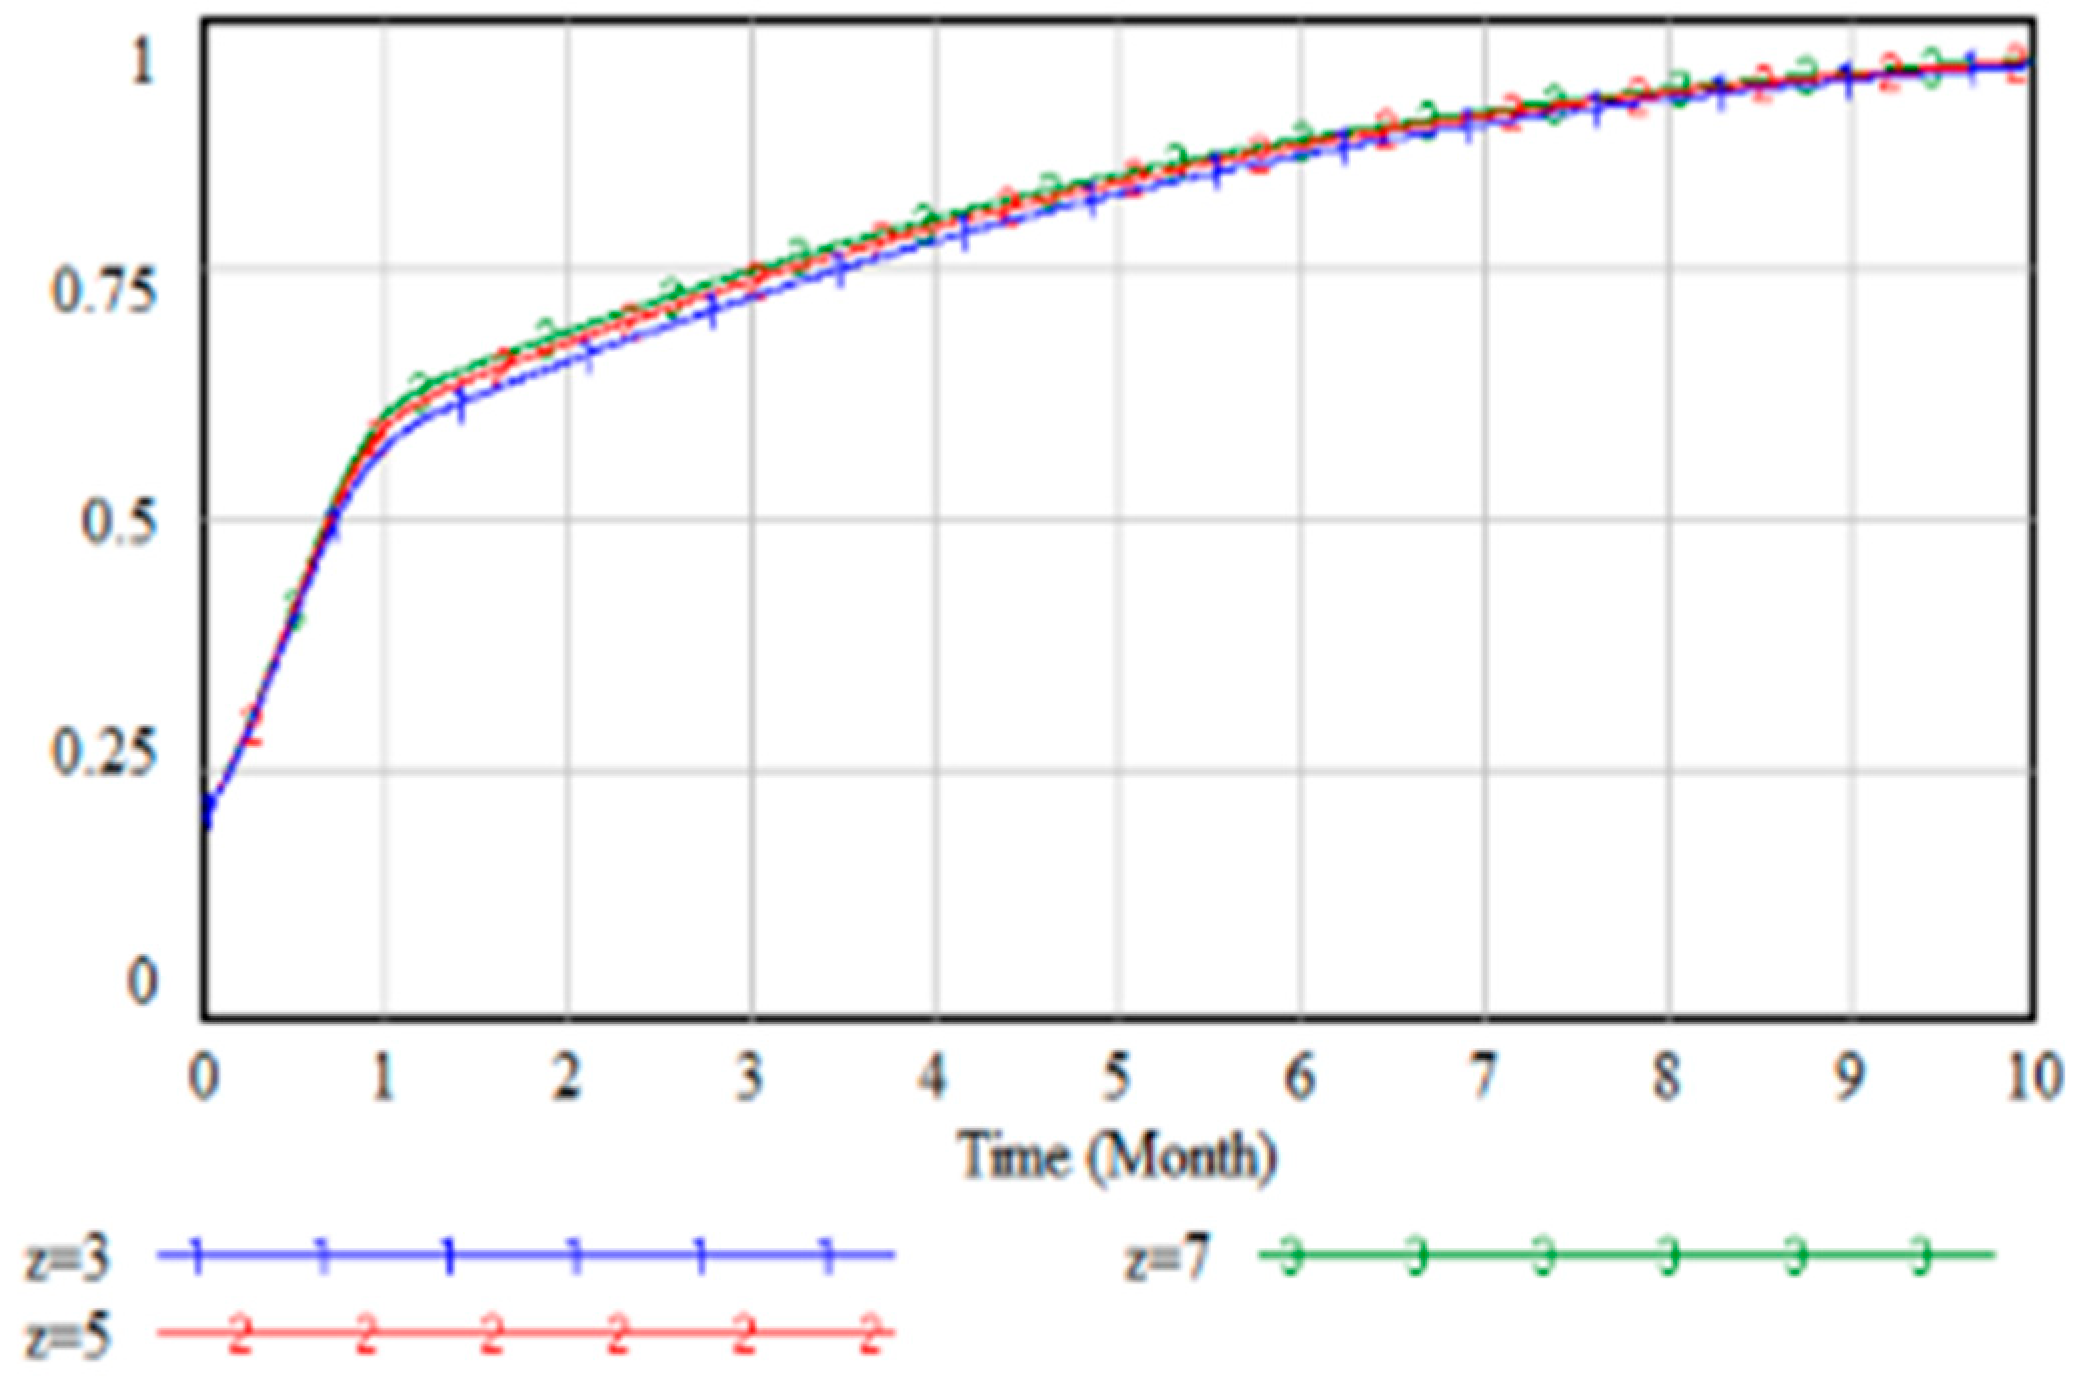
The graphical analysis reveals that an increase in the incremental cost (ΔR) incurred by logistics enterprises when adopting NEVs significantly alters the evolutionary trajectory of the system. Specifically, when ΔR reaches 2, the probability of government supervision fluctuates within the range of 0.25–0.9. Logistics vehicle enterprises persist in choosing to produce NEVs, while the probability of logistics enterprises utilizing NEVs fluctuates between 0.1–0.3. As ΔR further escalates to 3.5, a distinct equilibrium emerges: the government invariably chooses to implement supervision, logistics vehicle enterprises continue to produce NEVs, yet logistics enterprises predominantly opt for FVs, resulting in the system converging to the state represented by (1, 1, 0).
These results indicate that with the rising costs associated with NEV utilization, many logistics enterprises revert to traditional FVs. This shift precipitates a surge in the market presence of FVs, thereby exacerbating environmental pollution. In response, the government, aiming to mitigate environmental degradation and foster sustainable development, resorts to regulatory measures to minimize ecological losses. Under the influence of government supervision, logistics vehicle enterprises, to comply with policy directives and secure associated incentives, redouble their efforts in producing, researching, and developing NEVs.

4.2.4. The Impact of Government Fines (L) on the System Evolution of Logistics Vehicle Enterprises

The fines (L) imposed by the government on logistics vehicle enterprises are set to 3, 5, and 7. As the incremental fines increase, the impact on the evolutionary paths of the government, logistics vehicle enterprises, and logistics enterprises is shown in Figure 16, Figure 17 and Figure 18.
The graphical results indicate that the system’s evolutionary trajectory remains unaltered as the government escalates the fines imposed on FV-producing enterprises. Specifically, the system’s equilibrium state consistently converges to (0, 1, 1), signifying that the government ultimately opts for non-supervision, logistics vehicle enterprises specialize in producing NEVs, and logistics enterprises predominantly utilize NEVs. Notably, distinct temporal dynamics are observed during the initial cycles (0–1): the government’s convergence towards non-supervision decelerates, while the evolutionary pace of logistics vehicle enterprises accelerates. Subsequently, within cycles 1–10, the evolutionary progression of logistics enterprises experiences a marked acceleration, demonstrating a more rapid transition toward the utilization of NEVs.
This indicates that in cycles 0–1, even if the fine is raised, a small number of logistics vehicle enterprises still choose to produce FVs for cost reasons. The government will be more inclined to monitor, under government supervision, the probability of logistics vehicle enterprises producing NEVs increasing. As the government supervises logistics enterprises, they will be more inclined to use NEVs.

5. Conclusions and Recommendations

5.1. Conclusions

In this paper, based on the premise of finite rationality of the game parties, we constructed a tripartite EGT model of the government, logistics vehicle enterprises, and logistics enterprises for solving and analyzing. We numerically simulated the key factors by combining them with SD. The following main conclusions are drawn:
(1)
The tripartite game’s ideal stability strategy combination is (0, 1, 1), which describes {no government supervision, logistics vehicle enterprises produce NEVs, logistics enterprises use NEVs}.
(2)
When the incremental cost of producing NEVs by logistics vehicle enterprises is controllable, the government is inclined to employ a lenient regulatory policy. In this case, logistics vehicle enterprises are more willing to commit to producing NEVs. At the same time, due to the potential profits that the right-of-way policy may bring, logistics enterprises are also more inclined to adopt and use NEVs.
(3)
An increase in the dual-credit gain has a pronounced effect on motivating logistics vehicle enterprises to produce NEVs. Nevertheless, the rate at which logistics enterprises adopt NEVs continues to be restricted by cost-related factors.
(4)
When the cost (ΔR) of using NEVs rises for logistics enterprises, they may reconsider using FVs. In the face of environmental pollution problems, the government will be more likely to increase its supervision. Logistics vehicle enterprises will tend to produce NEVs to obtain government incentives.
(5)
With government incentives remaining unchanged and fines increasing, the probability of initial government oversight will increase. This will prompt logistics vehicle enterprises to transform and increase the production of NEVs rapidly. At the same time, logistics enterprises will accelerate the pace of NEVs.

5.2. Recommendations

The recommendations below are offered in light of the study’s outcomes to actively align with national low-carbon and environmental protection policies, facilitate the logistics industry’s achievement of energy conservation and emission reduction objectives, and enhance the adoption and promotion of NEVs within the industry.
(1)
Multi-dimensionally encourage logistics enterprises to adopt NEVs. The government can give NEVs more right-of-way, optimize the layout of charging facilities, reduce or waive road tolls, and implement other preferential policies to stimulate logistics enterprises to buy NEVs and increase their willingness to use them.
(2)
Optimize the DCP and increase the value of points trading. The DCP has a positive regulatory impact on advancing the NEV industry, and the government should continue to optimize the relevant policies and appropriately increase the value of NEV points to motivate logistics vehicle enterprises to produce more NEVs to make up for the cost increase.
(3)
Promote the cost reduction of NEVs and enhance market competitiveness. Encourage logistics vehicle enterprises to reduce the production cost of NEVs through technological innovation, research, and development of new batteries, scale effect, energy management optimization, and other means to make them more competitive in the market, thus making them more motivated to use NEVs. Moreover, long-term cost management should be prioritized by considering battery disposal expenses. Develop a standardized, efficient battery recycling system, invest in R&D, and boost recycling rates and resource conversion efficiency to cut retired battery disposal costs.
(4)
Appropriate policy support to reduce the incremental cost of NEVs. Give NEV enterprises certain incentives (tax incentives, negative points reduction, transfer, carry-over, etc.) in the early stage of subsidy degradation and increase penalties for enterprises producing FVs when necessary, which will help to make up for the production cost of the vehicle enterprises, incentivize the production of NEVs by logistics vehicle enterprises, and help encourage the logistics sector’s shift toward a low-carbon future.
This paper analyzes the key factors in promoting NEVs based on China’s current policy on NEVs. However, the NEV market is a complex system involving more stakeholders and influencing factors, and this paper only considers three stakeholders and 15 factors. In future research, we can consider taking more stakeholders into account, such as constructing a four-party game model of the government, logistics vehicle raw material suppliers, logistics vehicle manufacturers, and logistics enterprises. Additionally, we can consider factors such as consumer willingness, improvements in charging facilities, charging station availability, electricity prices, battery disposal costs, technological advances into account, and demand fluctuations (e.g., e-commerce spikes, oil price fluctuations, and the impact of emerging business models) as well as the limitations of new energy vehicles in logistics in parameter setting.

Author Contributions

Conceptualization, X.H. and C.M.; methodology, X.H. and C.Z.; software, C.M.; writing—original draft preparation, X.H., C.M. and C.Z.; writing—review and editing, X.H., C.M. and C.Z.; funding acquisition, X.H. All authors have read and agreed to the published version of the manuscript.

Funding

This work is supported by the National Key R&D Program of China (No. 2022YFE0120000), the Natural Science Foundation of Inner Mongolia Autonomous Region (No. 2023LHMS06016), the Fundamental Research Fund for Directly Affiliated Universities in Inner Mongolia Autonomous Region (No. JY20240010), and the Construction Project of Key Research Institute of Humanities and Social Sciences at Universities of Inner Mongolia Autonomous Region (No. 202305).

Institutional Review Board Statement

Not applicable.

Informed Consent Statement

Not applicable.

Data Availability Statement

Data are contained within the article.

Conflicts of Interest

The authors declare no conflicts of interest.

References

  1. He, L.Y.; Yin, F.; Zhong, Z.Q.; Ding, Z.H. The impact of local government investment on the carbon emissions reduction effect: An empirical analysis of panel data from 30 provinces and municipalities in China. PLoS ONE 2017, 12, e0180946. [Google Scholar] [CrossRef]
  2. Wang, Q.; Feng, Y.; Hu, A. Optimal utilization of ecological economic resources and low-carbon economic analysis from the perspective of Public Health. Front. Public Health 2023, 11, 1152809. [Google Scholar] [CrossRef] [PubMed]
  3. China Federation of Logistics and Purchasing. China Green Logistics Development Report (2023); China Federation of Logistics and Purchasing: Beijing, China, 2023. [Google Scholar]
  4. Intelligent Research Consulting. Available online: https://www.chyxx.com/ (accessed on 19 November 2024).
  5. Liu, L.H.; Wu, Y.L.; Liu, S.Q.; Chen, Z.X. Equilibrium study of logistics demand and logistics resource allocation in Guangdong Province. Sci. Rep. 2025, 15, 3805. [Google Scholar] [CrossRef] [PubMed]
  6. Song, R.; Shi, W.; Qin, W.; Xue, X. Exploring the interplay of new energy vehicle enterprises, consumers, and government in the context of the “dual carbon” target: An evolutionary game and simulation analysis. PLoS ONE 2023, 18, e0291175. [Google Scholar] [CrossRef] [PubMed]
  7. Xue, H.T.; Song, Z.W.; Wu, M.; Sun, N.; Wang, H.Q. Intelligent Diagnosis Based on Double-Optimized Artificial Hydrocarbon Networks for Mechanical Faults of In-Wheel Motor. Sensors 2022, 22, 6316. [Google Scholar] [CrossRef]
  8. KBA-Kraftfahrt-Bundesamt. Available online: https://www.kba.de/EN/Home/home_node.html (accessed on 19 November 2024).
  9. Chen, L.X.; Huang, J.Y. Study on the Interaction Effect between the Intensity of Government Low-Carbon Subsidies and the Growth Ability of Green and Low-Carbon Emerging Enterprises. Int. J. Environ. Res. Public Health 2023, 20, 2438. [Google Scholar] [CrossRef]
  10. Cai, D.; Guo, C.; Tan, Y. Design of Incentive Contract for Technological Innovation of New Energy Vehicles with Asymmetric Information. Int. J. Environ. Res. Public Health 2019, 16, 4544. [Google Scholar] [CrossRef]
  11. Yu, Y.; Zhou, D.; Zha, D.; Wang, Q.; Zhu, Q. Optimal production and pricing strategies in auto supply chain when dual credit policy is substituted for subsidy policy. Energy 2021, 226, 120369. [Google Scholar] [CrossRef]
  12. Zhang, X.; Hu, X.M.; Qi, L. Terminated Local Subsidy on Electric Vehicle Adoption during the COVID-19 Pandemic: The Case of Chongqing City. Energy 2022, 259, 124891. [Google Scholar] [CrossRef]
  13. Chinese Government Website. Available online: https://www.gov.cn/ (accessed on 20 November 2024).
  14. Yu, H.; Li, Y.; Wang, W. Does the Dual-Credit Policy Promote the Technological Development of New Energy Vehicles? An Industry Chain Reconstruction Perspective. Heliyon 2024, 10, e31009. [Google Scholar] [CrossRef]
  15. Wang, J.L.; Liu, X.B. Research on the Development Strategy Selection of the New Energy Vehicle Industry from the Perspective of Green Credit—Based on the Foursquare Evolutionary Game Analysis. PLoS ONE 2024, 19, e0297813. [Google Scholar] [CrossRef] [PubMed]
  16. Fan, W.; Gao, B. How State-Owned Vehicle Enterprises Face the Disruptive Technological Revolution—The Case of SAIC. Culture 2024, 2, 90–100. [Google Scholar]
  17. Wu, S.S.; Gong, X.; Wang, Y.F.; Cao, J. Consumer Cognition and Management Perspective on Express Packaging Pollution. Int. J. Environ. Res. Public Health 2022, 19, 4895. [Google Scholar] [CrossRef] [PubMed]
  18. Li, C.; Zhang, Z.C.; Wang, L.P. Carbon Peak Forecast and Low Carbon Policy Choice of Transportation Industry in China: Scenario Prediction Based on STIRPAT Model. Environ. Sci. Pollut. Res. 2023, 30, 63250–63271. [Google Scholar] [CrossRef]
  19. Ren, T.; Chen, Y.; Xiang, Y.C.; Xing, L.N.; Li, S.D. Low Carbon Cold Chain Vehicle Path Optimization Considering Customer Satisfaction. CIMS 2020, 26, 1108–1117. [Google Scholar]
  20. Yin, N. Multiobjective Optimization for Vehicle Routing Optimization Problem in Low-Carbon Intelligent Transportation. IEEE Trans. Intell. Transp. Syst. 2023, 24, 13161–13170. [Google Scholar] [CrossRef]
  21. Wang, Y.; Zhou, X.; Liu, Y.; Xu, M.Z. Optimization of multi-center co-distribution alliance based on vehicle sharing. CIMS 2021, 27, 1820–1832. [Google Scholar]
  22. Liu, W.; Li, W.; Zhou, Q.; Die, Q.; Yang, Y. The optimization of the “UAV-vehicle” joint delivery route considering mountainous cities. PLoS ONE 2022, 17, e0265518. [Google Scholar] [CrossRef]
  23. Zhang, S.Y.; Chen, N.; Song, X.M.; Yang, J. Optimizing decision-making of regional cold chain logistics system in view of low-carbon economy. Transp. Res. Part A Policy Pract. 2019, 130, 844–857. [Google Scholar] [CrossRef]
  24. Zhang, W.; Zhang, M.Y.; Zhang, W.Y.; Zhou, Q.; Zhang, X.X. What Influences the Effectiveness of Green Logistics Policies? A Grounded Theory Analysis. Sci. Total Environ. 2020, 71, 136731. [Google Scholar] [CrossRef]
  25. Han, X.B.; Han, Y.; Ke, R.; Zhao, J.H. Research on the Cooperation Model of New Energy Vehicle Supply Chain under the Background of Government Subsidies Declining. Sustainability 2022, 14, 12731. [Google Scholar] [CrossRef]
  26. Hu, J.; Wu, J.; Zhuang, F.; Wang, M.Z. Contract selection for collaborative innovation in the new energy vehicle supply chain under the dual credit policy: Cost sharing and benefit sharing. Int. J. Ind. Eng. Comput. 2024, 15, 209–222. [Google Scholar] [CrossRef]
  27. Shanmuganathan, J.; Victoire, A.A.; Balraj, G.; Victoire, A. Deep Learning LSTM Recurrent Neural Network Model for Prediction of Electric Vehicle Charging Demand. Sustainability 2022, 14, 10207. [Google Scholar] [CrossRef]
  28. Swain, D.; Kumar, M.; Nour, A.; Patel, K.; Bhatt, A.; Acharya, B.; Bostani, A. Remaining Useful Life Predictor for EV Batteries Using Machine Learning. IEEE Access 2024, 12, 134418–134426. [Google Scholar] [CrossRef]
  29. Yang, Y.; Zhang, Y.; Meng, X. A Data-Driven Approach for Optimizing the EV Charging Stations Network. IEEE Access 2020, 8, 118572–118592. [Google Scholar] [CrossRef]
  30. Xu, Y.; Han, L.Z.; Zhu, T.Y.; Sun, L.L.; Du, B.W.; Lv, W.F. Continuous-Time and Discrete-Time Representation Learning for Origin-Destination Demand Prediction. IEEE Trans. Intell. Transp. Syst. 2024, 25, 2382–2393. [Google Scholar] [CrossRef]
  31. Wu, B.; Liu, P.F.; Xu, X.F. An evolutionary analysis of low-carbon strategies based on the government-enterprise game in the complex network context. J. Clean. Prod. 2017, 141, 168–179. [Google Scholar] [CrossRef]
  32. Zhou, Y.; He, H.; Wang, Y.F. Low-Carbon Selection Decision for Logistics Enterprises Based on Evolutionary Game under the Supervision of Government. Adv. Mater. Res. 2011, 219–220, 736–741. [Google Scholar] [CrossRef]
  33. Li, L.H.; Wang, Y.; Deng, Y.J.; Nan, T.J. A three-party evolutionary game of green logistics development under carbon tax policy. J. Railw. Sci. Eng. 2023, 20, 3715–3726. [Google Scholar]
  34. Zheng, P.; Pei, W.J.; Pan, W.B. Impact of different carbon tax conditions on the behavioral strategies of new energy vehicle manufacturers and governments-A dynamic analysis and simulation based on prospect theory. J. Clean. Prod. 2023, 407, 137132. [Google Scholar] [CrossRef]
  35. Cai, R.; Zhang, T.; Wang, X.; Jia, Q.; Zhao, S.; Liu, N.; Wang, X. Evolutionary Game and Simulation Analysis of New-Energy Vehicle Promotion in China Based on Reward and Punishment Mechanisms. Mathematics 2024, 12, 2900. [Google Scholar] [CrossRef]
  36. Liu, C.; Liu, Z.; Li, W.; Xu, M. A time-delayed evolutionary game analysis of new energy vehicles development considering subsidy and carbon tax. Heliyon 2024, 10, e25667. [Google Scholar] [CrossRef] [PubMed]
  37. Liao, D.S.; Tan, B.B. An evolutionary game analysis of new energy vehicles promotion considering carbon tax in post-subsidy era. Energy 2023, 264, 126156. [Google Scholar] [CrossRef]
  38. Liu, C.; Song, Y.; Wang, W.; Shi, X. The governance of manufacturers’ greenwashing behaviors: A tripartite evolutionary game analysis of electric vehicles. Appl. Energy 2023, 333, 120498. [Google Scholar] [CrossRef]
  39. Jin, T.; Jiang, Y.L.; Liu, X.W. Evolutionary game analysis of the impact of dynamic dual credit policy on new energy vehicles after subsidy cancellation. Appl. Math. Comput. 2023, 440, 127677. [Google Scholar] [CrossRef]
  40. Zhang, G.S.; Wang, X.; Wang, Y.L.; Xu, J.Q. A tripartite evolutionary game for the regional green logistics: The roles of government subsidy and platform’ s cost-sharing. Kybernetes 2024, 53, 216–237. [Google Scholar] [CrossRef]
  41. Wang, X.J.; Quan, J.; Liu, W.B. Study on evolutionary games and cooperation mechanism within the framework of bounded rationality. Syst. Eng. Theory Pract. 2011, 31, 82–93. [Google Scholar]
  42. Guo, B.; Li, Y.X.; Wang, X.P. Steady-State Analysis of Social Responsibility Strategy of Coal Power Enterprises from the Perspective of Game Theory. Heliyon 2024, 10, e23124. [Google Scholar] [CrossRef]
  43. Tang, J.; Wu, Q. Fast or stable: Research on dynamic behaviors of duopoly automakers under the background of energy transformation in the automobile industry. Heliyon 2024, 10, e27711. [Google Scholar] [CrossRef]
  44. Cirillo, C.; Liu, Y.; Maness, M. A time-dependent stated preference approach to measuring vehicle type preferences and market elasticity of conventional and green vehicles. Transp. Res. Part A Policy Pract. 2017, 100, 294–310. [Google Scholar] [CrossRef]
  45. Wu, J.M.; Qian, J.L. Evolutionary game study of collaborative innovation among new energy vehicle enterprises, traditional vehicle enterprises, and government under the double integral policy. J. Technol. Econom 2024, 43, 22–32. [Google Scholar]
  46. Ritzberger, K.; Weibull, J.W. Evolutionary selection in normal-from game. Econometrica 1995, 63, 1371–1399. [Google Scholar] [CrossRef]
  47. Selten, R. A note on evolutionarily stable strategies in asymmetric animal conflicts. J. Theor. Biol. 1980, 84, 93–101. [Google Scholar] [CrossRef] [PubMed]
  48. Zhang, M.K.; Huang, Y.; Jin, Y.F.; Bao, Y. Government regulation strategy, leading firms’ innovation strategy, and following firms imitation strategy: An analysis based on evolutionary game theory. PLoS ONE 2023, 18, e0286730. [Google Scholar] [CrossRef] [PubMed]
  49. Zang, J.H.; Li, C.L. Interpretation of Adjustments to the Development Plan for New Energy Vehicle Industry (2021–2035). Automot. Manuf. Eng. 2021, 32–34. [Google Scholar] [CrossRef]
  50. Xing, Z. Research on New Energy Vehicle Industry Policy in Post-Subsidy Era. Master’s Thesis, Huazhong University of Science and Technology, Wuhan, China, 2023. [Google Scholar]
  51. Liu, Q.M. A Simulation Study on Game and Benefit Optimization in the Replacement Process of New and Old Energy Logistics Vehicles. Ph.D. Thesis, Beijing Jiaotong University, Beijing, China, 2021. [Google Scholar]
  52. China Society of Automotive Engineers (CSAE). Technology Roadmap for Energy Saving and New Energy Vehicles 2.0, 2nd ed.; China Machine Press: Beijing, China, 2020. [Google Scholar]
  53. CATL. Annual Technology Roadmap 2025. Available online: https://www.catl.com/en/news/665.html (accessed on 10 July 2025).
  54. China Association of Automobile Manufacturers; China Automotive Engineering Research Institute Co., Ltd.; FAW Jiefang Group Co., Ltd. Annual Report on the Development of China’s Commercial Vehicle Industry (2024); Social Sciences Academic Press: Beijing, China, 2024. [Google Scholar]
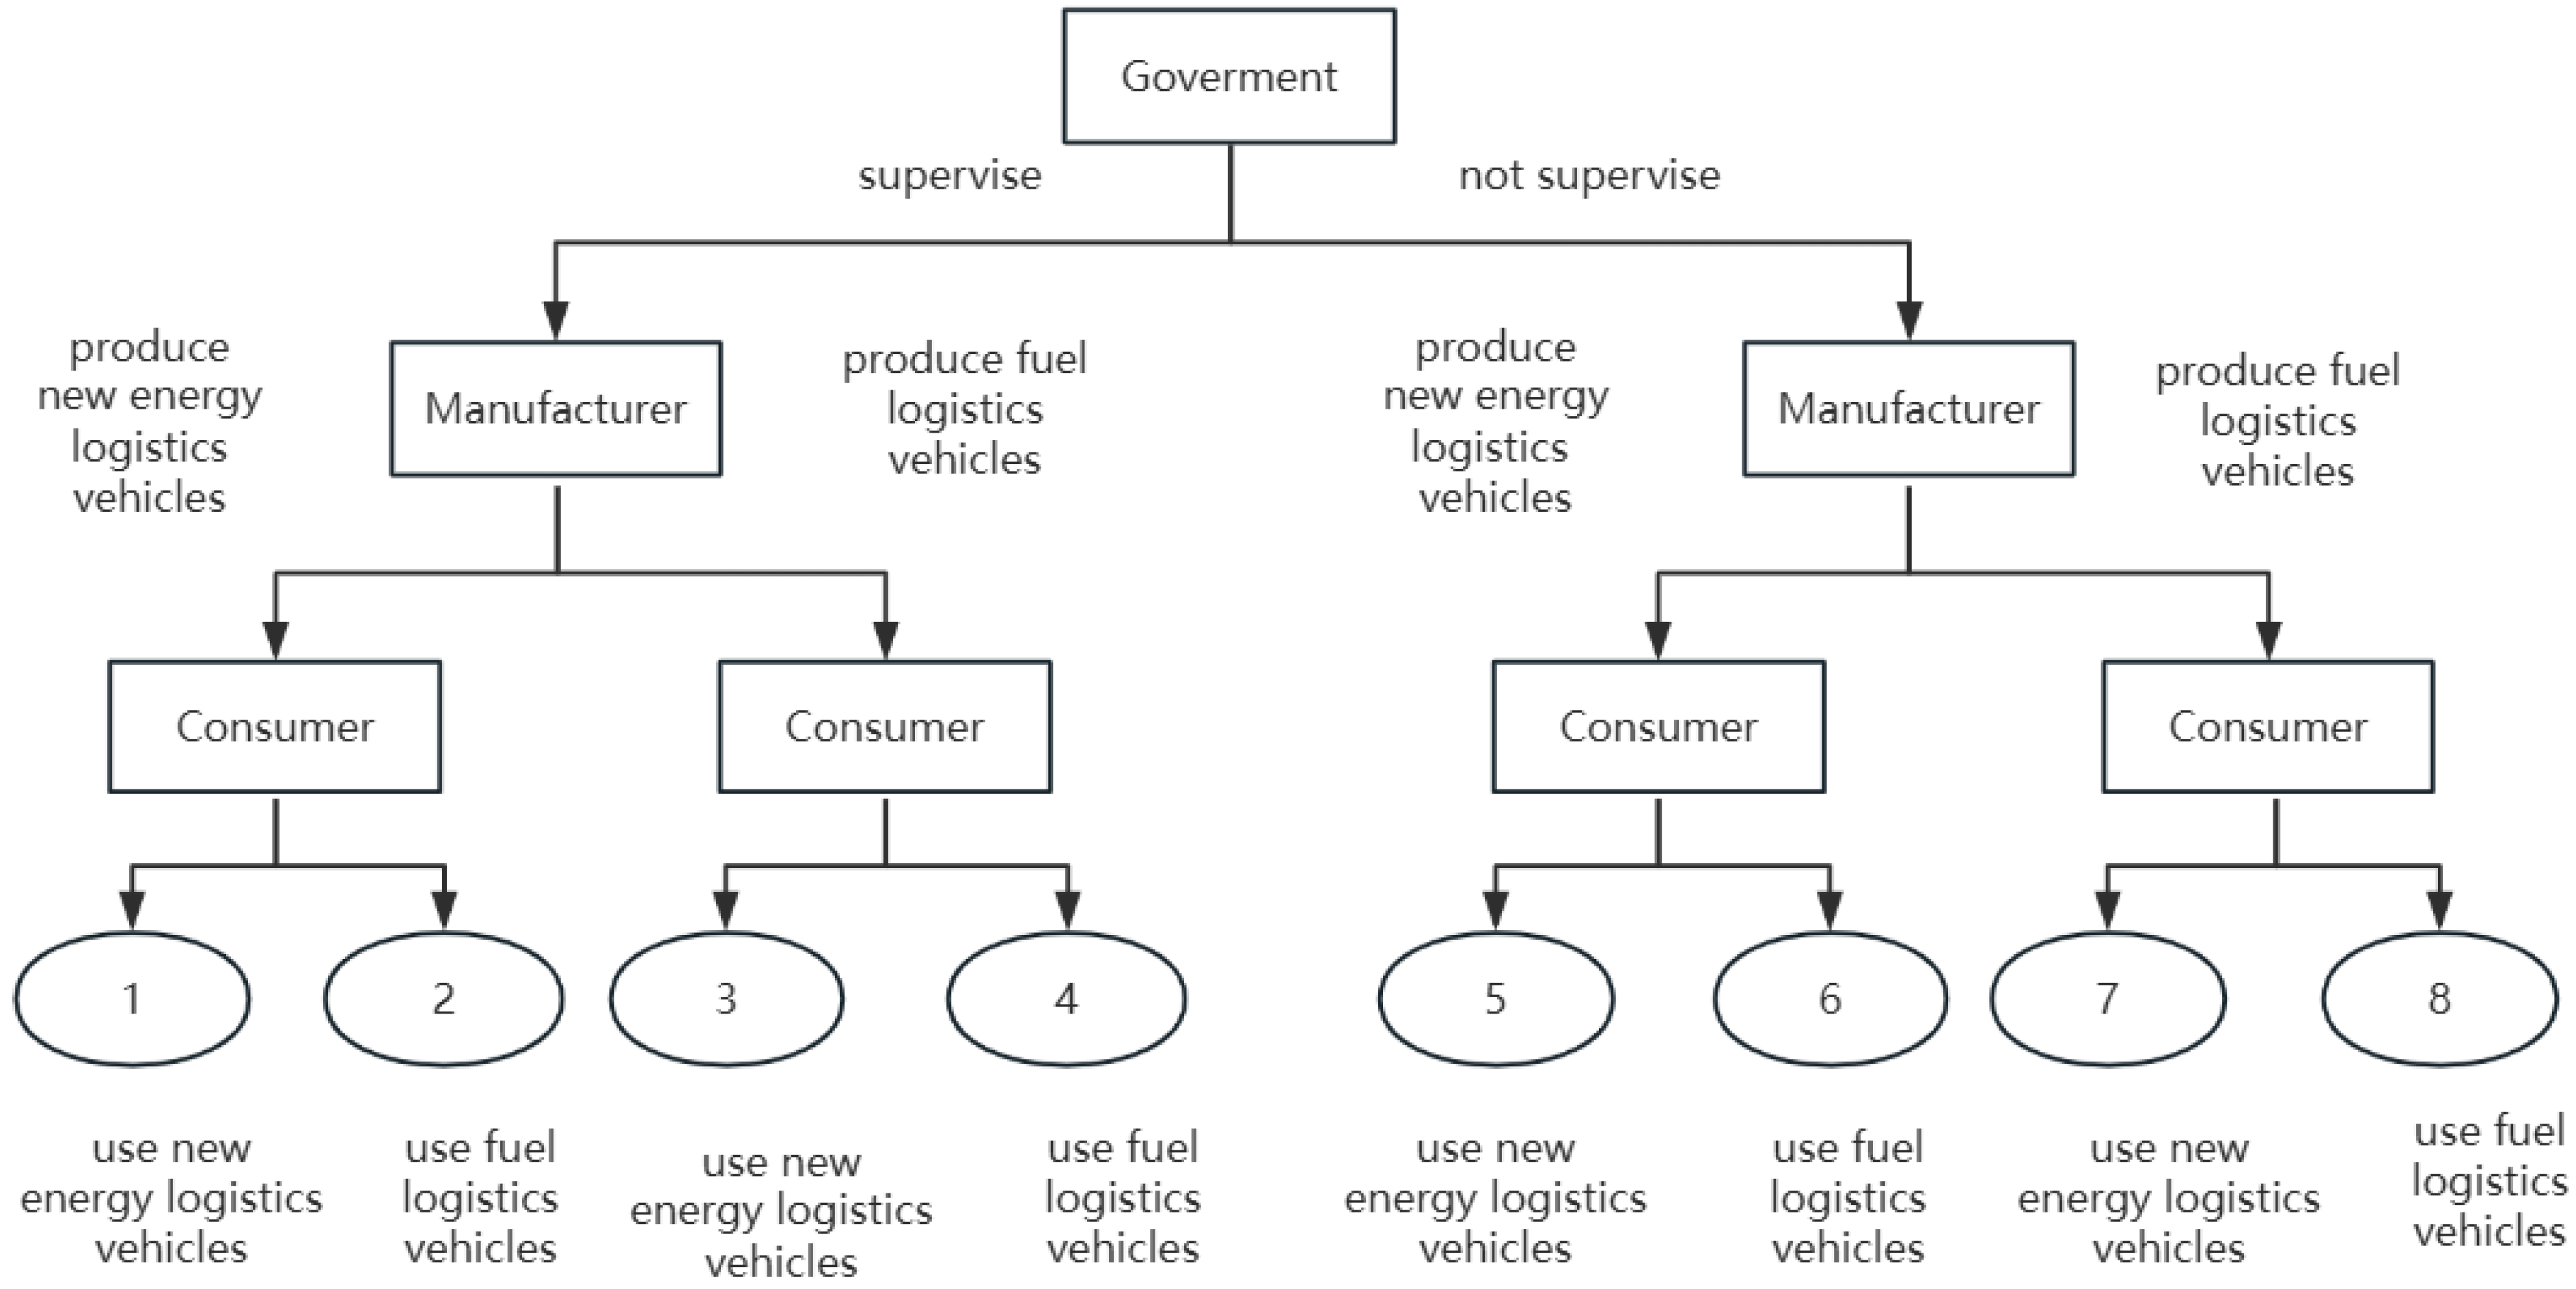
Figure 1. Relationship between the three parties of the game subjects.
Sustainability 17 08164 g001
Figure 2. Dynamic phase diagram of government replication.
Sustainability 17 08164 g002
Figure 3. Phase diagram of replication dynamics of logistics vehicle enterprises.
Sustainability 17 08164 g003
Figure 4. Phase diagram of replication dynamics in logistics enterprises.
Sustainability 17 08164 g004
Figure 5. SD simulation model.
Sustainability 17 08164 g005
Figure 6. Tripartite evolutionary path.
Sustainability 17 08164 g006
Figure 7. The impact of ΔC on the government.
Sustainability 17 08164 g007
Figure 8. The impact of ΔC on the logistics vehicle enterprise.
Sustainability 17 08164 g008
Figure 9. The impact of ΔC on the logistics enterprise.
Sustainability 17 08164 g009
Figure 10. The impact of S1 on the government.
Sustainability 17 08164 g010
Figure 11. The impact of S1 on the logistics vehicle enterprise.
Sustainability 17 08164 g011
Figure 12. The impact of S1 on the logistics enterprise.
Sustainability 17 08164 g012
Figure 13. The impact of ΔR on the government.
Sustainability 17 08164 g013
Figure 14. The impact of ΔR on the logistics vehicle enterprise.
Sustainability 17 08164 g014
Figure 15. The impact of ΔR on the logistics enterprise.
Sustainability 17 08164 g015
Figure 16. The impact of L on the government.
Sustainability 17 08164 g016
Figure 17. The impact of L on the logistics vehicle enterprise.
Sustainability 17 08164 g017
Figure 18. The impact of L on the logistics enterprise.
Sustainability 17 08164 g018
Table 1. Symbols and meanings of parameters.
SymbolsMeaning
LFines deducted by the government from enterprises producing FVs.
SGovernment incentives for enterprises producing NEVs.
MOversight costs incurred by the government.
GCosts of losses due to lack of government oversight.
NGovernment right-of-way costs.
C1The expense of producing FVs for logistics vehicle enterprises.
C1 + ΔCThe expense of producing NEVs for logistics vehicle enterprises.
R1Costs of purchasing FVs for logistics enterprises.
R1 + ΔRThe expense of purchasing NEVs for logistics enterprises.
S1Logistics vehicle enterprises to produce NEVs earned positive points for trading revenue.
S2The expense of purchasing positive credits for the production of FVs by logistics vehicle enterprises.
Q1Benefits of using FVs in logistics enterprises.
Q1 + ΔQBenefits for logistics enterprises using NEVs.
DConversion of right-of-way acquired by logistics enterprises using NEVs into indirect benefits.
KThe cost savings due to scale production are K.
xThe likelihood that the government elects to monitor.
yThe likelihood of logistics vehicle enterprises deciding to manufacture NEVs.
zThe probability of logistics enterprises deciding to use NEVs.
Table 2. Evolutionary game payoff matrix.
Logistics Vehicle EnterpriseGovernment
Supervise (x)Not Supervise (1 − x)
Logistics Enterprise
Use NEV (z)Use FV (1 − z)Use NEV (z)Use FV (1 − z)
Produce NEV(y)−S − M − N−S − M − N0−G
S + S1 + (R1 + ΔR − (C1 + ΔC)S(C1 + ΔC) + S1S1 + (R1 + ΔR) − (C1 + ΔC)S1 − (C1 + ΔC)
Q1 + ΔQ − (R1 + ΔR) + D − KQ1 − R1(Q1 + ΔQ) − (R1 + ΔR) − KQ1 − R1
Produce FV(1 − y)L − M − NL − M − N0−G
−C1 − S2 − LR1 − C1 − S2 − L−C1 − S2R1 − C1 − S2
Q1 + ΔQ − (R1 + ΔR) + DQ1 − R1(Q1 + ΔQ) − (R1 + ΔR)Q1 − R1
Table 3. Results of solving the Jacobi matrix.
F 1 x F 2 x F 3 x
F ς x (2x − 1)(M − L − G + N + Gz + Ly + Sy) Gx x 1 D z z 1
F ς y x (x − 1)(L + S)−(2y − 1)(S1 − R1 − ΔC + S2 + Lx + Sx + 2R1z + ΔRz) Kz ( z 1 )
F ς z Gx(x − 1)−y (2R1 + ΔR)(y − 1) 2 z 1 Δ Q Δ R + Dx Ky
Table 4. Jacobi matrix eigenvalue solution.
Balance PointThe Eigenvalue λ1The Eigenvalue λ2The Eigenvalue λ3
E1 (0, 0, 0)G + L − M − NS1 − R1 − ΔC + S2ΔQ − ΔR
E2 (1, 0, 0)M − L − G + NL − ΔC − R1 + S + S1 + S2D + ΔQ − ΔR
E3 (0, 1, 0)G − M − N − SΔC + R1 − S1 − S2ΔQ − K − ΔR
E4 (0, 0, 1)L − M − NR1 − ΔC + ΔR + S1 + S2ΔR − ΔQ
E5 (1, 1, 0)M − G + N + SΔC − L + R1 − S − S1 − S2D − K + ΔQ − ΔR
E6 (1, 0, 1)M − L + NL − ΔC + R1 + ΔR + S + S1 +S2ΔR − ΔQ − D
E7 (0, 1, 1)−M − N − SΔC − R1 − ΔR − S1 − S2K − ΔQ + ΔR
E8 (1, 1, 1)M + N + SΔC − L − R1 − ΔR − S − S1 − S2K − D − ΔQ + ΔR
Table 5. Stability analysis of equilibrium points.
Balance PointThe Eigenvalue λ1The Eigenvalue λ2The Eigenvalue λ3Eigenvalues Positive and NegativeStability
E1 (0, 0, 0)G + L − M − NS1 − R1 − ΔC + S2ΔQ − ΔR(*, *, +)precarious
E2 (1, 0, 0)M − L − G + NL − ΔC − R1 + S + S1 + S2D + ΔQ − ΔR(*, *, +)precarious
E3 (0, 1, 0)G − M − N − SΔC + R1 − S1 − S2ΔQ − K − ΔR(*, *, *)inconclusive
E4 (0, 0, 1)L − M − NR1 − ΔC + ΔR + S1 + S2ΔR − ΔQ(*, +, −)saddle point (math.)
E5 (1, 1, 0)M − G + N + SΔC − L + R1 − S − S1 − S2D − K + ΔQ − ΔR(*, *, *)inconclusive
E6 (1, 0, 1)M − L + NL − ΔC + R1 + ΔR + S + S1 + S2ΔR − ΔQ − D(*, +, −)saddle point (math.)
E7 (0, 1, 1)−M − N − SΔC − R1 − ΔR − S1 − S2K − ΔQ + ΔR(−, −, *)inconclusive
E8 (1, 1, 1)M + N + SΔC − L − R1 − ΔR − S − S1 − S2K − D − ΔQ + ΔR(+, −, *)saddle point (math.)
The inability to ascertain whether this eigenvalue is positive or negative is shown by *.
Table 6. Parameter values.
ParameterValueParameterValue
L1ΔR0.5
S0.5S13
M10S22
G20Q110
N5ΔQ1
C12D2
ΔC0.5K0.1
R12.2
Note: All parameter values in the table are expressed in millions of Chinese Yuan (CBY).
Disclaimer/Publisher’s Note: The statements, opinions and data contained in all publications are solely those of the individual author(s) and contributor(s) and not of MDPI and/or the editor(s). MDPI and/or the editor(s) disclaim responsibility for any injury to people or property resulting from any ideas, methods, instructions or products referred to in the content.