A Load Forecasting Model Based on Spatiotemporal Partitioning and Cross-Regional Attention Collaboration
Abstract
1. Introduction
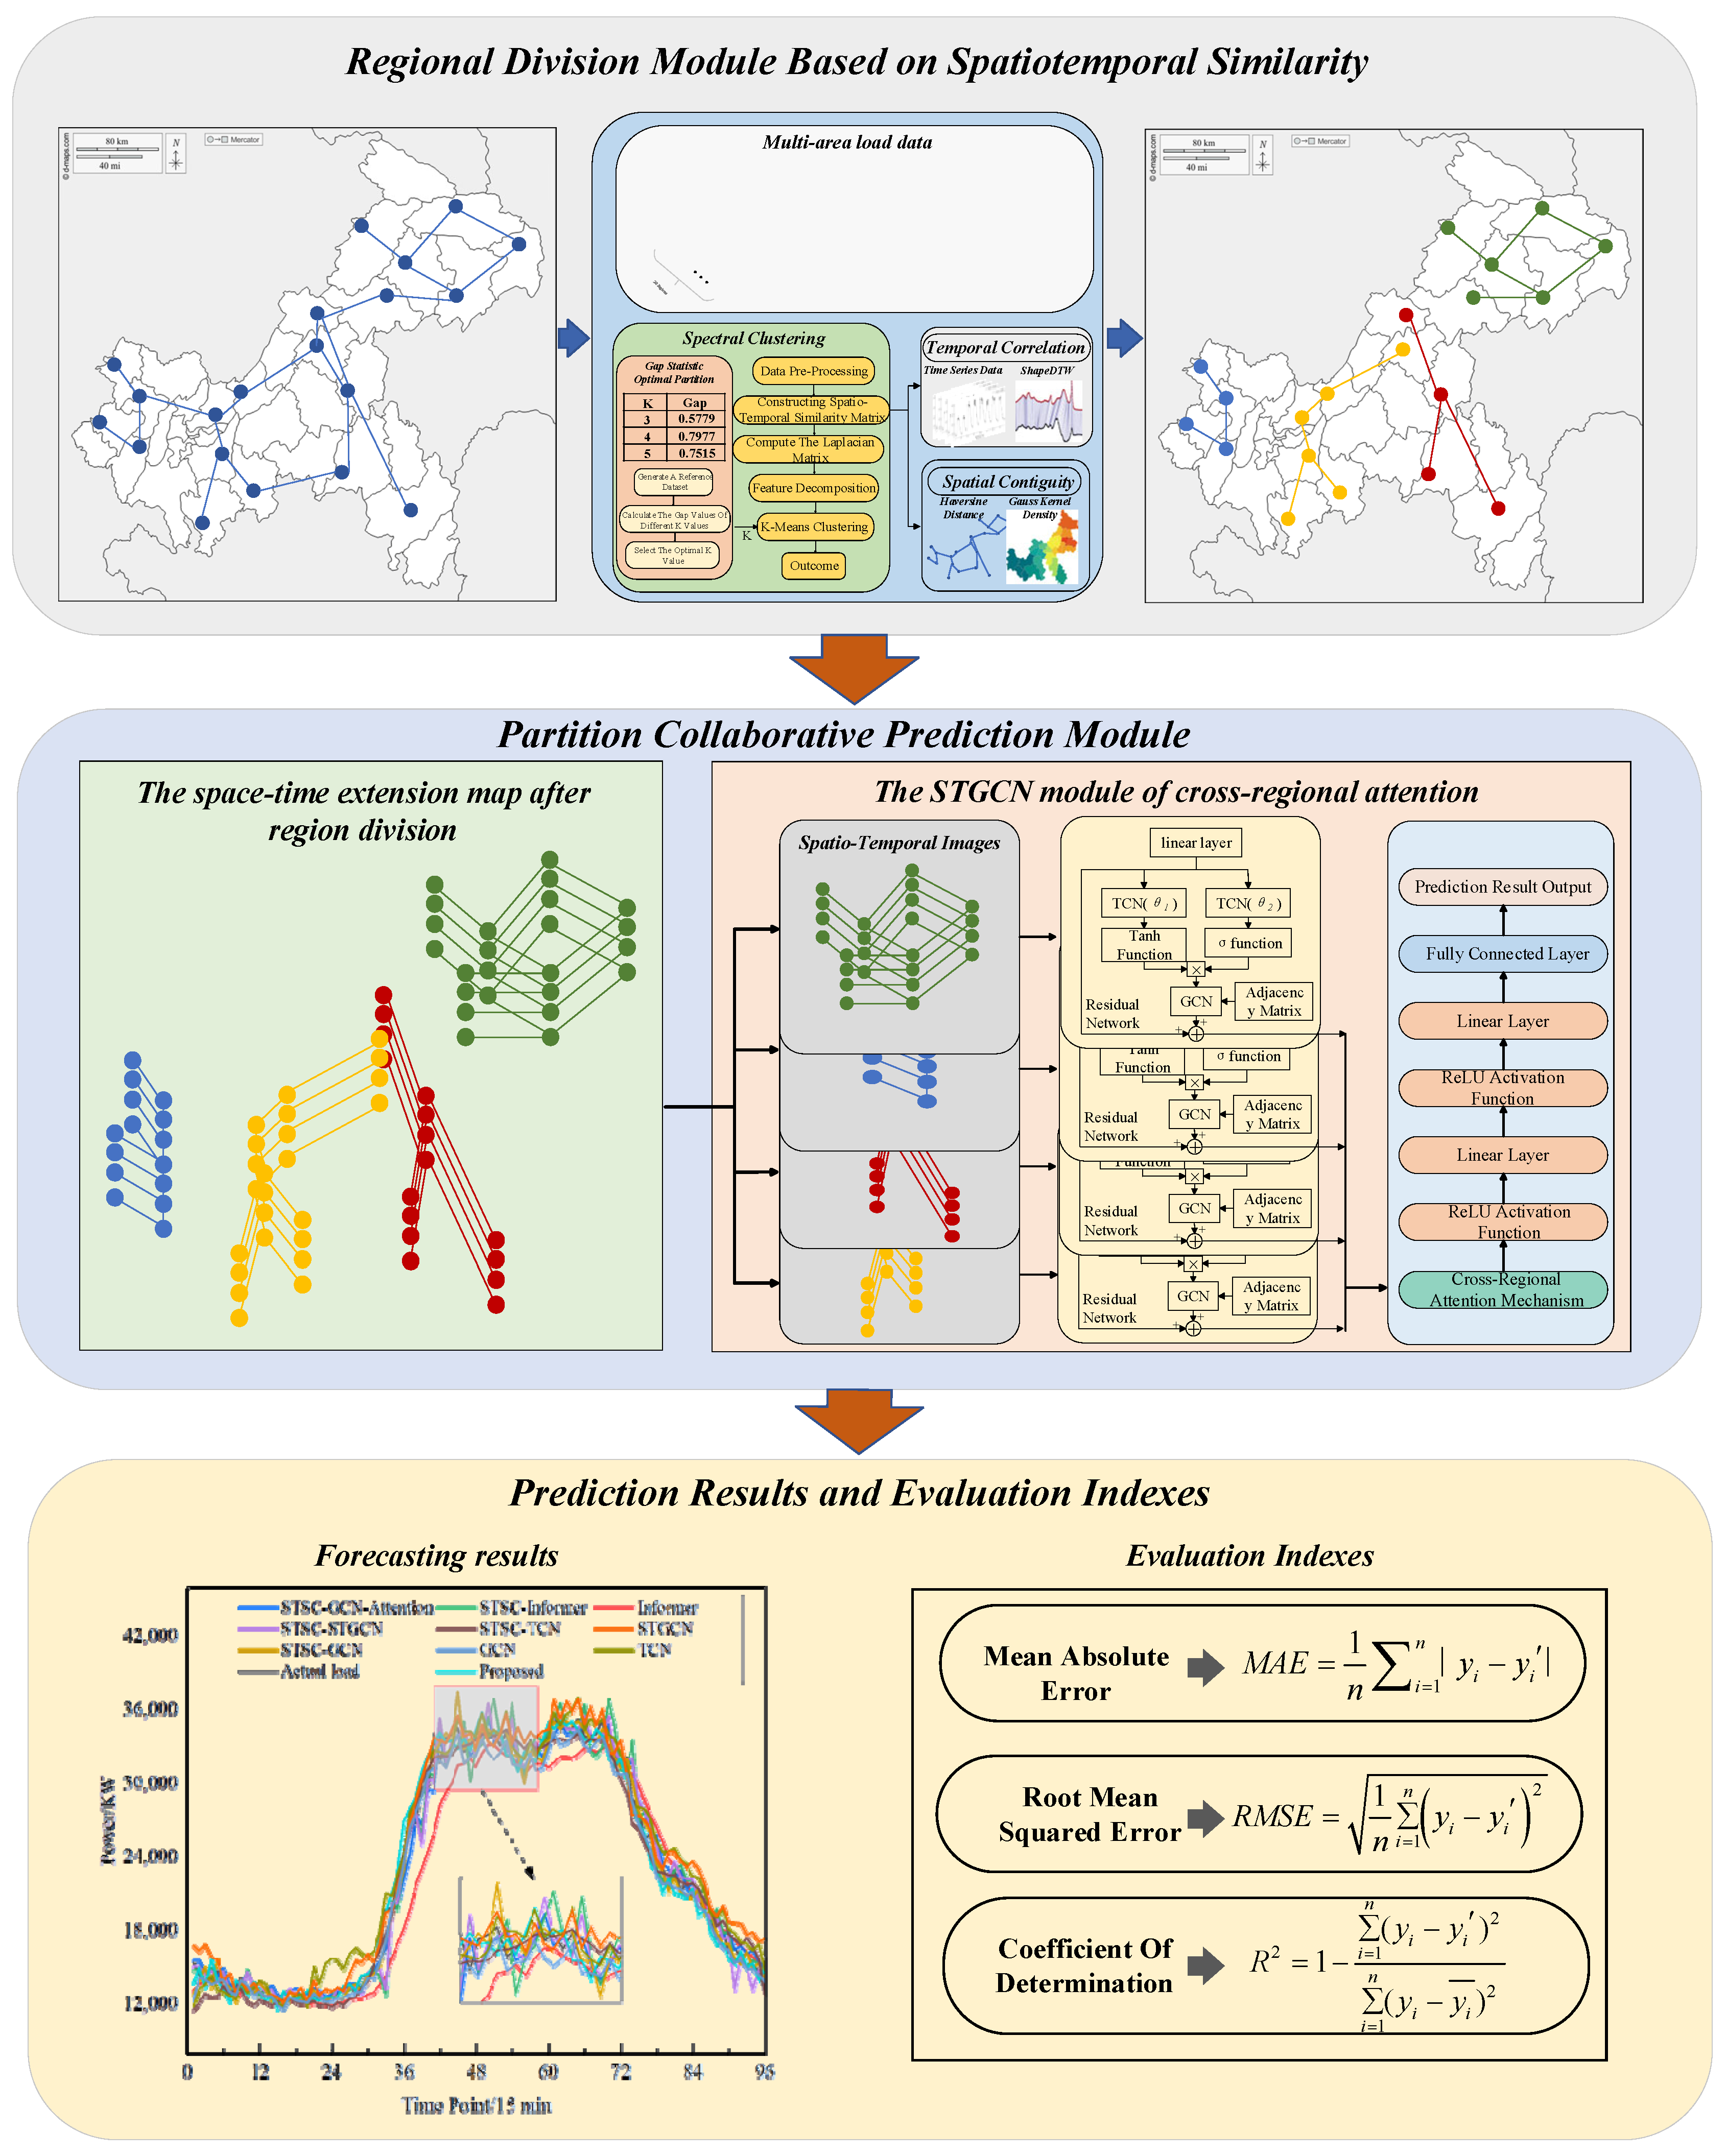
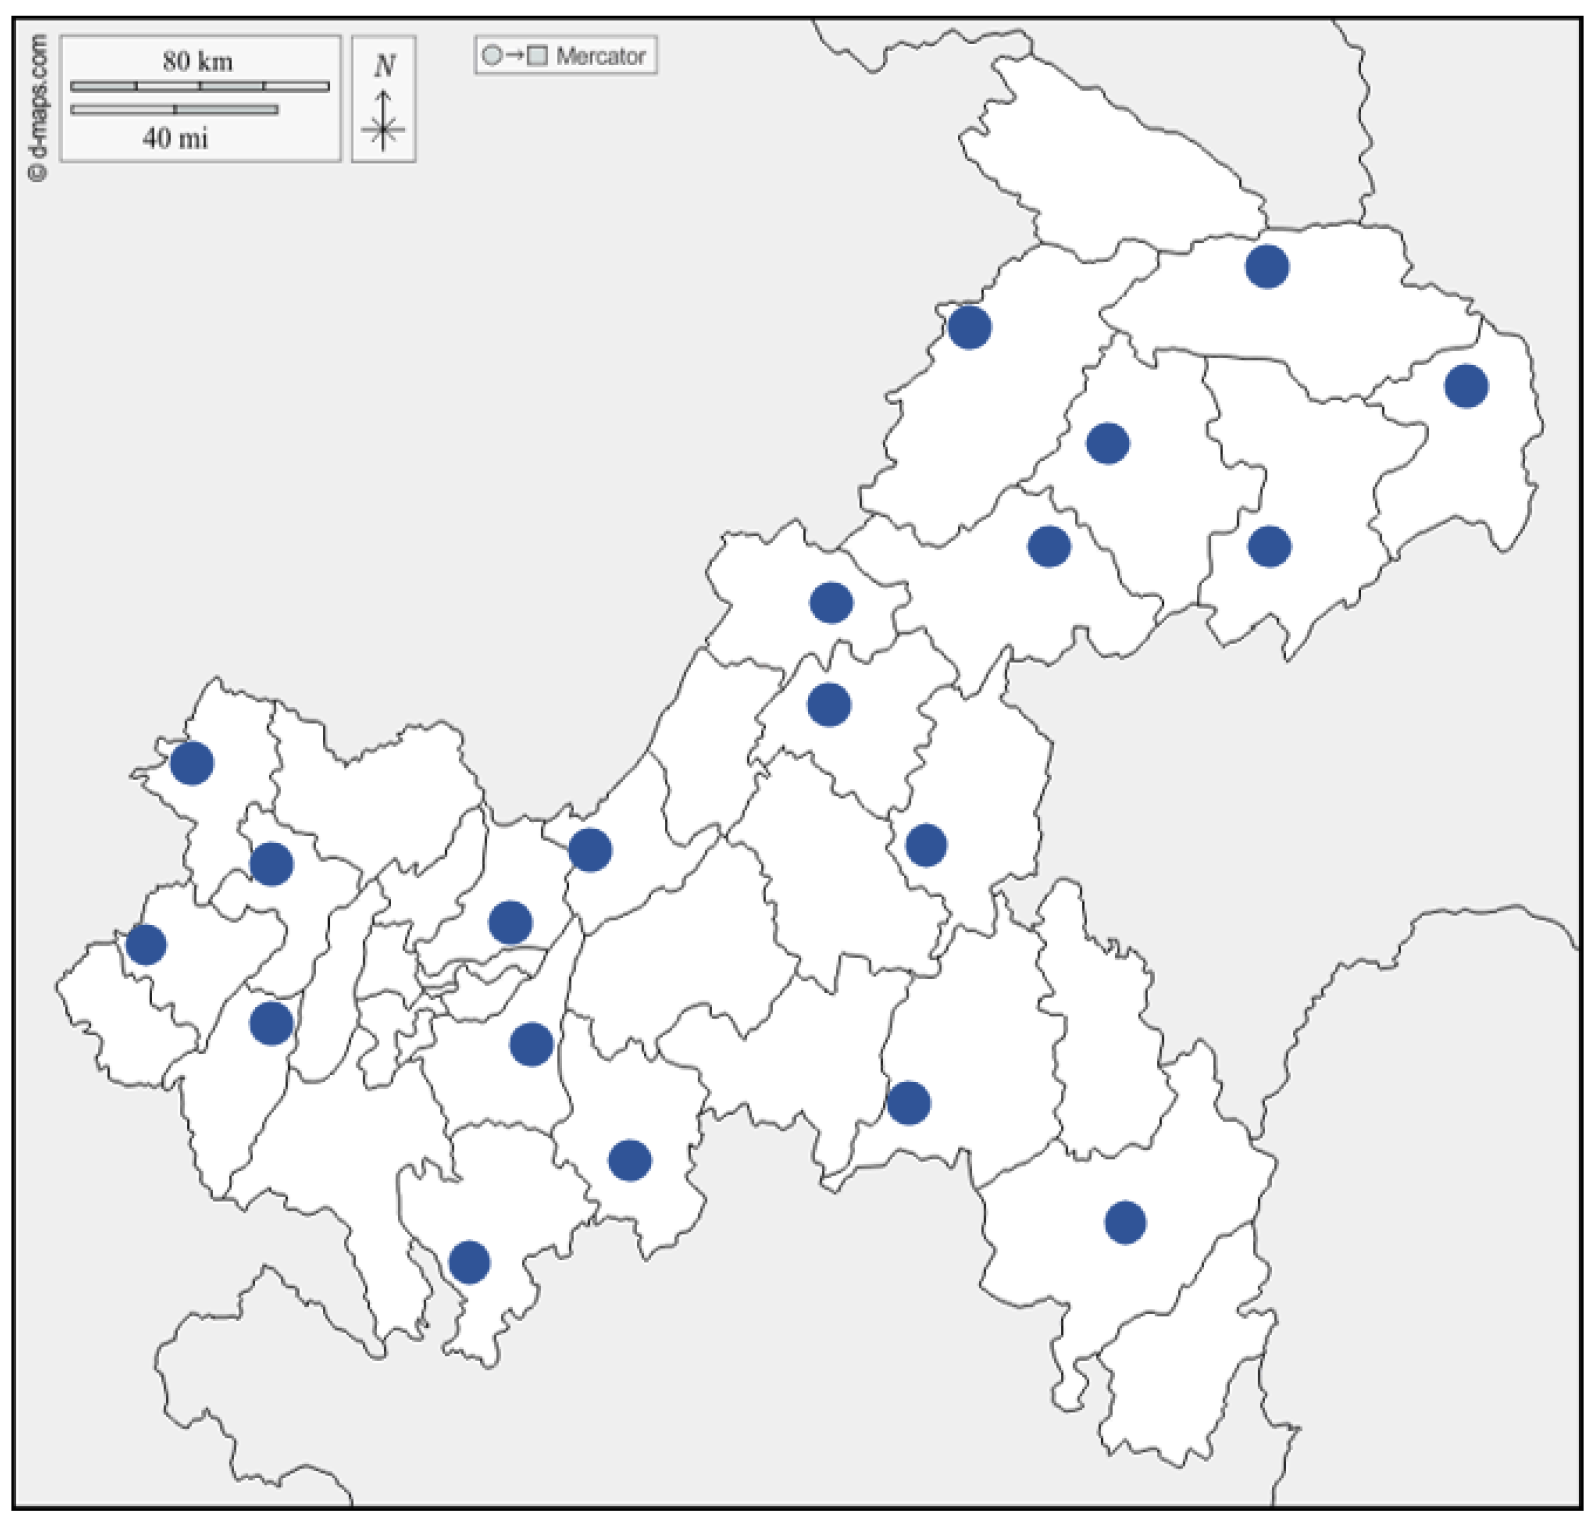
- An improved spectral clustering partitioning method based on spatiotemporal comprehensive evaluation is constructed. By integrating the ShapeDTW algorithm with an adaptive spatial kernel function based on the Haversine distance, a comprehensive evaluation matrix is formed, which can simultaneously capture the similarity in load time series patterns and the geographical relationships among nodes. This evaluation matrix serves as the basis for spectral clustering, and the optimal number of partitions is adaptively determined by incorporating the Gap Statistic criterion. The proposed method provides a more discriminative partitioning foundation for multi-node load forecasting, significantly improving both partition quality and overall forecasting performance.
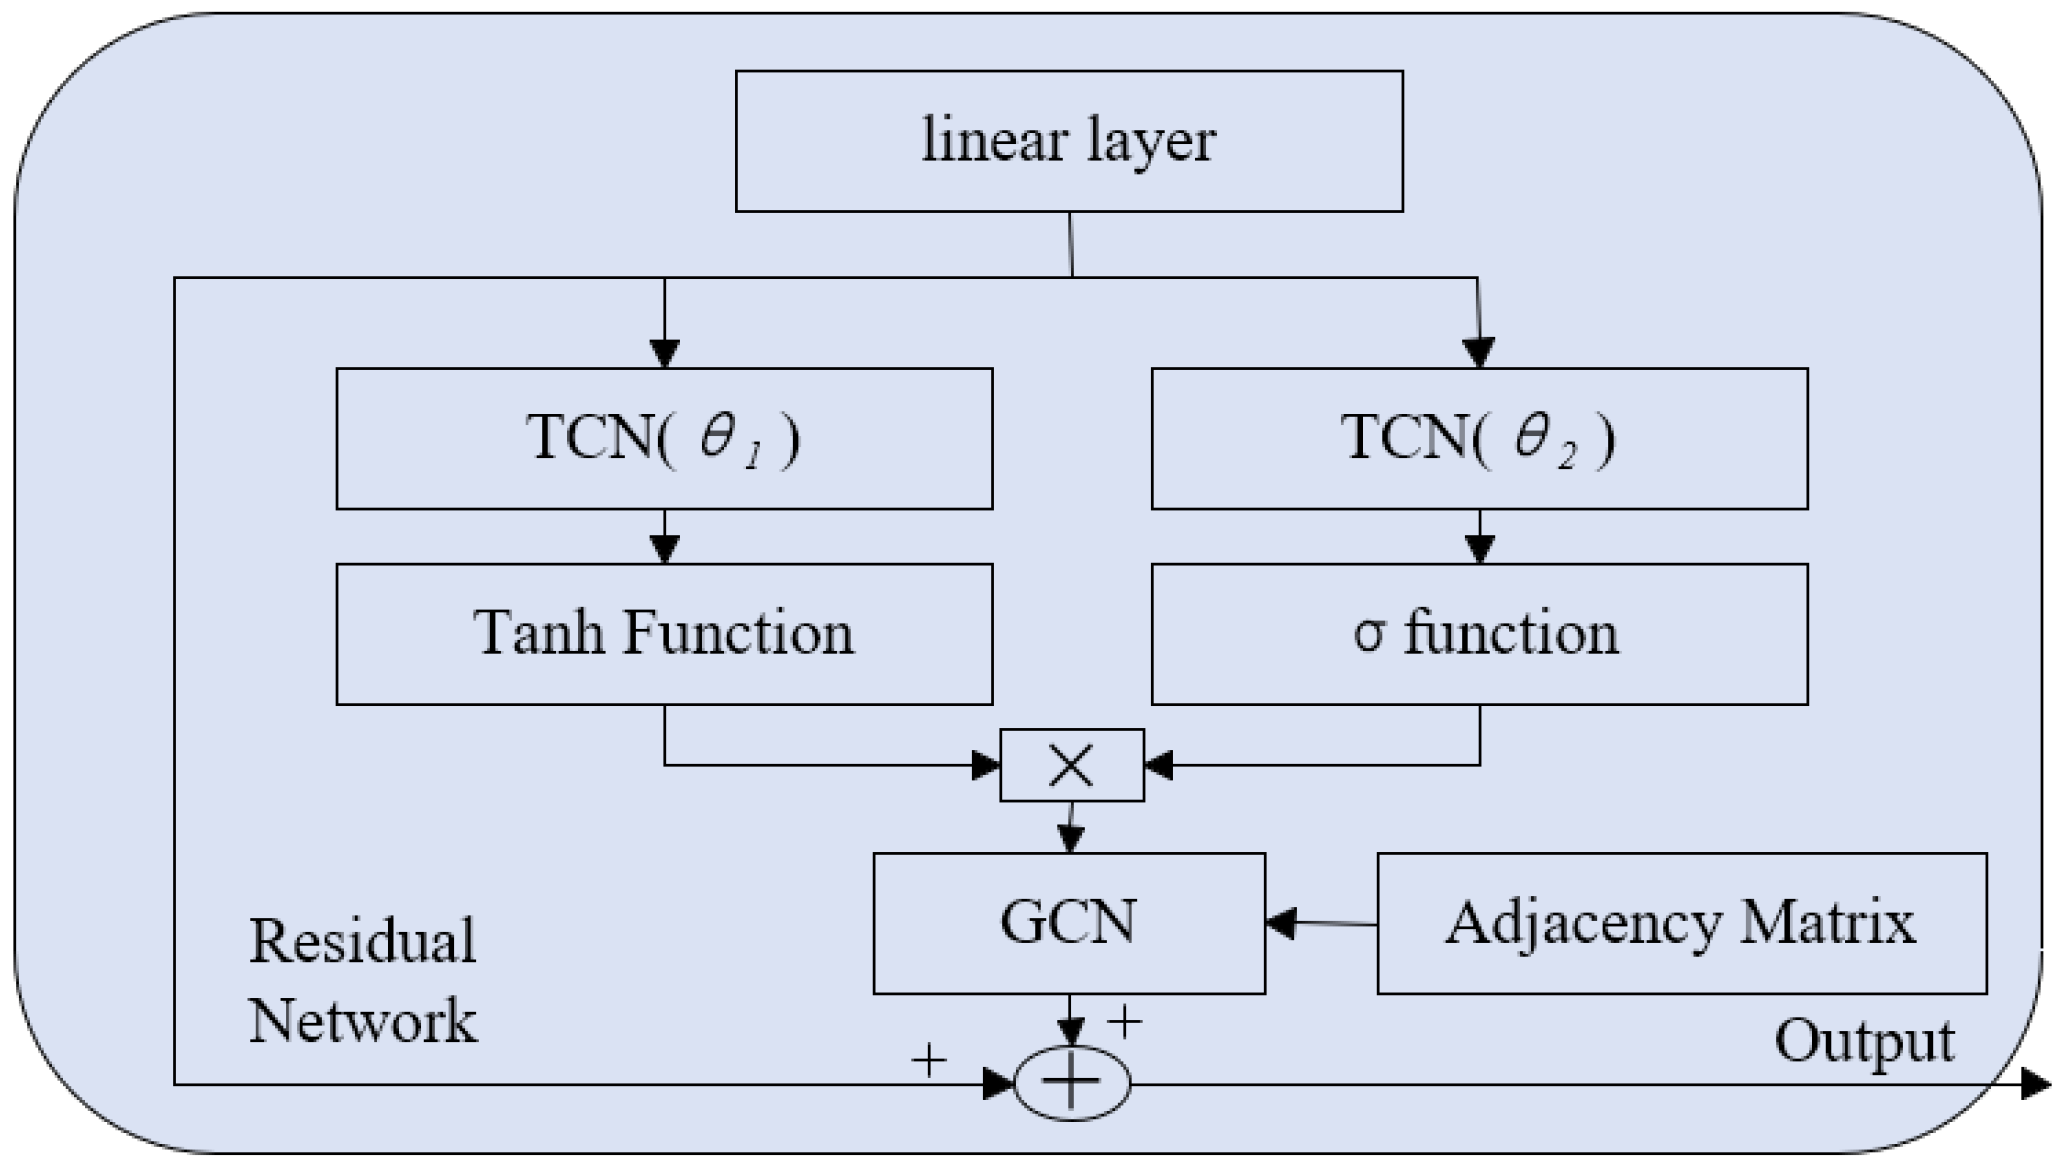
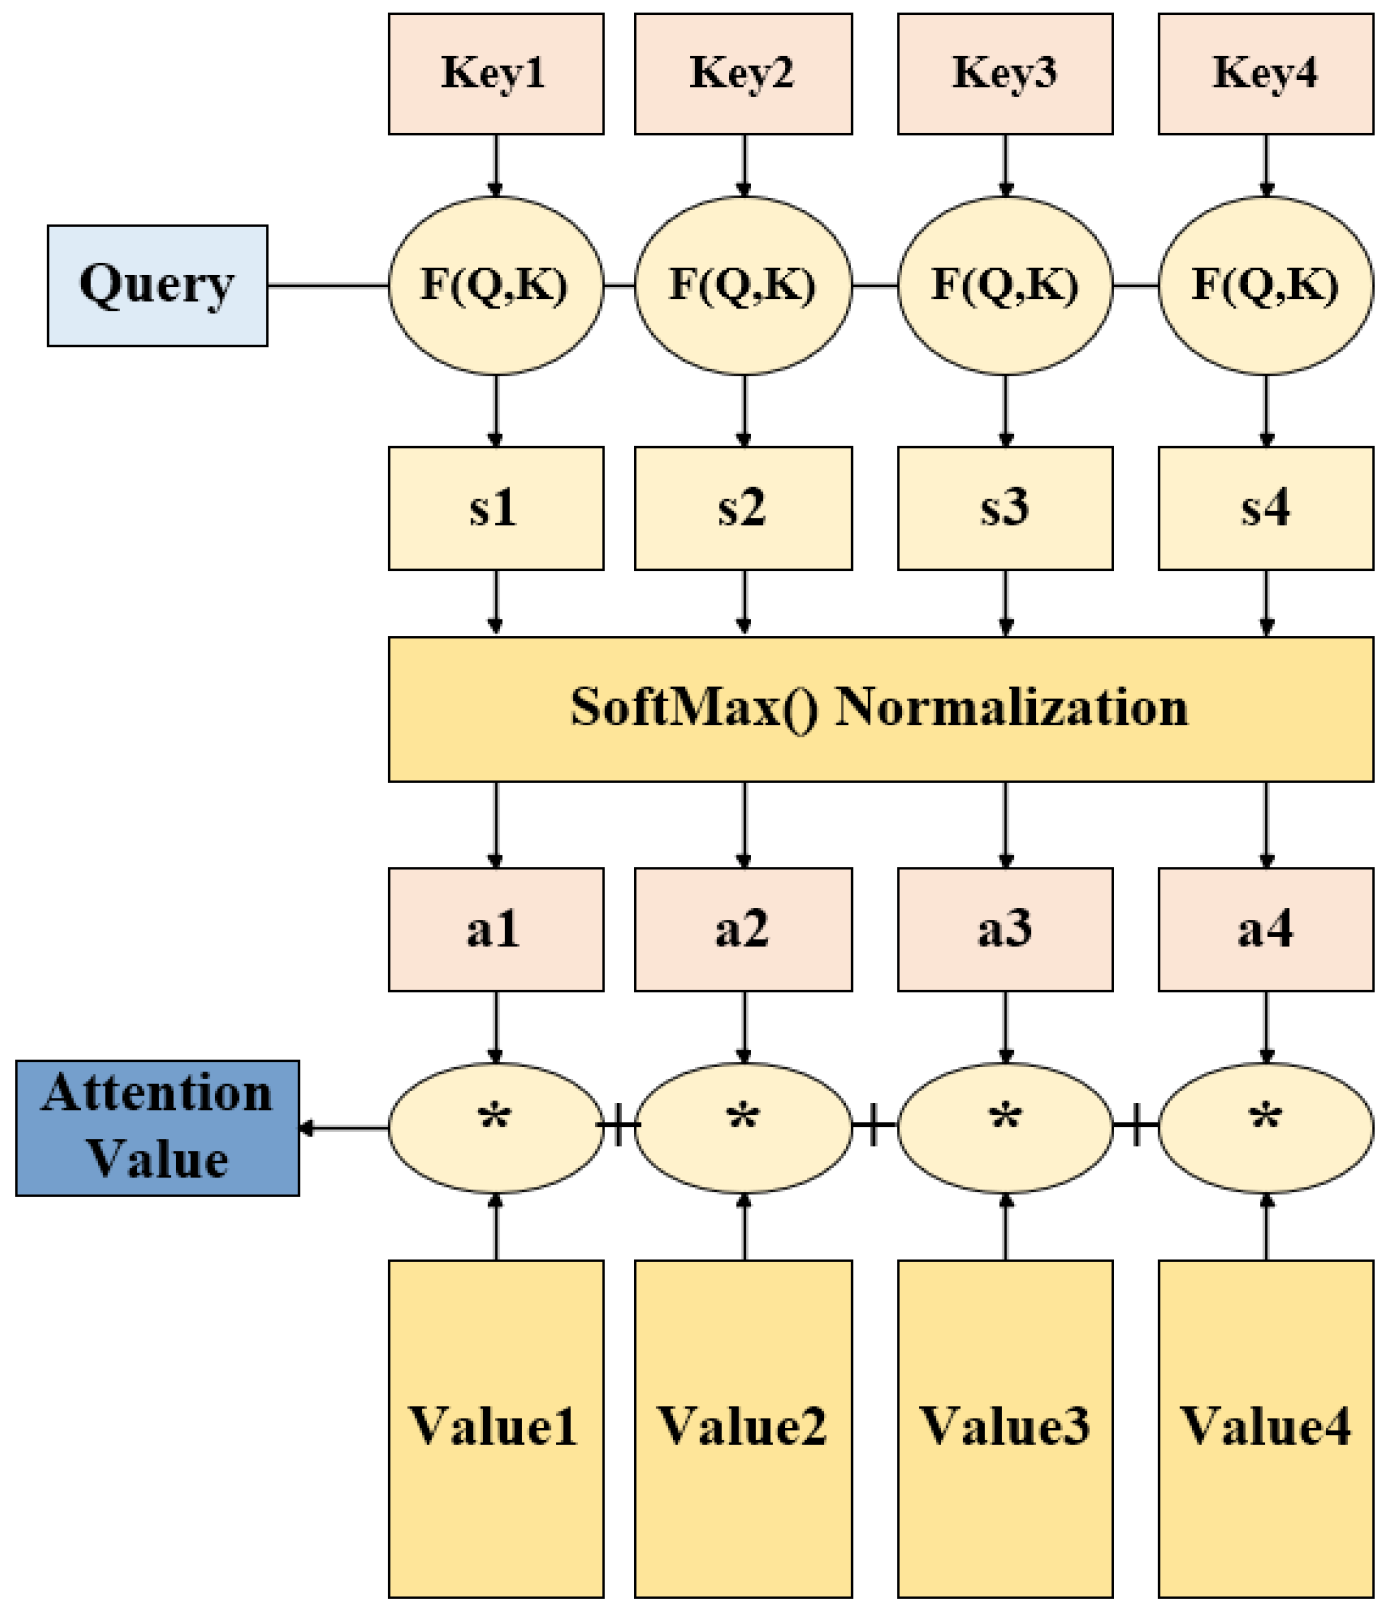
- A regional collaborative forecasting method based on STGCN is constructed. A local STGCN is deployed in each sub-region to precisely extract intra-regional features. The cross-regional attention mechanism is then designed to achieve collaborative fusion of global information. By balancing the adaptability of regional models with the interaction of global features, the proposed method effectively improves the overall accuracy and stability of short-term load forecasting for multi-node systems.
2. Methodology
2.1. Overall Framework
2.2. Regional Division Module Based on Spatiotemporal Similarity
2.2.1. Load Time Series Correlation Analysis Method Based on ShapeDTW
2.2.2. Spatial Proximity
2.2.3. Spectral Clustering
2.2.4. Optimal Partitioning with Gap Statistic
2.3. Regional Collaborative Prediction Model Architecture
2.3.1. Subgraph Construction Based on Spatiotemporal Characteristics
2.3.2. Adjacency Matrix Generation
2.3.3. STGCN-Attention Hybrid Model
3. Examples Analysis
3.1. Experimental Setup
3.2. Evaluating Indicator
3.3. Analysis of Regional Partitioning Rationality
3.4. Prediction Performance Comparison
4. Conclusions
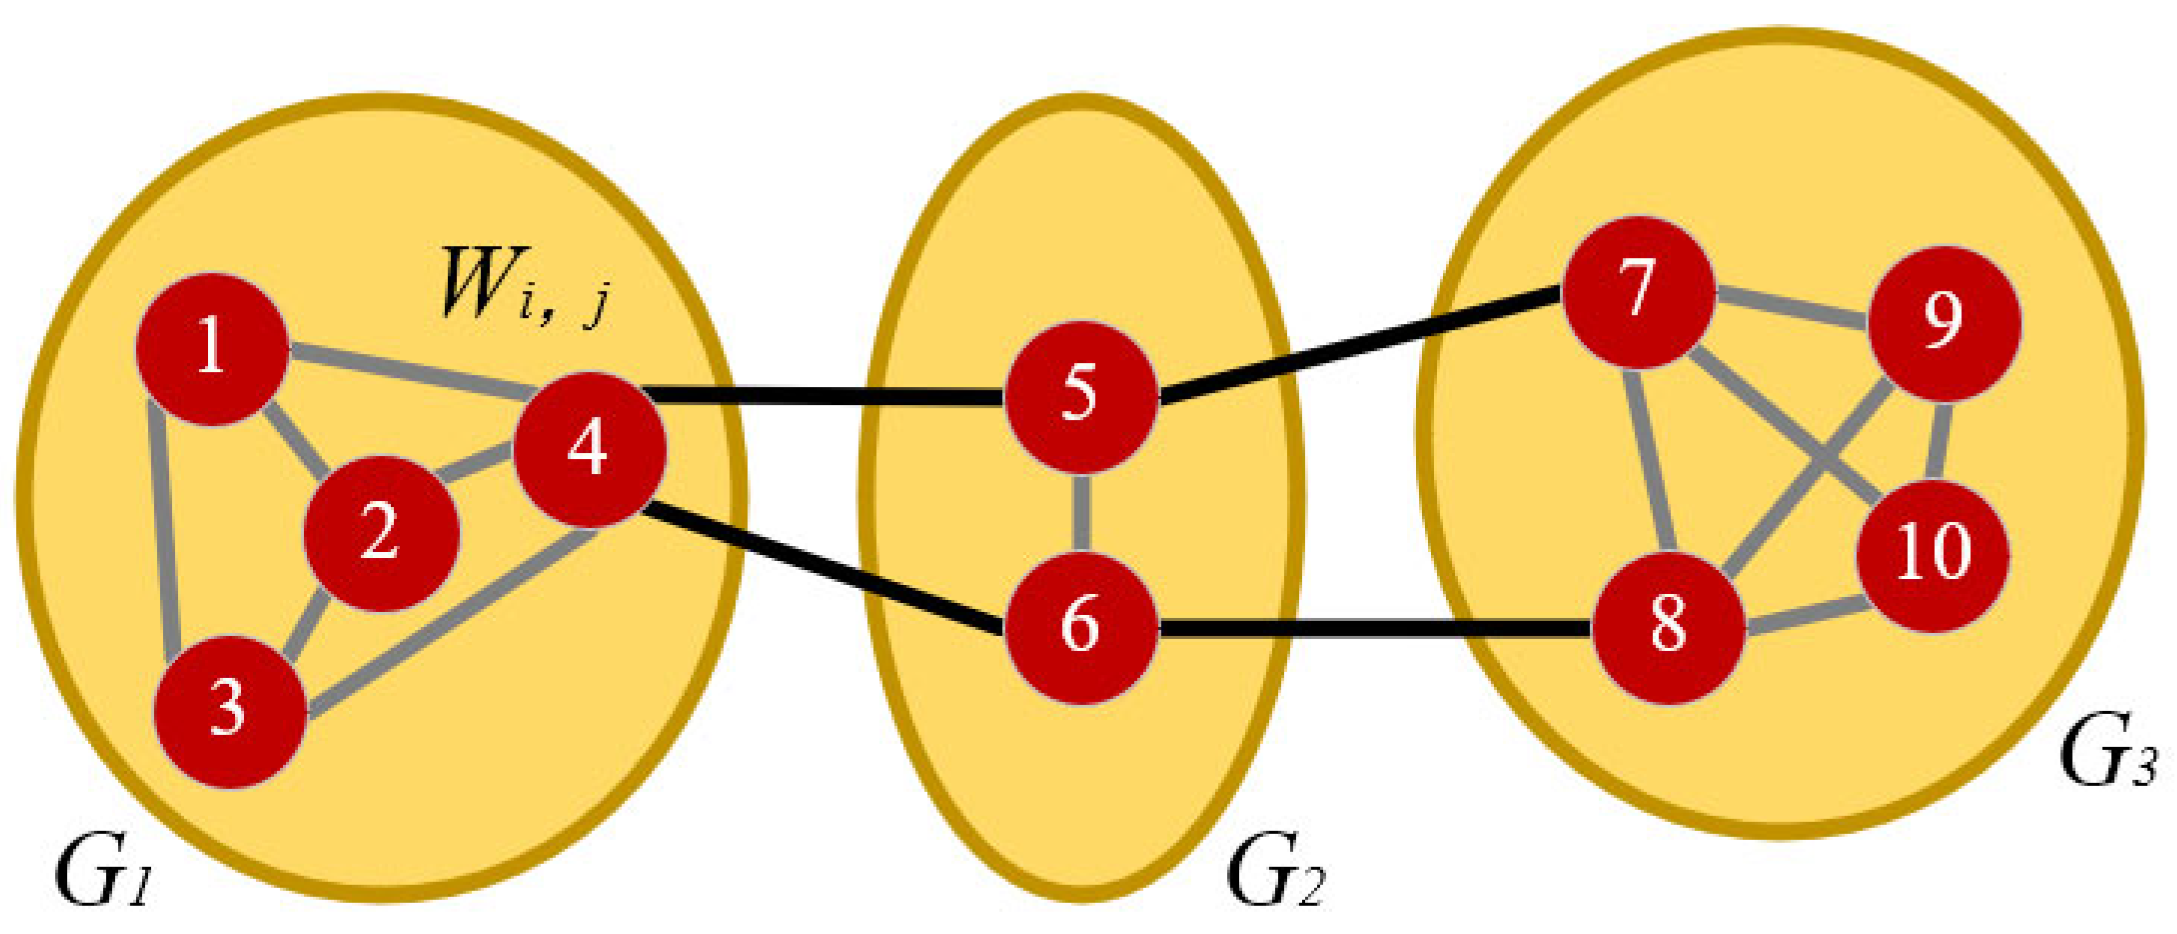
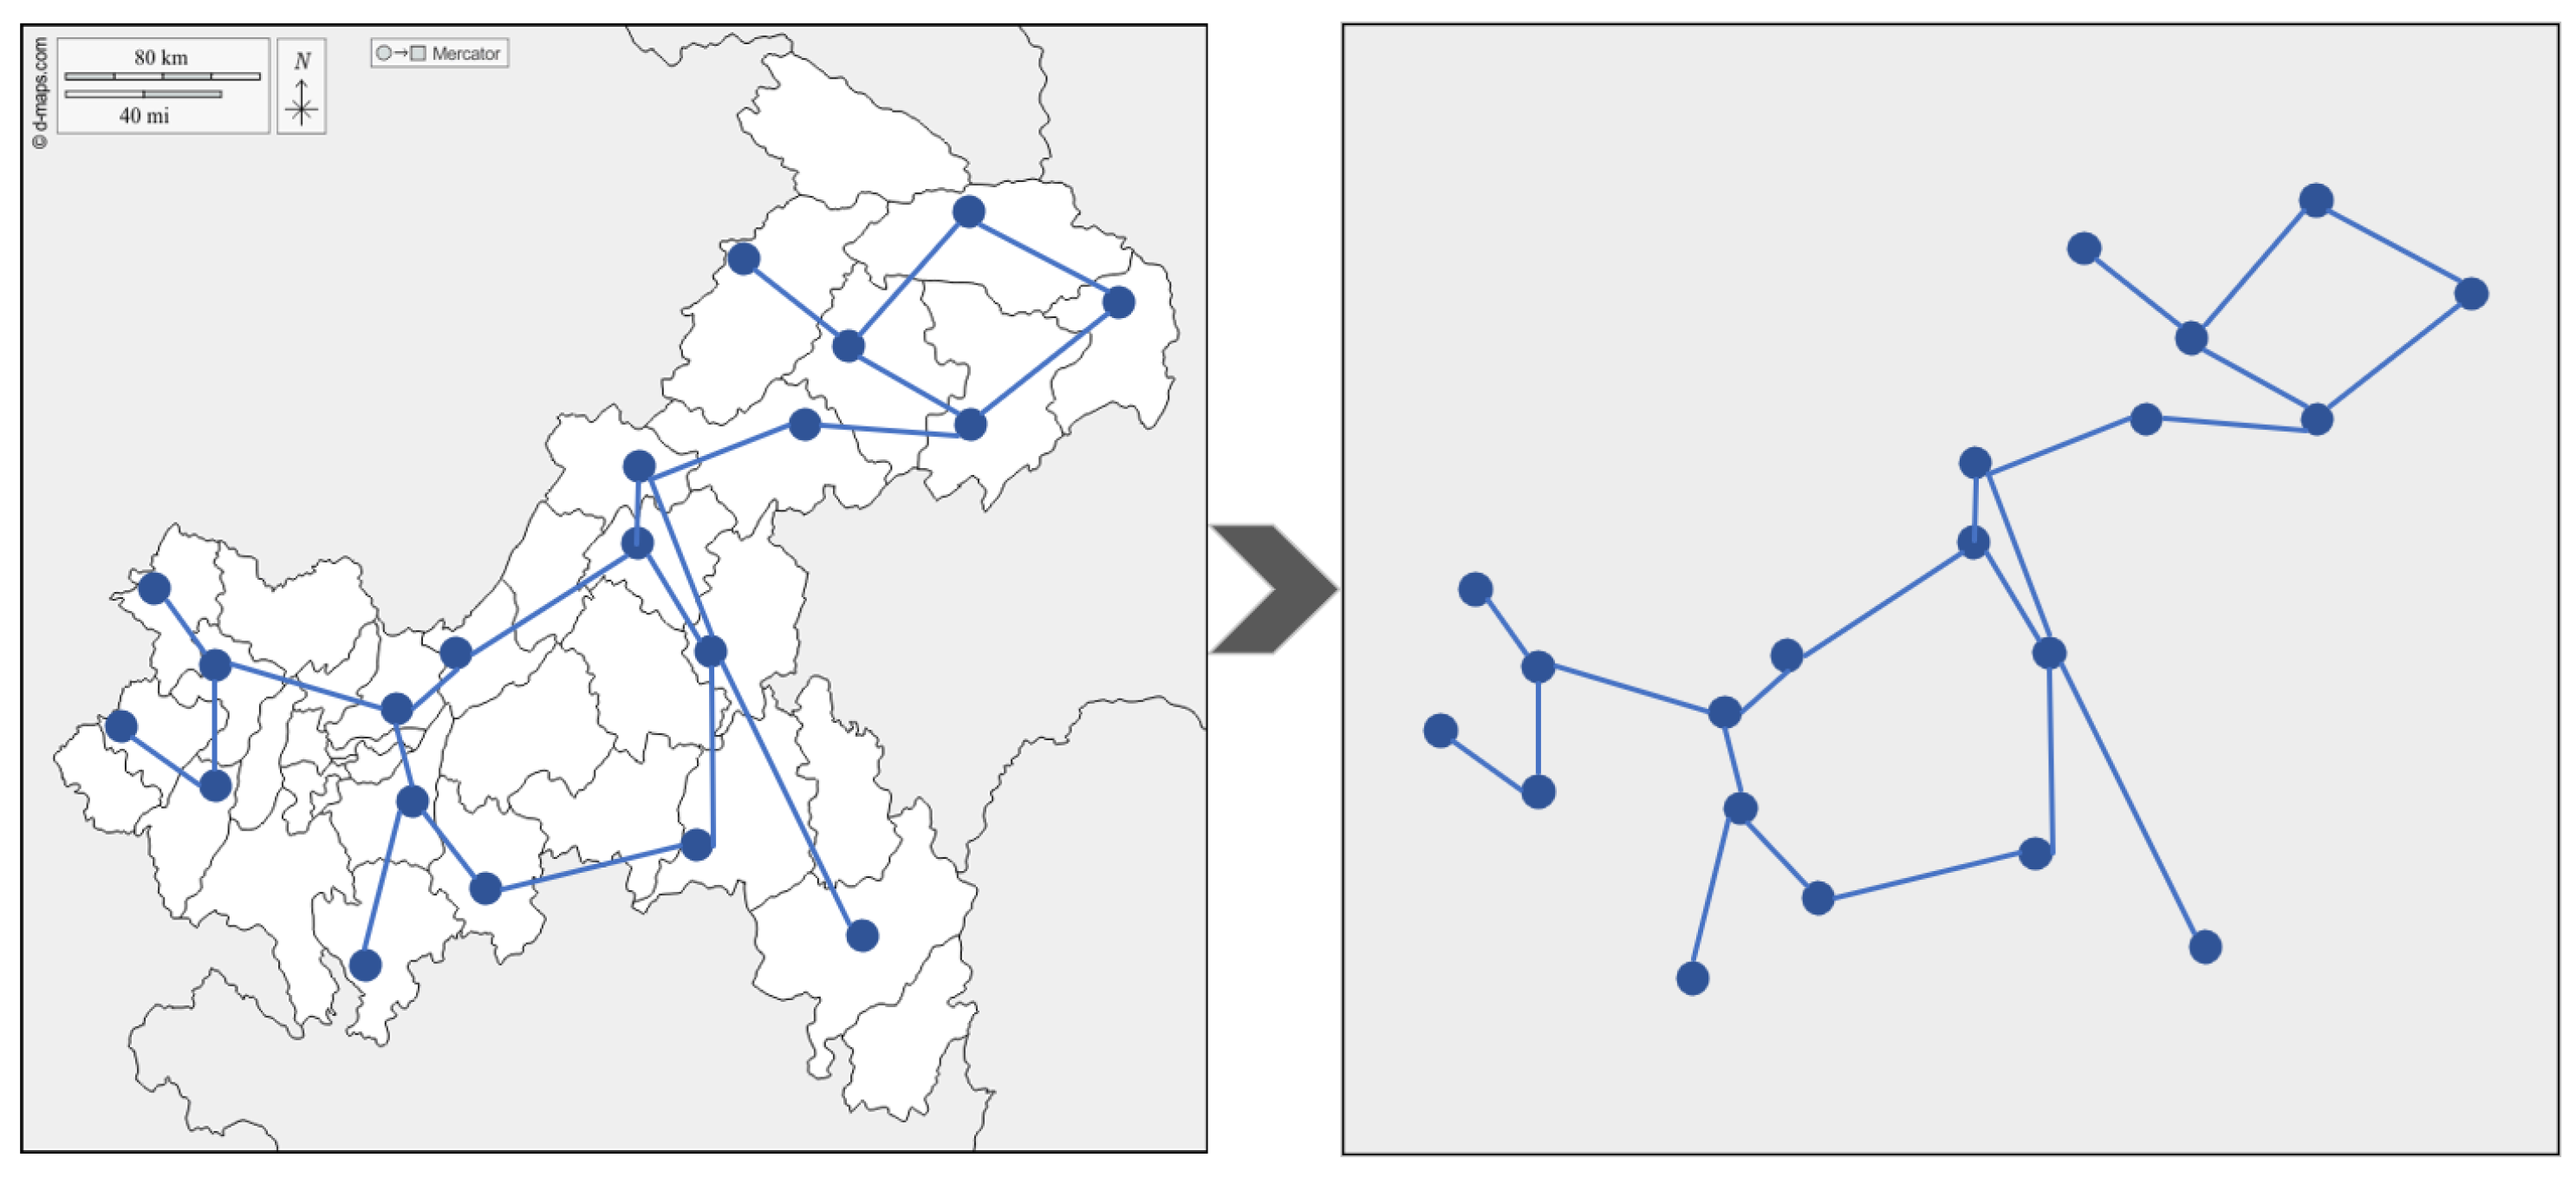
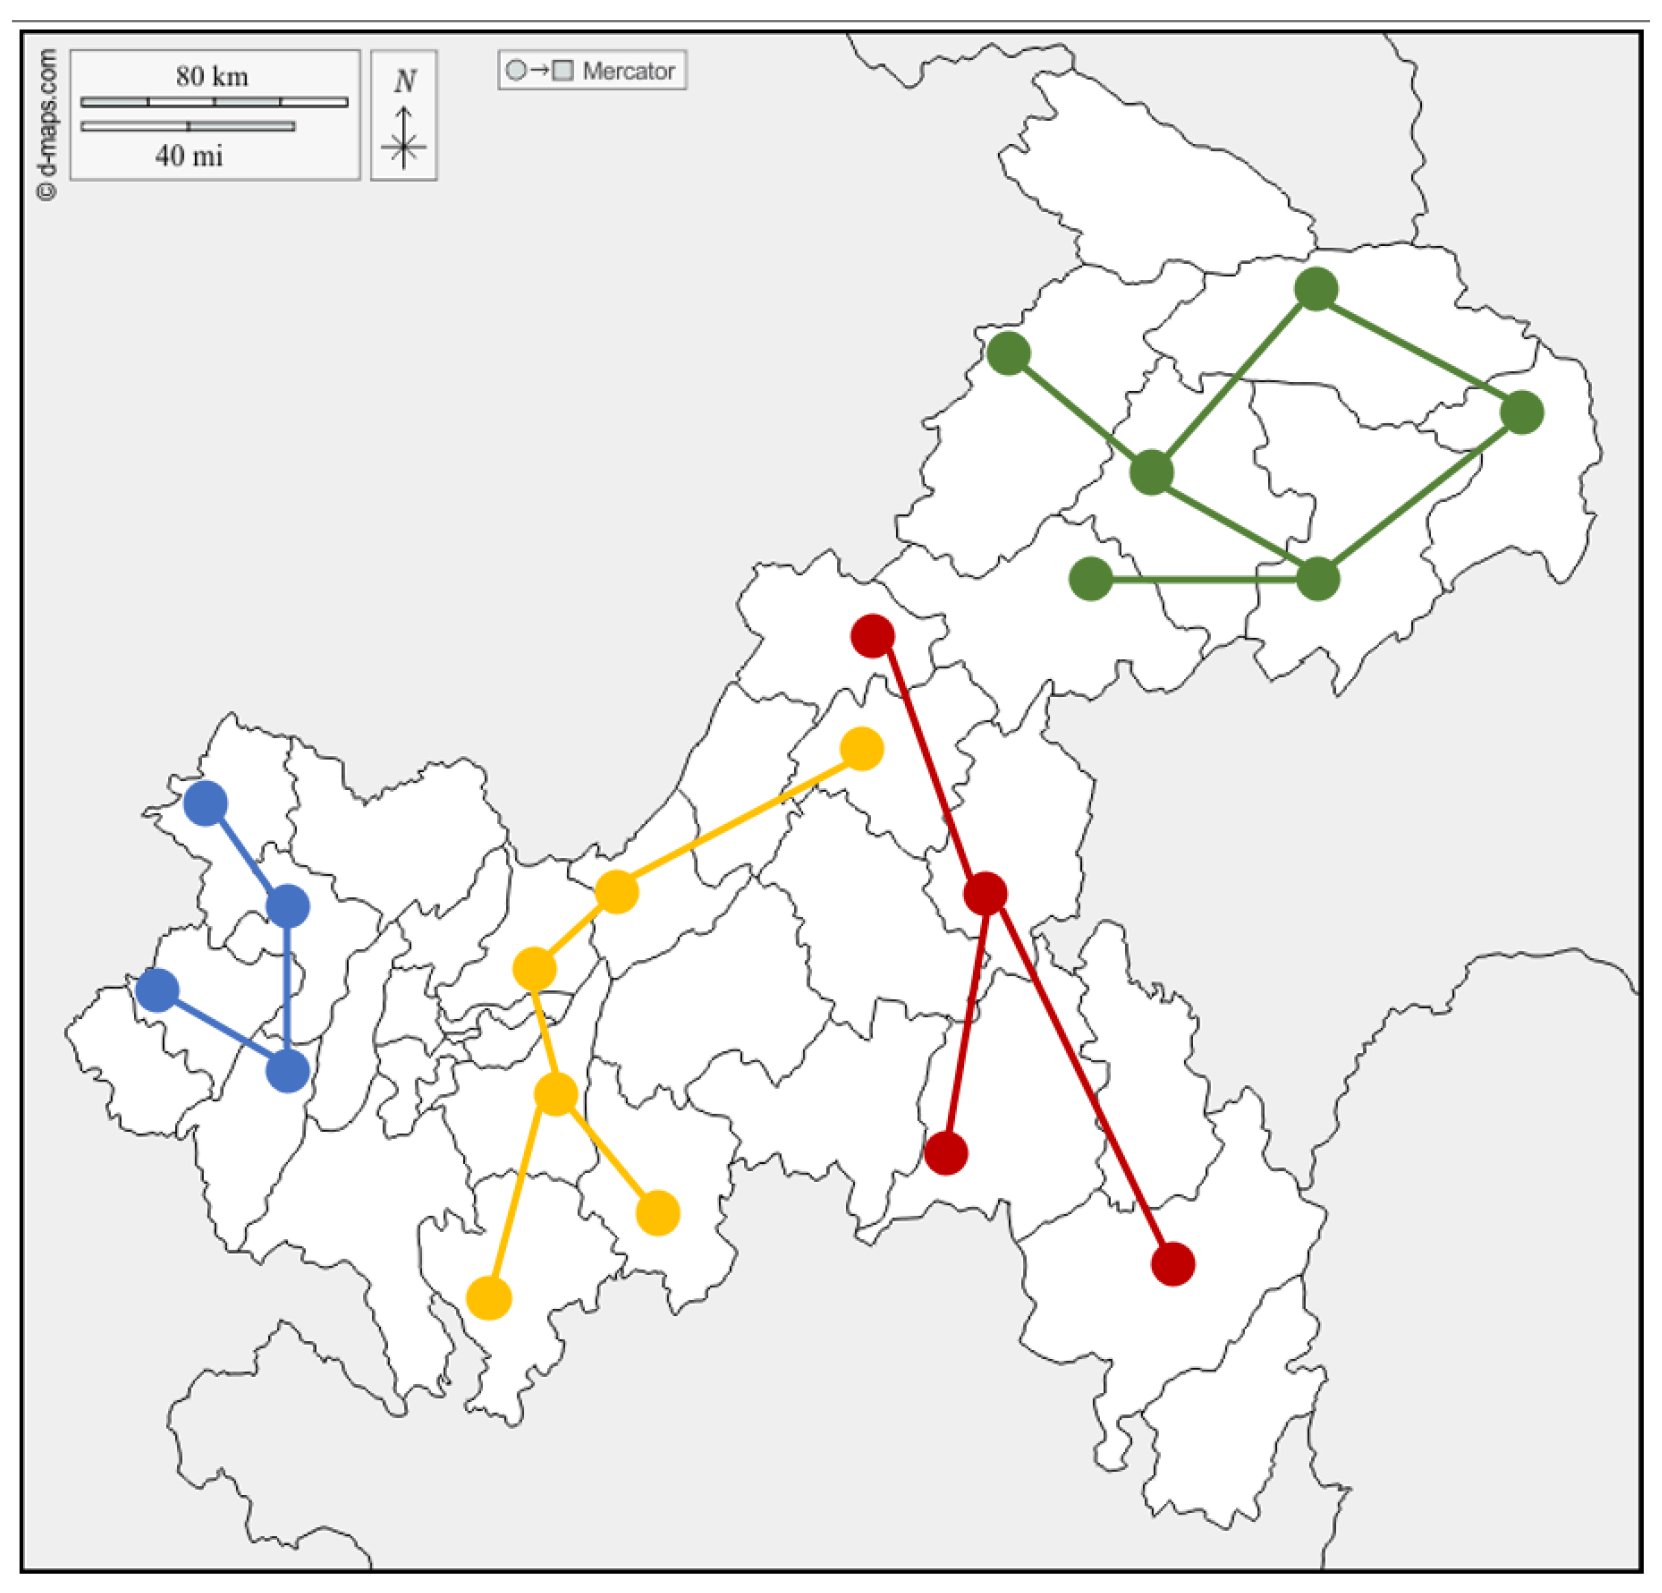
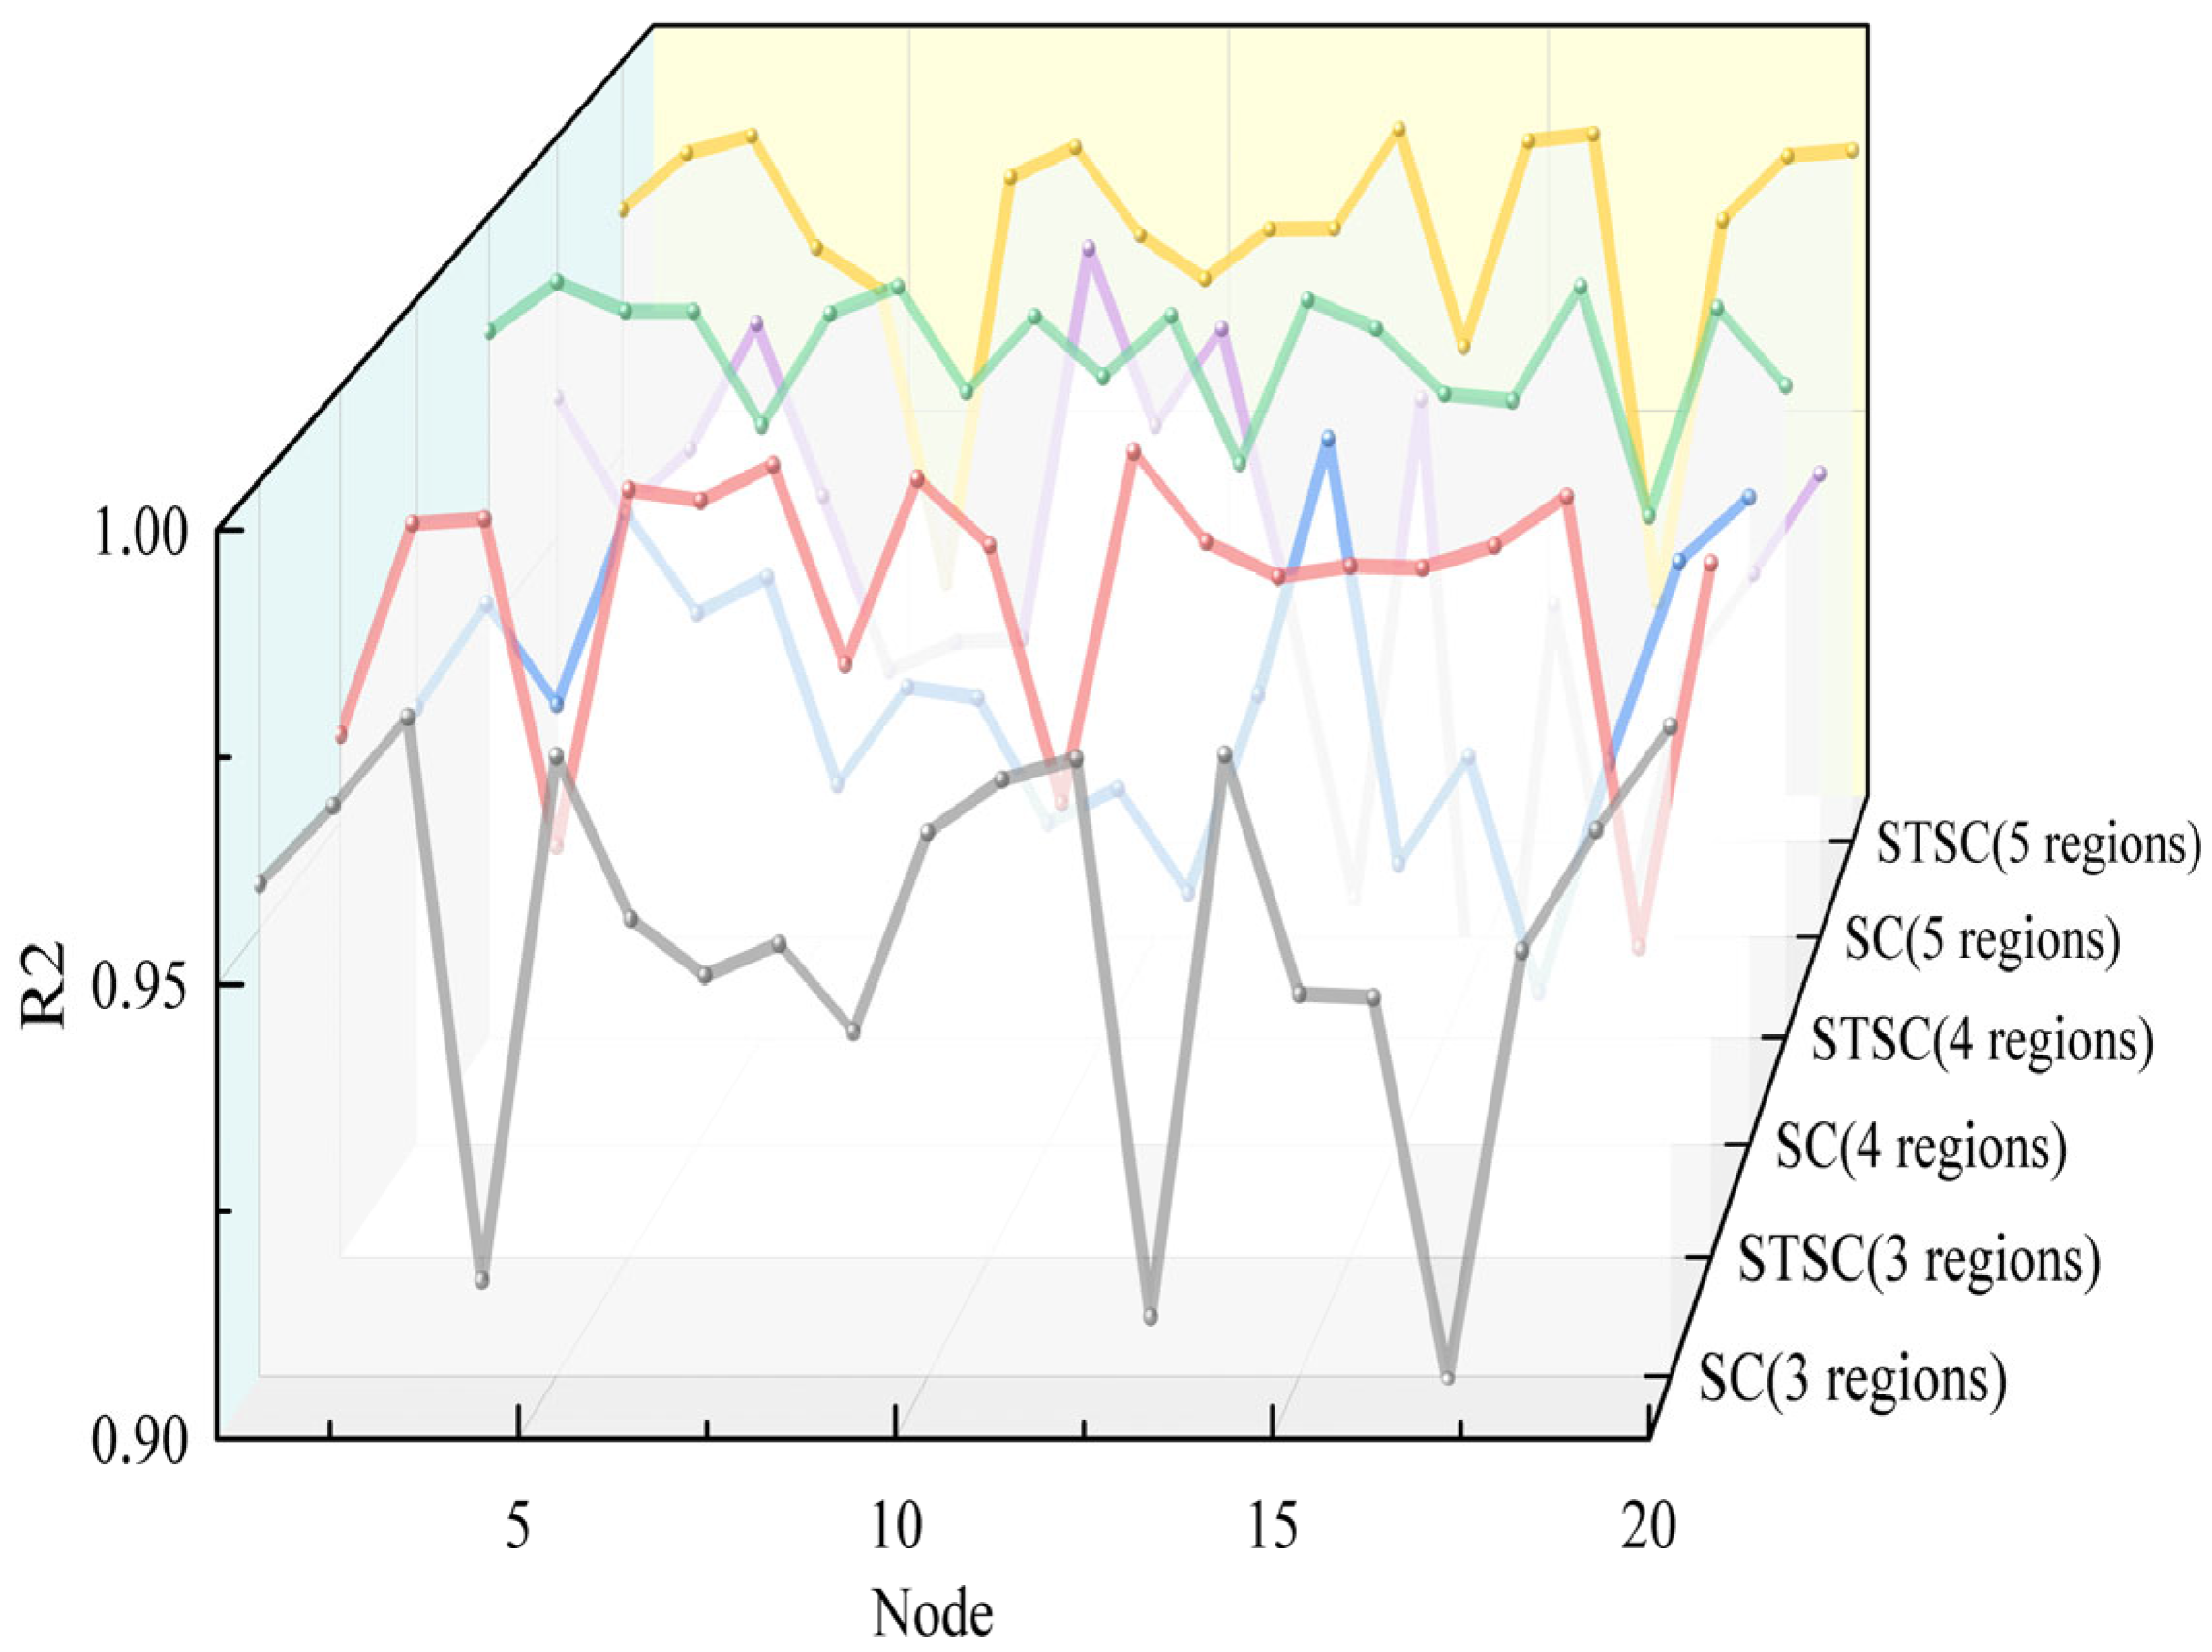
- An integrated similarity matrix is constructed by combining the temporal correlation matrix based on ShapeDTW and the spatial proximity matrix, which, together with spectral clustering and Gap Statistic for adaptive determination of the optimal number of partitions, enables the division of load nodes into multiple sub-regions with high spatiotemporal similarity. This approach transforms a single complex graph structure into several simpler ones, effectively reducing graph complexity while enhancing regional homogeneity. Comparative ablation experiments validate the effectiveness of the method. The spectral clustering model based on the spatiotemporal partitioning strategy achieves an average improvement of 3.142% in the R2 metric across 20 nodes compared to the traditional spectral clustering model.
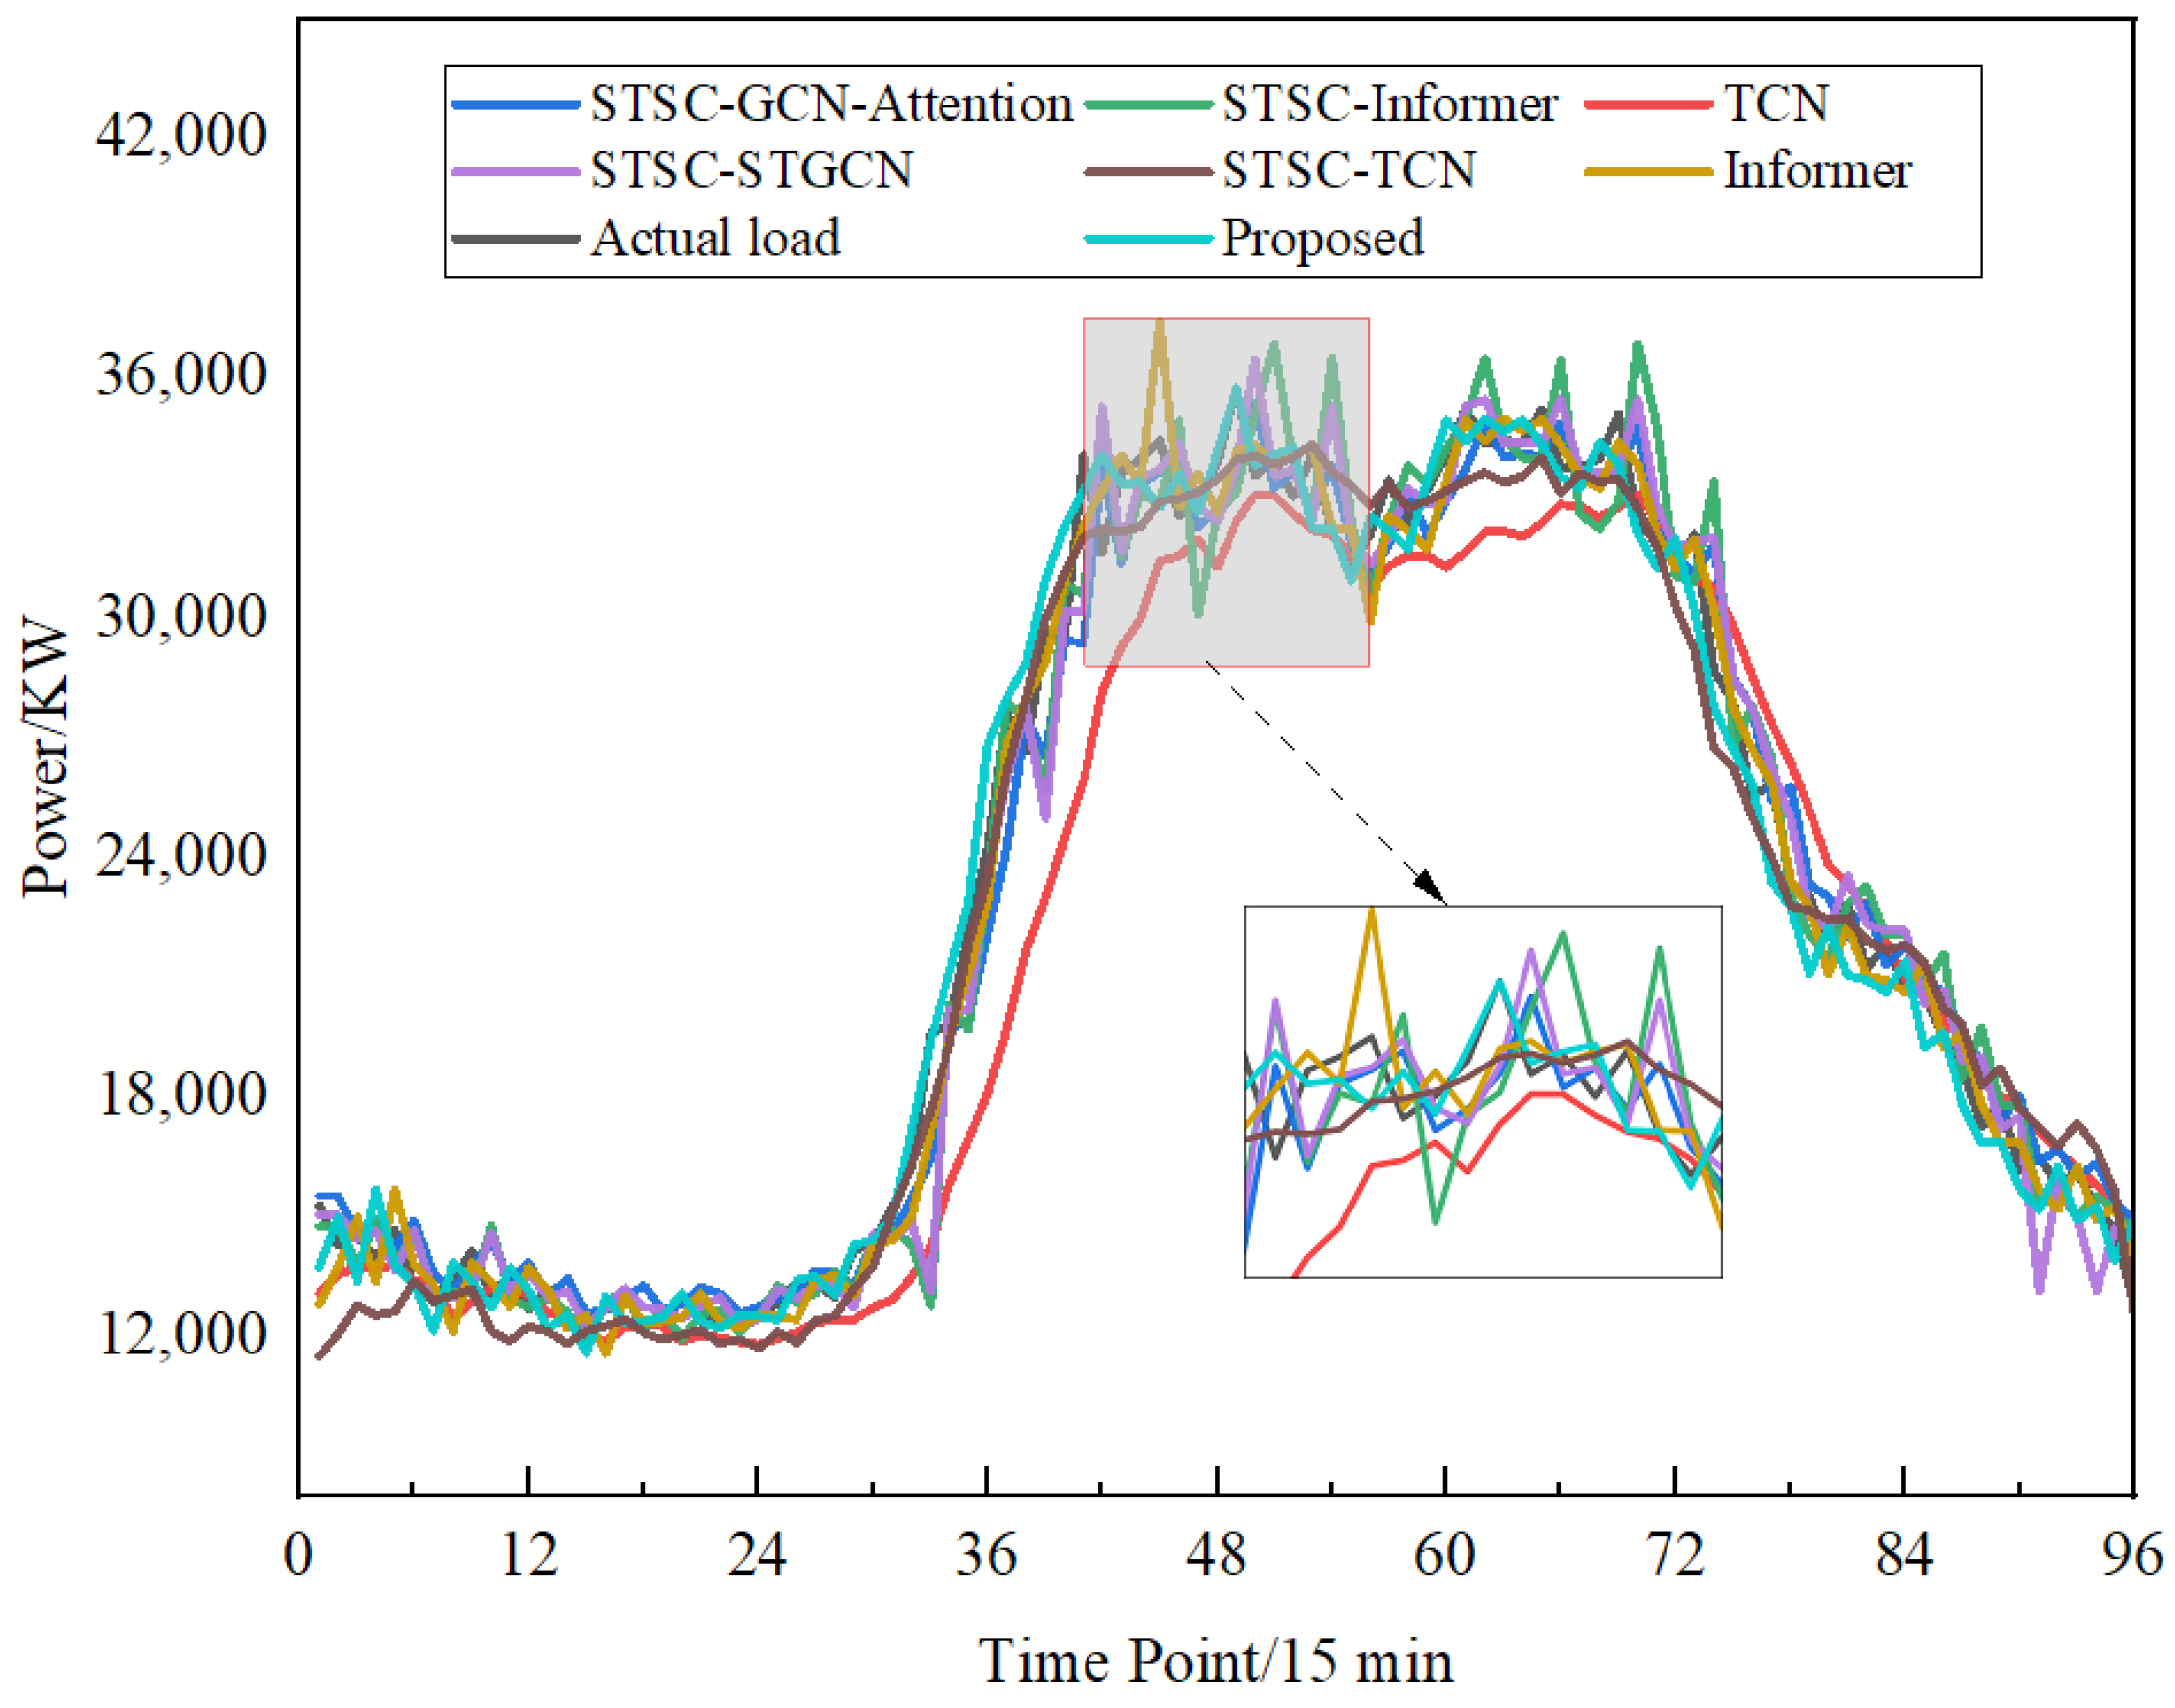
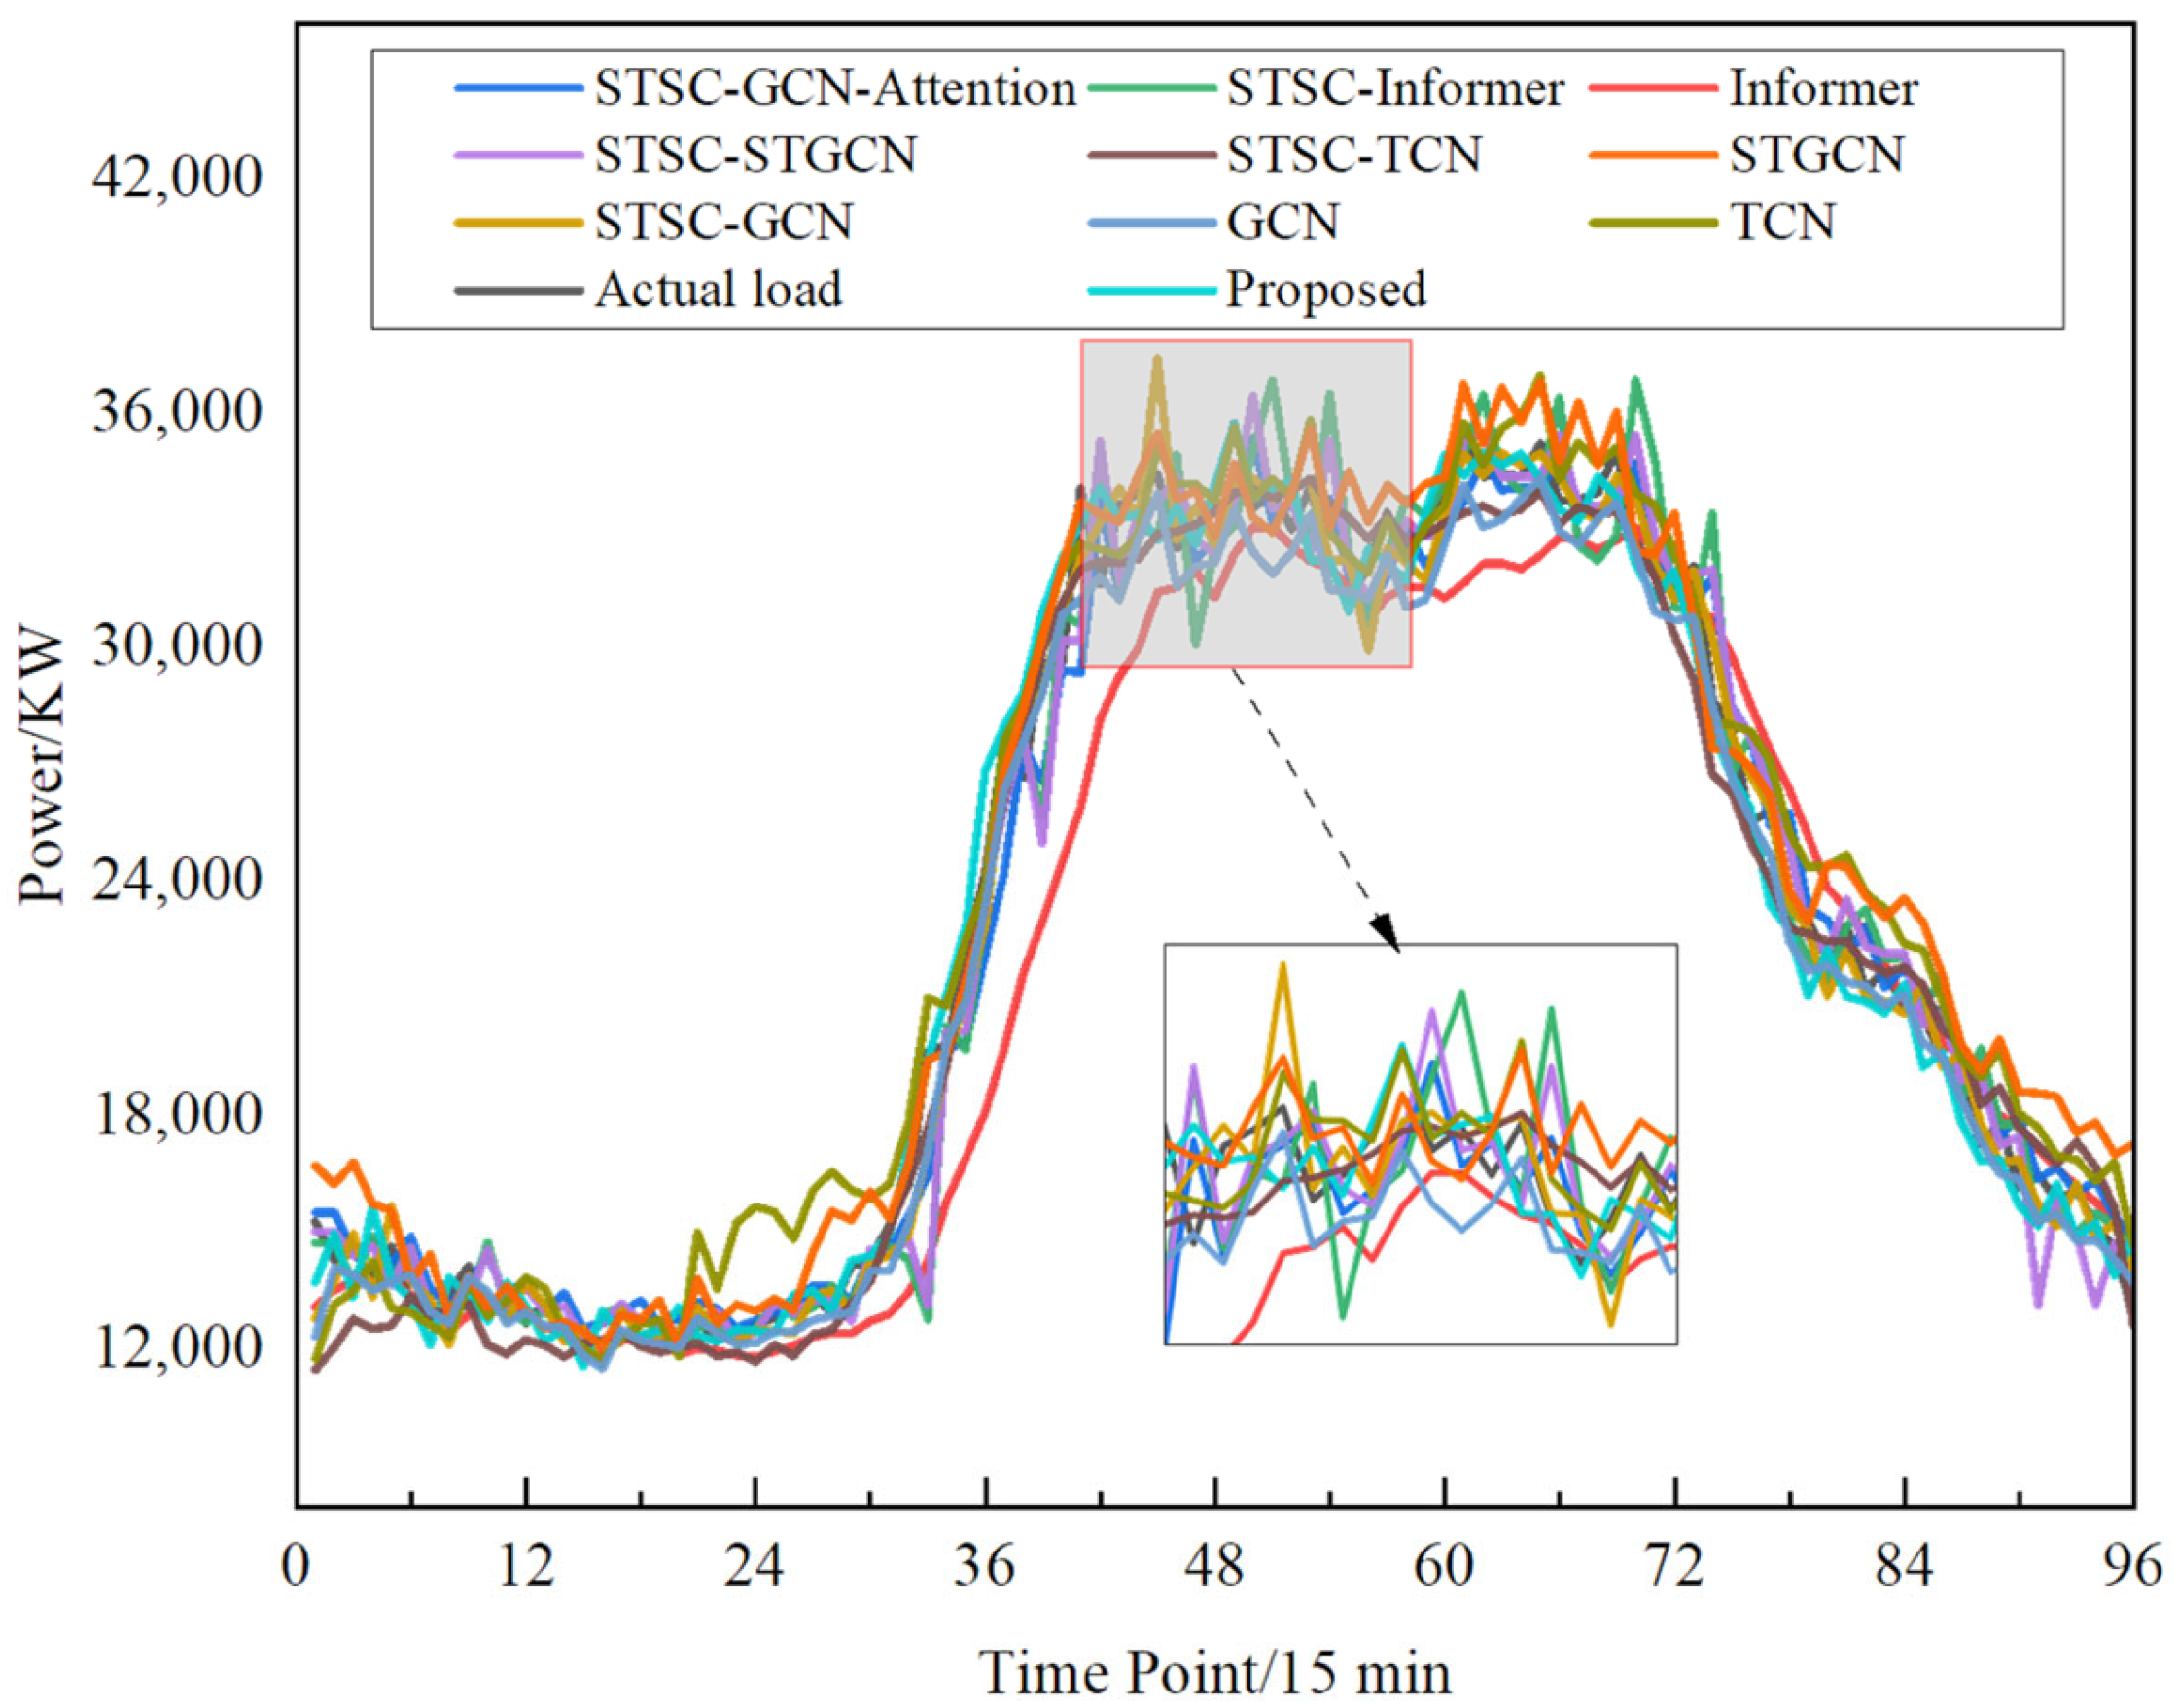
- The synergistic effect of partitioned STGCN and cross-region attention mechanisms effectively addresses the issue of “information islands” and insufficient inter-regional dependencies, significantly improving both prediction accuracy and stability. Verified through comparative ablation experiments, the proposed method achieves an average improvement of 3.563% in the R2 metric across 20 nodes compared to traditional models. The proposed model demonstrates high balance and stability, with an R2 distribution range of [0.9635, 0.9920] and a standard deviation only one-fourth that of the traditional STGCN model. The regional partitioning strategy effectively mitigates the negative impact of complex graph structures on local prediction accuracy, while the cross-region attention module suppresses error propagation across regions, ensuring balanced and stable prediction performance across all nodes.
Author Contributions
Funding
Data Availability Statement
Conflicts of Interest
Appendix A
| Region | SC (3 Regions) | STSC (3 Regions) | SC (4 Regions) | Proposed: STSC (4 Regions) | SC (5 Regions) | STSC (5 Regions) |
|---|---|---|---|---|---|---|
| 1 | 0.9550 | 0.9601 | 0.9517 | 0.9899 | 0.9674 | 0.9810 |
| 2 | 0.9638 | 0.9844 | 0.9640 | 0.9920 | 0.9532 | 0.9882 |
| 3 | 0.9737 | 0.9849 | 0.9520 | 0.9884 | 0.9609 | 0.9905 |
| 4 | 0.9108 | 0.9473 | 0.9746 | 0.9884 | 0.9766 | 0.9761 |
| 5 | 0.9693 | 0.9883 | 0.9629 | 0.9745 | 0.9551 | 0.9707 |
| 6 | 0.9511 | 0.9870 | 0.9671 | 0.9881 | 0.9333 | 0.9332 |
| 7 | 0.9448 | 0.9911 | 0.9426 | 0.9914 | 0.9368 | 0.9851 |
| 8 | 0.9483 | 0.9682 | 0.9541 | 0.9786 | 0.9373 | 0.9890 |
| 9 | 0.9385 | 0.9895 | 0.9529 | 0.9878 | 0.9861 | 0.9778 |
| 10 | 0.9608 | 0.9819 | 0.9380 | 0.9804 | 0.9639 | 0.9721 |
| 11 | 0.9667 | 0.9523 | 0.9421 | 0.9879 | 0.9760 | 0.9785 |
| 12 | 0.9691 | 0.9927 | 0.9298 | 0.9699 | 0.9421 | 0.9786 |
| 13 | 0.9067 | 0.9823 | 0.9533 | 0.9898 | 0.9048 | 0.9913 |
| 14 | 0.9695 | 0.9783 | 0.9835 | 0.9863 | 0.9672 | 0.9634 |
| 15 | 0.9427 | 0.9795 | 0.9332 | 0.9783 | 0.8657 | 0.9898 |
| 16 | 0.9424 | 0.9793 | 0.9459 | 0.9775 | 0.9416 | 0.9907 |
| 17 | 0.8996 | 0.9818 | 0.9180 | 0.9915 | 0.8983 | 0.9307 |
| 18 | 0.9475 | 0.9875 | 0.9452 | 0.9635 | 0.9334 | 0.9797 |
| 19 | 0.9611 | 0.9357 | 0.9690 | 0.9888 | 0.9454 | 0.9879 |
| 20 | 0.9726 | 0.9798 | 0.9766 | 0.9793 | 0.9579 | 0.9886 |
| Region | Proposed | STSC-GCN-Attention | STSC-STGCN | STSC-GCN | STSC-Informer | STSC-TCN | STGCN | GCN | Informer | TCN |
|---|---|---|---|---|---|---|---|---|---|---|
| 1 | 0.9899 | 0.9758 | 0.9800 | 0.9665 | 0.9692 | 0.9637 | 0.9553 | 0.9500 | 0.9378 | 0.9395 |
| 2 | 0.9920 | 0.9899 | 0.9245 | 0.9658 | 0.9517 | 0.9587 | 0.9700 | 0.9394 | 0.9558 | 0.8878 |
| 3 | 0.9884 | 0.9688 | 0.9440 | 0.8344 | 0.9477 | 0.9558 | 0.8629 | 0.9600 | 0.9669 | 0.9098 |
| 4 | 0.9884 | 0.9799 | 0.9202 | 0.9417 | 0.8714 | 0.9300 | 0.8940 | 0.9498 | 0.9744 | 0.8966 |
| 5 | 0.9745 | 0.9445 | 0.9237 | 0.8963 | 0.9608 | 0.9522 | 0.9592 | 0.9565 | 0.9575 | 0.8868 |
| 6 | 0.9881 | 0.9535 | 0.9457 | 0.9325 | 0.9186 | 0.9249 | 0.9496 | 0.9762 | 0.9433 | 0.9161 |
| 7 | 0.9914 | 0.9781 | 0.9815 | 0.9811 | 0.9495 | 0.9367 | 0.9905 | 0.9053 | 0.9571 | 0.9820 |
| 8 | 0.9786 | 0.9888 | 0.9617 | 0.9840 | 0.9427 | 0.9587 | 0.9685 | 0.9013 | 0.9485 | 0.9817 |
| 9 | 0.9878 | 0.9814 | 0.9798 | 0.9890 | 0.9392 | 0.9673 | 0.9627 | 0.9346 | 0.9505 | 0.9795 |
| 10 | 0.9804 | 0.9786 | 0.9735 | 0.9756 | 0.9689 | 0.9763 | 0.9695 | 0.9177 | 0.9600 | 0.9767 |
| 11 | 0.9879 | 0.9878 | 0.9798 | 0.9642 | 0.9835 | 0.9779 | 0.9539 | 0.9253 | 0.8903 | 0.9208 |
| 12 | 0.9699 | 0.9720 | 0.9823 | 0.9846 | 0.9822 | 0.9762 | 0.9800 | 0.9201 | 0.8688 | 0.9658 |
| 13 | 0.9898 | 0.9884 | 0.9530 | 0.9909 | 0.9566 | 0.9781 | 0.9890 | 0.9148 | 0.9016 | 0.9752 |
| 14 | 0.9863 | 0.9798 | 0.9751 | 0.9280 | 0.9828 | 0.9753 | 0.9145 | 0.9123 | 0.9072 | 0.9225 |
| 15 | 0.9783 | 0.9763 | 0.9248 | 0.9662 | 0.9650 | 0.9470 | 0.9621 | 0.9317 | 0.8932 | 0.9462 |
| 16 | 0.9775 | 0.9783 | 0.9039 | 0.9762 | 0.9759 | 0.9329 | 0.9747 | 0.8960 | 0.9652 | 0.9477 |
| 17 | 0.9915 | 0.9354 | 0.9187 | 0.9751 | 0.9717 | 0.9576 | 0.9629 | 0.9221 | 0.9325 | 0.9630 |
| 18 | 0.9635 | 0.9593 | 0.9264 | 0.9519 | 0.9697 | 0.9485 | 0.9316 | 0.9239 | 0.9196 | 0.9143 |
| 19 | 0.9888 | 0.9775 | 0.9731 | 0.9550 | 0.9729 | 0.9507 | 0.9592 | 0.9516 | 0.9361 | 0.9544 |
| 20 | 0.9793 | 0.9804 | 0.9535 | 0.9712 | 0.9673 | 0.9634 | 0.9214 | 0.9383 | 0.9355 | 0.8912 |
Appendix B
| Symbol | Definition |
|---|---|
| The Shape Dynamic Time Warping algorithm, used to calculate the structural similarity between two time series | |
| Univariate time series | |
| The Haversine distance (great-circle distance) between node i and node j | |
| r | The radius of the Earth, with a default value of 6371 km |
| Temporal correlation matrix | |
| The adaptive bandwidth for the Gaussian kernel function, taken as the median of the distances between all nodes | |
| The latitude and longitude coordinates of a node, expressed in radians | |
| The spatial proximity matrix | |
| Spatiotemporal joint similarity matrix | |
| L | Laplacian matrix |
| H | Clustering indicator matrix |
| k | The preset number of clusters |
| α | The weight coefficient for the temporal-spatial combination, set to 0.7 in this paper |
| The Gap Statistic, used to determine the optimal number of clusters | |
| , estimated by clustering random sample sets | |
| B | The number of sampling times for calculating the Gap Statistic |
| The standard deviation of the Gap value, which characterizes its stability | |
| Node matrix set | |
| n | The number of spatiotemporally similar nodes within a sub-region; also, the number of data points for evaluation metrics |
| m | The number of edges within a sub-region |
| Interval-based connection matrix | |
| Query vector in the attention mechanism | |
| Hierarchical spatiotemporal graph convolutional layer | |
| The nonlinear activation function ReLU |
| Abbreviation | Full Name |
|---|---|
| ShapeDTW | Shape Dynamic Time Warping |
| STGCN | Spatiotemporal Graph Convolutional Network |
| GCN | Graph Convolutional Network |
| TCN | Temporal Convolutional Network |
| GNN | Graph Neural Network |
| LSTM | Long Short-Term Memory |
| DTW | Dynamic Time Warping |
| STLF | Short-Term Load Forecasting |
| NWP | Numerical Weather Prediction |
| Seq2Seq | Sequence-to-Sequence |
| SC | Spectral Clustering |
| STSC | Spatiotemporal Spectral Clustering |
| MAE | Mean Absolute Error |
| RMSE | Root Mean Square Error |
| R2 | Coefficient of Determination |
References
- Wang, W.; Chen, Y.; Xiao, C.; Yang, Y.; Yao, J. Design of short-term load forecasting method considering user behavior. Electr. Power Syst. Res. 2024, 234, 110529. [Google Scholar] [CrossRef]
- Zhu, L.; Liu, J.; Hu, C.; Zhi, Y.; Liu, Y. Analysis of Electricity Consumption Pattern Clustering and Electricity Consumption Behavior. Energy Eng. 2024, 121, 2639–2653. [Google Scholar] [CrossRef]
- Shang, Q.; Zhang, Q.; Ju, C.; Zhou, Q.; Yang, Z. A unified traffic flow prediction model considering node differences, spatio-temporal features, and local-global dynamics. Phys. A Stat. Mech. Its Appl. 2025, 667, 130554. [Google Scholar] [CrossRef]
- Wang, Y.; Hao, Y.; Zhao, K.; Yao, Y. Stochastic configuration networks for short-term power load forecasting. Inf. Sci. 2025, 689, 121489. [Google Scholar] [CrossRef]
- Wang, Q. The characteristic analysis and forecasting of mid-long term load based on spatial autoregressive model. J. Northeast. Dianli Univ. 2021, 41, 118–123. [Google Scholar] [CrossRef]
- Hu, Y.; Qu, B.; Wang, J.; Liang, J.; Wang, Y.; Yu, K.; Li, Y.; Qiao, K. Short-term load forecasting using multimodal evolutionary algorithm and random vector functional link network based ensemble learning. Appl. Energy 2021, 285, 116415. [Google Scholar] [CrossRef]
- Zhao, F.; Sun, B.; Zhang, C. Cooling, heating and electrical load forecasting method for CCHP system based on multivariate phase space reconstruction and Kalman filter. Proc. CSEE 2016, 36, 399–406. [Google Scholar] [CrossRef]
- Amral, N.; Ozveren, C.S.; King, D. Short term load forecasting using multiple linear regression. In Proceedings of the 2007 42nd International Universities Power Engineering Conference, Brighton, UK, 4–6 September 2007; IEEE: New York, NY, USA, 2008; pp. 1192–1198. [Google Scholar] [CrossRef]
- Mai, H.; Xiao, J.; Wu, X.; Chen, C. Research on ARIMA model parallelization in load prediction based on R language. Power Syst. Technol. 2015, 39, 3216–3220. [Google Scholar] [CrossRef]
- Li, Y.; Wang, H.; Huang, X.; Hao, J.; Lei, W.; Wang, Q. Short-term power load forecasting in distribution networks considering human comfort level. Front. Energy Res. 2025, 13, 1514755. [Google Scholar] [CrossRef]
- Wang, Y.; Chen, J.; Chen, X.; Zeng, X.; Kong, Y.; Sun, S. Short-term load forecasting for industrial customers based on TCN-LightGBM. IEEE Trans. Power Syst. 2021, 36, 1984–1997. [Google Scholar] [CrossRef]
- Huang, N.; Li, B.; Sun, H.; Wang, Y.; Cai, G.; Zhang, L. Short-term Prediction of Wind Power in Wide-area Multi-wind Farms with Enhanced Time-space Characteristics. Power Syst. Technol. 2025, 49, 3688–3698. [Google Scholar] [CrossRef]
- Wang, S. Short-Term Load Temporal-Spatial Forecasting Based on Graph Neural Networks. Master’s Thesis, Northeast Electric Power University, Jilin, China, 2023. [Google Scholar]
- Chen, H.; Zhu, M.; Hu, X.; Wang, J.; Sun, Y.; Yang, J. Research on short-term load forecasting of new-type power system based on GCN-LSTM considering multiple influencing factors. Energy Rep. 2023, 9, 1022–1031. [Google Scholar] [CrossRef]
- Wang, P.; Feng, L.; Zhu, Y.; Wu, H. Hybrid spatial–temporal graph neural network for traffic forecasting. Inf. Fusion 2025, 118, 102978. [Google Scholar] [CrossRef]
- Cao, J.E.; Liu, C.; Chen, C.-L.; Qu, N.; Xi, Y.; Dong, Y.; Feng, R. A short-term load forecasting method for integrated community energy system based on STGCN. Electr. Power Syst. Res. 2024, 232, 110265. [Google Scholar] [CrossRef]
- Kong, X.; Zheng, F.; Zhijun, E.; Cao, J.; Wang, X. Short-term Load Forecasting Based on Deep Belief Network. J. Mod. Power Syst. 2018, 42, 133–139. [Google Scholar] [CrossRef]
- Zhang, Y.; Li, Y.; Zhang, G. Short-term wind power forecasting approach based on Seq2Seq model using NWP data. Energy 2020, 213, 118371. [Google Scholar] [CrossRef]
- Arastehfar, S.; Matinkia, M.; Jabbarpour, M.R. Short-term residential load forecasting using Graph Convolutional Recurrent Neural Networks. Eng. Appl. Artif. Intell. 2022, 116, 105358. [Google Scholar] [CrossRef]
- Zhao, W.; Chang, W.; Yang, Q. Collaborative energy management of interconnected regional integrated energy systems considering spatio-temporal characteristics. Renew. Energy 2024, 235, 121363. [Google Scholar] [CrossRef]
- Xian, H.; Che, J. Multi-space collaboration framework based optimal model selection for power load forecasting. Appl. Energy 2022, 314, 118937. [Google Scholar] [CrossRef]
- Wang, Z.; Duan, J.; Luo, F.; Qiu, X. Collaborative Forecasting of Multiple Energy Loads in Integrated Energy Systems Based on Feature Extraction and Deep Learning. Energies 2025, 18, 1048. [Google Scholar] [CrossRef]
- Zhao, J.; Itti, L. shapeDTW: Shape Dynamic Time Warping. Pattern Recognit. 2018, 74, 171–184. [Google Scholar] [CrossRef]
- Song, K.; Yao, X.; Nie, F.; Li, X.; Xu, M. Weighted bilateral K-means algorithm for fast co-clustering and fast spectral clustering. Pattern Recognit. 2021, 109, 107560. [Google Scholar] [CrossRef]
- Khan, I.K.; Daud, H.B.; Zainuddin, N.B.; Sokkalingam, R.; Naheed, N.; Janisar, A.A.; Inayat, A.; Rana, M.S. Standardization of expected value in gap statistic using Gaussian distribution for optimal number of clusters selection in K-means. Egypt. Inform. J. 2025, 30, 100701. [Google Scholar] [CrossRef]

| Parameter Name | Parameter Value |
|---|---|
| Seq len | 96 |
| Number of attention heads | 4 |
| Epoch | 150 |
| Batch size | 24 |
| Patience | 15 |
| Optimizer | Adam |
| Learning rate | 0.001 |
| Activation function | RELU |
| Loss function | MSE |
| k | Gap | Sk |
|---|---|---|
| 3 | 0.5779 | 0.1617 |
| 4 | 0.7977 | 0.1443 |
| 5 | 0.7515 | 0.2332 |
| Partitioning Strategy | Number of Divided Regions | Index | ||
|---|---|---|---|---|
| RMSE (KW) | MAE (KW) | R2 | ||
| SC | 3 | 2108.3017 | 1830.0889 | 0.9421 |
| 4 | 1541.1333 | 1301.5839 | 0.9690 | |
| 5 | 2320.9904 | 1738.6011 | 0.9298 | |
| Proposed (STSC) | 3 | 1075.2232 | 826.4382 | 0.9849 |
| 4 | 831.6296 | 605.7206 | 0.9899 | |
| 5 | 1040.4775 | 823.7987 | 0.9859 | |
| Partitioning Strategy | Number of Divided Regions | Average R2 |
|---|---|---|
| SC | 3 | 0.9497 |
| 4 | 0.9528 | |
| 5 | 0.9451 | |
| Proposed (STSC) | 3 | 0.9766 |
| 4 | 0.9836 | |
| 5 | 0.9771 |
| Method | RMSE (KW) | MAE (KW) | R2 |
|---|---|---|---|
| TCN | 2048.8692 | 1444.1106 | 0.9395 |
| Informer | 2060.6376 | 1506.0454 | 0.9378 |
| GCN | 1554.0343 | 1422.9149 | 0.9500 |
| STGCN | 1633.9125 | 1360.4150 | 0.9553 |
| STSC-TCN | 1540.0439 | 1071.3119 | 0.9637 |
| STSC-Informer | 1524.3477 | 1050.3312 | 0.9692 |
| STSC-GCN | 1343.7922 | 1021.9116 | 0.9665 |
| STSC-STGCN | 1180.6844 | 915.4481 | 0.9800 |
| STSC-GCN-Attention | 1302.1242 | 1001.2071 | 0.9758 |
| Proposed (STSC-STGCN-Attention) | 831.6296 | 605.7206 | 0.9899 |
Disclaimer/Publisher’s Note: The statements, opinions and data contained in all publications are solely those of the individual author(s) and contributor(s) and not of MDPI and/or the editor(s). MDPI and/or the editor(s) disclaim responsibility for any injury to people or property resulting from any ideas, methods, instructions or products referred to in the content. |
© 2025 by the authors. Licensee MDPI, Basel, Switzerland. This article is an open access article distributed under the terms and conditions of the Creative Commons Attribution (CC BY) license (https://creativecommons.org/licenses/by/4.0/).
Share and Cite
Dou, X.; Yang, R.; Dou, Z.; Zhang, C.; Xu, C.; Li, J. A Load Forecasting Model Based on Spatiotemporal Partitioning and Cross-Regional Attention Collaboration. Sustainability 2025, 17, 8162. https://doi.org/10.3390/su17188162
Dou X, Yang R, Dou Z, Zhang C, Xu C, Li J. A Load Forecasting Model Based on Spatiotemporal Partitioning and Cross-Regional Attention Collaboration. Sustainability. 2025; 17(18):8162. https://doi.org/10.3390/su17188162
Chicago/Turabian StyleDou, Xun, Ruiang Yang, Zhenlan Dou, Chunyan Zhang, Chen Xu, and Jiacheng Li. 2025. "A Load Forecasting Model Based on Spatiotemporal Partitioning and Cross-Regional Attention Collaboration" Sustainability 17, no. 18: 8162. https://doi.org/10.3390/su17188162
APA StyleDou, X., Yang, R., Dou, Z., Zhang, C., Xu, C., & Li, J. (2025). A Load Forecasting Model Based on Spatiotemporal Partitioning and Cross-Regional Attention Collaboration. Sustainability, 17(18), 8162. https://doi.org/10.3390/su17188162


