Article

Decarbonization Pathways in EU Manufacturing: A Principal Component and Cluster Analysis

Department of Engineering and Industrial Management, Transilvania University of Brasov, 500036 Brasov, Romania
*
Author to whom correspondence should be addressed.
Sustainability 2025, 17(18), 8154; https://doi.org/10.3390/su17188154
Submission received: 23 August 2025 / Revised: 5 September 2025 / Accepted: 8 September 2025 / Published: 10 September 2025

Abstract

This study assesses decarbonization progress in the European Union manufacturing sector between 2015 and 2023, using harmonized Eurostat indicators. The dataset covers emission intensity, energy intensity, renewable energy use, and structural markers of value added. After standardization, variables are reduced through principal component analysis (PCA). The resulting scores are then clustered with k-means, with the number of clusters chosen using elbow and silhouette diagnostics and validated through hierarchical clustering, representing a methodological innovation over existing typological studies. The results highlight persistent heterogeneities across member states. A group of frontrunners combines low intensities with a high share of RES; efficiency-centric groups advance mainly through energy intensity reductions but lag in fuel-switching, while structurally constrained groups remain hindered by energy mix limitations and outdated capital stocks. Dynamically, moderate convergence is observed along the main transition dimension, but persistent divergence remains in structural composition. These patterns justify differentiated policy approaches: accelerating fuel substitution where efficiency gains have already been achieved and integrated packages of modernization and infrastructure in structurally constrained economies. The novelty of this study lies in providing a harmonized, EU-wide, and reproducible typology of industrial decarbonization trajectories, enabling systematic cross-country comparison. Policy relevance is reinforced by linking the typology to current EU instruments such as the Emissions Trading System (ETS), the Carbon Border Adjustment Mechanism (CBAM), the Innovation Fund, and the Net-Zero Industry Act. The integration of PCA with clustering provides an evidence-based that is valuable for prioritizing European industrial policies in line with the Green Deal.

1. Introduction

Decarbonizing the manufacturing sector is a strategic objective of the European Union on its path to climate neutrality. This priority is embedded in the European Green Deal, the Fit for 55 package, and the recent Net-Zero Industry Act, which together define the regulatory framework for industrial transition. Since manufacturing represents a large share of final energy use and greenhouse gas emissions, its progress will critically determine the achievement of the 2030 and 2050 climate targets. Meeting these goals requires a combined strategy: improving energy efficiency, electrifying industrial processes (including process heat), expanding the use of renewable energy sources (RES), and deploying low-carbon technologies such as carbon capture, utilization, and storage (CCUS) and hydrogen. These efforts are supported by a coherent policy mix that includes the Energy Efficiency Directive (EED), the Carbon Border Adjustment Mechanism (CBAM), the EU Emissions Trading System (EU ETS), the Renewable Energy Directive (RED), and emerging instruments such as Carbon Contracts for Difference (CCfDs) [1,2,3,4,5]. In this context, comparable and reproducible assessments of progress across EU member states are crucial since effective policy design depends on empirical evidence that captures both convergence trends and persistent heterogeneities. This provides the rationale for using harmonized Eurostat indicators and statistical typologies as the analytical foundation of this study.
Recent studies highlight the role of industrial clusters and hubs as key drivers of the transition. Shared CO2/H2 infrastructures and access to geological storage can lower costs and accelerate deployment [6,7]. Sequencing connections according to “net energy” or “carbon return” criteria can further enhance efficiency [8,9]. In South-Eastern Europe, techno-economic assessments estimate abatement potentials of up to 25% through CCUS, yet current regimes of free allowances under the EU ETS remain a barrier [10]. Outside established hubs, dispersed industrial sites face additional challenges, as shared infrastructures are absent and the range of technological options must be broader [11]. In this context, a taxonomy based on industrial clusters provides a more realistic picture of constraints and economies of scale than traditional sectoral classifications [12]. Still, existing case-specific taxonomies remain fragmented, and no harmonized EU-wide statistical typology currently captures both frontrunners and structurally lagging economies.
At the same time, implementation is conditioned by socio-technical and institutional challenges. Net-zero megaprojects necessitate coordinated action across multiple actors and systems; in the absence of such alignment, the likelihood of implementation delays and the risk of carbon lock-in increase substantially [13,14,15]. Public acceptance of CCUS depends on visible local benefits, transparent governance, and well-structured actor networks [16]. Place-based approaches are equally important: Cluster boundaries are fluid and often contested, so policies must remain context-sensitive to prevent exclusion and ensure just transitions [17]. European-wide analyses show substantial emission reductions but also persistent regional disparities, challenging “one-size-fits-all” strategies [18]. Evidence from outside the EU confirms this point: In eastern India, local governance arrangements and the configuration of steel clusters have enabled credible low-carbon development trajectories [19].
Another strand of the literature stresses that industrial decarbonization extends beyond direct plant emissions and requires transformation along entire value chains. Benedikt et al. [20], using a Delphi approach, identify supply chain integration, policy alignment, and corporate commitments as central dimensions of net-zero carbon supply chains (NZCSCs) in Europe. Chen et al. [21], analyzing the Dongting basin in China, show that resource-intensive clustering tends to increase emissions but that technological upgrading and spatial coordination can offset these effects. These insights underline the need for heterogeneity-sensitive assessments. Similarly, Oh and Al-Juaied [22] argue that deep decarbonization of industrial hubs depends on integrated green industrial policies, where carbon pricing, supportive CCUS and hydrogen design, and a balanced mix of demand- and supply-side instruments are essential to address value chain complexity and sectoral heterogeneity [23]. Against this background, our empirical design employs harmonized Eurostat indicators that capture emission and energy intensities, renewable integration, and structural characteristics of manufacturing. While these proxies cannot fully reflect Scope 3 supply chain effects, they offer a comparable and reproducible basis for cross-country typologies, enabling the identification of both convergence and persistent divergence in EU decarbonization pathways.
Technological change is also accelerating through digitalization. Advanced analytics, artificial intelligence (AI), and the Internet of Things (IoT) now enable real-time energy monitoring, predictive maintenance, and energy-aware production scheduling, thereby reducing emission intensities in manufacturing [24]. At the industrial park level, bioeconomy systems and industrial symbiosis can amplify these impacts [25]. Multi-vector energy modeling further highlights the potential of heat electrification and RES integration in private cluster networks [26]. Oil and gas (O&G) firms can act as anchor institutions within local innovation ecosystems, provided that their strategic orientation evolves toward sustainable business model types [27]. Recent EU initiatives, such as the Digital Europe Program and the Net-Zero Industry Act, reinforce these developments by linking digital innovation with decarbonization objectives. However, adoption capacity, infrastructure, and industrial structure differ widely across countries. A systematic, comparative framework is therefore needed to assess whether digital and technological enablers promote convergence or reinforce divergence among member states. This provides additional motivation for a multidimensional typology based on harmonized indicators and statistical clustering. Establishing an EU-wide typology directly addresses intra-European disparities and creates a basis for aligning industrial decarbonization with global competitiveness and integration into net-zero supply chains. This perspective highlights the strategic importance of cross-country convergence for sustaining Europe’s position in emerging low-carbon value chains.
Methodologically, decomposition techniques and clustering analyses have been widely used to examine disparities and regional patterns [28,29]. However, at the EU scale, there is still no harmonized, systematic, and reproducible assessment based on Eurostat indicators and focused exclusively on manufacturing. Most existing studies concentrate on national case studies, single sectors, or specific value chains. This leaves a gap for an integrated and statistically validated typology able to capture both convergence and divergence in EU manufacturing over time.
This study addresses the gap by conducting an annual (2015–2023) assessment of decarbonization progress in EU manufacturing. We build a multidimensional dataset (emissions and intensities, energy efficiency, RES integration, structural markers, and technology adoption indicators), standardize it, and reduce its dimensionality using PCA. K-means clustering is then applied to the PCA scores, with the number of clusters determined by elbow and silhouette diagnostics and validated through hierarchical clustering. The resulting typology is reproducible and shows convergence in efficiency but persistent structural disparities. This paper (i) tests three explicit hypotheses on convergence, structural constraints, and place-based policy needs, (ii) provides statistical validation of typological differences, and (iii) links empirical findings to concrete EU policy instruments such as ETS, CBAM, the Just Transition Fund, and the Net-Zero Industry Act. This dual contribution strengthens both methodological rigor and policy relevance, offering a solid evidence base for differentiated policy interventions across Europe.
The remainder of this paper is structured as follows: Section 2 reviews the literature, Section 3 gives the data and methodology, the empirical findings are reported in Section 4, Section 5 discusses findings and policy implications, and Section 6 concludes.

2. Literature Review

2.1. European Policies and Governance

The decarbonization of European manufacturing is driven by the European Green Deal and its key instruments, including the EU ETS, CBAM, RED, EED, and emerging mechanisms such as CCfDs. More recently, the Innovation Fund and the Net-Zero Industry Act (2023) have been introduced to provide targeted support for industrial decarbonization projects and the deployment of low-carbon technologies. Together, these policies define the regulatory framework and incentives for the transition [1,2,3,4]. However, the application of “polluter pays” principles and transitional support schemes raises challenges. Turner et al. [30] show that transferring capture costs directly to energy-intensive industries such as chemicals may increase the risk of offshoring and job losses, with negative consequences for regional employment. European governance therefore faces a dual challenge: internalizing carbon costs while maintaining investment attractiveness. In parallel, large-scale industrial decarbonization projects require strong coordination among multiple actors and institutions, as misalignment can result in costly delays and carbon lock-in [13,14].

2.2. Industrial Clusters and Shared Infrastructures

Industrial clusters have become central drivers of the transition. Shared infrastructures, such as CO2/H2 pipelines and geological storage, reduce costs and create economies of scale [31]. As Devine-Wright [32] notes, cluster boundaries are fluid, and incorporating social and place-based perspectives is essential for legitimacy. Case studies outside Europe confirm these complexities. In China’s Dongting Basin, Chen et al. [21] show that resource-intensive agglomeration amplifies emissions, although technology upgrading and spatial coordination can mitigate these effects. In the United States, Ewers et al. [33] find that federal hydrogen hub policies mobilize coalitions across scales and integrate oil and gas incumbents, offering governance lessons relevant to Europe. Within the EU, techno-economic assessments suggest that CCUS infrastructures could deliver 20–25% emission reductions, though constraints persist under the current ETS regime and historical path dependencies [10]. Overall, the evidence highlights that infrastructural integration strongly influences the speed and depth of industrial decarbonization, while entrenched path dependencies continue to hinder structural transformation.

2.3. Supply Chains and Digitalization

The industrial transition extends beyond direct plant emissions and encompasses entire supply chains. Using a Delphi framework, Benedikt et al. [20] identify supply chain integration, corporate commitments, and policy alignment as key drivers of net-zero carbon supply chains in Europe. Bibliometric analyses further confirm the rapid growth of research on low-carbon supply chains, with strong emphasis on carbon accounting, logistics, and institutional barriers [34].
Digitalization further supports the transition. Industry 4.0 technologies improve energy management: IoT enables real-time monitoring, AI and big data generate predictive insights, and virtual reality helps optimize process design [24]. These tools create more energy-efficient, flexible, and smart factories. Recent EU initiatives, such as the Digital Europe Program, explicitly link digital innovation with decarbonization targets. Monitoring across countries still relies mainly on Scope 1 and Scope 2 indicators, and Scope 3 supply chain emissions remain excluded from statistical typologies. This omission is a major limitation when comparing decarbonization progress across member states.

2.4. Socio-Institutional and Methodological Dimensions

Beyond infrastructures and technologies, industrial decarbonization also depends on social legitimacy and governance. For CCUS, gaining a “social licence to operate” requires visible local benefits and transparent actor networks [16]. Place-based approaches help prevent exclusions and support just transitions [17]. At the European scale, spatial–temporal studies show substantial emission reductions but also persistent regional disparities, which undermine one-size-fits-all policies [18]. Evidence from outside the EU reinforces this point: in eastern India, place-based hub design enabled low-emission steelmaking trajectories [19]. Together, these insights show that governance quality and local context are critical for successful industrial transitions.
On the methodological side, many studies combine decomposition analysis with clustering to assess disparities and convergence [35]. A harmonized EU-wide analysis based on Eurostat data and focused specifically on manufacturing is still absent. This study fills that gap by developing a reproducible typology of industrial decarbonization progress across EU economies (2015–2023). We apply PCA to extract latent dimensions and k-means clustering to identify country typologies. This hybrid approach is widely used for multidimensional datasets and ensures transparency, comparability, and replicability, making it suitable for policy-relevant monitoring.

2.5. Research Hypotheses

Building on the reviewed literature, three main hypotheses are formulated. Evidence on EU policy instruments (Section 2.1) highlights the tension between carbon cost internalization and competitiveness, suggesting that decarbonization performance follows a combined dimension of energy efficiency and fuel switching. Research on industrial clusters and infrastructures (Section 2.2) points to persistent path dependencies in economies with outdated capital stocks and carbon-intensive energy mixes. Socio-institutional studies (Section 2.4) underline the need for differentiated, place-based strategies, as regional disparities persist despite overall emission reductions. Taken together, these insights motivate the following hypotheses, which are tested empirically using harmonized Eurostat indicators, PCA, and clustering.
H1. 
How is decarbonization performance in EU manufacturing structured along an integrated dimension of energy efficiency and fuel switching, distinguishing frontrunner economies from laggards?
H2. 
How do outdated capital stocks and carbon-intensive energy mixes shape structurally lagging typologies through path dependence and institutional constraints?
H3. 
How do persistent cross-country differences in decarbonization trajectories imply the need for place-based and differentiated policy approaches rather than uniform strategies?
By testing these hypotheses, this study not only classifies member states but also develops a reproducible typology that can inform dynamic monitoring and policy evaluation frameworks.

3. Data and Methodology

3.1. Data and Variables

The analysis uses an annual EU-27 panel for 2015–2023 at the country–year level, restricted to C–Manufacturing (NACE Rev.2) [36]. Table 1 lists the Eurostat sources, their SDMX codes, key filters (geo, nace_r2, unit, s_adj, etc.), measurement units, and their role in the analysis (active PCA variable, supplementary profiling indicator, or control series). Derived indicators (emission intensity, energy intensity, RES share in final industrial consumption, and structure of GVA) are defined in the methodological section, with corresponding formulas reported in Section 3.2 (Equations (1)–(5)).
The indicators were selected to capture direct emissions (Scope 1 and 2), efficiency improvements, fuel switching, and structural economic features, reflecting the main decarbonization pathways identified in the literature. Scope 3 supply chain emissions are excluded due to the absence of harmonized data; a limitation acknowledged in this study.
The dataset contained 11 missing values. As these were neither consecutive nor located at the boundaries of the series, we applied simple linear interpolation to estimate them. Because of the small proportion of missing data and the absence of edge cases, extrapolation was unnecessary. To test robustness, the PCA and clustering without were re-estimated without the interpolated values, obtaining consistent loadings and cluster assignments. This confirms that the limited interpolations do not affect the validity of the results.

3.2. Methodology

3.2.1. Data Pre-Processing and Standardization

The analysis uses an annual EU-27 panel for 2015–2023, at the country–year level, together with the indicators listed in Table 1. Extreme values are constrained by replacing observations beyond the 1st and 99th percentiles to reduce the influence of outliers while preserving the overall distributional shape. Indicators with a “lower = better” interpretation (specific emissions and energy intensity) are re-oriented so that higher scores consistently reflect superior climate performance.
As documented in Section 3.1, the dataset contained 11 missing values. Since these were neither consecutive nor located at the boundaries, linear interpolation was applied to short gaps (≤2 years), while no extrapolation was required. No country–year observations fell below the 80% data coverage threshold, so no series were excluded. Robustness checks confirmed that removing the interpolated points did not alter PCA loadings or cluster partitions. All indicators were then transformed to a common scale using z-score standardization on the pooled EU-27 × years sample, ensuring comparability across units and preventing distortions in distance-based analyses [37,38].
z ij = x ij μ i σ i
where μi and σi are the mean and standard deviation of variable i over the entire sample.
Dimensionality reduction was performed via PCA on the standardized matrix, extracting latent dimensions of decarbonization progress (efficiency, specific emissions, RES integration, and structure), mitigating collinearity, and providing an orthogonal space for clustering [39,40]. The linear transformation is
Z   = XW ,
where X is the standardized data matrix, W contains the eigenvectors (loadings), and Z are the principal component scores. For standardized data, the covariance matrix coincides with the correlation matrix:
Σ = 1 n 1 X T X .
The number of retained components was determined by a combination of Kaiser’s λ > 1 rule, scree plot inspection, and parallel analysis. In practice, this yields a stable 3–4 component solution that explains approximately 70–80% of total variance, ensuring comparability across years. To test stability, alternative specifications with additional components produced consistent clustering outcomes. The signs of the loadings are oriented so that higher component scores consistently indicate better performance (i.e., lower specific emissions/energy use and higher RES shares). R&D indicators are projected as supplementary variables for profiling the typologies, and robustness checks that included them as active variables did not significantly alter the partition structure.

3.2.2. K-Means Clustering in the PCA Space

Clustering is applied in the space of the retained principal components, using the k-means algorithm with multiple random initializations to avoid local minima. Convergence is assessed by the stability of the objective function or by centroid shifts below a fixed threshold, following standard practice [41]. This approach provides a parsimonious representation of the underlying data structure, while inevitably abstracting from sectoral specificities and nonlinearities. Such limitations resonate with recent findings by Kaplan et al. [42], who argue that industrial decarbonization often appears “hard to decarbonize” largely because it is “hard to model.” Accordingly, the k-means partitioning is not intended as an exhaustive map of all possible trajectories but rather as a complementary diagnostic tool that captures recurrent structural patterns. Recent advances apply machine learning clustering to industrial transitions, including multi-cluster assessments in Chinese manufacturing [35], socio-economic vulnerability mapping in U.S. counties [43], and uncertainty analysis in power systems [44]. These studies highlight the potential of hybrid frameworks to capture nonlinearities, but the present study emphasizes reproducibility and transparency at EU scale through PCA–k-means.
Operating in the PCA space reduces collinearity among indicators, enhances pattern separability, and preserves the shared informational structure of the dataset. In the baseline specification, k-means is applied directly to the raw component scores so that each axis contributes proportionally to its explained variance. As a robustness check, partitions are re-estimated on rescaled component scores (standardized to unit variance), yielding highly consistent results across years. Cluster solutions were explored for values of K between 2 and 15. The within-cluster sum of squares (WCSS) was inspected using the elbow criterion, and the silhouette index was also computed:
WCSS K   =   i = 1 K x j   C i x j   μ i 2 ,
where C i denotes cluster i, μ i its centroid, and x j the score vector of observation j. Both diagnostics indicated a local optimum at k = 3 and a secondary improvement at k = 4. To ensure parsimony and interpretability, the analysis retains k = 3 as the main specification, while noting that the k = 4 solution produces very similar results and does not substantively alter policy implications. The optimal number of clusters K is determined ex ante by combining the silhouette index [45] with the inflection point of the elbow curve. The algorithm is run with the chosen K, using at least 100 random initializations and a fixed random seed to ensure reproducibility. Cluster stability was further assessed through Adjusted Rand Index (ARI) values, confirming consistent assignments across specifications. Alternative approaches, such as fuzzy or dynamic clustering models, could capture gradual transitions and temporal dependencies. However, the present study prioritizes transparency and replicability, relying on PCA–k-means as a parsimonious benchmark for EU-wide typologies.
Cluster centroids are interpreted through two complementary steps: inspection of component loadings, which clarify the economic meaning of each PCA axis, and back-projection onto the original indicators, reporting cluster median profiles to facilitate interpretation in substantive terms (energy intensity, emissions per GVA, and RES shares). This dual procedure enhances both statistical validity and economic interpretability, ensuring that the identified typologies are not only mathematically robust but also substantively meaningful for policy analysis.
For temporal comparability, PCA is estimated once on the pooled sample (2015–2023), and annual scores are projected into this fixed basis. This strategy prioritizes consistency of the typology across years, allowing the analysis to track convergence or divergence dynamics over time. To verify robustness, the reference typology is re-estimated on annual snapshots using the same PCA basis, confirming the stability of results.

3.2.3. Robustness and Cross-Validation

To assess the robustness of the partitions, external validation is conducted using hierarchical clustering on the same PCA scores. The Euclidean distance metric is adopted because it preserves the orthogonality of PCA axes and reflects the geometric structure of the reduced space, ensuring interpretability of centroid-based algorithms. Ward’s linkage method is used to form clusters by minimizing the increase in within-cluster variance at each step [46]. Agreement between the k-means and hierarchical solutions is quantified by stability indices such as the ARI [47], which measures the consistency of assignments across methods.
The Euclidean distance between two observations x i and x j is defined as
d i , j = k = 1 p x ik   x jk 2 ,
where p is the number of retained main components. The Ward criterion minimizes the increase in clustering energy at successive mergers:
E = x C 1 C 2 x μ 2 x C 1 x μ 1 2   x C 2 x μ 2 2 ,
where μ, μ1, and μ2 denote the centroids of the merged and original clusters, respectively.
The dendrogram is cut at the same number of clusters K as determined by the silhouette and elbow diagnostics, ensuring comparability. Median profiles on the original indicators are then compared across methods to evaluate the economic interpretability of the typologies. Additional robustness was verified by rescaling PCA components to unit variance and by computing alternative separation indices (silhouette, Calinski–Harabasz, and Davies–Bouldin), all of which yielded highly consistent results. Stability was further supported by ARI values across k-means and Ward solutions, as well as by annual cluster stability tables. While fuzzy or dynamic clustering frameworks could, in principle, capture gradual transitions and temporal dependencies, comparative evidence from related studies suggests that the overall group structure is preserved, indicating that the conclusions are not driven by the constraints of the clustering assumption.
Furthermore, statistical corrections for cross-sectional dependence, including Driscoll–Kraay errors and CCE estimators, were implemented in parallel regressions, with no substantive impact on the clustering outcomes.
All validations are conducted separately for each year from 2015 to 2023, but the PCA basis estimated on the pooled sample is maintained. This guarantees that comparisons across time are coherent since the same latent space is used to define both the k-means and hierarchical solutions. Recent advances also integrate machine learning and multi-cluster frameworks to capture heterogeneity in industrial transitions. For example, Ran et al. [35] propose a machine-learning-assisted multi-cluster assessment for China’s chemical fiber industry, combining predictive models of energy use with Monte Carlo simulation of ETS scenarios. Such approaches reveal differentiated efficiency potentials and carbon trading outcomes across firm typologies. The present study adopts PCA–k-means for transparency and reproducibility at the EU scale, while parallels can be drawn with such hybrid methodologies, underscoring the broader value of clustering in tailoring policy to sectoral and structural contexts.

4. Results

4.1. Descriptive Statistics and Stationarity

Table 2 presents the descriptive statistics of the variables incorporated into the PCA, together with the supplementary indicators employed for cluster profiling. The distributions are highly heterogeneous: industrial emissions (AINAH and GGE) and R&D expenditures (GERDTOT and BERDIND) vary by two to three orders of magnitude across countries, reflecting the structural diversity of the EU manufacturing base. These series also display strong positive skewness (>2) and high kurtosis (>10), indicating heavy tails and the presence of extreme performers or laggards. The Jarque–Bera test rejects normality for nearly all series (p < 0.001).
More stable indicators, such as recycling rates (WASPCR), electrification (RE), or energy intensity (EI), exhibit more compact distributions but still deviate from Gaussian assumptions. Structural variables (A10 and INPR) show lower dispersion and moderate skewness, consistent with greater cross-country stability in industrial output levels. These features justify the preprocessing steps applied, which reduce the influence of extremes and improve comparability.
Cross-sectional dependence was assessed using Pesaran’s CD statistics [48] (Table 3). Significant dependence is detected for emissions and R&D-related variables (AINAH, GGE, MFA, RP, GERDTOT, and sBERDIND), confirming the role of EU-wide shocks and common technological dynamics. In contrast, indicators such as WASPCR, RE, REN, A10, and INPR show no significant dependence, suggesting more idiosyncratic or country-specific variation.
To account for persistence and dependence across countries, we estimated models that correct for both time and country effects, using robust standard errors. The results show strong persistence over time, particularly for R&D indicators (coefficients close to 1), which is consistent with the long-term and path-dependent nature of innovation processes (Table 4).
The models accounting for common shocks across countries (CCE models, Table 5) show that results differ depending on whether estimates are pooled or allowed to vary by country. These differences, especially for GGE and RP, point to substantial cross-country heterogeneity and highlight the need for a multivariate typology approach.
Overall, adding Driscoll–Kraay corrections and CCE estimators confirms that EU countries share common shocks. Importantly, this does not change the PCA results or the stability of the clusters, which supports the robustness of the typology.

4.2. Correlation Analysis

The annual correlation matrices for 2015–2023 (Figure 1) show a consistent three-block structure. The first is the emissions–industrial scale block, where AINAH, GGE, and MFA are almost perfectly correlated each year (Pearson ρ ≈ 0.91–1.00). This indicates a latent “scale” dimension: Higher production volumes systematically lead to higher emissions and material use. The strong collinearity in this block supports the use of PCA to reduce dimensionality and avoid overweighting closely related indicators.
A second block relates to clean energy and efficiency. REN is moderately and negatively correlated with emissions and intensities (≈−0.20 to −0.27), while EI shows a similar negative association (≈−0.17 to −0.31). RE has only weak correlations with emissions (≈0 to −0.08) but shows moderate positive links with REN (≈0.25–0.31) and EI (≈0.28–0.31). Overall, these relationships define a transition performance dimension, where progress comes mainly from lower intensities and higher RES shares, while electrification plays a smaller role, reflecting its uneven adoption across member states.
The third block relates to scale, structure, and innovation. Structural indicators such as A10 and INPR show moderate positive correlations with emissions (A10 ≈ 0.24–0.40; INPR falls from moderate levels in the early years to ≈0.00–0.10 by 2022–2023). Innovation indicators GERDTOT and BERDIND are strongly correlated with each other (≈0.83–0.91) and also with emissions variables (≈0.82–0.92), indicating that larger, more industrially intensive economies also report higher R&D expenditures. Circularity indicators (RP and WASPCR) have a moderately negative correlation (≈−0.47 to −0.32), which weakens over time but has not yet turned positive.
Across all years, the correlation structure remains highly consistent, with only minor year-to-year variation. This stability supports robust PCA loadings and strengthens the reliability of the cluster interpretations.

4.3. Principal Component Analysis

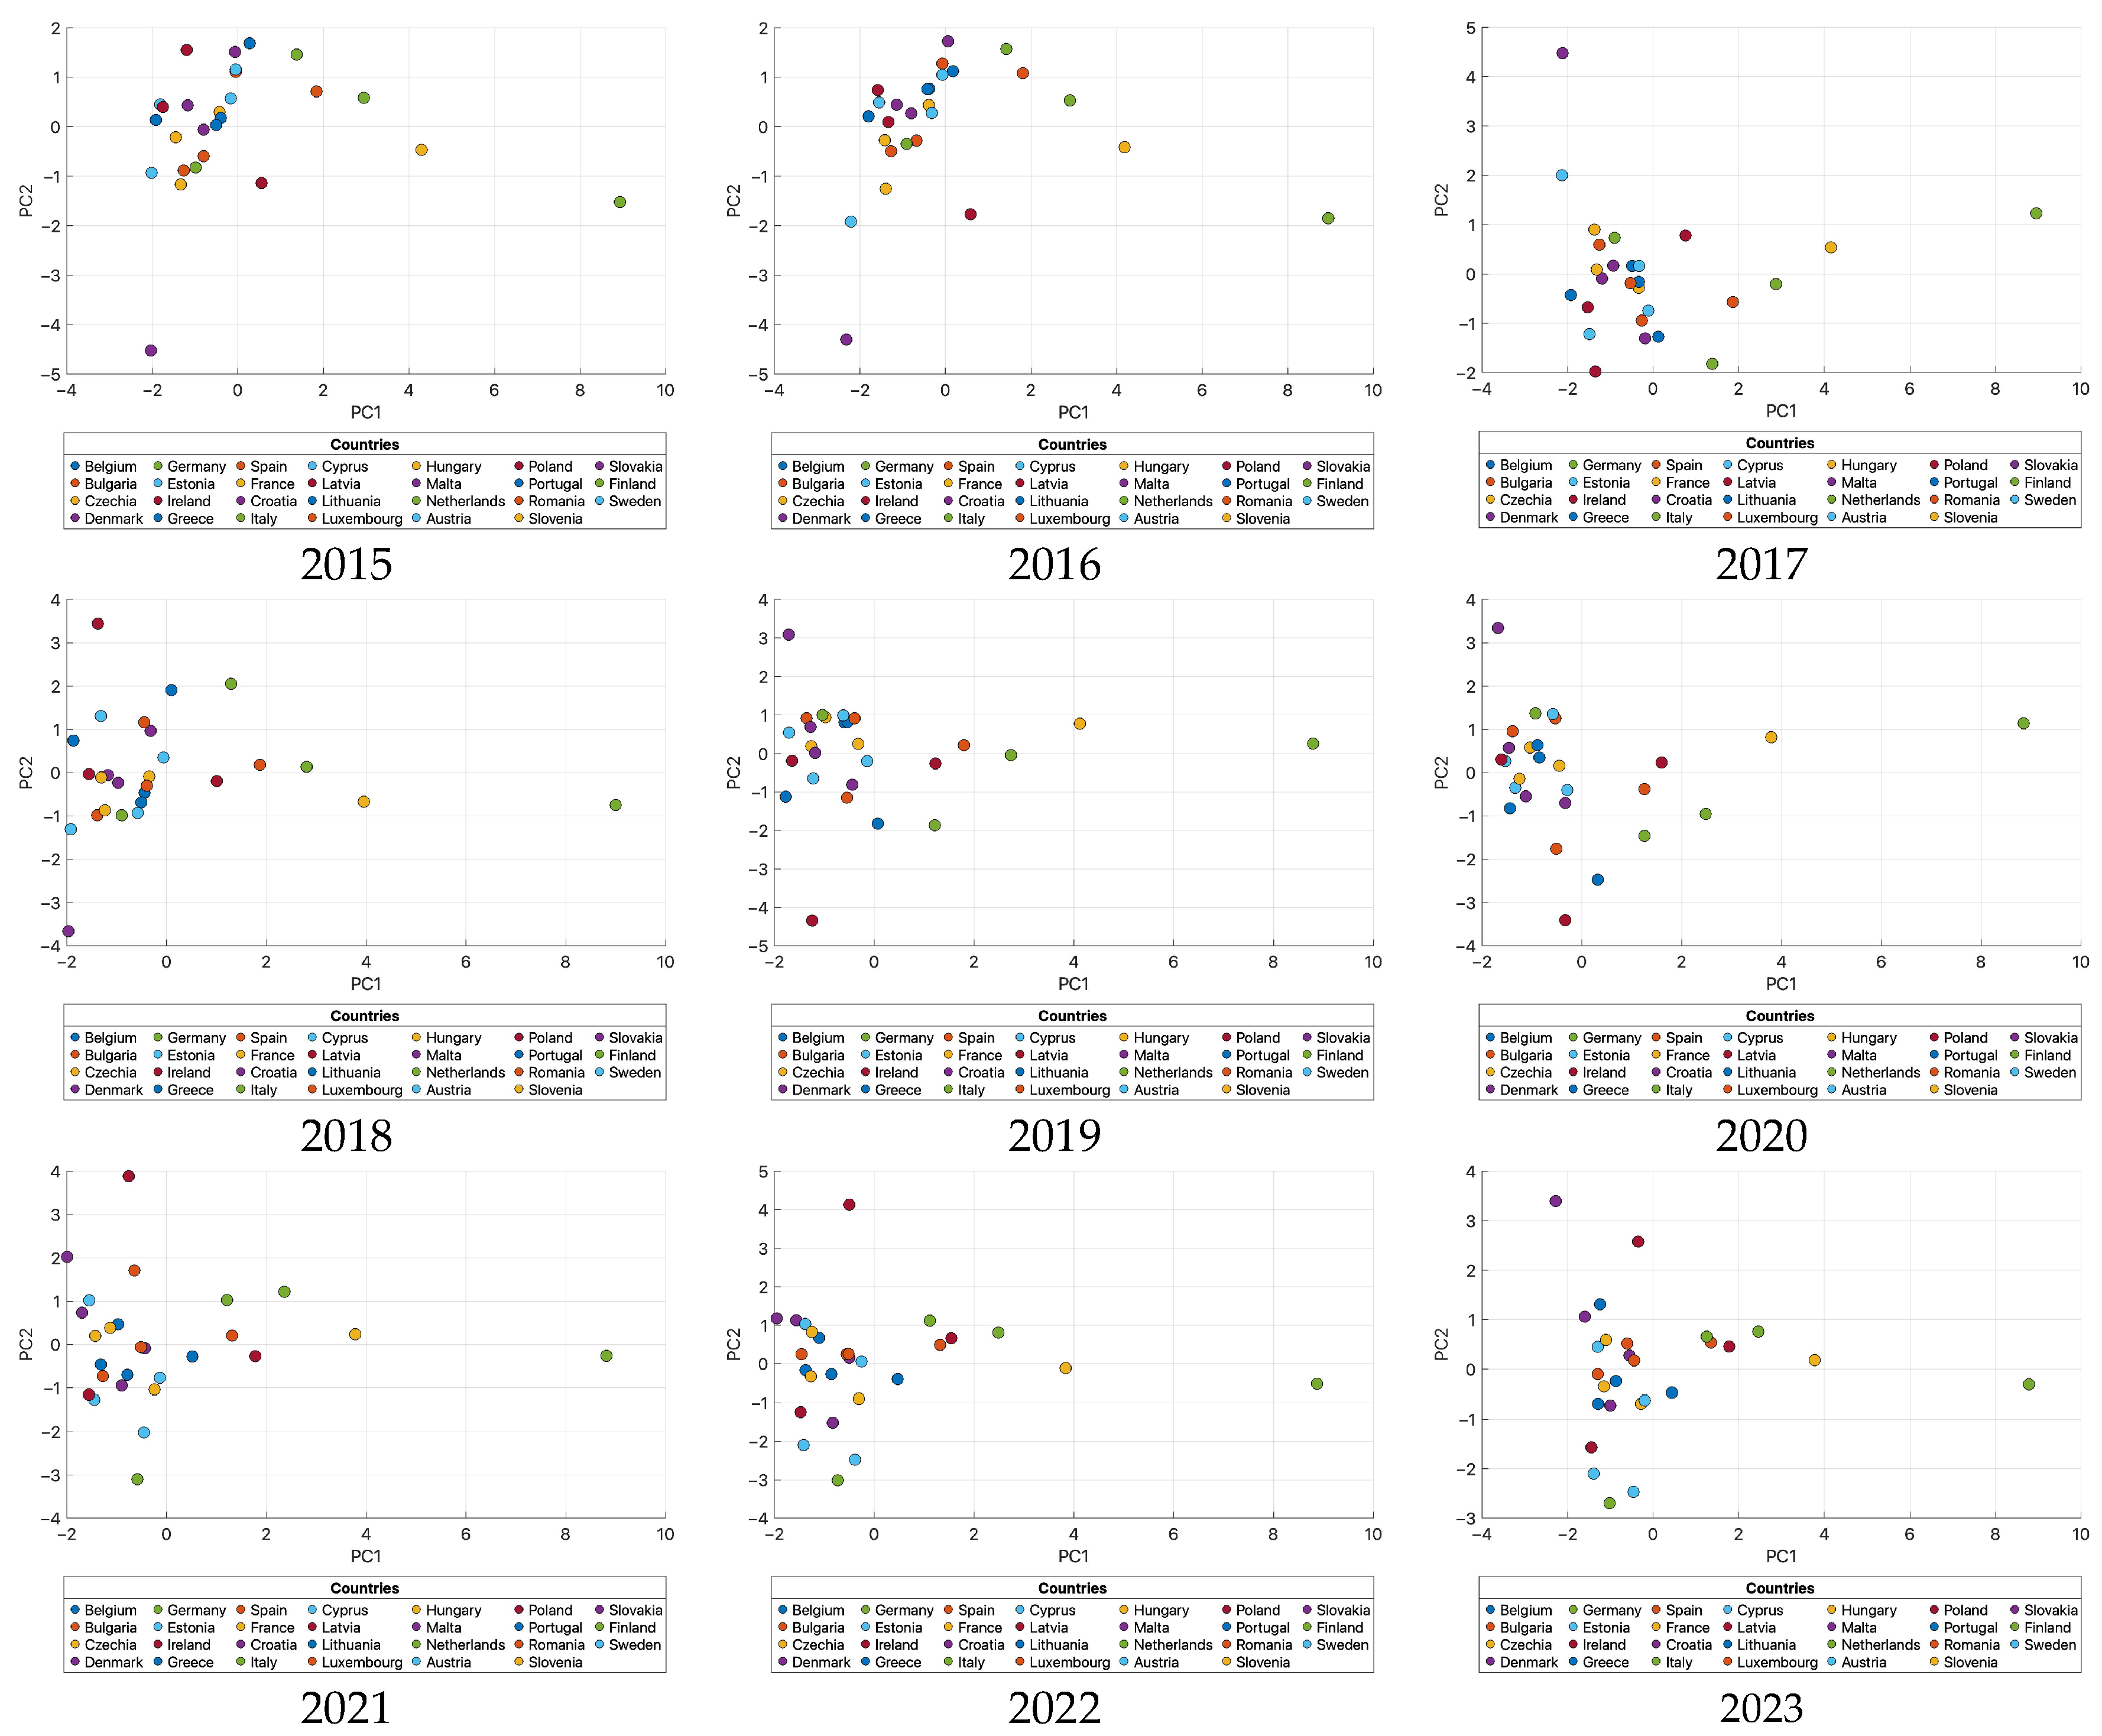
The component scores (Figure 2) are oriented so that higher values consistently reflect stronger decarbonization performance, facilitating cross-country comparison and their use in k-means clustering. Projections in the PC1–PC2 space over 2015–2023 show a relatively compact distribution along PC2 and a gradual rightward shift along PC1, indicating steady gains in integrated performance through lower emission and energy intensities combined with higher renewable shares.
In the early years, most countries are positioned slightly left of the origin on PC1, with one clear leader at high values. Between 2018 and 2019, separation along PC1 becomes more pronounced, although the main distribution remains concentrated near the origin. In 2020, dispersion increases vertically along PC2 without changing the relative ordering on PC1. After 2021, the distribution contracts again along PC2, while the center of gravity shifts modestly toward positive PC1 values. This pattern suggests moderate convergence toward stronger performance on PC1, while structural heterogeneity represented by PC2 persists, as economies with larger manufacturing bases remain spread vertically despite progress on PC1.
Overall, there is moderate convergence toward higher PC1 values, but structural differences captured by PC2 persist. Economies with a strong manufacturing base remain vertically dispersed, even when performing well on PC1. This dynamic aligns with the k-means typologies: stable leaders, a gradually advancing efficiency-centric core, and a transition or structurally lagging group that stays to the left of the origin and progresses first through intensity reductions before moving to fuel substitution.
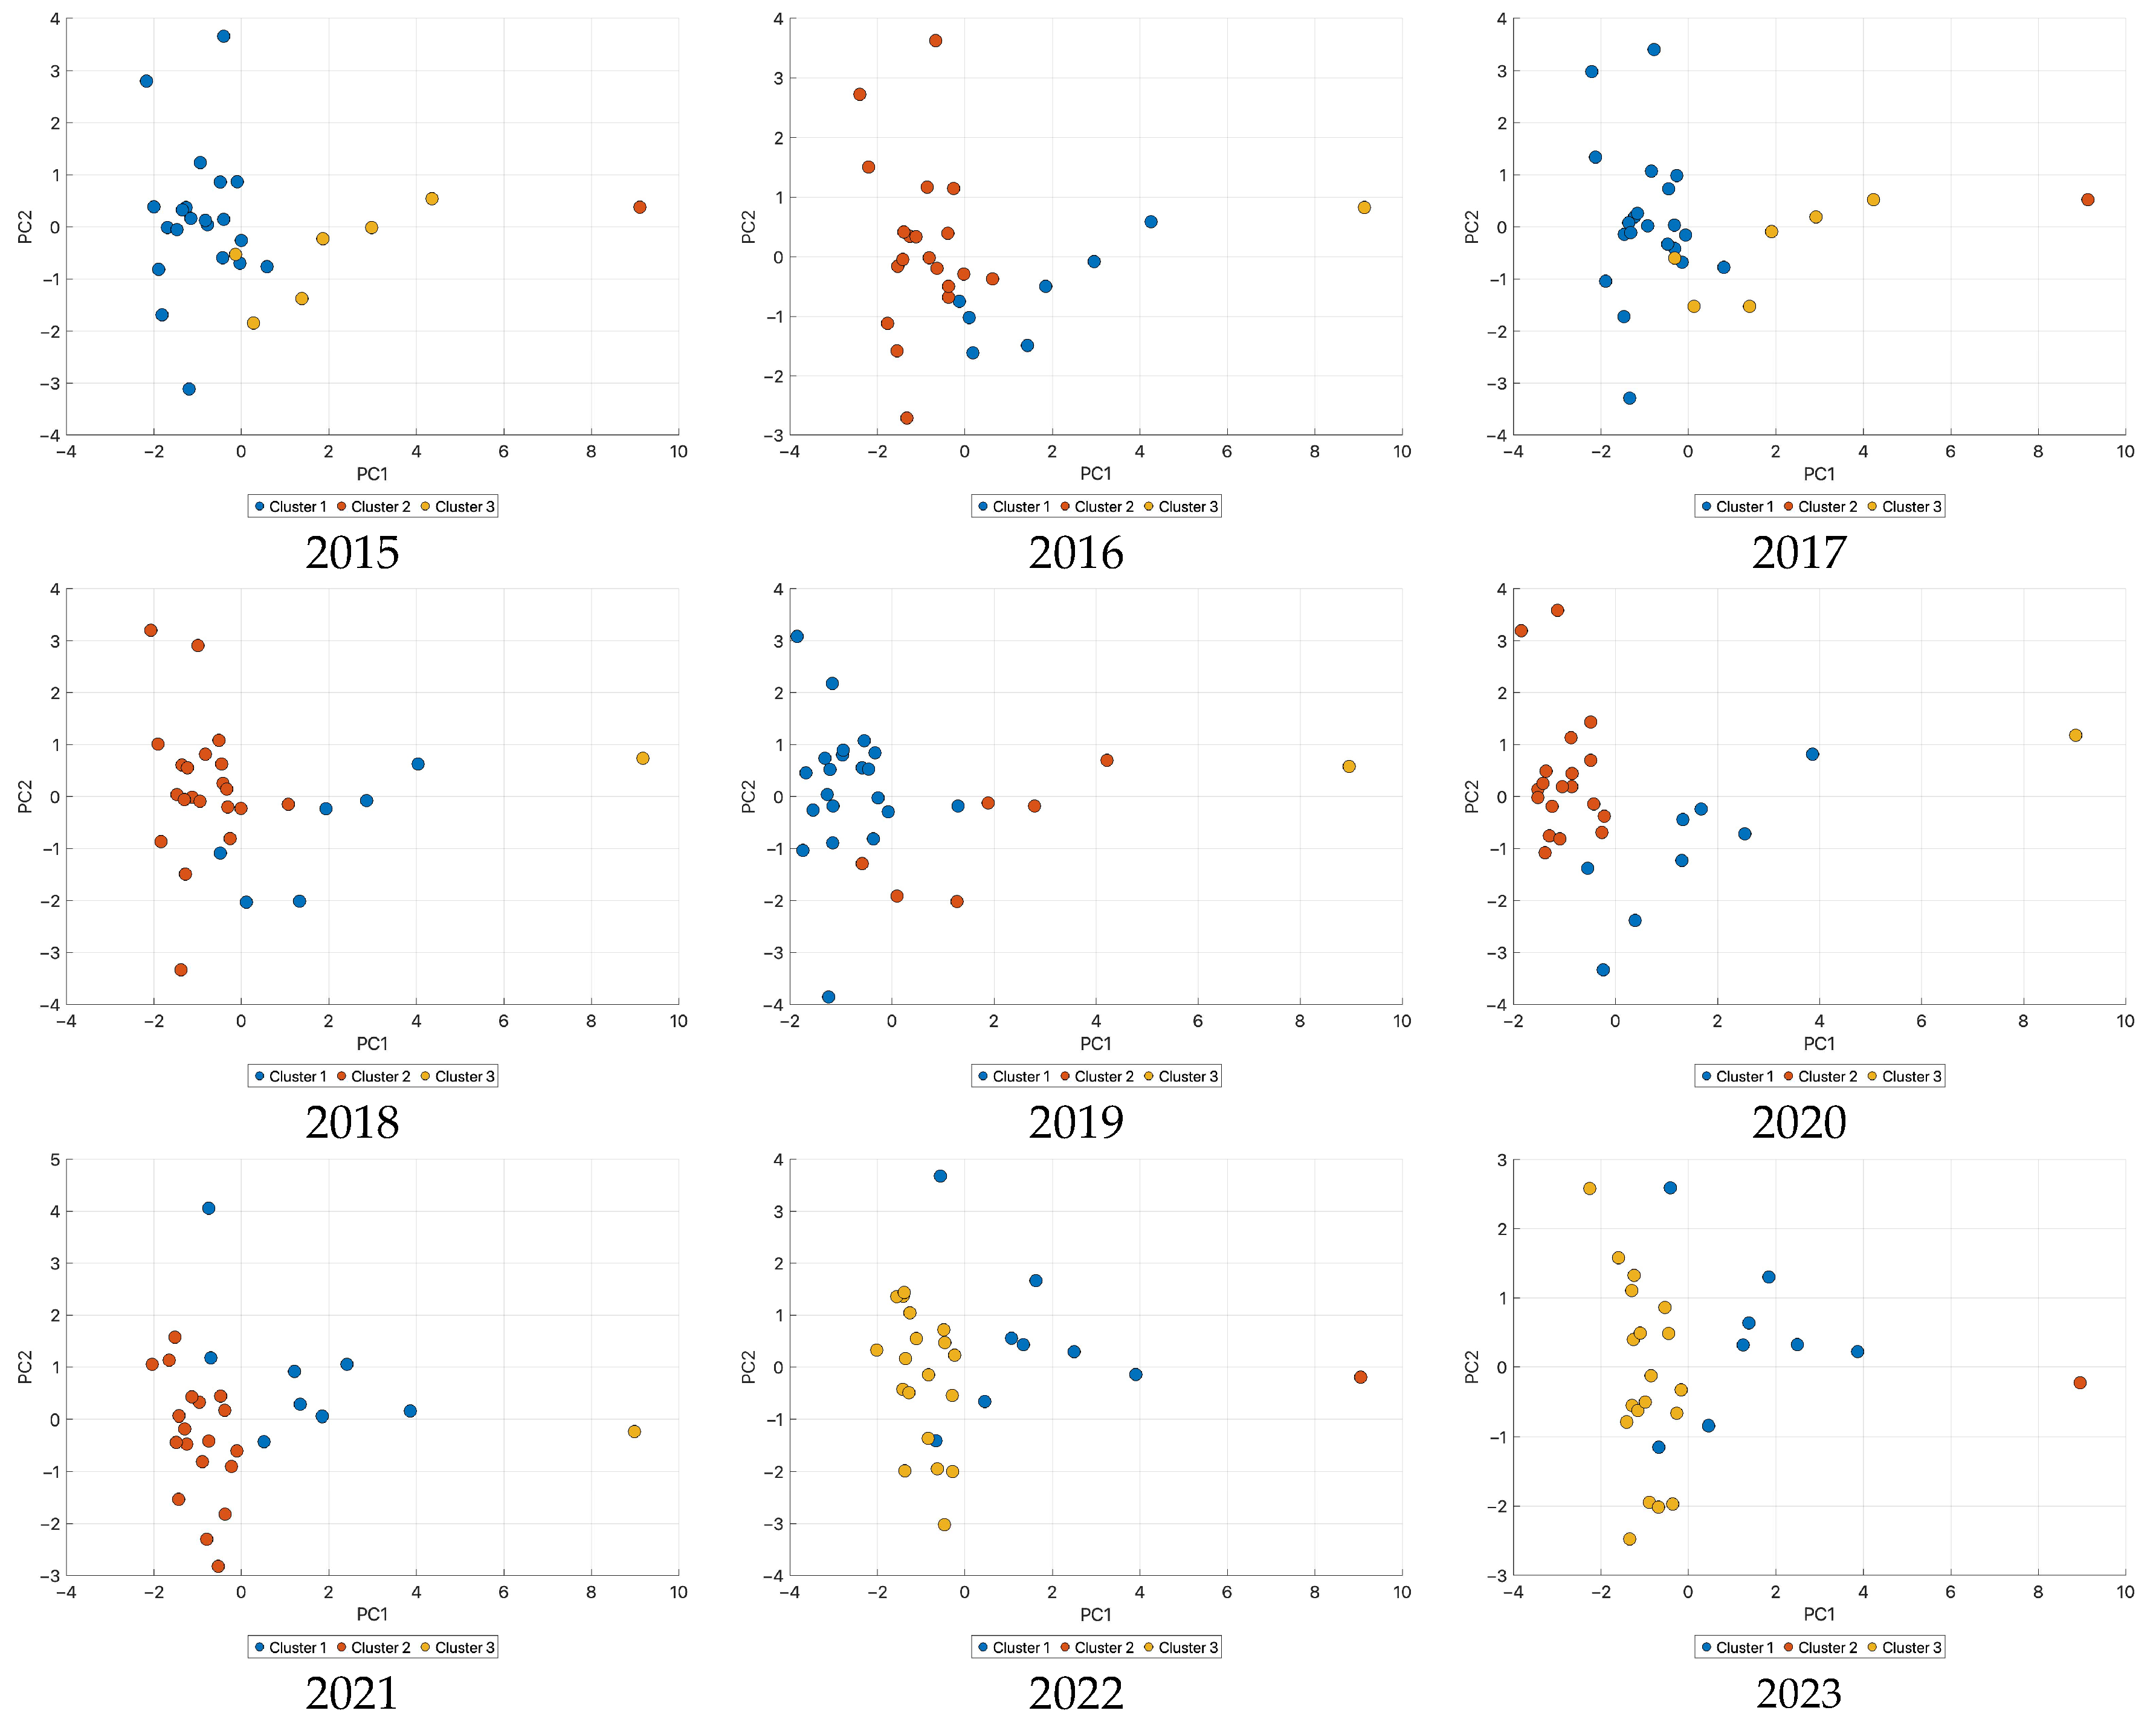
Applying k-means in the PC1–PC2 plane yields three well-separated clusters (Figure 3), consistent with the PCA dimensions. The first, with negative or low PC1 and dispersed PC2 positions, represents structurally lagging economies. The second, centered around slightly positive PC1, corresponds to efficiency-centric profiles. The third, a compact group at the extreme positive end of PC1, captures frontrunners. Together, the clusters broadly map the lower, middle, and upper ranges of PC1, while PC2 reflects structural heterogeneity across economies.
Over time, a clear migration occurs from the first to the second group, followed by consolidation as the core gradually shifts toward higher PC1 values. The presence of a single extreme case explains why, in specifications with K = 4, the additional cluster mainly splits the right-hand tail. Although internal diagnostics favor K = 4, the substantive interpretation of policy-relevant groups remains unchanged. This suggests that while the three-cluster solution ensures parsimony and interpretability, the four-cluster alternative adds granularity by highlighting structural asymmetries.
Ward dendrograms (Figure 4) confirm the presence of distinct and stable industrial–energy groupings. The first major split appears at high linkage distances, separating two macro-blocks shaped by different structural regimes that combine manufacturing scale, energy mix, and technological capacity.
Within each branch, short linkage distances reflect strong similarity among countries that have advanced modernization, higher electrification, and greater reliance on low-carbon energy. By contrast, branches separated by larger distances capture economies where efficiency improvements dominate, but fuel substitution remains limited due to infrastructural and financial barriers, which increases the risk of carbon lock-in. Cutting the dendrogram at a level equivalent to k = 4 reproduces the k-means typologies, with two macro-blocks subdividing into three to four coherent clusters. The concordance between the dendrogram and the PCA-based clustering, supported by internal validity metrics, confirms both the statistical robustness and the economic interpretability of the partitions.

4.4. Selection of the Number of Clusters and Internal Validation

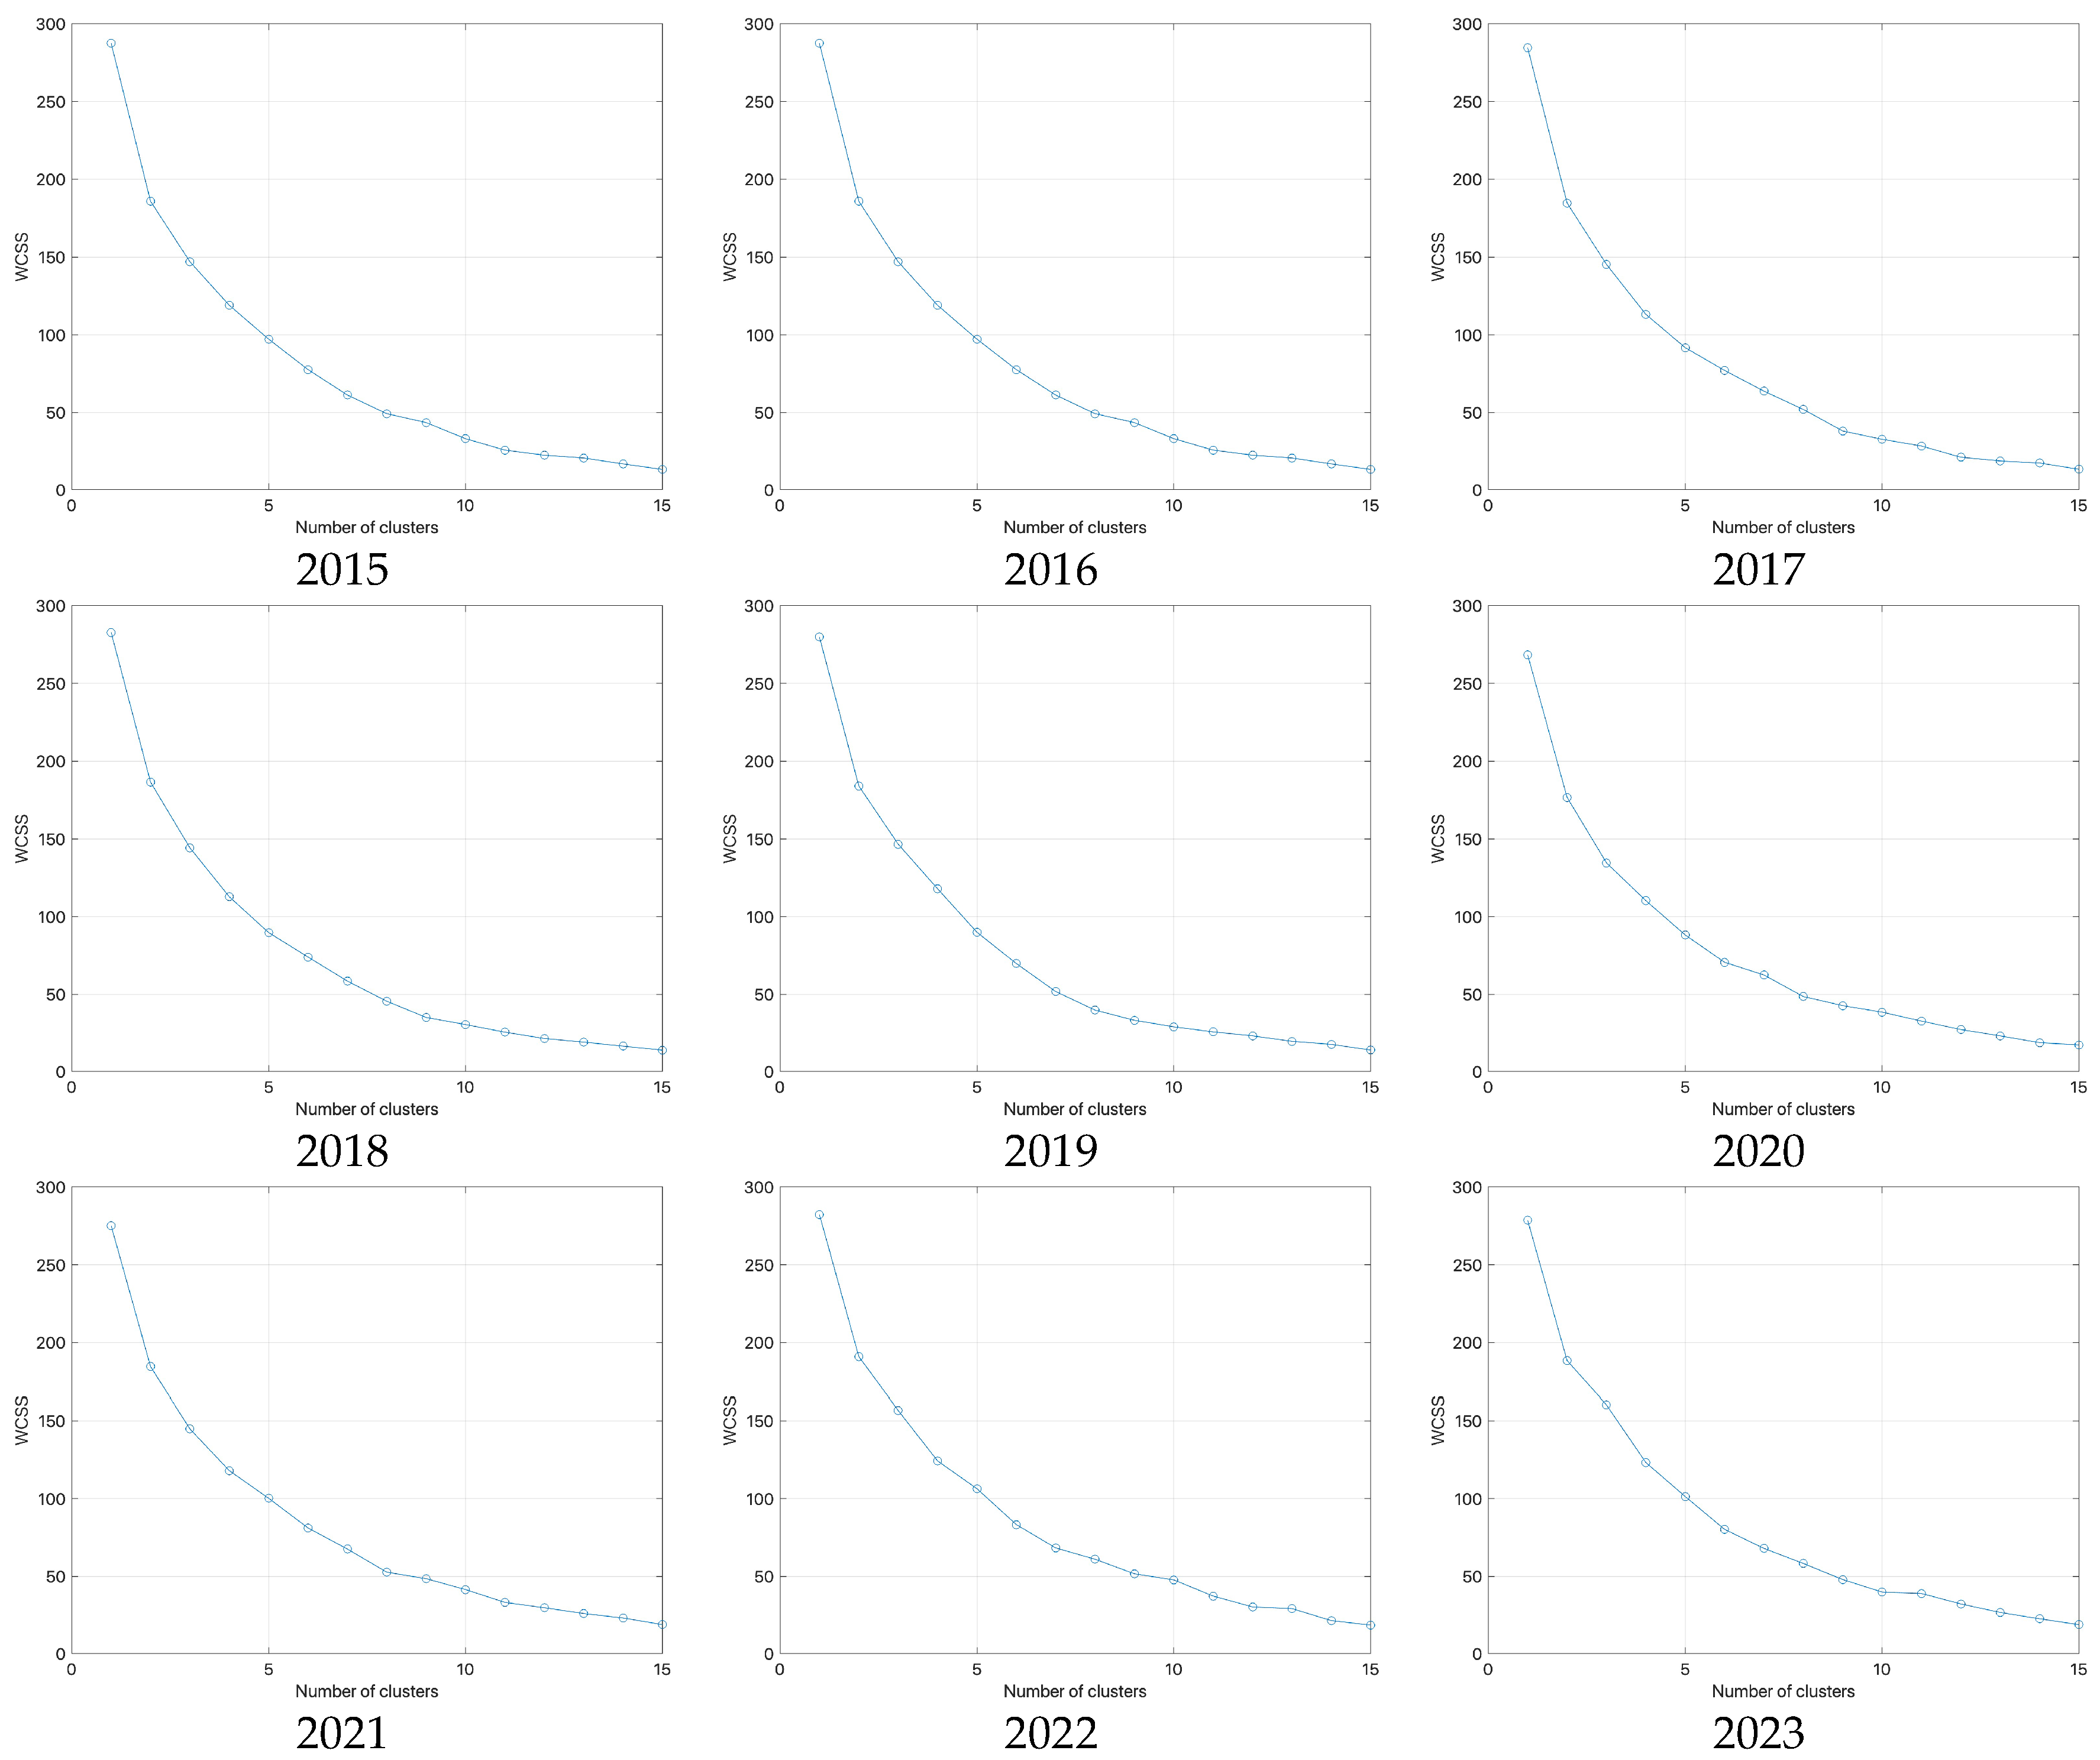
The choice of K was guided by two complementary diagnostics: the “elbow” curve of WCSS and the average silhouette score (Figure 5 and Figure 6). Over the full 2015–2023 period, the WCSS shows a clear bend at K ≈ 4, while the silhouette score reaches its maximum at K = 4. Increasing the number of clusters to K = 5 yields only marginal and inconsistent gains in separation.
Internal stability was verified through multiple random initializations, silhouette distributions with no negative values, and balanced cluster sizes. For reasons of parsimony and interpretability, K = 3 is kept as the baseline specification, while results for K = 4 are reported as a robustness check. The two solutions lead to similar substantive conclusions, with K = 4 mainly splitting the upper tail of the distribution. This dual perspective meets statistical criteria and ensures that the typology is both stable and economically meaningful.
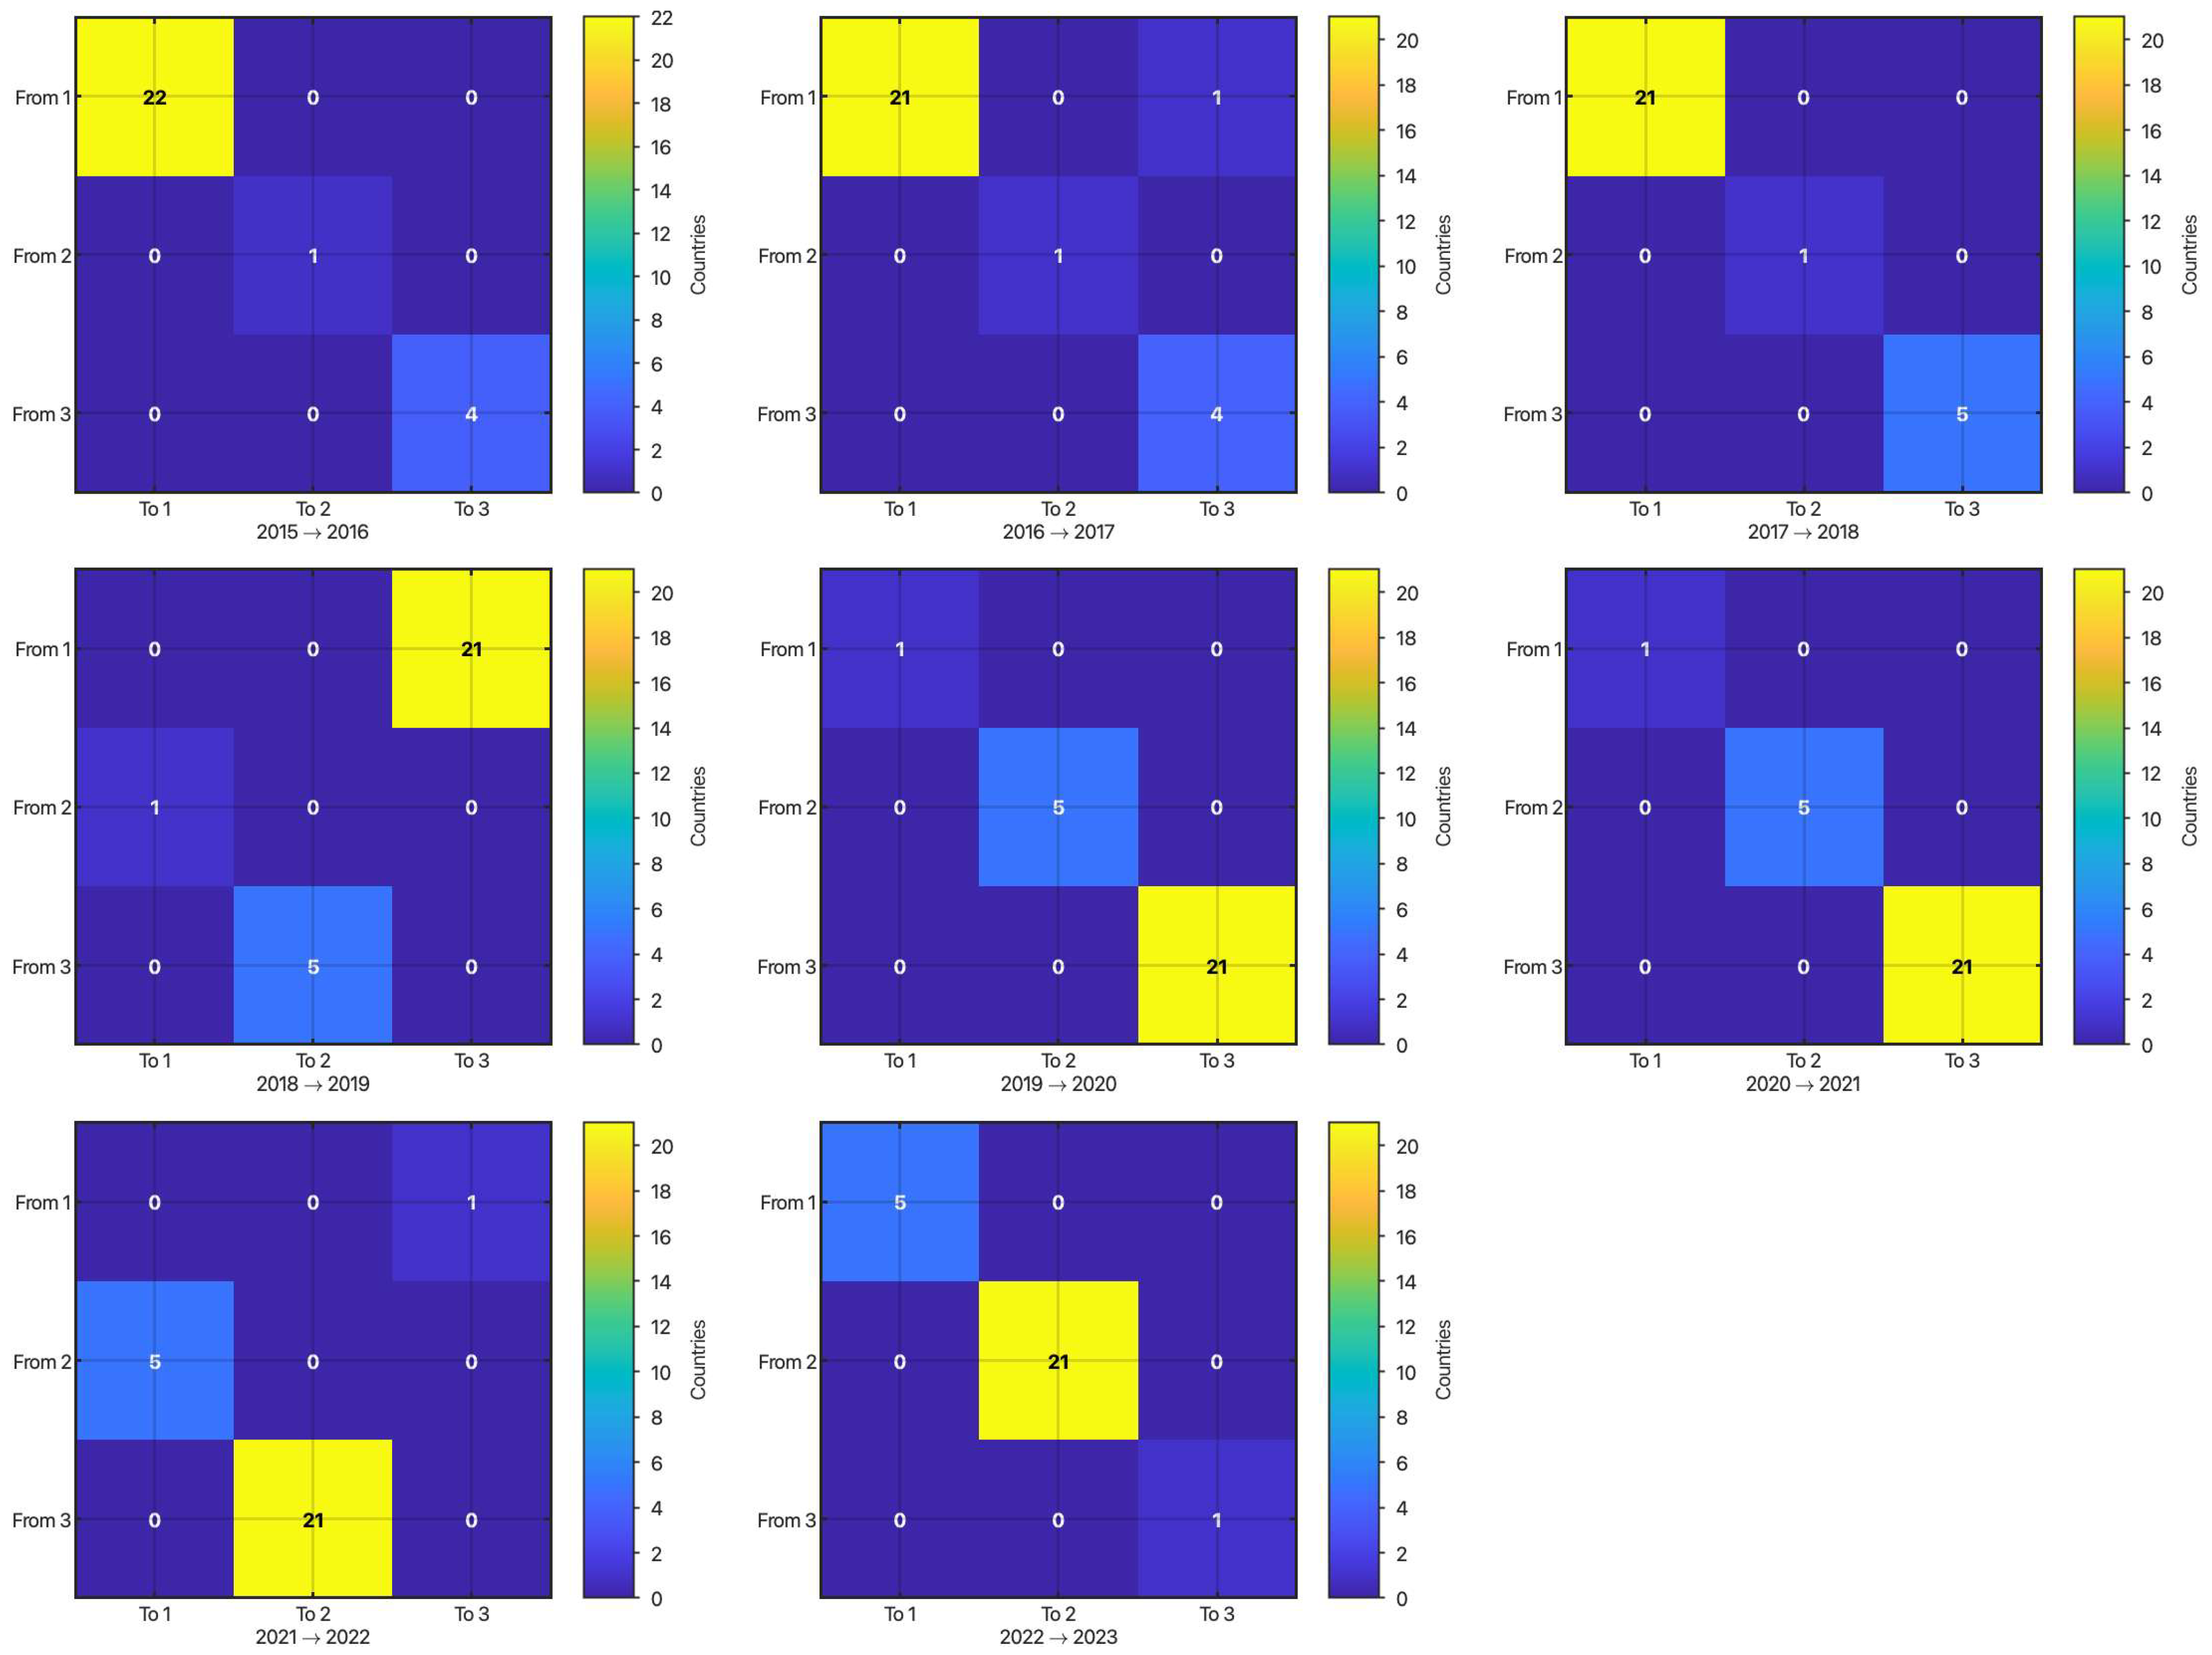
Additional evidence of robustness is provided in Appendix A. Figure A1 displays the PCA-based scatterplots colored by k-means partitions, confirming the internal coherence of the groups. Figure A2 reports annual transition matrices, which show that cluster membership is highly stable over time, with only gradual, one-directional mobility. Together, these results reinforce the conclusion that the selected partitioning is both statistically robust and economically meaningful.

5. Discussion

5.1. Latent Architecture and Identified Typologies

The projection of indicators into the PCA space reveals a clear low-dimensional structure of decarbonization performance in EU manufacturing. PC1 combines low emission and energy intensities with high shares of RES and electrification, accounting for around 40–45% of total variance. Together with PC2, the cumulative variance explained rises above 55–60%. These results support H1, which posits that industrial decarbonization can be captured by an integrated dimension of the energy transition.
The stability of the correlation structure over 2015–2023 points to two dominant drivers of industrial decarbonization: the energy transition (efficiency improvements and fuel switching, captured by PC1) and the economic structure (manufacturing share and industrial scale, captured by PC2). The first dimension reflects technological upgrading and the substitution of fossil fuels with renewables, while the second highlights path dependencies linked to industrial composition and scale effects. Taken together, the results show that progress depends not only on efficiency gains but also on the capacity to overcome structural and institutional constraints.
This conclusion is consistent with Chen et al. [21], who demonstrate that industrial agglomeration reduces emissions only when combined with a clean energy mix. Similar evidence from other regional contexts [13] also highlights the interplay between structural constraints and systemic modernization. Together, these findings show that effective typologies must capture both energy-transition dynamics and structural–industrial legacies since the two dimensions jointly shape decarbonization pathways.

5.2. Comparative Typologies and Partial Convergence

The k-means solution with K = 4 produces stable and statistically distinct typologies. Frontrunners such as Sweden, Finland, Denmark, Germany, and the Netherlands combine low emission and energy intensities with high shares of RES and electrification. This profile reflects sustained investment in low-carbon technologies, diversified renewable portfolios, and consistent policy frameworks, generating the “early-mover” advantages noted by Steiner [20].
Efficiency-centric economies such as Italy, Spain, the Czech Republic, and Slovakia reduce energy intensities but lag in fuel switching. This pattern suggests that incremental efficiency gains, often achieved through equipment modernization and process optimization, precede more capital-intensive transformations in the energy mix. The observed sequencing provides empirical support for Hypothesis H2, which posits that efficiency improvements typically occur before shifts in the energy mix.
Transition cases such as Poland, Hungary, and Portugal display inter-typological mobility, shifting from lagging profiles toward more balanced configurations. This is consistent with Turner et al. [30], who highlight competitive pressures under ETS/CBAM. By contrast, structurally lagging economies such as Bulgaria, Romania, and Greece remain locked in profiles characterized by high intensities and low shares of clean energy. Their persistence reflects outdated capital stocks, limited access to financing, and slow deployment of renewable infrastructures, reinforcing Hypothesis H1 on structural gaps.
Dynamically, moderate convergence is observed along PC1, but divergence along PC2 persists. Comparative evidence highlights that convergence in decarbonization is conditional and partial, shaped by inherited industrial structures and uneven resource endowments [18]. Evidence from Spain further illustrates how circular economy strategies are increasingly integrated with low-carbon transition pathways, reinforcing the importance of national approaches that link industrial decarbonization with broader circular practices [51].
The persistence of structurally lagging economies can be interpreted through the lens of institutional theory, as policy thresholds such as ETS and CBAM often operate as barriers rather than enablers in contexts with weaker institutional capacity and limited administrative capabilities. By contrast, frontrunner and efficiency-centric profiles illustrate the resource-based view since firm-level and national assets such as energy efficiency, renewable integration, and infrastructural capacity act as strategic resources underpinning competitive advantage. Finally, the observed inter-typological mobility, particularly among transition economies, aligns with innovation diffusion theory, reflecting the uneven adoption and spatial diffusion of decarbonization technologies across the EU manufacturing base.

5.3. Policy Implications and International Comparisons

The identified typologies support the case for differentiated policy design by industrial profile, thereby confirming H3. For efficiency-centric economies, the priority is to accelerate fuel switching. Concrete measures include minimum performance standards for carbon intensity, targeted electrification of process heat supported by differentiated tariffs, and facilitated access to flexible grid connections. Complementary instruments beyond the EU ETS, such as CCfDs, the EU Hydrogen Bank, and offtake guarantees for hydrogen and CCUS, reduce the risk of stranded investments and address competitiveness concerns, echoing Turner et al.’s [30] warnings regarding the limitations of a purely “polluter pays” approach.
Empirical evidence also shows that uncertainty around ETS allowance prices and electricity costs may delay industrial decarbonization investments. Using a real options framework, Tautorat et al. [52] demonstrate that firms in the chemical industry tend to postpone transitions to electrification, biomass, or CCS under volatile price expectations. These findings reinforce the rationale for complementing the ETS with investment–risk-mitigation instruments such as the Innovation Fund and the Modernization Fund, which provide financial stability for long-term industrial transformation (see also IEA, [2]). In parallel, recent evidence indicates that green bond issuance can stimulate green innovation by alleviating financing constraints, suggesting that financial instruments may serve as an important complement to EU funds in supporting industrial decarbonization pathways [53].
For structurally lagging economies, the policy agenda centers on fixed capital renewal and large-scale investment in shared H2/CO2 infrastructures. European initiatives, such as the Just Transition Fund and financing from the European Investment Bank (EIB), are particularly important for overcoming legacy capital stocks, infrastructural deficits, and uneven access to private capital markets. The persistence of resource-intensive clusters, as highlighted by Chen [21], further underscores the need for coordinated EU-level investment strategies that integrate financial, infrastructural, and institutional support.
Frontrunner economies have the capacity to shift toward system-level optimizations. Policy priorities in these contexts include expanding demand response mechanisms, integrating flexibility services, and systematically deploying green public procurement, thereby consolidating the “early mover” advantages documented by Steiner [20].
Comparative perspectives reinforce these differentiated priorities. In China, machine-learning multi-cluster assessments reveal how efficiency heterogeneity and carbon trading dynamics shape industrial transition pathways [35], while in the United States, county-level vulnerability typologies highlight the socio-economic risks of fossil-dependent regions [43]. Such international evidence underscores the value of clustering-based approaches for tailoring policies to structural and institutional contexts. In parallel, financial instruments such as green bonds have been shown to accelerate innovation in energy-intensive sectors [53], and circular economy strategies contribute both to decarbonization and to the EU’s objectives of Open Strategic Autonomy in critical raw materials [54]. Positioning the European typology within this broader landscape links industrial decarbonization not only to internal heterogeneity but also to global competitiveness and resilient value chains.
Broader international comparisons highlight that industrial pathways are not only technological but also conceptual frameworks. Griffiths et al. [55] show that strategies framed under the CCE can provide oil- and gas-producing countries with a pragmatic bridge between decarbonization and defossilization, balancing environmental objectives with political and economic realities. In this context, the European Union must combine high policy ambition with recognition of diverse transition logics across regions, ensuring both competitiveness and global credibility. Circular economy strategies in critical raw materials, such as recycling and reshoring in the titanium value chain, contribute to both decarbonization and the EU’s objectives of Open Strategic Autonomy, particularly in aerospace and defense sectors.
The robustness of the typologies under ±10–30% perturbations reinforces their practical relevance: Stable rankings imply that policy prioritization can be pursued with confidence. Efficiency-centric economies can be reliably targeted with CCfDs and process-heat electrification, while structurally lagging economies require infrastructure pooling and capital renewal packages. Frontrunners, whose classification remains unaffected across robustness checks, can focus on system-level optimizations without risk of policy misalignment. In addition, complementary instruments can strengthen these pathways: green finance (e.g., green bonds) to ease capital constraints, circular economy initiatives to couple material efficiency with decarbonization, advanced dispatch and EMPC approaches to improve industrial-park operations, and supply chain management frameworks to extend monitoring from direct emissions to Scope 3.

5.4. Methodological Comparability and Lessons from Other Regions

Clustering-based methods have increasingly been employed to capture the heterogeneity of industrial transitions. The present analysis, while conducted at a macro-European and multi-sectoral scale, confirms the suitability of the PCA–k-means combination for identifying latent structures, reducing multicollinearity, and generating reproducible typologies that support differentiated decision-making.
The integration of digitalization and Industry 4.0 practices, as emphasized by Cagno et al. [24], holds substantial potential for advancing typological methods. Real-time energy monitoring, predictive maintenance, and energy-aware scheduling could transform typologies from static classifications into dynamic instruments for monitoring and policy evaluation, thereby enhancing both their academic relevance and practical utility over the long term.
Herman et al. [56] emphasize that industrial decarbonization in the UK’s largest clusters is not a linear pathway but rather a contested process of meta-system transformation, combining modular reconfigurations (fuel switching, CCUS, and electrification) with systemic disruptions (shared hydrogen and CO2 infrastructures). The European findings align with this perspective, indicating that cluster-based strategies can both enable and constrain decarbonization, depending critically on governance quality and infrastructural coordination.
Further comparative evidence from North America [33] and Asia [21] reinforces the conclusion that cluster-based transitions are highly path dependent and must be adapted to local institutional arrangements and energy system characteristics. These international parallels underline the broader methodological insight that clustering frameworks are most effective when embedded in contextual knowledge of governance and infrastructural conditions.

6. Conclusions

This study provided a comparable and reproducible assessment of decarbonization progress in the EU manufacturing sector (2015–2023), using harmonized Eurostat indicators integrated into a parsimonious empirical framework. The latent space consistently revealed a primary dimension of integrated transition performance (PC1), explaining about 40–45% of the variance and combining reductions in emission and energy intensities with increases in the share of renewables and electrification. A secondary dimension (PC2) reflects differences in industrial scale and composition, while the first three to four components typically account for 70–80% of the total variance. These findings provide empirical support for Hypothesis H1, which posits that decarbonization performance is structured along a joint dimension of energy efficiency improvements and fuel-switching capacity.
The typologies derived from PCA scores are both stable across years and economically interpretable: a frontrunner profile characterized by technological modernization and electrification; efficiency-centric trajectories where fuel substitution remains limited; and in-transition/structurally lagging configurations marked by high intensities and low shares of clean energy. Internal validations (elbow and silhouette diagnostics) together with concordance with Ward’s hierarchical clustering confirm the robustness of these partitions. The persistence of structural constraints in lagging economies provides empirical support for Hypothesis H2, which highlights the role of outdated capital stocks and carbon-intensive energy mixes in constraining transition pathways.
The policy implications are clear: Maximum performance is achieved when energy efficiency improvements and fuel switching progress in tandem. Efficiency-centric economies require instruments that accelerate fuel switching in thermal processes, such as heat electrification, hydrogen deployment, minimum performance standards, and carbon contracts for difference while maintaining pressure on efficiency gains. Structurally lagging economies call for integrated packages that combine fixed-capital modernization, production-chain efficiency measures, innovation support, and access to shared low-carbon infrastructures (grids and CCUS/H2), thereby preventing lock-in to transitional solutions. Frontrunners can shift towards system-level optimization (flexibility, storage, and demand response) and leverage green public procurement to monetize the competitive advantage of low-carbon products. This differentiation of policy priorities across typologies provides empirical confirmation of Hypothesis H3, which stresses the need for place-based and differentiated strategies. Furthermore, the stability of the latent dimensions indicates that the proposed typology can function not only as a static classification but also as a framework for dynamic monitoring and policy evaluation.

6.1. Limitations

This study is subject to the inherent limitations of a descriptive design. PCA captures only linear patterns of common variation, and although the orientation of component signs is made economically consistent, it remains conventional by construction. The k-means algorithm presumes approximately spherical clusters and is sensitive to the choice of metric and initialization; robustness checks and hierarchical validation reduce but cannot fully remove these risks.
Measurement at the national level may mask intra-national heterogeneity and sector-specific dynamics, limiting the capacity to capture regional industrial diversity. The conservative treatment of missing data, relying on interpolation and minimal extrapolation, introduces additional uncertainty, particularly for countries with weaker reporting systems. More critically, the analysis includes only Scope 1 and Scope 2 emissions (direct and energy-related) while omitting Scope 3 supply chain emissions. Since Scope 3 often constitutes the majority of the manufacturing carbon footprint, its exclusion may compromise the integrity of the typologies by underestimating cross-country differences in upstream and downstream emissions. Furthermore, exclusive reliance on harmonized Eurostat indicators, although ensuring comparability, precludes triangulation with firm-level or sector-specific data, which could offer deeper insights into investment dynamics and technological adoption.

6.2. Future Research

Future research should aim for greater granularity and a clearer identification of the mechanisms underlying observed patterns. Extending the analysis to the NUTS-2 level and to energy-intensive NACE sub-sectors would allow intra-national variation to be captured more effectively. Incorporating LMDI decomposition could disentangle the respective contributions of efficiency, structural change, and energy mix. In parallel, applying dynamic or spatial panel models and quasi-experimental designs (e.g., difference-in-differences and event studies) would help to link typologies more directly to policy and price shocks such as ETS, CBAM, or the energy crisis.
An important avenue for future research is the extension to Scope 3 and supply chain emissions, in line with recent literature on NZCSCs. This would allow indirect externalities and the role of value-chain cooperation to be captured. Linking the typology with firm-level data on investments, technological capabilities, and Industry 4.0 adoption would further strengthen explanatory power and enable more robust causal assessments.
Policy relevance can also be strengthened by aligning future typologies with the latest EU instruments, including the Net Zero Industry Act, the Innovation Fund, the Just Transition Fund, and the EU Hydrogen Bank, thereby ensuring that empirical results directly inform ongoing industrial decarbonization strategies.
The publication of code and SDMX queries enhances transparency and supports reproducibility. The central contribution of this study is to provide an evidence-based and replicable typology of decarbonization progress in European manufacturing, which can be further extended to impact evaluation, dynamic monitoring, and forecasting of convergence in the transition toward a low-emission European industry.

Author Contributions

Conceptualization, C.G. and O.P.; methodology, C.G. and O.P.; software, C.G. and O.P.; validation, C.G. and O.P.; formal analysis, C.G. and O.P.; investigation, C.G. and O.P.; resources, C.G., O.P. and N.S.; data curation, C.G. and O.P.; writing—original draft preparation, C.G. and O.P.; writing—review and editing, C.G. and O.P.; visualization, C.G., O.P. and N.S. All authors have read and agreed to the published version of the manuscript.

Funding

The APC was funded by Transilvania University of Brasov, Romania.

Data Availability Statement

The following supporting information can be downloaded at https://doi.org/10.5281/zenodo.16929223 (Zenodo).

Conflicts of Interest

The authors declare no conflicts of interest.

Abbreviations

The following abbreviations are used in this manuscript:
AIArtificial Intelligence
ARIAdjusted Rand Index
BERDBusiness Enterprise Research and Development
CBAMCarbon Border Adjustment Mechanism
CCfDCarbon Contracts for Difference
CCUSCarbon Capture, Utilization, and Storage
EEDEnergy Efficiency Directive
EIBEuropean Investment Bank
ETSEmissions Trading System
EU ETSEuropean Union Emissions Trading System
GERDGross Domestic Expenditure on Research and Development
GVAGross Value Added
IEAInternational Energy Agency
IoTInternet of Things
LMDILogarithmic Mean Divisia Index
NZCSCNet-Zero Carbon Supply Chains
O&GOil and Gas
PCAPrincipal Component Analysis
PC1/PC2Principal Component 1/Principal Component 2
REDRenewable Energy Directive

Appendix A

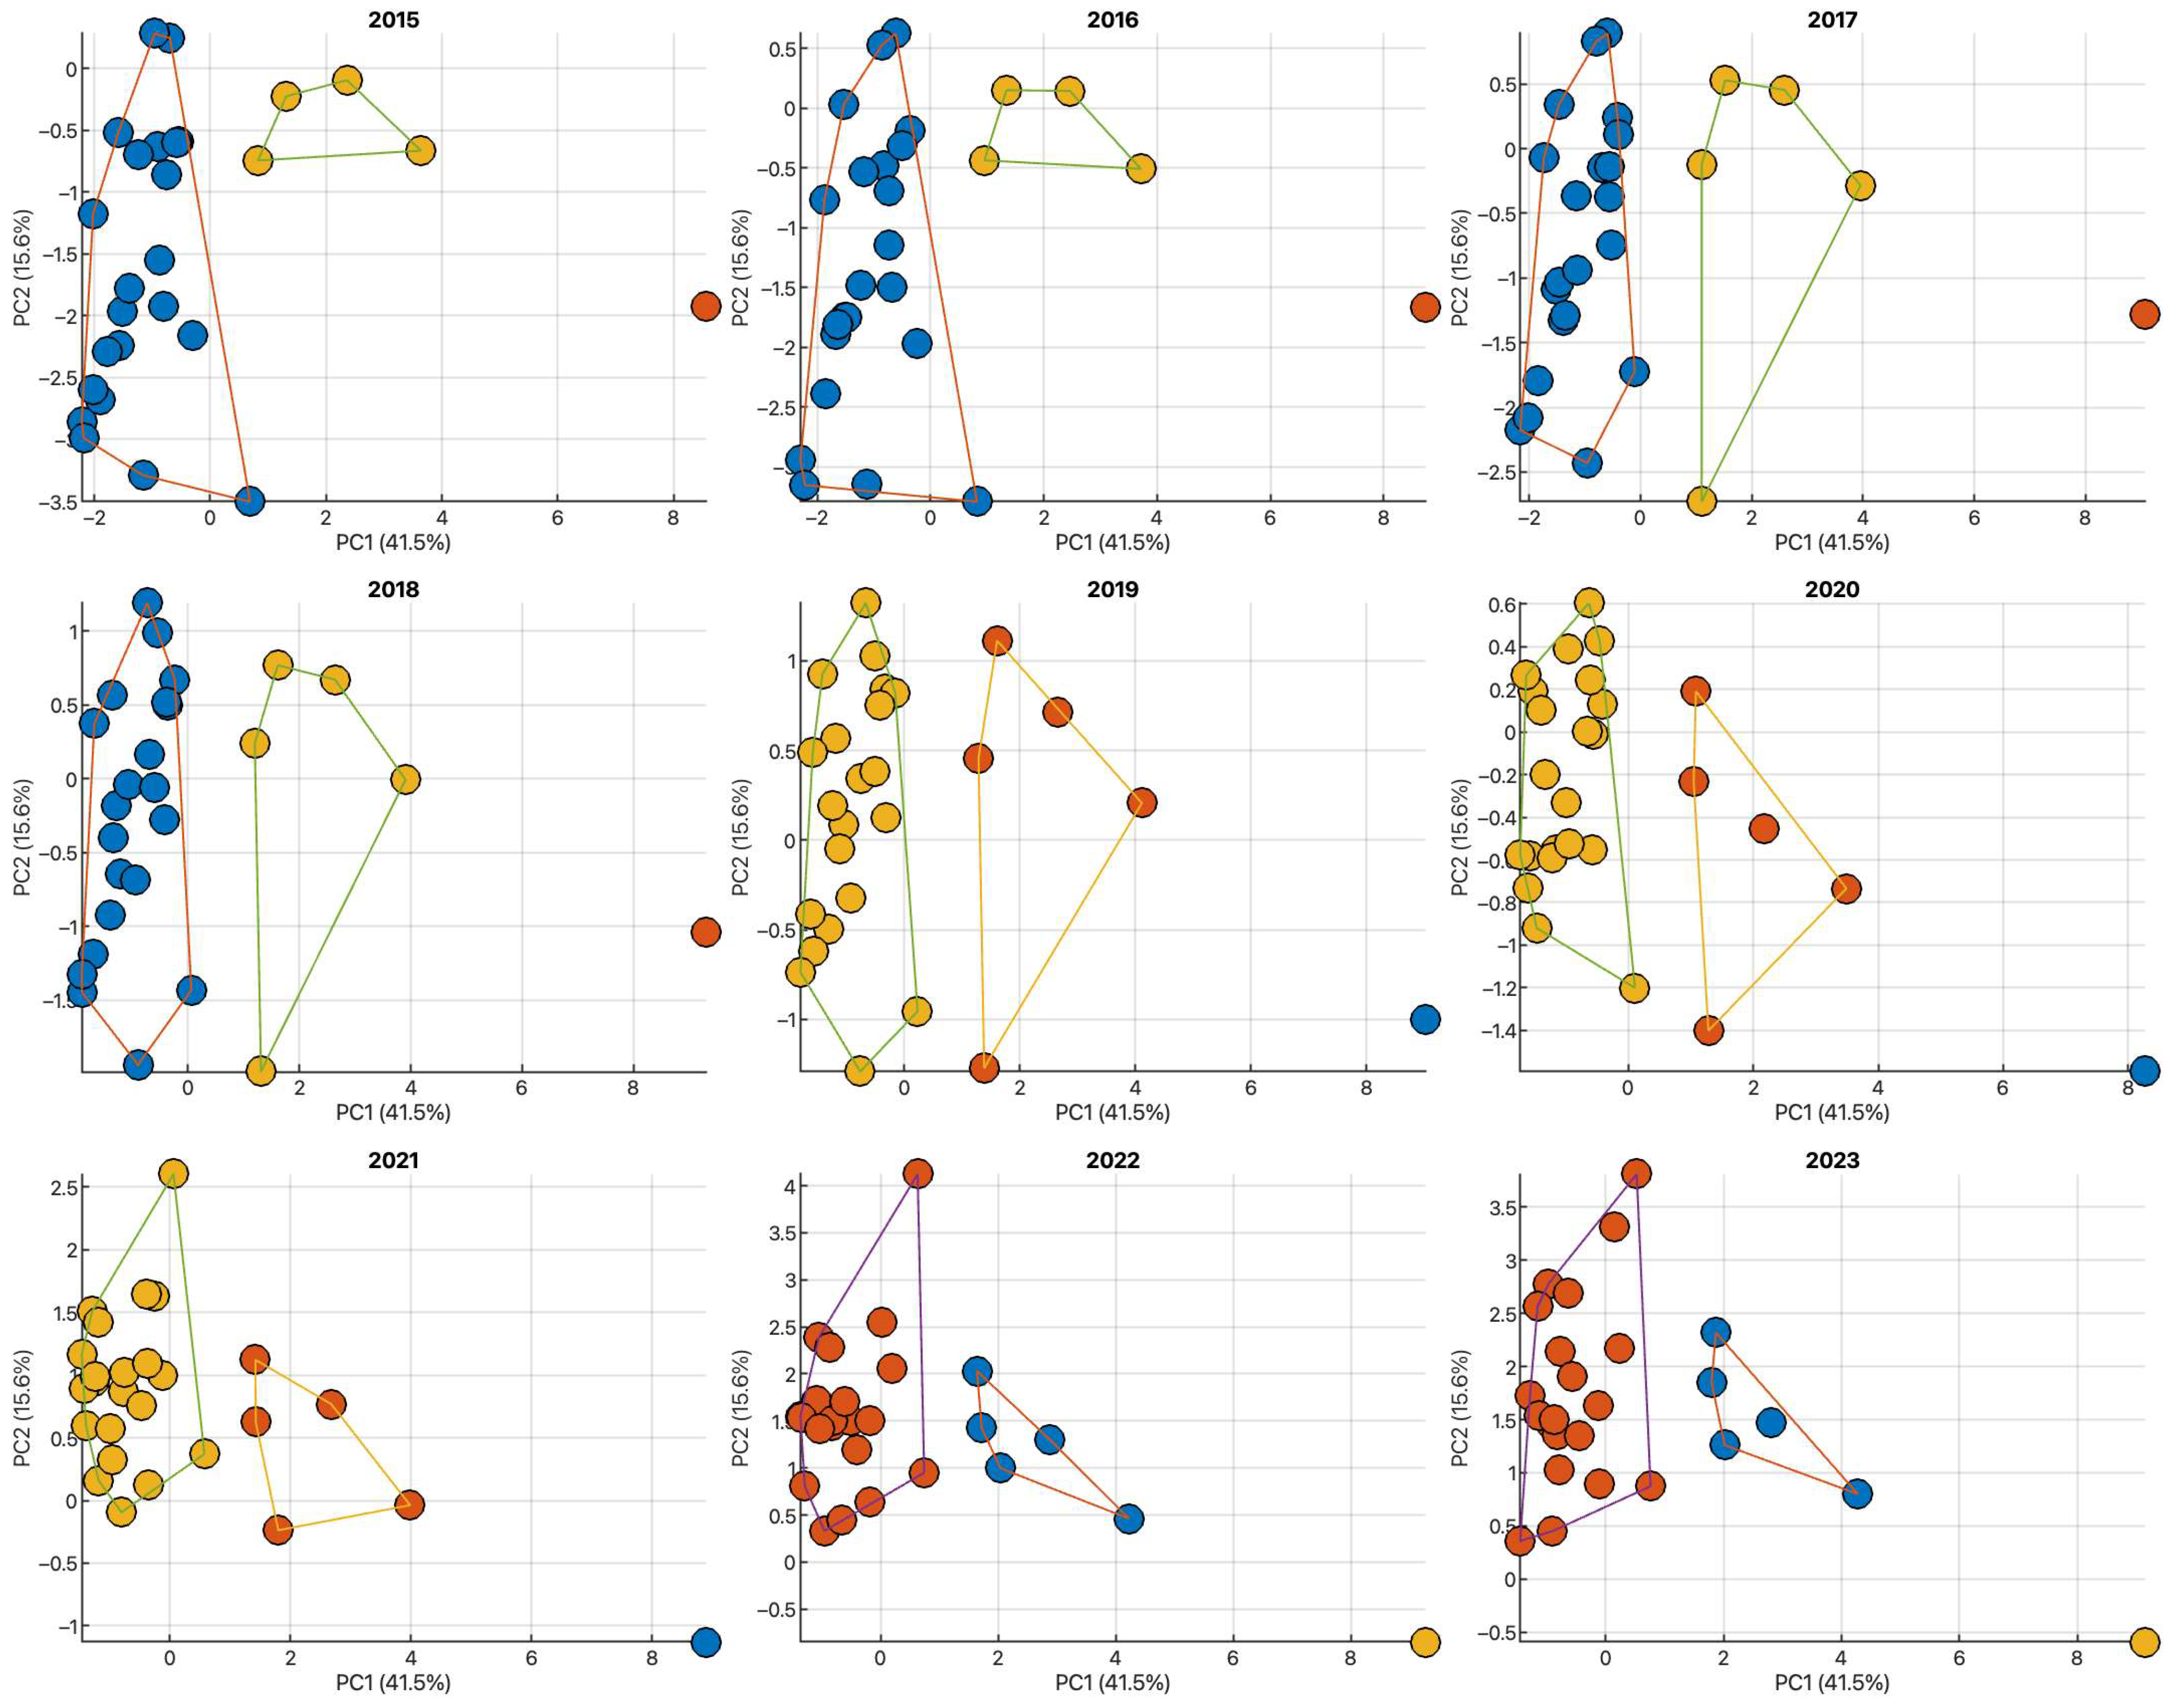
Figure A1. Annual PCA–k-means partitions in the PC1–PC2 space (annual panels 2015–2023). Note: projection of country-year observations in the PC1–PC2 plane, with colors denoting cluster membership. The polygons connect cluster members for each year, highlighting the structural separation between frontrunners, efficiency-centric, and structurally lagging economies. The horizontal axis (PC1≈41.5% variance explained) reflects integrated performance (emission and energy intensity reductions combined with higher RES shares). The vertical axis (PC2 ≈ 16.5% variance explained) captures structural scale effects.
Sustainability 17 08154 g0a1
Figure A2. Stability of PCA–k-means clusters over 2015–2023. Note: Each heatmap shows the number of countries moving from a given cluster in year t (vertical axis) to a cluster in year t+1 (horizontal axis). Diagonal cells indicate persistence, and off-diagonal entries capture inter-cluster mobility.
Sustainability 17 08154 g0a2

References

  1. International Energy Agency (IEA). Net Zero by 2050: A Roadmap for the Global Energy Sector; International Energy Agency: Paris, France, 2021; Available online: https://www.iea.org/reports/net-zero-by-2050 (accessed on 2 August 2025).
  2. International Energy Agency (IEA). Net Zero Roadmap: A Global Pathway to Keep the 1.5 °C Goal in Reach; International Energy Agency: Paris, France, 2023; Available online: https://www.iea.org/reports/net-zero-roadmap-a-global-pathway-to-keep-the-15-0c-goal-in-reach (accessed on 2 August 2025).
  3. European Commission. Fit for 55: Delivering the EU’s 2030 Climate Target on the Way to Climate Neutrality; Publications Office of the European Union: Luxembourg, 2023. Available online: https://op.europa.eu/en/publication-detail/-/publication/649643b0-9008-11ec-b4e4-01aa75ed71a1/language-en (accessed on 2 August 2025).
  4. European Parliamentary Research Service (EPRS). Fit for 55 Package—Briefing. PE 733.513; European Parliament: Brussels, Belgium, 2022. Available online: https://www.europarl.europa.eu/RegData/etudes/BRIE/2022/733513/EPRS_BRI(2022)733513_EN.pdf (accessed on 2 August 2025).
  5. Bataille, C.; Åhman, M.; Neuhoff, K.; Nilsson, L.J.; Fischedick, M.; Lechtenböhmer, S.; Solano-Rodriquez, B.; Denis-Ryan, A.; Stiebert, S.; Waisman, H.; et al. A review of technology and policy deep decarbonization pathway options for making energy-intensive industry production consistent with the Paris Agreement. J. Clean Prod. 2018, 187, 960–973. [Google Scholar] [CrossRef]
  6. Calvillo, C.; Race, J.; Chang, E.; Turner, K.; Katris, A. Characterisation of UK Industrial Clusters and Techno-Economic Cost Assessment for Carbon Dioxide Transport and Storage Implementation. Int. J. Greenh. Gas Control 2022, 119, 103695. [Google Scholar] [CrossRef]
  7. Reace, E.; Howe, J.; Font-Palma, C. Accelerating sustainability transitions: The case of the hydrogen agenda in the North West region of England. Sustain. Sci. Pract. Policy 2022, 18, 428–442. [Google Scholar] [CrossRef]
  8. Isoli, N.; Chaczykowski, M. Net energy analysis and net carbon benefits of CO2 capture and transport infrastructure for energy applications and industrial clusters. Appl. Energy 2025, 382, 125227. [Google Scholar] [CrossRef]
  9. Gunawan, T.A.; Luo, H.; Greig, C.; Larson, E. Shared CO2 capture, transport, and storage for decarbonizing industrial clusters. Appl. Energy 2024, 359, 122775. [Google Scholar] [CrossRef]
  10. Kryeziu, A.; Ursavas, E.; Varga, D.; Zhu, S.X. A practical assessment of CCUS opportunities in the Southeast European industrial sector—Bulgaria, Croatia, Greece, Romania. J. Clean. Prod. 2025, 517, 145723. [Google Scholar] [CrossRef]
  11. Rattle, I.; Gailani, A.; Taylor, P.G. Decarbonisation strategies in industry: Going beyond clusters. Sustain. Sci. 2024, 19, 105–123. [Google Scholar] [CrossRef]
  12. Sechi, S.; Giarola, S.; Leone, P. Taxonomy for industrial cluster decarbonization: An analysis for the Italian hard-to-abate industry. Energies 2022, 15, 8586. [Google Scholar] [CrossRef]
  13. Geels, F.W.; Sovacool, B.K.; Iskandarova, M. The socio-technical dynamics of net-zero industrial megaprojects: Outside-in and inside-out analyses of the Humber industrial cluster. Energy Res. Soc. Sci. 2023, 98, 103003. [Google Scholar] [CrossRef]
  14. Kyle, S.H.; Hall, J.K.; Sovacool, B.K.; Iskandarova, M. The industrial decarbonization paradigm: Carbon lock-in or path renewal in the United Kingdom? Ecol. Econ. 2025, 235, 108628. [Google Scholar] [CrossRef]
  15. Guo, X.; Huang, L.; Miao, H.; Mi, L.; Han, Z. Exploring carbon reduction pathways in the steel industry from the perspective of emerging technologies for achieving carbon neutrality. J. Environ. Manag. 2025, 385, 125768. [Google Scholar] [CrossRef]
  16. Gough, C.; Mander, S. CCS industrial clusters: Building a social license to operate. Int. J. Greenh. Gas Control 2022, 119, 103713. [Google Scholar] [CrossRef]
  17. Lai, H.-L.; Devine-Wright, P. Imagining and emplacing net zero industrial clusters: A critical analysis of stakeholder discourses. Geo-Geogr. Environ. 2024, 11, e00139. [Google Scholar] [CrossRef]
  18. Vagnini, C.; Vieira, L.C.; Longo, M.; Mura, M. Chasing net zero: An exploratory space-time analysis of European regions’ industrial carbon emissions. J. Environ. Manag. 2025, 391, 126466. [Google Scholar] [CrossRef]
  19. Mallett, A.; Kathuria, H.; Pal, P.; Thool, K.S. Pathways for the Indian steel sector: Realizing low carbon industrial clusters through a place-based approach in eastern India. Energy Res. Soc. Sci. 2025, 127, 104209. [Google Scholar] [CrossRef]
  20. Benedikt, B.; Münch, C.; Beckmann, M.; von der Gracht, H. Developing Net-Zero Carbon Supply Chains in the European Manufacturing Industry—A Multilevel Perspective. Supply Chain Manag. 2024, 29, 164–181. [Google Scholar] [CrossRef]
  21. Chen, Y.; Jiao, S.; Gu, X.; Li, S. Decoding the Spatiotemporal Effects of Industrial Clusters on Carbon Emissions in a Chinese River Basin. J. Clean. Prod. 2025, 516, 145851. [Google Scholar] [CrossRef]
  22. Oh, S.; Al-Juaied, M. Decarbonizing industrial hubs and clusters: Towards an integrated framework of green industrial policies. Energy Res. Soc. Sci. 2024, 118, 103777. [Google Scholar] [CrossRef]
  23. Rissman, J.; Bataille, C.; Masanet, E.; Aden, N.; Morrow III, W.R.; Zhou, N.; Elliott, N.; Dell, R.; Heeren, B.; Graus, W.; et al. Technologies and policies to decarbonize global industry: Review and assessment. Appl. Energy 2020, 266, 114848. [Google Scholar] [CrossRef]
  24. Cagno, E.; Accordini, D.; Thollander, P.; Andrei, M.; Monjurul Hasan, A.S.M.; Pessina, S.; Trianni, A. Energy management and Industry 4.0: Analysis of the enabling effects of digitalization on the implementation of energy management practices. Appl. Energy 2025, 390, 125877. [Google Scholar] [CrossRef]
  25. Yan, K.; Gao, H.; Liu, R.; Lyu, Y.; Wan, M.; Tian, J.; Chen, L. Review on low-carbon development in Chinese industrial parks driven by bioeconomy strategies. Renew. Sust. Energy Rev. 2024, 199, 114541. [Google Scholar] [CrossRef]
  26. Ngwaka, U.; Khalid, Y.; Ling-Chin, J.; Counsell, J.; Pinedo-Cuenca, R.; Dawood, H.; Smallbone, A.J.; Dawood, N.; Roskilly, A.P. Decarbonisation pathways for industrial clusters through multi-energy systems. Sustain. Futures 2025, 9, 100656. [Google Scholar] [CrossRef]
  27. Menéndez-Sánchez, J.; Fernández-Gómez, J.; Araujo-de-la-Mata, A. Sustainability Strategies by Oil and Gas Companies, Contribution to the SDGs and Local Innovation Ecosystems. Energies 2023, 16, 2552. [Google Scholar] [CrossRef]
  28. Liao, C.; Wang, S.; Zhang, Y.; Song, D.; Zhang, C. Driving forces and clustering analysis of provincial-level CO2 emissions from the power sector in China from 2005 to 2015. J. Clean. Prod. 2019, 240, 118026. [Google Scholar] [CrossRef]
  29. Shui, B.; Cai, Z.; Luo, X. Towards customized mitigation strategy in the transportation sector: An integrated analysis framework combining LMDI and hierarchical clustering method. Sust. Cities Soc. 2024, 107, 105340. [Google Scholar] [CrossRef]
  30. Turner, K.; Race, J.; Alabi, O.; Calvillo, C.; Katris, A.; Swales, K. Policy Trade-Offs in Introducing a CO2 Transport and Storage Industry to Service the UK’s Regional Manufacturing Clusters. Ecol. Econ. 2022, 201, 107547. [Google Scholar] [CrossRef]
  31. Calvillo, C.; Katris, A.; Race, J.; Corbett, H.; Turner, K. Regional employment implications of deploying CO2 transport and storage to decarbonise the UK’s industry clusters. Ecol. Econ. 2025, 233, 108587. [Google Scholar] [CrossRef]
  32. Devine-Wright, P. Decarbonisation of Industrial Clusters: A Place-Based Research Agenda. Energy Res. Soc. Sci. 2022, 91, 102725. [Google Scholar] [CrossRef]
  33. Ewers, M.; Brannstrom, C.; Conrecode, C. What are the emerging contours of regional decarbonization? Insights from an exploratory analysis of US clean hydrogen hubs. Geoforum 2025, 163, 104294. [Google Scholar] [CrossRef]
  34. Luo, J.; Huang, M.; Bai, Y. Visual Analysis of Low-Carbon Supply Chain: Development, Hot-Spots, and Trend Directions. Front. Environ. Sci. 2022, 10, 995018. [Google Scholar] [CrossRef]
  35. Ran, F.; Xu, X.; Yu, Z.-T.; Lin, Q. A Machine-Learning Assisted Multi-Cluster Assessment for Decarbonization in the Chemical Fiber Industry toward Net-Zero: A Case Study in a Chinese Province. J. Clean. Prod. 2023, 425, 138965. [Google Scholar] [CrossRef]
  36. Eurostat. Eurostat Database (Data Browser); Eurostat: Luxembourg, 2025. Available online: https://ec.europa.eu/eurostat (accessed on 2 August 2025).
  37. Hastie, T.; Tibshirani, R.; Friedman, J. The Elements of Statistical Learning: Data Mining, Inference, and Prediction, 2nd ed.; Springer: New York, NY, USA, 2009. [Google Scholar] [CrossRef]
  38. Gareth, J.; Witten, D.; Hastie, T.; Tibshirani, R. An Introduction to Statistical Learning: With Applications in R, 2nd ed.; Springer: New York, NY, USA, 2021. [Google Scholar] [CrossRef]
  39. Jolliffe, I.T. Principal Component Analysis, 2nd ed.; Springer: New York, NY, USA, 2002. [Google Scholar] [CrossRef]
  40. Jolliffe, I.T.; Cadima, J. Principal component analysis: A review and recent developments. Philos. Trans. R. Soc. 2016, 374, 20150202. [Google Scholar] [CrossRef]
  41. Jain, A.K. Data clustering: 50 years beyond K-means. Pattern Recognit. Lett. 2010, 31, 651–666. [Google Scholar] [CrossRef]
  42. Kaplan, P.O.; Boyd, G.; Browning, M.; Perl, K.; Supekar, S.; Victor, N.; Worrell, E. Is the Industrial Sector Hard to Decarbonize or Hard to Model? A Comparative Analysis of Industrial Modeling and Net Zero Carbon Dioxide Pathways. Energy Clim. Chang. 2025, 6, 100190. [Google Scholar] [CrossRef]
  43. Hincapie-Ossa, D.; Frey, N.; Gingerich, D.B. Assessing County-Level Vulnerability to the Energy Transition in the United States Using Machine Learning. Energy Res. Soc. Sci. 2023, 100, 103099. [Google Scholar] [CrossRef]
  44. Jahangiri, Z.; Miri, M.; Yi, K.M.; McPherson, M. Machine learning-based uncertainty analysis in power system planning: Insights and pathways for decarbonization. Energy Rep. 2024, 12, 942–954. [Google Scholar] [CrossRef]
  45. Rousseeuw, P.J. Silhouettes: A graphical aid to the interpretation and validation of cluster analysis. J. Comput. Appl. Math. 1987, 20, 53–65. [Google Scholar] [CrossRef]
  46. Ward, J.H., Jr. Hierarchical grouping to optimize an objective function. J. Am. Stat. Assoc. 1963, 58, 236–244. [Google Scholar] [CrossRef]
  47. Hubert, L.; Arabie, P. Comparing partitions. J. Classif. 1985, 2, 193–218. [Google Scholar] [CrossRef]
  48. Pesaran, M.H.; Ullah, A.; Yamagata, T. A bias-adjusted LM test of error cross-section independence. Econom. J. 2008, 11, 105–127. [Google Scholar] [CrossRef]
  49. Pesaran, M.H. General Diagnostic Tests for Cross Section Dependence in Panels; Cambridge Working Papers in Economics No. 0435, 864; Faculty of Economics, University of Cambridge: Cambridge, UK, 2004. [Google Scholar] [CrossRef]
  50. Pesaran, M.H. A simple panel unit root test in the presence of cross-section dependence. J. Appl. Econ. 2007, 22, 265–862312. [Google Scholar] [CrossRef]
  51. Pablo-Romero, M.P.; Sánchez-Braza, A.; Torreblanca, C. Implementing the Circular Economy in the European Union and Spain: Links to the Low-Carbon Transition. Energies 2024, 17, 5255. [Google Scholar] [CrossRef]
  52. Tautorat, P.; Iversen, J.; Schmidt, T.S.; Steffen, B. Real Options Analysis of Decarbonization Investments in the Chemical Industry. Appl. Energy 2025, 397, 126238. [Google Scholar] [CrossRef]
  53. Dong, X.; Yu, M. Green bond issuance and green innovation: Evidence from China’s energy industry. Int. Rev. Financ. Anal. 2024, 94, 103281. [Google Scholar] [CrossRef]
  54. Jakimów, M.; Samokhalov, V.; Baldassarre, B. Achieving European Union strategic autonomy: Circularity in critical raw materials value chains. Int. Aff. 2024, 100, 1735–1748. [Google Scholar] [CrossRef]
  55. Griffiths, S.; Sovacool, B.; Iskandarova, M.; Walnum, H.J. Bridging the Gap between Defossilization and Decarbonization to Achieve Net-Zero Industry. Environ. Res. Lett. 2025, 20. Available online: https://iopscience.iop.org/article/10.1088/1748-9326/adaed6/pdf (accessed on 5 August 2025). [CrossRef]
  56. Herman, K.S.; Sovacool, B.K.; Geels, F.W.; Iskandarova, M. Navigating reconfiguration and systems disruption: Decarbonization pathways for UK industrial clusters. Energy 2025, 328, 136464. [Google Scholar] [CrossRef]
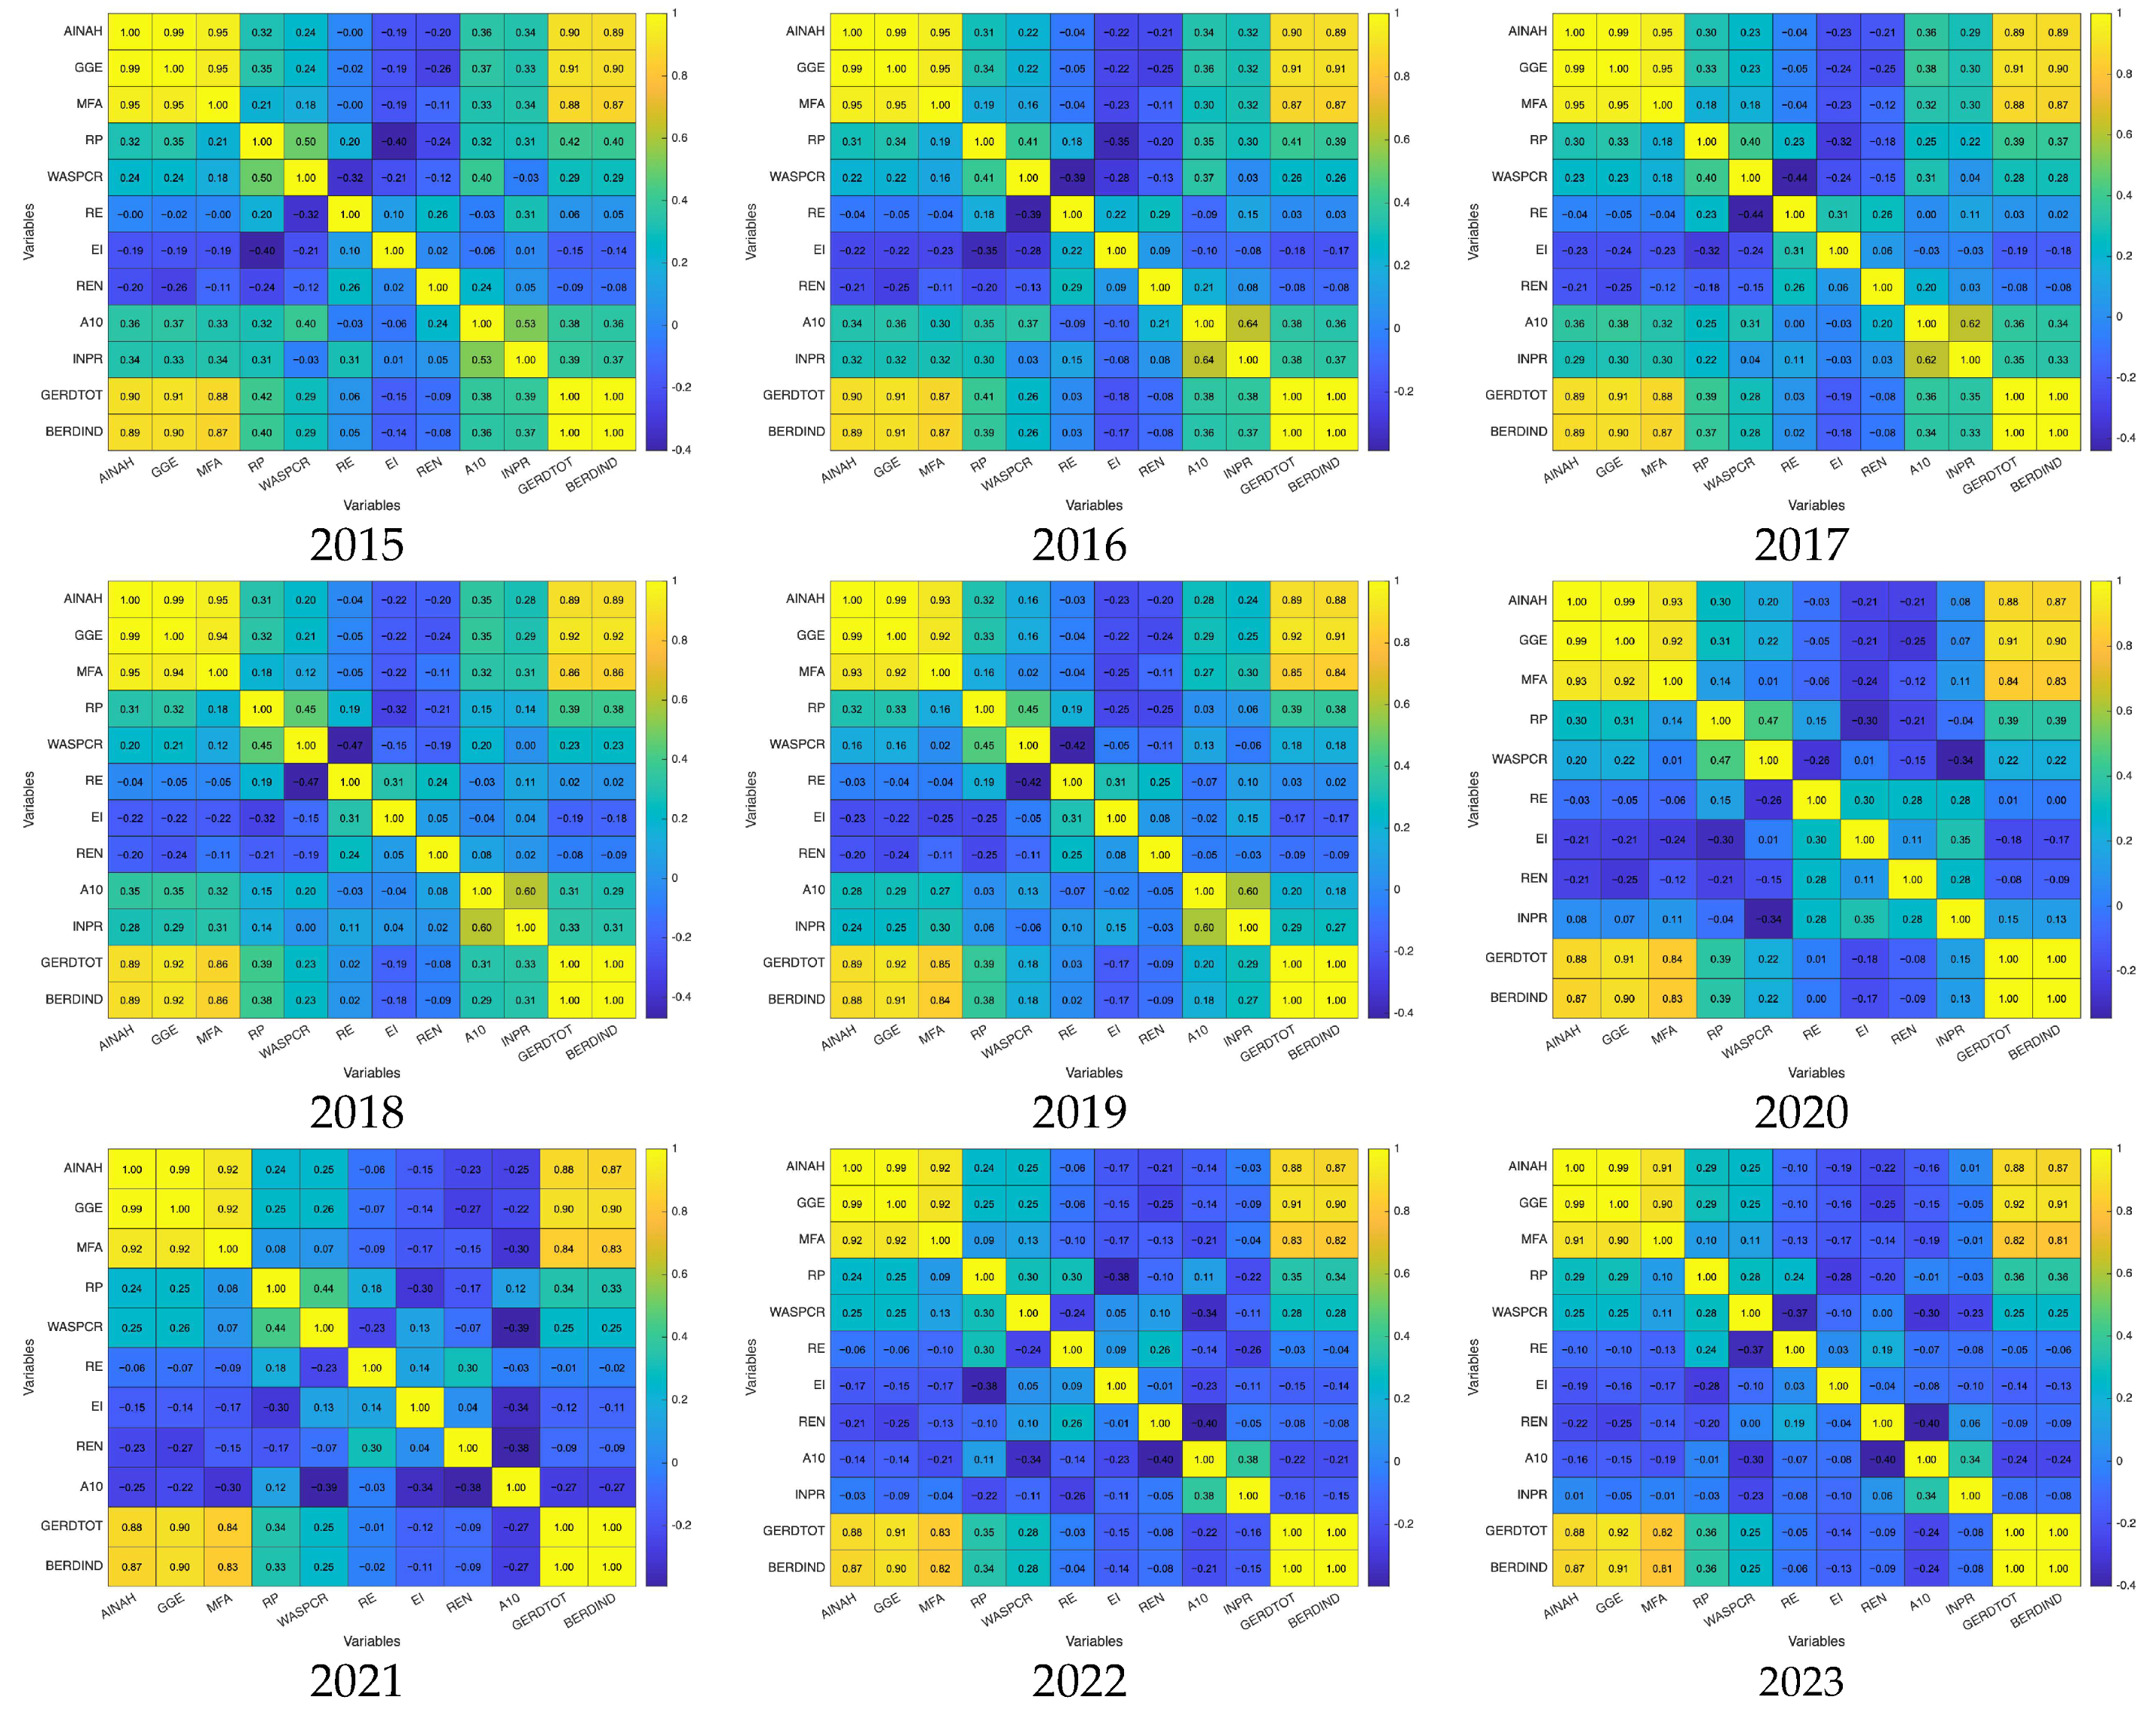
Figure 1. Correlation matrix of the indicators used in the PCA and clustering analysis (EU-27, annual data 2015–2023). Pearson coefficients are reported, with darker shades indicating stronger absolute correlations.
Sustainability 17 08154 g001
Figure 2. Projections of EU-27 country–year observations in the PC1–PC2 plane (2015–2023). Higher scores indicate superior decarbonization performance.
Sustainability 17 08154 g002
Figure 3. K-means clustering on PCA scores (annual panels 2015–2023).
Sustainability 17 08154 g003
Figure 4. Ward dendrograms (annual panels 2015–2023). Hierarchical clustering based on PCA scores, Euclidean distance, and Ward’s linkage confirms the existence of two macro-blocks, further subdividing into three–four coherent subclusters. The different colors denote the distinct clusters identified.
Sustainability 17 08154 g004
Figure 5. Elbow method for cluster number selection (annual panels 2015–2023).
Sustainability 17 08154 g005
Figure 6. Silhouette analysis for cluster number selection (annual panels 2015–2023).
Sustainability 17 08154 g006
Table 1. Eurostat sources, SDMX codes, units, role, and transformations.
BlockDataset
(Official Title)
SDMX CodeUnitsDerived Indicator/Use
EnvironmentAir emissions accounts by NACE Rev.2 activityenv_ac_ainah_r2
(AINAH)
kilotonnes of CO2 equivalentEmission intensity = GHG_C/GVA_C
EnvironmentGreenhouse gas emissions by source sectorenv_air_gge
(GGE)
kilotonnes of CO2 equivalentCross-check of emission levels at source
EnvironmentMaterial flow accountsenv_ac_mfa
(MFA)
thousand tonnesResource context/
correlations
EnvironmentResource productivityenv_ac_rp
(RP)
EUR per kilogramResource efficiency context
EnvironmentRecycling rates of packaging wasteenv_waspacr
(WASPACR)
percentCircularity context
EnergyEnergy intensity in industry (indicator)nrg_ind_ei
(EI)
kilograms of oil equivalent per EUROfficial energy intensity (robustness check)
EnergyShare of energy from renewable sources (heating and cooling)nrg_ind_ren
(REN)
percentMacro-level benchmark for RES (external validation)
EconomyGross value added and income by main industry (NACE Rev.2)nama_10_a10
(A10)
million EUR (volume)GVA_C; Structure = GVA_C/GVA_total
EconomyProduction in industry—annual datasts_inpr_a
(INPR)
index (2015 = 100)Industrial cycle context /consistency checks
InnovationGERD by sector of performancerd_e_gerdtot
(GERDTOT)
percent of GDP / thousand EURTechnological capacity at firm level
InnovationBERD by NACE Rev.2 activityrd_e_berdindr2
(BERDIND)
thousand EURR&D intensity in
C–Manufacturing
Note: Table 1 inventories the Eurostat datasets used in this study. Core indicators (emissions, energy use, and GVA) are combined into derived measures and employed in the PCA and clustering framework. The abbreviations in parentheses represent the codes of the variables as they are used in the dataset processing.
Table 2. Descriptive statistics.
VariableMeanMaximumMinimumStd. Dev.SkewnessKurtosisJarque–BeraProbability
AINAH8,779,392.066,600,000.01,345,031.012,300,000.02.710.7920.00.000
GGE120,281.1936,055.3−2033.0181,275.82.710.6915.20.000
MFA228,938.61,274,335.05329.2270,792.12.07.0340.50.000
RP2.17.40.31.31.03.948.70.000
WASPCR63.385.326.810.1−0.94.354.30.000
RE34.369.816.310.51.55.6168.20.000
EI115.2215.533.734.70.43.26.60.036
REN24.977.45.015.11.55.2146.90.000
A10102.3126.774.28.5−0.24.216.90.000
INPR95.4122.459.19.5−1.14.990.80.000
GERDTOT11,380.3129,972.058.721,757.33.515.62181.80.000
BERDIND7491.988,707.019.514,711.93.516.12337.20.000
Note: Summary statistics for the variables used in the PCA (2015–2023, EU-27). Values are reported as raw series before standardization. Jarque–Bera tests reject normality for nearly all variables (p < 0.001), consistent with heavy tails and skewed distributions.
Table 3. Pesaran CD test results.
VariableStatisticp-Value
AINAH8.9970.000
GGE9.2900.000
MFA4.1260.000
RP2.8640.000
WASPCR 1.2670.978
RE 1.5460.778
EI 0.3501.000
REN 1.1640.796
A10 1.3710.980
INPR 0.8610.998
GERDTOT9.2630.000
BERDIND10.8300.000
Note: Results of cross-sectional dependence tests on panel residuals (EU-27, 2015–2023). The CD statistic is based on Pesaran [49], with bootstrap p-values (B = 500). Significant dependence (p < 0.01) is observed for emissions (AINAH, GGE, MFA, and RP) and R&D indicators (GERDTOT and BERDIND), suggesting common shocks or EU-wide dynamics. No significant dependence is found for WASPCR, RE, REN, A10, and INPR.
Table 4. Two-way fixed effects estimate with Driscoll–Kraay standard errors for variables with cross-sectional dependence.
TermEstimateStd. ErrorStatisticp-ValueVariableSpecification
lag(AINAH, 1)0.7180.2682.6740.008AINAHFE-twoways, lags = 2
lag(AINAH, 2) 0.0020.178 0.0090.993AINAHFE-twoways, lags = 2
lag(GGE, 1)0.5700.1145.0110.000GGEFE-twoways, lags = 2
lag(GGE, 2)0.2470.1851.3390.182GGEFE-twoways, lags = 2
lag(MFA, 1)0.5370.2192.4560.015MFAFE-twoways, lags = 2
lag(MFA, 2)0.1620.0941.7380.084MFAFE-twoways, lags = 2
lag(RP, 1)0.6480.1275.1050.000RPFE-twoways, lags = 2
lag(RP, 2)0.2630.1851.4250.156RPFE-twoways, lags = 2
lag(GERDTOT, 1)0.9920.1616.1410.000GERDTOTFE-twoways, lags = 2
lag(GERDTOT, 2)0.0390.0890.4330.666GERDTOTFE-twoways, lags = 2
lag(BERDIND, 1)0.9310.2184.2700.000BERDINDFE-twoways, lags = 2
lag(BERDIND, 2)0.0210.0590.3530.725BERDINDFE-twoways, lags = 2
Note: Dynamic panel regressions estimated with two-way fixed effects (country and year), including up to two lags. Standard errors are corrected for heteroskedasticity, autocorrelation, and cross-sectional dependence using the Driscoll–Kraay method. Significant AR(1) coefficients (close to unity for GERDTOT and BERDIND) indicate strong persistence, especially in innovation-related variables.
Table 5. Estimates from CCE pooled and mean group models.
VariableModelTermEstimate
AINAHCCE FAILED
GGECCE pooledlag(GGE, 1) 0.053
GGECCE MGlag(GGE, 1)0.170
MFACCE pooledlag(MFA, 1)0.601
MFACCE MGlag(MFA, 1)0.411
RPCCE pooledlag(RP, 1) 0.060
RPCCE MGlag(RP, 1)0.172
GERDTOTCCE pooledlag(GERDTOT, 1)0.546
GERDTOTCCE MGlag(GERDTOT, 1)0.363
BERDINDCCE pooledlag(BERDIND, 1)0.620
BERDINDCCE MGlag(BERDIND, 1)0.385
Note: Estimates from CCE pooled and CCE mean group models following Pesaran [50]. Results capture the impact of unobserved common factors. Divergences between pooled and mean group coefficients (notably for GGE and RP) highlight cross-country heterogeneity within the EU manufacturing sector. “CCE FAILED” indicates non-convergence for AINAH in the pooled specification.
Disclaimer/Publisher’s Note: The statements, opinions and data contained in all publications are solely those of the individual author(s) and contributor(s) and not of MDPI and/or the editor(s). MDPI and/or the editor(s) disclaim responsibility for any injury to people or property resulting from any ideas, methods, instructions or products referred to in the content.