Article

Numerical Simulation Study of Blast Furnace Mixed Blown Pulverized Coal and Hydrochar

1
School of Metallurgical and Ecological Engineering, University of Science and Technology Beijing, Beijing 100083, China
2
Beijing Shougang Corporation Ironmaking Division, Tangshan 064400, China
*
Author to whom correspondence should be addressed.
Sustainability 2025, 17(18), 8122; https://doi.org/10.3390/su17188122
Submission received: 1 July 2025 / Revised: 7 August 2025 / Accepted: 8 September 2025 / Published: 9 September 2025

Abstract

In order to alleviate the energy crisis and respond to the “dual carbon strategy”, a new energy substance is needed to replace pulverized coal as the new blast furnace blowing fuel. Hydrochar is a clean and renewable carbon resource with high calorific value, good transportation and storage properties, and low ash content. Numerical simulation is used to study the combustion process of co-blown pulverized coal and hydrochar inside the cyclone zone. In this study, a three-dimensional physical model was constructed based on the actual dimensions of the direct-blowing pipe, tuyere, coal gun, and swirl zone of a large blast furnace in China. Numerical simulation methods were used to study the combustion process of coal powder and hydrothermal carbon co-injected into the swirl zone, and to investigate changes in the swirl zone of the tuyere under different conditions. The results show that increasing the proportion of hydrochar in the blended coal is conducive to improving the combustion rate of the blended coal, the temperature inside the gyratory zone increases significantly with the increase in the oxygen enrichment rate, and the high temperature zone is gradually enlarged. For every 1% increase in the oxygen enrichment rate, the maximum temperature of the centerline of the coal plume increases by 28 K, and the burnout rate increases by 1.12%; the increase in the blast temperature makes the combustion of pulverized coal slightly advance and promotes the increase in the internal temperature of the gyratory zone. The change of the blast temperature to 1559 K is more obvious, and the increase in the blast temperature after it is greater than 1559 K is not significant for the improvement of the burnout rate and the temperature of the gyratory area, and it will increase the cost; the lower the proportion of the small particle size is, the bigger the high temperature area of the gyratory area is, and the higher the temperature of the centerline of the coal strand is. If the content of the volatile matter remains unchanged, the increase in the ratio of the hydrochar has little influence on the temperature field of the gyratory area and the temperature of the centerline of the coal strand. The temperature difference is kept at 20 K. With the increase in the hydrochar ratio, the overall burnout rate of pulverized coal gradually increases. Therefore, hydrochar can replace bituminous coal as blast furnace blowing fuel to a certain extent, which can reduce costs and carbon emissions.

1. Introduction

The steel industry, as a core pillar industry in the global industrialization process, has always played an irreplaceable role in driving economic development. However, this industry also has a significant impact in terms of energy consumption and greenhouse gas emissions [1,2,3]. Carbon dioxide emissions from steel production account for approximately 6% of global carbon dioxide emissions, and the steel industry consumes approximately 8% of global energy [4,5,6,7,8,9]. As a key sector contributing to global carbon footprints, its transition to low-carbon practices is critical for achieving long-term ecological balance and energy security. Although new technologies such as hydrogen metallurgy and carbon capture are gradually emerging, due to constraints such as production capacity scale, technological costs, and supply chain stability, the blast furnace will remain a critical process equipment for ensuring steel supply over the next few decades [10,11,12,13,14].
Blast furnace ironmaking, as a pyrometallurgical process, uses ore as raw material and relies on coal, coke, and other carbon-based fuels as both fuel and reducing agents [15]. To reduce costs, China has widely adopted the use of coal powder injection to replace part of the coke. However, coal combustion produces significant carbon emissions as well as NOX and SOX, posing threats to the environment and human health, prompting researchers to explore new types of coal for injection. In recent years, biomass energy has garnered significant attention due to its renewable and carbon-neutral characteristics. According to the “China Renewable Energy Development Strategy Research Report,” China’s annual biomass energy extraction volume is equivalent to 117 million tons of standard coal, accounting for 54.5% of total clean energy [16]. However, biomass has drawbacks such as low calorific value, poor wear resistance, and high alkali metal content, making it unsuitable for direct use in blast furnace injection [17]. Hydrochar, derived from renewable biomass, represents a promising alternative to fossil fuels, aligning with sustainable development goals by reducing reliance on non-renewable coal resources, mitigating carbon emissions, and promoting circular utilization of organic materials. In addition, the products of biomass hydrothermal carbonization offer significant advantages, including high calorific value, good storage and transportation properties, low ash and harmful element content, and the ability to improve the ash melting performance of coal powder. Therefore, mixing biomass hydrothermal carbon with coal powder in a specific ratio for blast furnace injection can both reduce ironmaking costs and contribute to achieving ironmaking decarbonization goals.
The blast furnace windrow gyratory zone of blast furnaces remains a central focus in the research domain of blast furnace pulverized coal injection. When the coal lance is inserted at an oblique angle into the blowpipe, pulverized coal is injected into the blast furnace after mixing with the gas flow within the blowpipe, forming a whistle-shaped region inside the furnace referred to as the exhaust swirl zone. Methods for investigating the internal characteristics of the blast furnace tuyere swirl zone are systematically categorized into direct and indirect approaches. The direct approach involves analyzing swirl zone characteristics (such as temperature profiles and coal combustion behavior) through manual observation or instrumental measurements, which are subject to limitations from human subjective judgment as well as the precision and measurement range of experimental apparatus. The indirect method is characterized by the abandonment of the actual observation, through the establishment of mathematical models or actual physical models in the computer or real reproduction of the internal characteristics of the cyclone area, the effectiveness of this method has been confirmed by many scholars. Compared with the direct method, the analysis of mathematical modeling through fluid simulation software can be more convenient and intuitive to study the combustion characteristics inside the cyclotron region, completely avoiding human subjective errors and the limitations of the instrument. Shen [18] et al. constructed a three-dimensional model of the blast furnace pulverized coal injection process and verified the validity of the model through the measurements of the gas components and the coal consumption of two pilot test benches. The gas–solid flow as well as the combustion of pulverized coal were simulated and analyzed, and the model can better represent the distribution of each gas in the gyratory zone as well as describe the combustion process of pulverized coal particles. Based on the actual production data of a blast furnace in the past 6 months, this study analyzes the combustion process of mixed pulverized coal injection and pulverized coal hydrochar co-injection by building a three-dimensional model. In the simulation process, it is assumed that coal powder is a regular sphere, and the fragmentation and agglomeration of coal powder particles are not considered; it is assumed that the blast furnace operation is stable, and the size of the tuyere swirl zone remains constant; the effects of unburned coal powder on the combustion model and the porosity of the coke layer are not considered; the reaction of coke is not considered, and only the combustion of coal powder and hydrogen-rich gas is considered; and the condition of a single tuyere is used to represent the overall situation of the lower part of the blast furnace. The innovative core of this study lies in constructing a cross-scale multi-physics field coupling model targeting the heterogeneous characteristics of hydrothermal carbon and coal powder, revealing the synergistic interaction mechanisms of mixed fuels within the blast furnace, and developing engineering-applicable optimization strategies through dynamic simulation and industrial validation. This not only enriches the theoretical framework of blast furnace fuel injection but also provides new technical pathways for the low-carbon transformation of the steel industry.

2. Model Building

2.1. Model Description

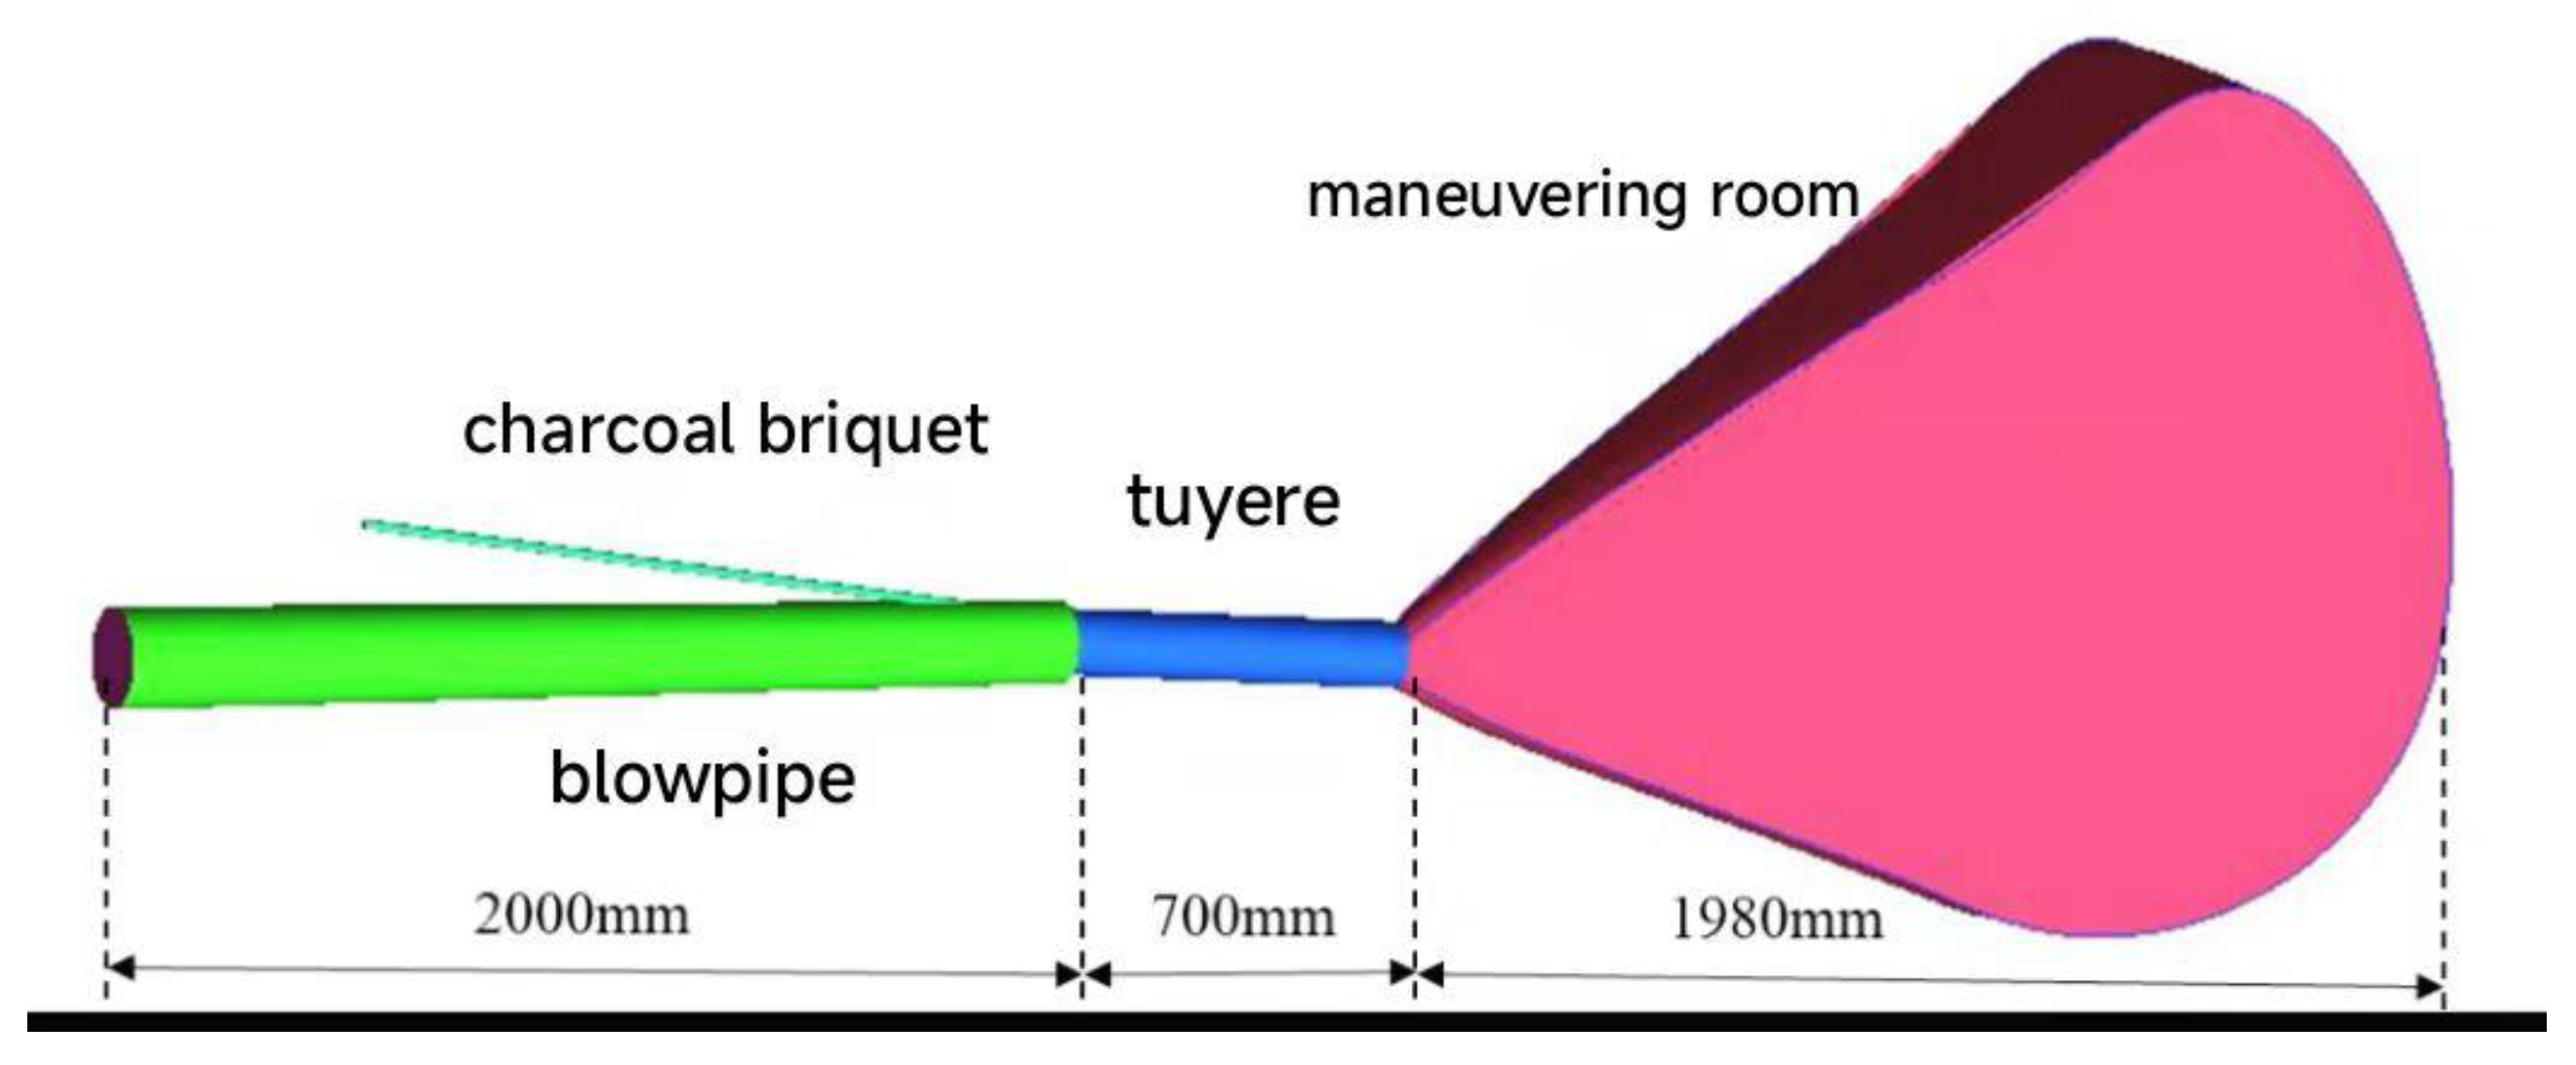
A three-dimensional model of pulverized coal combustion was established (Figure 1), and the specific structure includes the direct blowpipe, the wind mouthlet, the coal lance, and the wind mouth gyratory area. The pulverized coal is injected by the coal lance and mixed with the hot air in the direct blowpipe to form a whistle-shaped area inside the furnace cylinder, which is called the blast furnace wind mouth gyratory area. The pulverized coal undergoes volatile combustion, residual carbon combustion, and dissolution reaction of residual carbon in this series of processes. Due to the continuous occurrence of pulverized coal combustion reactions within the furnace cylinder, conducting detailed simulations remains challenging. Therefore, the pulverized coal combustion process is modeled under a quasi-steady-state assumption, whereby the geometry and dimensions of the blast furnace wind mouth gyratory area are considered invariant. In addition, the treated hydrochar mixed with anthracite and bituminous coal is co-injected into the blast furnace, and only the combustion reaction of the three kinds of pulverized coal is considered without considering the gasification of coke inside the cylinder. The ensemble averaging method can accurately reflect the macroscopic behavior of a particle ensemble (such as swirl zone morphology, temperature distribution, and reaction efficiency) through reasonable statistical averaging, but it weakens the random fluctuations of individual particles (such as trajectory differences caused by local turbulence). For engineering applications, this trade-off is necessary—the core objective of simulation is to predict the overall characteristics of the swirl zone (such as size, temperature peaks, and gas composition), rather than the detailed motion of individual particles. Therefore, in this study, we adopted the particle aggregation method. The software used in this study mainly included the following: SolidWorks (version 2019) was used to build the model, ICEM (version 2022 R1) was used to mesh the model, Fluent (version 2022 R1) was used to simulate the model, and CFD-post (version 2022 R1) was used for post-processing of the data.

2.2. Model Parameters

2.2.1. Kinetic Equations

The finite-difference method was used for the gas phase, and averaging was carried out over a group of particles contained in one grid cell. The averaging operation mainly consists of the following five parts. Particle tracking: track the motion of each particle in the Lagrangian framework, recording its grid cell location and state parameters. Grid statistics: for each grid cell, summarize the forces and mass/energy exchange quantities of all particles within it. Source term generation: divide the aggregated particle action quantities by the grid volume to obtain the source term for the continuity equation. Gas phase solution: solve the gas phase control equation containing the source term using the finite difference method, and update the gas phase parameters of the grid cells. Parameter feedback: map the updated gas phase parameters back to the particles within the corresponding grid cells for use in the next time step’s particle calculations. Due to the flow of fluid inside the direct blowpipe, the gas phase is described as a continuous phase by means of a three-dimensional steady state model, the k-ε equation, and the N-S equation. In order to obtain variables such as pressure and velocity, they are solved through the continuous phase equations in Table 1 [19,20].
The turbulence parameters are set to the classical values Cμ = 0.09, C1 = 1.44, and C2 = 1.92. Turbulence boundary conditions: the inlet turbulence intensity I is set to 7%, and the characteristic length L is set to 0.24 m, which is the inlet diameter.
Pulverized coal particles and hydrochar particles are treated as discrete phases, with the Lagrangian method employed to track particle trajectories throughout the computational domain. This tracking approach enables the characterization of particle motion within the model by solving Lagrangian governing equations. The governing equations for the discrete phase are detailed in Table 2. Inter-particle heat transfer and heat exchange between particles and the gas phase are realized through convex surface heat transfer mechanisms and mass–energy transfer processes [21,22]. Heat transfer within particles and between particles and the gas phase is achieved through convex surface heat transfer and mass transfer. The specific equations are shown in Table 3.
The combustion process of pulverized coal (including bituminous coal and anthracite) and hydrochar mixed and blown into the blast furnace is divided into (1) the preheating stage of the mixed coal, (2) the combustion stage of the volatile components in the pulverized coal and hydrochar, and (3) the combustion and gasification phases of residual carbon, along with the reactions of volatile components and residual carbon combustion [23], are tabulated in Table 4.
In the heat transfer process between particles and the gas phase, convex surface heat transfer (mainly referring to heat conduction and convection) and mass heat transfer (latent heat transfer accompanied by mass migration) are two key mechanisms, corresponding to the following equations.
Through the above equations, it is possible to fully describe heat conduction within particles, convective heat transfer between particles and the gas phase, and latent heat/reaction heat transfer accompanying mass migration, thereby accurately simulating the effects of heat transfer on particle combustion time and size changes.

2.2.2. Simulation Conditions

The simulation was based on the actual production parameters of the blast furnace of an ironmaking plant (Table 5). The depth of the wind gyratory zone was calculated to be 1.98 m, the width to be 0.8 m, and the height to be 1.65 m. The industrial and elemental analyses of the main blown coal types are listed in Table 6. Hydrochar was used after being heated in the ambient temperature of 240 °C for 1 h. The diameter of pulverized coal was designed to be 8 × 10⁻⁵ m. In order to study the effects of different blast and physical parameters on the blast furnace, 75% anthracite coal and hydrochar were used. Based on the operational parameters of Jingtang fuel, the pulverized coal particle diameter is specified as 8 × 10⁻⁵ m. In order to study the effect of different blast air and physical parameters on the blast furnace blown pulverized coal and hydrochar, 75% anthracite, 15% bituminous coal, and 10% hydrochar were used for the mixing of blended coal blowing.
To ensure the accuracy and reliability of the computational results, this study conducted validity verification on the constructed model. First, simulations were performed under basic operating conditions (without mixed injection) using the same process parameters as those of the blast furnace. Table 7 shows a comparison of the actual production results and the simulated results. The simulation results were found to be closely aligned with the actual results. Additionally, the wind mouth swirl zone model developed in this study was compared with previous research [24] under similar physical models and parameters. As shown in Table 8, under similar models and parameters, the results produced by the model developed in this study were generally consistent with those of previous studies, further validating the effectiveness and reliability of the model proposed in this study.

3. Results and Discussion

3.1. Analytical Results for Different Oxygen Enrichment Rates

The combustion process when pulverized coal is co-injected with hydrochar was simulated for oxygen enrichment rates of 5%, 7.2%, 9%, and 11%, respectively. Figure 2 shows the temperature cloud on the symmetric surface at the center of the model and the temperature variation curve at the centerline of the coal plume. Analyzing the temperature field in the figure, it can be found that with the increase in oxygen concentration, the difference in the temperature field distribution near the exit of the coal lance is not particularly large. This is due to the fact that even if the oxygen concentration of the blast is increased, the heat transfer coefficient between the blast and the pulverized coal will not be changed, and thus cannot promote the heat absorption and combustion of the pulverized coal. In addition, although the increase in oxygen concentration can improve the mass transfer coefficient between the pulverized coal particles and O2, due to the process of momentum exchange with the high-speed hot air, the pulverized coal flow rate is very fast, subject to the constraints of the combustion time and space, which restricts the improvement of the mass transfer rate. It can be seen that due to the increase in oxygen concentration in the blast air makes the coal dust and hydrochar can be more fully combusted. Therefore, with the increase in oxygen concentration in the blast air, the high temperature region within the gyratory zone expands. After entering the gyratory zone at the wind mouth, it can be seen from the temperature curve that the temperature increases rapidly, and the highest temperatures on the centerline of the four coal plumes are 2464 K, 2533 K, 2581 K, and 2632 K. The temperature changes are more obvious with the increase in oxygen enrichment rate.
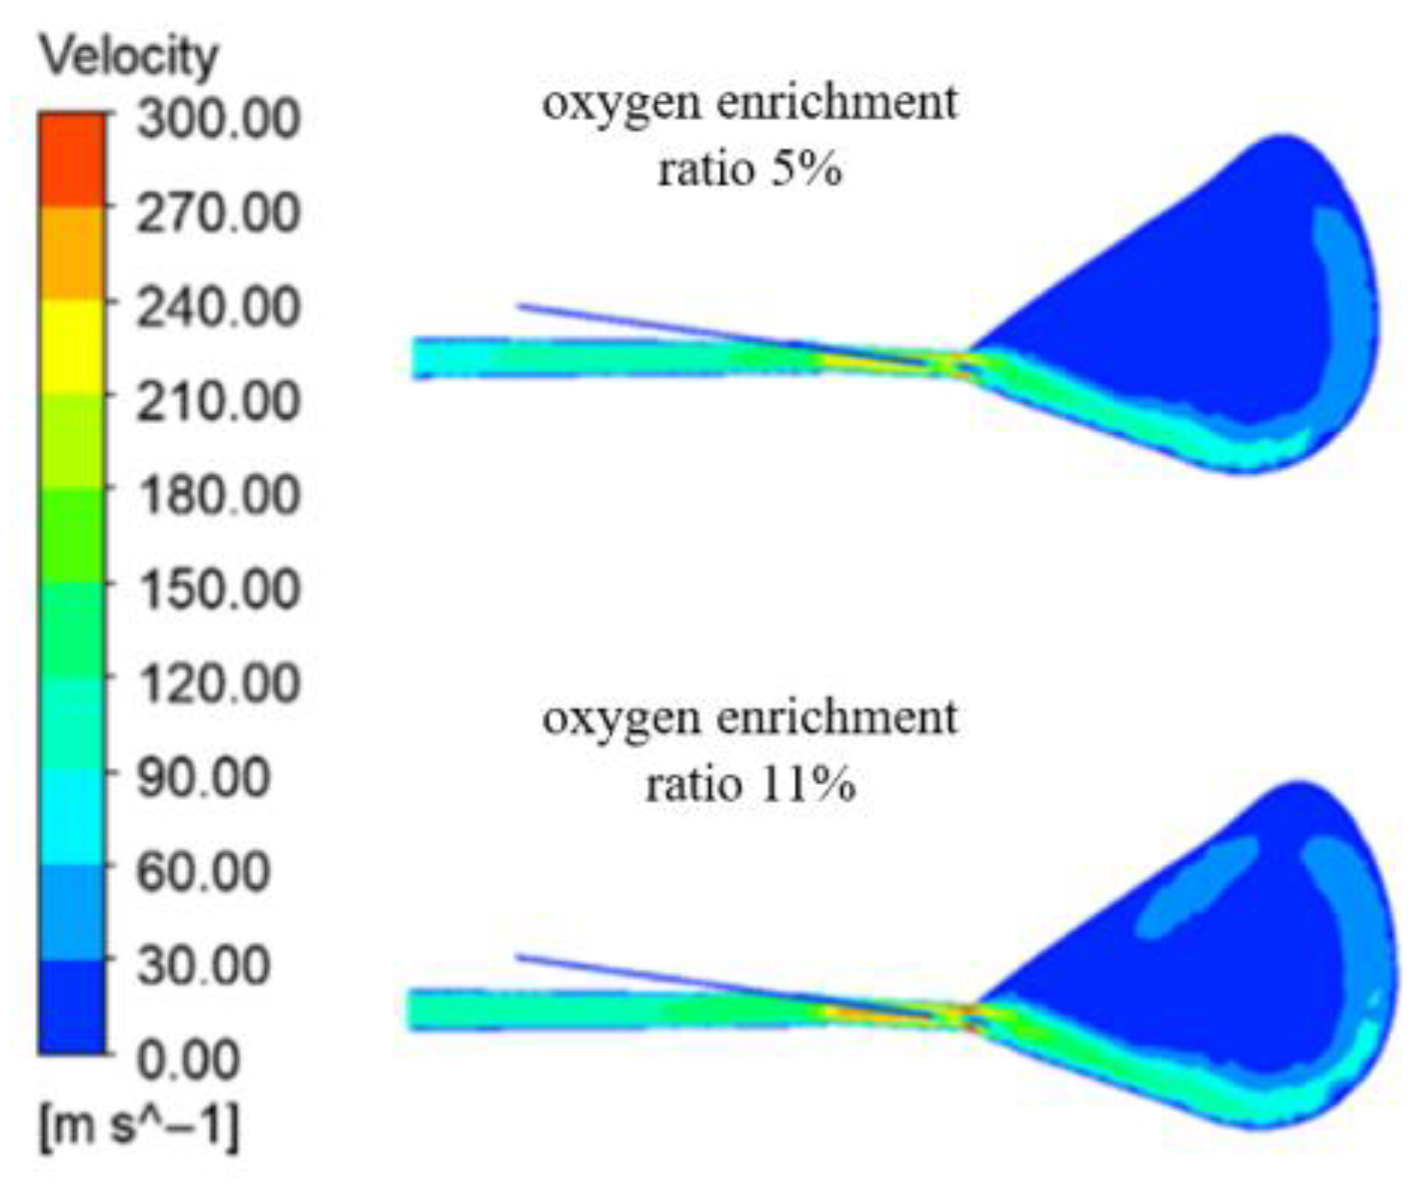
The velocity field in the gyratory region under different oxygen concentrations is shown in Figure 3. Comparing the velocity field cloud diagrams, it can be seen that under the condition of high-speed blast, the gas with very high velocity moves along the centerline of the wind outlet at high speed and moves upward rapidly in the center region of the blast furnace, so as to form a main stream gas velocity formed by the high-speed gas in front of the wind outlet and upward movement of the gas in the center of the furnace chamber. The maximum velocity of the gas under four kinds of oxygen-rich rate appeared at the outlet of the wind mouth, respectively, as 312.5 m/s, 315.7 m/s, 320.4 m/s, and 324.4 m/s. It can be seen that the movement of pulverized coal particles increases in the process of the movement of the gas velocity in the wind mouth, below the gyratory area, with the increase in the oxygen-rich rate. This may be due to the increase in the concentration of oxygen resulting in higher temperatures, volatile reaction, and faster reaction of residual carbon to generate increases in gas volume. This may be the result of the increase in oxygen concentration which leads to the increase in temperature, while the volume of gas generated after the reaction of the volatile matter and residual carbon increases quickly.
Figure 4 shows the distribution cloud of the main gas content under different oxygen enrichment rates, and Figure 5 shows the change curve of the main gas content in the centerline of the coal plume under different oxygen enrichment rates. Overall, the higher the oxygen concentration, the more CO2 and CO are generated in the cyclone zone, which is easy to understand. After the blended coal enters the cyclone area, i.e., around 0.2–0.4 m, a large amount of CO2 is generated, the oxygen is consumed drastically, and less CO is generated at this time. After 0.4 m, CO is generated. On the one hand, it is the lack of oxygen that leads to the generation of CO, on the other hand, a large amount of CO2 reacts with the residual carbon to generate CO. Due to the fact that the amount of oxygen is small in comparison with that of the blowing pulverized coal, the amount of oxygen is always insufficient, and the four types of gas content are not enough to be generated after leaving the blowhole after 0.4 m. After 0.4 m, the vast majority of O2 in the four cases has been consumed and the mass fraction is no longer different.
For carbon dioxide, the carbon dioxide molar fractions at different oxygen enrichment rates increase rapidly at high oxygen content and reach the maximum value around 0.43 m. The carbon dioxide molar fractions at different oxygen enrichment rates increase rapidly at high oxygen content and reach the maximum value around 0.43 m. Before this stage, the oxygen concentration decreases very quickly, and when the oxygen content is low, the generation of CO begins, after which the carbon dioxide content gradually decreases and finally tends to zero due to the solvation reaction of the residual carbon, at this time, the carbon dioxide mole fraction corresponding to an oxygen enrichment rate of 11% is about 3.5% higher than that corresponding to an oxygen enrichment rate of 7.2%. The difference of the highest CO2 mole fraction is mainly influenced by the oxygen content, high oxygen concentration will make the unit volume of pulverized coal burn more fully, and then generate more CO2.
Figure 6 shows the blended coal burnout rate and the burnout rate of each coal type under different oxygen enrichment rates. Figure 6a shows the variation of blended coal burnout rate, and it can be seen that there is almost no difference in the blended coal burnout rate under different oxygen enrichment rates in the preheating stage. After that, due to the difference in oxygen enrichment rate, the burnout rate of pulverized coal is higher in the case of high oxygen enrichment rate. In the case of high oxygen enrichment rate, the remaining residual carbon after volatile matter volatilization can be reacted with the excess of oxygen, and more CO2 can be generated after the oxygen is consumed to react with more residual carbon to make the burnout rate of pulverized coal is higher. Jingtang blast furnace coal is relatively high, resulting in a lower amount of relative oxygen, so the change in the oxygen concentration has a greater impact on the burnout rate of blended coal. Four kinds of oxygen-rich rates of blended coal had burnout rates of 67.08%, 69.96%, 72.25%, and 73.8%, respectively. Figure 6b–d show the burnout rates of anthracite, bituminous coal, and hydrochar, respectively. As can be seen from the figures, hydrochar has the highest burnout rate, even close to complete burnout under high oxygen enrichment, and anthracite has the lowest burnout rate, which is least affected by the oxygen enrichment rate. Due to the high content of volatile matter in hydrochar, the combustion exhaustion rate in the pre-combustion period can reach about 60%, and the combustion exhaustion rate can reach 99.91% in the case of 11% oxygen enrichment after 1 m of spraying out of the coal lance. As the residual carbon content of hydrochar is less, after the volatile matter is completely volatilized, the dissolution reaction of residual carbon is also carried out more thoroughly. On the other hand, anthracite is different, the volatile fraction of anthracite is only 11.12%, while the fixed carbon can reach 78.54%, the burnout rate of anthracite is mainly expressed in the dissolution reaction of residual carbon. Relative to bituminous coal, the burnout rate of anthracite is less affected, the oxygen enrichment rate increases from 5% to 11%, the burnout rate of anthracite increases from 61.7% to 67.82%, an increase of 6.12%. Bituminous coal, on the other hand, increased from 76.4% to 86.4%, an increase of 10%. The enhanced burnout rate with higher oxygen enrichment not only improves energy efficiency but also reduces unburned carbon waste, aligning with sustainable development’s emphasis on resource optimization. Hydrochar’s high burnout rate (up to 99.91% under high oxygen enrichment) further amplifies this effect. As a biomass-derived fuel, its carbon cycle is near-neutral, reducing net carbon emissions compared to fossil coal and supporting the industry’s low-carbon transition.

3.2. Analysis Results for Different Blast Temperatures

Keeping the oxygen enrichment rate at 7.2%, the comparative analysis of different temperatures was carried out by changing the blast temperature. The simulated blast temperatures were set to 1459 K, 1509 K, 1559 K, and 1609 K. Figure 7 shows the temperature change of the centerline of the coal plume and the temperature distribution on the symmetric surface at the center of the model. In Figure 7a, the coal plume centerline temperature in the pre-combustion difference is more obvious, and higher hot air temperature, the distance to reach the maximum temperature is shorter; the temperature increase of 100 K, to reach the maximum temperature from the exit of the coal lance of the distance is shortened by about 0.007 m. And the overall temperature of the coal plume centerline with the increase in the temperature of the blower air, with a maximum temperature of 2516 K, 2531 K, 2541 K, and 2552 K, respectively, 2541 K and 2552 K; the higher the temperature, the smaller the temperature difference of the highest temperature in the centerline of the coal plume. Figure 7b shows that there is no obvious difference in the temperature distribution within the cyclone area below the hot air temperature of 1559 K, and when the hot air temperature reaches 1609 K, the high temperature area is slightly expanded, but the change is small. From the above temperature cloud and curve, with the increase in the blast temperature, the location of the high-temperature zone appeared to shift forward and the high-temperature zone area becomes larger and the highest temperature increases. That is, the main combustion reaction area is closer to the mouth of the wind and put out more heat. There are two main reasons: first, high wind temperature into the cyclone area of the heat increased; second, the unit mass of pulverized coal around the temperature rises, so that the volatile components precipitated combustion process occurs faster and earlier. Combustion of released heat promoted the gas-phase temperature, the gas-phase high temperature and, in turn, promoted the continued combustion of residual carbon. The interaction between the two aspects and mutual influence leads to the location of the high temperature zone to advance and expand.
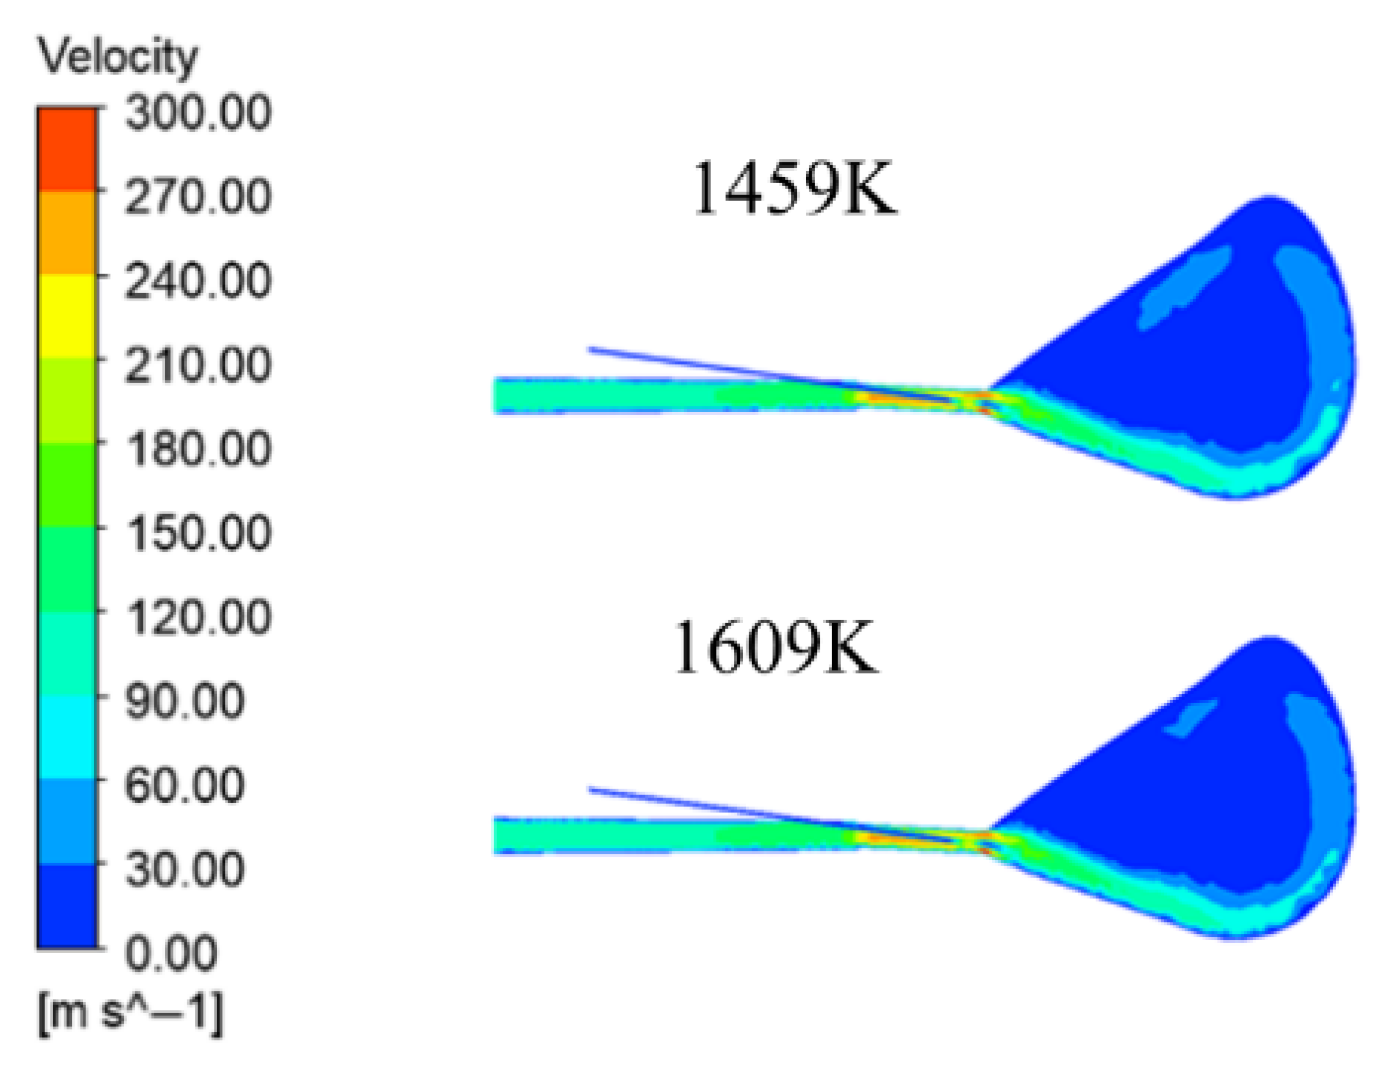
The high temperature air passes through the outlet of the coal lance and the velocity value increases due to the extrusion of the coal lance, after which it exchanges momentum with the coal dust and the velocity value decreases. At the end of the air outlet, the diameter decreases and the velocity increases, and, after entering the gyratory zone, due to the sudden increase in space, the airflow velocity gradually decreases according to the continuity equation. In addition, due to the buoyancy effect, the high temperature air appears to flow diagonally upward, and a part of the gas flows out from the top, while the other part of the gas flows out at a high speed after cycling for a period of time in the cyclotron zone. Among the four blast temperatures in Figure 8, the maximum velocity occurs at the air opening. The higher the wind temperature, the greater the gas velocity; the maximum velocity was 313.5 m/s, 315.7 m/s, 316.8 m/s, and 318.6 m/s. This is due to the increase in the temperature of the blower, where the gas volume slightly increased, and higher temperatures made the volatile components burn faster to make the gas volume increase, prompting an increase in gas velocity. And above the cyclone area, the gas shows a trend of shrinking in the high velocity area after cyclone. The reason is due to the high blast temperature before this coal powder reached the highest combustion exhaustion, so that the gas volume no longer increases; but at a lower blast temperature, coal powder will have a small solvation reaction after slightly increasing the gas volume, slightly larger than the high velocity area of high temperature working conditions.
Figure 9 shows the distribution of the mass fraction of the main gases in the cloud and Figure 10 shows the mass fraction change curve of the centerline of the coal plume. When the blast temperature is different, the trend of the same gas cloud is basically the same; after the coal dust leaves the gun and enters the air outlet, it mixes with the high temperature gas and is preheated by the hot air, and the volatile compounds in the preheated coal dust are precipitated and combusted and their combustion process consumes a large amount of oxygen, so the content of oxygen decreases rapidly. The combustion of volatile compounds generates a large amount of CO2, which leads to the rapid increase in CO2 in the first distance. In the early stage of pulverized coal combustion, the oxygen content is more sufficient, resulting in slow CO generation. In the later stage, the higher temperature of the blast wind and the more heat brought in make the dissolution reaction of CO2 faster, so the CO2 consumption is faster.
For CO2, the CO2 mass fraction peaked at 0.44 m under the blast temperature of 1609 K, which was 0.02 m earlier than the stabilization at 0.47 m under the blast temperature of 1459 K. The figure shows that after the large amount of oxygen consumption, accompanied by the emergence of CO2 peak, and the higher the temperature, the lower the CO2 peak. This indicates that the residual carbon has been carried out at this time the solvation reaction and incomplete combustion. The higher the temperature, the faster the progress of the solvation reaction. CO2 consumption is slightly larger, so when the volatile components of the combustion are completed, most of the residual carbon is only solvation reaction, and the CO2 peak is the degree of solvation reaction.
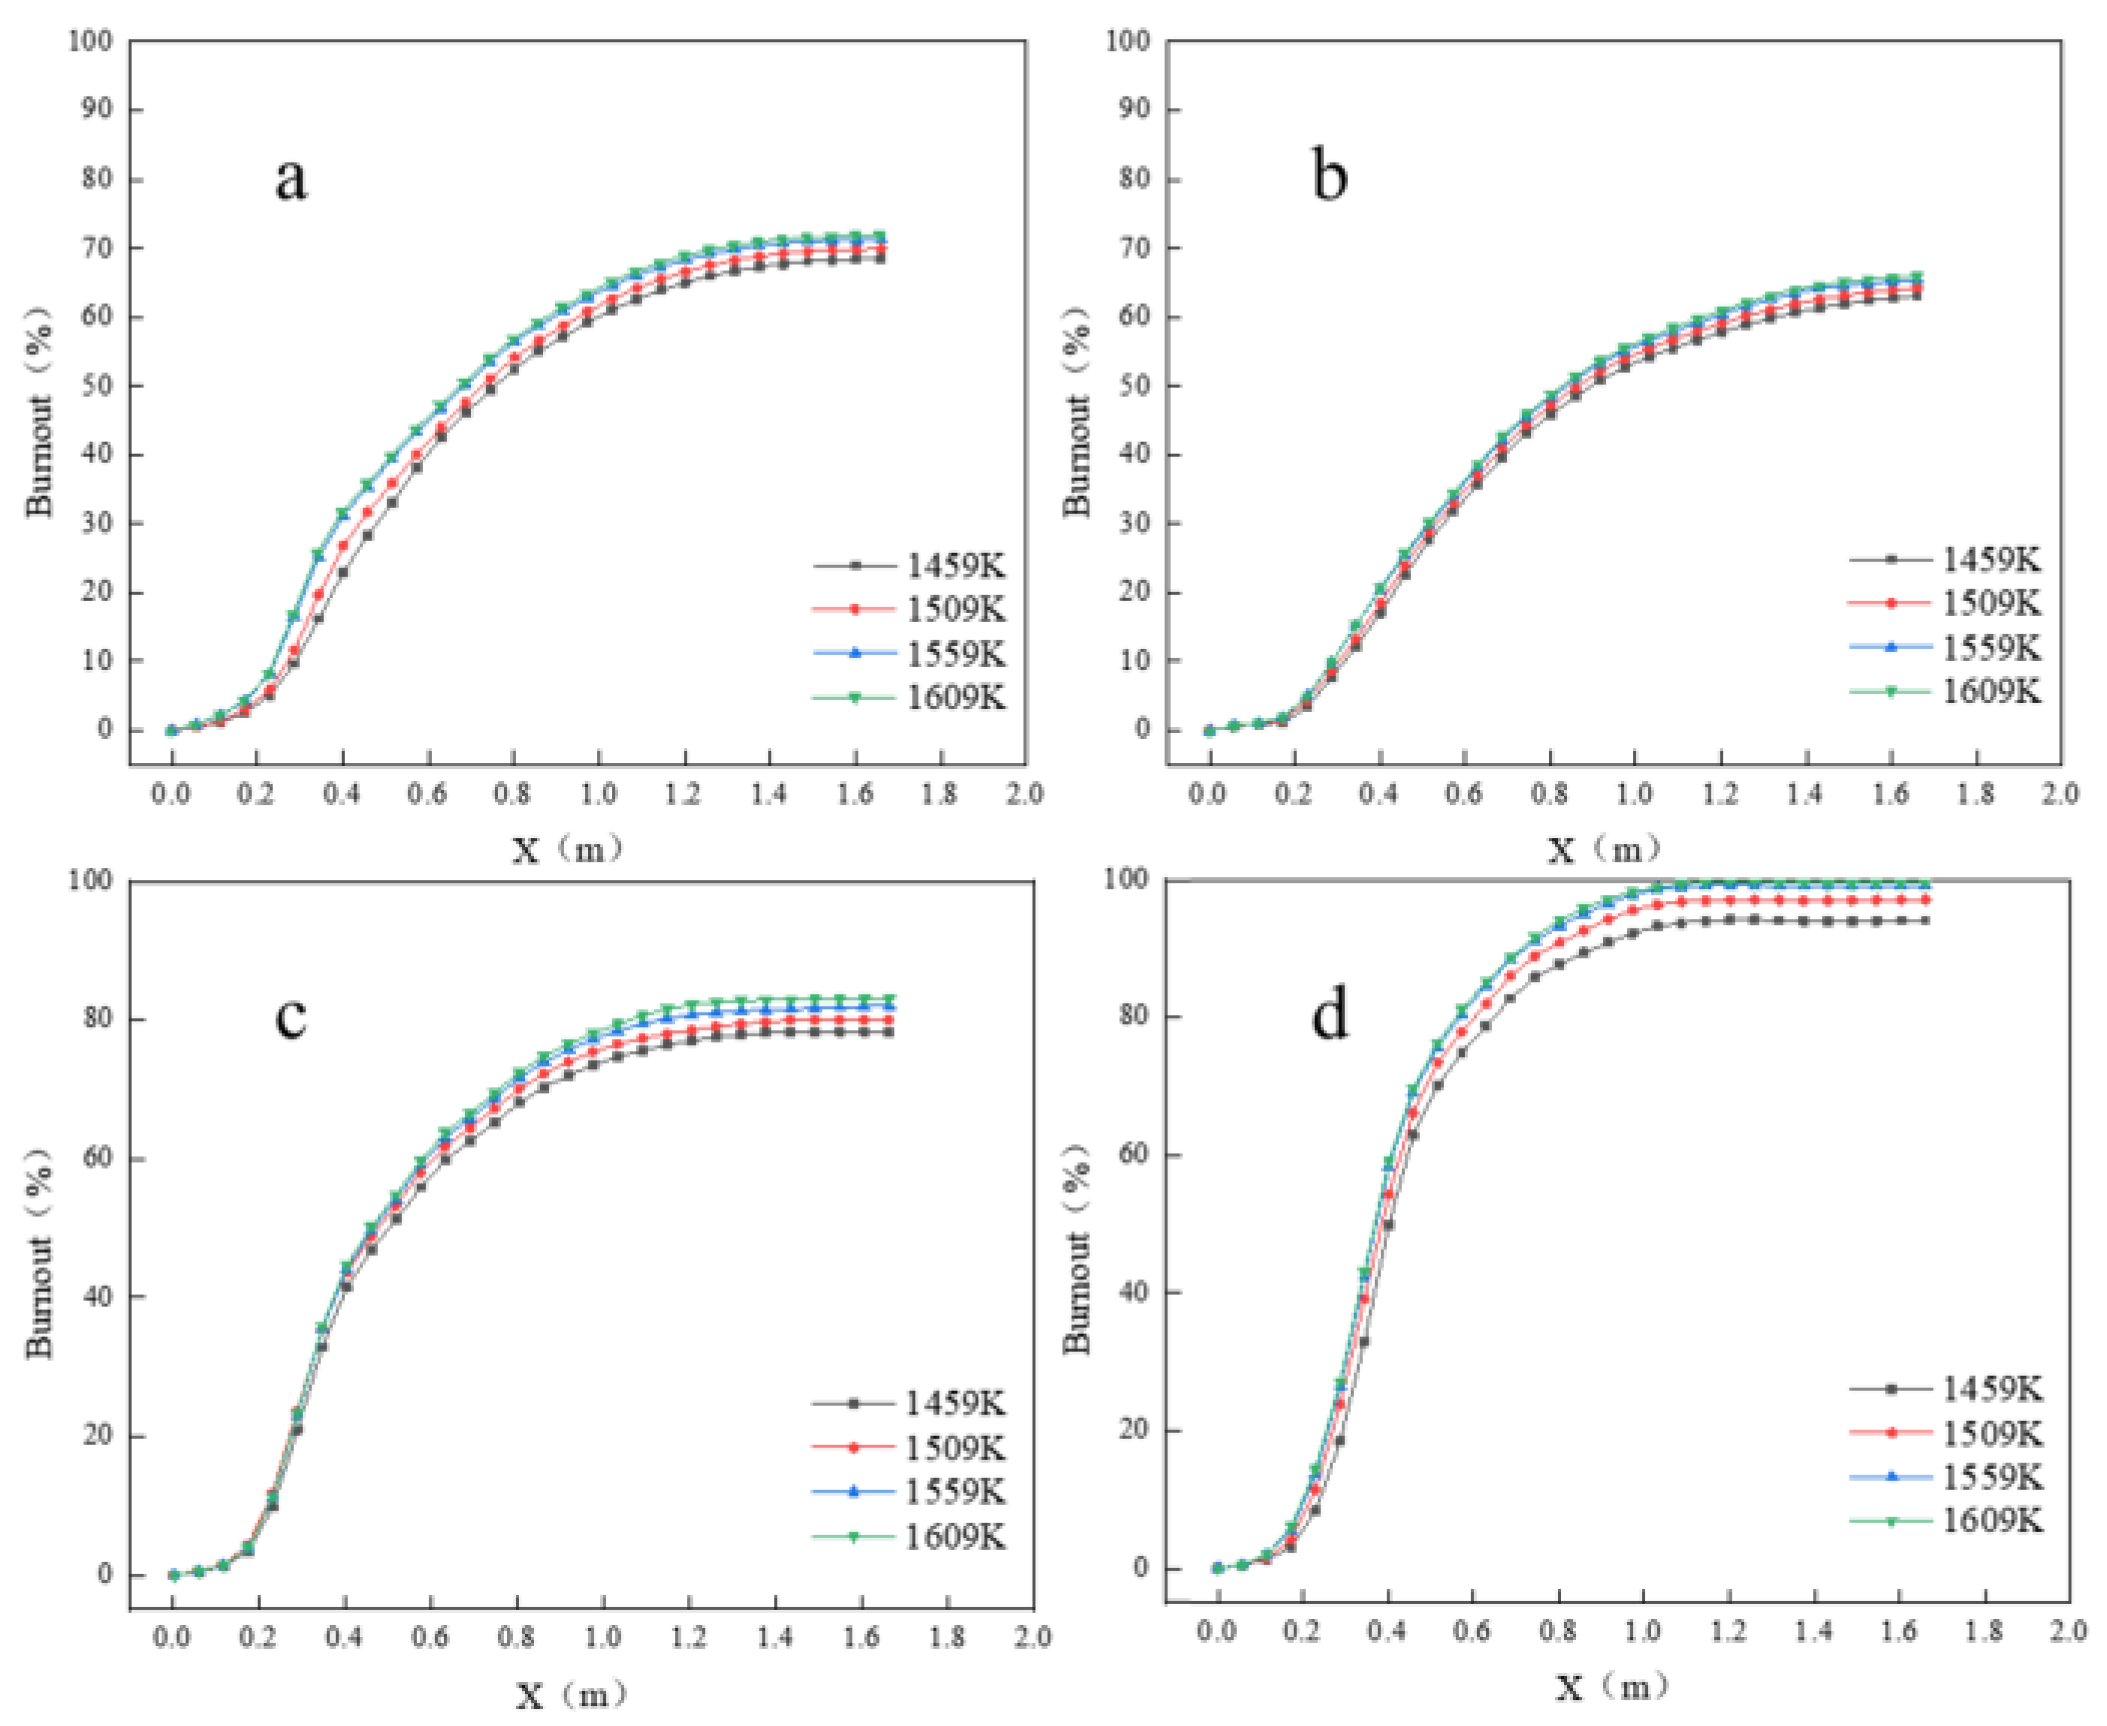
Figure 11 shows the variation of combustion exhaustion rate of blended coal and each coal type at different blast temperatures. Figure 11a shows that in the pre-combustion period when the volatile components are burned in large quantities, higher blast temperatures give higher burnout results. After the oxygen is consumed, the combustion exhaustion rate of all four blast temperatures slows down and increases from 1459 K to 1559 K, and the combustion exhaustion rate increases from 68.52% to 71.3%, which is a more obvious change. And from 1559 K to 1609 K, the burnout rate only increased by 0.65%. The optimal blast temperature of 1559 K, balancing burnout efficiency and cost, reflects sustainable development’s focus on economic feasibility alongside environmental benefits. Avoiding excessive temperature increases beyond this point prevents unnecessary energy consumption, minimizing resource waste, and aligning with the principles of efficient energy use in sustainable industrial systems.
Figure 11b shows the burnout rate curve of anthracite. Due to the lower volatile matter of anthracite, after spraying, the lance in the pre-combustion burnout rate is lower, and then due to the higher residual carbon, the dissolution reaction is not as deep as the other two types of coals. So, the overall view of the burnout rate of anthracite by the temperature of the smaller effect. In Figure 11c, the bituminous coal at 0.4 m combustion rate difference is obvious. This is due to the wind temperature bringing different heat, resulting in higher wind temperature conditions in the bituminous coal in the volatile components of the more intense combustion, this phenomenon is more obvious in the Figure 11d hydrochar combustion rate curve. Figure 11c,d shows that the burning rate of coal (hydrochar) reaches a plateau more quickly at higher wind temperatures compared to Figure 11a.

3.3. Analysis Results of Different Coal Dust Particle Sizes

Particle size mainly affects the ignition characteristics of particles. The ignition characteristics refer to the baseline characteristics of pulverized coal at the combustion stage, when the critical conditions for pulverized coal combustion are reached. Although the combustibility requirements of pulverized coal are generally the same, the ignition time varies, which leads to a change in the combustion efficiency of pulverized coal. In the comparison of pulverized coal samples with different particle sizes, the ignition times of pulverized coal with small particle size is shorter than that of pulverized coal with large particle size. This is due to the fact that the contact surface area of pulverized coal increases after refinement, which helps to improve the combustion speed. And the overall reduction of particle size will make the pulverized coal combustion characteristics enhanced. Therefore, in conjunction with the basic operating parameters and blast conditions of the Jingtang No. 1 blast furnace, simulations were carried out for the blended coal containing 75% anthracite, 15% bituminous coal, and 10% hydrochar with three different particle size distributions (90%, 70%, and 50% of particle size less than 80 um, respectively).
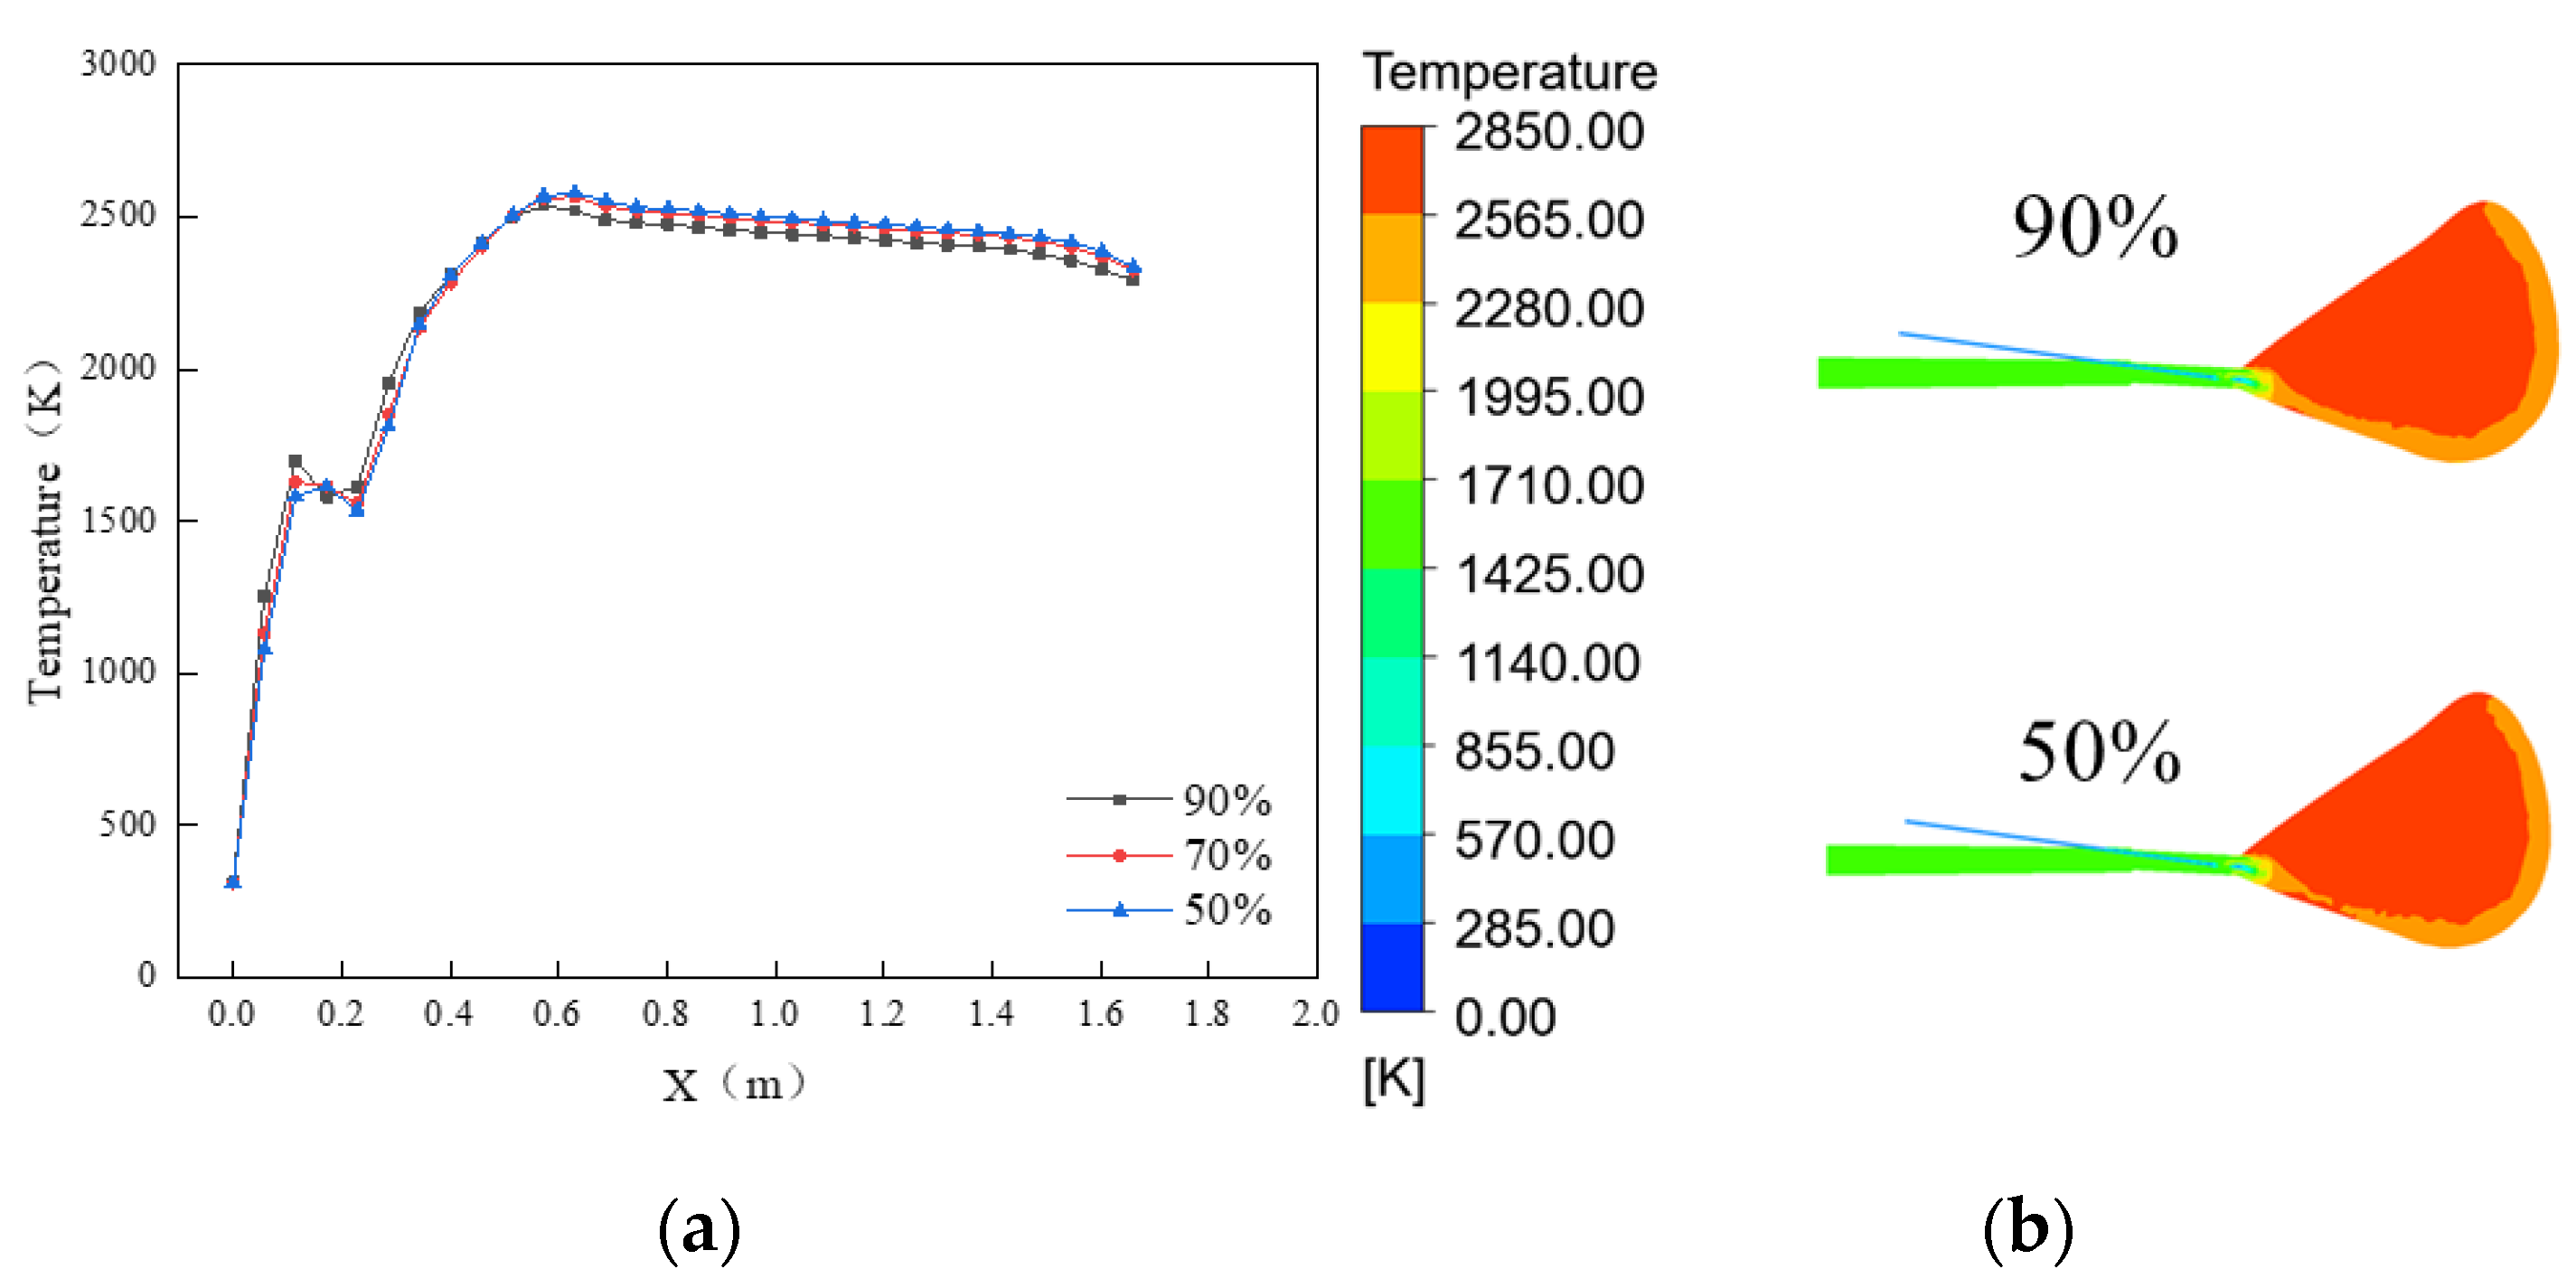
Figure 12 shows the temperature performance of the symmetric surface at the center of the model for different particle sizes. Figure 12a shows the temperature variation curves at the center of the coal plume, and the analysis shows that at the same location, where the blended coal with smaller average particle sizes obtained higher temperatures and reached the maximum temperature more quickly. The maximum temperatures that can be reached by the three particle sizes are 2531 K, 2569 K, and 2581 K, respectively, and with the increase in the average particle size, the maximum temperature increases gradually. This is because after the volatile fraction is burned, most of the oxygen is consumed, and the little remaining oxygen continues to react with the residual carbon. At this time, the residual carbon and CO2 react and absorb heat to generate CO. Due to dissolution, reaction of particles with larger particle sizes happens less than that of particles with smaller sizes, so its temperature continues to increase, resulting in a higher maximum temperature than that of particles with smaller particle sizes. Figure 12b shows the temperature cloud of the center section, and the analysis shows that the larger the average particle size, the higher temperature area inside the cyclotron zone increases slightly, and the temperature difference is less than 100 K in general.
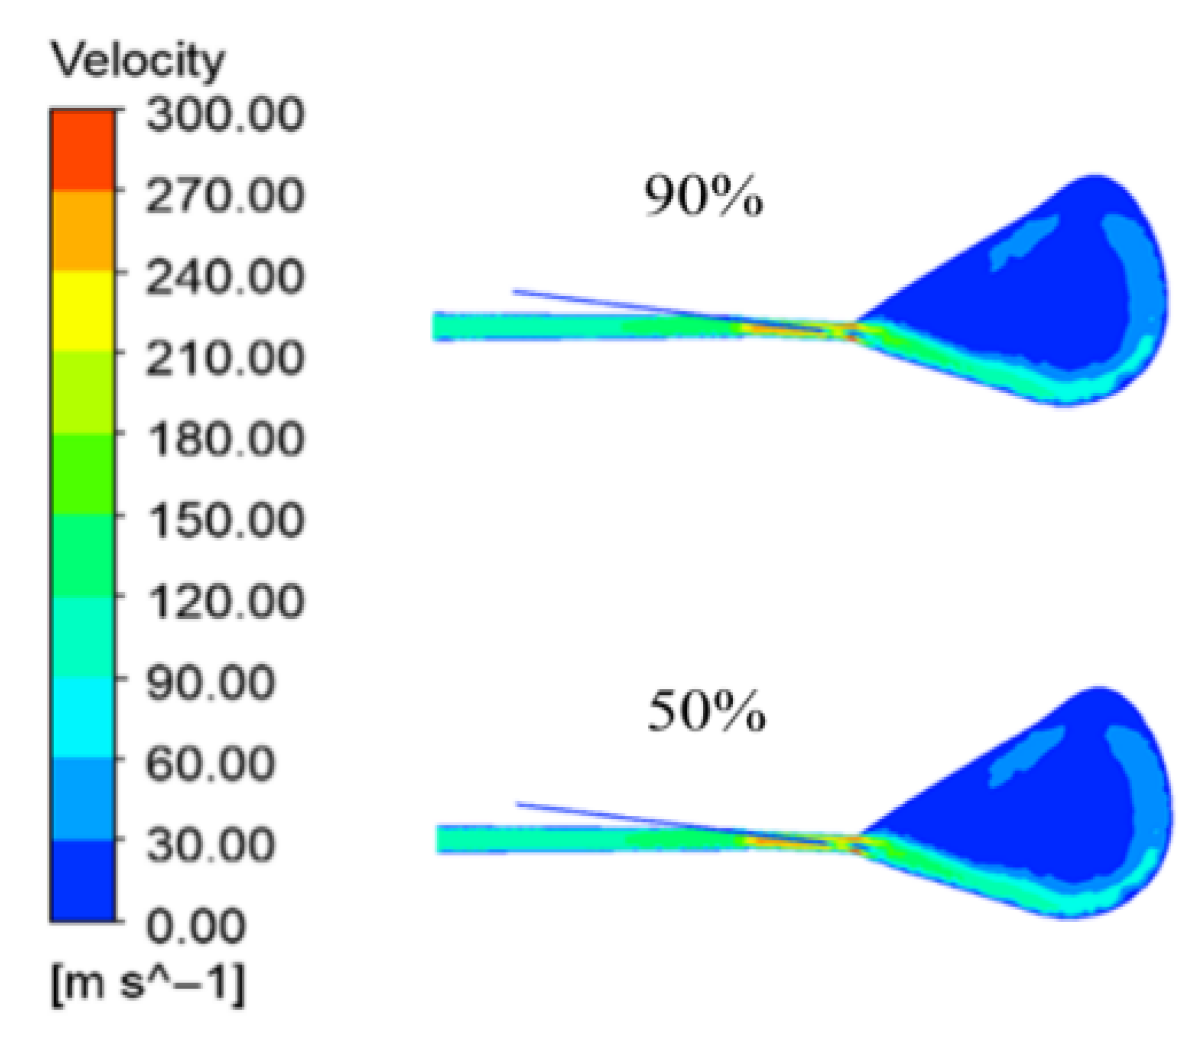
Figure 13 shows the velocity clouds for three different average particle sizes. The maximum velocities just out of the air outlet are 315.7 m/s, 310.4 m/s, and 306.5 m/s. The smaller the average particle size, the greater the maximum velocity in the pre-combustion phase, because the rapid combustion of volatile matter leads to an increase in temperature, which in turn leads to the expansion of the gas (the same reason for the reaction of the gas generation), resulting in a slightly greater velocity of the gas when the gas is spewed out of the air outlet. In the late cyclone area above, the high-speed area slightly expanded, the same reason and the influence of the blast temperature, the late average particle size of coal dust residual carbon is higher than the small particle size of coal dust, dissolution reaction expands the gas volume slightly, resulting in the upper part of the high-speed area being slightly larger.
Figure 14 shows the distribution cloud diagrams of CO, CO2, and O2 on the sym-metric surface at the center of different particle sizes, while Figure 15 illustrates the variation curves of major gas species along the coal plume centerline under varying particle diameters. Analysis of the cloud diagrams show that larger coal particle sizes correspond to higher CO2 mass fractions at the initial exit of the blowpipe. However, as coal particles combust within the swirl zone, the CO2 content in the coal plume at the swirl zone periphery decreases with increasing particle size, indicating that more CO2 undergoes reaction with residual carbon to generate CO. Correspondingly, the CO content of the coal plume with the smaller particle size at the edge of the gyratory zone is higher in the CO plots. Similarly, in the inner part of the gyratory zone, the oxygen is basically consumed, and the larger the particle size of the residual carbon of the coal plume, after consuming the oxygen, causes the dissolution reaction to proceed more slowly and to a lower extent compared with that of the coal plume with a smaller particle size. As shown in the cloud diagram, the larger the particle size of the pulverized coal combustion, the more CO2 content inside the cyclone area, the lower the CO content. When the temperature is high, the rate of reaction is mainly controlled by diffusion; when the temperature is low, the rate of reaction is mainly controlled by temperature.
Figure 16 shows the combustion rate of blended coal and each coal type with different particle sizes. The combustion exhaustion rates of the blended coal with three different particle size distributions are 69.96%, 68.8%, and 67.6%, respectively. It can be seen that as the proportion of small particle sizes decreases, the burnout rate gradually decreases. As the fuel particles are refined, the increase in specific surface area and the decrease in apparent activation energy are the main reasons for the increase in the burnout rate. This contributes to cleaner production. The low ash content of hydrochar further reduces pollutant emissions, supporting environmental sustainability. Figure 16a shows that in the pre-combustion period of blended coal, especially in the volatile fraction of intense combustion, the difference between the burnout rates of blended coal with different particle sizes is large. This is mainly due to the faster combustion of finer hydrochar. It can also be seen in Figure 16d, in the 0.2–0.4 m, that the difference between the burnout rates of hydrochar is large. However, the differences in their final combustion rates are not large, 97.3%, 96.28%, and 95.13%, respectively, which is because in the later dissolution reaction, the change in the particle size within a certain degree does not have much effect on the reaction of hydrochar. The overall difference between the burnup rates of anthracite and bituminous coal in Figure 16b,c is not significant, which is due to the relatively low volatile matter and the fact that the later residual carbon dissolution reaction mainly relies on the heat released before.
4. Conclusions

Based on the actual parameters of the Jingtang blast furnace and each kinetic equation, a three-dimensional model of single lance blowing pulverized coal was established. The temperature field, gas distribution, and combustion rate inside the model under different conditions are analyzed and discussed, and the main conclusions are as follows:
(1)
The wind temperature of 1509 K, coal ratio of 202 kg/tHM, oxygen enrichment rate of 7.2%, and gun outlet on the centerline of coal strand were selected as the basic working conditions to simulate the mixed coal combustion process. The airflow reaches a maximum value of 313.71 m/s at the air outlet, and the maximum temperature at the centerline of the coal strand is about 2531 K, and its blended coal combustion rate finally reaches 69.96%;
(2)
Oxygen enrichment rate has an important influence on pulverized coal combustion, especially when the coal ratio is too high. The temperature inside the gyratory zone increases significantly with the increase in oxygen enrichment rate, and the high-temperature zone gradually expands. For every 1% increase in oxygen enrichment rate, the maximum temperature of the centerline of the coal plume increases by 28 K, and the burnout rate increases by 1.12%;
(3)
Increasing the blast temperature makes the combustion of pulverized coal slightly earlier and promotes the temperature increase inside the gyratory zone. The change in blast temperature up to 1559 K is more obvious and raising the blast temperature after it is higher than 1559 K will not improve the burnout rate and the temperature of the cyclone zone, and it will increase the cost. For this blast furnace, the blast temperature around 1559 K is considered to be the benchmark temperature point to meet the efficiency of pulverized coal combustion;
(4)
The lower the proportion of small particle size, the larger the high temperature zone in the cyclotron area, and the higher the centerline temperature of the coal strand. As the fuel particles are refined, the specific surface area of the particles increases and the apparent activation energy decreases, and the combustion rate gradually increases;
(5)
Under the condition of keeping the volatile matter content basically unchanged, increasing the hydrochar ratio has little effect on the temperature field and the centerline temperature of the coal strand with the gyratory area, and the temperature difference is kept at 20 K. With the increase in the hydrochar ratio, the overall combustion exhaustion rate of pulverized coal gradually increases. Promoting the use of sustainable biomass energy is crucial to achieving long-term sustainable development in industry.

Author Contributions

X.N. and G.W. conceived the idea of this study. Z.R., G.K., H.Z., and J.W. collected and analyzed relevant data. Z.R. and G.K. prepared an initial draft of the paper. All authors have read and agreed to the published version of the manuscript.

Funding

This research was funded by the National Natural Science Foundation of China (No. 52174295) and China Baosteel Low-Carbon Fund (No. 202215; No.202305).

Institutional Review Board Statement

Not applicable.

Informed Consent Statement

Not applicable.

Data Availability Statement

The data presented in this study are available on request from the corresponding author due to privacy.

Conflicts of Interest

Author Haibin Zhang was employed by the company Beijing Shougang Corporation Ironmaking Division. The remaining authors declare that the research was conducted in the absence of any commercial or financial relationships that could be construed as a potential conflict of interest.

References

  1. An, R.; Yu, B.; Li, R.; Wei, Y.-M. Potential of energy savings and CO2 emission reduction in China’s iron and steel industry. Appl. Energy 2018, 226, 862–880. [Google Scholar] [CrossRef]
  2. Wang, H.; Ping, X.; Zhou, J.; Li, X.; Lu, L. Review and prospect of green development for Chinese steel industry. Iron Steel 2023, 58, 8–18. [Google Scholar]
  3. Stephan, A.K. Standardized battery reporting guidelines. Joule 2021, 5, 1–2. [Google Scholar] [CrossRef]
  4. Ren, L.; Zhou, S.; Peng, T.; Ou, X. A review of CO2 emissions reduction technologies and low-carbon development in the iron and steel industry focusing on China. Renew. Sustain. Energy Rev. 2021, 143, 110846. [Google Scholar] [CrossRef]
  5. Liu, Q.; Zhang, F. Research process of carbon reduction and CO2 resource technology utilization in iron and steel industry. Iron Steel 2024, 59, 13–24. [Google Scholar]
  6. Zhang, Q.; Xu, J.; Wang, Y.; Hasanbeigi, A.; Zhang, W.; Lu, H.; Arens, M. Comprehensive assessment of energy conservation and CO2 emissions mitigation in China’s iron and steel industry based on dynamic material flows. Appl. Energy 2018, 209, 251–265. [Google Scholar] [CrossRef]
  7. Zhang, Q.; Tian, S.S.; Shen, J.L. Roadmap and timetable for achieving carbon peak and carbon neutrality of China’s iron and steel industry. Iron Steel 2023, 58, 59–68. [Google Scholar]
  8. Zhao, J.; Zuo, H.; Wang, Y.; Wang, J.; Xue, Q. Review of green and low-carbon ironmaking technology. Ironmak. Steelmak. 2020, 47, 296–306. [Google Scholar] [CrossRef]
  9. Kuang, S.; Li, Z.; Yu, A. Review on modeling and simulation of blast furnace. Steel Res. Int. 2018, 89, 1700071. [Google Scholar] [CrossRef]
  10. Sahu, S.; Mukherjee, A.; Kumar, M.; Adak, A.; Sarkar, P.; Biswas, S.; Tiwari, H.; Das, A.; Banerjee, P. Evaluation of combustion behaviour of coal blends for use in pulverized coal injection (PCI). Appl. Therm. Eng. 2014, 73, 1014–1021. [Google Scholar] [CrossRef]
  11. Cai, D.W.; Chen, Q.Y.; Pan, J.; Zhu, D.Q.; Yang, C.C. Research status of low carbon smelting for metallized burden in blast furnace. China Metall. 2024, 34, 9–20. [Google Scholar]
  12. Steer, J.M.; Marsh, R.; Greenslade, M.; Robinson, A. Opportunities to improve the utilisation of granulated coals for blast furnace injection. Fuel 2015, 151, 40–49. [Google Scholar] [CrossRef]
  13. Zhang, F.M.; Liu, Q.M. Development and understanding on low carbon technology based on BF-BOF steel manufacturing processes. China Metall 2023, 33, 1–17. [Google Scholar]
  14. Zhang, L.K.; Peng, X.; Wang, J.S.; Zuo, H.B.; Wang, G.; Xue, Q.G.; She, X.F. Numerical simulation study on pulverized coal combustion behavior under different injection mechanisms in oxygen blast furnace. Energy Metall. Ind. 2025, 44, 3–8. [Google Scholar]
  15. Zhang, F.M.; Jie, J.X.; Yin, R.Y. Analysis of dissipation structure in ironmaking section of steel manufacturing process. Iron Steel 2022, 57, 1–9. [Google Scholar]
  16. Shi, Y.C. Overview of biomass energy development in China. Smart Power 2017, 45, 1–5. [Google Scholar]
  17. Hu, Z.W.; Zhang, J.L.; Zuo, H.B.; Liu, Z.J.; Yang, T.J. Applications and prospects of bio-energy in ironmaking process. In Proceedings of the 2010 the Second China Energy Scientist Forum, Xuzhou, China, 18–19 October 2010; Scientific Research Publishing: Irvine, CA, USA, 2010; Volume 1, pp. 708–713. [Google Scholar]
  18. Shen, Y.; Guo, B.; Yu, A.; Maldonado, D.; Austin, P.; Zulli, P. Three-dimensional modelling of coal combustion in blast furnace. ISIJ Int. 2008, 48, 777–786. [Google Scholar] [CrossRef]
  19. Launder, B.E.; Spalding, D.B. The numerical computation of turbulent flows. In Numerical Prediction of Flow, Heat Transfer, Turbulence and Combustion; Pergamon: Oxford, UK, 1983; pp. 96–116. [Google Scholar]
  20. Silaen, A.; Wang, T. Effect of turbulence and devolatilization models on coal gasification simulation in an entrained-flow gasifier. Int. J. Heat Mass Transf. 2010, 53, 2074–2091. [Google Scholar] [CrossRef]
  21. Wijayanta, A.T.; Alam, S.; Nakaso, K.; Fukai, J.; Kunitomo, K.; Shimizu, M. Numerical study on pulverized biochar injection in blast furnace. ISIJ Int. 2014, 54, 1521–1529. [Google Scholar] [CrossRef]
  22. Yu, A.B.; Xu, B.H. Particleâ scale modelling of gasâ solid flow in fluidisation. J. Chem. Technol. Biotechnol. Int. Res. Process Environ. Clean Technol. 2003, 78, 111–121. [Google Scholar]
  23. Wijayanta, A.T.; Alam, S.; Nakaso, K.; Fukai, J.; Kunitomo, K.; Shimizu, M. Combustibility of biochar injected into the raceway of a blast furnace. Fuel Process. Technol. 2014, 117, 53–59. [Google Scholar] [CrossRef]
  24. Zhang, C.L.; Zhang, J.L.; Xu, R.S.; Zheng, A.Y.; Zhu, J.F.; Li, T. Numerical investigation of hydrogen-rich gas and pulverized coal injection in the raceway of a blast furnace with lower carbon emissions. Fuel 2024, 356, 129462. [Google Scholar] [CrossRef]
Figure 1. Schematic of the model.
Sustainability 17 08122 g001
Figure 2. Temperature performance at various oxygen enrichment rates. (a) Temperature variation at the center of the coal plume; (b) temperature distribution at the center symmetric surface.
Sustainability 17 08122 g002
Figure 3. Velocity cloud for centrosymmetric surfaces with different oxygen enrichment rates.
Sustainability 17 08122 g003
Figure 4. Cloud map of the distribution of major gas content (from left to right, CO, CO2, O2).
Sustainability 17 08122 g004
Figure 5. Variation of main gas content in the center of the coal plume under different oxygen enrichment rate conditions.
Sustainability 17 08122 g005
Figure 6. Pulverized coal combustion rates at different oxygen enrichment rates. (a) Blended coal; (b) anthracite; (c) bituminous coal; (d) hydrochar.
Sustainability 17 08122 g006
Figure 7. Temperature performance at different blast temperatures. (a) Coal plume centerline temperature variation; (b) Center symmetric surface temperature cloud.
Sustainability 17 08122 g007
Figure 8. Velocity cloud of the centrosymmetric surface at different blast temperatures.
Sustainability 17 08122 g008
Figure 9. Cloud map of the distribution of the main gas contents (from left to right, CO, CO2, O2).
Sustainability 17 08122 g009
Figure 10. Variation of major gas content in the center of the coal plume at different blast temperatures.
Sustainability 17 08122 g010
Figure 11. Coal dust burnout rates at different blast temperatures. (a) Blended coal; (b) anthracite; (c) bituminous coal; (d) hydrochar.
Sustainability 17 08122 g011
Figure 12. Temperature performance at different particle sizes. (a) Coal plume centerline temperature variation; (b) center symmetric surface temperature cloud.
Sustainability 17 08122 g012
Figure 13. Centrosymmetric surface velocity cloud for different particle sizes.
Sustainability 17 08122 g013
Figure 14. Cloud map of the distribution of major gas content (CO, CO2, O2 from left to right).
Sustainability 17 08122 g014
Figure 15. Variation of main gas content in the center of the coal plume at different blast temperatures.
Sustainability 17 08122 g015
Figure 16. Coal combustion rate of pulverized coal at different particle sizes. (a) Blended coal; (b) anthracite; (c) bituminous coal; (d) hydrochar.
Sustainability 17 08122 g016
Table 1. k-ε equation, N-S equation, and continuous phase equations.
EquationEquation Expression
k equation ρ k t + μ k = μ + μ t σ k k + G k + G b ρ ε Y M
ε equation ρ ε t + μ ε = μ + μ t σ ε ε + C 1 ε ε k G k + C 3 ε G b C 2 ε ρ ε 2 k
N-S equation ρ μ t + μ μ = ρ + τ + ρ g
Mass equation ( ρ U ) = n p m ˙
Material ρ U Y i Γ i + μ t σ Y i Y i = W i
Momentum equation ( ρ U U ) [ ( μ + μ t ) ( U + ( U ) T ) ] = p + 2 3 ρ k + n p f D
Energy equation ρ U H λ C p + μ t σ H = n p q
Turbulent kinetic energy ρ U k μ + μ t σ k k = ( P k ρ ε )
Turbulent dissipation rate ρ U ε μ + μ t σ ε ε = ε k ( C 1 P k C 2 ρ ε )
Table 2. Discrete phase equations.
EquationEquation Expression
Mass equation d m p d t = m ˙
Momentum equation m p d U p d t = f D ;
f D = 1 8 π d p 2 ρ C D | U U p | ( U U p )
Energy equation m p C p d T p d t = q ;
q = π d p λ N u ( T g T p ) + d m p d t H r e a c + A p ε p ( π I σ B T p 4 )
Table 3. Equations involved in heat transfer between particles and gas phase.
EquationEquation Expression
Internal heat conduction equation for particles (internal mechanism of heat transfer on convex surfaces) ρ p c p , p T p ( r , t ) t = 1 r 2 r r 2 k p T p ( r , t ) r + Q c h e m
Convective heat transfer equation between particles and gas phase (interface mechanism of heat transfer on convex surfaces) q c o n v = h A p ( T g T p , s )
Quality transfer rate m ˙ = 4 π r p 2 D e f f ρ g Y i | r = r p
Heat flux contribution of mass transfer q m a s s = m ˙ ( h v a p + Δ H c h e m )
Total heat balance equation (total heat transfer between particles and gas phase) k p T p r | r = r p = q c o n v + q r a d + q m a s s
Table 4. Reaction equations and kinetic parameters of particles.
Equation of a Chemical ReactionPrefactorReaction Activation Energy
C α H β O γ N φ + a O 2 b C O + c H 2 O + d N 2 2.10 × 10112.03 × 108
C O + 0.5 O 2 C O 2 2.20 × 10121.67 × 108
C ( s ) + 0.5 O 2 CO 1.36 × 1061.30 × 108
C ( s ) + 0.5 O 2 CO 6.78 × 1041.63 × 108
C ( s ) + H 2 O C O + H 2 8.55 × 1041.40 × 108
Table 5. Blast furnace operating parameters.
ParametersNumerical ValueParametersNumerical Value
Blast furnace volume/m35500Carrier gas compositionN2
Utilization factor/t/(m3·d)2.54Pulverized coal temperature/K300
Coal ratio/kg/tHM202Air volume/m3/min8300
Wind pressure/KPa460Number of air outlets/pcs42
Blast temperature/K1509Oxygen enrichment ratio7.2%
Table 6. Industrial and elemental analysis of each coal type.
Coal TypeIndustrial Analysis (wt%)Elemental Analysis (wt%)Calorific Value/MJ/kg
AdVdFCd * NdCdHdSdOd *HHV
Anthracite10.3411.1278.541.4481.353.40.363.1230.61
Bituminous coal5.933.360.80.9772.394.650.2315.8728.94
Hydrochar2.4258.1339.450.3563.765.350.0528.0825.61
Note: V: volatile matter; A: ash; FC: fixed carbon, d: air-dried basis; *: by difference.
Table 7. Comparison of actual production and simulation results (without hydrochar).
ParametersUnitActualThis Study
Comparison of resultsFocus temperatureK25952653
Wind speedm/s299.90300.58
Table 8. Comparison of previous research results with the results of this study.
ParametersUnitThis StudyPredecessors [24]
Blower parametersCoal powder injection ratekg/tHM202170
Airflowm3/min83008000
Wind temperatureK15091473
Oxygen enrichment rate%7.26
Comparison of resultsFocus temperatureK26532617
Peak speedm/s303301
Disclaimer/Publisher’s Note: The statements, opinions and data contained in all publications are solely those of the individual author(s) and contributor(s) and not of MDPI and/or the editor(s). MDPI and/or the editor(s) disclaim responsibility for any injury to people or property resulting from any ideas, methods, instructions or products referred to in the content.