Article

Is There a Historical Relationship Between Urban Growth and Resilience Loss? The Case of Floods in Belo Horizonte (Brazil)

by
Sergio Salazar-Galán
1,*,
Amanda Granha Magalhães Gomes e Silva
2,
Domingo Sánchez-Fuentes
3 and
Emilio J. Mascort-Albea
4
1
Laboratorio de Historia de los Agroecosistemas, Universidad Pablo de Olavide, Carretera de Utrera km 1, 41013 Sevilla, Spain
2
Departamento de Geografia, Universidade Federal de Minas Gerais, Av. Pres. Antônio Carlos, 6627-Pampulha, Belo Horizonte 31270-901, Brazil
3
Departamento de Urbanística y Ordenación del Territorio, Universidad de Sevilla, Avda. Reina Mercedes 2, 41012 Sevilla, Spain
4
Departamento de Estructuras de Edificación e Ingeniería del Terreno, Universidad de Sevilla, Avda. Reina Mercedes 2, 41012 Sevilla, Spain
*
Author to whom correspondence should be addressed.
Sustainability 2025, 17(18), 8110; https://doi.org/10.3390/su17188110
Submission received: 21 July 2025 / Revised: 5 September 2025 / Accepted: 8 September 2025 / Published: 9 September 2025

Abstract

Reducing the negative effects associated with floods in cities constitutes one of the highest-priority contemporary social challenges on the global sustainability agenda. In general, most historical studies focus on the consequences, but not on the causes of the phenomenon, which is essential for moving towards sustainable and resilient territories. The aim of this research is to quantify the effect that urban expansion has exerted on floods, taking the city of Belo Horizonte as a critical and representative case study. To this end, an integrative, qualitative, and quantitative approach has been developed, based on previous studies and on distributed hydrological modelling for the period 1940–2024. The results show that urban growth has contributed to a 7%, 14%, and 21% increase in the first three quartiles of annual floods. Likewise, the increase in the magnitude and frequency of the floods is also attributable, since it is more noticeable in the events of higher frequency than in those of lower frequency, in a range from 15% to 7%. The above results show the way in which the application of quantitative knowledge derived from the environmental history is highly useful for decision-making regarding the measures required to increase resilience, considering the possible effects of climate change. Thus, the recovery of the infiltration capacity of the soil constitutes a priority measure to reverse the effect that urban growth has exerted on the hydrological cycle.

1. Introduction

Throughout the history of the evolution of human civilisations, the establishment of many of them close to a natural water system (river, wetland, sea) is related to the natural necessity for sustaining a wide variety of ecosystem services, such as fertile land for crops, water for drinking and cleaning, means of transport, trade, and religious practices. Civilisations that flourished around great rivers, such as the Huang He, Indus, Nile, Tigris, and Euphrates, had to cope with river dynamics, including periodic floods, which they utilised for agricultural production through control systems in the form of dams, canals, and reservoirs [1]. In what is now Colombian territory, in the so-called “Momposina depression”, there are also millenary traces of adaptive flood management with hydraulic control technologies for agricultural production and also for the settlement of indigenous communities such as the Zenú and Malibú [2].
While there are studies documenting extraordinary floods in which catastrophe was triggered in times of great riverine civilisations, such as the case of the Huang He [3], floods as a social problem, rather than an opportunity, are due to the social construction of risk in contemporary times. All of this is a consequence of a co-evolutionary process associated with the growth of urban settlements and the new urban–rural paradigms that emerged after the expansion of the values of capitalism [4]. Societies influence flood frequency by introducing control measures; meanwhile, such changes modulate social development in floodplains, which, in turn, alter the processes associated with flood generation [5]. Control measures, such as levees to protect floodplains, reduce the frequency of flooding and create a sense of security that promotes more intense economic development near the river. Nevertheless, these actions may even increase flood risk since protection from frequent flooding reduces risk perception and increases vulnerability to low-probability but high-impact events [6]. In fact, the statistics on disasters associated with floods due to failures in hydraulic infrastructures such as dykes in the 20th century confirm this [7].
The increased exposure of people in flood-prone areas worldwide [8] can be exacerbated by the effect of urbanisation on the hydrological cycle itself through changes in the natural land cover into impervious surfaces. This land cover change produces effects such as soil sealing (i.e., destruction or covering of the ground by an impermeable material), reduction in infiltration, an increase in surface runoff, and higher peak flood flows [9]. These processes may be more pronounced in regions where the effects of climate change may lead to larger and more frequent precipitation events. Such physical conditions have differentiated effects depending on the vulnerability of the exposed population. For example, the expected consequences of floods in Latin America and the Caribbean could be more intense due to the irregular and exponential urbanisation of flood plains, land degradation due to anthropogenic activities in watersheds, lack of preparedness and resilience to emergency response, persistent poverty, and inefficient public policies and infrastructure problems [10].
As presented by Schiermeier [11] from the analysis of more than 170 publications of climate-change attribution studies on 190 extreme weather events of the nearly 40 storm/flood events, just over half can be attributed to an increase in magnitude or frequency due to anthropogenic climate change. Lahsen and Ribot [12] stated that the blaming of disasters on climate change, as is the case with many public policy figures, can be misleading since they are rooted in pre-existing territorial fragilities and inequalities. For this reason, a multi-causal analysis of climate-related disasters is necessary to illuminate a broader range of means to reduce damages associated with climate change and extreme weather events. As recently concluded from a systematic literature review, the main challenge for urban flood management is to understand the origins and causes of floods, and not to focus only on the impacts, as it has been common so far [13]. Sharing this innovative perspective, this research proposes the need for the systematic use of historical information on the territories as an essential factor in analysing their specific vulnerabilities and strengths.
Accordingly, environmental history, conceived as a sustainable science [14], can help to understand the society–nature coevolution. In this case, it should help to elucidate the origins of the increase in flooding in cities from multi-causal analyses to bring sound scientific information for the basis of appropriate decision-making regarding future adaptation priorities to increase urban resilience. Although Latin American environmental history may already have reached a state of maturity [15], the analysis of the causes of floods from a historical quantitative perspective remains very scarce, and this exemplifies one of the methodological innovations that this research aims to provide. Some regional studies [16,17,18] identify the growing settlement of vulnerable populations in flood-prone areas as one of the causes of flood disasters in Latin American cities. This points to one dimension of flood risk (vulnerability/impacts), losing sight of the other dimension (hazard), which is dynamic in terms of historical interactions between land uses and climate. In the same direction, there are several historical studies in specific cities of that region [19,20,21,22,23], all of them contributing from qualitative approaches and mainly focusing on the vulnerability dimension. In this way, new studies from the field of environmental history are needed that also address the geophysical dimension of the phenomenon, which constitutes a cognitive gap that scientific efforts should aim to fill.
To the best of our knowledge, long-term historical multi-causal studies of floods in Latin American cities involving quantitative analyses have hitherto been non-existent. This paper, therefore, aims to quantitatively identify the differentiated effects of two of the main changes in the forcings on the behaviour of floods that cause fluvial flooding: land use change and climate change. To achieve this objective, the proposed approach combines qualitative and quantitative information to identify the main geophysical processes that have contributed to increasing floods throughout contemporary history. This novel proposal has been tested in the city of Belo Horizonte as a representative case study of Latin American cities.
The selection of a Brazilian case study enables a representative case to be analysed of a Latin American country with one of the highest rates of population and economic growth. Furthermore, Belo Horizonte is one of the most important cities in the country (the sixth most populated [24]) and the first modern planned capital whose emphasis on land speculation led to the establishment of Brazil’s first favelas in its surroundings [25]. The city was planned within the drainage area of the Arrudas catchment [26] and mainly around its river valley, as can be seen in the planned city map [27]. Despite the interventions of canalisation of the drainage network undertaken since the 1920s for “flood control”, such a phenomenon remains frequent, and has even increased in recent years [26], reflecting that the paradigm of hydraulic infrastructure is failing, as is occurring in other Brazilian cities such as Sao Paulo [28], Latin American cities [10,21], or worldwide [7]. Then, are the causes of the floods being properly considered over time? Are designers and decision-makers considering the co-evolution of the hydrological cycle and the city growth?
This article aims to answer the above questions by filling the gap identified in the scientific literature. There are several qualitative historical works that reflect the changes in the drainage network and their relationship with population growth, and the accelerated urbanisation process of the 20th century in Belo Horizonte [29,30,31,32]. However, the identification of the urbanising effect on the hydrological cycle has yet to be quantified, while the possible effect that a change in climate may also be having on this phenomenon has not been identified. This is essential to understand the main mechanisms that generate flood flows over time and thus shed light on the priorities for action in terms of measures for flood hazard reduction to increase urban sustainability and contribute to moving forward a socio-ecological resilience [33].
As was stated by Zevenbergen et al., the engineering resilience, understood as an outcome focused on flood hazard mitigation based on design and technologies, assumes that the system remains constant over time, which is not true for floods [33]. In fact, historical hydraulic interventions have been shown to be inefficient in managing floods in many cities in the world [7], which may reflect a loss of resilience due to the belief that engineering designs would reduce flooding in the city, losing perspective on the causes of floods, and indeed increasing the flood risk [5]. Then, novel approaches would be useful to understand the origin of urban floods, considering both the history of the city’s occupation and the political responses of its government, together with the physiographic characteristics of the watersheds [34]. In this respect, the present work is an innovative contribution that involves an integrative, qualitative, and quantitative approach. We introduced a distributed hydrological modelling for the historical period of analysis, to consider the effect of the urbanisation process throughout history, along with the main physiographic and hydroclimatic characteristics of the Arrudas catchment.
The rest of the article is organised as follows. The Section 2 gives a description of the case study, while the Section 3 describes the methodology proposed and applied to the case study. The Section 4 presents the results with their respective discussion in the light of the state of the art. The Section 5 presents the synthesis, while the last section lists the bibliographical references employed.

2. Case Study

As mentioned above, Belo Horizonte was the first modern city designed in Brazil, built on part of the drainage area of the “Ribeirão Arrudas” and mainly on its floodplain. Given that the phenomenon to be analysed is related to the main hydrological processes associated with floods (increase in peak flow) until flooding occurs (overflowing of the main channel and flooding of surrounding areas that are normally dry), the basic unit of analysis must, therefore, be taken as the catchment. In this respect, the case study herein is the “Ribeirão Arrudas” catchment, whose drainage area is at present occupied by the cities of Belo Horizonte (79%), Contagem (14%), and Sabará (7%). Figure 1 shows the delimitation of the Arrudas catchment within the “Rio das Velhas” basin. The coloured polygons in Figure 1 highlight the main river basins in Brazil (top centre), one of which is the “Rio das Velhas” (black square). Also, in Figure 1 (top right), the coloured polygons are the 23 strategic landscape units for water management in the central region of the state of Minas Gerais, Brazil, according to the “Sistema Nacional de Gestão de Recursos Hídricos”, one of which is the “Ribeirão Arrudas” (black square). This unit has an area of 228.37 km2 and a population of 1,244,620, with only 388 inhabitants considered rural. The Arrudas unit is only second to the “Ribeirão do Onça” unit in terms of being the catchment with the highest population density in the Rio das Velhas basin [35].
The headwaters of the Arrudas are located on the slopes of the Serra do Rola Moça, in the Barreiro region, and are formed from the confluence of the Córregos do Jatobá and Barreiro. Due to the geological conditions of the area, with granite gneiss on the left bank and metasediments on the right-hand side bank, there is an asymmetry in the development of the alluvial valley of the Arrudas, with the right-hand side bank being more extensive and the left bank more restricted. Due to the relief present in the catchment, the rainfall has a strong orographic character with high concentrations at the headwaters of the Serra do Curral. Furthermore, given the high slope gradients at the headwaters [31], there is a susceptibility to high velocities in the process of translation of surface runoff in the catchment, being a key factor in the generation of floods.
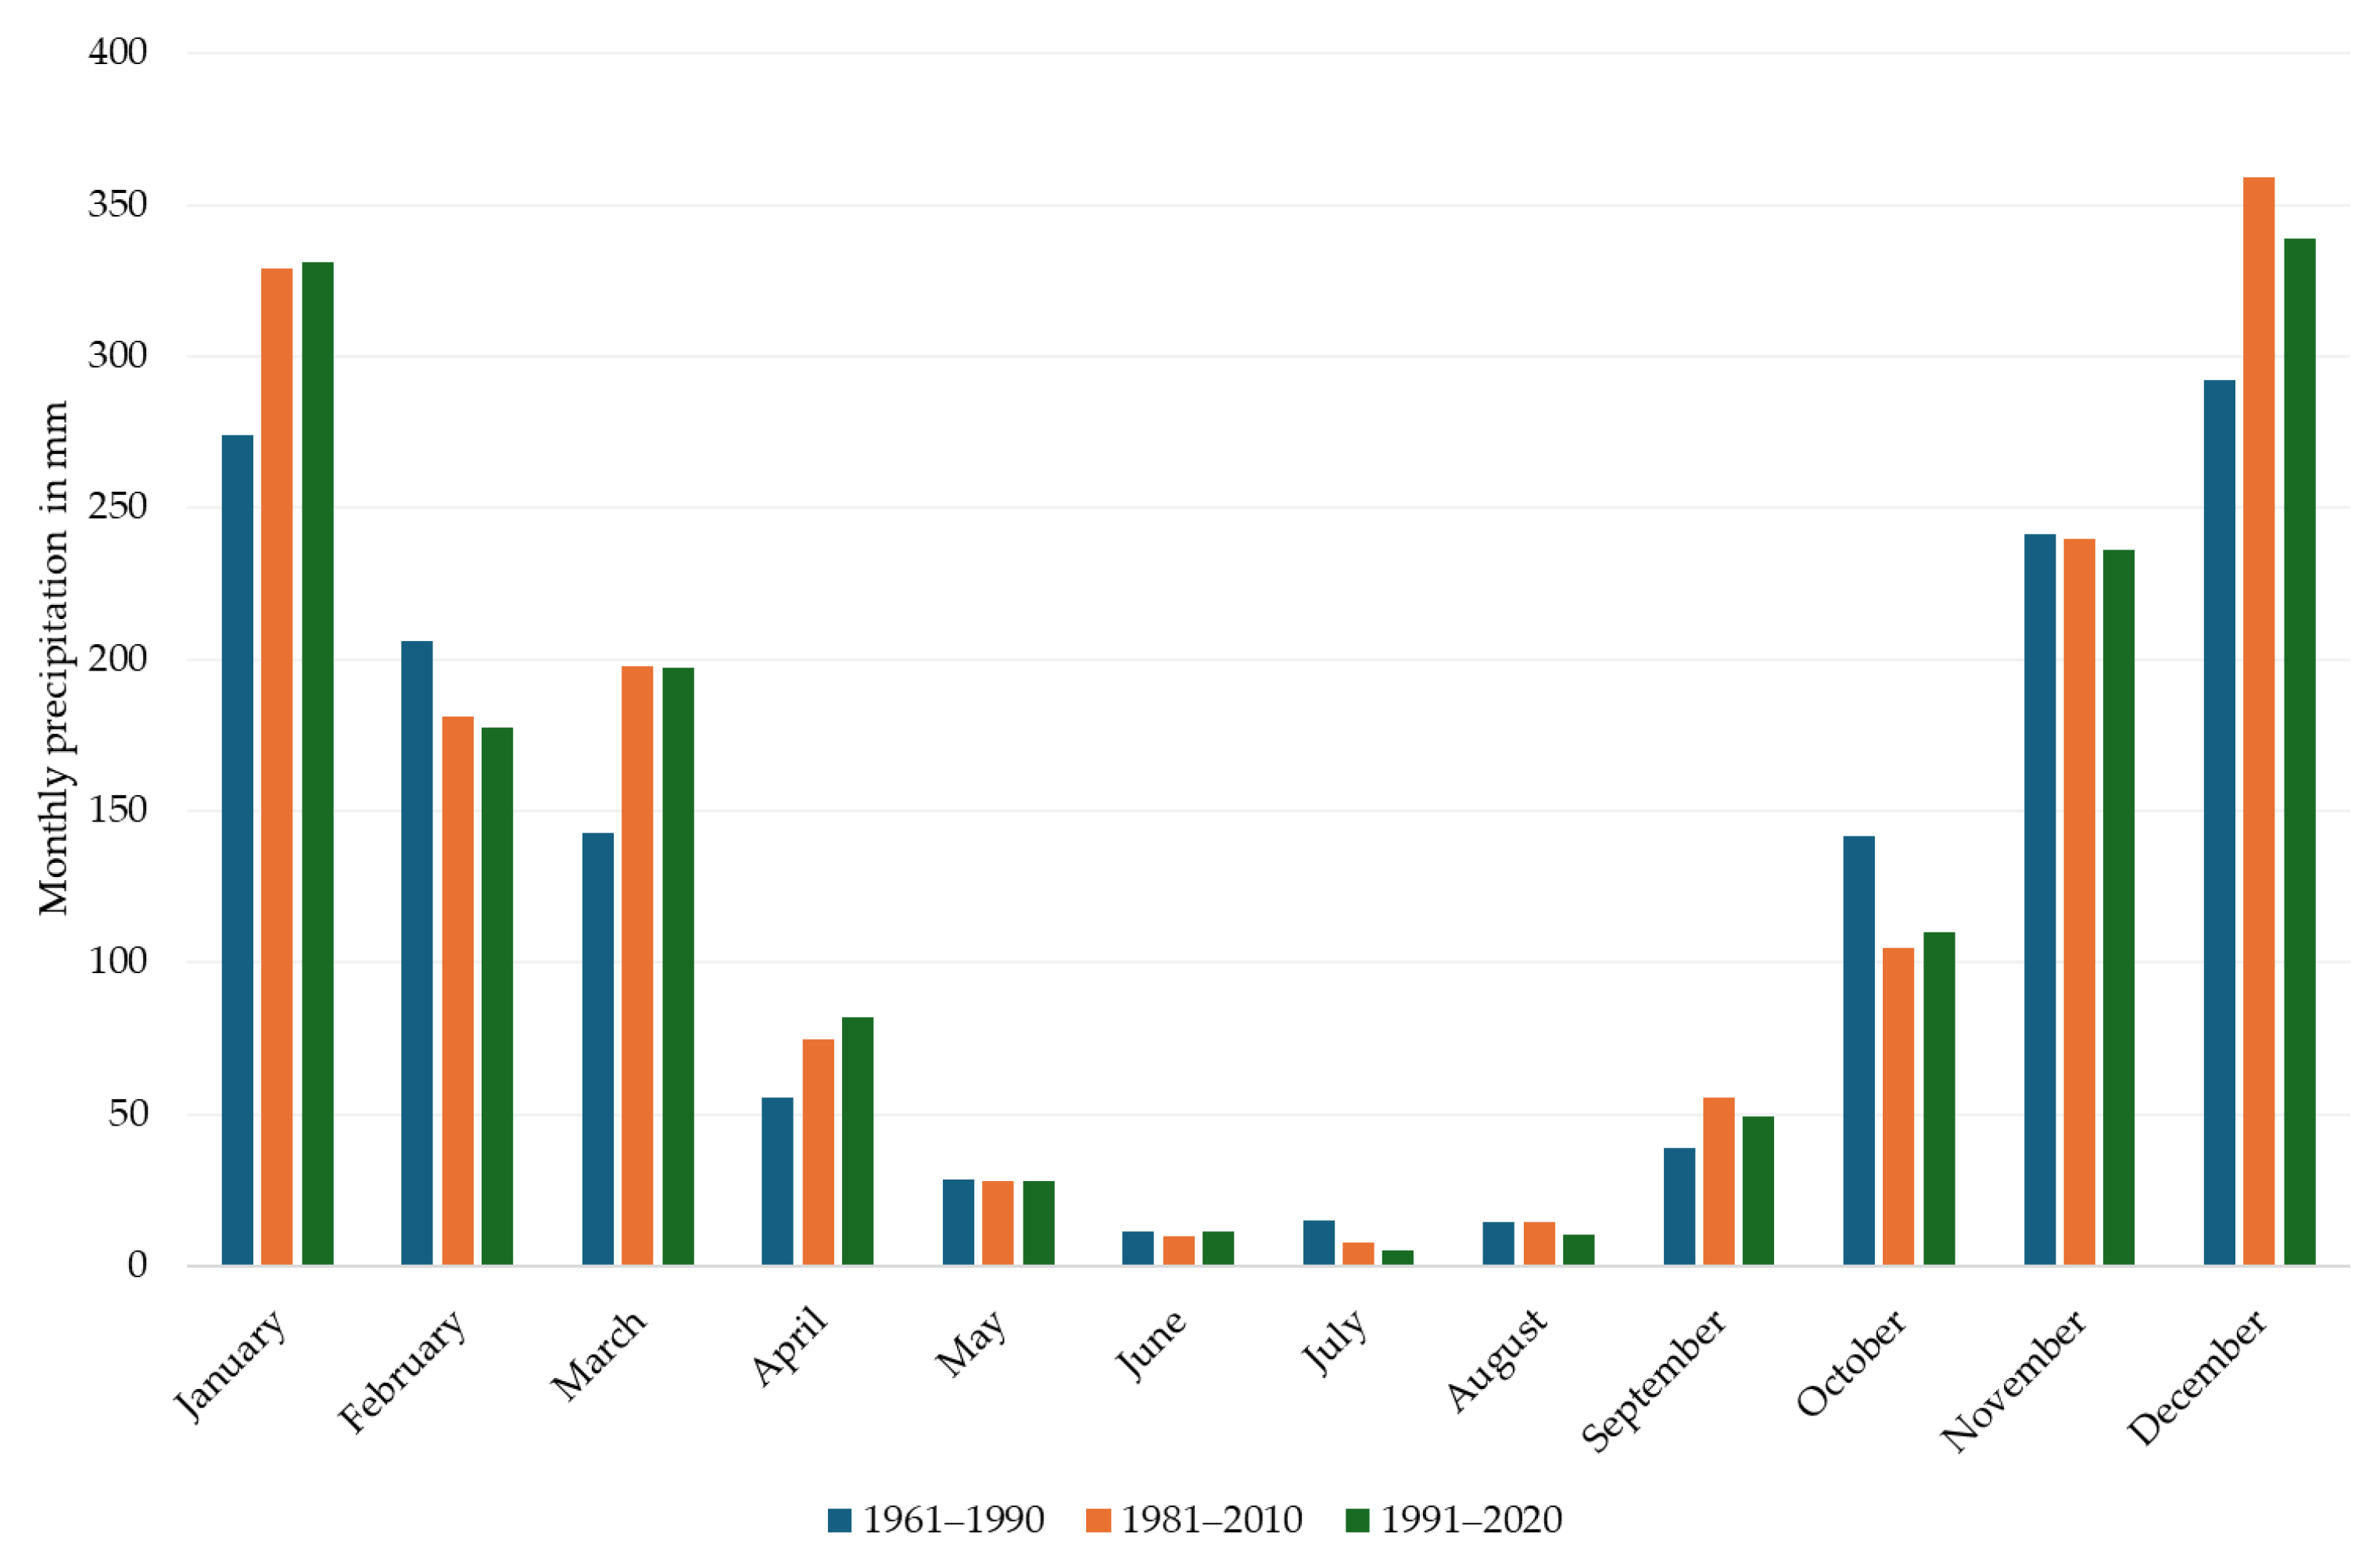
Belo Horizonte is located in the south-eastern region of Brazil, in a transition zone between a typical tropical climate (in which dry and wet periods are well-defined) and a humid subtropical climate. According to the characterisation of the behaviour of monthly and annual accumulated precipitation for the historical series 1911–2011 in Belo Horizonte [36], the annual accumulated and seasonal variations present no major alterations in this historical period, whose annual values have remained at approximately 1500 mm/year and whose extremes were recorded at the minimum in 1963 (497.5 mm) and at the maximum in 1982 (2509.8 mm). According to this study, the rainfall regime is monomodal, with the months from October to March with the highest rainfall recorded (the maximum in December ~300–360 mm/month and January ~270–310 mm/month), April and September as the transition months (~60–80 mm and ~30–50 mm, respectively), and May to August with the lowest values (below ~30 mm/month). It is precisely in the months of higher rainfall (November, December, and January) that the greatest disasters have been reported, mainly associated with floods and landslides in the two catchments that cover the territory of Belo Horizonte, the Arrudas, and the Onça [34]. Climatological normal data from the National Institute of Meteorology (INMET) for the Belo Horizonte station [37] indicate this trend for the climatic periods 1961–1990, 1981–2010, 1991–2020, as shown in Figure 2, with annual averages of 1463.7 mm, 1602.6 mm, and 1578.3 mm, respectively.

3. Methodology

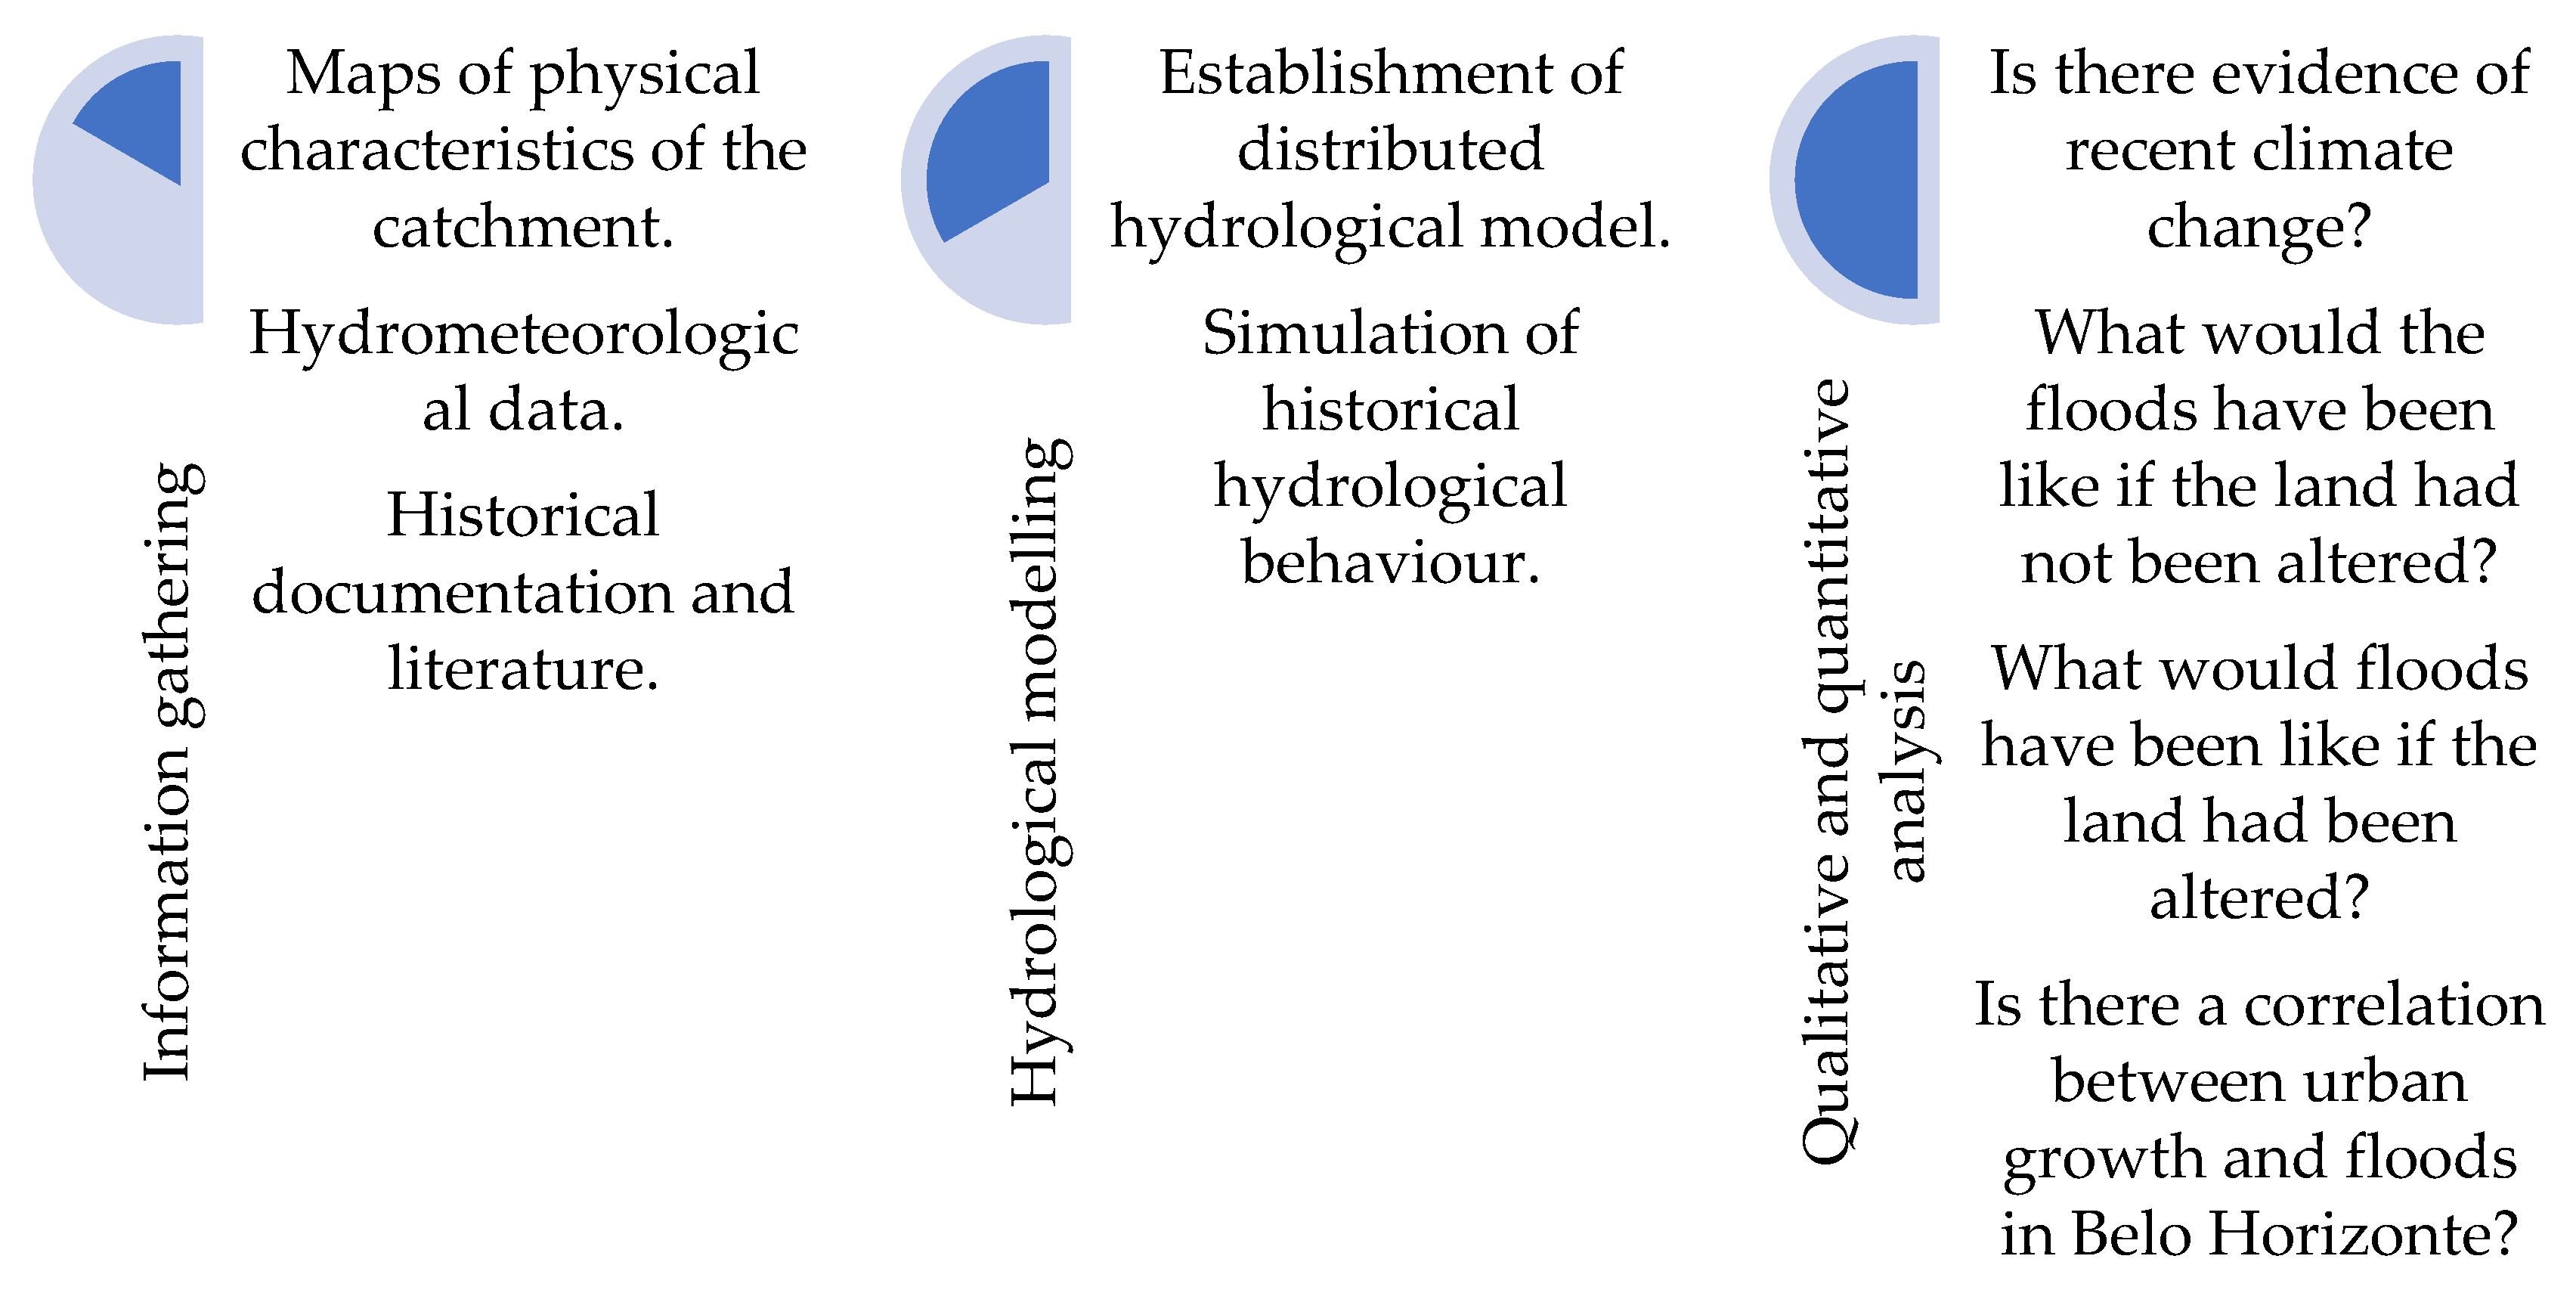
To quantify the effect that urban expansion has exerted on floods in comparison to the effects related to climate change in the historical period 1940–2024, the process outlined in Figure 3 is proposed. It is developed in the following subsections. The methodological approach is based on the collection of available sources from both scientific publications and grey literature (official technical reports, postgraduate dissertations, and doctoral theses), as well as characterisation maps of the catchment (topography, soils, geomorphology, geology, land cover, and land use). Among the characterisation maps, land cover and land use from a historical perspective provide the fundamental basis for the assessment of the changes that have occurred on the land surface and that directly affect the distribution of water in the catchment. Distributed hydrological modelling is, therefore, proposed as a central tool to ascertain the spatial variations caused in the hydrological cycle because of the urbanisation process throughout history. From this modelling, qualitative information is contrasted with quantitative information to identify the fundamental causes of the co-evolution of changes in the hydrological cycle and the anthropic interventions carried out in accordance with these changes. This is one of the main innovations of the present study, and its approach contributes to filling the previously identified scientific gap. Thanks to this analysis, it is possible to separately attribute the possible effects of climate change in the historical period and the effects of soil sealing resulting from the accelerated urbanisation process of the city during the 20th and 21st centuries.

3.1. Information Gathering

Various databases were employed to characterise the historical evolution of urban growth, flood events, the climate, and the catchment attributes. In the first case, regarding the historical evolution of urban growth and floods, documentary sources were utilised from the available literature, as presented in Section 4.1 and Section 4.2.
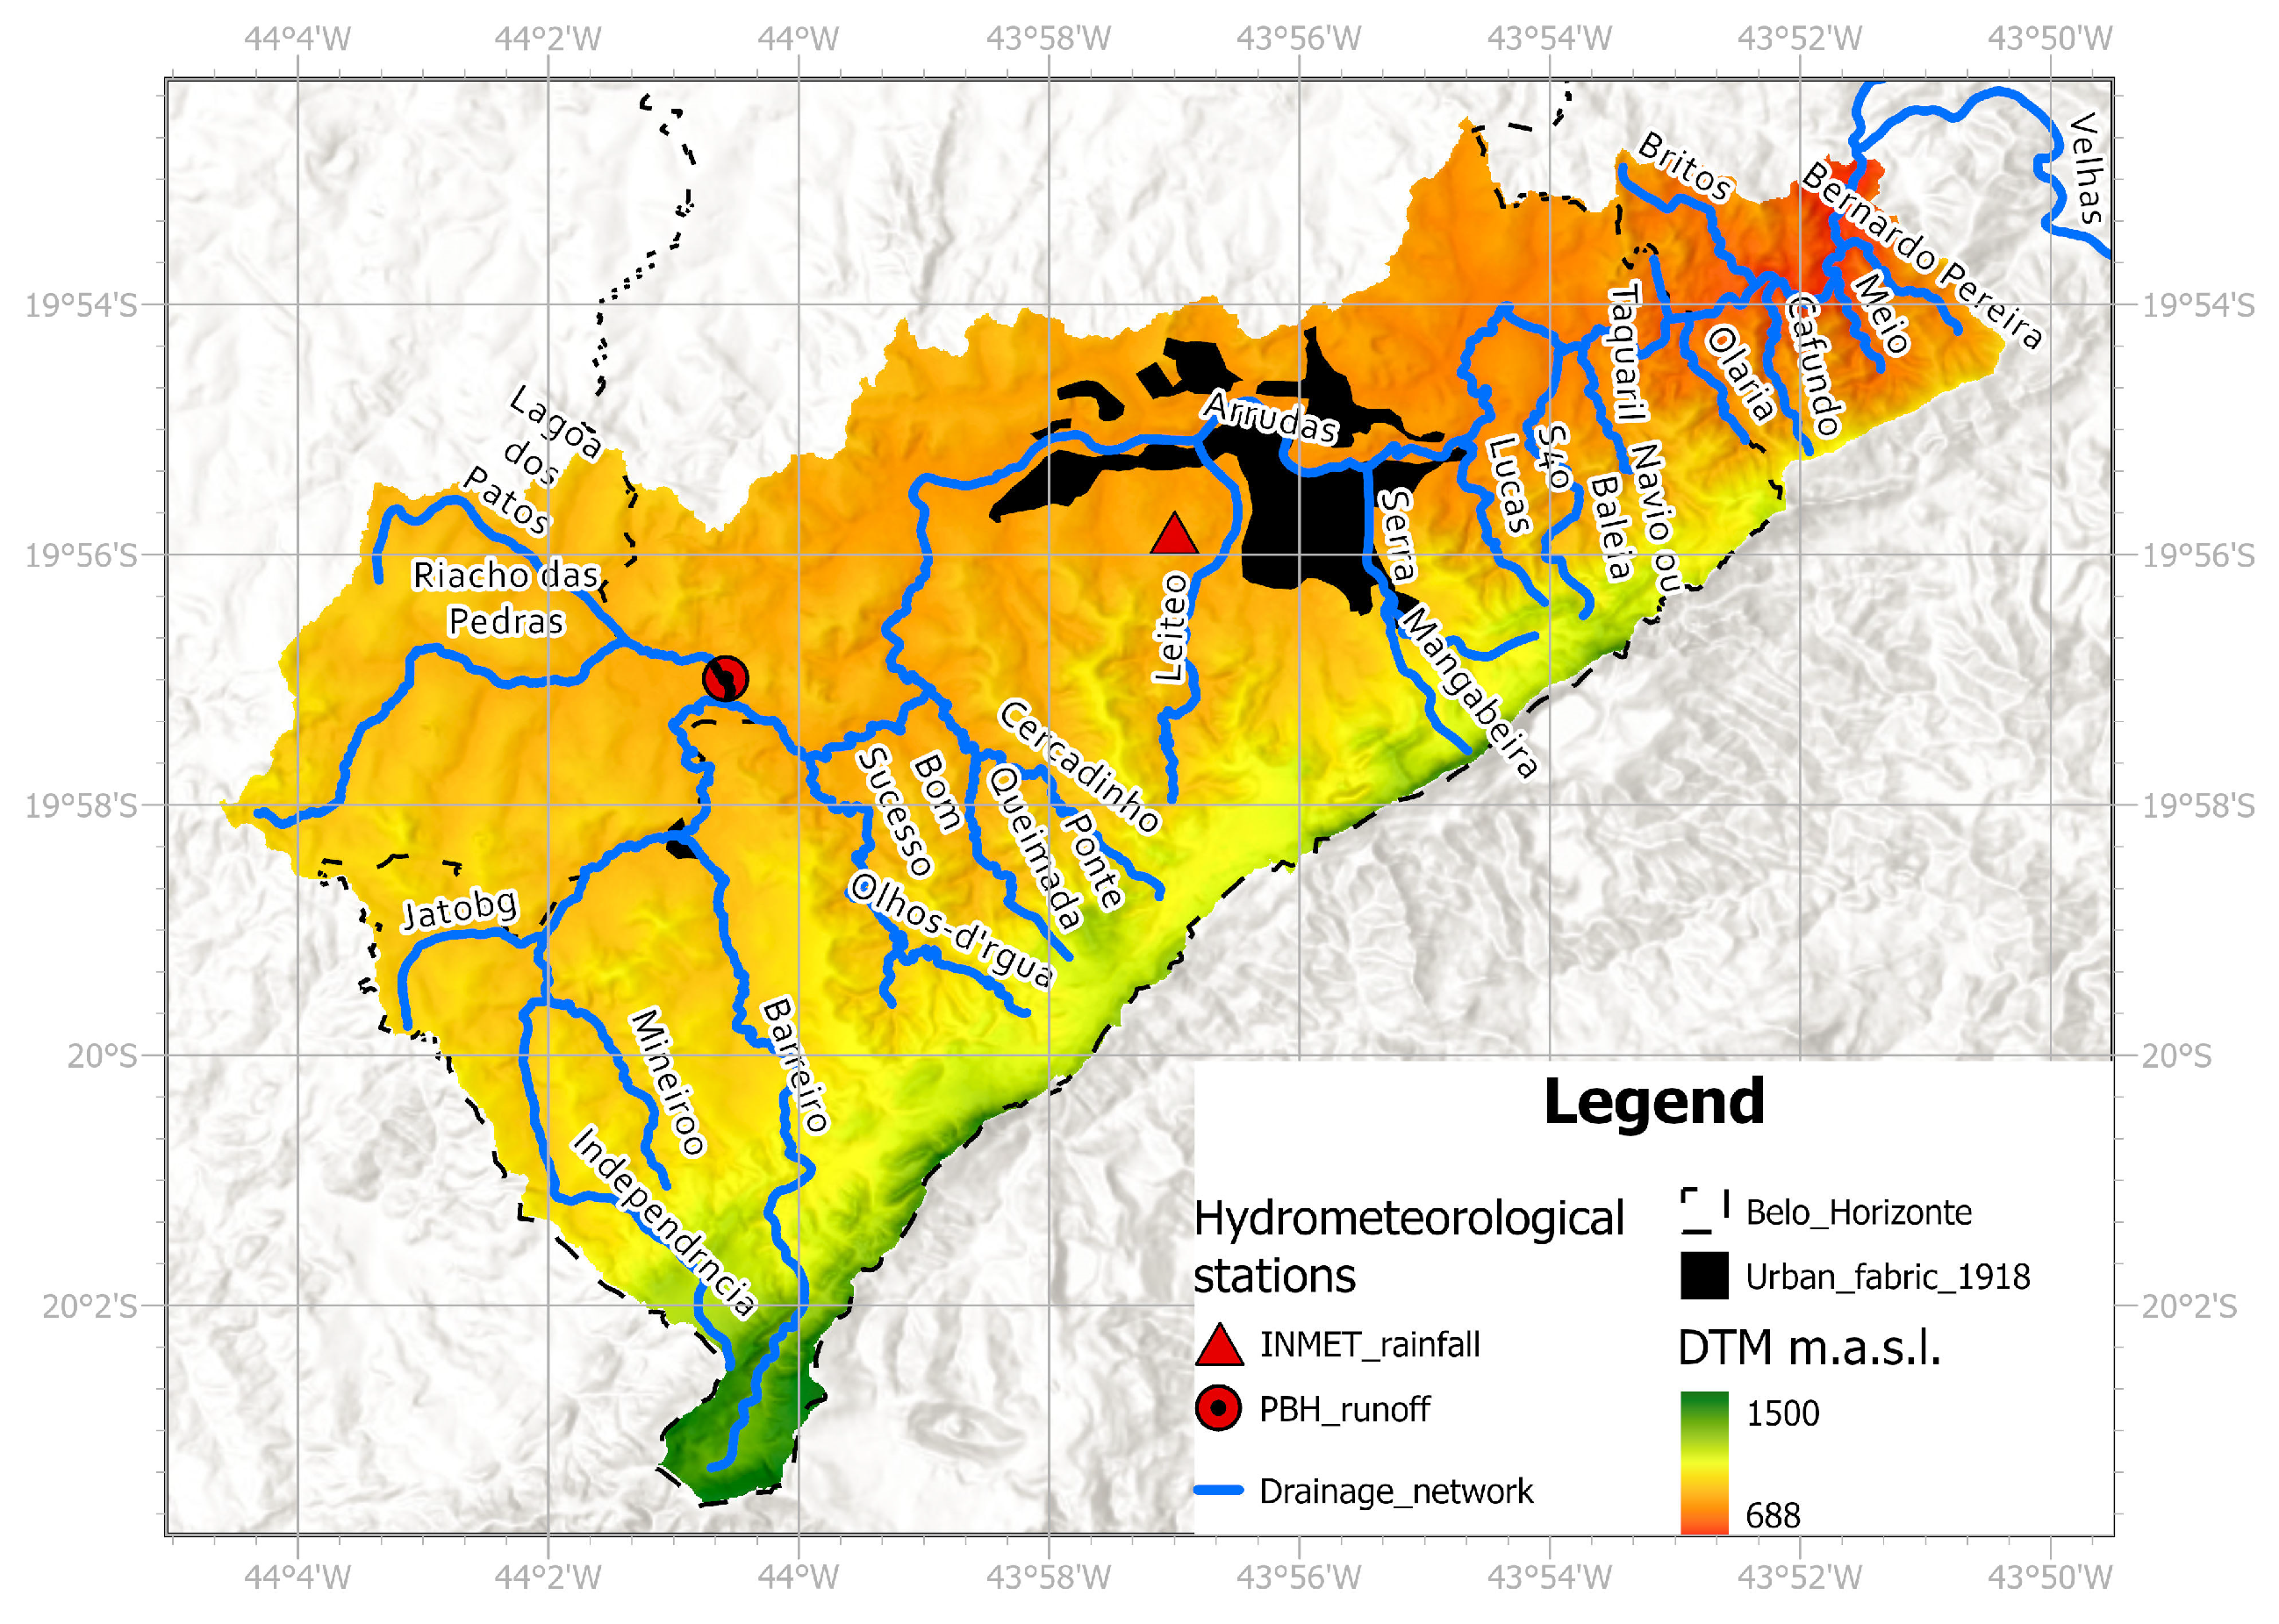
To characterise the climate, data from the historical reconstruction of climatic variables from 1940 to 2024 for the whole world were used [38]. From this database, the area belonging to Arrudas was selected, whereby daily values of precipitation and evapotranspiration were obtained from 2 January 1940 to 31 December 2024. Data was also used from the conventional station with ID 83587 (Belo Horizonte) in the dataset of INMET, for which data is available in the range from 1939 to 2023 (see location in Figure 4).
For the historical streamflow series, due to the lack of direct measurements of this variable, it was necessary to estimate the values, which are fundamental for the calibration and validation of the model. To this end, historical water-level measurements were requested directly from the municipality of Belo Horizonte (PBH). Data was available from several monitoring points with an average interval of 10 min from 7 October 2011, 01:00:00 to 2 February 2023, 09:20:00. This water-level data was translated to streamflow data following the results of previous studies with a similar aim as our study [39]. In that study (see details in [39]), there are results for the gauging curve (water level vs. streamflow) for gauging station 24 of the Arrudas catchment (see location in Figure 4), which was used to establish the hydrological model.
To consider the spatial variability of the geophysical factors of the catchment, several maps were used, which, after processing with GIS tools in ArcGis Pro 3.4.0, were employed to establish the distributed hydrological model, as described in the following subsection. On the one hand, maps on geology/hydrogeology, geomorphology, slope, altitude, land use, and land cover were considered from the VELHASMAP tool of the Rio das Velhas information system [40]. For the spatial distribution of drainage, by considering the typologies of each section of the hydrographic network of the catchment, PBH directly provided the database used in this study.
For the characterisation of the topography, the high-resolution digital terrain model (DTM) with a cell size of 12.5 m was created (see Figure 4) from the mosaic of raster images downloaded from the ALOS-PALSAR mission [41].
The spatial variability of land cover and land use is represented using the historical HILDA + map categories [42], which provide maps of the world for each year for the period 1899–2019. Likewise, polygon layers of the historical urban area of Belo Horizonte are available for the years 1918, 1935, 1950, 1977, 1999, 2007, and 2018. The urban fabric of Belo Horizonte in 1918 is presented in Figure 4.
Soil depth to bedrock (R horizon) from SoilGrids [43], a map of the available water content derived from field capacity, and wilting point maps from the HiHydrosoils database [44] are also employed.
For the estimation of the saturated hydraulic conductivity of the surface soil, the global database of 250 m spatial resolution HiHydrosoils is used, which has data of this variable for various depths (from 0 to 2 m).

3.2. Hydrological Modelling

The phenomenon to be studied is the effect of historical urban growth on the hydrological cycle. Therefore, distributed hydrological modelling has been selected in order to understand the functioning of the hydrological cycle and its spatial and temporal variability. The variable to be analysed is that of the floods generated in response to observed extreme precipitation past events. This variable is an indicator of flooding since, after an increase in flood flows, flooding follows if the drainage network is unable to contain these flows within its natural or artificial channel. Therefore, this study only simulated the generation of surface runoff and its propagation hydrologically, avoiding the use of a hydraulic model that exceeds the scope of this paper (for example, this type of modelling is necessary to simulate channel overflow and its effects on floodplains).
The establishment of the distributed hydrological model comprises a first phase of initial parameter estimation and then a process of calibration and validation until an acceptable model is obtained for the previously defined purpose. Given that our analysis is conducted at the river basin level and that our model will be used to understand the main changes in the hydrological cycle due to changes in land use, the aforementioned procedure for establishing the model is sufficient. Therefore, in this study, a formal analysis of the different sources of uncertainty is beyond the scope. However, further research in this direction is needed in a broader scenario involving stakeholders and decision-makers in order to support sound decisions under uncertainty (see a review in [45]).
The starting point is the conceptual distributed hydrological model TETIS [46], which makes it possible to represent the spatial variability of the geophysical characteristics of the catchment thanks to its conceptualisation, parsimony, and robustness for the representation of the main hydrological processes, as has been shown in various applications worldwide [47,48] and in Latin America [49].
The initial parameter estimation process can be summarised as follows. Firstly, the topographic characterisation is carried out, based on the hydrological correction of the original DTM, and the derived maps (flow directions, accumulated cells, slope and flow velocity on slopes) are then attained by using geographic information system tools. For the modelling of the evapotranspiration process, the concept of vegetation factor is used, through which the potential evapotranspiration (PET) or reference evapotranspiration (ET0) is related to the actual maximum evapotranspiration (ET) of the existing land cover. The Hilda+ land cover and land use maps are corrected with historical maps of the urban area of Belo Horizonte and then reclassified according to the behaviour of the land cover in relation to the evapotranspiration process. Likewise, a detail of parks and gardens of Belo Horizonte and Contagem is incorporated, which is employed to correct the land cover and land use map through the inclusion of the coincidence between urban use and this layer of detail, which is corrected for all the historical maps.
The estimation of parameters associated with soil hydraulic characteristics is carried out by processing various sources of information, such as historical land use and land cover; maps of soil depth to bedrock; soil slope; maximum effective root depth following the average reference values [50] based on historical land use and land cover maps; and the available soil water content, calculated from the difference between field capacity and wilting point for the 7 depths of the HiHydrosoils database. From the processing, within a GIS, of the saturated hydraulic conductivity maps of the surface soil of the HiHydrosoils database, the values of horizontal and vertical hydraulic conductivity are obtained from Leonards [51]. The effect of soil impermeability on hydraulic conductivity (vertical and horizontal) in urban areas is also incorporated into these maps based on the historical maps available. From the HiHydrosoils database, the value of the saturated hydraulic conductivity of the subsoil, at a depth of 2 m, serves as a reference for the TETIS model parameter related to the hydraulic conductivity in the lower soil layer (subsoil) under saturated conditions. The Kps map represents the percolation velocity in the deep soil zone. The TETIS model considers the possibility that some of the water reaching the aquifer is not incorporated into the baseflow in the catchment (the so-called losses to one or more deeper aquifers). This parameter is assumed to be one-tenth of the value of Kp since it is usually a low value. For the construction of the subsurface horizontal saturated hydraulic conductivity (Ksa) map, a lithology layer of the area is used while considering the reference values available from the world reference literature [52].
For the model calibration process, an automatic calibration is used within the TETIS model, which implements the “Shuffled Complex Evolution—University of Arizona” (SCE-UA) method, which has been shown to be a robust and efficient method for the calibration of rainfall–runoff models with a long history of use (see review of applications in [53]). The objective is to obtain the best set of correcting factors, which globally affect the initially estimated parameters, in order to represent the predominant hydrological processes in the study catchment for the intended purpose—in this case, flood flows. The demonstration of this hypothesis is carried out by launching simulations over a period, in contrast to that of the calibration, for which both visual inspection and statistical performance metrics are used to objectively accept or reject the behaviour of the model by comparing the simulated flows with the observed flows. To this end, the recommendations of Moriasi et al. [54] are followed.
Once the hydrological model has been accepted as being representative of the main predominant hydrological processes, it serves as a reference to carry out simulations, which, for the present research, are proposed as follows. Firstly, a simulation of the historical period 1940–2024 is carried out with the characteristics of the oldest catchment, which are from 1918 (a few years after its proclamation as the capital of Minas Gerais), in order to represent how the floods would have behaved with respect to the observed climatic behaviour and to a city that had not significantly altered the natural characteristics of the territory. This is the baseline reference for the assessment of the effect of urbanisation on floods. In the same direction, the characteristics of the catchment in 1935 are used under the same approach as above, which makes it possible to see the effect of urbanisation, both with the baseline of 1918, and then to compare with other historical moments. This approach also makes it possible to separate the effect of climate change from the effects induced by changes in land use and land cover caused by urban growth. Simulations are then carried out for the period 1940–2024 using the historical characteristics of the catchment area from 1935, 1950, 1977, 1999, 2007, and 2018. The intermediate time intervals between each change are employed to consider the transitions between one historical moment and the next.
Once the simulations have been obtained, the maximum annual daily flows are extracted and their return periods are estimated by adjusting a probability distribution function, which makes it possible to evaluate the changes in the frequency and magnitude of floods for the historical period analysed. For this purpose, the use of one of the most widely used theoretical models for this type of extreme data at a global level is proposed, which is also used in Brazil with good adjustments for the study area [55]: the log-Pearson Type III function. Uncertainty bands are estimated for this function for a 90% confidence level, which is the standard procedure in this type of hydrological study. As previously mentioned, there are other sources of uncertainty in hydrological studies (e.g., data inputs, model structure, model parameters, knowledge gaps) that should be considered in studies with other purposes, such as forecasting [56] or decision-making processes [45].

4. Results and Discussion

4.1. The Historical Evolution of Landscape Transformation

As a starting point for the documentary analysis, it is necessary to put into context the evolution of the historical landscape transformations of the city, particularly in the Arrudas catchment, where this capital city was planned: a pioneer in the introduction of a new urban planning paradigm for Brazil at the end of the 19th century based on a racialized narrative of modernity and progress [25]. Belo Horizonte was the first capital of Brazil to be designed and built between 1894 and 1897, which was considered a technical opinion under the introduction of positivist, hygienist, and sanitary precepts into the country [26]. The official plan for the new capital was presented by the “Comissão Construtora da Nova Capital” (CCNC) and was developed to house the planned area of Belo Horizonte within the drainage area of the Arrudas catchment. The only watercourse that had part of its course initially preserved in the project presented was precisely the Arrudas, in the area corresponding to the Renné Giannetti Municipal Park, since the objective was to integrate it into the urban park project (see map of the planned city in [27]). Moreover, the Arrudas was a natural divider of the urban and suburban regions, since it divides the northern and southern regions of the municipality, and, as part of the urban infrastructure of services initially planned for the new capital by the CCNC [57].
Throughout the 20th century, the Brazilian population transformed from being largely rural during the first decades to being mostly urban by the end of the century due, as some authors point out, to the accelerated process of industrialisation [58]. According to the 1937 statistical yearbook [59], the censuses state that Belo Horizonte had an urban, suburban, and rural composition of 7694, 5847, and 4074, respectively, in 1905, and 12,033, 14,842, and 11,947 in 1912. The same source reported an estimated population in 1900 of 13,472 people, 45,741 in 1915, 116,981 in 1930, and 180,241 in 1936. In line with this population progression, as Barreto [60] documents, the city that was designed to be home to 200,000 inhabitants in the 21st century, had, by the early 1940s, already surpassed that figure. In fact, in just 30 years, this planned figure tripled and followed an accelerated progression until the end of the 20th century; it has advanced more moderately in the 21st century. According to data from the IBGE [24], Belo Horizonte went from ~1.25 million inhabitants in 1970, to ~1.78 million in 1980, ~2.02 million in 1991, ~2.24 million in 2000, ~2.38 million in 2010, and 2.32 million in 2022. Such population growth has been accompanied by a dizzying pace of urbanisation, with the Arrudas catchment playing a leading role in this historical process of territorial change.
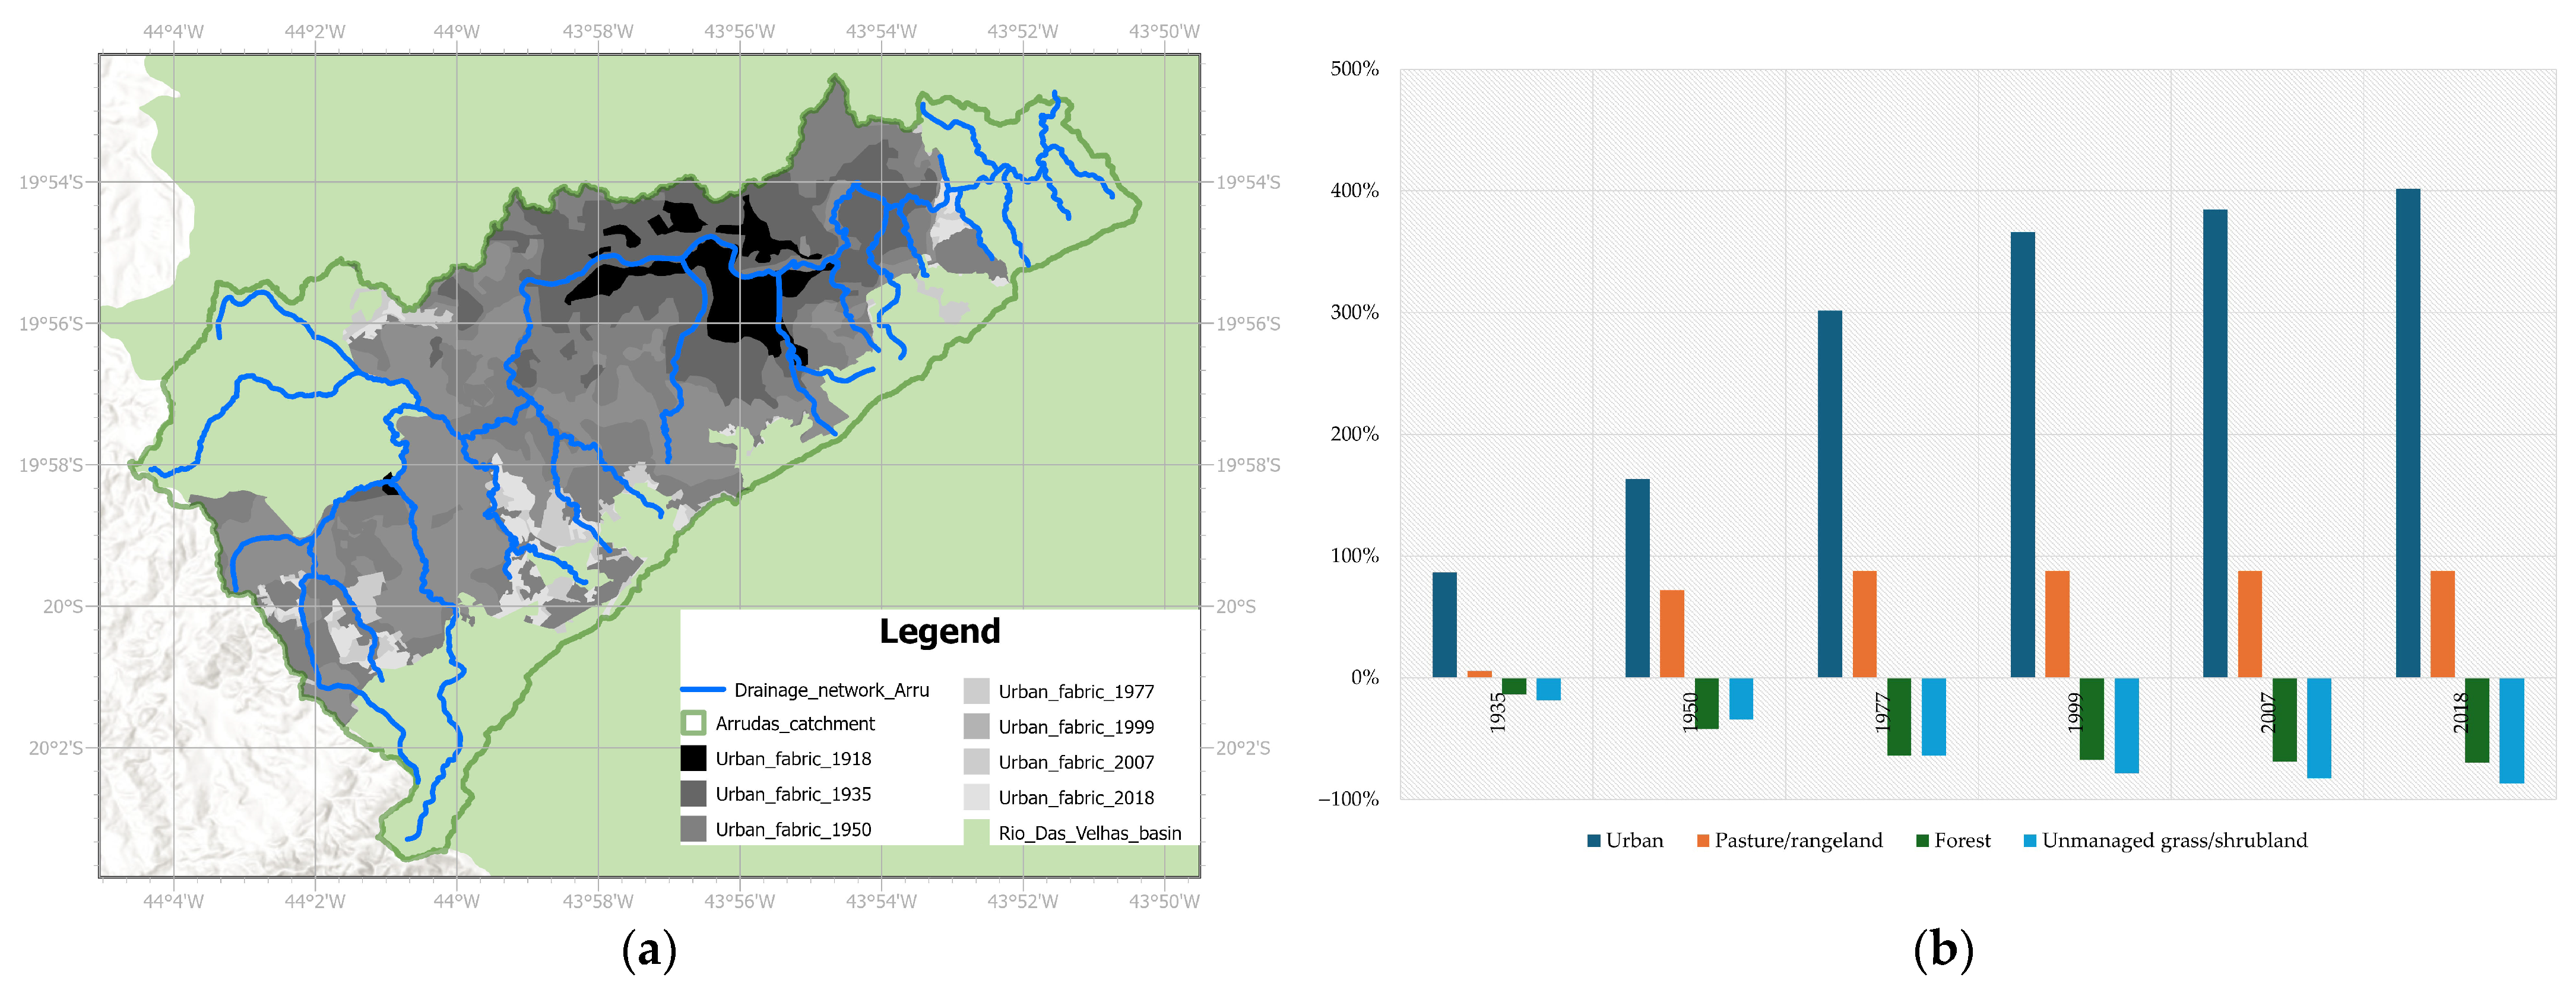
The originally planned city lies entirely within the Arrudas catchment, whose horizontal expansion occurred up until the 1950s (see Figure 5). From that time, especially during the period 1980–1991, due to the arrival of migrants from the state and other states, the city has undergone an unprecedented expansion, fundamentally along two vectors: to the west within the Arrudas catchment and to the north in the Onça catchment [58]. Indeed, as late as 1940, several blocks of the city centre (Arrudas floodplain) remained unoccupied [25]. According to Borsagli [61], until the 1950s, there was a relatively harmonious coexistence between the population of Belo Horizonte and its watercourses, since they were still considered an essential element for the beautification of the city, even if they were already partially channelled to the open air. However, in the 1960s, the capital began to show signs of the territorial imbalance produced by the disorderly urban development process. At that time, a political decision was taken to close the watercourses that crossed the central region, thereby fulfilling the multiple functions of eliminating the stench, reducing the risk of diseases due to urban waste, and, above all, diminishing the flooding that was already part of the daily life of the inhabitants of Belo Horizonte during the rainy season [29]. Along with the evolution of the urbanisation of the municipality throughout the 20th century, the relationship between the natural elements and the capital of Minas Gerais deteriorated, when real estate capital, the commercialisation of plots, and tax collection took precedence over the quality of life of the population and over the relationship between the population and the reference elements of the urban landscape [30].
At the beginning of the 21st century, the DRENURBS programme “Programa de Recuperação Ambiental de Belo Horizonte” [62] was launched, which promised to be a new paradigm of urban regeneration aimed at promoting the reinsertion and/or integration of watercourses into the urban landscape, and at enabling decontamination, the control of sedimentation, and the flood risk reduction. Among the motivations for this programme, the PBH mentioned that the advance of urbanization and the consequent land use have caused a reduction in the natural storage of water in the territory, which has been transferred to other locations within the city, generating new occurrences of flooding, repeated every rainy season and always in an evolving manner. Although the programme proposed an innovative look at the environmental management of urban river systems, it was insufficient to prevent that, three years after its launch, a new part of the Arrudas was covered, due to the need for the expansion of the roads within the project called “Linha Verde” [30].
In short, despite this new paradigm change, subsequent hydraulic interventions under the old grey infrastructure approach have maintained the focus of analysis of the urbanising effect on one specific dimension of the problem: the circulation of water through the drainage network and the flooding impacts. However, these new interventions remained incomplete as they did not adequately consider the effects of soil sealing, which is the origin of the increase in the generation of surface runoff that subsequently reaches the drainage network. From the available historical maps of the urban core of the city of Belo Horizonte, the historical evolution of the urban area has been reconstructed, as shown in Figure 5. These maps were complemented with the other available historical sources, and the evolution of the main land cover changes in the Arrudas catchment was obtained, taking the characteristics of 1918 as a baseline (Figure 5). As can be observed in Figure 5, it shows that an intense rate of expansion was maintained between 1935 and 1999, but with less intensity in the 21st century due to the physical limitations of the natural cover that remained to be transformed. By 1999, 68% and 78% of natural forests and grasslands had been transformed in favour of urban growth.

4.2. The Historical Co-Evolution of Territorial Transformation and Flooding

In accordance with the functioning of the hydrological cycle, urbanisation alters basic physical processes, such as the infiltration of water into the ground, which is reduced. As a result, surface runoff increases and moves more quickly over impermeable surfaces, leading to higher peak flows in a shorter response time after precipitation events. The types of flooding can be caused by inadequacies in the rainwater drainage network and/or by the overflowing of the lotic systems that cross the city (rivers, streams, ravines, etc.), and to a lesser extent by the rise in the water table or the entry of waves in the case of coastal cities. In the case of Belo Horizonte, the main types of flooding associated with the Arrudas catchment are largely due to the overflow of the Arrudas in its flood valley and the inadequacy of the drainage network [26,34].
A few years after the inauguration of the city, there are records of floods associated with the overflowing of the Arrudas and its tributaries, such as an event in January 1915 that caused material damage in the surrounding areas of the Arrudas valley [26]. Also, there is another documented event that occurred in 1923 [34]. Based on an analysis of various sources of information, Cavalcante [31] analysed the floods in the Arrudas catchment between 1930 and 2005. In his study, the author identified two distinct periods in the occurrence of flooding in the Arrudas valley: the beginning of the occupation, due to poor sizing of drainage within the urban area, and the development of the impermeable area, which coincides with the increase in the occurrence of flooding due to the effects of both changes in land use and occupation and the channelling of the tributaries of the Arrudas river. In his work, Cavalcante [31] mentions that between the 1930s and 1970s, the phenomenon worsened, reaching a first decade of maximum flooding records, which was then surpassed by the five-year period 2001–2005. In a subsequent study, Lucas et al. [62] systematised the flood occurrence records between 2009 and 2012, from which it can be observed that the four areas associated with Arrudas account for an average of 31.1% of the records.
According to Assis et al. [34], despite the evidence of flooding in the first half of the 20th century, the damage really began to be significant from the end of the 1970s. According to the authors, the first catastrophic event occurred on 12 December 1977, with a recorded rainfall of 174 mm in 48 h, and impacts such as nine deaths, 17 seriously injured people, and 23 missing persons. On 8 February 1979, another event was recorded in the city centre, causing severe damage. On 2 January 1983, a further catastrophic event was recorded with more than 70 deaths due to the destruction of the Sovaco de Cobra favela, located at the margins of the Arrudas stream. In 1987, the Arrudas also overflowed, sweeping away cars and flooding the Américo René Gianetti Municipal Park, in the Centro-Sul region, together with the shops on Avenida dos Andradas [63].
Similarly, in terms of impacts, a new catastrophic event occurred in January 2020. That month was the wettest in the history of Belo Horizonte since climatological measurements began in 1910, and corresponded to 932.2 mm, almost as much as the total rainfall of 2019. In January 2020, two of the regions belonging to the Arrudas catchment (Barreiro and Oeste) recorded a third of the rainfall expected for the whole month of January in just 2 h and 20 min, resulting in massive flooding, with a death toll of 13 people [34]. On 15 January 2021, 80 mm in 4 h was recorded in the Arrudas area, causing flooding in the vicinity of Tereza Cristina Avenue, a phenomenon that was repeated just a few weeks later with an event occurring on 6 February 2021 [34].
Given the findings of several studies related to flooding in Belo Horizonte and the Arrudas catchment described previously, the origin of the floods in the city of Belo Horizonte must be sought in both the geomorphological configuration of the city and in the sustained interventions over time. These interventions involve changes in land use in the catchment that cause soil sealing and the increase and acceleration of surface runoff: a process that leads to more water being concentrated in the drainage network in a shorter time, thereby rendering the systematically adopted structural measures of open and then closed channels as insufficient. In short, this remains an unresolved, cyclical, co-evolutionary problem: increase in the sealed surface of the soil; increase in surface water velocity; increase in water velocity through the channels; and inadequacy of the drainage network.

4.3. Is There a Relationship Between Increased Flood Frequency and Changes in Rainfall Patterns?

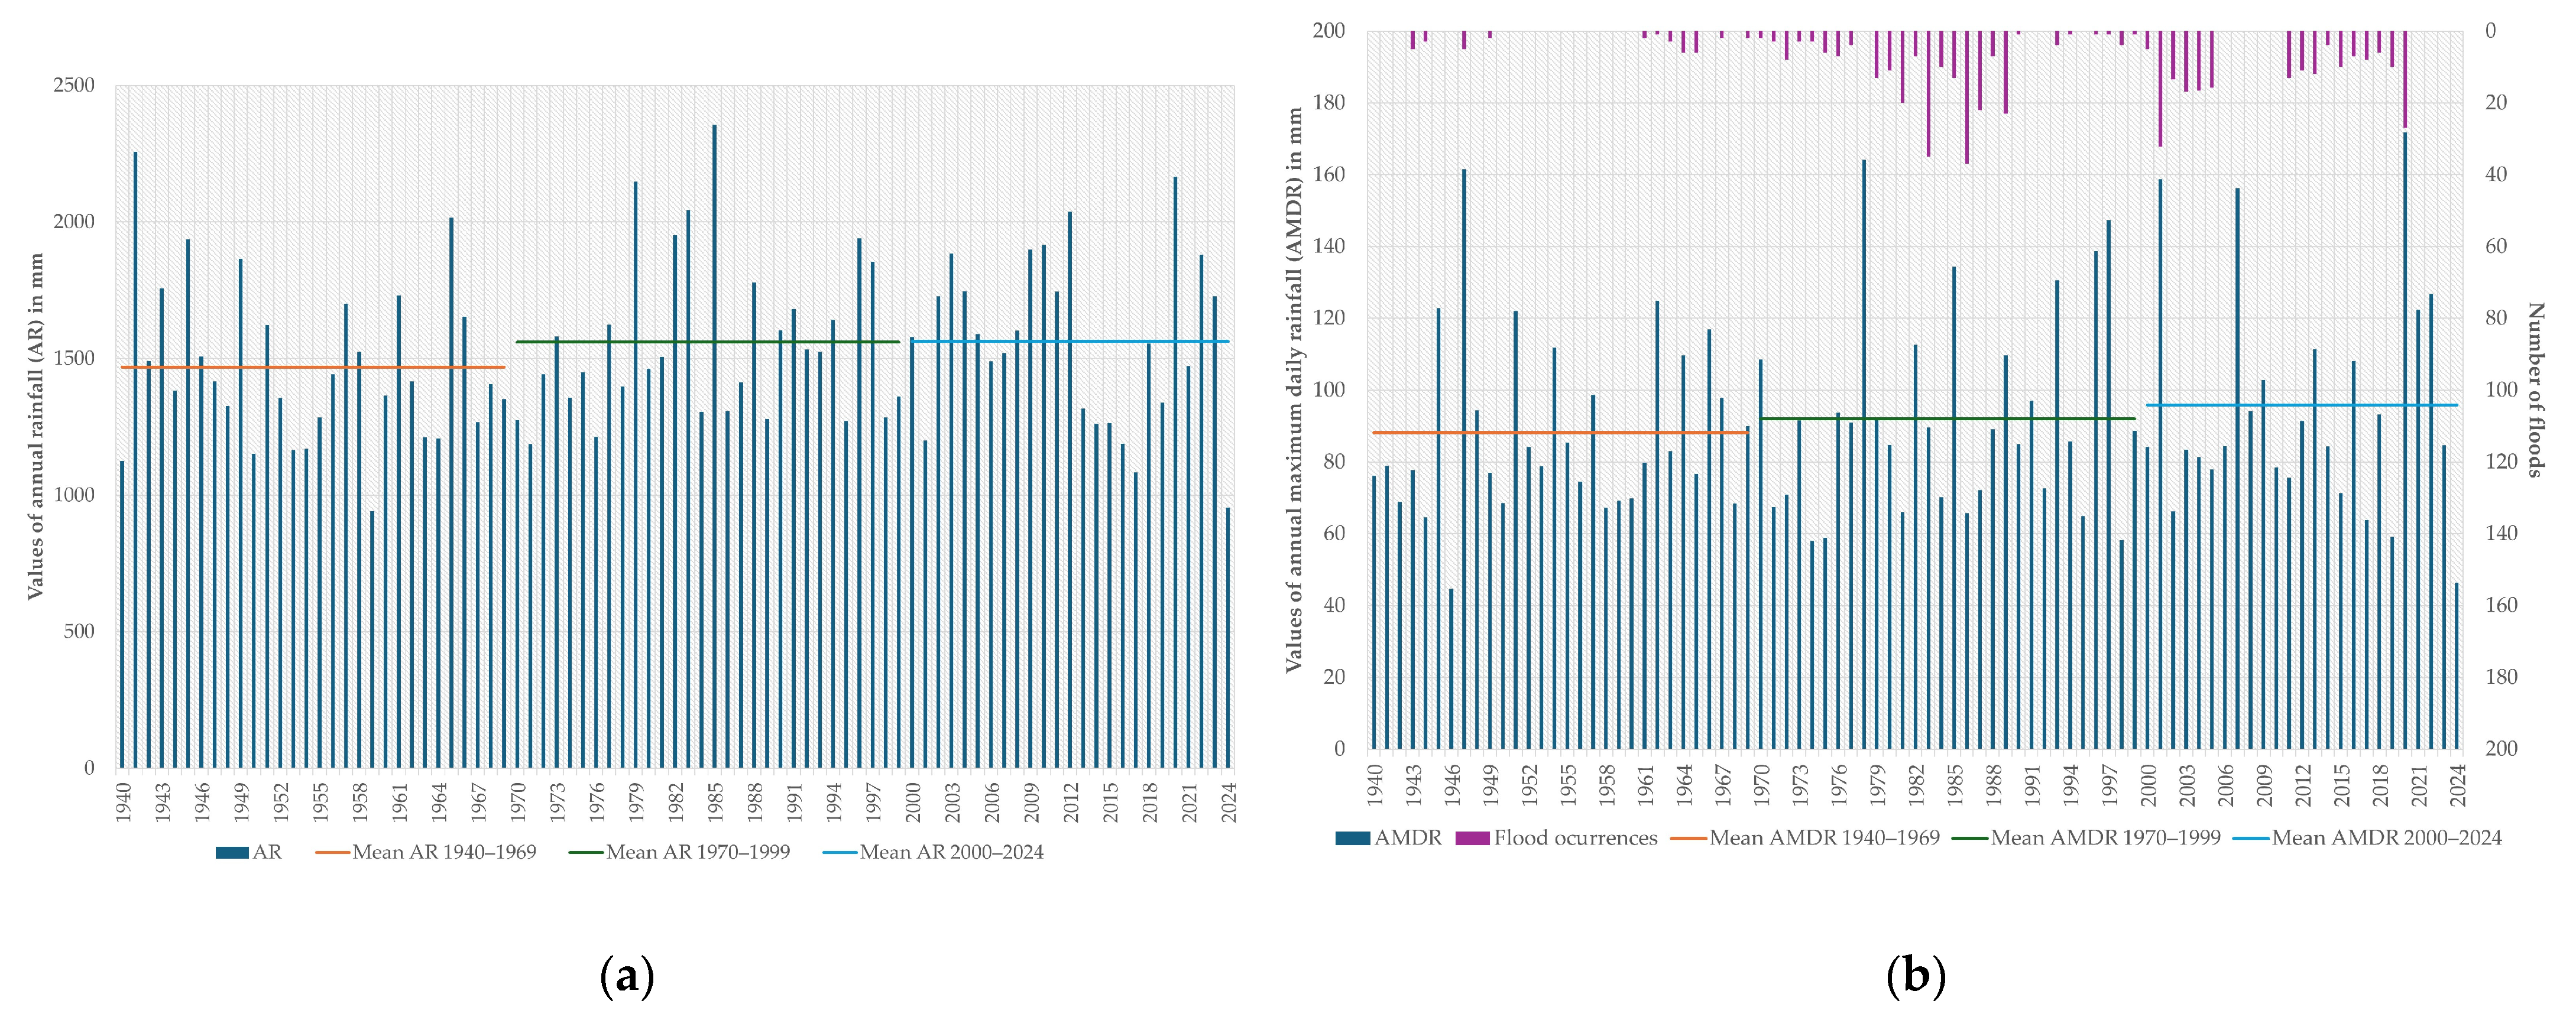
Based on the flood event data systematised by Cavalcante [31] for the period 1930–2005, and by the Belo Horizonte municipality for the period 2011–2020, the flood frequencies for the period 1930–2020 were reconstructed. In Figure 6, there are two graphs; the one on the left represents the total annual rainfall, and on the right, the annual maximum daily rainfall, together with their respective climate period averages (straight lines). The figure on the right includes the reconstructed flood occurrences for the period 1930–2000. The annual period corresponds to the hydrological year, and not to the calendar year, that is, it runs from 1 October of year n − 1 to 30 September of year n, with the year of the graphs being year n. As can be observed in Figure 6, there is a slight increasing trend in both the annual rainfall and in the magnitude of the annual maximum daily rainfall.
However, if analysed in terms of quartiles (see Table 1), there are variations in the rise and fall of the three successive climatic periods, although the trend of the whole series is increasing in both total annual rainfall and annual maximum daily rainfall.
From Figure 6 and Table 1, it can be observed that there is a slight increase in both total annual rainfall and annual maximum daily rainfall when comparing the mean and median values of the climatic periods under consideration. This trend coincides with previous long-term studies that indicate an upward trend in annual maximum daily rainfall in the region under study [64]. However, such changes fail to fully explain the behaviour of the upward trend in flood occurrences and their dynamics in the time series, since there are years in which floods increased despite their mean annual rainfall values falling below the mean or median of their corresponding climatic period, and vice versa. In fact, from the daily rainfall and flooding data reported by Nunes et al. [60] for the period 1979–2014, there is a fairly wide range of daily rainfall records associated with flooding (from 5.4 mm to 158.8 mm, with a median of 42.9 mm). This is an indication of the effect of territorial transformations on the functioning of the hydrological cycle in the catchment, and, as concluded by Nunes et al. [65], the data shows a change in 1988 that is representative of the process of urban expansion.
The observed differences between rainfall and floods show the non-linear nature of the processes associated with the generation and propagation of surface runoff, where the catchment plays a fundamental role. Therefore, a direct relationship between an increase in rainfall and an increase in flood flows cannot be attributed, which reflects the need to ascertain, both spatially and temporally, the functioning of the hydrological cycle in the watershed and the effects thereon caused by drastic changes in land use throughout the 20th and 21st centuries. Similarly, Assis et al. [34] mention that, despite the importance of pluviometric anomalies as triggers of extreme hydrological events, urban flooding events result from very different pluviometric accumulations, which reinforces the hypothesis that the type of land use and organisation exerts a decisive influence on the configuration of these processes in Belo Horizonte. This also underlines the need to better understand the functioning of the hydrological cycle. A qualitative–quantitative integrative approach, such as the one proposed in this paper, is therefore useful.

4.4. Is There a Relationship Between the Increase in the Frequency and Magnitude of Floods in the Arrudas Catchment in Relation to Historical Changes in Land Use?

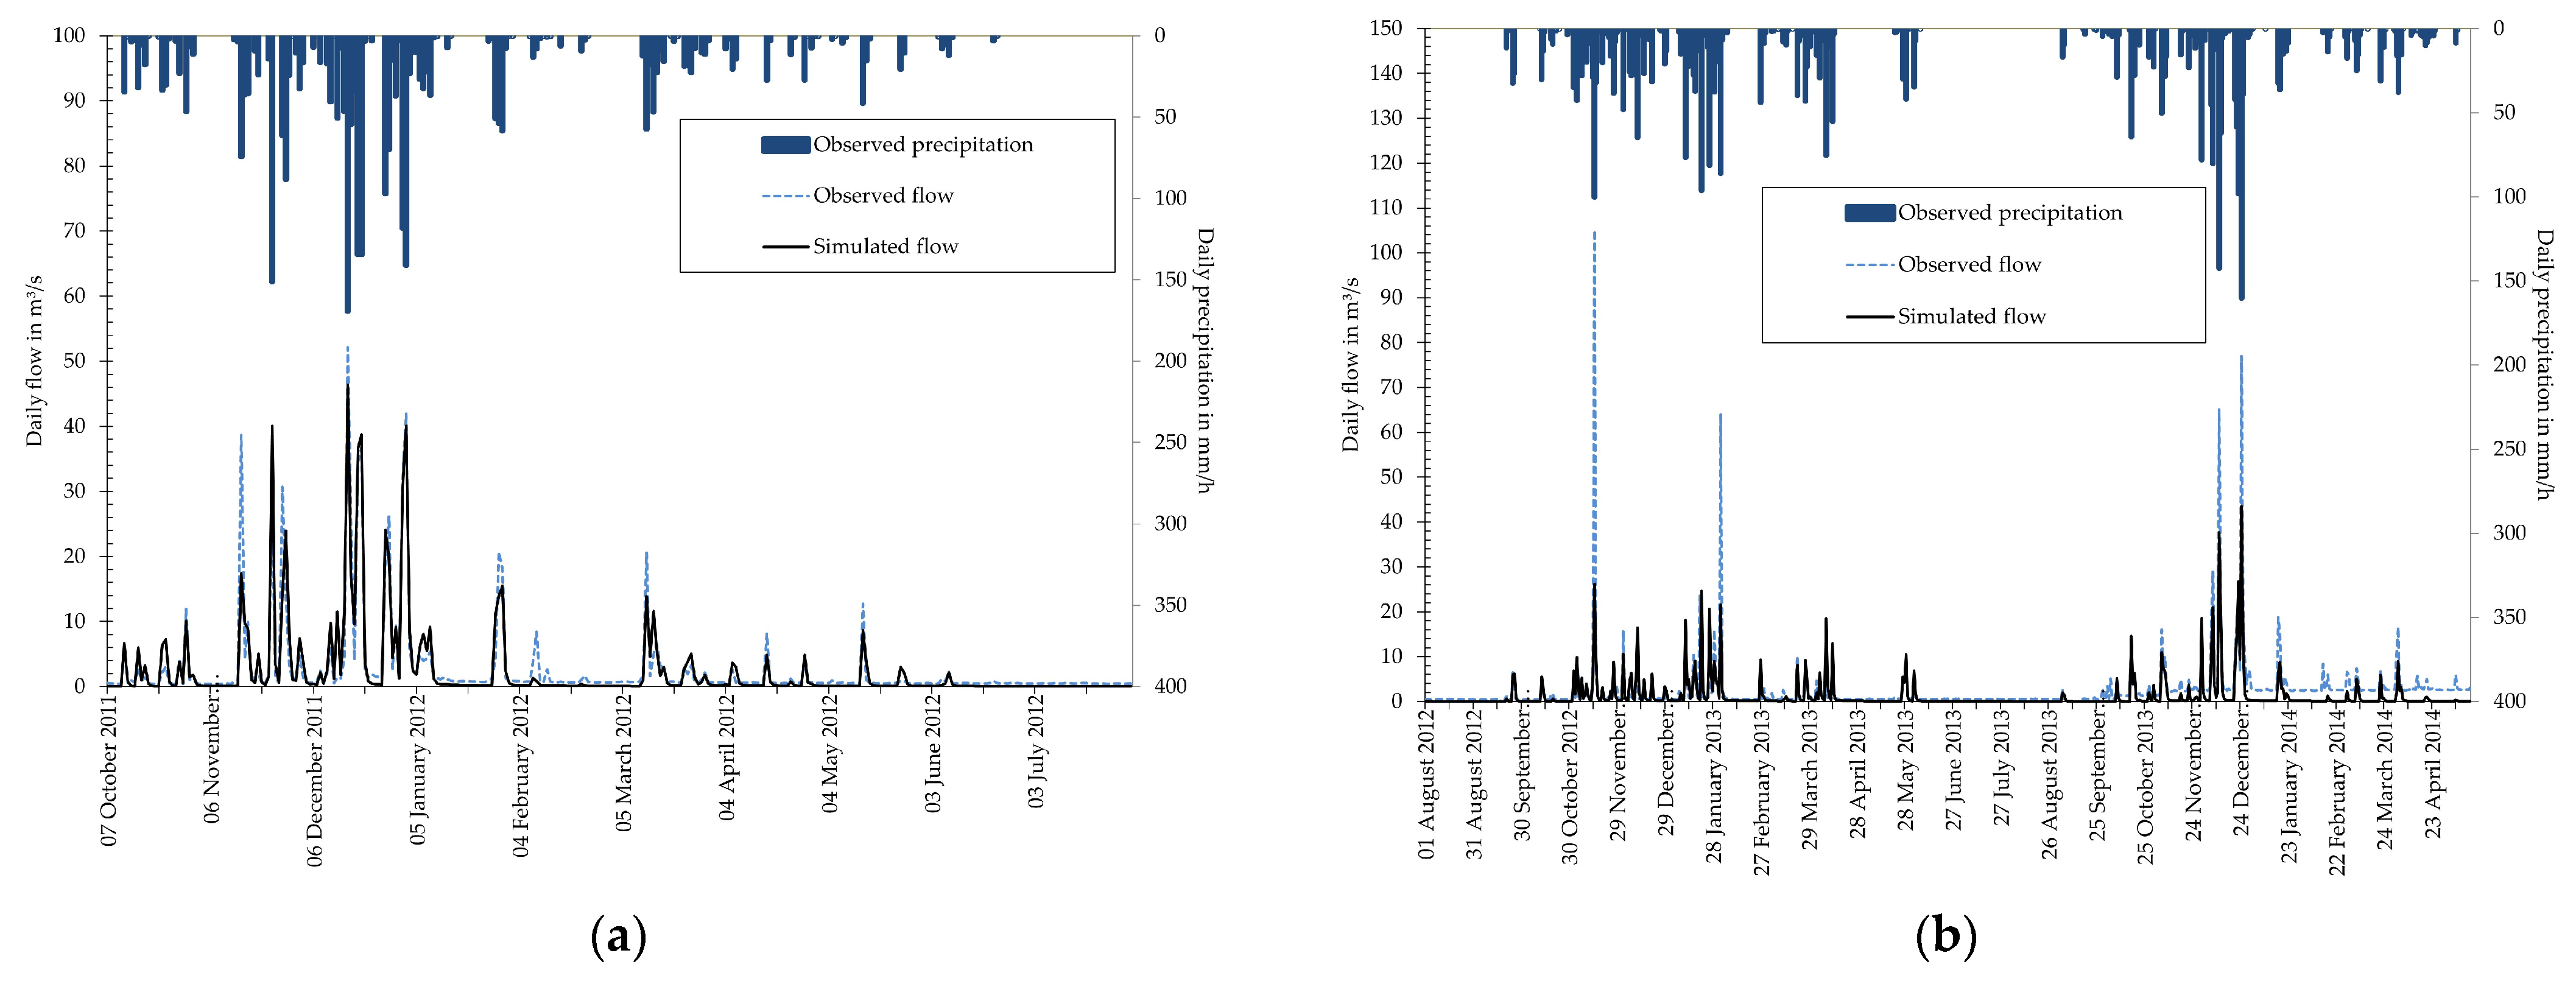
The establishment of the distributed hydrological model of the Arrudas catchment showed satisfactory results according to the results of the calibration and validation process for the time periods selected: the hydrological year 2011–2012 for calibration, and two hydrological years for validation (2012 to 2014). The Nash–Sutcliffe efficiency index yielded values of 0.86 and 0.54 for calibration and validation, respectively. These are excellent and acceptable values of model performance according to the recommendations of Moriasi et al. [54], which are widely used for this type of modelling. Visually (see Figure 7), the model shows that it is able to reproduce the dynamics of peak flows throughout the time series despite the sources of uncertainty that may be associated with the hydrological modelling process (input data, parameters, and conceptual structure of the model). Then, for the purpose of this research, which is to identify historical changes in the hydrological cycle with emphasis on floods, the model is acceptable for the simulation of the hydrological behaviour of the historical period 1940–2024. More research is needed if it is necessary to quantify the total uncertainty of the model, but in our case, it falls outside the scope of this paper (see a review about it in Moges et al. [45]).
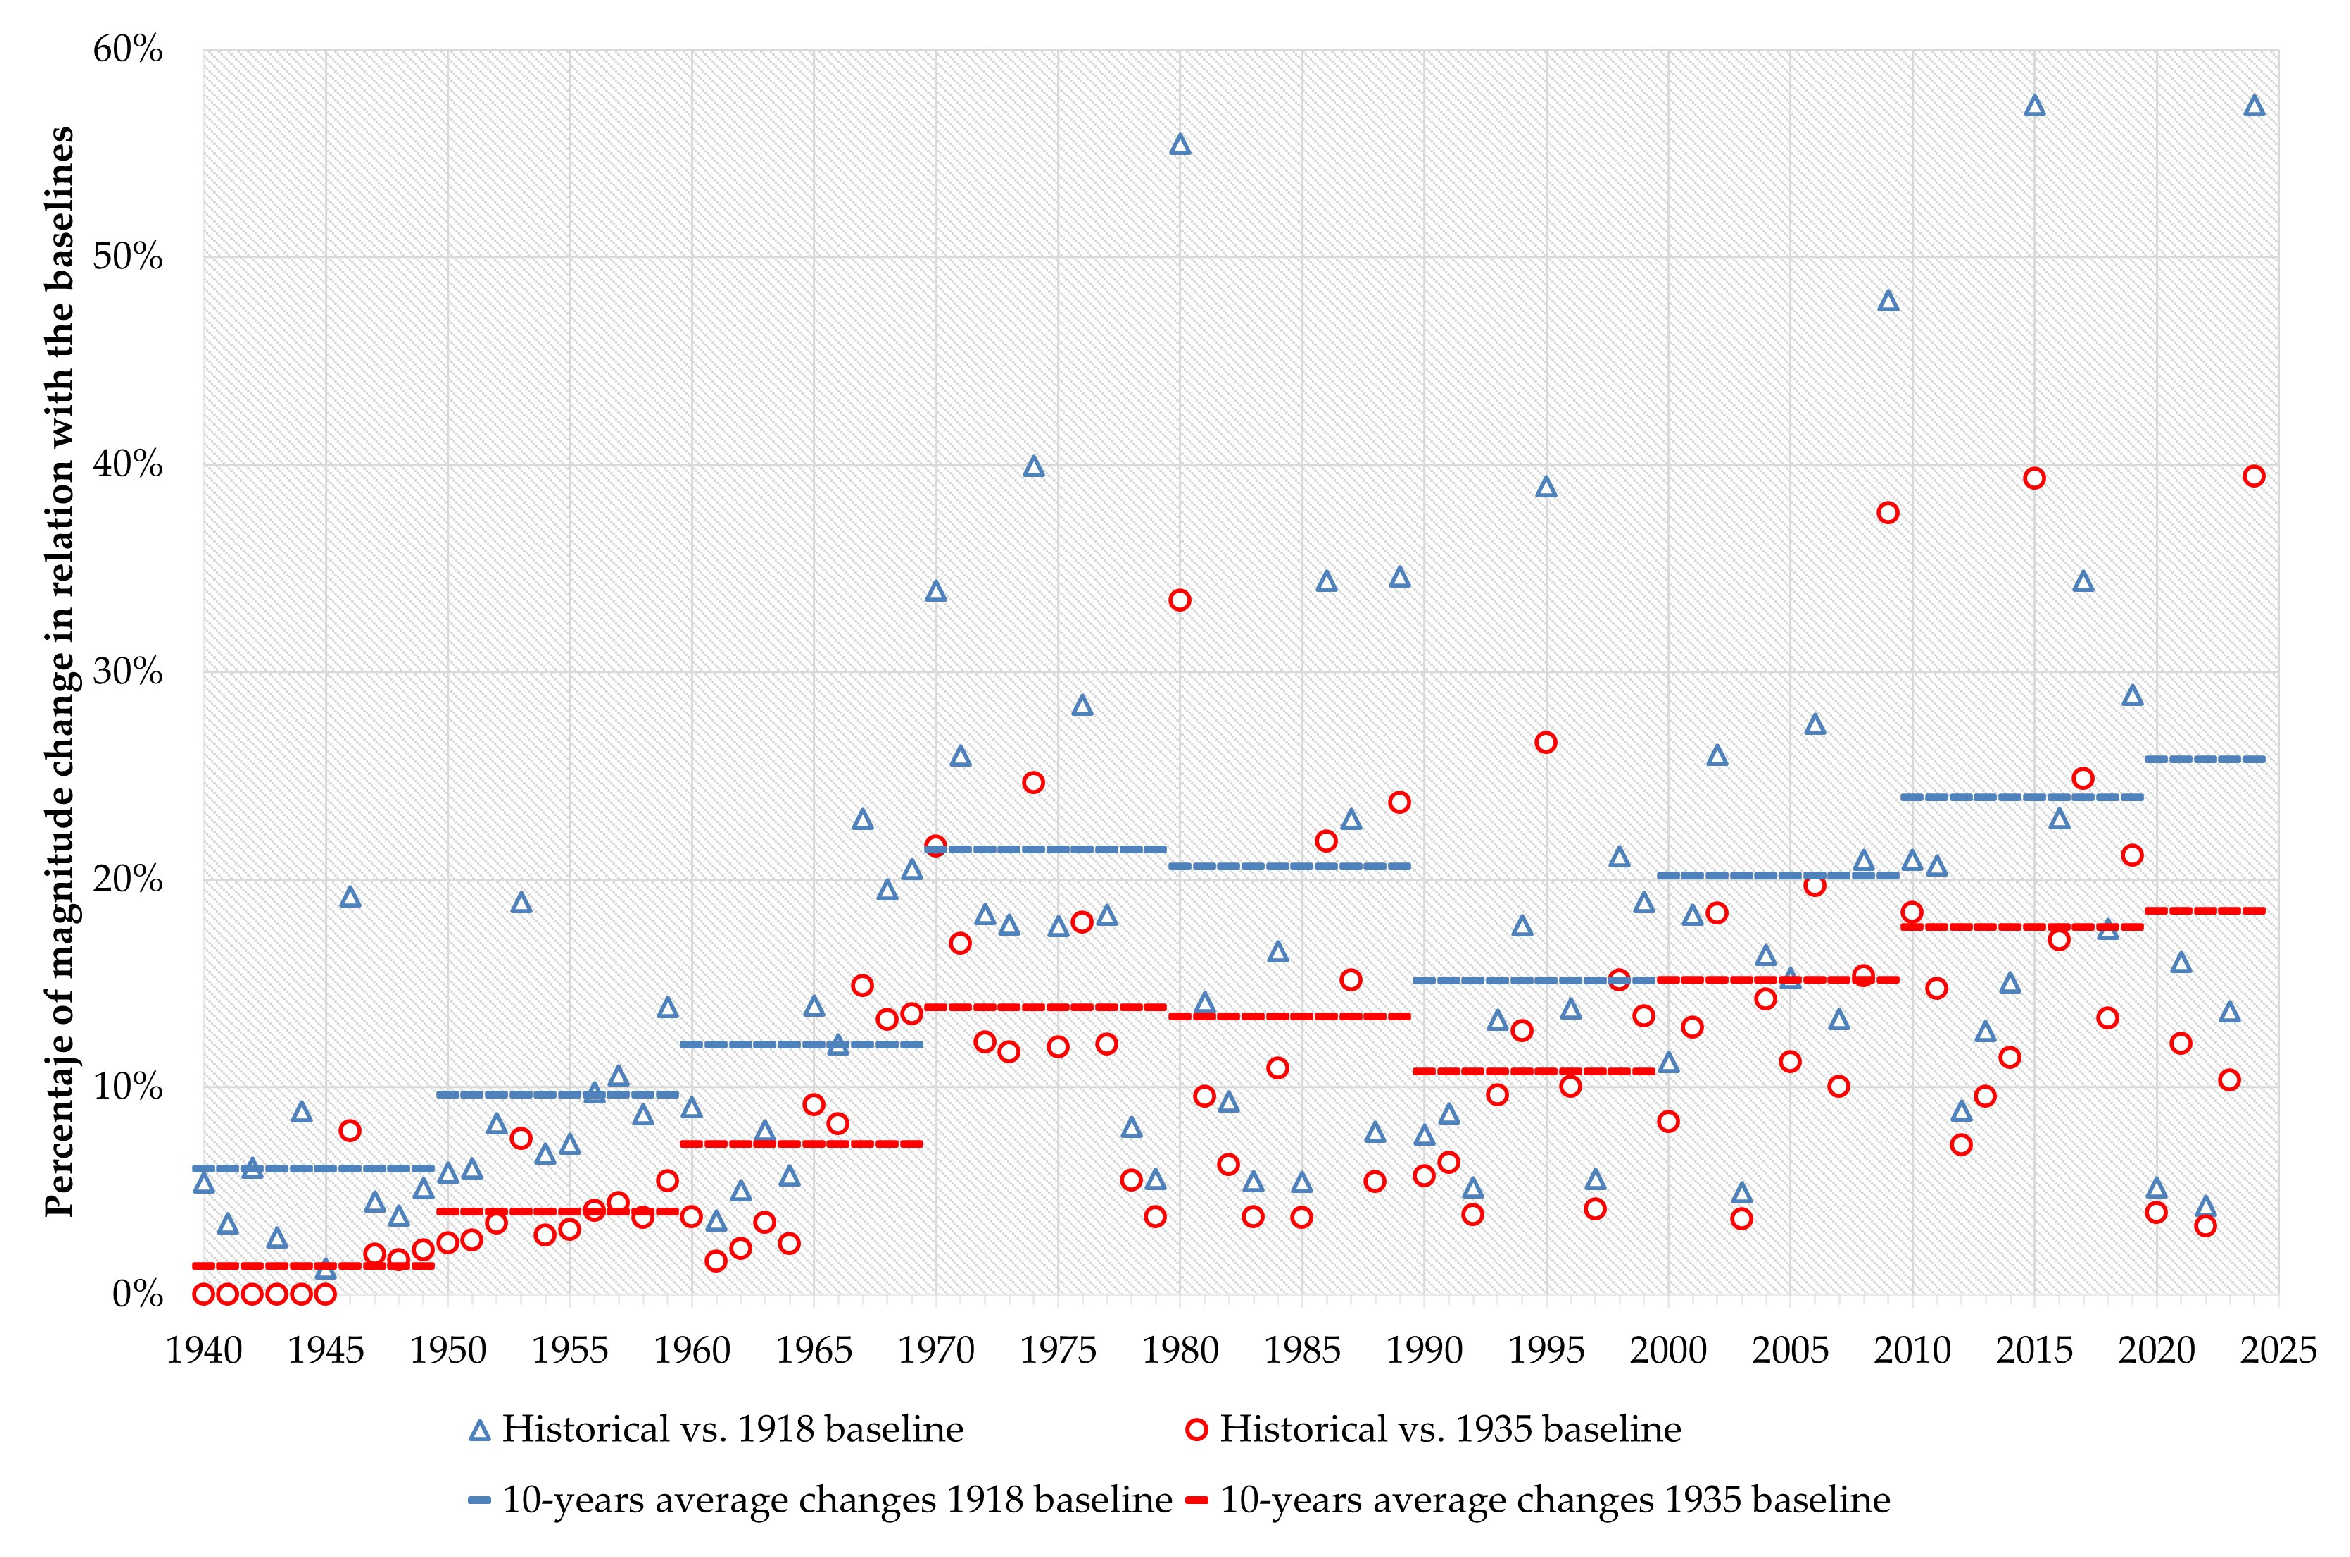
Based on the validated hydrological model, the simulations of the historical series 1940–2024 were launched, considering two baselines for comparison with respect to the state of land use: that of the city in conditions very close to those of its foundation (land use in 1918) and the closest available at the beginning of the simulation period (1935). The results of these two simulations show the response of the catchment without changes in land use and serve as a reference for the comparison of the changes produced in the hydrological cycle based on the results of the simulations of the historical period with the incorporation of the changes in land use. In this way, it is possible to quantify the effect that can be directly attributed to the change in land use produced by the urbanisation process throughout the historical period of analysis. Figure 8 shows the results of the comparison of the change in the annual maximum daily flow in terms of the historical series of changes with respect to the two baselines. The results show the effect of the urbanisation process on the magnification of peak flows over a wide range, with attributions up to approximately 60%. The trend is clearly increasing and is also accompanied by the changes in soil sealing presented in Figure 5. Compared to that of 1918, urban land in 1935 was already 87% larger, in 1950 it was 1.6 times larger, in 1977 3.01 times larger, in 1999 3.66 times, in 2007 3.85 times, and in 2018 this factor rose to 4.02. The accentuated effect between 1940 and 1980 reflects this accelerated territorial transformation, with an important jump between the 1960s and 1970s, coinciding with the beginning of one of the major territorial changes in which flooding started to become more recurrent [26].
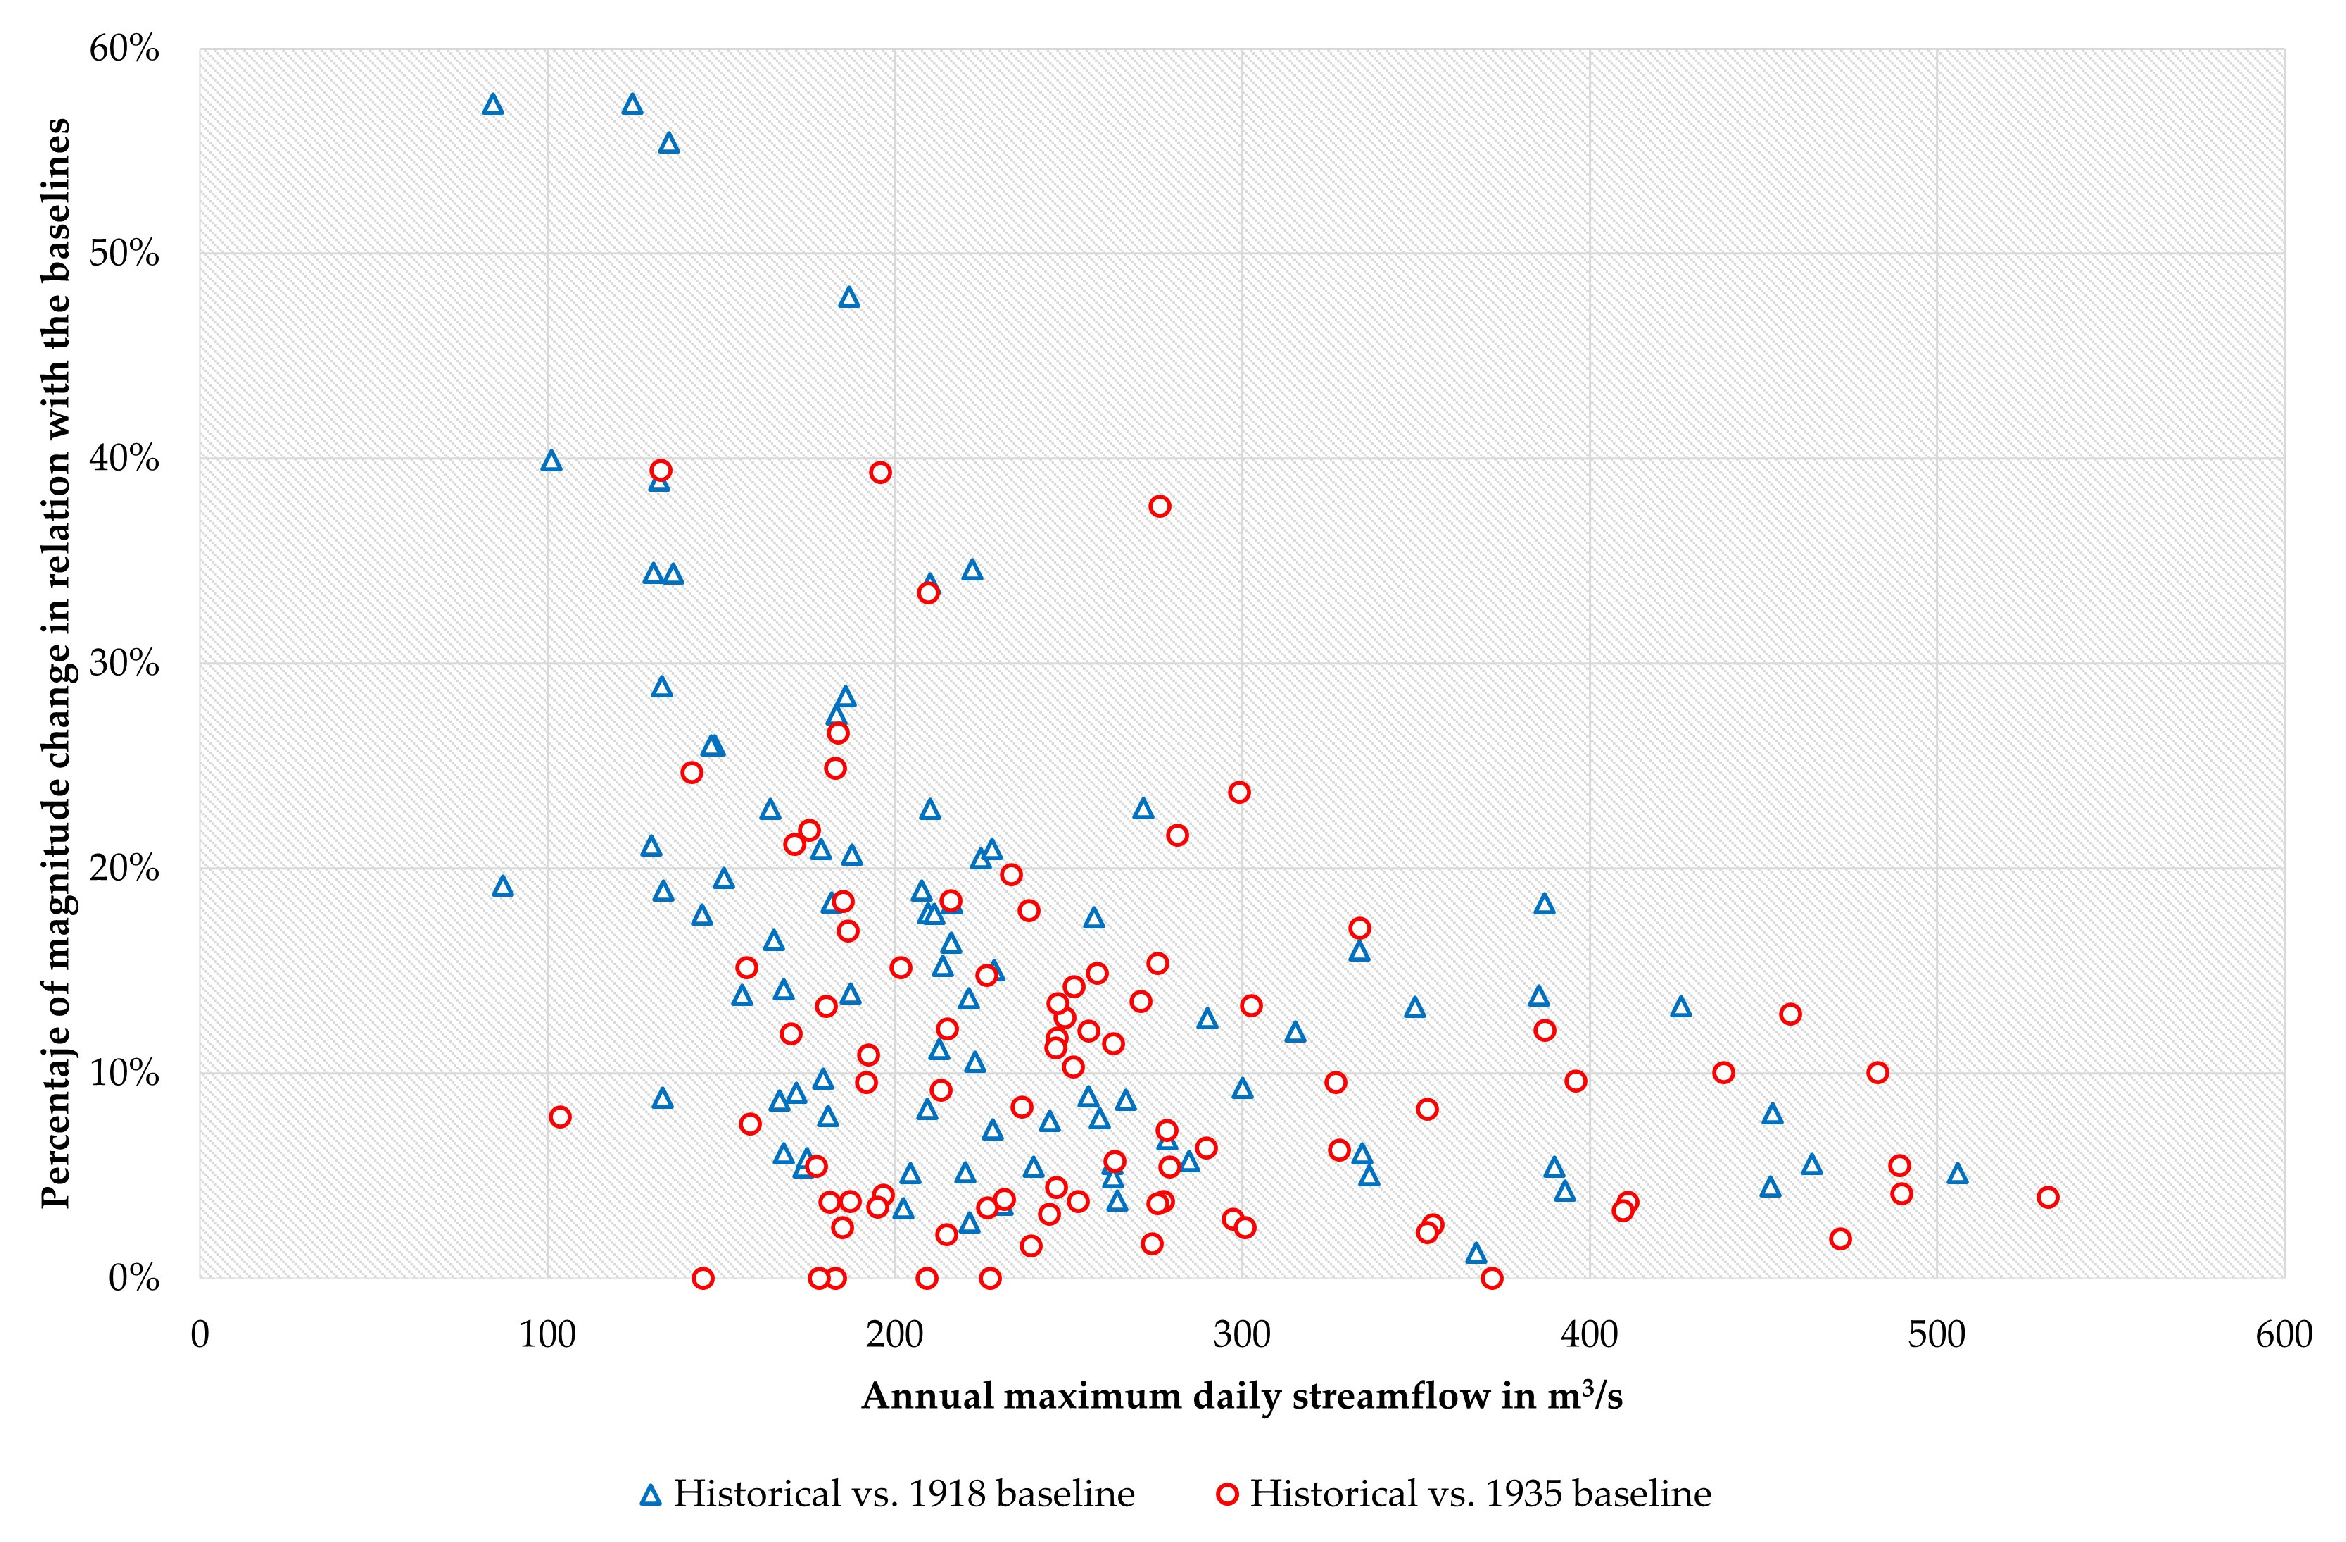
In Figure 8, the changes in lesser effect in certain decades, such as from the 1980s to the beginning of the 21st century, and of greater effect in other decades, can be explained by the relationship between the magnitude of the event and the role of the watershed as a mediator of the rainfall–runoff transformation process, a process which, as has already been mentioned, is not linear. By investigating this relationship (see Figure 9), it has been identified that the effect of the urbanisation process is more noticeable in smaller events than it is in larger events. This is caused by the effect on the alteration of the runoff generation mechanism, since, in smaller events, the effect of sealing makes the immediate generation of runoff more noticeable (due to the loss of the infiltration capacity of the soil), by the acceleration of the propagation of runoff through the surface and drainage network, and by the subsequent synchronisation of the response of the tributaries, which magnifies the maximum flood flow. In the case of large events, such an effect is not as noticeable, since the catchment functions rapidly as a whole. Such an effect supports the empirical observation made by Nunes et al. [65], which is based on recorded daily rainfall and flood occurrence data, regarding the increase in flooding related to low magnitude rainfall events.
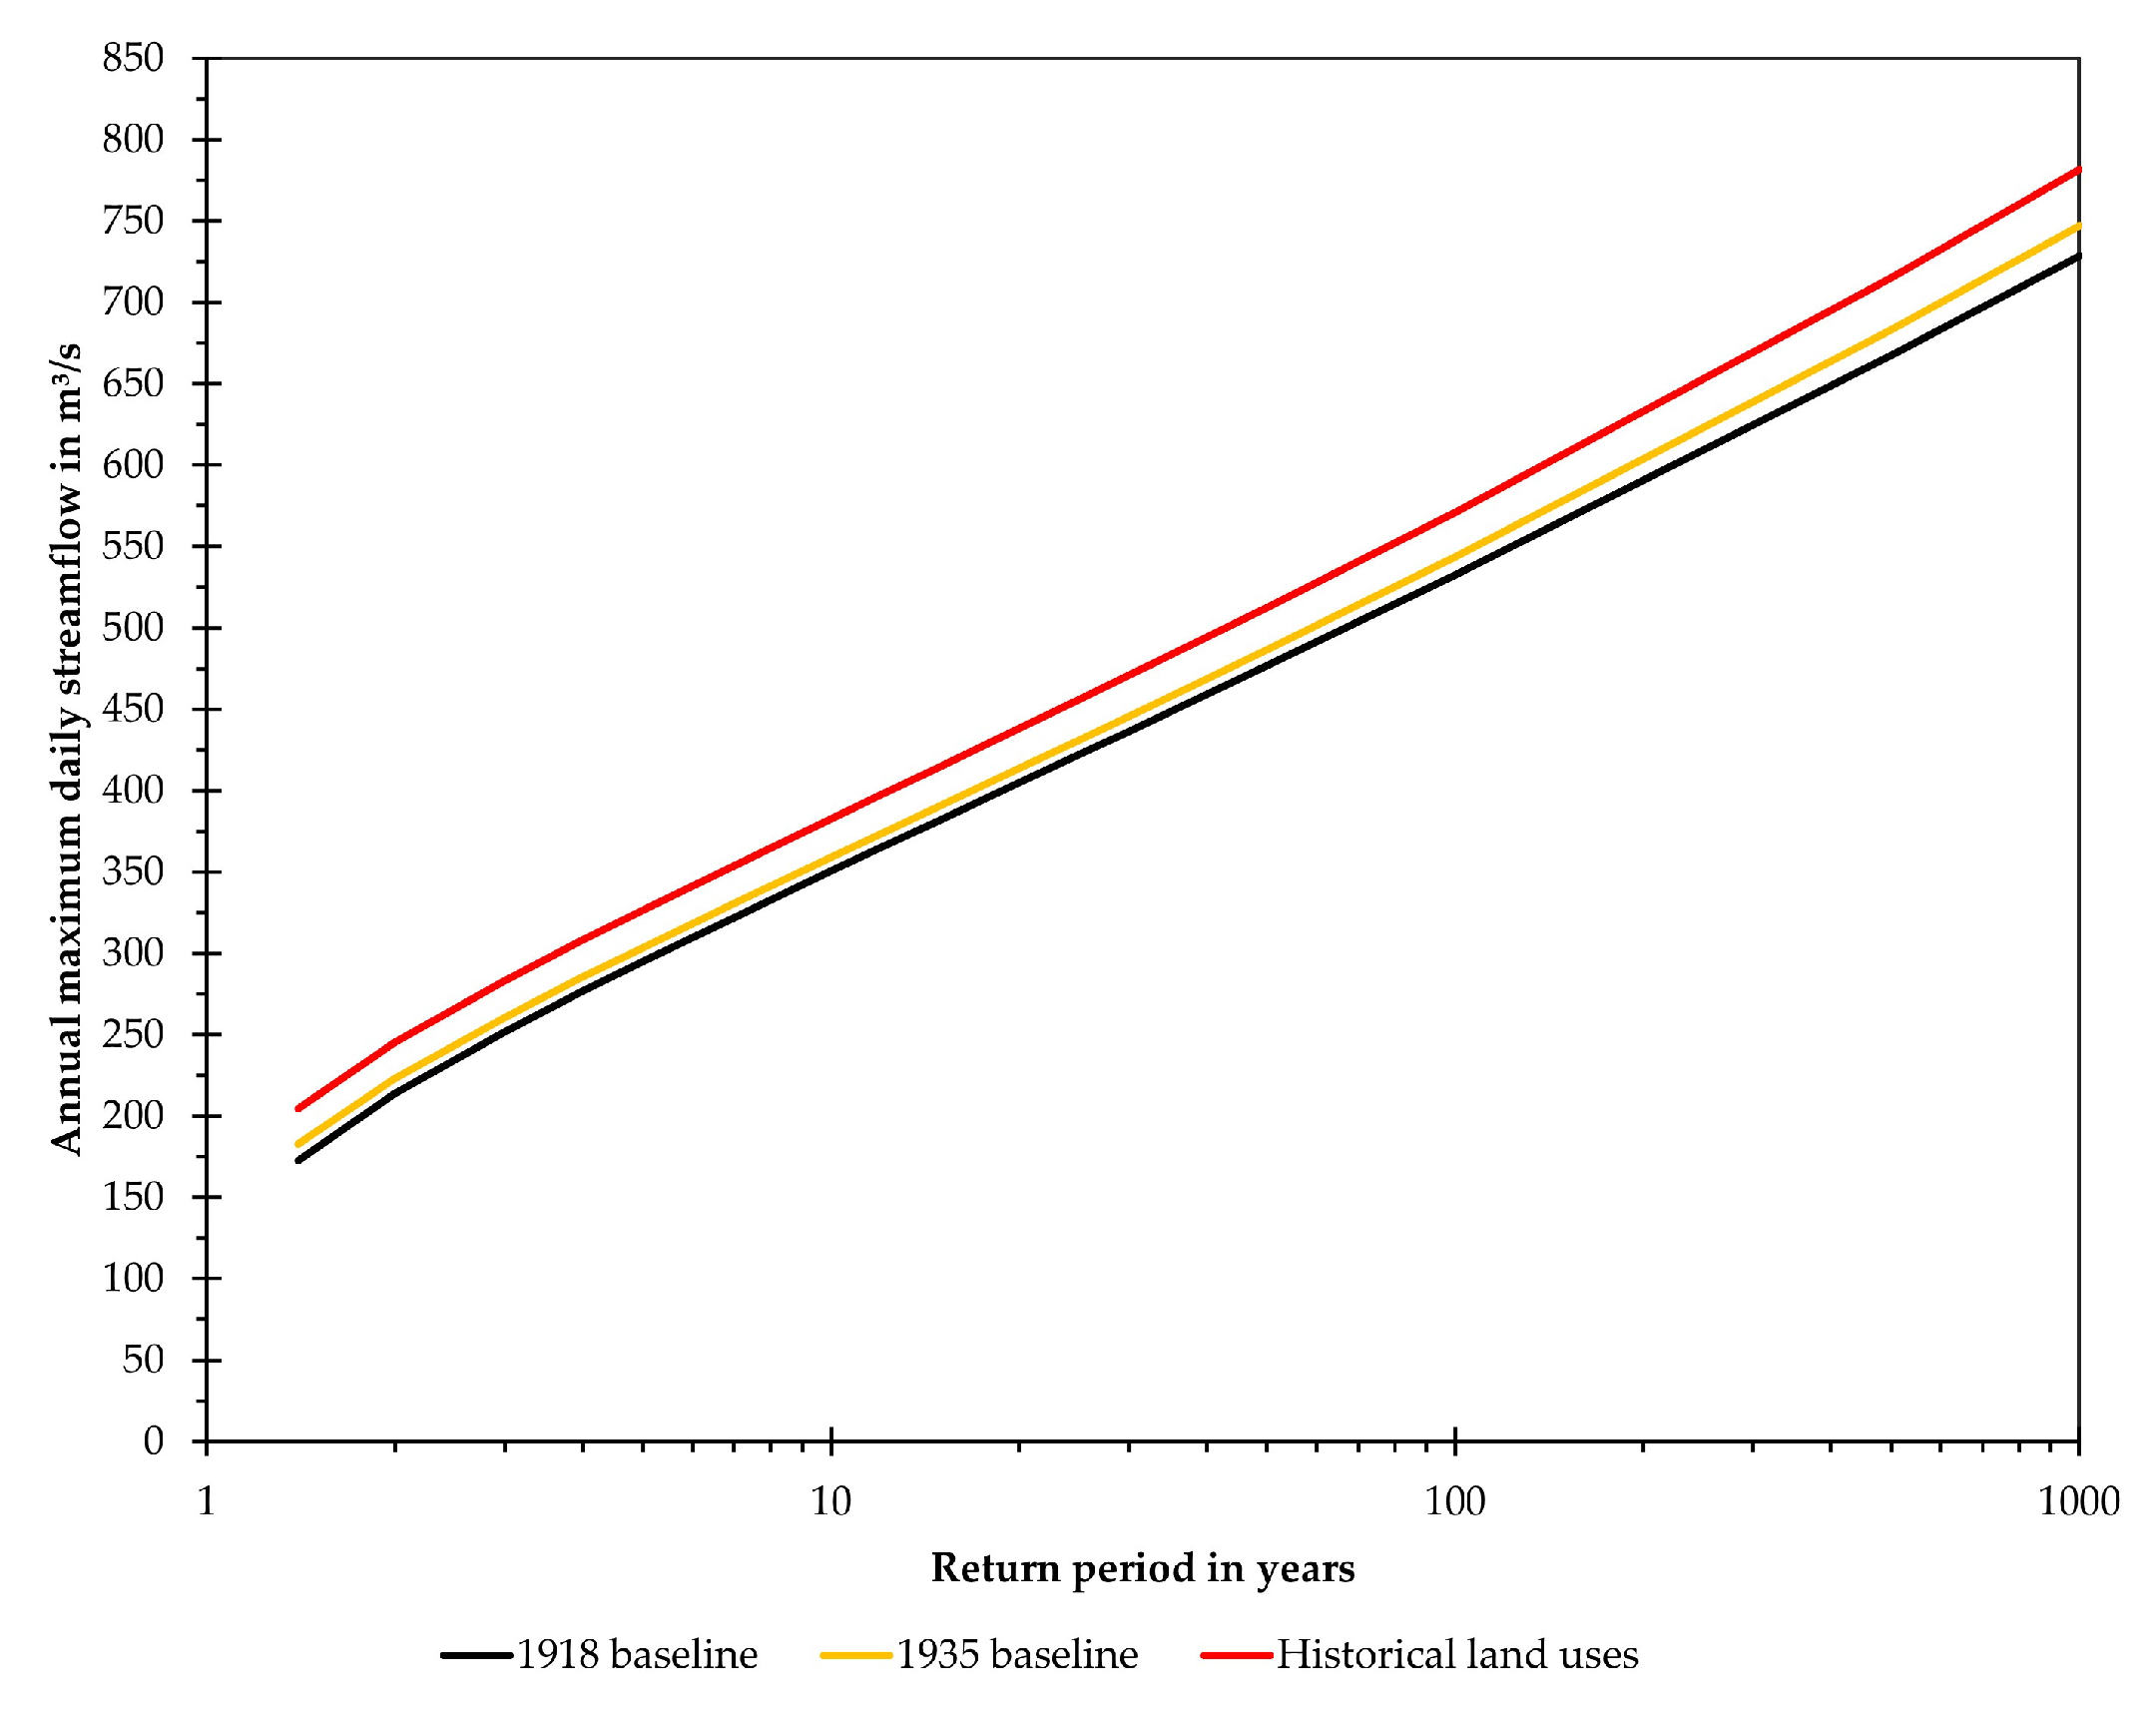
In order to illustrate the effect of land use change on flood magnitude and frequency, the Log-Pearson type-III probability distribution function was estimated from the results of the hydrological simulations, and the theoretical function was found to fit the behaviour of the data. From this estimation, the results of the two baselines were compared with those of the historical period (see Figure 10 and Table 2). The previous effect, analysed with respect to the relationship between the magnitude of change attributable to the urbanisation effect and the magnitude of the event, is evident: the higher the flood frequency, the greater the effect of the urbanisation process on the amplification of the flood magnitude. For events with a higher frequency of occurrence (return periods of 2, 5, and 10 years), the effect is greater (between 9 and 15% compared with the configuration of the city in 1918, and between 6 and 10% compared with the configuration of the city in 1935) than for events of medium frequency (25, 50, 100 years) and low frequency (500 and 1000 years).

4.5. Where Should Decisions Be Directed to Move Towards a More Sustainable and Resilient City?

As we have previously shown, the historical co-evolution of the city and its hydrological cycle has led to an increase in flood flows of the Arrudas catchment. Decisions focused on hydraulic infrastructure, such as channels (open or covered), have become obsolete as the city has grown, sealing the soil and affecting water distribution in the topsoil. The greater the imperviousness of the soil, the faster surface runoff is transferred to the network of channels, which have been artificialised, also accelerating flows downstream. Despite the DRENURBS programme’s promise to shift the focus of flood management, a key component of the programme has been ‘more of the same’: grey infrastructure. Recent floods have highlighted this, as have the results obtained in this study. In this regard, a real change in focus should be made, in which an increase in soil infiltration capacity through nature-based solutions—NbS (e.g., sustainable urban drainage systems such as green roofs, rainwater harvesting, infiltration systems, ponds and wetlands, among others—see [66]) could play an important role. Such NbS, aligned with an expansion of the city’s green infrastructure, could contribute to reducing the magnitude of floods, while the behaviour of the phenomenon in the flood zone is reviewed and radical decisions are taken, such as providing more room for the river while retaining water in the landscape [67]. Urban green spaces provide a range of ecosystem services simultaneously: reducing surface runoff through natural storage and infiltration; improving water quality; regulating urban microclimate; and enhancing biodiversity [68].
Likewise, this type of operation contributes to expanding and reinforcing the structure of the natural heritage system of urban and metropolitan environments, which is an essential factor in the construction of territorial resilience mechanisms [4]. Through its contribution to the strengthening of social cohesion and identity, the economic development of cooperation networks and the recovery of biodiversity in degraded ecosystems, the natural heritage system will benefit from the recovery of land ecosystem services.

5. Conclusions

This article provides a contribution from the perspective of environmental history to one of the main challenges of urban flood management: understanding the origins and causes of floods. Its approach differs from the most common approach found to date, which involves focusing on the impacts. To this end, a qualitative–quantitative approach has been adopted, and the case study selected is that of the city of Belo Horizonte, one of the most important cities in Brazil, and the first Brazilian city to be technically planned at the end of the 19th century. It was originally built on the alluvial plain of the Arrudas river, since this was considered as its backbone not only in terms of landscape, but also in terms of services. However, this city underwent accelerated urban sprawl that overtook its planning in less than half a century and triggered the “socio-ecological problems” of the city’s progress: bad smells, a host of disease vectors, and flooding. To solve these problems, the prevailing paradigm up until the beginning of the 21st century involved open and then closed channels, which further aggravated the problem, rendering it cyclical and co-evolving. Increased soil sealing contributes towards increasing the magnitude of surface runoff, which, in turn, accelerates the process of propagation down the catchment to the drainage network. Since this network has been artificialised, water moves faster through the urban drainage system, which eventually becomes insufficient, causing overflows, triggering flooding. The city has continued to grow; the canals have persisted, but the flooding has not stopped. This shows that the approach to flood management has become obsolete, resulting in an increase in flood risk and resilience loss.
This study has shown that there is no complete correspondence between the increase in the magnitude of storms due to the possible effects of climate change and the increase in the occurrence of floods. From the analysis of historical series of daily rainfall and flood reports in the city, the non-linear nature of the processes associated with the generation and translation of surface runoff, where the watershed plays a fundamental role, has become evident. Hence, the need to understand, both spatially and temporally, the functioning of the hydrological cycle in the catchment and the effects thereon caused by drastic changes in land use during the 20th and 21st centuries. The results of the modelling of the historical growth periods of the city, compared to the city immediately after its foundation in 1918 and a few years later in 1935, show the effect of the urbanisation process on the magnification of peak flows across a wide range, with attributions of up to approximately 60%. The trend is clearly increasing and is further accompanied by growing changes in soil sealing. These were most intense in the period between 1940 and 1980, when the city’s surface area increased by just over three times. In this regard, the most rapid change occurred between 1950 and 1977, as reflected in the increase in the magnitude of floods.
The magnification effect of the peak flow due to soil sealing becomes more noticeable depending on the magnitude of the storm. This is more noticeable in smaller events than in larger events. This is caused by the effect on the alteration of the runoff generation mechanism, since, in smaller events, the effect of sealing makes the immediate generation of runoff more noticeable, by the acceleration of its propagation through the surface and drainage network, and by the subsequent synchronisation of the response of the tributaries that causes the peak flow to be magnified. In the case of large events, this effect is not as noticeable since the catchment rapidly functions as a whole, thereby reducing the role of the soil in the runoff generation process. This exerts a direct impact on the behaviour of flood magnitude and frequency, which is essential information for flood analysis and associated risk management measures. The analysis of flood frequency shows that, in comparison with the configuration of the city in 1918, the effect is greater for events with a higher frequency of occurrence (events that occur at least once in 2, 5, or 10 years, at 15, 11, and 9%, respectively), than for those with a medium frequency (25, 50, and 100 years, at between 9 and 8%), and low frequency (500 and 100 years, approximately 7%). The above results are very useful for decision-making regarding adaptation measures in which the possible effects of climate change should be considered. To this end, as this study shows, a crucial role is played by the recovery of the infiltration capacity of the soil in the catchment via Nbs, increasing the green infrastructure and recovering the natural heritage, thereby reversing the effect that urban growth has exerted on the hydrological cycle.

Author Contributions

Conceptualization, S.S.-G. and A.G.M.G.e.S.; methodology, S.S.-G.; software, S.S.-G.; validation, S.S.-G.; formal analysis, S.S.-G.; investigation, S.S.-G. and A.G.M.G.e.S.; resources, S.S.-G. and A.G.M.G.e.S.; data curation, S.S.-G.; writing—original draft preparation, S.S.-G.; writing—review and editing, S.S.-G., A.G.M.G.e.S., D.S.-F. and E.J.M.-A.; visualisation, S.S.-G.; supervision, S.S.-G., D.S.-F. and E.J.M.-A.; project administration, S.S.-G.; funding acquisition, S.S.-G. All authors have read and agreed to the published version of the manuscript.

Funding

S Salazar-Galán is supported by the research talent recruitment programme “EMERGIA”, Call 2021, Consejería de Universidad, Investigación e Innovación, Junta de Andalucía, Spain (ref: EMC21_00413). The APC was funded by this grant.

Institutional Review Board Statement

Not applicable.

Informed Consent Statement

Not applicable.

Data Availability Statement

Data will be made available on request.

Conflicts of Interest

The authors declare no conflicts of interest. The funders had no role in the design of the study; in the collection, analyses, or interpretation of data; in the writing of the manuscript; or in the decision to publish the results.

References

  1. Macklin, M.G.; Lewin, J. The rivers of civilization. Quat. Sci. Rev. 2015, 114, 228–244. [Google Scholar] [CrossRef]
  2. Plazas, C. La Sociedad Hidráulica Zenú: Estudio Arqueológico de 2.000 Años de Historia en las Llanuras del Caribe Colombiano; Banco de la República, Museo del Oro: Bogotá, Colombia, 1993; 299p, ISBN 9589028926. [Google Scholar]
  3. Kidder, T.R.; Liu, H. Bridging theoretical gaps in geoarchaeology: Archaeology, geoarchaeology, and history in the Yellow River valley, China. Archaeol. Anthropol. Sci. 2017, 9, 1585–1602. [Google Scholar] [CrossRef]
  4. Salazar-Galán, S.; Mascort-Albea, E.; Sánchez-Fuentes, D. Post-COVID-19 territorial redefinition: Resilience in the face of risks and imbalances in urban-rural patterns. Rev. EURE—Rev. Estud. Urbano Reg. 2022, 48, 1–9. [Google Scholar] [CrossRef]
  5. Di Baldassarre, G.; Kooy, M.; Kemerink, J.S.; Brandimarte, L. Towards understanding the dynamic behaviour of floodplains as human-water systems. Hydrol. Earth Syst. Sci. 2013, 17, 3235–3244. [Google Scholar] [CrossRef]
  6. Di Baldassarre, G.; Viglione, A.; Carr, G.; Kuil, L.; Salinas, J.L.; Blöschl, G. Socio-hydrology: Conceptualising human-flood interactions. Hydrol. Earth Syst. Sci. 2013, 17, 3295–3303. [Google Scholar] [CrossRef]
  7. Plate, E.J. Flood Risk and Flood Management. J. Hydrol. 2002, 267, 2–11. [Google Scholar] [CrossRef]
  8. Rentschler, J.; Avner, P.; Marconcini, M.; Su, R.; Strano, E.; Vousdoukas, M.; Hallegatte, S. Global evidence of rapid urban growth in flood zones since 1985. Nature 2023, 622, 87–92. [Google Scholar] [CrossRef]
  9. Tingsanchali, T. Urban Flood Disaster Management. Procedia Eng. 2012, 32, 25–37. [Google Scholar] [CrossRef]
  10. Pinos, J.; Quesada-Román, A. Flood risk-related research trends in Latin America and the Caribbean. Water 2021, 14, 10. [Google Scholar] [CrossRef]
  11. Schiermeier, Q. Droughts, heatwaves and floods: How to tell when climate change is to blame. Nature 2018, 560, 20–22. [Google Scholar] [CrossRef]
  12. Lahsen, M.; Ribot, J. Politics of attributing extreme events and disasters to climate change. Wiley Interdiscip. Rev. Clim. Change 2022, 13, e750. [Google Scholar] [CrossRef]
  13. Alves, P.B.; Amanguah, E.; McNally, D.; Espinoza, M.; Ghaedi, H.; Reilly, A.C.; Hendricks, M.D. Navigating the definition of urban flooding: A conceptual and systematic review of the literature. Water Sci. Technol. 2024, 90, 2796–2812. [Google Scholar] [CrossRef]
  14. González de Molina, M.; Toledo, V.M. Environmental History as Sustainability Science. In The Social Metabolism: A Socio-Ecological Theory of Historical Change, 2nd ed.; Springer International Publishing: Cham, Switzerland, 2023; pp. 9–46. ISBN 978-3-031-48410-0. [Google Scholar]
  15. Sanchez-Calderon, V.; Blanc, J. Latin American Environmental History: Change and Continuity in a Growing Field. Hist. Crítica 2019, 74, 3–18. [Google Scholar] [CrossRef]
  16. Aragón-Durand, F. Inundaciones en Zonas Urbanas de Cuencas en América Latina, 1st ed.; Soluciones Prácticas: Lima, Peru, 2014. [Google Scholar]
  17. Fernández Illescas, C.; Buss, S. Ocurrencia y Gestión de Inundaciones en América Latina y el Caribe-Factores Claves y Experiencia Adquirida; Nota Técnica N° IDB-TN-924; Banco Interamericano de Desarrollo, División de Agua y Saneamiento: Washington, DC, USA, 2016. [Google Scholar]
  18. Novillo Rameix, N. Climate change and environmental social conflicts in intermediary cities of Latin America and the Caribbean. Let. Verdes Rev. Latinoam. Estud. Socioambient. 2018, 24, 124–142. [Google Scholar] [CrossRef]
  19. Serna Quintana, C.A. The social nature of floods and landslides in Medellín (1930–1990). Hist. Crítica 2011, 43, 198–223. [Google Scholar] [CrossRef]
  20. Capilé, B.; Sedrez, L.F. Water labour: Urban metabolism, energy and rivers in nineteenth-century. In More-Than-Human Histories of Latin America and the Caribbean: Decentring the Human in Environmental History; de Carvalho Cabral, D., Vasques Vital, A., Gascón, M., Eds.; University of London Press: London, UK; pp. 119–139. ISBN 978-1-915249-52-4.
  21. Brailovsky, A. Buenos Aires, Ciudad Inundable; Capital Intelectual: Buenos Aires, Argentina, 2010; 248p. [Google Scholar]
  22. Vitz, M. A City on a Lake: Urban Political Ecology and the Growth of Mexico City; Duke University Press: Durham, NC, USA, 2020. [Google Scholar]
  23. dos Santos, F.A. Inundações na cidade de São Paulo, uma construção social. Histórica 2015, 62, 15–22. [Google Scholar]
  24. Instituto Brasileiro de Geografia e Estatística. Estimates of the Resident Population in Brazilian Municipalities with a Reference Date of 1 July 2025. Available online: https://servicodados.ibge.gov.br/api/docs/pesquisas (accessed on 11 August 2025). (In Portuguese)
  25. McDonald, D.L. The origins of informality in a Brazilian planned city: Belo Horizonte, 1889–1900. J. Urban Hist. 2021, 47, 29–49. [Google Scholar] [CrossRef]
  26. Borsagli, A.; Prado, I.; Granceri Bradaschia, M. The City of Waters: Art, Perceptions, and Historical–Geographical Studies on the Hydrographic Network of Belo Horizonte (Brazil). In Climate Change Adaptation, Flood Risk, and Beyond: State of Play in the Science-Policy-Action Nexus; Springer Nature: Cham, Switzerland, 2024; pp. 285–310. [Google Scholar] [CrossRef]
  27. Comissão Construtora da Nova Capital. Planta Geral da Cidade de Minas, Organizada Sobre a Planta Geodésica, Topográfica e Cadastral de Belo Horizonte. Available online: http://www.comissaoconstrutora.pbh.gov.br/exe_dados_documento.php?intCodigoDoc=CC%20Dt%2006%20007&strTipo=MAPAS%20E%20PLANTAS# (accessed on 24 August 2025).
  28. Millington, N. Stormwater politics: Flooding, infrastructure, and urban political ecology in São Paulo, Brazil. Water Altern. 2021, 14, 866–885. [Google Scholar]
  29. Borsagli, A. O Vale Do Córrego Do Leitão Em Belo Horizonte: Contribuições Da Cartografia Para a Compreensão Da Sua Ocupação. In Proceedings of the Anais Do 1o Simpósio Brasileiro de Cartografia Histórica, Paraty, Brazil, 11–14 May 2011; pp. 1–17. [Google Scholar]
  30. Borsagli, A.; Melo Bernardes, B. Sob o asfalto do progresso: Os rios invisíveis da zona urbana de Belo Horizonte. Rev. Eletrônica Arq. Público Cid. Belo Horiz. 2016, 3, 25–45. [Google Scholar]
  31. Cavalcante, L.V.B. A Bacia do rio Arrudas: Análise das Inundações Entre 1930 a 2005 no Município de Belo Horizonte/MG. Master’s Thesis, Universidade Federal de Minas Gerais, Belo Horizonte, Brazil, 2011. [Google Scholar]
  32. Alves Rodrigues, L.A. Impacto do Processo de Urbanização na Formação de Enchentes e Alagamentos em Belo Horizonte, MG. Postgraduate’s Thesis, Universidade Federal de Minas Gerais, Belo Horizonte, Brazil, 2020. [Google Scholar]
  33. Zevenbergen, C.; Gersonius, B.; Radhakrishan, M. Flood resilience. Philos. Trans. R. Soc. A 2020, 378, 20190212. [Google Scholar] [CrossRef] [PubMed]
  34. Assis, W.L.; Magalhães Junior, A.P.; de Azevedo Lopes, F.W. Urban Flooding in the City of Belo Horizonte Southeastern Brazil. In Urban Flooding in Brazil; Mendonça, F., Farias, A., Buffon, E., Eds.; Springer International Publishing: Cham, Switzerland, 2023; pp. 107–132. [Google Scholar]
  35. CBH Velhas. Plano Diretor de Recursos Hídricos: Unidade Territorial Estratégica Ribeirão Arrudas; CBH Velhas: Belo Horizonte, Brazil, 2016.
  36. Assis, W.L. O Sistema Clima Urbano do Município de Belo Horizonte na Perspectiva Têmporo-Espacial. Doctoral Thesis, Universidade Federal de Minas Gerais, Belo Horizonte, Brazil, 2010. [Google Scholar]
  37. Instituto Nacional de Meteorologia. Normal Climatológica do Brasil 1991–2020: Precipitação Acumulada Mensal e Anual (mm). Available online: https://portal.inmet.gov.br/normais (accessed on 2 May 2025).
  38. Hersbach, H.; Bell, B.; Berrisford, P.; Biavati, G.; Horányi, A.; Muñoz Sabater, J.; Nicolas, J.; Peubey, C.; Radu, R.; Rozum, I.; et al. ERA5 Hourly Data on Single Levels from 1940 to Present; ECMWF: Reading, UK, 2023. [Google Scholar] [CrossRef]
  39. Lima, F.N.; dos Santos Fernandes, W.; Nascimento, N. Joint calibration of a hydrological model and rating curve parameters for simulation of flash flood in urban areas. RBRH 2019, 24, e24. [Google Scholar] [CrossRef]
  40. Velhas River Basin Authority. Geographic Information System. Available online: https://www.siga.cbhvelhas.org.br/portal/index.zul (accessed on 16 May 2025).
  41. Digital Terrain Model © JAXA/METI ALOS PALSAR L1.0 2007. Available online: https://www.earthdata.nasa.gov/data/catalog/asf-alos-psr-l1.0-1 (accessed on 24 August 2024).
  42. Winkler, K.; Fuchs, R.; Rounsevell, M.; Herold, M. HILDA+ Global Land Use Change Between 1960 and 2019; PANGAEA: London, UK, 2020. [Google Scholar] [CrossRef]
  43. Hengl, T.; Mendes de Jesus, J.; Heuvelink, G.B.M.; Ruiperez Gonzalez, M.; Kilibarda, M.; Blagotić, A.; Shangguan, W.; Wright, M.N.; Geng, X.; Bauer-Marschallinger, B.; et al. SoilGrids250m: Global gridded soil information based on machine learning. PLoS ONE 2017, 12, e0169748. [Google Scholar] [CrossRef] [PubMed]
  44. Simons, G.; Koster, R.; Droogers, P. HiHydroSoil v2.0—High Resolution Soil Maps of Global Hydraulic Properties; Future Water: Wageningen, The Netherlands, 2020; 18p. [Google Scholar]
  45. Moges, E.; Demissie, Y.; Larsen, L.; Yassin, F. Sources of hydrological model uncertainties and advances in their analysis. Water 2021, 13, 28. [Google Scholar] [CrossRef]
  46. Francés, F.; Vélez, J.I.; Vélez, J.J. Split-parameter structure for the automatic calibration of distributed hydrological models. J. Hydrol. 2007, 332, 226–240. [Google Scholar] [CrossRef]
  47. Beneyto, C.; Aranda, J.Á.; Salazar-Galán, S.; Garcia-Bartual, R.; Albentosa, E.; Francés, F. Expanding information for flood frequency analysis using a weather generator: Application in a Spanish Mediterranean catchment. J. Hydrol. Reg. Stud. 2024, 53, 101826. [Google Scholar] [CrossRef]
  48. Droppers, B.; Rakovec, O.; Avila, L.; Azimi, S.; Cortés-Torres, N.; De León Pérez, D.; Samaniego, L. Multi-model hydrological reference dataset over continental Europe and an African basin. Sci. Data 2024, 11, 1009. [Google Scholar] [CrossRef]
  49. Sánchez, H.G.; Loaiza Usuga, J.C.; Vélez Upégui, J.I. Hydrological Response to Predominant Land Use and Land Cover in the Colombian Andes at the Micro-Watershed Scale. Land 2024, 13, 1140. [Google Scholar] [CrossRef]
  50. Canadell, J.; Jackson, R.B.; Ehleringer, J.B.; Mooney, H.A.; Sala, O.E.; Schulze, E.D. Maximum rooting depth of vegetation types at the global scale. Oecologia 1996, 108, 583–595. [Google Scholar] [CrossRef]
  51. Leonards, G.A. Engineering properties of soils. In Foundation Engineering; McGraw-Hill: New York, NY, USA, 1962. [Google Scholar]
  52. Domenico, P.A.; Schwartz, F.W. Physical and Chemical Hydrogeology, 2nd ed.; Wiley: New York, NY, USA, 1998. [Google Scholar]
  53. Naeini, M.R.; Analui, B.; Gupta, H.V.; Duan, Q.; Sorooshian, S. Three decades of the Shuffled Complex Evolution (SCE-UA) optimization algorithm: Review and applications. Sci. Iran. 2019, 26, 2015–2031. [Google Scholar] [CrossRef]
  54. Moriasi, D.N.; Gitau, M.W.; Pai, N.; Daggupati, P. Hydrologic and water quality models: Performance measures and evaluation criteria. Trans. ASABE 2015, 58, 1763–1785. [Google Scholar] [CrossRef]
  55. Valentini, M.H.K.; Beskow, S.; Beskow, T.L.C.; de Mello, C.R.; Cassalho, F.; da Silva, M.E.S. At-Site Flood Frequency Analysis in Brazil. Nat. Hazards 2024, 120, 601–618. [Google Scholar] [CrossRef]
  56. De León Pérez, D.; Acosta Vega, R.; Salazar Galán, S.; Aranda, J.Á.; Francés García, F. Toward systematic literature reviews in hydrological sciences. Water 2024, 16, 436. [Google Scholar] [CrossRef]
  57. Rodrigues de Aguiar, T.F. Vastos Subúrbios da Nova Capital: Formação do Espaço Urbano na Primeira Periferia de Belo Horizonte. Doctoral Thesis, Universidade Federal de Minas Gerais, Belo Horizonte, Brazil, 2006. [Google Scholar]
  58. de Souza, J. A expansão urbana de Belo Horizonte e da Região Metropolitana de Belo Horizonte: O caso específico do município de Ribeirão das Neves. Doctoral Thesis, Universidade Federal de Minas Gerais, Belo Horizonte, Brazil, 2008. [Google Scholar]
  59. Instituto Nacional de Estatistica. Anuario Estatistico de Belo Horizonte Ano I—1937; Instituto Nacional de Estatistica: Lisboa, Portugal, 1937.
  60. Barreto, A. História do Brasil: Belo Horizonte—Memória Histórica e Descritiva: História média. Planejamento, Estudo, Construcção, e Inauguração da Nova Capital (1893–1898); Edições da Livraria Rex: Belo Horizonte, Brazil, 1936; Volume 2. [Google Scholar]
  61. Borsagli, A. Rios Invisíveis da Metrópole Mineira; Ed. do Autor: Belo Horizonte, Brazil, 2016. [Google Scholar]
  62. Lucas, T.P.B.; Augusto, P.; dos Reis, S.; Rocha, S.C. Impactos hidrometeóricos em Belo Horizonte-MG. Rev. Bras. Climatol. 2015, 16, 7–28. [Google Scholar] [CrossRef]
  63. Prudente, C.N.; dos Reis, R.J. Banco de dados de desastres naturais em belo horizonte 1979 a 2009. An. Simpósio Bras. Geogr. Física 2009, 13, 1–11. [Google Scholar]
  64. de Carvalho, J.R.P.; Assad, E.D.; de Oliveira, A.F.; Pinto, H.S. Annual maximum daily rainfall trends in the Midwest, southeast and southern Brazil in the last 71 years. Weather Clim. Extrem. 2014, 5, 7–15. [Google Scholar] [CrossRef]
  65. Nunes, A.D.A.; Pinto, E.J.D.A.; Baptista, M.B. Detection of Trends for Extreme Events of Precipitation in the Metropolitan Region of Belo Horizonte through Statistical Methods. Rev. Bras. Recur. Hidr. 2018, 23, 1–13. [Google Scholar] [CrossRef]
  66. Monachese, A.P.; Gómez-Villarino, M.T.; López-Santiago, J.; Sanz, E.; Almeida-Ñauñay, A.F.; Zubelzu, S. Challenges and innovations in urban drainage systems: Sustainable drainage systems focus. Water 2024, 17, 76. [Google Scholar] [CrossRef]
  67. Salazar, S.; Francés, F.; Komma, J.; Blume, T.; Francke, T.; Bronstert, A.; Blöschl, G. A comparative analysis of the effectiveness of flood management measures based on the concept of “retaining water in the landscape” in different European hydro-climatic regions. Nat. Hazards Earth Syst. Sci. 2012, 12, 3287–33065. [Google Scholar] [CrossRef]
  68. Liu, N.; Zhang, F. Urban green spaces and flood disaster management: Toward sustainable urban design. Front. Public Health 2025, 13, 1583978. [Google Scholar] [CrossRef] [PubMed]
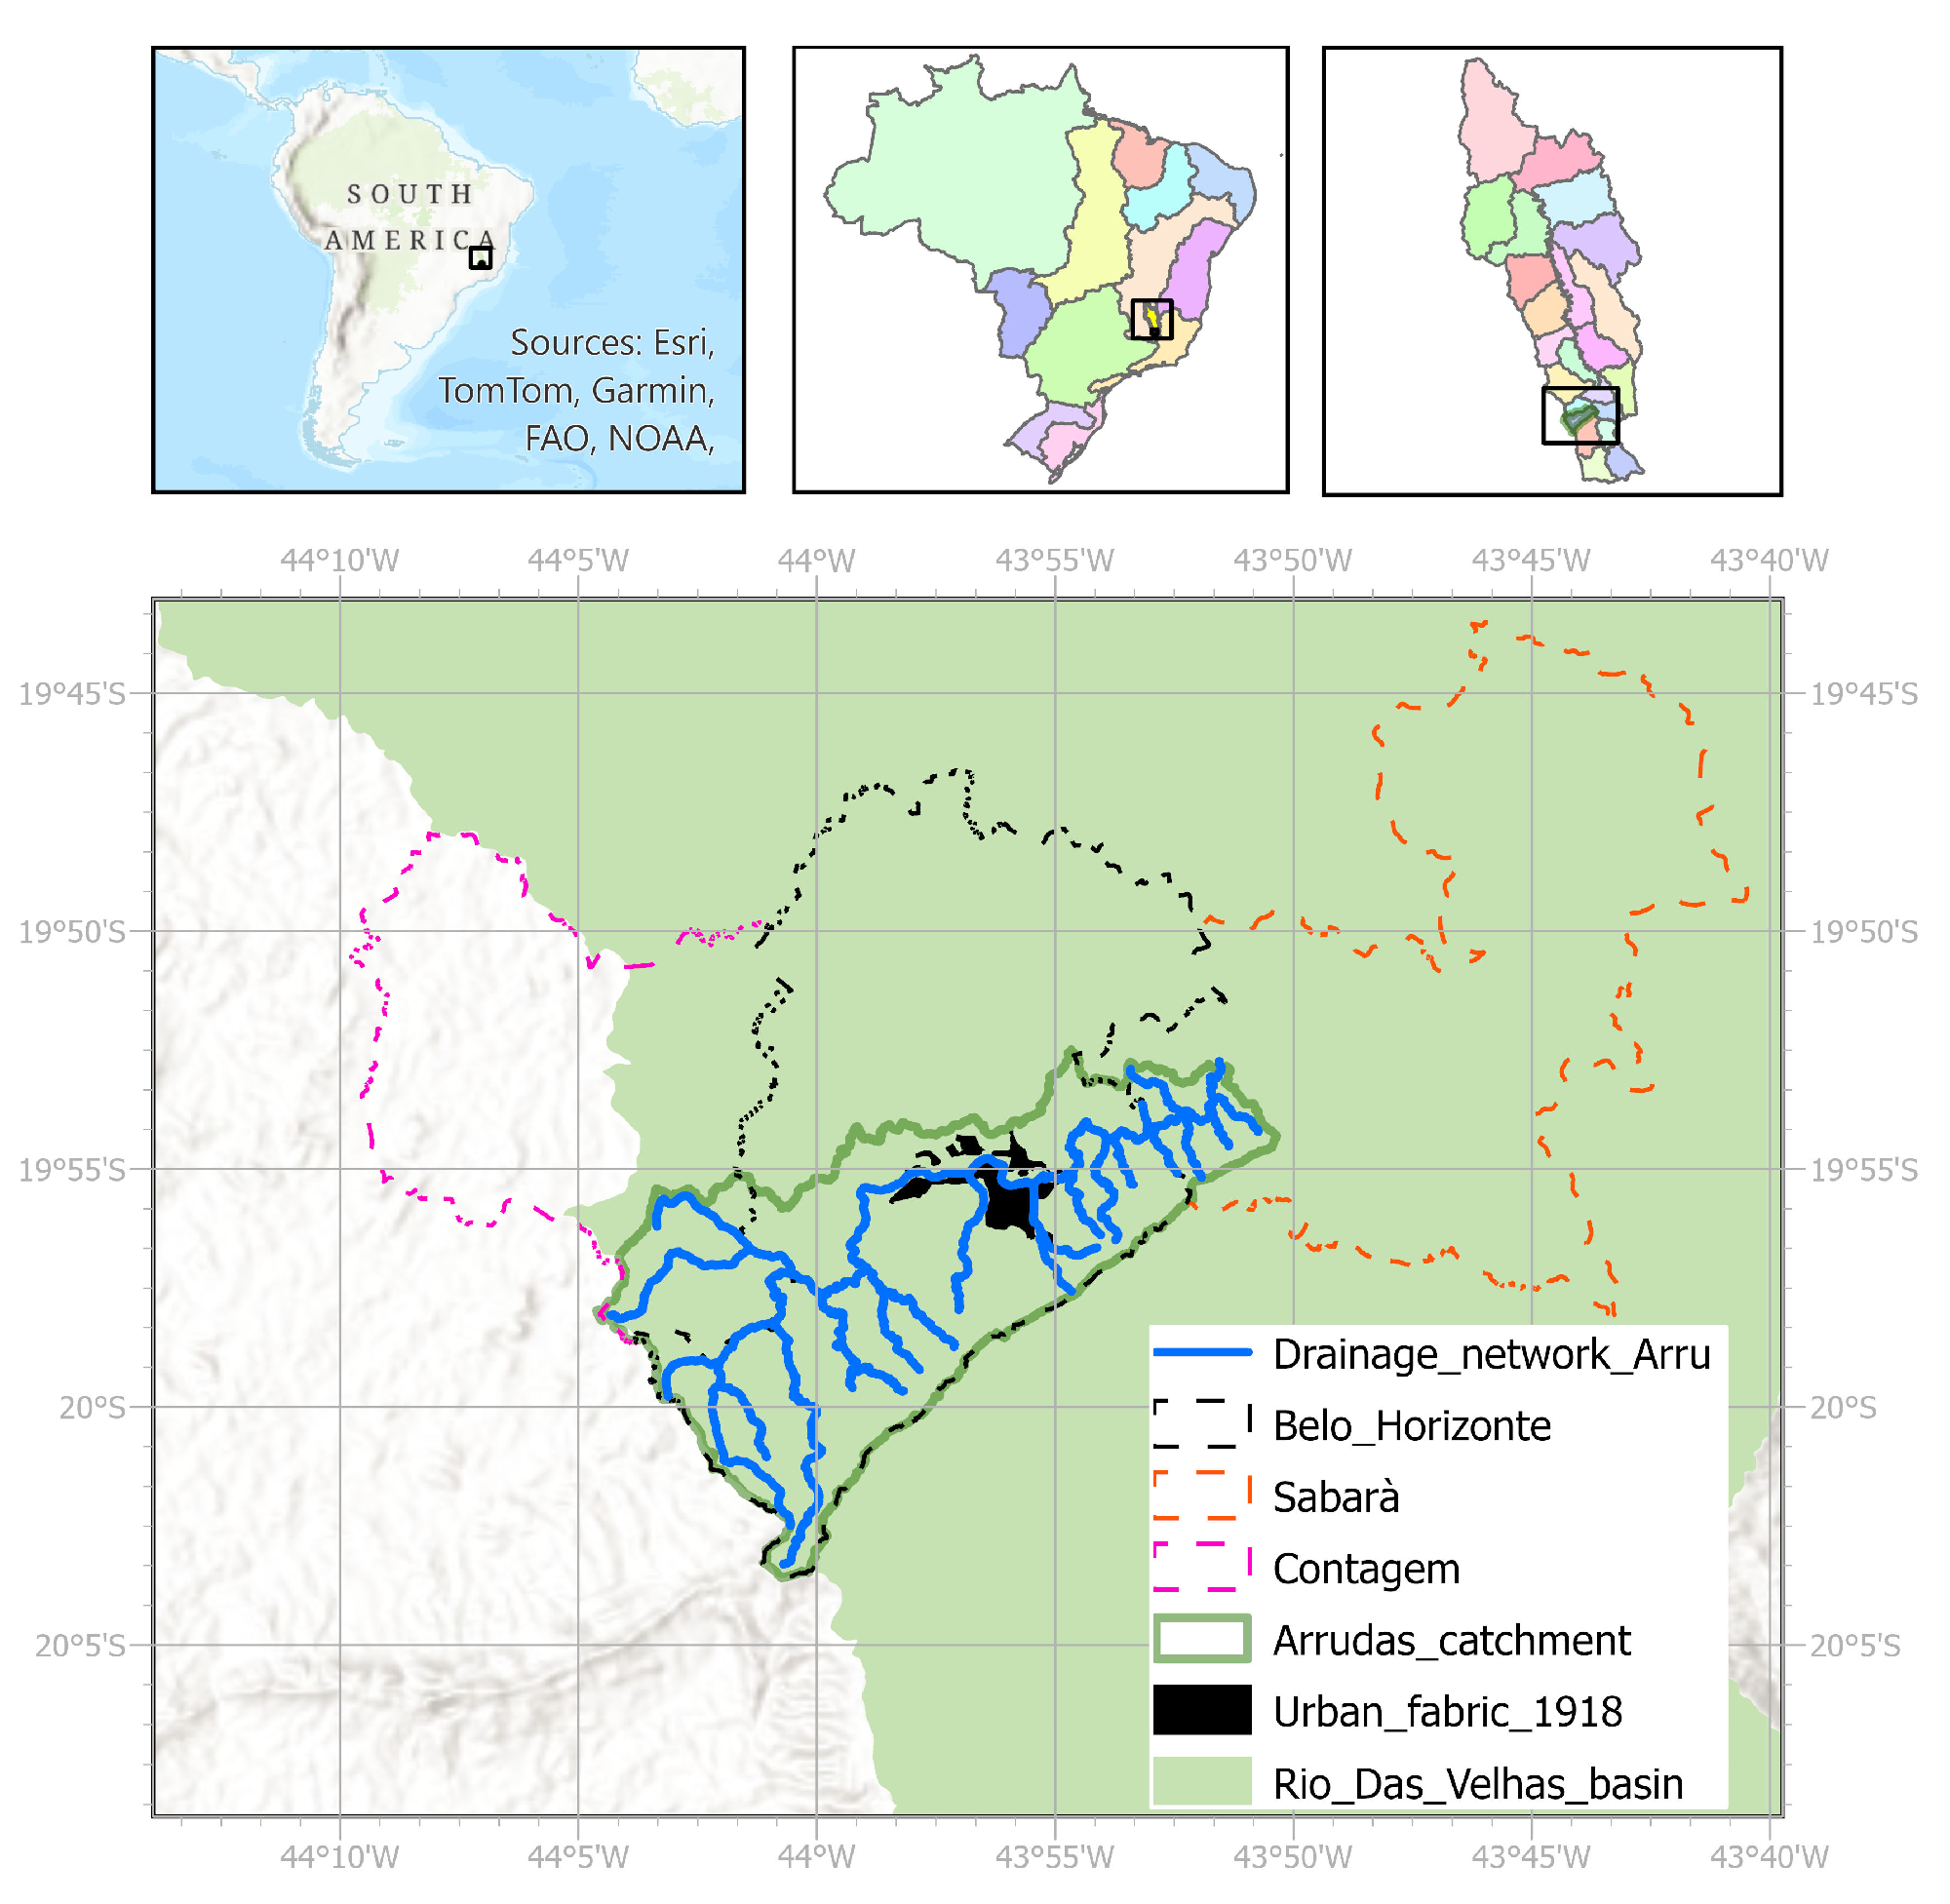
Figure 1. Location of the Ribeirão Arrudas catchment within the Rio das Velhas basin, Minas Gerais, Brazil.
Sustainability 17 08110 g001
Figure 2. Multi-annual monthly average precipitation (climatological normal) of climatic periods. Source: estimated to this study from the time series of the INMET’s Belo Horizonte station.
Sustainability 17 08110 g002
Figure 3. Schematic of the methodological approach developed.
Sustainability 17 08110 g003
Figure 4. Digital terrain model and main drainage network of the Arrudas catchment.
Sustainability 17 08110 g004
Figure 5. Temporal evolution of the spatial occupation of the city of Belo Horizonte according to: (a) historical maps of the Belo Horizonte city; (b) reconstruction of land cover and land use for the Arrudas catchment.
Sustainability 17 08110 g005
Figure 6. Temporal evolution of: (a) total annual rainfall; (b) annual average daily maximum rainfall, and the number of floods recorded in the Arrudas catchment.
Sustainability 17 08110 g006
Figure 7. Results of the Arrudas hydrological model at gauging station 24 of the PBH for the process of: (a) calibration; (b) validation.
Sustainability 17 08110 g007
Figure 8. Changes in the magnitude of the annual maximum daily floods of the Arrudas catchment at the outlet of the city of Belo Horizonte as a result of the urbanisation process.
Sustainability 17 08110 g008
Figure 9. Relationship between changes in the magnitude of annual maximum daily floods and the magnitude of the event associated with these changes.
Sustainability 17 08110 g009
Figure 10. Changes in the magnitude and frequency of Arrudas floods at the outlet of the city of Belo Horizonte.
Sustainability 17 08110 g010
Table 1. Quartiles of the total annual rainfall (mm) and annual maximum daily rainfall (mm).
QuartileTotal Annual Rainfall (mm)Annual Maximum Daily Rainfall (mm)
1940–19691970–19992000–20241940–19691970–19992000–2024
Minimum941.81187.4954.744.658.046.4
1Q1271.21319.91317.271.070.478.0
2Q1411.31485.01579.679.489.084.4
3Q1646.11671.61746.998.5105.7108.1
Maximum2257.62356.62166.3161.5164.2171.8
Table 2. Annual maximum daily streamflow for various return periods and relative changes in relation to the 1918 baseline and 1935 baseline.
Annual Maximum Daily Streamflow for Various Return Periods
Historical land use conditions251025501005001000
1918 baseline213.6295.0350.4422.1476.7532.3667.3728.6
1935 baseline223.0303.6358.9431.1486.5543.3683.0747.1
Historical land uses245.0326.5382.6456.0512.6570.9715.1781.7
Comparison Percentage of change for various return periods
Historical land uses vs. 1918 baseline14.7%10.7%9.2%8.0%7.5%7.2%7.2%7.3%
Historical land uses vs. 1935 baseline9.9%7.5%6.6%5.8%5.4%5.1%4.7%4.6%
Disclaimer/Publisher’s Note: The statements, opinions and data contained in all publications are solely those of the individual author(s) and contributor(s) and not of MDPI and/or the editor(s). MDPI and/or the editor(s) disclaim responsibility for any injury to people or property resulting from any ideas, methods, instructions or products referred to in the content.