Article

User-Friendly, Real-Time LCA Tool for Dynamic Sustainability Assessment and Support of EPD Schemes Towards Circular Bioenergy Pathways

by
Christodoulos Savva
1,
Christos Koidis
2,
Charisios Achillas
3,
Christos Mertzanakis
1,
Dimitrios-Aristotelis Koumpakis
1,
Alexandra V. Michailidou
1 and
Christos Vlachokostas
1,*
1
Sustainability Engineering Laboratory, Aristotle University of Thessaloniki, Box 483, 54124 Thessaloniki, Greece
2
Engineers for Business S.A. (EFB), 17is Noemvriou 79, 55534 Thessaloniki, Greece
3
Department of Supply Chain Management, International Hellenic University, Kanelopoulou 2, 60100 Katerini, Greece
*
Author to whom correspondence should be addressed.
Sustainability 2025, 17(18), 8106; https://doi.org/10.3390/su17188106
Submission received: 4 August 2025 / Revised: 22 August 2025 / Accepted: 4 September 2025 / Published: 9 September 2025

Abstract

This study presents FARMBENV, a user-friendly, real-time, and web-based LCA tool developed specifically for the agricultural sector, enabling dynamic environmental impact assessments and supporting Environmental Product Declarations (EPDs). To demonstrate its functionality, three wheat production systems in Greece—differing in harvest frequency and the use of green manure through the addition of vetch—were assessed using primary data. Environmental impacts were calculated using a cradle-to-gate approach, with a functional unit of 1000 kg of wheat. Results from FARMBENV were validated with OpenLCA v2.4.1, confirming the tool’s accuracy. The addition of vetch in wheat production significantly reduced the Global Warming Potential (GWP), while the single-harvest systems applying green manure present better environmental sustainability performance. In addition, lab-scale experiments were conducted to process wheat residues via three waste-to-energy (WtE) pathways—pellet, biodiesel, and bioethanol production—and their environmental performance was assessed under multiple electricity sourcing scenarios. The source of electricity for the production systems is crucial for minimizing the impact on the GWP for the WtE pathways. The integration of WtE pathways and wheat production scenarios reduces the GWP by up to 49%. Overall, this study demonstrates FARMBENV’s capacity to deliver real-time, scenario-specific LCA results and highlights the potential of circular bioenergy strategies in sustainable agriculture.

1. Introduction

The agricultural industry is characterized by significant energy and resource inefficiency [1] and is a main contributor to environmental degradation [2]. It is estimated that food system emissions represent 34% of the total greenhouse gas (GHG) emissions—71% of which results from agriculture and land use activities [3]. Moreover, traditional agricultural systems lead to excessive operational costs [1] and socio-ecological impacts [4,5], including excessive water consumption and Global Warming Potentials (GWPs) [6], which in turn harm crop productivity [7].
Nevertheless, the agriculture sector is essential for food production [8], and in the context of an increasing world population [8,9,10], the environmental impact caused by agriculture is expected to be further increased [8]. The food sector must adopt an efficient and sustainable use of resources to ensure food availability for current and future generations [11], while supporting most of the United Nations Sustainable Development Goals [12]. In this light, various government support mechanisms have been introduced to implement sustainable practices and reduce the environmental impacts caused by the agricultural sector [13].
Wheat production, like many agricultural activities, generates a significant amount of waste [14]. Fruits, vegetables, and cereal crops are among the leading contributors to food loss and waste [15]. Despite wheat cultivation requiring only 120–140 kg of seed, farmers sow between 180 and 300 kg of seed to ensure a sufficient yield [15]. Hence, managing agricultural waste, including wheat straw, is becoming an increasing concern [16]. By the valorization of agricultural waste, valuable materials and energy could be retrieved, enhancing the circular economy model and biofuel production [17]. To do so, various methods are available, such as pyrolysis, gasification, anaerobic digestion, and fermentation [18,19]. Nevertheless, the practical application of the circular economy model in the context of agriculture remains minimal or limited [20]. Despite the production of biofuels raising important concerns due to food versus fuel for feedstocks, the utilization of crop residues can avoid such conflicts [21].
The Life Cycle Assessment (LCA) is one of the most widely used methodologies for assessing the environmental impacts of products and services of all sectors in their whole supply chain, including agriculture [22,23]. It enables the identification of environmental hotspots and provides opportunities to reduce environmental burdens, thereby supporting more informed decision-making [24]. In the agricultural sector, LCAs can guide improvements in resource efficiency and sustainability and can serve as a decision support tool and a foundation for external environmental communication through certifications and declarations [25]. Environmental certification, such as Environmental Product Declarations (EPDs), can encourage more sustainable resource use [26], contribute to GHG emission reductions [27], and promote transparency and accountability within the agrifood industry. Such certification schemes not only support climate change mitigation efforts [28] but also signal a commitment to sustainability, potentially influencing consumer choices and policy development [29,30,31]. To carry out an LCA study, and therefore obtain an environmental certification, software is typically required due to the large volume of data, characterization factors, and calculations involved. However, most LCA tools currently available on the market rely on static life cycle inventory (LCI) databases, which can lead to significant uncertainties in the results [32]. Due to the dynamic nature of product systems and services, the use of real-time data is crucial to the accuracy and reliability of the LCA results [33]. Real-time LCA engines provide advantages over the typical LCA software, as reported in [34], such as the dynamic integration of data from several sensors to the LCI. As reported by Vyrkou et al. (2025), only a few published papers referred to “real-time” LCAs, despite several studies agreeing that a real-time assessment leads to improved accuracy, better insight into the process, and time savings in the analysis [35]. The LCA studies that were performed in real-time incorporate some type of real-time monitoring/data collection and a digital representation of the system [35]. Domínguez-Patiño et al. (2014) utilized a real-time data monitoring and processing software to build the inventory of coffee cup systems and then integrated it in LCA software to assess the impacts [36]. They concluded that a real-time LCA allows for a better understanding of the processes and to take immediate actions in favor of the environment [36]. Hagen et al. (2020) introduced a real-time product LCA in a learning factory [37]. Their methodology consists, among others, of a code that receives, processes, and stores the data. The data are eventually extracted into LCA software, which sources background data from the Ecoinvent database, and calculates the environmental impacts [37]. Boje et al. (2021) applied the combination of Building Information Modeling and LCAs, with the use of a digital twin to provide real-time data about the inhabited environment of the building [38]. By using real-time data from sensors, their study implemented a constant re-evaluation of the impacts with time, and improvement in the accuracy of the calculations as the volume of data gathered increases [38]. Ferrari et al. (2021) present a pattern that offers dynamic data collection through factory sensors, which can then be exported in an LCA tool to perform the assessment [39]. They concluded that time and cost savings and improved data reliability can occur because of the real-time data collection [39]. Piron et al. (2025) integrate digital twins and LCAs to perform a dynamic environmental analysis of plastics [40]. The digital twin acquires the data and uses them for the formation of the inventory [40].
Moreover, traditional LCA software often contains a large number of features, processes, and data, which increases the complexity for users, especially non-experts. Additionally, uncertainties and variations occur in the LCA results when using different software [41,42]. Therefore, developing user-friendly and dynamic LCA tools and inventories that are product- and location-specific can substantially improve the accuracy and reliability of the assessment [33,43], while also expanding sustainability assessments across the industry, particularly among Small–Medium Enterprises (SMEs).
In this light, a user-friendly, real-time, and web-based LCA tool, FARMBENV [44], was developed, focusing exclusively on the agrifood sector, where the demand for environmental certification is increasing. The FARMBENV tool can be utilized to assess the environmental impacts of any agricultural product and integrates a dynamic LCA engine with real-time sensor data, enabling personalized, context-specific environmental assessments. This approach contrasts with typical LCA software, which typically relies on static, generic LCI databases. In a previous study [45], the requirements of potential end-users were identified and incorporated into the tool’s design, enhancing its user-friendliness and applicability for producers, certifiers, and policymakers.
It should be noted that FARMBENV does not replace conventional LCI databases but rather complements them. Background processes, such as fertilizer production or electricity generation, are modeled using established static datasets (e.g., Ecoinvent), which provide consistency and comparability with the standard LCA practice. At the same time, FARMBENV introduces the dynamic integration of real-time foreground data through sensors monitoring the on-farm energy use, irrigation, or fertilizer application. For example, while the background impacts of fertilizer production and transport are modeled using Ecoinvent, the actual quantity of the fertilizer applied can be updated dynamically in FARMBENV based on live sensor data. In practice, this means that while Ecoinvent provides the static background system, FARMBENV continuously updates the model with live, context-specific inputs from the production site. By merging static background data with real-time, site-specific inputs, FARMBENV enables more accurate and context-sensitive results than conventional tools, which rely solely on static data. This hybrid approach ensures both methodological robustness and enhanced relevance for certification and decision-making.
By leveraging real-time data, FARMBENV provides immediate feedback on environmental impacts, allowing users to implement timely adjustments to reduce emissions, energy consumption, or resource inefficiencies. The tool supports the real-time assessment of carbon footprints and other environmental indicators, making it particularly valuable for EPDs and sustainability certification processes. Compared to existing studies on real-time LCAs, FARMBENV offers an easy-to-use, web-based application designed for non-experts, integrating both real-time data collection and an impact assessment within a single platform. The FARMBENV tool ensures the direct and continuous transformation of real-time data into LCA results, while aggregating data to enable EPD certification. This methodological innovation reduces delays and inconsistencies while enhancing transparency and accuracy. Furthermore, FARMBENV is tailored to the agricultural sector, accounting for its inherent variability, and it uniquely applies real-time LCAs in this context. As a web-based tool, it is openly accessible to stakeholders and policymakers for monitoring sustainability performances. In addition, it can contribute to reduced production costs by optimizing resource use and minimizing environmental burdens. Ultimately, FARMBENV enables tailored sustainability assessments for farmers and agrifood businesses, while promoting the circular economy and bioeconomy practices within the agricultural sector.
Th wheat cultivation stage is recognized as the biggest environmental hotspot in the life cycle of wheat [46], with the efficiency and GHG emissions significantly affected by farming technologies [47]. Numerous studies have assessed the environmental impacts of wheat production, utilizing primary [48,49,50,51,52] and secondary data [53,54,55,56,57]. Among sustainable practices, the use of green manure, particularly through the addition of vetch [58], has been shown to increase soil fertility and reduce the demand for fertilizers [59] while preserving the wheat yield [60]. Moreover, it could reduce the amount of NOx (nitrous oxide) emissions from wheat production [61]. However, while LCA studies have assessed the impacts of wheat–vetch systems using primary data, these are limited to Spain [62] and Italy [63]. To date, no LCA study using primary data has been identified for wheat production systems in Greece nor for the integration of vetch in this context. This highlights a clear research gap regarding region-specific environmental performance and the potential benefits of green manure in Greek wheat cultivation systems.
In this light, this work offers a novel contribution by achieving the following:
(i)
Presenting and demonstrating the functionality of FARMBENV, a user-friendly, real-time, and web-based LCA tool specifically developed for the agricultural sector, and validating its accuracy through a comparison with OpenLCA v2.4.1 using the Ecoinvent v3.9.1 database;
(ii)
Assessing the environmental impacts of three wheat production routes, differentiated by the inclusion of vetch and the number of harvests, using primary data collected through an interview with a farmer in the region of Central Macedonia in Greece;
(iii)
Presenting laboratory-scale experimental results on biofuel production from wheat residues, utilizing three waste-to-energy (WtE) technologies (pellet mill, oil press, and ethanol still) to support a circular economy approach in agriculture;
(iv)
Evaluating the potential reduction in environmental impacts achievable through each WtE pathway and integrating these reductions into the wheat production pathways to highlight the benefits of incorporating circular economy practices into conventional agricultural systems.
Section 2 presents the methodology, including the laboratory-scale experimental processes, a description of wheat production scenarios, the LCI data, and the LCA framework applied in this study. Section 3 provides a brief overview of the FARMBENV tool, presents the results from the lab-scale experiments and the LCA results of wheat production scenarios, WtE pathways, and their integration. Section 3 also includes the sensitivity analysis conducted and discusses the key findings of this study. Finally, Section 4 summarizes the conclusions and outlines this study’s limitations.

2. Materials and Methods

2.1. Laboratory-Scale Biofuel Production Experiments

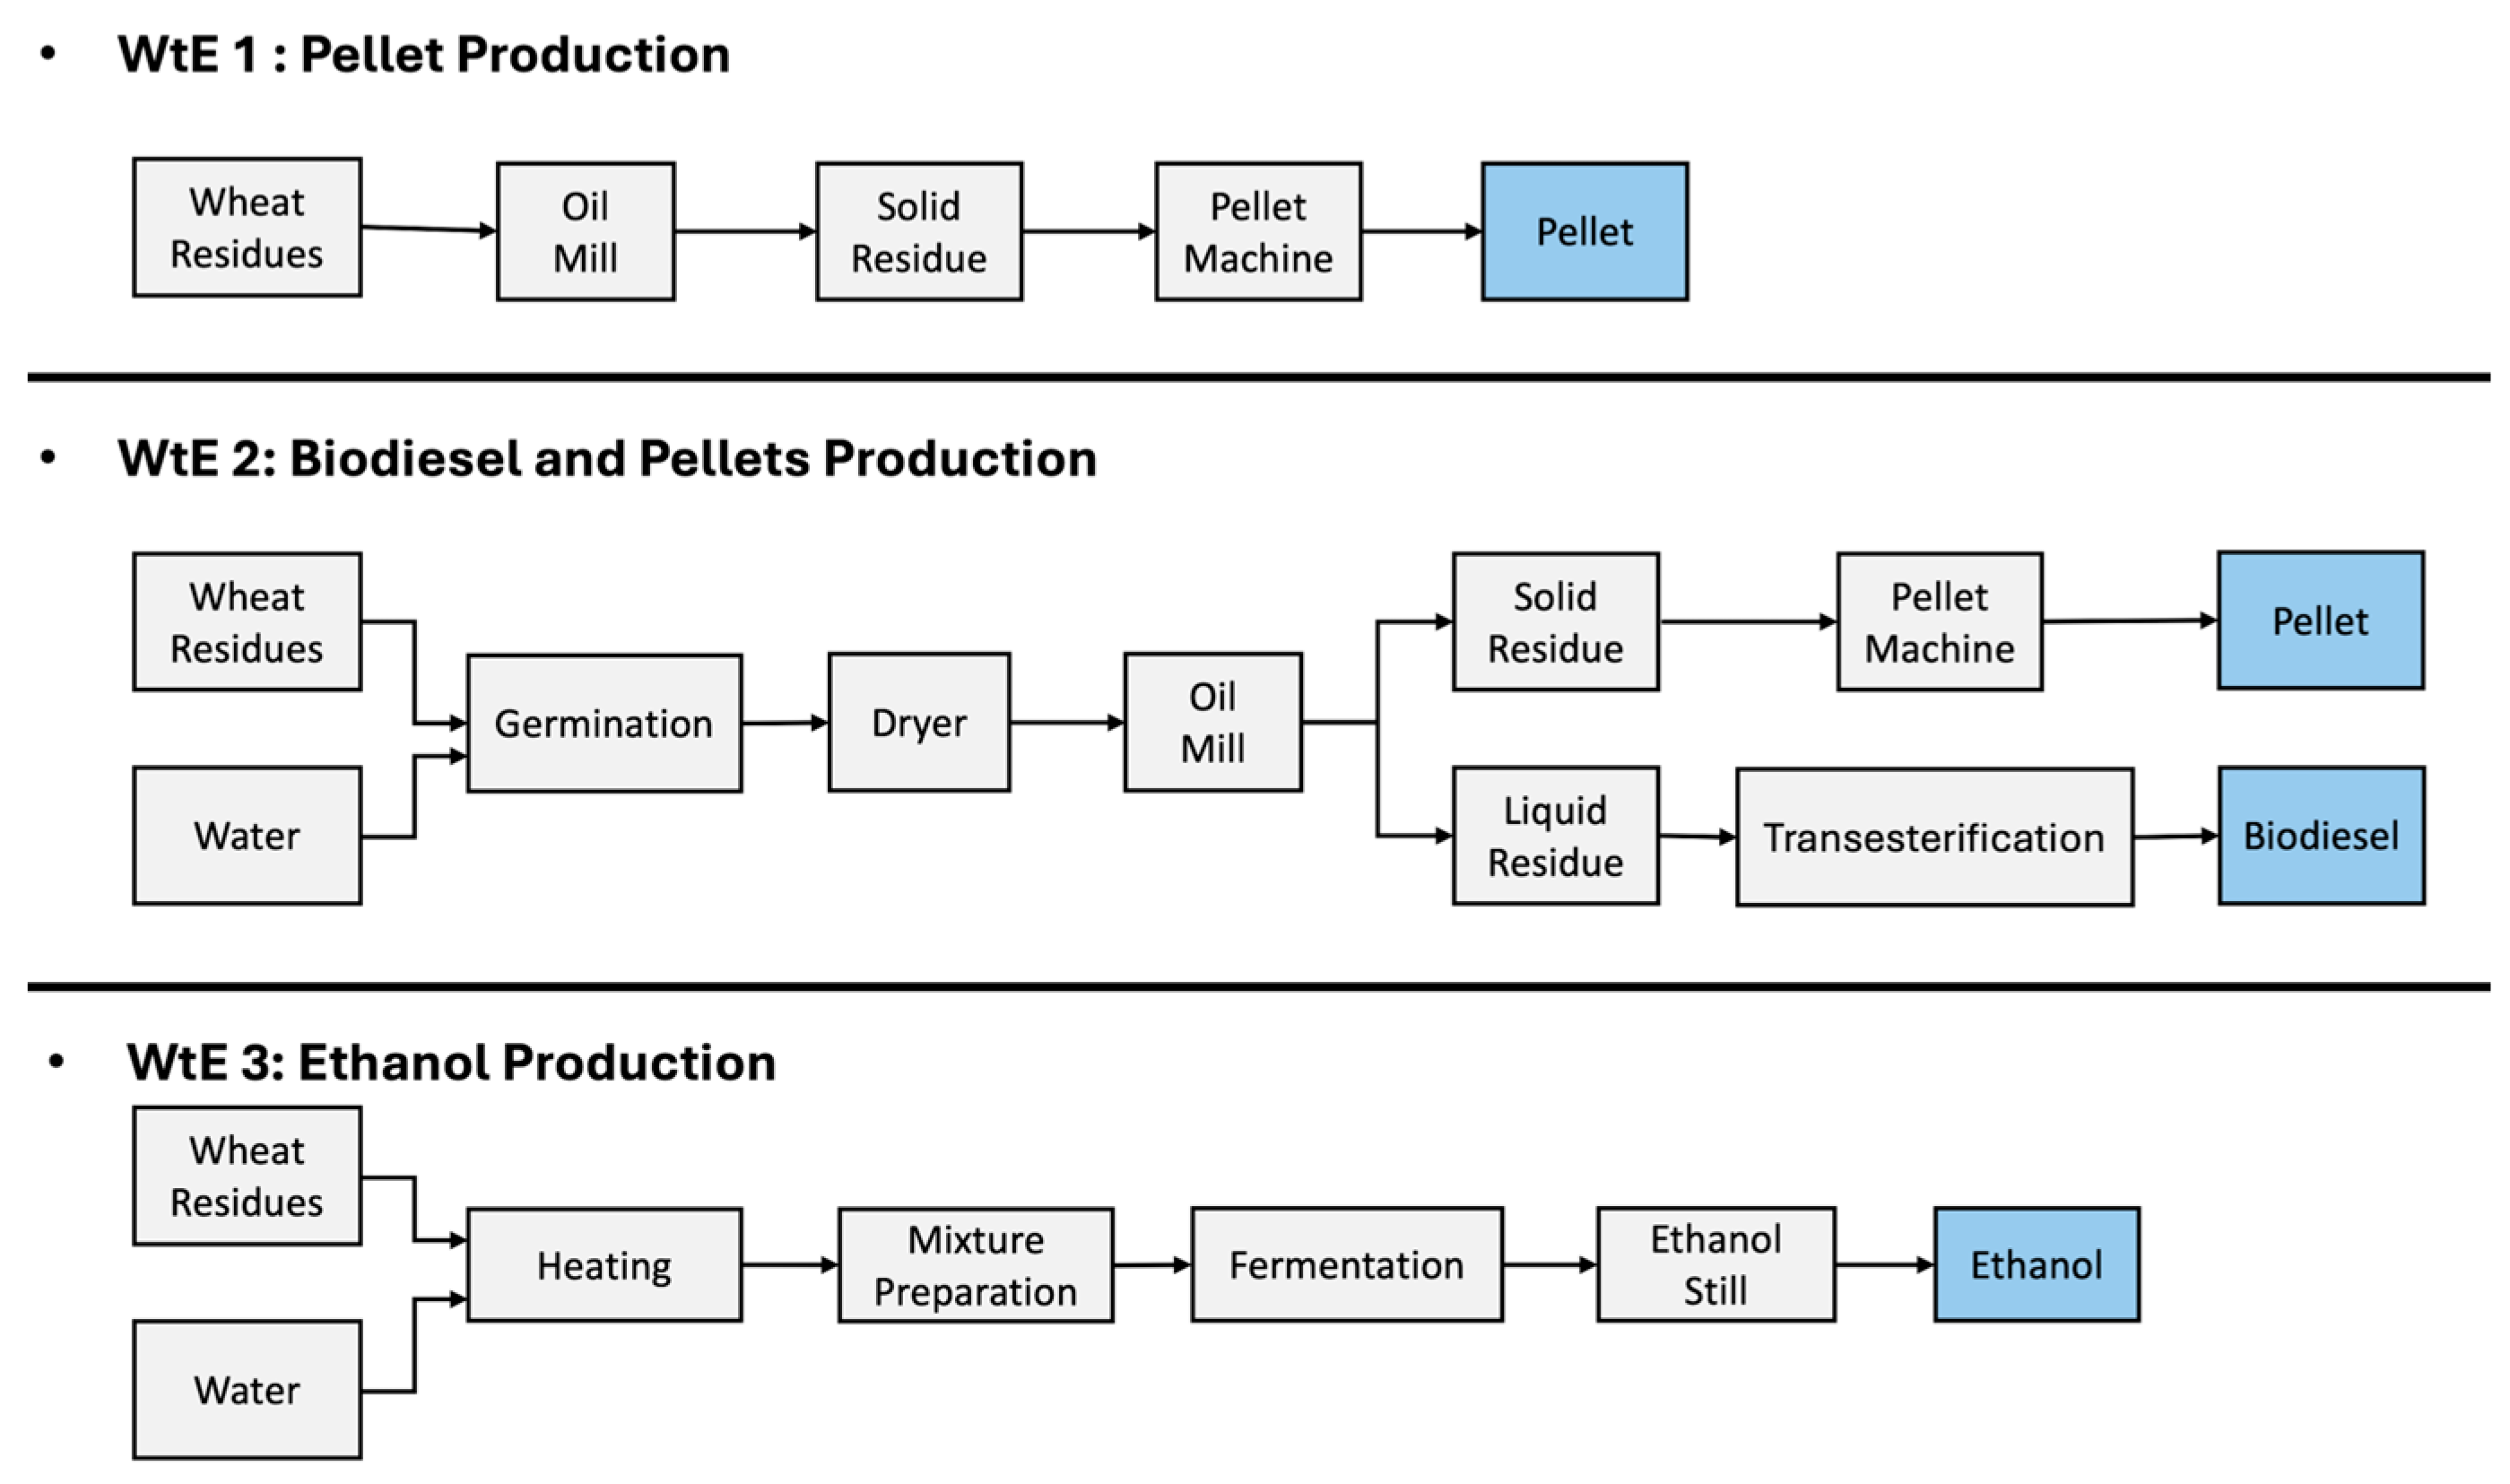
The equipment employed consisted of an oil press (Ölwerk GmbH, Cottbus, Germany) with a rated power of 1.5 kW, a pellet mill (TECHTONGDA, Jinan, China) with 2.2 kW of rated power, a dryer (Karamco, Seoul, South Korea) with 2 kW of rated power, and the ethanol still (Inoxform, Athens, Greece). The ethanol still uses a 38 W pump (SICCE, Pozzoleone, Italy) and an LPG cylinder (TOPGAS, Athens, Greece) with a 0.25 kg/h flow rate. Moreover, to process the mixture into a suitable form to produce ethanol, alpha amylase, glucoamylase, yeast, and an electric heater (Nahita Blue, Navarra, Spain), with a rated power of 120 W, are required. Finally, methanol and sodium hydroxide are required to process the produced biodiesel. Figure 1 presents the schematic representation of each WtE pathway. The wheat residues processed were provided by the local farmer, who provided the inventory regarding wheat production scenarios.
In the WtE-1 pathway, 300 g of wheat was added to the oil press, which operated for 10 min, producing 204 g of solid residue and zero liquid. Then, the mixture was entered into the pellet mill, which operated for 5 min, and 110 g of pellets was produced.
In the WtE-2 pathway, 600 g of wheat was germinated using water for five days, before entering the dryer for 4 h. The final mixture added to the oil press weighed 888 g. The oil press worked for 20 min and produced 673 g of solid residue and 110 mL of liquid. Eventually, 355 g of pellets was produced from the pellet mill, which operated for 15 min. For the transesterification process, 0.9 g of sodium hydroxide and 20 mL of methanol were added to the liquid produced by the oil press. The mixture was kept together for 1 week so the glycerin could settle to be removed, and after biodiesel was washed to remove various residues, 80 mL of biodiesel was produced.
In the WtE-3 pathway, 2 kg of wheat was milled and mixed with 5 L of water. The mixture was heated for 2 h by the electric heater. Then, 0.4 g of alpha amylase was added, and then the mixture was cooled to 60 °C before 0.7 g of glucoamylase and 4.5 g of yeast were added to the mix, which was left to ferment for 1 week. LPG cylinder was used to provide the required heat for the distillation of ethanol, while a pump for the circulation of water was also used to cool the steam to condense into a liquid form. The distillation process lasted 1 h, and 1.2 L of ethanol at 30% concentration was produced.

2.2. Wheat Production Scenarios and Inventory Data Collection

Three scenarios regarding wheat production were evaluated. Scenario 1 (Sc1) includes one harvest period without the addition of vetch, while Scenario 2 (Sc2) includes two harvesting periods with the addition of vetch. Finally, Scenario 3 (Sc3) includes three harvesting periods with the addition of vetch. Among the scenarios, some common group processes took place. Therefore, those groups’ processes were modeled as modules. Modules 1 and 2 refer to the operations required for the initial wheat and vetch sowing, respectively. Module 3 refers to the processes required for wheat cultivation after vetch, while Module 4 refers to the processes required for wheat sowing after wheat.
The LCI was built based on interviews conducted with a local farmer in Central Macedonia, Greece. Table 1 presents the processes included in each module, referring to the initial wheat and vetch sowing, and the wheat sowing after vetch or wheat sowing. Moreover, Table 2 presents how many times each module takes place in each scenario, the number of harvest periods, and the amount of produced wheat. No irrigation is used because the cultivation is rainfed. It should be noted that the information that the farmer provided included the required process (e.g., application of plant protection) that takes place and the amount of diesel that is consumed for each process. Based on the description provided by the Ecoinvent v3.9.1 database for its processes, the amount of diesel that is consumed for each process differs from what is reported by the farmer. The required amount of each process, based on the Ecoinvent v3.9.1 database, was adjusted to match the actual diesel consumption, as measured and reported by the farmer. Therefore, this approach prioritizes site-specific data, increasing the accuracy, transparency, and reliability of the LCI and hence the results of LCA.

2.3. Life Cycle Assessment Framework

LCA was carried out according to ISO standards [64,65]. The goals of the study are as follows:
(i)
Evaluate the environmental impacts of 3 WtE pathways by utilizing wheat residues;
(ii)
Assess the environmental impacts of 3 wheat production scenarios, with or without the addition of vetch and with different harvest crops;
(iii)
Demonstrate the role of circular economy towards sustainable agriculture by integrating WtE pathways and wheat production scenarios;
(iv)
Demonstrate the functionality and accuracy of the FARMBENV tool by comparing its results with the results of the OpenLCA software v2.4.1 and the Ecoinvent v3.9.1 database.
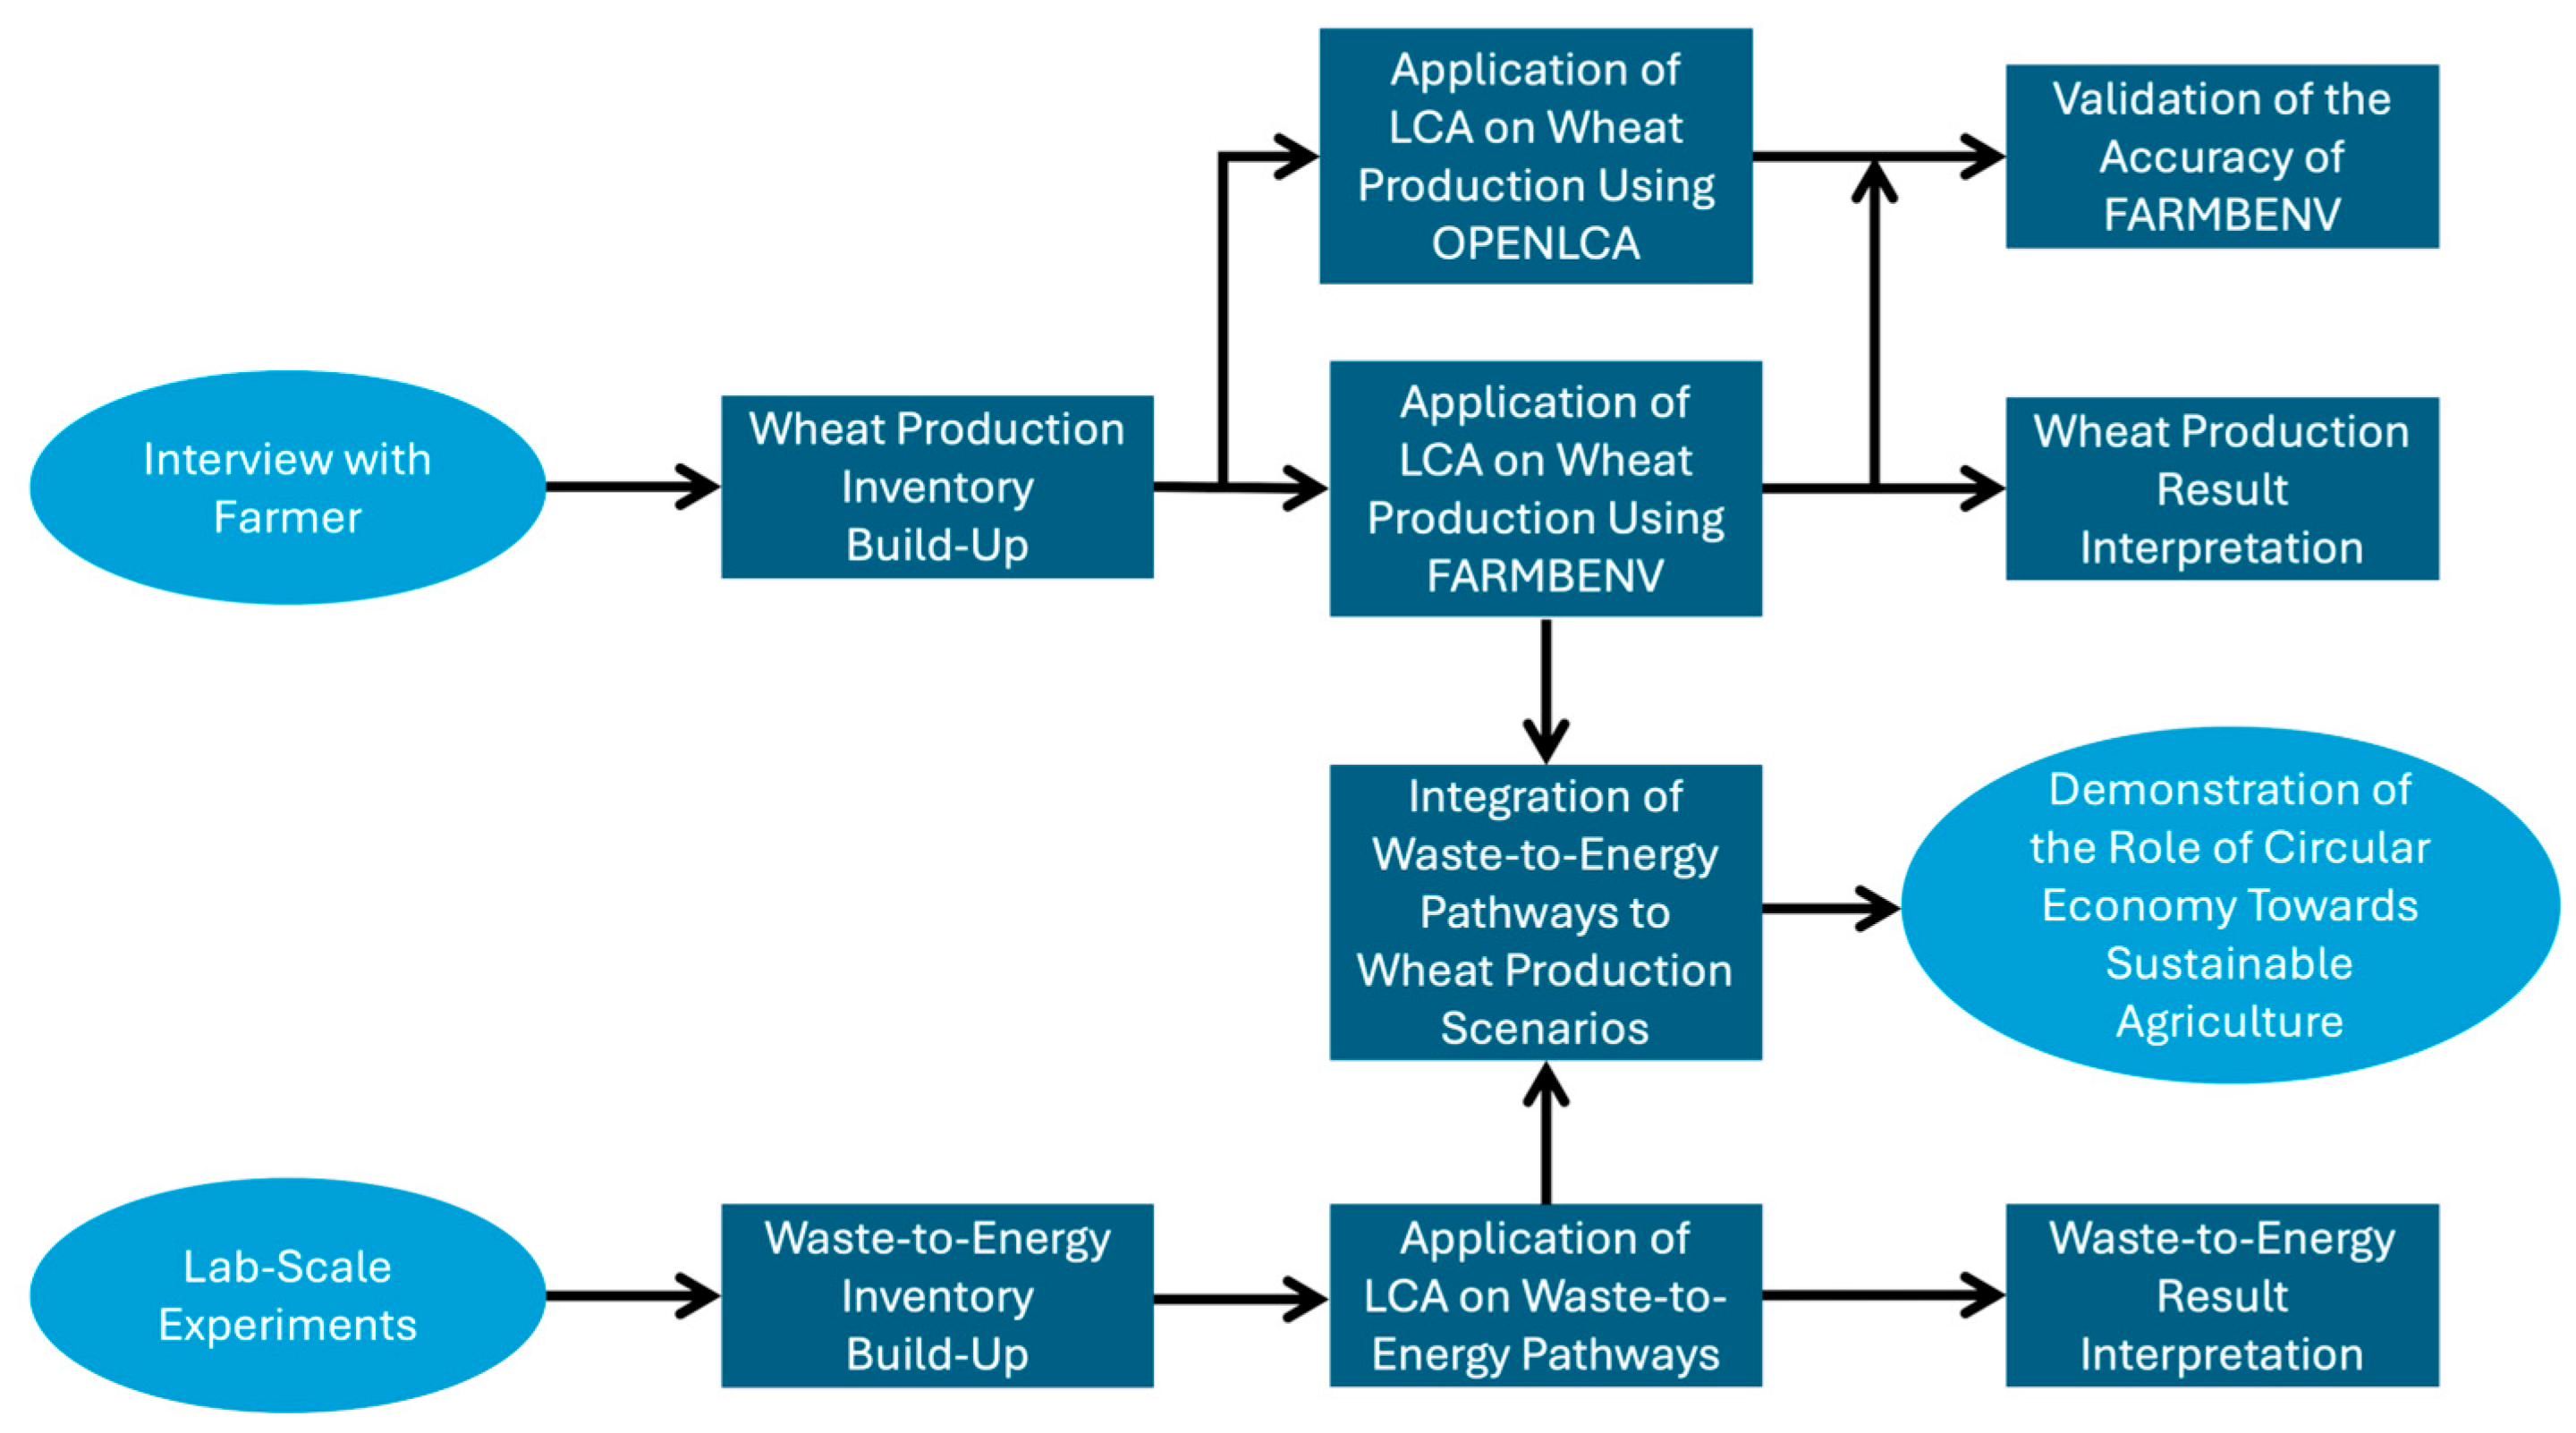
Figure 2 presents the methodology that was applied to fulfill the goals of this study.
Regarding wheat production scenarios, the functional unit is defined as “the production of 1000 kg of wheat”, and the system boundaries are set as “Cradle-to-Gate”. To facilitate a clear and transparent comparison of the scenarios, the packaging and transportation of wheat to the final user were excluded, since they are the same for all scenarios. The LCI was built based on the interview conducted with the farmer, and the background data were based on the Ecoinvent v3.9.1 database. It should be noted that the production and use phases of the necessary agricultural machinery and diesel are included in this study by the use of Ecoinvent v3.9.1, although they are not presented in Table 1. As mentioned, the processes of Ecoinvent v3.9.1 were customized to reflect the actual diesel consumption, as reported by the farmer. The required electricity is provided by the Greek electricity mix.
Regarding the WtE pathways, the functional unit is defined as the “valorization of 1 kg of wheat residues for energy production”, and the system boundaries are set as “Cradle-to-Grave”. Once the biofuels were produced, they were assumed to be combusted to produce heat. Regarding pellets, they was assumed to have a lower heating value equal to 18 MJ/kg, and the emission factors were based on the literature, while it was assumed to provide heat with an 80% efficiency [66]. Biodiesel and ethanol were assumed to provide heat with a 44% efficiency [67] and to have an energy density equal to 32.9 MJ/L [67] and 19.6 MJ/L [68], respectively, while their emission factors were retrieved from the literature [69,70]. CO2 emissions were treated as biogenic, since the evaluated fuels are biofuels. By applying System Expansion–Substitution method [71], the produced heat was assumed to substitute for heat provided by light fuel oil. The LCI was built based on the lab-scale experiments that are presented in this study. Finally, the required electricity in the WtE pathways is also provided by the Greek electricity mix.
Eventually, the results of the WtE pathways were integrated into the results of wheat production. In this case, the functional unit is defined as “the production of 1000 kg of wheat”, and the system boundaries are set as “Cradle-to-Gate”. Nevertheless, by assuming that 0.5 kg of recoverable wheat residues is produced per 1 kg of produced wheat, the production of energy by the wheat residues was included in the system boundaries. By doing so, the benefits of enhancing a circular economy approach in the agricultural sector are demonstrated.
The FARMBENV tool was utilized to assess the impacts, sourcing background data from the Ecoinvent v3.9.1 database. Impact assessment was performed on a midpoint level, using the Recipe 2016 Midpoint (H) method, including the following impact categories: fossil resource scarcity (FRS), freshwater ecotoxicity (FEc), freshwater eutrophication (FEu), Global Warming Potential (GWP), human carcinogenic toxicity (HCT), human non-carcinogenic toxicity (HnCT), land use (LU), and terrestrial acidification (TA). It is worth mentioning that the FARMBENV tool supports all the available Life Cycle Impact Assessment methods, including the EN15084 method, which is a method compatible with an EPD. Regarding wheat production scenarios, LCA was also conducted using the OpenLCA software v2.4.1 and the Ecoinvent v.3.9.1 database with Recipe 2016 Midpoint (H) selected as the impact assessment method to validate the accuracy of the FARMBENV tool.
Sensitivity analysis was conducted to evaluate the influence of the electricity source in the results. Specifically, the electricity scenarios that were evaluated are the average European electricity mix, electricity by photovoltaic, and, finally, electricity by wind turbines. The electricity source was selected for sensitivity analysis because it is expected to be an environmental hotspot, influencing both wheat production and WtE pathways. As such, variations in the electricity grid mix are expected to have a significant impact on the overall environmental results, making it a key parameter to test for uncertainty in the assessment. For the WtE-3 pathway, where heat is required, it was assumed that heat would be provided by an electric heater with a 90% efficiency. Finally, the influence of the amount of recoverable wheat residues per 1 kg of wheat on the results was evaluated as well.

3. Results and Discussion

3.1. An Overview of the FARBENV Tool

The FARMBENV real-time LCA tool is web-based and features an intuitive design to enhance user-friendliness. Registered users can create, edit, and monitor private or public projects. After logging in, the user is redirected to the project section, where the project settings must be defined. The required settings include the project name and description, the functional unit of the model, the selected LCIA method, the data source based on which input will be integrated into the tool, and the default indicator. Additional optional project settings include project visibility, project tags, project icons, a time range for data fetched from connected sensors, and the number of decimal places for presenting results. Finally, the user can set some threshold values regarding the upper accepted limit for each impact category. If the results of the LCA exceed this limit, FARMBENV will trigger a hotspot and inform the user accordingly. Threshold values have a great significance when using live sensor data, enabling the user to monitor the results in real-time and to make the appropriate adjustments to the system.
After configuring the project, the user can model the LCA. The project is organized in three stages, the Upstream, Core, and Downstream, aligned with the EPD structure, with each stage containing at least one process and each process containing at least one group of flows. A user-friendly search tool provides users with easy access to the available flows of the chosen dataset and the corresponding quantities. To enable dynamic data, FARMBENV provides the option for each flow to be connected to a relevant user-controlled sensor, which feeds live data into the tool.
Once all the input is defined, the user selects “impact analysis”, and a list of all the impact indicators related to the project is provided, together with their score. If any indicator exceeds the defined threshold value, a notification is triggered. The results can be exported locally as an XLSX file or in the ISO/TS 14048:2002 [72]-compatible JSON-LD format for further analysis. Finally, an EPD tab illustrates the scores of all impact indicators of the method EN 15804 [73]. These results align with the principles and standards of an EPD and can be directly extracted without further modifications.
FARMBENV has been designed to handle dynamic data streams through an integrated data pipeline. Real-time data from sensors or external sources are mapped to the corresponding inventory, enabling the continuous updating of activity levels (e.g., energy use, fertilizer application) and the automatic recalculation of environmental impacts using the selected background database and the LCIA method. In traditional LCAs, environmental impacts are calculated as the product of an activity level and a characterization factor; in FARMBENV’s real-time implementation, activity levels are continuously updated from live data streams. While this study demonstrated FARMBENV using static datasets, the system architecture supports real-time operations by linking live inputs with automated LCA calculations.
Regarding sensor integration, a dedicated sensor repository was developed to support dynamic data integration. This repository is accessible through a RESTful API, enabling users to register their sensors, define their parameters, and continuously store their data. Beyond direct storage, the system also supports dynamic data streams, as it can consume sensor messages delivered via streaming technologies such as Apache Kafka, ensuring scalability for live data ingestion. The architecture accommodates different modes of computation, such as cumulative, average, or instantaneous values, over both dynamic and static time intervals, offering flexibility in how data is processed. Furthermore, sensor outputs can be transformed into alternative units or formats by applying configurable multipliers, ensuring interoperability across diverse datasets.
On the modeling side, a threshold mechanism has been implemented, allowing users to set upper limits for specific impact categories within project settings. When these thresholds are exceeded during modeling, the system triggers visual notifications, enabling users to precisely identify where their projects surpass expected or acceptable environmental impact levels. This methodological framework ensures both the robustness of real-time calculations and the practical usability of the system in environmental modeling contexts.
To further enhance cost-efficiency, the FARMBENV tool allows for the integration of free databases, such as the European Commission’s EF database [74]. Additionally, the tool supports the integration of several other components, including Product Lifecycle Management (PLM) systems for Internet of Things (IoT) and big data management, as well as Decision Support Systems (DSSs) and Artificial Intelligence (AI) modules to facilitate advanced decision-making and data analysis.

3.2. Results from Laboratory-Scale Biofuel Experiments

Table 3 summarizes the total inputs and outputs for each WtE pathway. Results are normalized per 1 kg of wheat residue treated, to align with the functional unit and allow an easier comparison between the pathways. These results are used as the input for the LCA. Regarding the produced biofuel, the values in the parentheses represent the estimated heat produced, based on the assumptions discussed in the previous chapter. Moreover, regarding the required LPG in the WtE-3 pathway, the value in the parentheses represents the amount of energy that is produced by it. Finally, the CO2 emissions from the WtE-3 pathway occurred due to the combustion of the LPG.
Table 3 depicts that WtE-1 pathway required the least amount of energy, while the WtE-2 pathway required the highest amount of energy, due to the drying process, which lasted for a significant amount of time. In terms of energy efficiency, the WtE-1 pathway was the most efficient, as it avoids any heating steps, followed by the WtE-3 pathway and, finally, by the WtE-2 pathway, which was the least efficient. The WtE-1 pathway produced only pellets, which is the least energy intensive, and has the highest utilization efficiency. Both WtE-2 and WtE-3 required an increased heat input in their processes, either through the dryer (WtE-2) or produced by the LPG combustion and the electric heater for the preparation of the mixture (WtE-3). In both pathways, the valorization of a higher amount of wheat residues could decrease the amount of consumed heat per 1 kg of input. Finally, the WtE-2 pathway produced the highest amount of energy and the WtE-1 scenario the least.

3.3. Life Cycle Assessment Results

3.3.1. Environmental Impacts of Wheat Production Scenarios

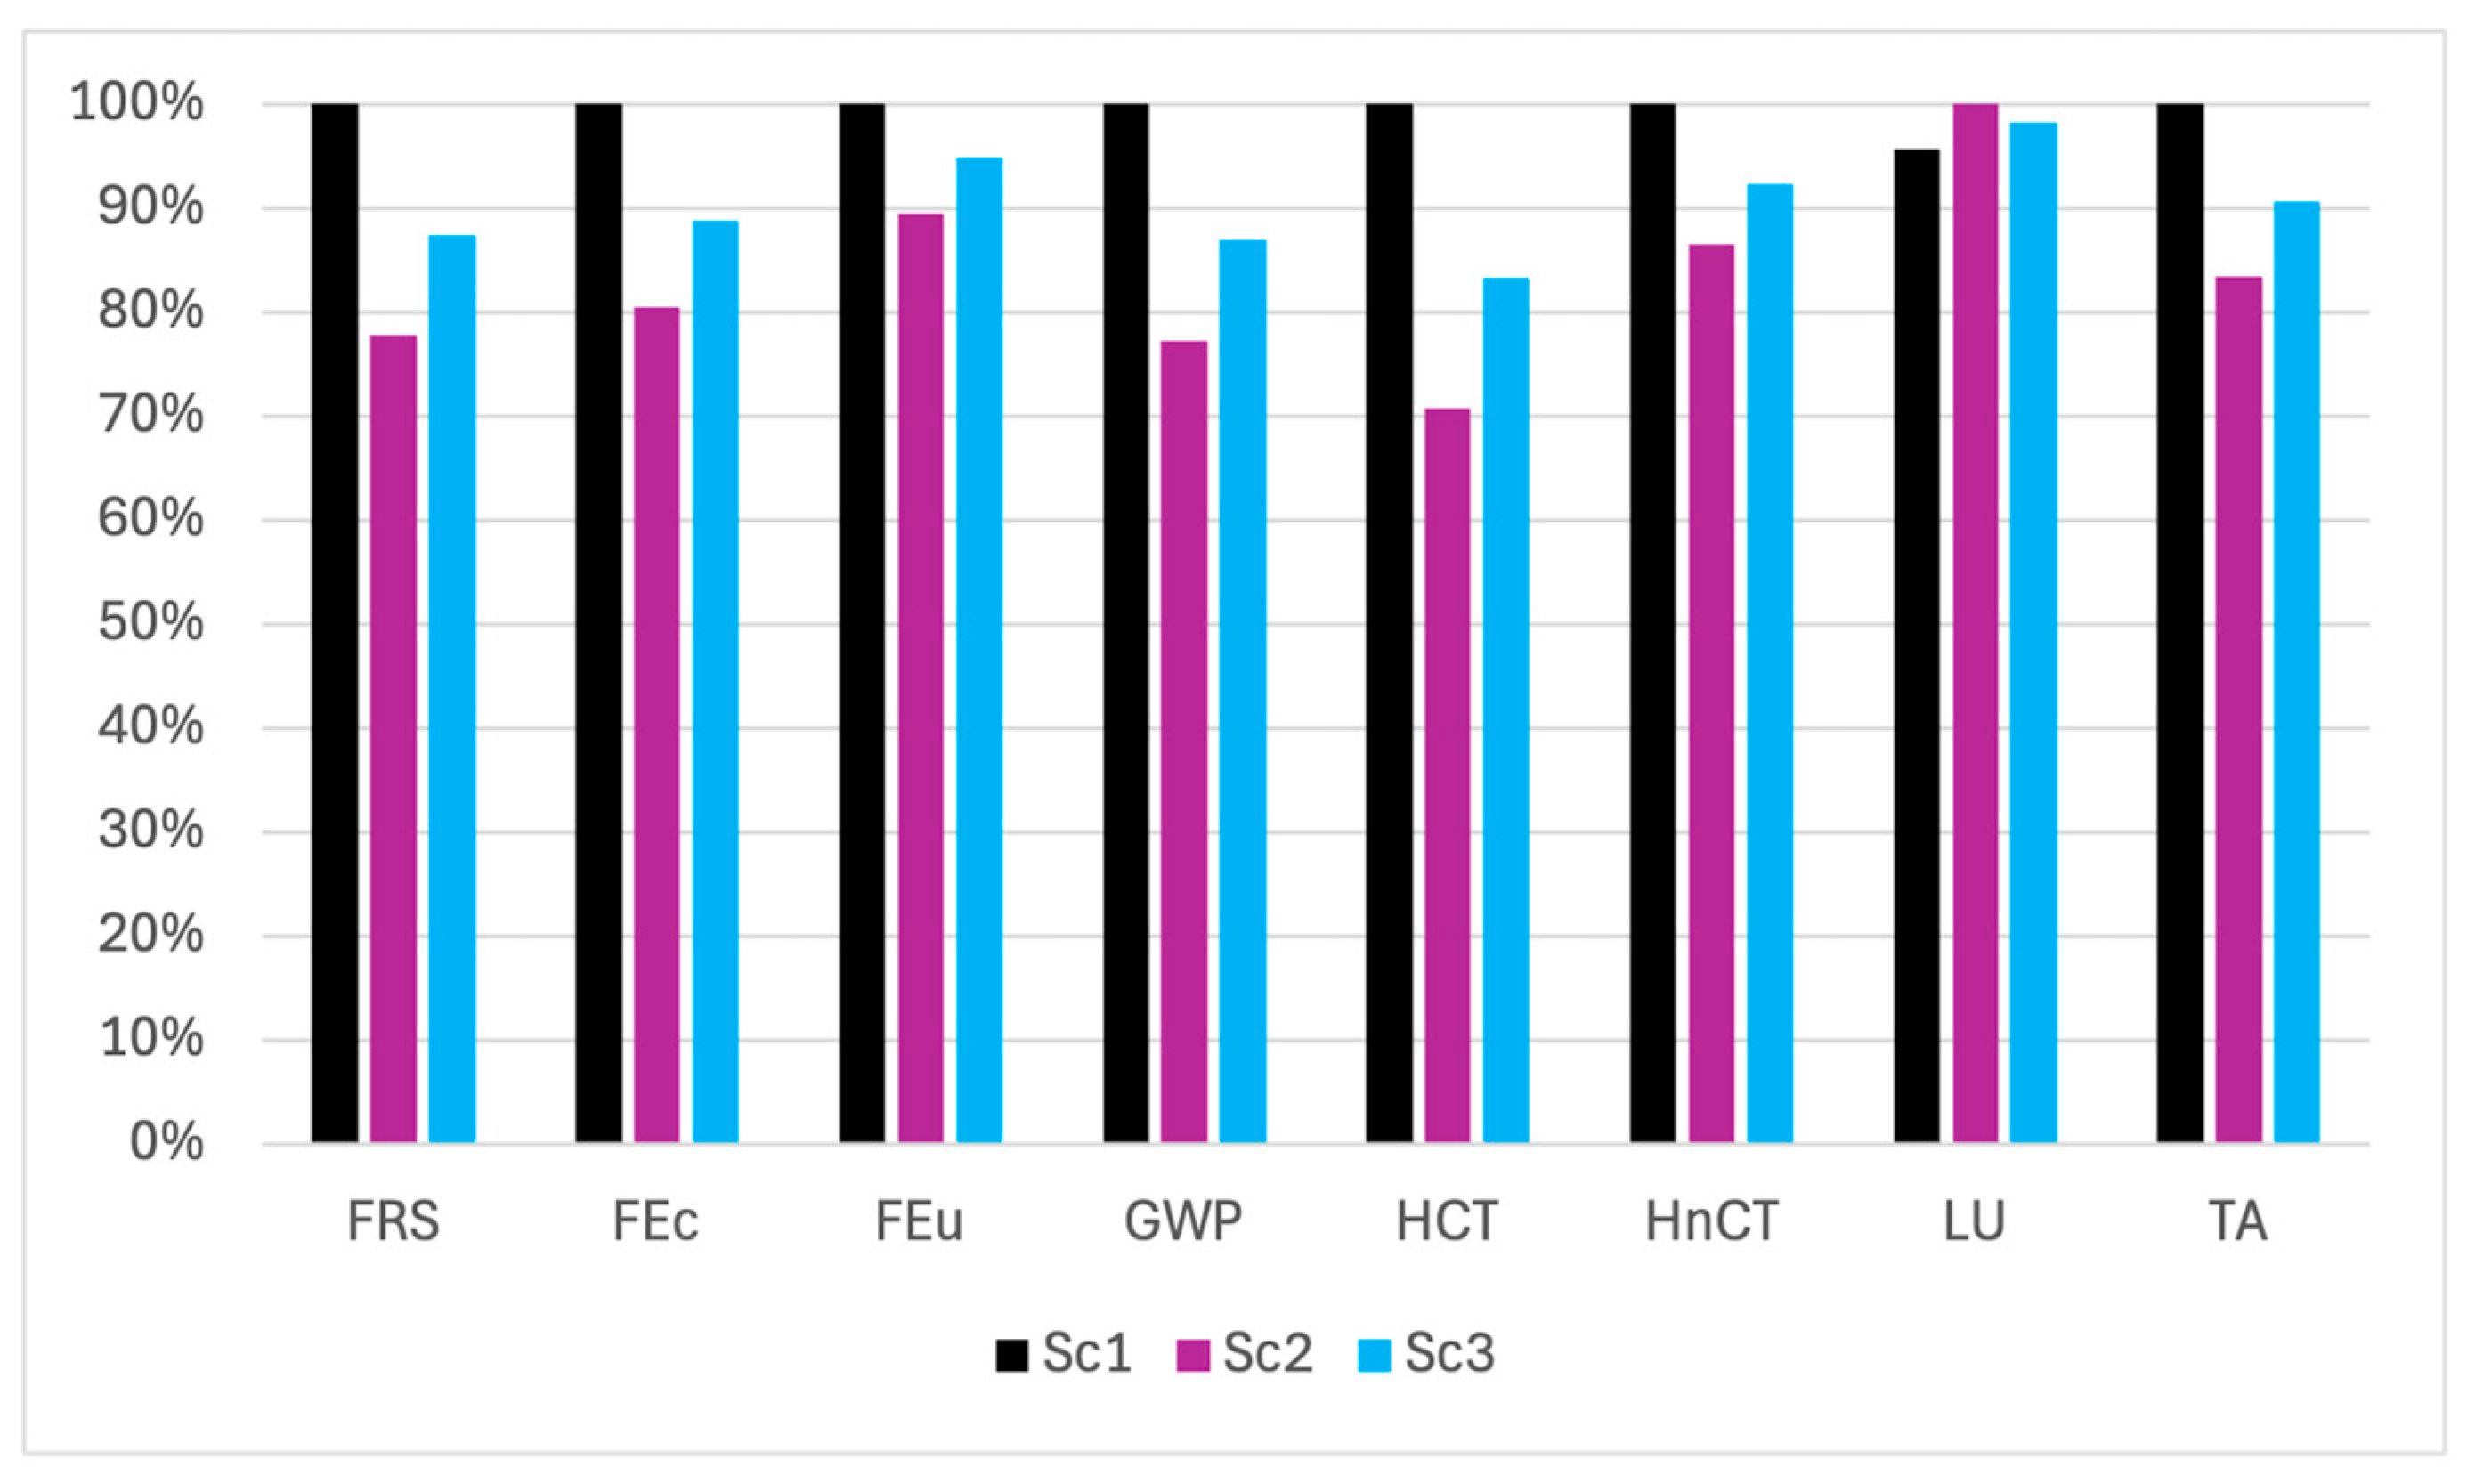
Table 4 presents the environmental impact in each evaluated impact category for the wheat production scenarios. Moreover, to aid in understanding the differences among the scenarios, Figure 3 presents the relative comparison between them. Overall, Scenario 2, which includes two harvest crop periods with the addition of vetch, shows the best environmental performance across all impact categories except LU, where it shows the worst performance. Scenario 1, which includes one harvest period without the addition of vetch, shows the lowest impact on LU but the highest impact in the rest of the categories.
Regarding the GWP, the highest impact is caused by Scenario 1, which does not include the addition of vetch. Scenario 2, which includes the addition of vetch and two harvest crops, led to the lowest impact, reduced by 22.8% compared to Scenario 1. Moreover, Scenario 3, with the addition of vetch and three harvest periods, reduces the impact by 13.1% compared to Scenario 1. Those results highlight the importance of a more circular approach in agriculture through the application of green manure, although they suggest that two harvesting periods should be preferred instead of three harvesting periods. Appendix A’s Table A1 presents the contribution of each process in the GWP for each scenario. Tillage processes caused the highest burden in Scenario 1 (185 kg CO2 eq), while their impact is reduced by 52.8 and 92.4 kg CO2 eq in Scenarios 3 and 2, respectively. Harvesting processes caused the second-highest impact in Scenario 1 (139.9 kg CO2 eq), which is reduced by 15.4 and 26.9 kg CO2 eq in Scenarios 3 and 2, respectively, followed by the impact caused by the fertilizer (137.6 kg CO2 eq), which is reduced by 19.7 and 34.4 kg CO2 eq in Scenarios 3 and 2, respectively, demonstrating the reduction in the demand for fertilizer due to the application of green manure. All scenarios require the same amount of electricity; thus, the impact caused by electricity is identical and equal to 137 kg CO2 eq. The rest of the processes contribute 73.2 kg CO2 eq to all of the scenarios.
Scenario 1 caused the highest impact in all the impact categories, except for LU. In the FRS category, the larger impact occurred from tillage processes, followed by electricity and then fertilizer, while in the FEc and FEu categories, the greater burden is caused by electricity, followed by harvesting processes and then fertilizer. Regarding HCT and HnCT, the greater burden is caused by harvesting processes, followed by tillage processes and electricity. In TA, the greater burden is caused by tillage and harvesting processes, followed by electricity. Finally, in LU, the impact is mainly caused due to the production of wheat seeds.
Scenario 2 presents the lowest impact in all categories, except for LU, where it presents the highest impact. Similarly to the GWP, the impact of Scenario 2 and Scenario 3 is reduced compared to Scenario 1, since the addition of vetch leads to lower resource and fertilizer consumption. In Scenarios 2 and 3, the impact caused by the production of wheat is slightly reduced; although, due to the need to produce additional seeds for vetch production, the overall impact on LU is further increased. Scenario 2 requires the highest number of additional seeds; hence, its impact is the highest.
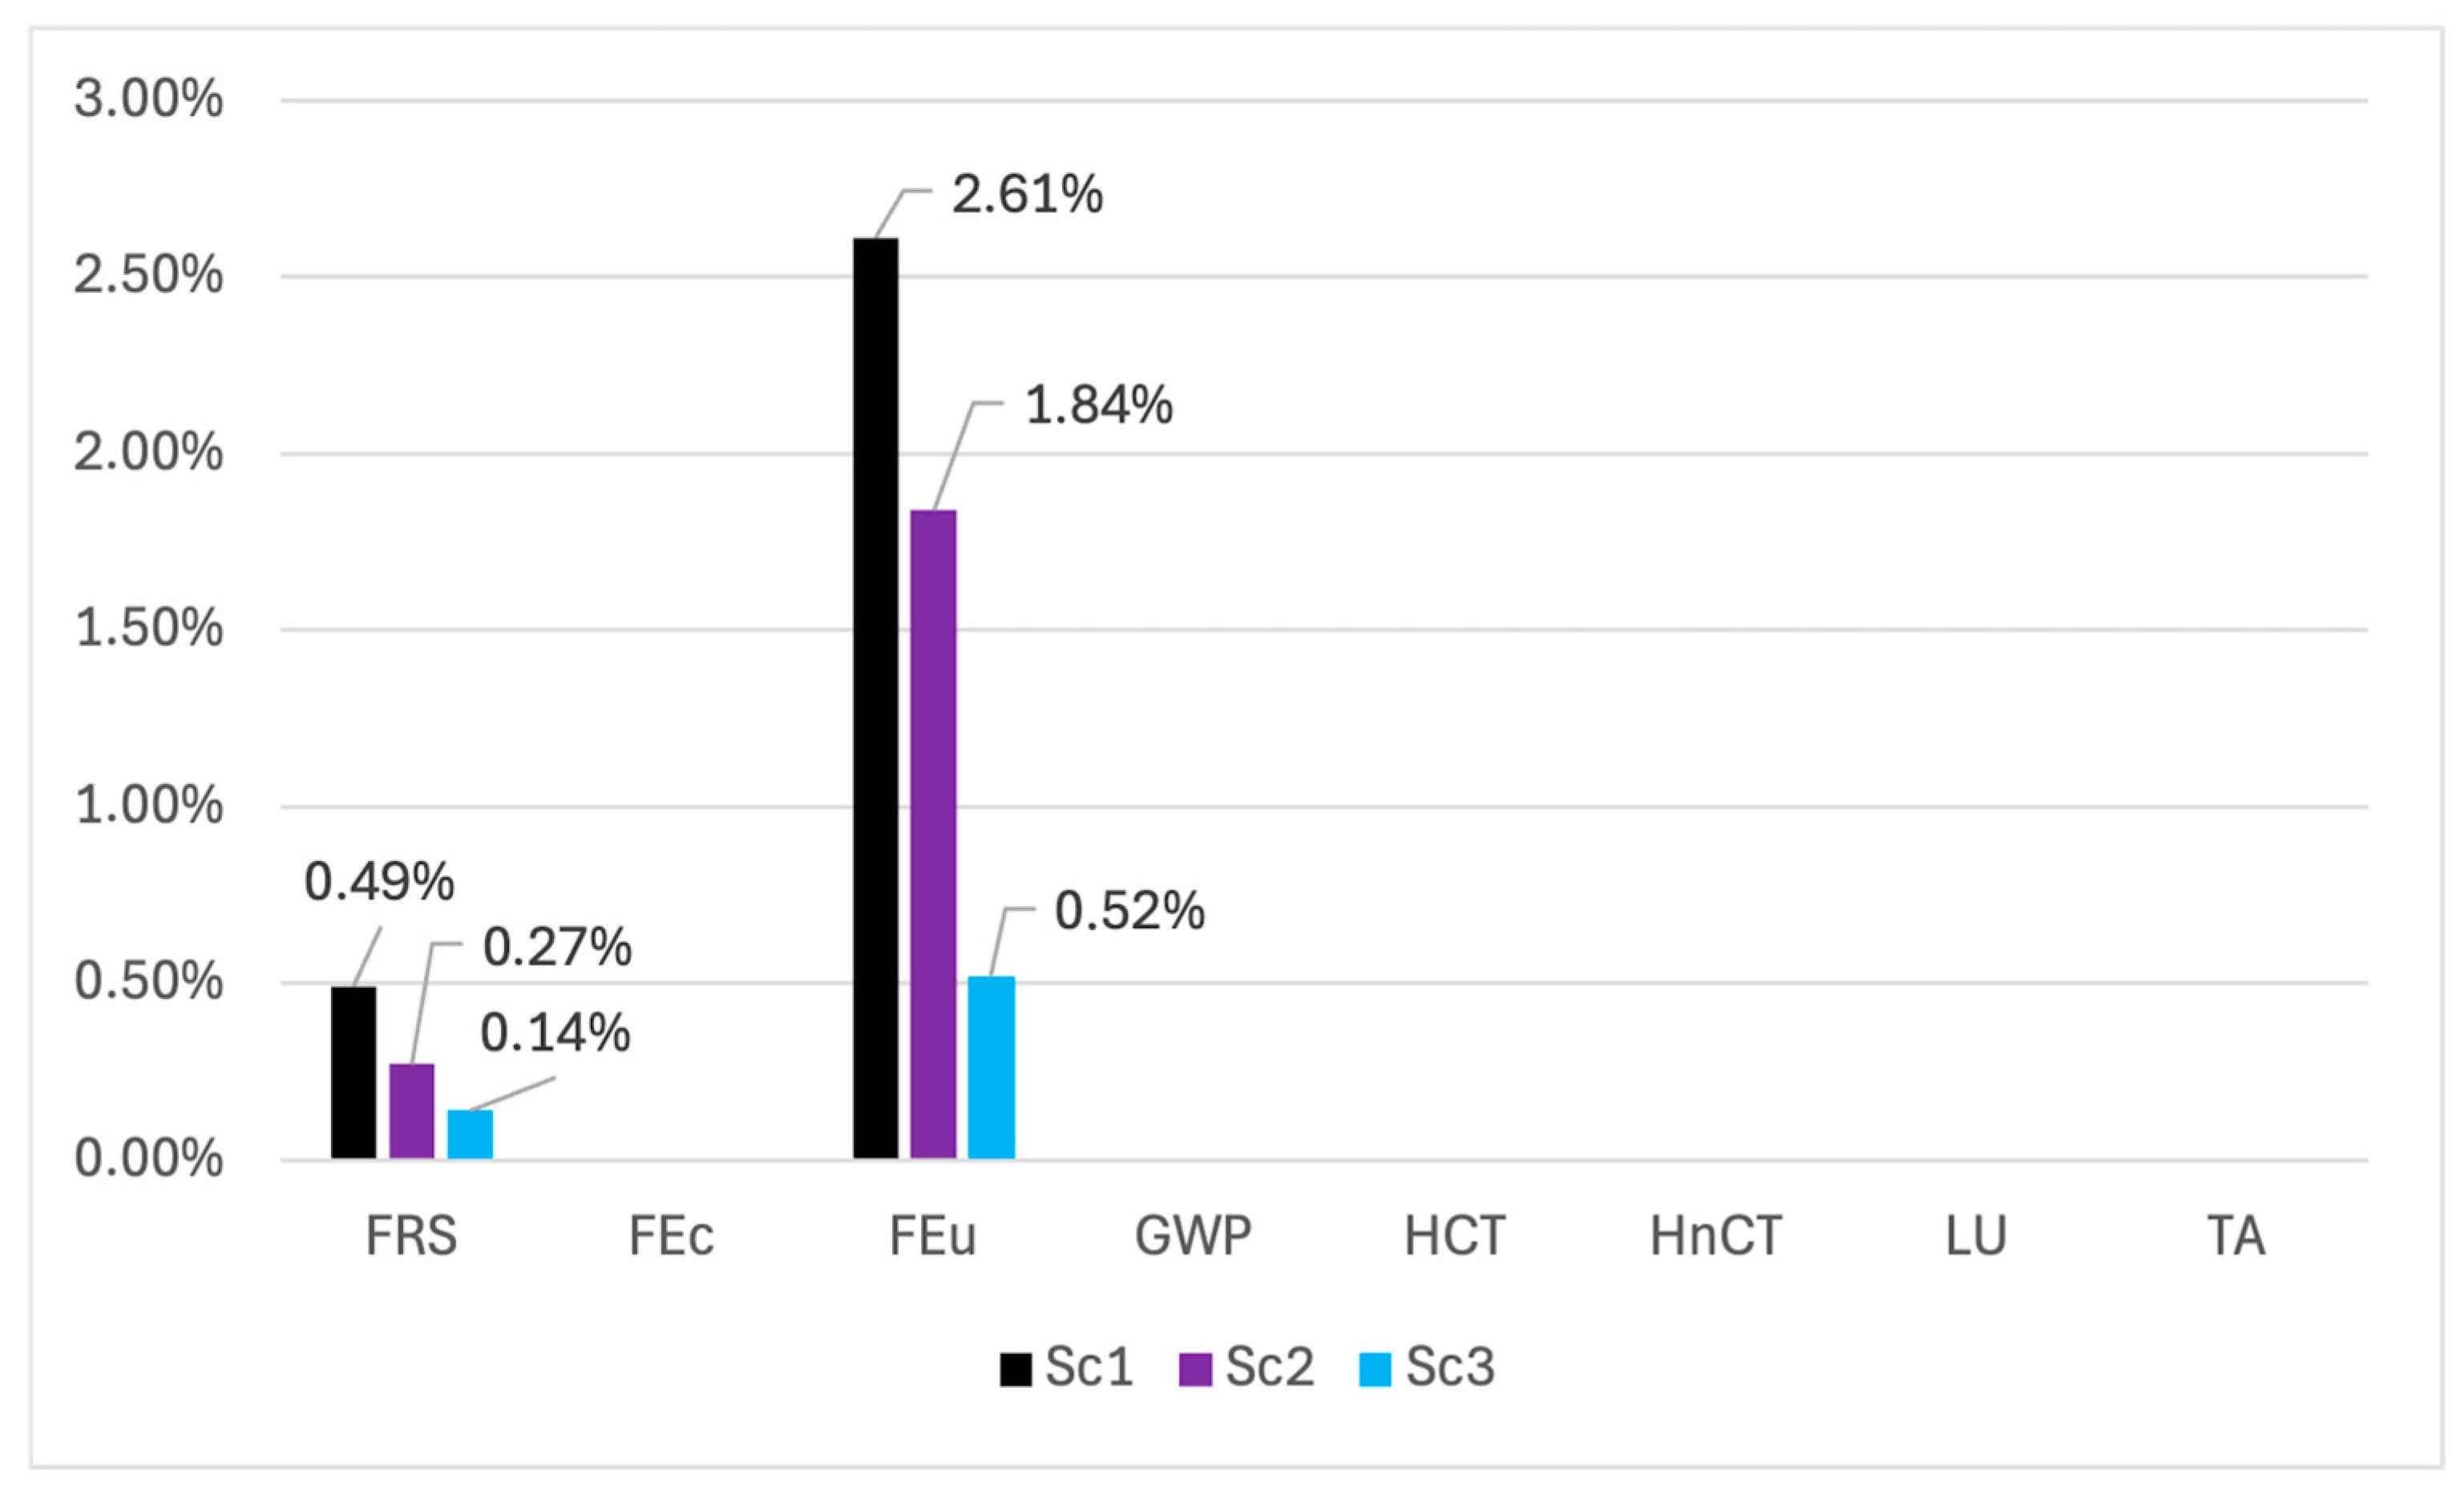
The assessment was also conducted with OpenLCA software v2.4.1, using the Ecoinvent v3.9.1 database and Recipe 2016 Midpoint (H) as the LCIA method. The results that occurred from the use of the two tools are identical. The default OpenLCA v2.4.1 option for presenting the results is five decimal points. Hence, based on the choice of the user of the FARMBENV tool about the number of decimal places to present the results, a minor deviation could occur due to rounding errors. When conducting the assessment using the FARMBENV tool, results were reported to two decimal points. As shown in Appendix A Figure A1, small deviations between FARMBENV and OpenLCA v2.4.1 occurred in the FRS and FEu impact categories. Scenario 1 exhibits the highest deviations, with 2.6% in FEu and 0.49% in FRS. However, when both tools report results with the same number of decimal points, the outcomes are identical, since the same LCI, background database, and LCIA method were applied.
The farmer and their co-workers conducted LCA studies in previous years as well, using different commercial software. In this light, they were asked to use the tool and describe its user-friendliness. On a scale of one to five, with one being very difficult to use and five being very user-friendly, they rated the user-friendliness of the tool as four out of five, indicating a positive experience with the tool. Moreover, they were asked whether they experienced any difficulties understanding the tool’s functions. On a scale of one to five, with one being too many difficulties and five no difficulties at all, they assigned a score of five out of five, suggesting that the functions of the FARMBENV tool were easy to understand.
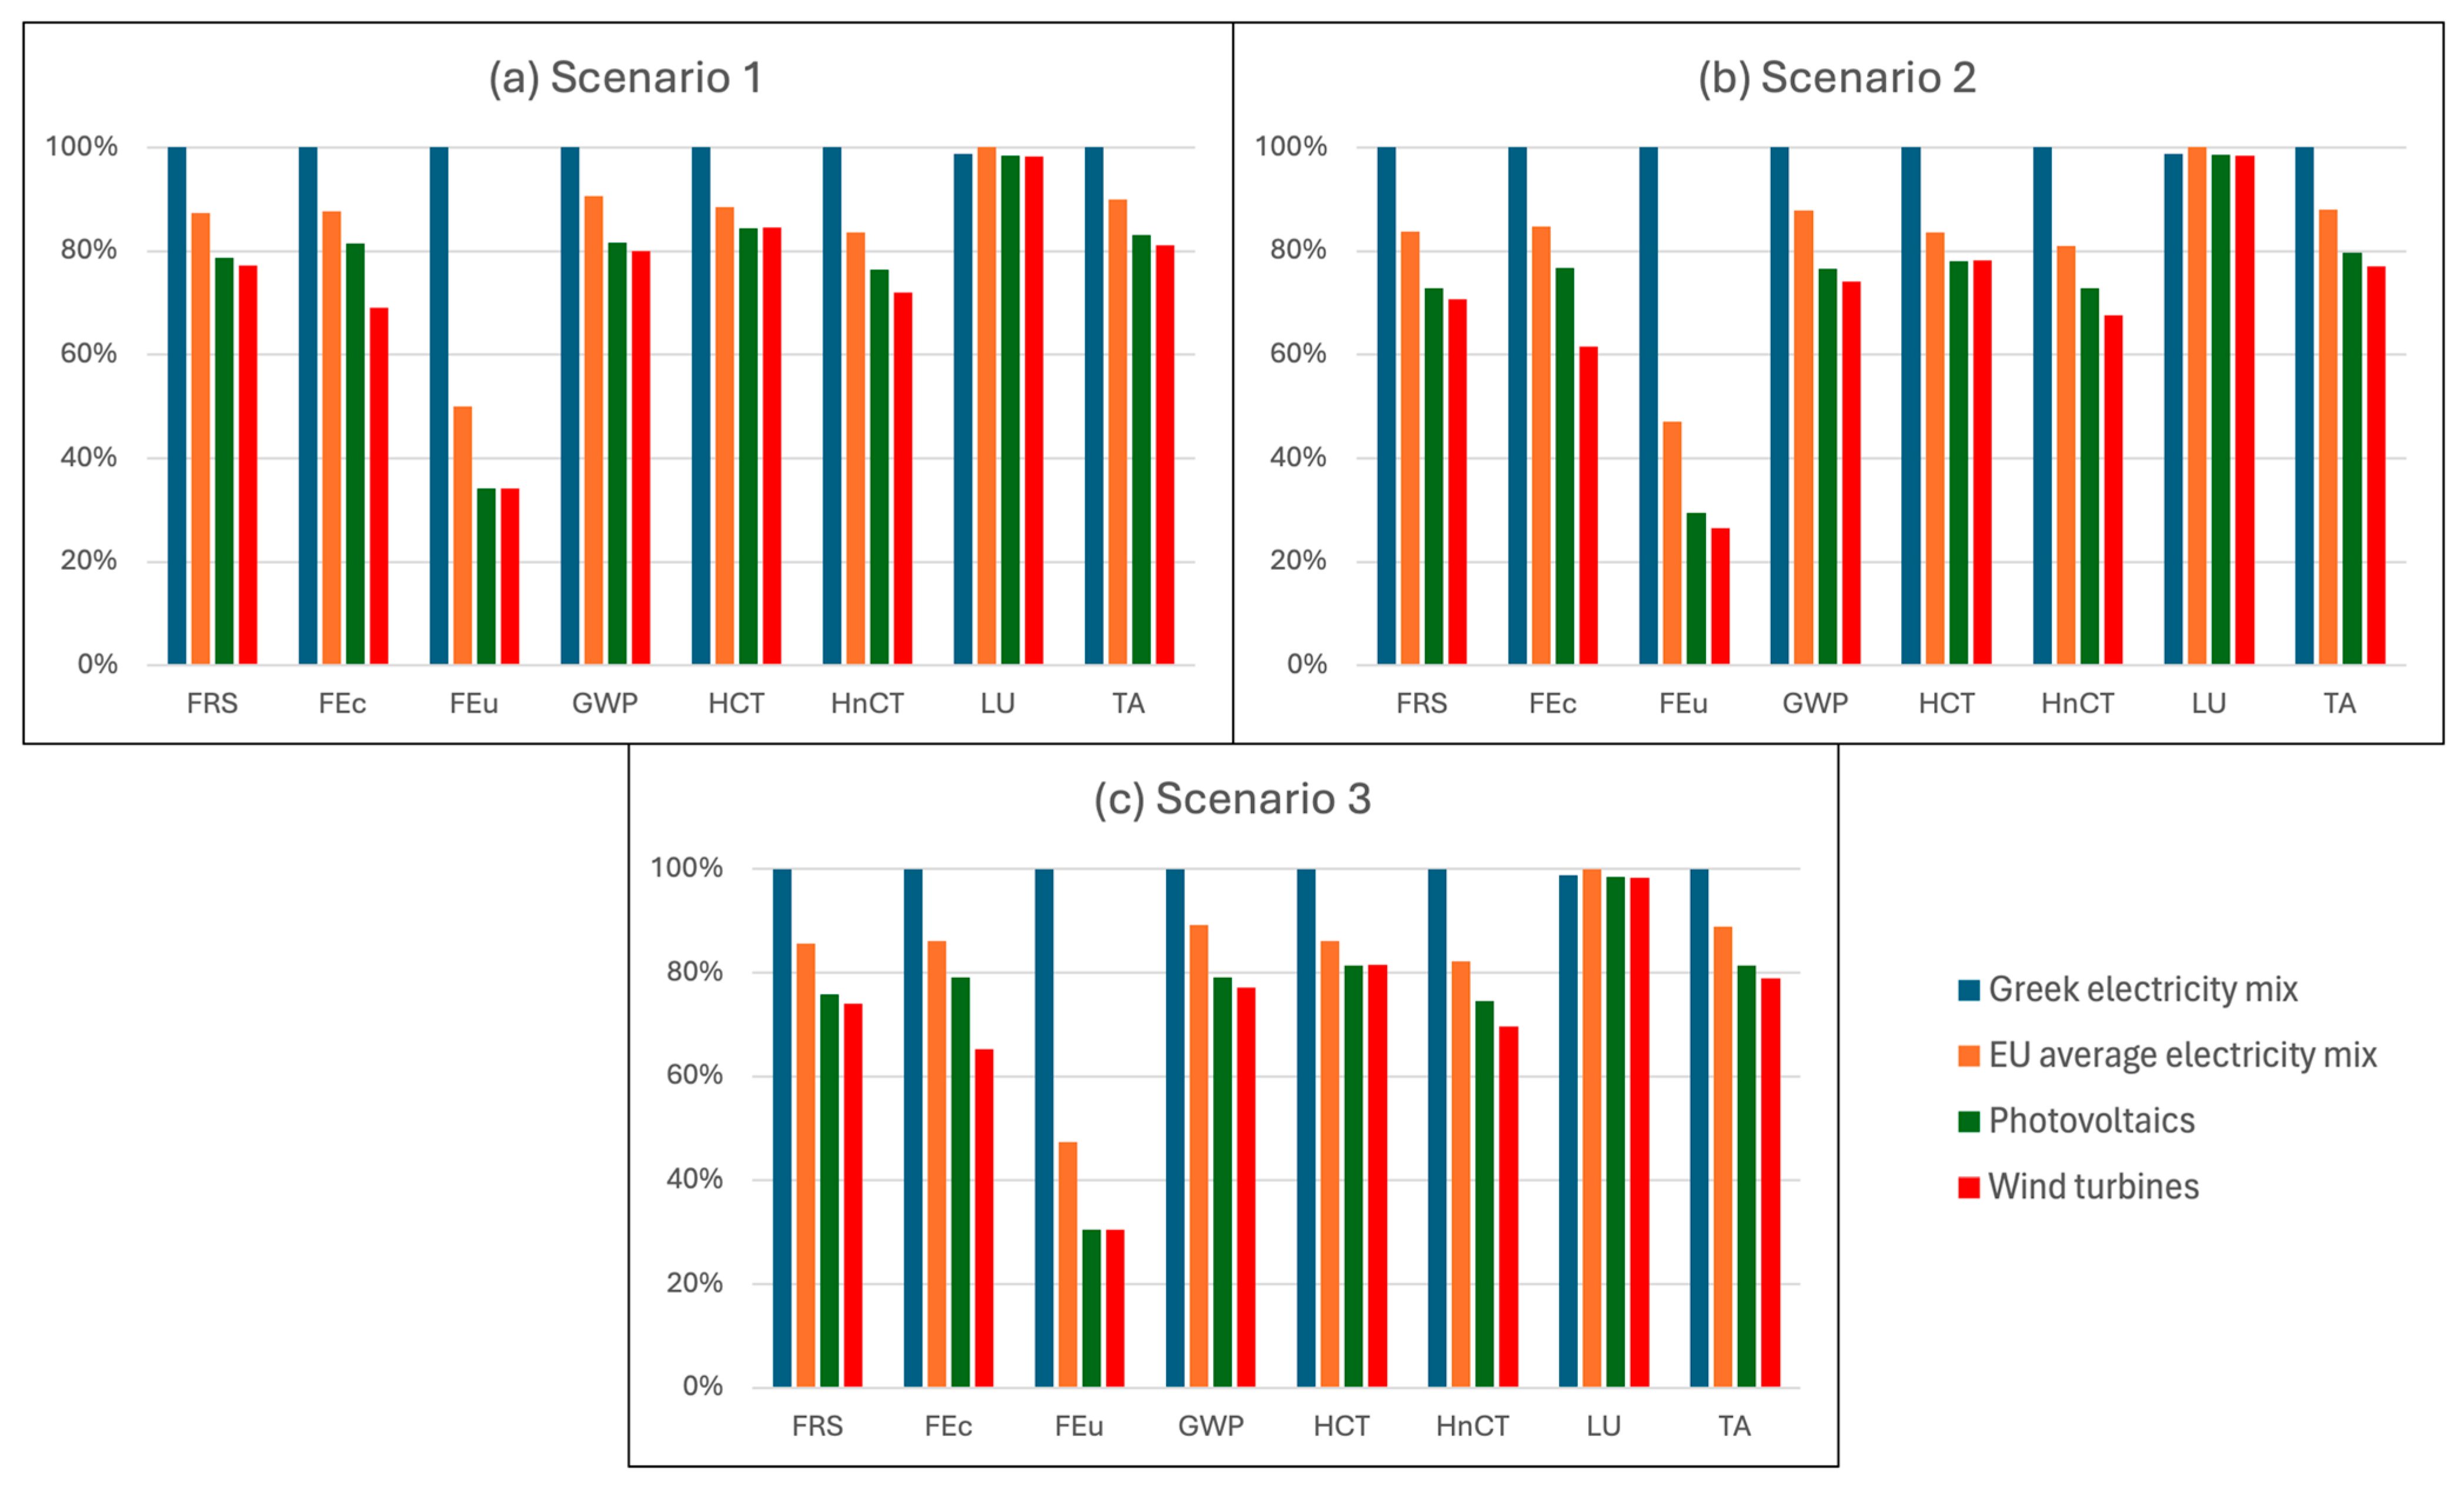
Figure 4 presents the results of the sensitivity analysis regarding the electricity source, while the numerical values of environmental impacts of each wheat production scenario under the different electricity scenarios are presented in Appendix A Table A2, Table A3 and Table A4. Since the impact of electricity is the same for all impact categories and scenarios, the ranking between the scenarios in terms of environmental performance is the same. However, the total environmental impact varies between the scenarios and, hence, so does the relative contribution of electricity to the total impact. For all impact categories except LU, the relative contribution of electricity to the total impacts is the highest in Scenario 2, which has the lowest overall impact, and the lowest in Scenario 1, which has the highest overall impact. Regarding the GWP, electricity contributes 137 kg CO2-eq in all wheat production scenarios, but it accounts for 26.4% and 20.4% of the total impact in Scenarios 2 and 1, respectively. When electricity is provided by the average EU electricity mix instead of the Greek electricity mix, the impact on the GWP caused by wheat production Scenarios 1, 2, and 3 is reduced by 9.4%, 12.2%, and 10.8%, respectively. Thus, the largest reduction is achieved in Scenario 2, while the lowest reduction is in Scenario 1. In contrast, for LU, the highest reduction is observed in Scenario 1 and the lowest in Scenario 2.
Using the EU average electricity mix lowers the impact in all categories compared to the Greek electricity mix, except for LU, where the impact is increased by 1% for all scenarios. Regarding the GWP, the impact is reduced by 12% in Scenario 2, by 11% in Scenario 3, and by 9% in Scenario 1. The greatest reduction is achieved in the category of FEu, where the highest impact was caused by electricity in the base case scenario (i.e., using electricity provided by the Greek electricity mix). The impact is reduced by 53% in Scenarios 2 and 3 and by 50% in Scenario 1. Examining the case of electricity produced by photovoltaic results in an even greater reduction across all impact categories, including LU. Compared to the base case scenario, the GWP is reduced by 23% in Scenario 2, 21% in Scenario 3, and 18% in Scenario 1. Regarding FEu, the impact is reduced by 71% in Scenario 2 and by 76% in Scenario 1, compared to the base case. Electricity produced by wind achieves the lowest impact in all impact categories, except for HCT. In HCT, the impact is slightly increased compared to the case of photovoltaics, where the lowest impact is achieved. Compared to the Greek electricity mix, wind electricity reduces the impact on the GWP by 26% in Scenario 2, 23% in Scenario 3, and 20% in Scenario 1.

3.3.2. Environmental Impacts of Waste-to-Energy Pathways

Table 5 presents the environmental impact of the WtE pathways when electricity is provided by the Greek electricity grid and the EU average electricity mix, while Table 6 presents the impacts when electricity is produced by photovoltaics and wind turbines. For the case of the Greek electricity mix, the application of the evaluated WtE pathways is not sufficient to provide environmental reductions. This is due to the increased burden that is caused by the Greek electricity mix, and the increased electricity consumption of the lab-scale experiments. For both cases where electricity is provided by the grid, the highest impact in all categories is caused by the WtE-2 pathway, which requires the highest amount of electricity. In terms of the GWP, the lowest impact is caused by the WtE-1 pathway. For all pathways, the maximum carbon intensity of the electricity used to achieve a zero-value GWP is in line with their required electricity. To achieve a GWP equal to or lower than zero, the WtE-1 pathway requires an electricity source with a carbon intensity lower than 398 g/kWh, a WtE-2 lower than 68 g/kWh, and, finally, a WtE-3 lower than 95 g/kWh.
In WtE-1 and WtE-2 pathways, the impact in all categories is caused mainly by electricity. Direct impacts due to the combustion of the fuels and indirect impacts due to the production of the required methanol, sodium hydroxide, and tap water are negligible. In WtE-3 pathways, the production and use of the LPG is identified as the most significant hotspot in the categories of the GWP, FRS, and TA, while in the LU category, yeast production is identified as the most significant hotspot, followed by LPG production. In the remaining categories, electricity is responsible for the greatest impact. By using electricity provided by the EU average mix, the WtE-1 pathway reduces the overall impact on the GWP and FRS, while WtE-2 and -3 pathways still lead to an increase in all categories. For the WtE-3 pathway, heat was provided by the LPG and not by an electric heater. Except for LU, the impact is reduced in all categories compared to the Greek electricity mix.
Heat was assumed to be provided by an electric heater in the WtE-3 pathway for the cases where electricity was assumed to be produced by photovoltaics or wind turbines. For the WtE-3 pathway, the impact on FEc, FEu, HCT, and HnCT (mainly attributed to the indirect impacts of electricity instead of LPG) is increased compared to the case of the EU average mix. The impact on FEc and HnCT is also increased compared to the case of the Greek electricity mix. In addition, the impact on the LU of the WtE-3 pathway remains approximately the same, since most of the impact was caused by yeast production.
In the rest of the impact categories and pathways, the impact is reduced when using electricity produced by photovoltaics. Nevertheless, despite the reduction, only WtE-1 and WtE-3 pathways lead to a reduction in the overall impact on FRS and the GWP. Compared to the previous case, the WtE-1 pathway also leads to a reduction in the impact on TA. The WtE-2 pathway does not lead to potential reductions in any impact category, due to its increased electricity consumption.
For the case where electricity is produced by wind turbines, the lowest impact occurred in all impact categories, except for HCT, where the impact is slightly increased compared to photovoltaics, like the wheat production results. All WtE pathways lead to a reduction in the overall impact on the GWP and FRS. WtE-1 and WtE-2 pathways lead to a reduction in TA, while WtE-1 leads to a reduction in HnCT as well. The WtE-2 pathway, which has the potential to produce the greatest amount of energy, also leads to the highest reduction in the GWP and FRS, where WtE-3, which leads to the lowest potential produced energy, leads to the lowest reduction. Moreover, the impact caused by the WtE-1 pathway in the rest of the impact categories is negligible.

3.3.3. Integrated Assessment of Wheat Production Scenarios and Waste-to-Energy Pathways

The results of the WtE-1 pathway, using electricity produced by photovoltaics and wind turbines, were integrated with the results of the wheat production Scenario 2, where electricity is provided by the Greek electricity mix. The reason for integrating the WtE-1 pathway is that it requires the least amount of electricity and input requirements, and its operational simplicity makes it easy to adopt in practice from a techno-economic perspective. WtE scenarios using electricity provided by the grid were not integrated, since a circular economy approach aims to promote the use of low-carbon and renewable energy sources. Among the wheat production scenarios, Scenario 2 was evaluated, since it is the best-case scenario in terms of environmental performance. The case of electricity provided by the Greek electricity mix for wheat production was evaluated, since it is the current real-life practice, ensuring the analysis is relevant in today’s energy context.
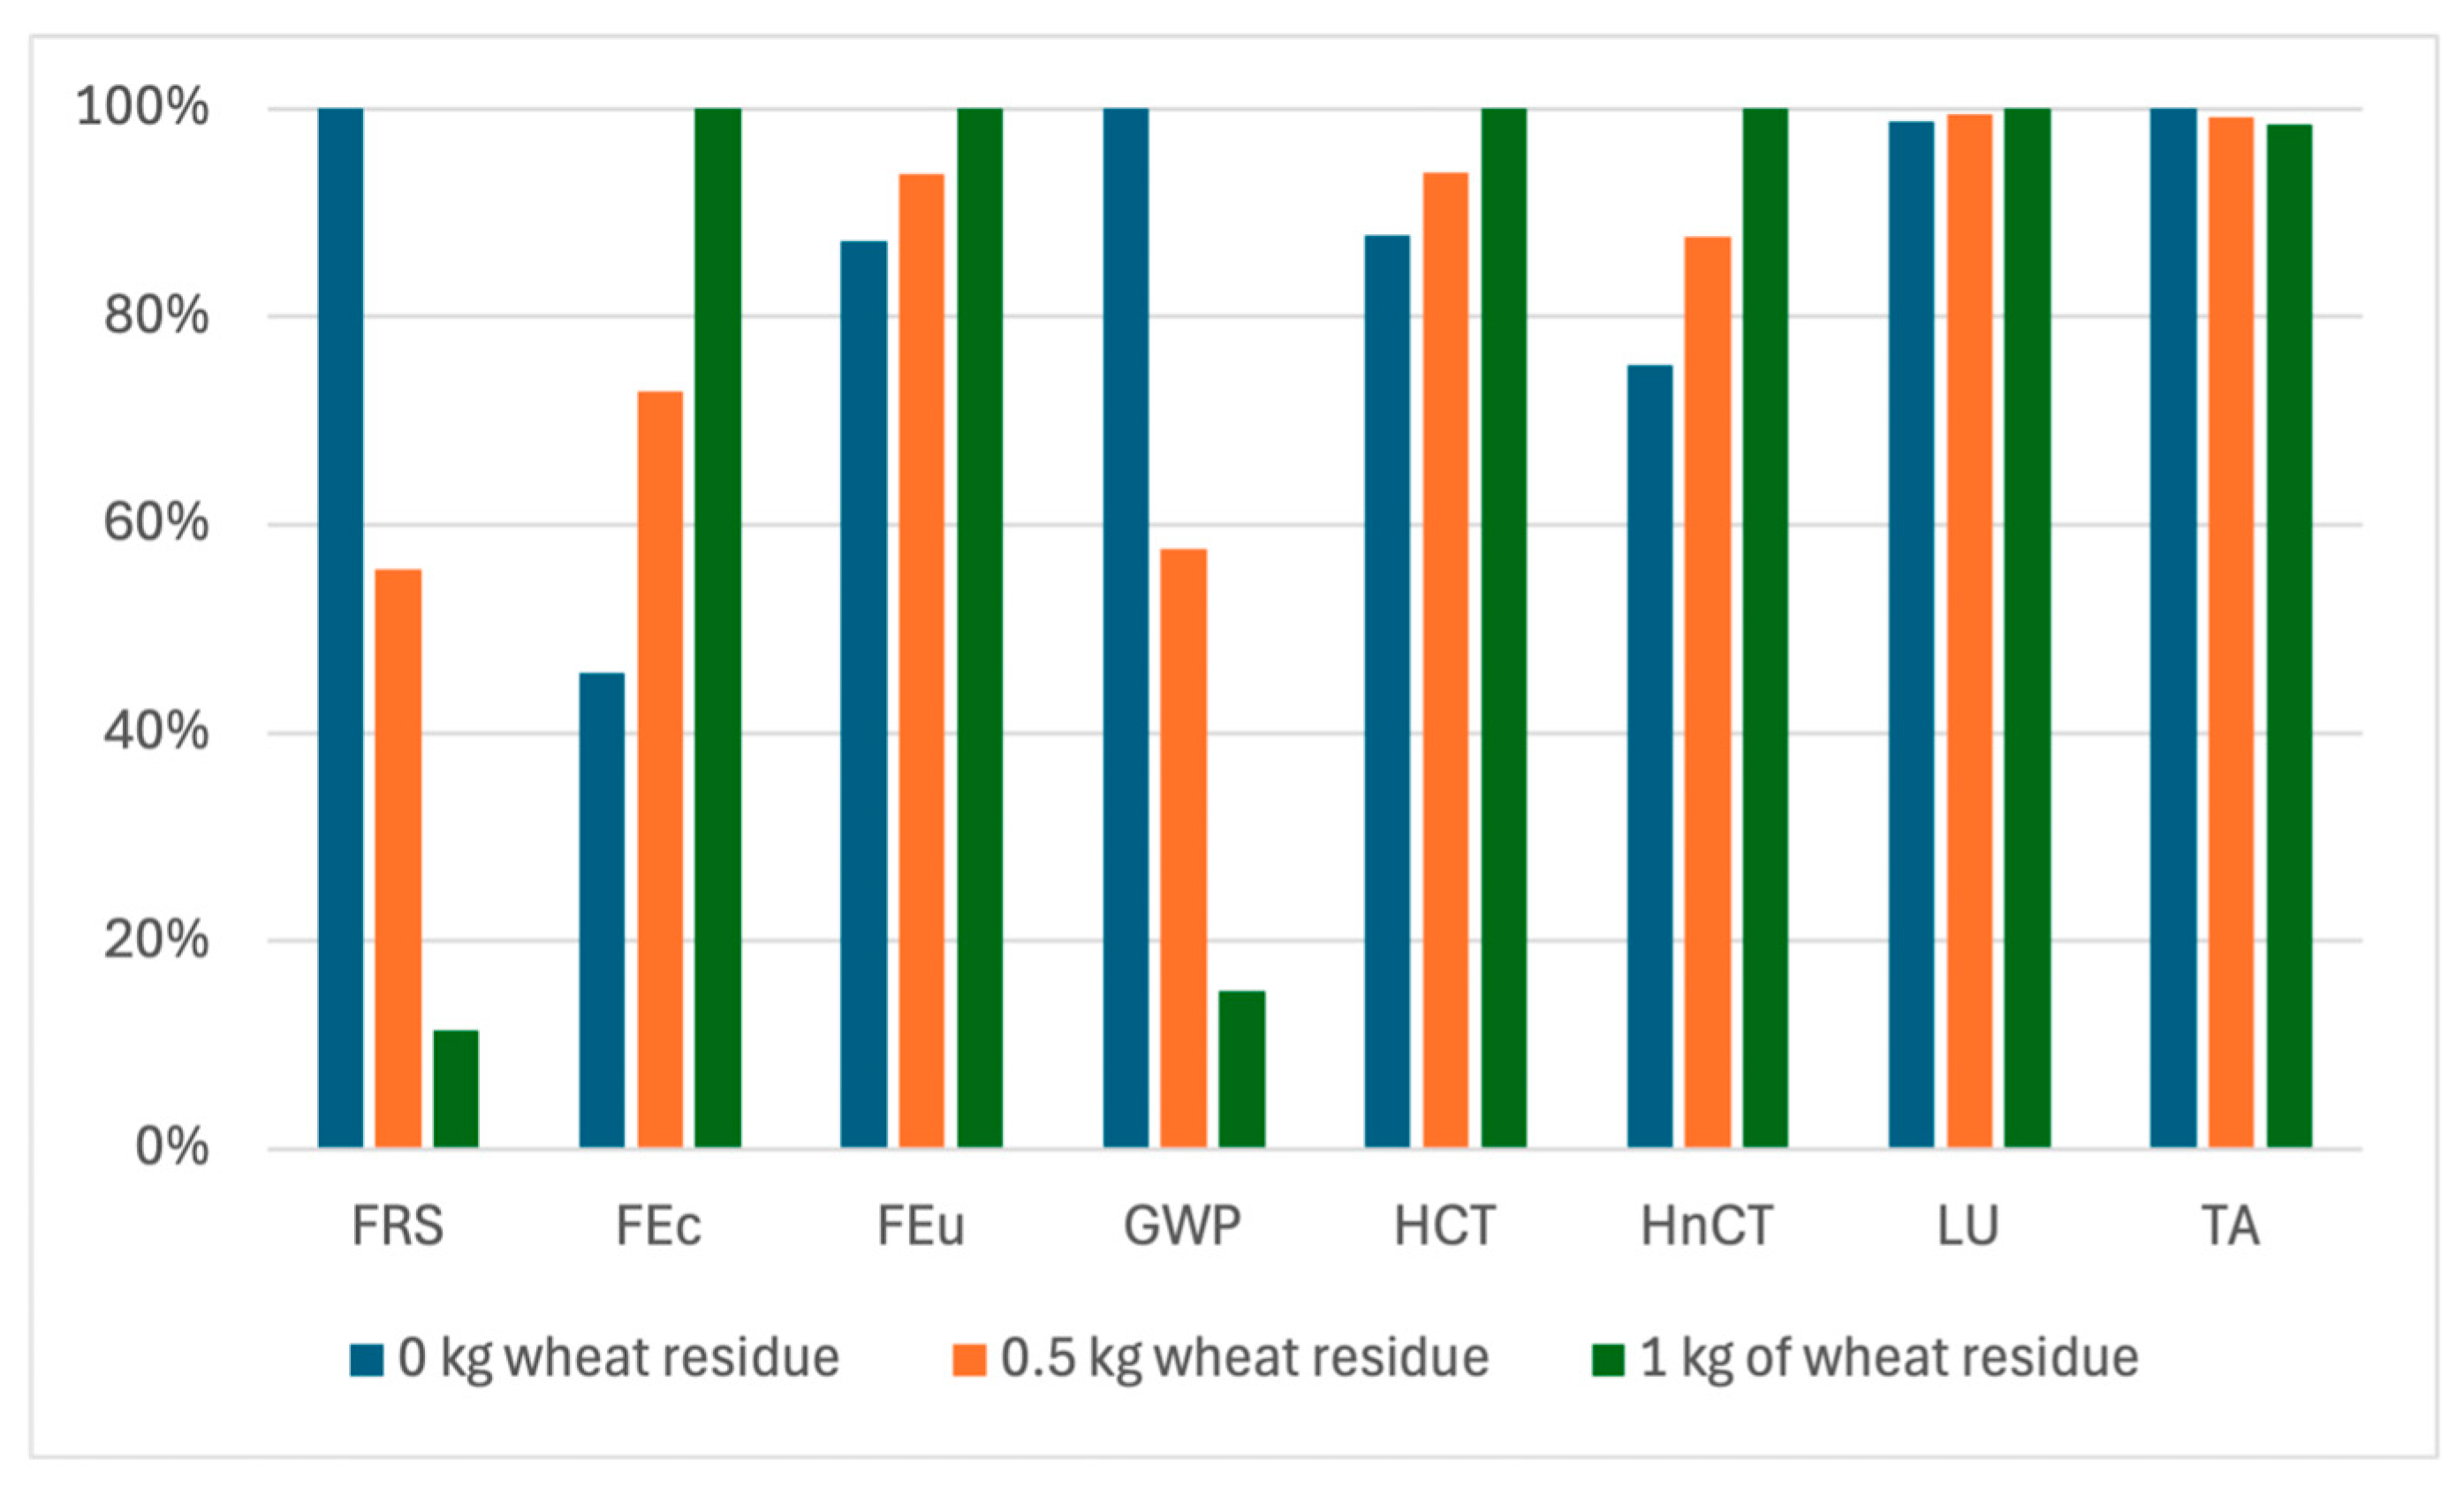
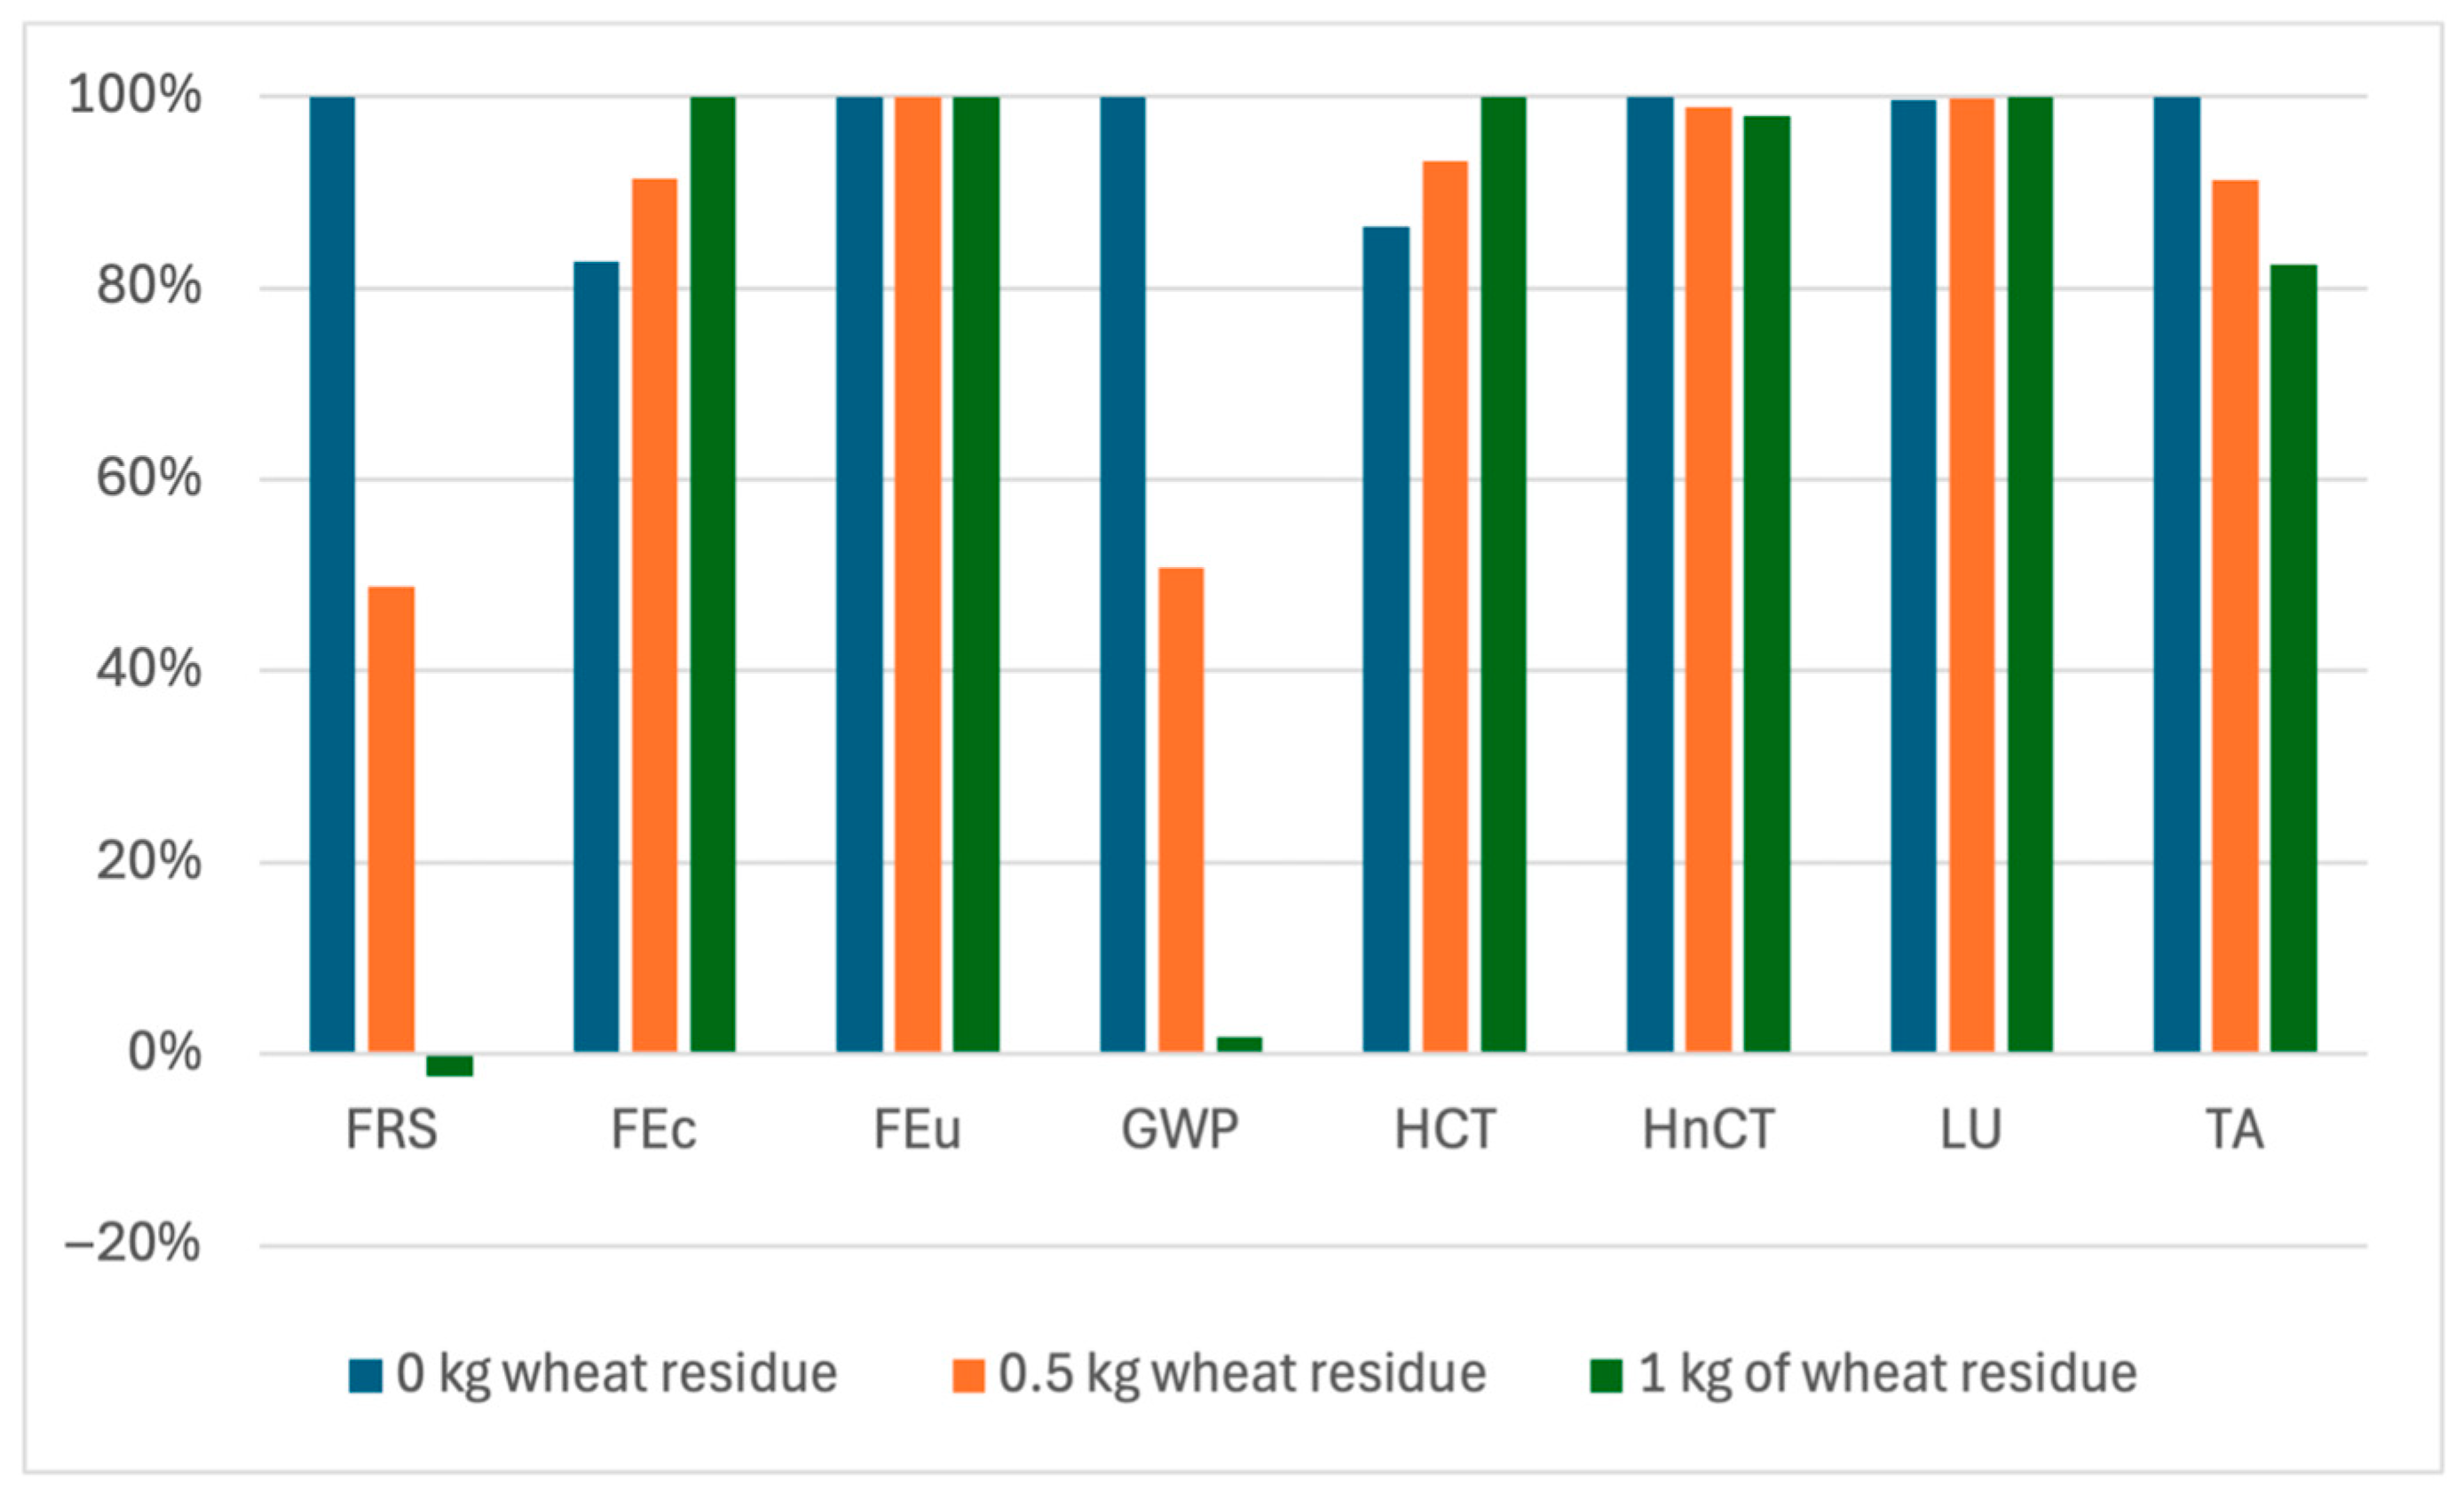
Figure 5 presents the integrated impact results for Scenario 2, with WtE-1 and the electricity for WtE produced by photovoltaics. The case of 0 kg of wheat residue per kg of produced wheat represents the current approach, without energy valorization. Under the assumption that 0.5 kg of wheat residue is recoverable per 1 kg of produced wheat, the application of the WtE-1 pathway using electricity produced by photovoltaics reduces the impact on the GWP and FRS by 42% and 44%, respectively, and by 1% for TA. Under the assumption of 1 kg of recoverable wheat residues, the potential reduction is doubled. In the LU category, the impact remains approximately identical. However, the overall impact is increased in the rest of the categories, with the most noticeable increase in the FEc category (59.4%), followed by HnCT (16.4%), FEu (7.3%), and HCT (7%).
Figure 6 presents the integration in the case where the electricity for WtE-1 is produced by wind turbines. Under the assumption that 0.5 kg of wheat residue is recoverable per 1 kg of produced wheat, the application of the WtE-1 pathway reduces the impact on the GWP and FRS by 49% and 51%, respectively, and by 9% for TA. In addition, a minor reduction (1%) could be achieved in HnCT, while the impact on LU and FEu remains identical. Nevertheless, in the category of FEc the impact is increased by 10.4% and by HCT for 7.9%, compared to the non-integrated case.

4. Conclusions

This study introduced FARMBENV, a user-friendly, real-time, and web-based LCA tool designed for the agriculture sector, and validated its accuracy through a comparison with OpenLCA v2.4.1. Overall, the results from the tools were consistent, validating the accuracy of the FARMBENV tool. Moreover, the end-users who used the tool characterized it as user-friendly and its function as easy to understand.
The tool was applied to assess three wheat production systems in Greece using primary data. Among the scenarios, Scenario 2 (two harvests, with vetch) showed the best environmental performance across most impact categories, which led to a 22.8% lower impact on the GWP compared to Scenario 1 (no vetch). These results highlight the importance of a more circular approach in agriculture through the application of green manure and suggest that, in terms of environmental impact, two harvesting periods should be preferred instead of three harvesting periods.
Moreover, three WtE pathways were evaluated through lab-scale experiments and LCAs. The WtE-1 pathway (pellet production) showed the best environmental performance in the GWP impact category for all cases, except the one where electricity is produced by wind turbines. Moreover, in WtE-1, the GWP can be reduced when the electricity is not provided by the Greek electricity mix, while in WtE-3 (ethanol production), the GWP can be reduced when the electricity is produced by photovoltaics or wind turbines. The WtE-2 (pellet and biodiesel production) pathway led to a reduction in the GWP only when electricity was produced by wind turbines. In that case, WtE-2 led to the greatest reduction in the GWP. Finally, the integration of wheat production Scenario 2 and WtE-1 demonstrated a 49% GWP reduction when the electricity used for the latter was produced by wind turbines.
The findings of the sensitivity analysis outline the strong influence of the electricity source on the overall environmental performance of agriculture and WtE pathways, especially in the categories of GWP, FRS, and FEu. Nevertheless, the integration of WtE pathways using renewable energy sources into the current wheat production scenarios demonstrates an increase in the overall impact caused on FEc and human toxicity, suggesting trade-offs that must be considered in system designs.
This study has several limitations. This study focused on a single case study to demonstrate the functionality of FARMBENV. Moreover, the agricultural data were obtained from a single farm under Mediterranean conditions, which may limit the generalizability of the results to other regions, management practices, or climates. Moreover, seasonal and inter-annual variations in crop performance were not considered, which could influence the LCA outcomes. In addition, this study examined only wheat–vetch systems, limiting insights into the tool’s applicability to other crops, while it does not integrate the live sensors data. Finally, regarding the WtE technologies, the amount of feedstock available was limited, restricting the experiments to lab-scale conditions.
Future research should expand to include the economic and social pillars of sustainability and investigate the integration of additional WtE technologies, such as anaerobic digestion, gasification, and pyrolysis, within the agricultural sector. Moreover, additional experiments with the equipment used should be performed with larger amounts of feedstock to optimize the procedures, lower the energy demand per kg of treated residues, and obtain a higher biofuel yield. Within this study, the main focus was to apply FARMBENV to a single case study to demonstrate its functionality and capabilities. The generalizability of the results could also be enhanced by incorporating data from multiple farms and regions, as well as by accounting for seasonal and inter-annual variations in crop performance. A further demonstration of FARMBENV through additional case studies and agricultural products could be carried out, particularly by utilizing the tool’s ability to source data from live sensors to support EPDs. Finally, while this study focused on wheat–vetch systems under Mediterranean conditions, the tool applies to other agricultural products. In this regard, assessing the environmental performance of wheat–vetch systems in humid and tropical regions, using region-specific data, would be especially valuable to better understand how the benefits of green manure vary across climates.
Author Contributions

Conceptualization, C.S., C.K., C.A., A.V.M. and C.V.; methodology, C.S., C.A., A.V.M. and C.V.; software, C.S.; validation, C.S. and C.K.; formal analysis, C.S. and A.V.M.; investigation, C.M. and D.-A.K.; resources, C.K., C.A. and C.V.; data curation, C.S., C.K., C.M. and D.-A.K.; writing—original draft preparation, C.S.; writing—review and editing, C.K. and A.V.M.; visualization, C.S.; supervision, C.K., C.A., A.V.M. and C.V.; project administration, C.K. and A.V.M.; funding acquisition, C.A. and C.V. All authors have read and agreed to the published version of the manuscript.

Funding

This research was carried out as part of the project “Real-time environmental assessment of agricultural and agrifood production for the support of certification schemes” (project code: KMP6-0078501) under the framework of the action “Investment Plans of Innovation” of the Program “Central Macedonia 2021–2027”, which is co-funded by the European Union and Greece.

Institutional Review Board Statement

Ethical review and approval were waived for this study due to minimal-risk research. The study involved experimental measurements of agricultural residues, wheat production data obtained from farm records and field operations, a short interview with a farmer in Central Macedonia, Greece, and a computational life cycle assessment (LCA) modeling. During the interview, the farmer was asked to provide information on agricultural practices and to give feedback on the user-friendliness of the LCA tool. No personal, medical, or sensitive information was collected, and no animals were involved. Oral informed consent was obtained from the participant. In accordance with institutional and national regulations, such research is considered minimal and is exempt from prior ethics committee approval.

Informed Consent Statement

Verbal informed consent was obtained from the participants. Verbal consent was obtained rather than written because the interview involved minimal-risk research, collected only non-sensitive information about agricultural practices and feedback on the LCA tool, and did not include personal, medical, or identifying data.

Data Availability Statement

All data used in this study are included within the article.

Acknowledgments

The authors would like to acknowledge Kassandra Makavou for her support in the validation process of the LCA tool.

Conflicts of Interest

Author CK was employed by the company EFB. The remaining authors declare that the research was conducted in the absence of any commercial or financial relationships that could be construed as a potential conflict of interest.

Abbreviations

The following abbreviations are used in this manuscript:
EPDEnvironmental product declaration
FEcFreshwater ecotoxicity
FeuFreshwater eutrophication
FPMFFine particulate matter formation
FRSFossil resource scarcity
GHGGreenhouse gas
GWPGlobal warming potential
HCTHuman carcinogenic toxicity
HnCTHuman non-carcinogenic toxicity
IRIonizing radiation
LCALife cycle assessment
LCILife cycle inventory
LCIALife cycle impact assessment
LULand use
MEcMarine ecotoxicity
MEuMarine eutrophication
MRSMineral resource scarcity
OFHHOzone formation human health
OFTEOzone formation terrestrial ecosystems
SODStratospheric ozone depletion
TATerrestrial acidification
TETerrestrial ecotoxicity
WCWater consumption
WtEWaste-to-energy

Appendix A

Figure A1. Deviation between the results of the FARMBENV tool, reported in two decimal points, and OpenLCA v2.4.1, presented in five decimal points.
Sustainability 17 08106 g0a1
Table A1. Contribution analysis of each process in the GWP for the evaluated wheat production scenarios.
ProcessScenario 1Scenario 2Scenario 3
Tillage processes (kg CO2-eq)184.9992.56132.17
Harvesting processes (kg CO2-eq)139.9113124.53
Fertilizer (kg CO2-eq)137.61103.21117.96
Electricity (kg CO2-eq)136.97136.97136.97
Seed production (kg CO2-eq)25.727.5126.74
Application of plant protection (kg CO2-eq)20.9915.7417.99
Sowing (kg CO2-eq)19.7724.9422.73
Pesticide (kg CO2-eq)6.735.045.76
Total impact (kg CO2-eq)672.67518.99584.55
Table A2. Environmental impacts of wheat production–sensitivity analysis results of using electricity provided by the EU average electricity mix, impacts per 1000 kg of produced wheat.
Impact CategoryUnitsScenario 1Scenario 2Scenario 3
Fossil Resource Scarcity (FRS)kg oil eq164.96122.95140.95
Freshwater Ecotoxicity (FEc)kg 1.4-DCB36.6928.5132.01
Freshwater Eutrophication (FEu)kg P eq0.190.160.17
Global Warming Potential (GWP)kg CO2 eq609.28455.69521.46
Human Carcinogenic Toxicity (HCT)kg 1.4-DCB71.5847.9158.05
Human Non-Carcinogenic Toxicity (HnCT)kg 1.4-DCB945.33791.99857.7
Land Use (LU)m2a crop eq126.71132.48130.01
Terrestrial Acidification (TA)kg SO2 eq2.772.262.48
Table A3. Environmental impacts of wheat production–sensitivity analysis results of using electricity produced by photovoltaics, impacts per 1000 kg of produced wheat.
Impact CategoryUnitsScenario 1Scenario 2Scenario 3
Fossil Resource Scarcity (FRS)kg oil eq148.49106.98124.78
Freshwater Ecotoxicity (FEc)kg 1.4-DCB34.0625.8529.37
Freshwater Eutrophication (FEu)kg P eq0.130.100.11
Global Warming Potential (GWP)kg CO2 eq549.39397.80462.77
Human Carcinogenic Toxicity (HCT)kg 1.4-DCB68.3444.7054.83
Human Non-Carcinogenic Toxicity (HnCT)kg 1.4-DCB864.47711.70777.17
Land Use (LU)m2a crop eq124.75130.54128.05
Terrestrial Acidification (TA)kg SO2 eq2.562.052.27
Table A4. Environmental impacts of wheat production–sensitivity analysis results of using electricity produced by wind turbines, impacts per 1000 kg of produced wheat.
Impact CategoryUnitsScenario 1Scenario 2Scenario 3
Fossil Resource Scarcity (FRS)kg oil eq145.81103.80121.80
Freshwater Ecotoxicity (FEc)kg 1.4-DCB28.8920.7124.21
Freshwater Eutrophication (FEu)kg P eq0.130.090.11
Global Warming Potential (GWP)kg CO2 eq538.64384.96450.83
Human Carcinogenic Toxicity (HCT)kg 1.4-DCB68.4944.8354.97
Human Non-Carcinogenic Toxicity (HnCT)kg 1.4-DCB813.81660.46726.18
Land Use (LU)m2a crop eq124.57130.34127.86
Terrestrial Acidification (TA)kg SO2 eq2.501.982.20

References

  1. Syed, L. Smart Agriculture Using Ensemble Machine Learning Techniques in IoT Environment. Procedia Comput. Sci. 2024, 235, 2269–2278. [Google Scholar] [CrossRef]
  2. Feng, Y.; Cheng, J.; Deng, Y. Study on Agricultural Water Resource Utilization Efficiency under the Constraint of Carbon Emission and Water Pollution. Environ. Res. 2024, 253, 119142. [Google Scholar] [CrossRef]
  3. Crippa, M.; Solazzo, E.; Guizzardi, D.; Monforti-Ferrario, F.; Tubiello, F.N.; Leip, A. Food Systems Are Responsible for a Third of Global Anthropogenic GHG Emissions. Nat. Food 2021, 2, 198–209. [Google Scholar] [CrossRef] [PubMed]
  4. Pascucci, S. Building Natural Resource Networks: Urban Agriculture and the Circular Economy. In Achieving Sustainable Urban Agriculture; Burleigh Dodds Science Publishing: Sawston, UK, 2020; pp. 101–120. [Google Scholar]
  5. Kaufmann, L.; Mayer, A.; Matej, S.; Kalt, G.; Lauk, C.; Theurl, M.C.; Erb, K.-H. Regional Self-Sufficiency: A Multi-Dimensional Analysis Relating Agricultural Production and Consumption in the European Union. Sustain. Prod. Consum. 2022, 34, 12–25. [Google Scholar] [CrossRef]
  6. He, Q.; Liu, D.L.; Wang, B.; Wang, Z.; Cowie, A.; Simmons, A.; Xu, Z.; Li, L.; Shi, Y.; Liu, K.; et al. A Food-Energy-Water-Carbon Nexus Framework Informs Region-Specific Optimal Strategies for Agricultural Sustainability. Resour. Conserv. Recycl. 2024, 203, 107428. [Google Scholar] [CrossRef]
  7. Malhi, G.S.; Kaur, M.; Kaushik, P. Impact of Climate Change on Agriculture and Its Mitigation Strategies: A Review. Sustainability 2021, 13, 1318. [Google Scholar] [CrossRef]
  8. Xu, Y.; Li, J.; Li, H.; Yang, S.; Jiang, Q.; Sui, P.; Gao, W.; Cui, J.; Chen, Y. The Water-Food-Energy Nexus Evaluation and Optimization of Cropping System in the North China Plain: A Case of County Scale. J. Clean. Prod. 2024, 443, 141200. [Google Scholar] [CrossRef]
  9. Alexandratos, N.; Bruinsma, J. World Agriculture Towards 2030/2050: The 2012 Revision; FAO: Rome, Italy, 2012. [Google Scholar]
  10. Canicattì, M.; Vallone, M. Drones in Vegetable Crops: A Systematic Literature Review. Smart Agric. Technol. 2024, 7, 100396. [Google Scholar] [CrossRef]
  11. Wang, J.; Azam, W. Natural Resource Scarcity, Fossil Fuel Energy Consumption, and Total Greenhouse Gas Emissions in Top Emitting Countries. Geosci. Front. 2024, 15, 101757. [Google Scholar] [CrossRef]
  12. United Nations. The 17 Sustainable Development Goals. Available online: https://Sdgs.Un.Org/Goals (accessed on 4 August 2025).
  13. Barbosa, M.W. Government Support Mechanisms for Sustainable Agriculture: A Systematic Literature Review and Future Research Agenda. Sustainability 2024, 16, 2185. [Google Scholar] [CrossRef]
  14. Bux, C.; Lombardi, M.; Varese, E.; Amicarelli, V. Economic and Environmental Assessment of Conventional versus Organic Durum Wheat Production in Southern Italy. Sustainability 2022, 14, 9143. [Google Scholar] [CrossRef]
  15. FAO. Food Wastage Footprint: Impacts on Natural Resources—Summary Report; FAO: Rome, Italy, 2013; ISBN 9789251077528. [Google Scholar]
  16. Jadischke, R.; Lubitz, W.D. Current State of Greenhouse Waste Biomass Disposal Methods, with a Focus on Essex County Ontario. Sustainability 2025, 17, 1476. [Google Scholar] [CrossRef]
  17. Mujtaba, M.; Fernandes Fraceto, L.; Fazeli, M.; Mukherjee, S.; Savassa, S.M.; Araujo de Medeiros, G.; do Espírito Santo Pereira, A.; Mancini, S.D.; Lipponen, J.; Vilaplana, F. Lignocellulosic Biomass from Agricultural Waste to the Circular Economy: A Review with Focus on Biofuels, Biocomposites and Bioplastics. J. Clean. Prod. 2023, 402, 136815. [Google Scholar] [CrossRef]
  18. Ufitikirezi, J.d.D.M.; Filip, M.; Ghorbani, M.; Zoubek, T.; Olšan, P.; Bumbálek, R.; Strob, M.; Bartoš, P.; Umurungi, S.N.; Murindangabo, Y.T.; et al. Agricultural Waste Valorization: Exploring Environmentally Friendly Approaches to Bioenergy Conversion. Sustainability 2024, 16, 3617. [Google Scholar] [CrossRef]
  19. Koumpakis, D.-A.; Vlachokostas, C.; Tsakirakis, A.; Petridis, S. Evaluating Plastic Waste Management Strategies: Logistic Regression Insights on Pyrolysis vs. Recycling. Recycling 2025, 10, 33. [Google Scholar] [CrossRef]
  20. De Jesus, A.; Aguiar Borges, L. Pathways for Cleaner, Greener, Healthier Cities: What Is the Role of Urban Agriculture in the Circular Economy of Two Nordic Cities? Sustainability 2024, 16, 1258. [Google Scholar] [CrossRef]
  21. Kim, S.; Dale, B.E. Global Potential Bioethanol Production from Wasted Crops and Crop Residues. Biomass Bioenergy 2004, 26, 361–375. [Google Scholar] [CrossRef]
  22. Zhang, X.X.; Ma, F.; Wang, L. Application of Life Cycle Assessment in Agricultural Circular Economy. Appl. Mech. Mater. 2012, 260–261, 1086–1091. [Google Scholar] [CrossRef]
  23. van der Werf, H.M.G.; Knudsen, M.T.; Cederberg, C. Towards Better Representation of Organic Agriculture in Life Cycle Assessment. Nat. Sustain. 2020, 3, 419–425. [Google Scholar] [CrossRef]
  24. Sala, S.; Amadei, A.M.; Beylot, A.; Ardente, F. The Evolution of Life Cycle Assessment in European Policies over Three Decades. Int. J. Life Cycle Assess. 2021, 26, 2295–2314. [Google Scholar] [CrossRef]
  25. Del Borghi, A.; Moreschi, L.; Gallo, M. Life Cycle Assessment in the Food Industry. In The Interaction of Food Industry and Environment; Elsevier: Amsterdam, The Netherlands, 2020; pp. 63–118. [Google Scholar]
  26. Esteve-Llorens, X.; Ita-Nagy, D.; Parodi, E.; González-García, S.; Moreira, M.T.; Feijoo, G.; Vázquez-Rowe, I. Environmental Footprint of Critical Agro-Export Products in the Peruvian Hyper-Arid Coast: A Case Study for Green Asparagus and Avocado. Sci. Total Environ. 2022, 818, 151686. [Google Scholar] [CrossRef]
  27. Liu, X.; Kwon, H.; Northrup, D.; Wang, M. Shifting Agricultural Practices to Produce Sustainable, Low Carbon Intensity Feedstocks for Biofuel Production. Environ. Res. Lett. 2020, 15, 084014. [Google Scholar] [CrossRef]
  28. Puma-Flores, M.; Rosa-Díaz, I.M. Promoting Sustainable Agri-Food Systems through Sustainability and Responsible Marketing: The Case of Peruvian Companies at International Trade Shows. J. Clean. Prod. 2024, 448, 141568. [Google Scholar] [CrossRef]
  29. Ostfeld, R.; Reiner, D.M. Seeing the Forest through the Palms: Developments in Environmentally Sustainable Palm Oil Production and Zero-Deforestation Efforts. Front. Sustain. Food Syst. 2024, 8, 1398877. [Google Scholar] [CrossRef]
  30. Arroyo-Lambaer, D.; Zambrano, L.; Rivas, M.I.; Vázquez-Mendoza, D.L.; Figueroa, F.; Puente-Uribe, M.B.; Espinosa-García, A.C.; Tapia-Palacios, M.A.; Mazari-Hiriart, M.; Revollo-Fernández, D.; et al. Identifying Urban Agriculture Needs and Challenges for the Implementation of Green Labeling in Xochimilco, Mexico. Front. Sustain. Cities 2022, 4, 892341. [Google Scholar] [CrossRef]
  31. Rezazga, A.; Ruiz, C.; Montanaro, G.; Falcone, G.; Koubouris, G. Driving the Ecological Transition of Agriculture through Voluntary Certification of Environmental Impacts: An Exploratory Literature Review on the Olive-Oil Sector. Sustainability 2024, 16, 1227. [Google Scholar] [CrossRef]
  32. De Vries, J.W.; Groenestein, C.M.; De Boer, I.J.M. Environmental Consequences of Processing Manure to Produce Mineral Fertilizer and Bio-Energy. J. Environ. Manag. 2012, 102, 173–183. [Google Scholar] [CrossRef]
  33. Fnais, A.; Rezgui, Y.; Petri, I.; Beach, T.; Yeung, J.; Ghoroghi, A.; Kubicki, S. The Application of Life Cycle Assessment in Buildings: Challenges, and Directions for Future Research. Int. J. Life Cycle Assess. 2022, 27, 627–654. [Google Scholar] [CrossRef]
  34. Koidis, C.; Tsampoulatidis, I.; Achillas, C.; Aidonis, D.; Bantsos, A. Real-Time LCA Tool for the Assessment of Environmental Impacts in Industrial Production. In Proceedings of the 6th Experiment at International Conference, Évora, Portugal, 5–7 June 2023; Institute of Electrical and Electronics Engineers Inc.: New York, NY, USA, 2023; pp. 217–221. [Google Scholar]
  35. Vyrkou, A.; Aryblia, M.; Savvakis, N.; Nicacio, I.; Siddique, O.; Arampatzis, G.; Angelis-Dimakis, A. Dynamic vs Real Time Life Cycle Assessment. Clean. Environ. Syst. 2025, 18, 100296. [Google Scholar] [CrossRef]
  36. Domínguez, J.; Rodríguez-Martínez, A.; Romero, R.J.; Herrera, I.; Domínguez-Patiño, J.; Rodríguez Martínez, A.; Javier Romero, R.; Herrera Orozco, I. Life Cycle Assessment on Real Time in a Coffee Machine. Artic. J. Chem. Chem. Eng. 2014, 8, 1142–1149. Available online: https://www.researchgate.net/publication/317358955_Life_Cycle_Assessment_on_Real_Time_in_a_Coffee_Machine (accessed on 3 September 2025).
  37. Hagen, J.; Büth, L.; Haupt, J.; Cerdas, F.; Herrmann, C. Live LCA in Learning Factories: Real Time Assessment of Product Life Cycles Environmental Impacts. Procedia Manuf. 2020, 45, 128–133. [Google Scholar] [CrossRef]
  38. Boje, C.; Marvuglia, A.; José Hahn Menacho, Á.; Hermen, J.; Kubicki, S.; Guerriero, A.; Navarrete, T.; Benetto, E. A Pilot Using a Building Digital Twin for LCA-Based Human Health Monitoring. In Proceedings of the Conference CIB W78, Luxembourg, 11–15 October 2021. [Google Scholar]
  39. Ferrari, A.M.; Volpi, L.; Settembre-Blundo, D.; García-Muiña, F.E. Dynamic Life Cycle Assessment (LCA) Integrating Life Cycle Inventory (LCI) and Enterprise Resource Planning (ERP) in an Industry 4.0 Environment. J. Clean. Prod. 2021, 286, 125314. [Google Scholar] [CrossRef]
  40. Piron, M.; Bovo, E.; Lucchetta, G.; Manzardo, A. Soft-Sensors to Drive Manufacturing toward Clean Production: LCA Based on Digital Twin. J. Clean. Prod. 2025, 498, 145192. [Google Scholar] [CrossRef]
  41. Herrmann, I.T.; Moltesen, A. Does It Matter Which Life Cycle Assessment (LCA) Tool You Choose?—A Comparative Assessment of SimaPro and GaBi. J. Clean. Prod. 2015, 86, 163–169. [Google Scholar] [CrossRef]
  42. Iswara, A.P.; Farahdiba, A.U.; Nadhifatin, E.N.; Pirade, F.; Andhikaputra, G.; Muflihah, I.; Boedisantoso, R. A Comparative Study of Life Cycle Impact Assessment Using Different Software Programs. In Proceedings of the IOP Conference Series: Earth and Environmental Science, Surabaya City, Indonesia, 1–2 October 2019; Institute of Physics Publishing: Bristol, UK, 2020; Volume 506. [Google Scholar]
  43. Levasseur, A.; Lesage, P.; Margni, M.; Deschênes, L.; Samson, R. Considering Time in LCA: Dynamic LCA and Its Application to Global Warming Impact Assessments. Environ. Sci. Technol. 2010, 44, 3169–3174. [Google Scholar] [CrossRef]
  44. FARMBENV—Real-Time Agriculture Sustainability Assessment Tool. Available online: https://farmbenv.gr/language/en/home/ (accessed on 4 August 2025).
  45. Savva, C.; Vlachokostas, C.; Mertzanakis, C.; Michailidou, A.; Kalaitzidis, A.; Koidis, C.; Bantsos, A. Life Cycle Assessment Towards Efficient and Eco-Friendly Supply Chain Management in the Agrifood Sector. In Olympus International Conference on Supply Chains; Communications in Computer and Information Science; Springer: Cham, Switzerland, 2025; Volume 2111, pp. 3–13. [Google Scholar] [CrossRef]
  46. Cappelli, A.; Cini, E. Challenges and Opportunities in Wheat Flour, Pasta, Bread, and Bakery Product Production Chains: A Systematic Review of Innovations and Improvement Strategies to Increase Sustainability, Productivity, and Product Quality. Sustainability 2021, 13, 2608. [Google Scholar] [CrossRef]
  47. Khatri-Chhetri, A.; Sapkota, T.B.; Maharjan, S.; Cheerakkollil Konath, N.; Shirsath, P. Agricultural Emissions Reduction Potential by Improving Technical Efficiency in Crop Production. Agric. Syst. 2023, 207, 103620. [Google Scholar] [CrossRef]
  48. Ghasemi-Mobtaker, H.; Kaab, A.; Rafiee, S. Application of Life Cycle Analysis to Assess Environmental Sustainability of Wheat Cultivation in the West of Iran. Energy 2020, 193, 116768. [Google Scholar] [CrossRef]
  49. Hou, L.; Yang, Y.; Zhang, X.; Jiang, C. Carbon Footprint for Wheat and Maize Production Modulated by Farm Size: A Study in the North China Plain. Int. J. Clim. Change Strateg. Manag. 2021, 13, 302–319. [Google Scholar] [CrossRef]
  50. Ghasemi-Mobtaker, H.; Kaab, A.; Rafiee, S.; Nabavi-Pelesaraei, A. A Comparative of Modeling Techniques and Life Cycle Assessment for Prediction of Output Energy, Economic Profit, and Global Warming Potential for Wheat Farms. Energy Rep. 2022, 8, 4922–4934. [Google Scholar] [CrossRef]
  51. Rafiee, M.; Abbaspour-Fard, M.H.; Heidari, A. Analyzing Sustainability in Bread Production: A Life Cycle Assessment Approach to Energy, Exergy and Environmental Footprint. Environ. Sci. Pollut. Res. 2024, 31, 46949–46964. [Google Scholar] [CrossRef] [PubMed]
  52. Hashimi, R.; Matsuura, E.; Komatsuzaki, M. Effects of Cultivating Rice and Wheat with and without Organic Fertilizer Application on Greenhouse Gas Emissions and Soil Quality in Khost, Afghanistan. Sustainability 2020, 12, 6508. [Google Scholar] [CrossRef]
  53. Zhang, L.; Zhang, W.; Cui, Z.; Hu, Y.; Schmidhalter, U.; Chen, X. Environmental, Human Health, and Ecosystem Economic Performance of Long-Term Optimizing Nitrogen Management for Wheat Production. J. Clean. Prod. 2021, 311, 127620. [Google Scholar] [CrossRef]
  54. Mohammadi, A.; Venkatesh, G.; Eskandari, S.; Rafiee, S. Eco-Efficiency Analysis to Improve Environmental Performance of Wheat Production. Agriculture 2022, 12, 1031. [Google Scholar] [CrossRef]
  55. Jiang, Z.; Zheng, H.; Xing, B. Environmental Life Cycle Assessment of Wheat Production Using Chemical Fertilizer, Manure Compost, and Biochar-Amended Manure Compost Strategies. Sci. Total Environ. 2021, 760, 143342. [Google Scholar] [CrossRef] [PubMed]
  56. Kazlauskas, M.; Bručienė, I.; Savickas, D.; Naujokienė, V.; Buragienė, S.; Steponavičius, D.; Romaneckas, K.; Šarauskis, E. Life Cycle Assessment of Winter Wheat Production Using Precision and Conventional Seeding Technologies. Sustainability 2023, 15, 14376. [Google Scholar] [CrossRef]
  57. Martin, T.M.P.; Aubin, J.; Gilles, E.; Auberger, J.; Esculier, F.; Levavasseur, F.; McConville, J.; Houot, S. Comparative Study of Environmental Impacts Related to Wheat Production with Human-Urine Based Fertilizers versus Mineral Fertilizers. J. Clean. Prod. 2023, 382, 135123. [Google Scholar] [CrossRef]
  58. Bandh Fayaz, S.A.; Malla Editors, A. Waste Management in the Circular Economy; Springer: Berlin/Heidelberg, Germany, 2023. [Google Scholar]
  59. Zhang, D.; Yin, W.; Chai, Q.; Fan, Z.; Hu, F.; Zhao, L.; Fan, H.; He, W.; Cao, W. Enhancing Crop Production and Carbon Sequestration of Wheat in Arid Areas by Green Manure with Reduced Nitrogen Fertilizer. J. Environ. Manag. 2024, 365, 121571. [Google Scholar] [CrossRef]
  60. Zhou, G.; Fan, K.; Gao, S.; Chang, D.; Li, G.; Liang, T.; Liang, H.; Li, S.; Zhang, J.; Che, Z.; et al. Green Manuring Relocates Microbiomes in Driving the Soil Functionality of Nitrogen Cycling to Obtain Preferable Grain Yields in Thirty Years. Sci. China Life Sci. 2024, 67, 596–610. [Google Scholar] [CrossRef] [PubMed]
  61. Qiu, W.; Bao, M.; Yang, W.; Song, Q.; He, H.; Ma, X.; Wang, Z. Soil Surface Management of Legume Cover Has the Potential to Mitigate Nitrous Oxide Emissions from the Fallow Season during Wheat Production. Sci. Total Environ. 2022, 820, 153352. [Google Scholar] [CrossRef]
  62. Weiner, M.; Moakes, S.; Raya-Sereno, M.D.; Cooper, J. Legume-Based Crop Rotations as a Strategy to Mitigate Fluctuations in Fertilizer Prices? A Case Study on Bread Wheat Genotypes in Northern Spain Using Life Cycle and Economic Assessment. Eur. J. Agron. 2024, 159, 127267. [Google Scholar] [CrossRef]
  63. Falcone, G.; Stillitano, T.; Montemurro, F.; De Luca, A.I.; Gulisano, G.; Strano, A. Environmental and Economic Assessment of Sustainability in Mediterranean Wheat Production. Agron. Res. 2019, 17, 60–76. [Google Scholar] [CrossRef]
  64. ISO 14044; Environmental Management-Life Cycle Assessment-Requirements and Guidelines Management Environnemental-Analyse Du Cycle de Vie-Exigences et Lignes Directrices. ISO: Geneva, Switzerland, 2006.
  65. ISO 14040; Environmental Management-Life Cycle Assessment-Principles and Framework Management Environemental-Analyse Du Cycle de Vie-Principes et Cadre. ISO: Geneva, Switzerland, 2006.
  66. Wang, C.; Chang, Y.; Zhang, L.; Pang, M.; Hao, Y. A Life-Cycle Comparison of the Energy, Environmental and Economic Impacts of Coal versus Wood Pellets for Generating Heat in China. Energy 2017, 120, 374–384. [Google Scholar] [CrossRef]
  67. Tomos, B.A.D.; Stamford, L.; Welfle, A.; Larkin, A. Decarbonising International Shipping—A Life Cycle Perspective on Alternative Fuel Options. Energy Convers. Manag. 2024, 299, 117848. [Google Scholar] [CrossRef]
  68. Bankar, S.B.; Survase, S.A.; Ojamo, H.; Granström, T. Biobutanol: The Outlook of an Academic and Industrialist. RSC Adv. 2013, 3, 24734. [Google Scholar] [CrossRef]
  69. Daystar, J.; Reeb, C.; Gonzalez, R.; Venditti, R.; Kelley, S.S. Environmental Life Cycle Impacts of Cellulosic Ethanol in the Southern U.S. Produced from Loblolly Pine, Eucalyptus, Unmanaged Hardwoods, Forest Residues, and Switchgrass Using a Thermochemical Conversion Pathway. Fuel Process. Technol. 2015, 138, 164–174. [Google Scholar] [CrossRef]
  70. Zincir, B.A.; Arslanoglu, Y. Comparative Life Cycle Assessment of Alternative Marine Fuels. Fuel 2024, 358, 129995. [Google Scholar] [CrossRef]
  71. European Commission; Joint Research Centre; Institute for Environment and Sustainability. International Reference Life Cycle Data System (ILCD) Handbook General Guide for Life Cycle Assessment: Detailed Guidance; Publications Office: Luxembourg, 2010; ISBN 9789279190926. [Google Scholar]
  72. ISO/TS 14048:2002; Environmental Management—Life Cycle Assessment—Data Documentation Format. International Organization for Standardization: Geneva, Switzerland, 2002.
  73. EN 15804:2012+A2:2019; Sustainability of Construction Works—Environmental Product Declarations—Core Rules for the Product Category of Construction Products. European Committee for Standardization (CEN): Brussels, Belgium, 2019.
  74. European Comission European Platform on LCA|EPLCA. Available online: https://eplca.jrc.ec.europa.eu/LCDN/contactListEF.html (accessed on 7 July 2025).
Figure 1. Schematic representation of waste-to-energy pathways.
Sustainability 17 08106 g001
Figure 2. Applied methodology to achieve the goals of this study.
Sustainability 17 08106 g002
Figure 3. Relative comparison between the wheat production scenarios.
Sustainability 17 08106 g003
Figure 4. Effect of the electricity source on the total environmental impacts for wheat production scenarios.
Sustainability 17 08106 g004
Figure 5. Integration of wheat production Scenario 2, using electricity provided from the Greek electricity mix and WtE-1 pathway, using electricity produced by photovoltaics.
Sustainability 17 08106 g005
Figure 6. Integration of wheat production Scenario 2, using electricity provided by the Greek electricity mix and WtE-1 pathway, using electricity produced by wind turbines.
Sustainability 17 08106 g006
Table 1. Process included in each module (common group processes among the scenarios).
ModuleRequired Process (Ecoinvent Name)AmountUnit
Module 1: Initial wheat sowing Application of plant protection product, by field sprayer3.03ha
Harvesting, by complete harvester, ground crops0.13ha
Market for wheat seed, for sowing10kg
NPK (15-15-15) fertilizer production38.4kg
Market for pesticide0.2kg
Module 2: Initial vetch sowingTillage, harrowing by offset disk harrow0.13ha
Sowing0.11ha
Tillage, rolling0.05ha
Tillage, plowing0.07ha
Harvesting, by complete harvester, ground corps0.01ha
Rye seed production, organic for sowing8kg
Module 3: Wheat sowing after vetchTillage, cultivating, chiseling0.05ha
Tillage, rotary cultivator0.12ha
Sowing0.26ha
Market for electricity, low voltage80kWh
Module 4: Wheat sowing after wheatTillage, rolling0.78ha
Tillage, plowing0.08ha
Tillage, subsoiling, by subsoiler plow0.15ha
Tillage, rotary cultivator0.12ha
Sowing0.22ha
Market for electricity, low voltage60kWh
Table 2. Harvest periods, produced wheat, and modules associated with each scenario.
ScenarioHarvest
Periods
Produced WheatModule 1Module 2Module 3Module 4
Scenario 11300 kg1001
Scenario 22400 kg1110
Scenario 33700 kg2111
Table 3. Results of the lab-scale experiments, adjusted to the treatment of 1 kg of wheat residues.
PathwayInputsAmountOutputsAmount
WtE-1: Pellet
Production
Wheat residues1 kgPellet366.7 g (1.47 kWh)
Water100 mL
Electricity1.33 kWh
WtE-2: Biodiesel and Pellet ProductionWheat residues1 kgBiodiesel133.33 mL (0.54 kWh)
Water2 LPellet591.7 g (2.37 kWh)
Sodium hydroxide1.5 g
Methanol33.33 mL
Electricity15.08 kWh
WtE-3: Ethanol
Production
Wheat residues1 kgEthanol 0.6 L (0.43 kWh)
Water2.5 kgCO20.375 kg
Alpha amylase0.2 g
Glucoamylase0.35 g
Yeast2.25 g
LPG0.125 kg
(1.28 kWh)
Electricity0.16 kWh
Table 4. Environmental impacts of wheat production scenarios, impacts per 1000 kg of produced wheat.
Impact CategoryUnitsScenario 1Scenario 2Scenario 3
Fossil Resource Scarcity (FRS)kg oil eq188.70146.69164.7
Freshwater Ecotoxicity (FEc)kg 1.4-DCB41.8333.6537.15
Freshwater Eutrophication (FEu)kg P eq0.380.340.36
Global Warming Potential (GWP)kg CO2 eq672.67518.99584.85
Human Carcinogenic Toxicity (HCT)kg 1.4-DCB80.9557.2967.43
Human Non-Carcinogenic Toxicity (HnCT)kg 1.4-DCB1130.85977.51043.21
Land Use (LU)m2a crop eq125.09130.86128.39
Terrestrial Acidification (TA)kg SO2 eq3.082.572.79
Table 5. Environmental impacts of waste-to-energy pathways, using electricity provided by the Greek or EU average mix.
Impact CategoryUnitsElectricity Source: Greek Electricity MixElectricity Source: EU Average Electricity Mix
WtE-1WtE-2WtE-3WtE-1WtE-2WtE-3
Fossil Resource Scarcity (FRS)kg oil eq0.133.000.15−0.021.210.14
Freshwater Ecotoxicity (FEc)kg 1.4-DCB0.091.070.010.060.680.01
Freshwater Eutrophication (FEu)kg P eq16.8 × 10−30.022 × 10−44.5 × 10−45 × 10−35.8 × 10−5
Global Warming Potential (GWP)kg CO2 eq0.389.310.47−0.044.530.41
Human Carcinogenic Toxicity (HCT)kg 1.4-DCB0.091.090.020.030.380.01
Human non-Carcinogenic Toxicity (HnCT)kg 1.4-DCB2.1024.310.270.8510.320.13
Land Use (LU)m2a crop eq3.8 × 10−30.050.030.010.180.03
Terrestrial Acidification (TA)kg SO2 eq3 × 10−30.058.4 × 10−41 × 10−30.026 × 10−4
Table 6. Environmental impacts of waste-to-energy pathways, using electricity produced by photovoltaics or wind turbines.
Impact CategoryUnitsElectricity Source: PhotovoltaicsElectricity Source: Wind Turbines
WtE-1WtE-2WtE-3WtE-1WtE-2WtE-3
Fossil Resource Scarcity (FRS)kg oil eq−0.130.01−0.02−0.15−0.23−0.04
Freshwater Ecotoxicity (FEc)kg 1.4-DCB0.040.480.057 × 10−30.090.02
Freshwater Eutrophication (FEu)kg P eq5 × 10−57 × 10−46.8 × 10−41.4 × 10−78.4 × 10−58.8 × 10⁻⁶
Global Warming Potential (GWP)kg CO2 eq−0.440.17−0.04−0.51−0.8−0.12
Human Carcinogenic Toxicity (HCT)kg 1.4-DCB8 × 10−30.140.019 × 10−30.150.01
Human non-Carcinogenic Toxicity (HnCT)kg 1.4-DCB0.324.260.44−0.020.40.04
Land Use (LU)m2a crop eq1.6 × 10−30.030.033.4 × 10−40.010.03
Terrestrial Acidification (TA)kg SO2 eq−4.1 × 10−57.8 × 10−34.6 × 10⁻⁴−4.5 × 10−42.7 × 10−3−4.4 × 10⁻⁵
Disclaimer/Publisher’s Note: The statements, opinions and data contained in all publications are solely those of the individual author(s) and contributor(s) and not of MDPI and/or the editor(s). MDPI and/or the editor(s) disclaim responsibility for any injury to people or property resulting from any ideas, methods, instructions or products referred to in the content.