Article

Estimating the Niche Breadth of Tomicus piniperda L. on Breeding Material: A Statistical Approach

by
Andrzej Borkowski
Department of Environmental Biology, Jan Kochanowski University, Uniwersytecka 7 Str., 25-406 Kielce, Poland
Sustainability 2025, 17(17), 7744; https://doi.org/10.3390/su17177744
Submission received: 21 July 2025 / Revised: 22 August 2025 / Accepted: 26 August 2025 / Published: 28 August 2025

Abstract

Progressive climate change has increased the emergence of bark beetle outbreaks, which justifies the need for in-depth research into their response to climatic factors in order to improve forest resource management strategies. A measure of the adaptation of species to changing conditions is provided by the determination of the breadth of their ecological niches. This study proposes a novel, minimally invasive method to estimate the niche breadth of Tomicus piniperda, a representative species in its taxonomic group. EntomologiJcal analyses were carried out on trap trees. The niche of T. piniperda was described by means of stepwise regression, and its niche breadth was found to depend significantly on the bark thickness and gallery density on stems (p < 0.001). The constructed models explained over 80% of the variation in T. piniperda niche breadth on the stems, and the differences between the observed and predicted mean niche breadth were not significant (p > 0.05), with the relative errors for individual trees generally not exceeding 13%. Data on the parameters of niches may be useful in evaluating the possible consequences of changes in climatic factors for organismal fitness, for example, or as a starting point for the construction of models of bark beetle population size.

1. Introduction

Climate change [1] has impacts both on the health and vitality of tree stands [2,3,4] and bark beetle populations [5]. The key aspects of the impact of climate change on the ecological niche of bark beetles can be categorised into three primary dimensions. The first is the expansion of the climatic niche: rising temperatures enhance the survival and establishment of bark beetles in previously unsuitable, cooler habitats, including higher latitudes and montane regions [6]. Warmer winters reduce the overwintering mortality of both larvae and adults beneath the bark, while an extended growing season enables the development of additional generations per year (e.g., increasing from one to two or more) [7]. The second is the broadening of the trophic niche: thermal stress and drought conditions weaken host trees, increasing their susceptibility to infestation. As a result, bark beetles are increasingly colonising tree species that were previously considered more resistant or healthy and, in some cases, exhibiting shifts in host preference [8]. The final dimension is the enhancement of ecological plasticity: bark beetles display an increasing adaptive capacity to variable environmental conditions, thereby facilitating niche expansion with respect to tolerance to fluctuating microclimatic factors, such as humidity and solar radiation [9].
A measure of the adaptation of species to changing conditions is their niche breadth [10], the quantification of which is an important area of research aimed at assessing potential competition at the local level between species with similar ecological requirements [11]. Studies of this type are best conducted on model organisms in their natural environment. These are species representative of their taxonomic group, having features that facilitate the investigation of specific biological processes [12,13].
Bark beetles have been among the most prominent model systems used in ecological research [14] and are a significant factor in tree mortality [15,16,17,18]. One of the most intensively studied, and hence best understood, forest insect species is the common pine shoot beetle, Tomicus piniperda L. A summary of the most important literature relating to this species can be found in a review article devoted to insects of the genus Tomicus [19]. It is a species with a wide geographical range [20], is strongly expansive in new locations [21,22,23], and occurs in all types of tree stands containing Scots pine (Pinus sylvestris L.) [19]. Its genome has been sequenced [24], and minimally invasive methods of determining its population density [25,26] permit research to be carried out even in strictly protected areas. According to a biological sketch of this species [14], it is a representative species for its taxonomic group and may be used as a model organism. The preliminary results of research in Sweden indicate that it is a highly valuable model species in the context of climate research. An analysis of phenological changes in T. piniperda over the last century has shown that these insects now begin flying, on average, about a month earlier [27]. Moreover, warmer temperatures are promoting increases in the population of T. piniperda by accelerating the development of new generations and increasing their number throughout the year [19,28,29].
Over the course of evolution, bark beetles have developed mechanisms that limit interspecies competition and promote niche segregation. Species colonising the same host often differ in their geographical range. These are mainly monophagous species (food specialisation) colonising different parts of the tree (spatial specialisation). They also differ in flight period (behavioural specialisation) and the degree of weakening of the trees they colonise (physiological specialisation) [14,30,31,32]. The literature on niche theory is highly developed, and key works have been presented by Sexton et al. [10] and Carscadden et al. [33]. In the former, the authors point to significant gaps in the research on niche breadth evolution, emphasising the importance of field research for acquiring mechanistic knowledge that will allow for more accurate prediction of biological responses under conditions of global environmental change. In the second paper, the authors formulate a research programme aimed at answering fundamental questions in the fields of ecology, evolution, and conservation biology. It should be emphasised that such research tasks will only be possible if a precise method for assessing the parameters of bark beetle niches on breeding material becomes available. The accurate assessment of niche breadth requires the laying out of trap trees or the use of windfalls, followed by the counting of all bark beetle galleries. This is a time-consuming and labour-intensive process, requiring the precise debarking of stems and branches and the simultaneous marking of galleries. The high costs associated with this type of analysis may be one of the reasons for the small number of studies devoted to bark beetles [34,35,36,37,38,39,40]. For this reason, in many studies, gallery density is determined on the basis of selected stem units, with the values obtained being considered representative of the entire stem. However, these methods are not based on statistical principles, which makes it impossible to estimate the error and may therefore lead to significant inaccuracies in the assessment. A significant gap in the methodologies applied in research on bark beetle breeding material was identified in a review paper devoted to representatives of the genus Tomicus (Latreille) [19]: “a reliable sampling method is still lacking, which makes quantification and detailed surveying of populations very difficult”.
Considering the facts presented, research based on breeding material using statistical tools is particularly valuable. Currently, such analyses focus primarily on models simulating bark beetle responses in the context of observed climate change [41,42] or on assessing the risk of outbreaks [43,44,45]. Since observations are best conducted in protected areas, methods for assessing niche parameters should be minimally invasive, limiting interference with the forest ecosystem.
The present work proposes a minimally invasive statistically based method for evaluating the niche breadth of T. piniperda on breeding material. It is hypothesised that there are correlations between the niche breadth of T. piniperda and parameters relating to the colonisation of stems and their features.
A review of the literature [10,33] indicates that to date, no analysis of the bark beetle niche on breeding material has been carried out with simultaneous consideration of the abiotic (bark thickness) and biotic (population density) dimensions. In theory, the niche parameter is a useful tool for estimating how observed climate change affects organisms; from a practical perspective, the niche parameter can be included in models used to estimate bark beetle population sizes. The proposed method, with analogously derived linear regression functions, may be used for the estimation of populations of other bark beetle species.

2. Materials and Methods

2.1. Climatic Conditions in the Study Area

For this study, forest stands growing in the Świętokrzyskie Mountains, located in central Poland, were selected (Figure 1A). The Świętokrzyskie Mountains are characterised by a cooler climate compared to that of its surrounding regions. The average annual temperature ranges from 6 to 7 degrees Celsius, and precipitation reaches 650–900 mm per year. Winds blow at an average speed of 2.5–4 m/s, and the windiest months are December, January, and February, when gusts of up to 10 m/s can occur. The highest rainfall is recorded in July. The number of rainy days averages between 120 and 170 per year, while frost or freezing temperatures occur for about 100 to 135 days. Snow cover persists for 50 to 90 days, reaching its maximum depth in January and February [46]. Data were collected in 2022 (Dataset D1) and 2023 (Dataset D2) from forests containing P. sylvestris in this region.

2.2. Sample Tree Dataset D1

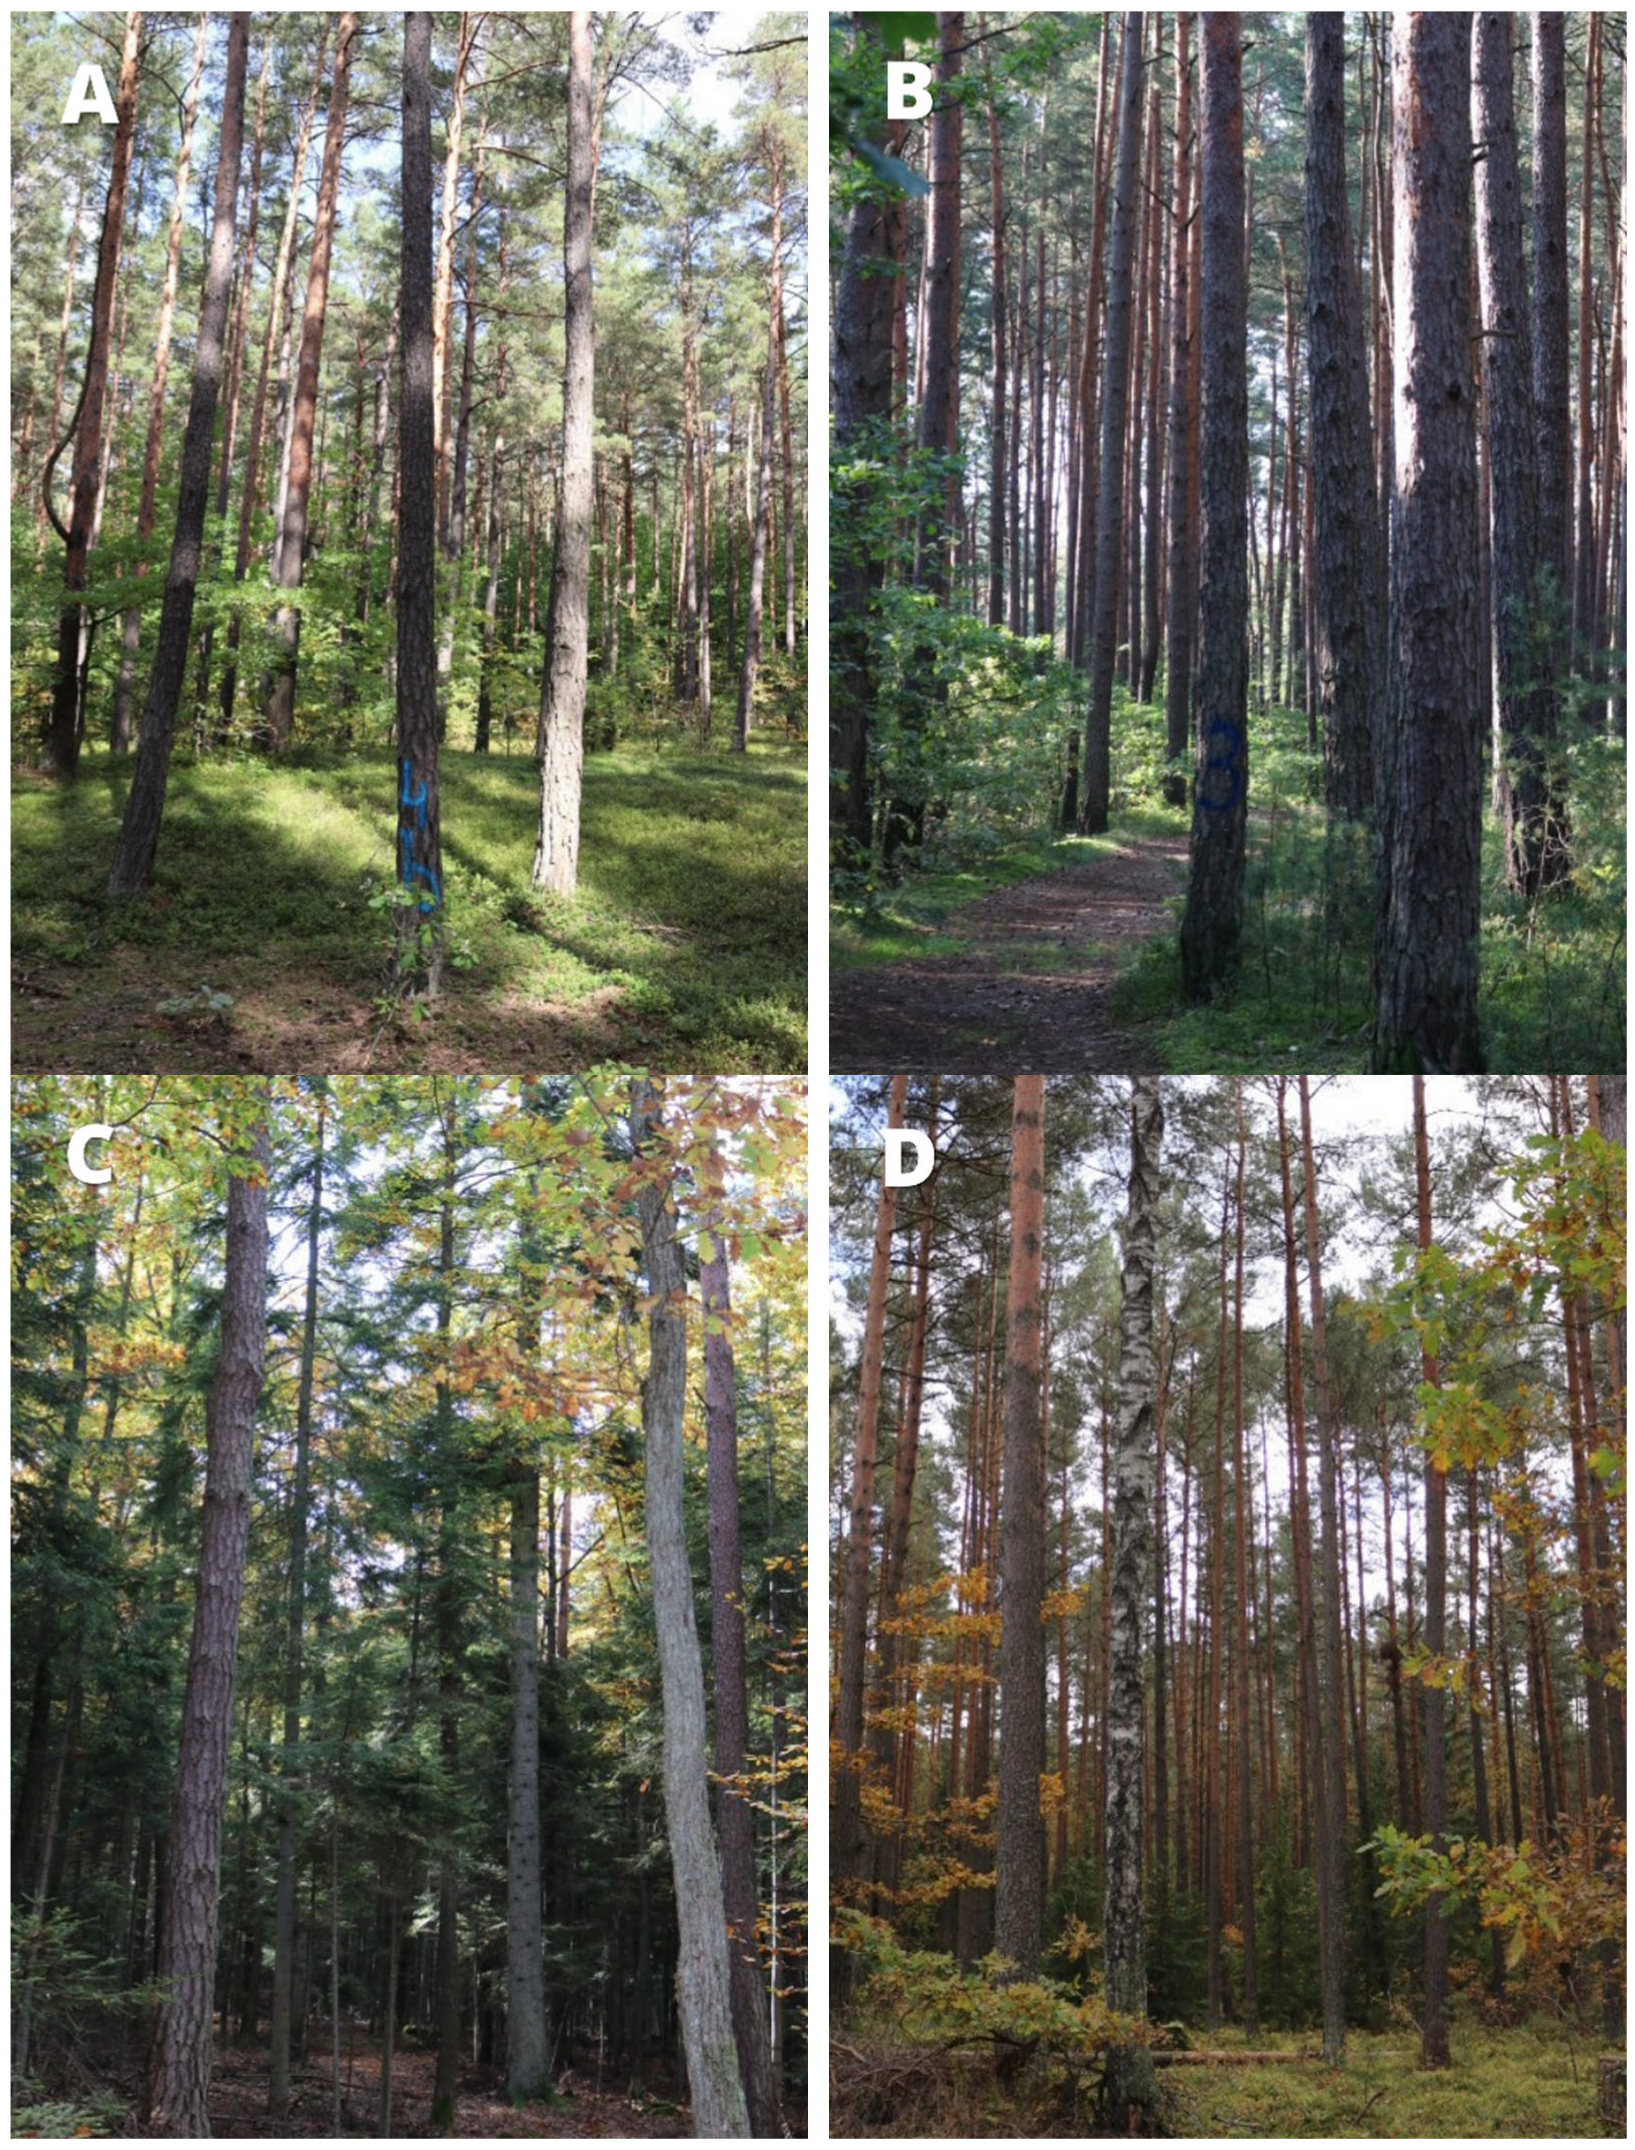
The method of data collection in the field was previously described by Borkowski [26]. Observations were conducted in the protected area of Suchedniów–Oblęgorek Landscape Park (Figure 1A). The selected pine stands, aged over 80 years, extended over a minimum distance of 2000 m. Pine monocultures were found in the subdistricts of Występa and Rejów, while mixed stands (50% to 90% pine) were observed in the subdistricts of Kruk and Wilczy Bór (Figure 2).
In selecting stands for this study, it was assumed that T. piniperda populations may be more numerous in homogeneous Scots pine stands. This may lead to increased competition among individuals competing for limited stem resources and, consequently, to the expansion of their ecological niche. In each stand, four zones were marked out at distances of 400 m (Figure 1B). In the Rejów and Występa forest subdistricts, sampling zones were established starting directly from the forest edge, whereas in the Wilczy Bór and Kruk subdistricts, the zones were delineated beginning at a distance of 400 m from the forest edge. In Rejów and Występa, the zones were located at distances of 0 m (zone 1), 400 m (zone 2), 800 m (zone 3), and 1200 m (zone 4) from the forest edge, and in Wilczy Bór and Kruk, the respective distances were 400 m (zone 1), 800 m (zone 2), 1200 m (zone 3), and 1600 m (zone 4). In each zone, a circular sample plot 50 m in diameter was marked out. Each plot was labelled with a letter code for the subdistrict in which it is located—W (Występa), R (Rejów), WB (Wilczy Bór), or K (Kruk)—and a digit (1, 2, 3, or 4) identifying the plot within its subdistrict. A full list of plots with their labels and general characteristics is presented in Table 1.
In each plot, the two healthy pines with the largest (ttc) and smallest (ttn) diameters at breast height (dbh) were selected. The stems of the selected 32 sample trees were straight and undamaged.
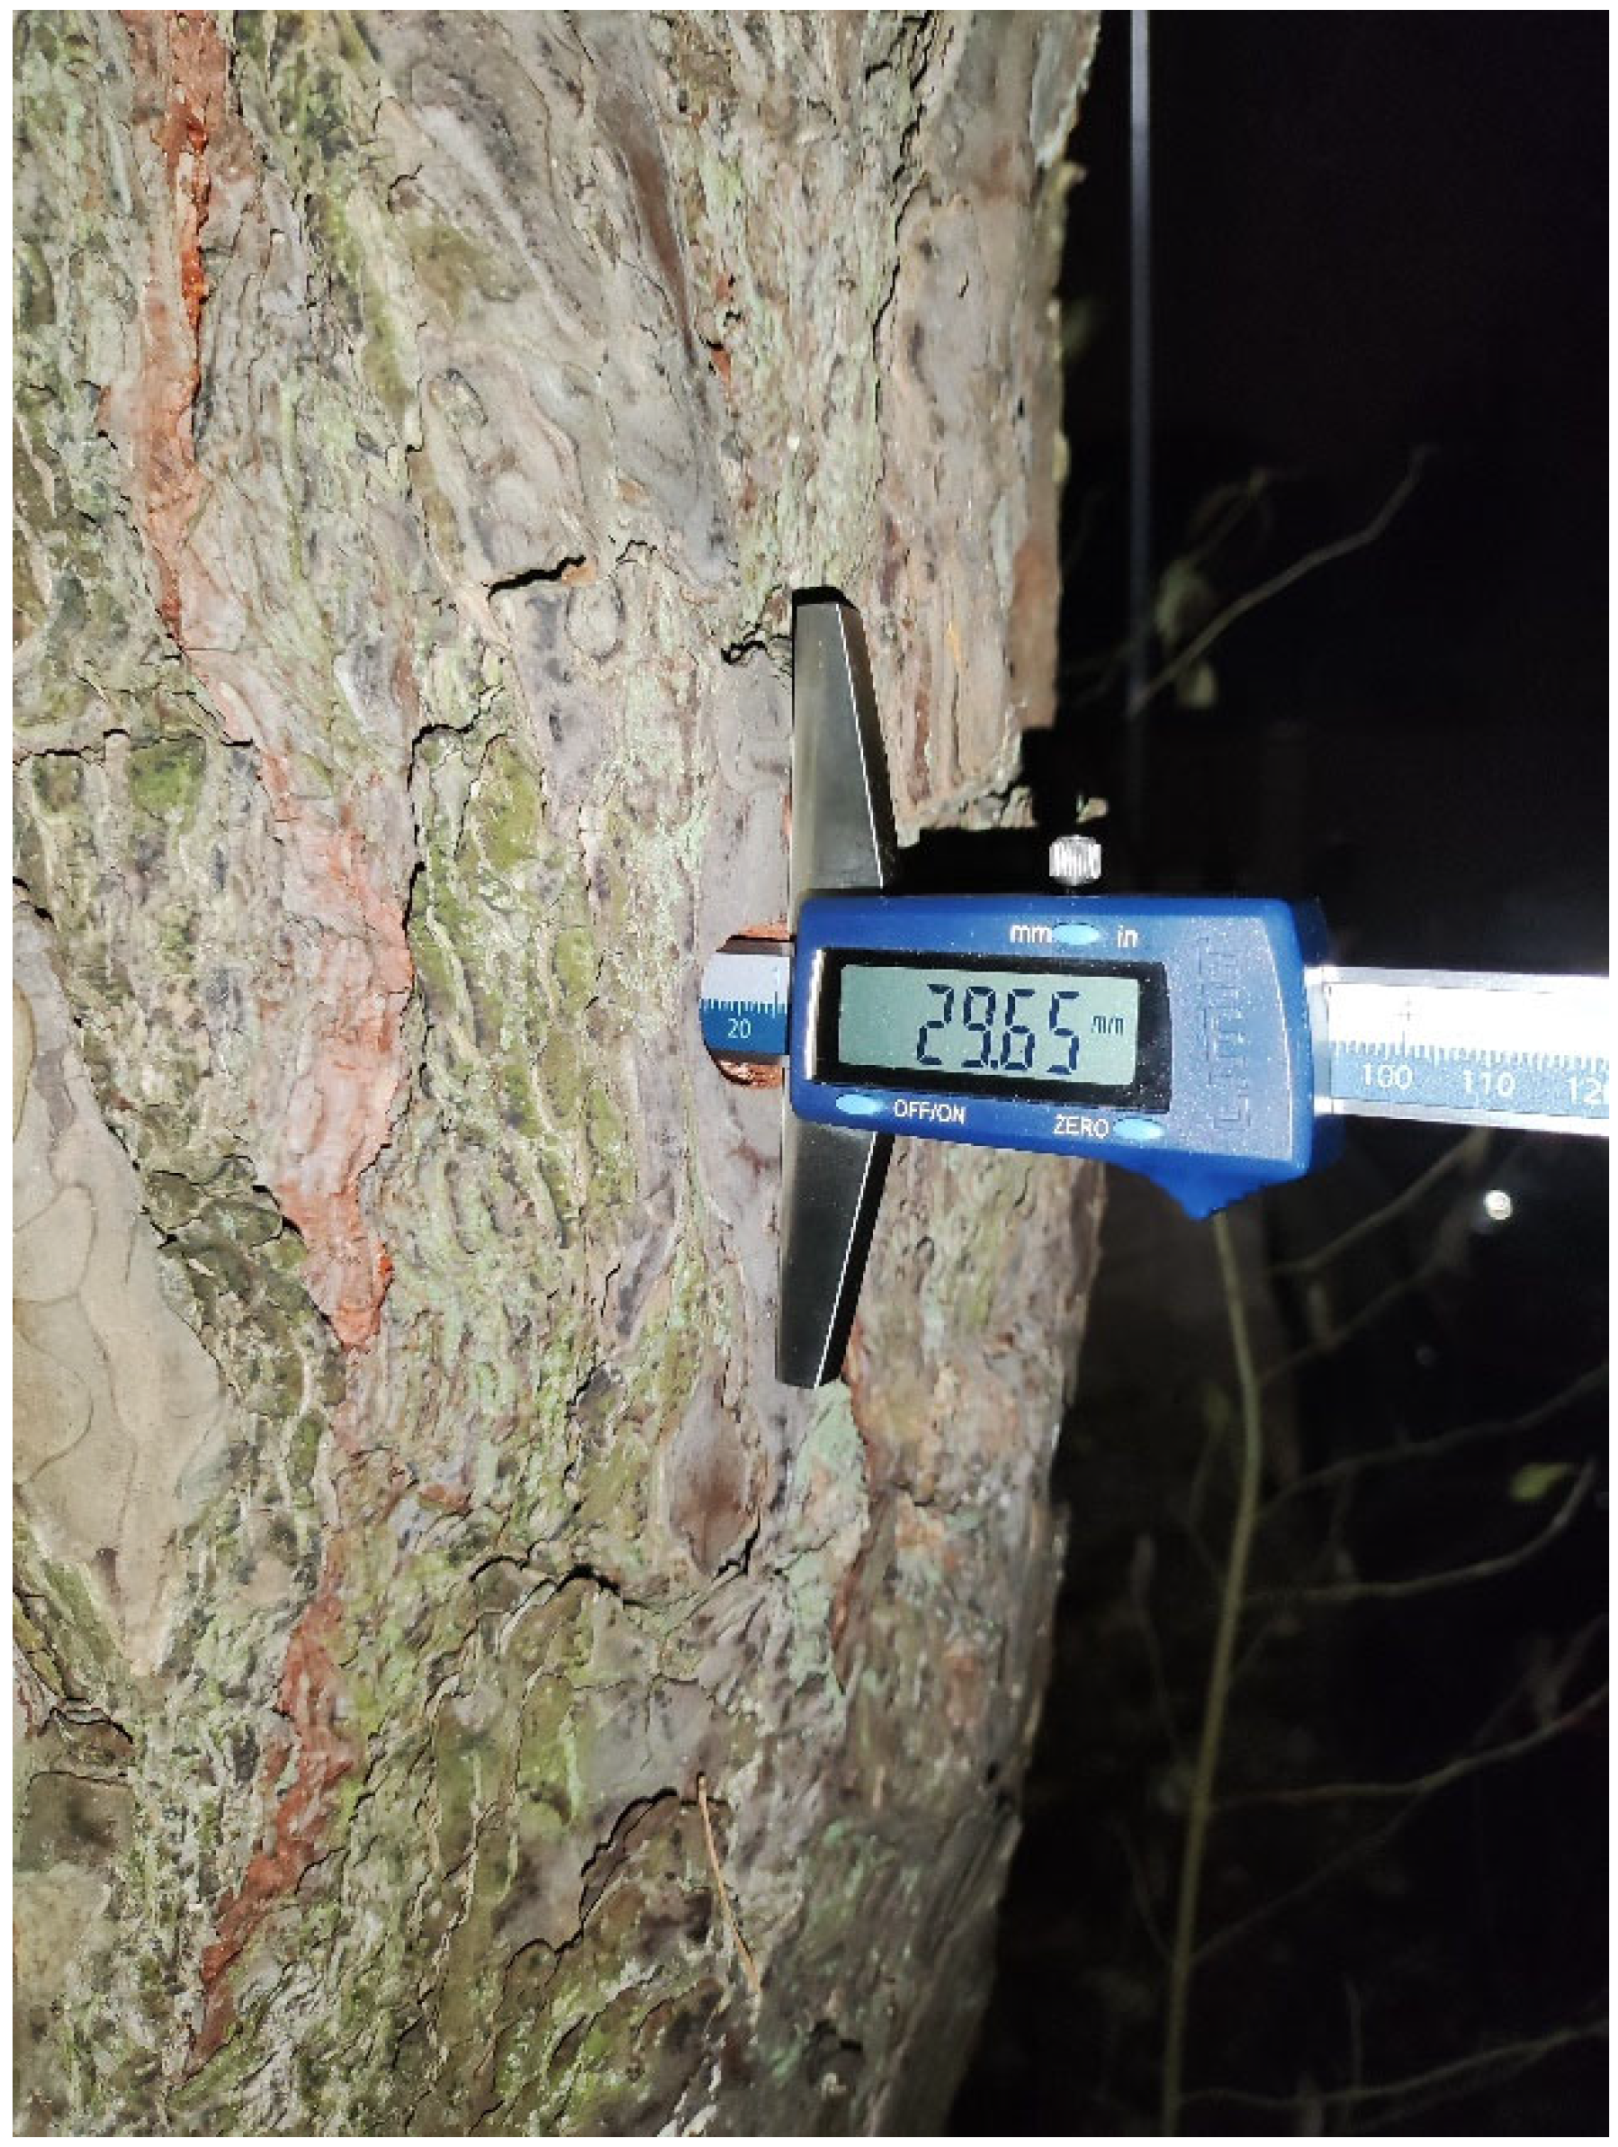
On the sample trees, the stem diameter and bark thickness at breast height were measured. To measure bark thickness, a hole was drilled in the stem using a hole cutter with a diameter of 2 cm. Following bark removal, the depth of the hole was measured (with an accuracy of 0.01 mm) using an electronic depth gauge (Figure 3).
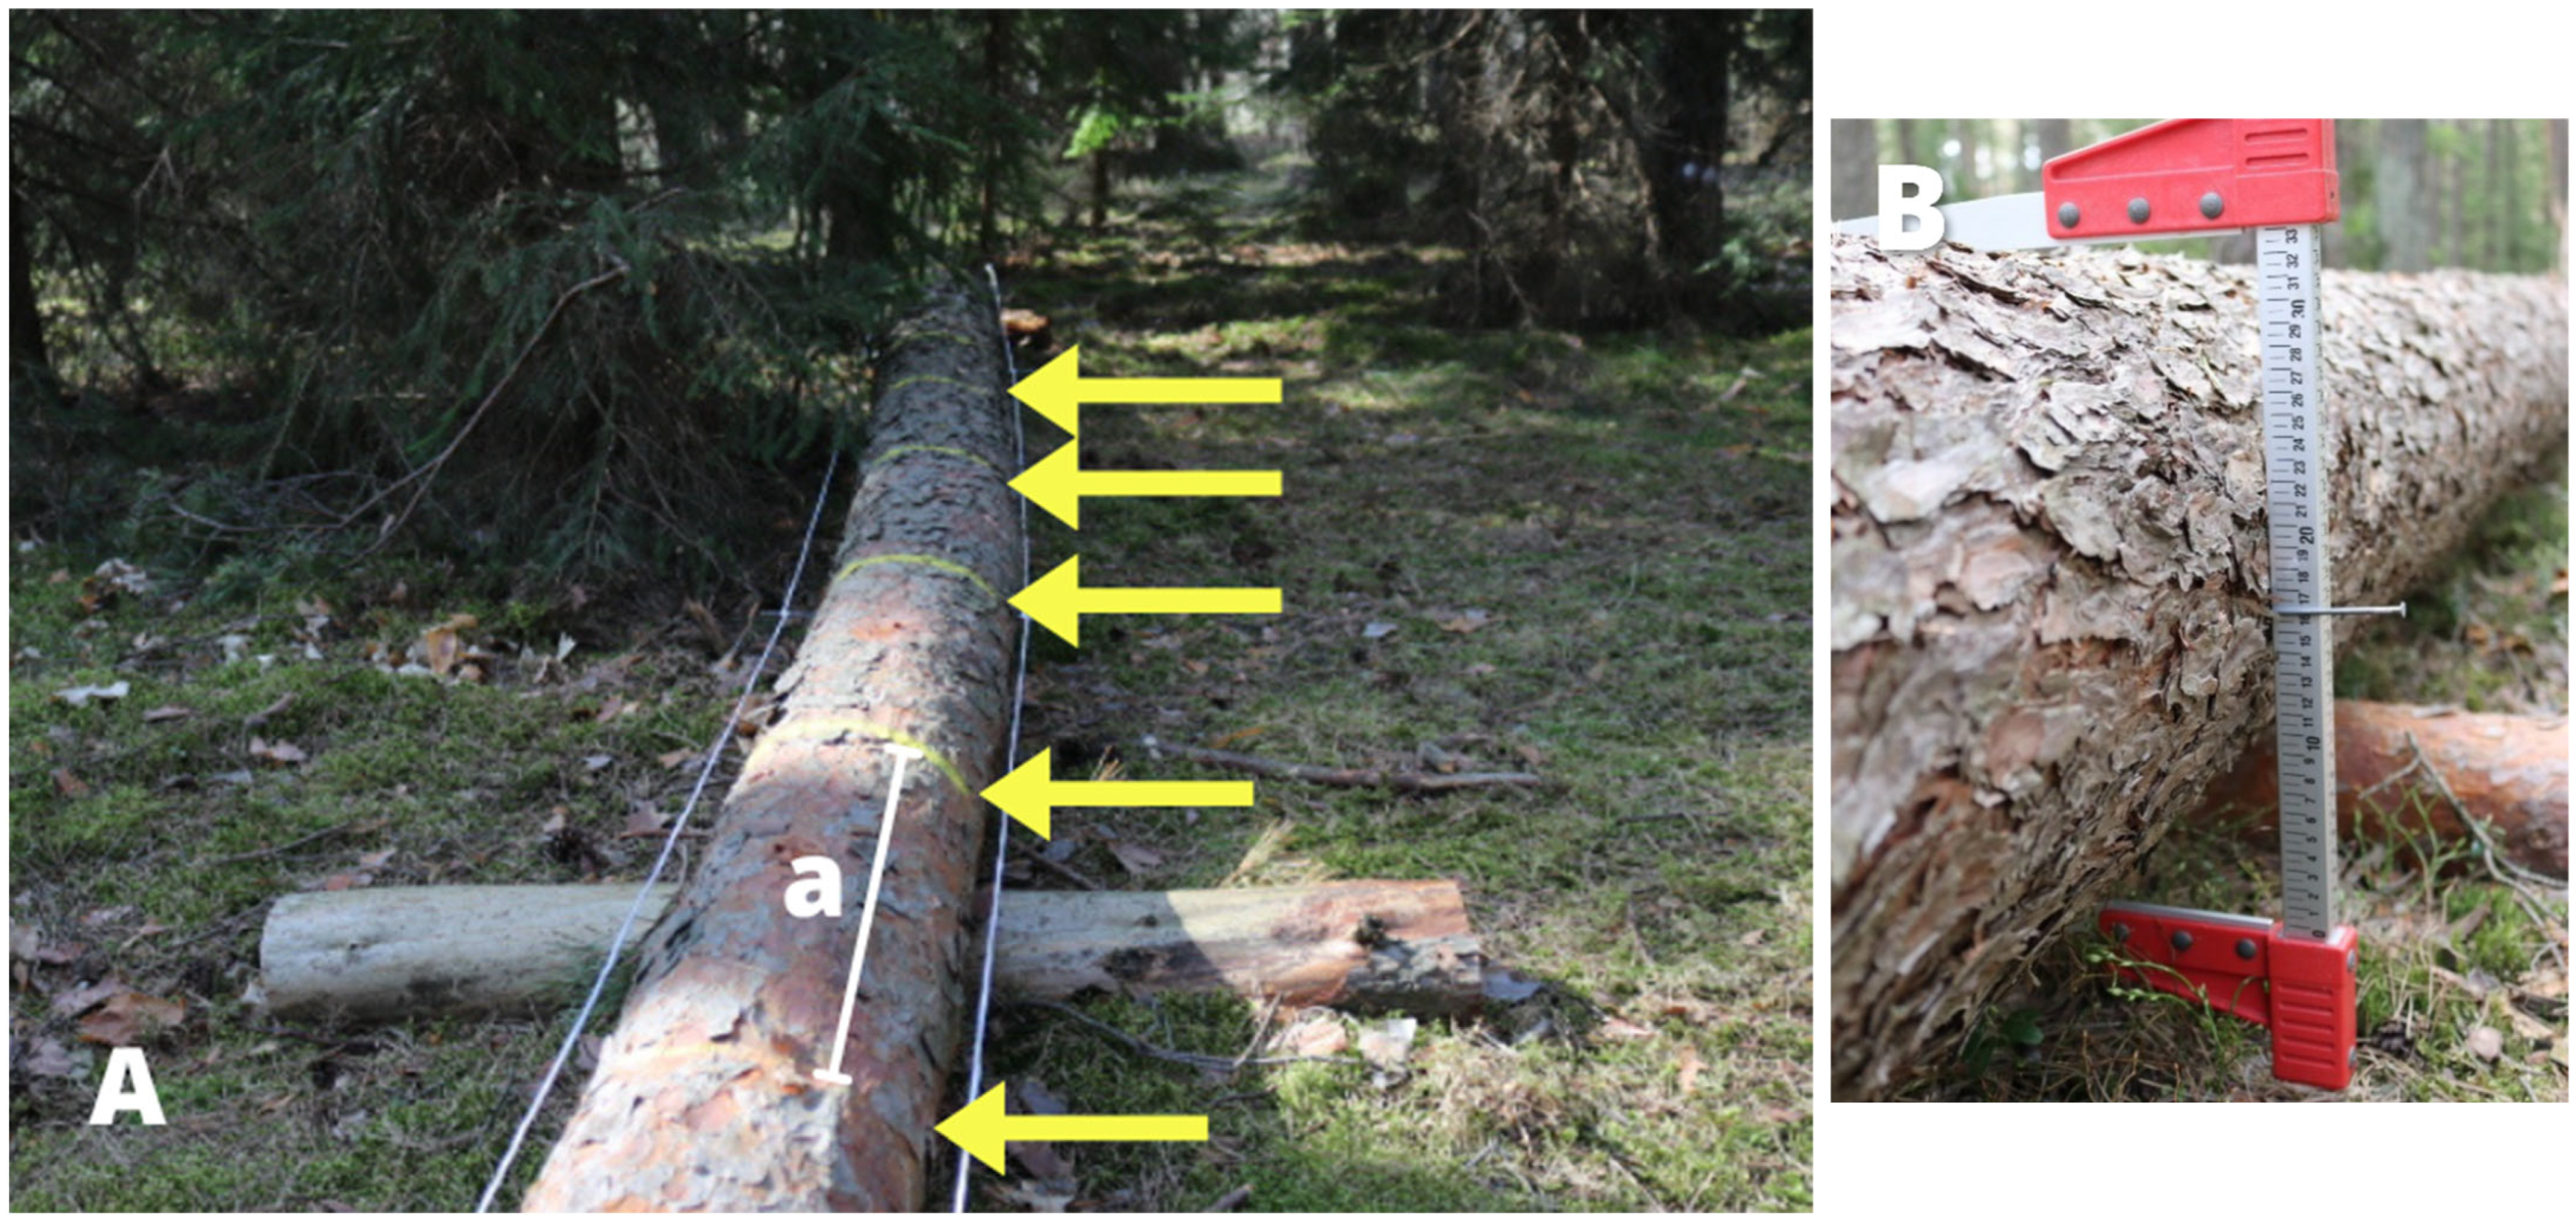
In late January and early February 2022, the trees were felled. They were then placed on supports, made from dead wood, at a height enabling insect colonisation on the entire circumference of the stems. These were trap trees used for bark beetle monitoring [47]. The stems were then divided into 2.5% units (u) (Figure 1C and Figure 4).
The following parameters were measured for each trap tree:
i.
The initial and final stem diameter;
ii.
The initial diameter of the unit stem;
iii.
The total length;
iv.
The thickness of the bark at the midpoint of each stem unit, using the same method as was used to measure the bark thickness at breast height.
In May, when the average length of T. piniperda galleries exceeded 8 cm, the trap trees had their branches removed, followed by the careful removal of bark. The stems were divided into 2.5% units. The stems were also divided into upper and lower parts, each of which accounted for half of the circumference (Figure 1C). As a result of the lengthwise division (units) and lateral division (upper and lower part), the stem surface area was divided into 80 sections (h). The number of bark beetle galleries was counted on each section. The total density of infestation of the stem by bark beetles was calculated using the number of galleries on all 2.5% stem sections and the stem surface area.

2.3. Sample Tree Dataset D2

In January 2023, field surveys were performed in stands on Klonowskie Mountain in Świętokrzyski National Park, with the aim of identifying wind-damaged pine trees. In the selected stands, all windfalls meeting the following criteria were numbered: (1) those that had been blown down by the wind in the winter period; (2) those whose roots maintained contact with the ground; and (3) those which had straight, undamaged stems. A total of 50 such windfalls were marked, from which 10 were randomly selected using a random number generator. In February 2023, each windfall was cut from its roots and was then placed on supports. Dendrometric and entomological data were collected in the same manner as that for trap trees prepared from standing trees (Dataset D1), and the dendrometric parameters of the windfalls are given in Table 2.

2.4. Measures Used to Describe the Niche Breadth of Bark Beetles

Niche breadth represents the range of parts of the stem used by a given species of bark beetle as a place of development or as breeding material, determined on the basis of the spatial distribution of galleries along the longitudinal and/or transverse axis of the stem. This parameter reflects the degree of spatial specialisation of the species and can be expressed using quantitative indicators such as the Levins or Hurlbert indices, which take into account the relative density of galleries in different sections of the stem. The ecological functions of the niche breadth include (1) information on whether a species colonises a narrow (low-parameter-value) or wide (high-value) range of stem parts; (2) an indication that species with a broad niche may overlap spatially with others, increasing competitive pressure; and (3) an emphasis on the fact that niche breadth diversity in a bark beetle community promotes species coexistence on the stem.
The niche breadth of bark beetles ( B ^ ) was computed by means of the method proposed by Levins [48], according to the following formula:
B = 1 / h = 1 n p i h 2
where pih is the proportion of species i in section h, h denotes a stem section covering half the circumference of a tree unit, and n is the number of sections.
For the standardisation of the niche breadth parameter, Hurlbert’s [49] measure was used:
B A = B 1 n 1
where B ^ A is Levins’ standardised niche breadth, B ^ is Levins’ measure of niche breadth, and n is the number of possible resource states.
The niche breadth index has a value of 0.0 when T. piniperda colonises only one of the 40 available stem sections (minimum niche breadth, maximum specialisation) and reaches 1.0 when all sections are colonised uniformly (maximum niche breadth, minimum specialisation).
The similarity between species distributions in a resource set was quantified using the proportional similarity index Psi [50], based on Equation (3):
P s i = 1 0.5 h = 1 n p i h p j h
It was assumed that niche segregation occurred when the value Psi was less than 0.7 [51].

2.5. Analysis of the Distribution of T. piniperda Galleries on Stems

All calculations and statistical analyses were carried out using Statistica software, version 13.3 (TIBCO Software Inc., Tulsa, OK, USA) [52]. Prior to the data analysis, the normality and homogeneity of the variances were checked using the Shapiro–Wilk and Levene tests [53]. To test differences in infestation density between the upper and lower stem sections, a t-test was used, while the uniformity of the distribution of bark beetle galleries on stems was assessed using the Kruskal–Wallis test. In order to establish the mean infestation density of T. piniperda galleries in different bark thickness classes, a curve was fitted using the smoothing procedure of distance-weighted least squares. Polynomial (second-order) regression was performed for each value on the X-variable scale to determine the corresponding Y value such that the influence of the individual data points on the regression decreased with their distance from the particular X value [54]. To assess differences in niche breadth on stems belonging to three bark thickness classes—class 1 (below 30 cm), class 2 (30–40 cm), and class 3 (above 40 cm)—one-way ANOVA was applied. Post hoc analysis was performed using Tukey’s LSD test.

2.6. Model Construction Procedure for T. piniperda Niche on Stems

2.6.1. Stepwise Regression Model Construction Process

Stepwise regression, a statistical method for selecting variables based on their significance, was used to analyse the relationship between niche breadth and stem characteristics and gallery density. This is the preferred method for selecting a suitable subset of independent variables for predictive purposes [55]. It is based on the sequential elimination of the least important variables, and the process ends when an “optimum” set of significant variables is obtained. The significance of each independent variable is evaluated using the F-statistic. Variables with F-values below the predetermined threshold are excluded from the model. The stages in the selection of independent variables are as follows:
Step 1. The starting model includes all k potential variables:
y = b0 + b1x1 + … + bkxk
where y is the dependent variable (the niche breadth of T. piniperda on a stem); b0, b1, …, bk are the equation parameters; and x1, …, xk are values of the independent variables.
Step 2. An insignificant variable, having the lowest value for the F-statistic, is removed from the model. After the variable xk is removed, a new model is constructed, including all of the previous variables except for the one that was removed. This has the following form:
y = b0 + b1x1 + … + bk−1xk−1
At subsequent stages, further variables are removed iteratively, until a model is obtained in which every variable is statistically significant.
During the model construction process, the data was divided into two groups [56]: Dataset D1 was used for parameterisation, while Dataset D2 was used for model validation.

2.6.2. Model Parameterisation Stages

The set of potential independent variables consisted of the following:
  • Infestation density (number of galleries/m2) for stem units (du) and upper sections (dhu).
  • Stem characteristics:
    -
    Initial diameter of the stem;
    -
    Stem diameter and bark thickness at breast height;
    -
    Length of the stem with a bark thickness greater than 1, 2, …, 20 mm (l>1, l>2, …, l>20).
Prior to the construction of a model, the following assumptions were verified:
i.
The relationship between the independent variables and the dependent variable;
ii.
The relationships between independent variables were examined by calculating the variance inflation factor (VIF) [57]:
V I F = 1 1 R 2
where R2 is the regression coefficient of determination of an independent variable on all other independent variables.
The interpretation of VIF values was performed as follows [57]:
VIF = 1: no collinearity (the variable is not correlated with other independent variables);
VIF < 5: acceptable level of collinearity (often considered a safe threshold);
VIF > 5: high collinearity—the model may be unstable, and parameter estimates are unreliable.
This study adopted a rigorous approach with a threshold of less than 2. The adoption of a VIF of less than 2 was a conscious choice aimed at limiting collinearity between variables, which translated into a more stable, precise, and reliable regression model.
iii.
The distribution of regression residuals was analysed using White’s test [58]:
W = nR2
where n is the number of observations and R2 is the coefficient of determination of the auxiliary regression expressed by the equation
e 2 = b 0 + b 1 X 1 + b 2 X 2 + b 3 X 1 2 + b 4 X 2 2 + b 5 X 1 × X 2
The critical area is given by the inequality
nR2 > χ2p−1,α
iv.
The Shapiro–Wilk test was used to check whether the residuals were normally distributed.

2.6.3. Assessment of the Accuracy of the Constructed Model

Based on the windfalls selected for validation, the niche breadth of T. piniperda was computed for each stem B o and for all stems B ¯ o . Next, the niche breadth was estimated for each stem B p and for all stems B ¯ p using the model.
For each stem, the relative error was computed from the formula
δ B % = B o B p B o · 100
For all stems in the study area, the mean niche of T. piniperda, B ¯ , is an unbiased estimator for B′ [59]. The differences between the observed mean B ¯ o and the model mean B ¯ p were tested using the t-test for independent variables. Normality and homogeneity of the variances were checked using the Shapiro–Wilk and Levene tests, respectively, prior to the t-test [53].

3. Results

3.1. Analysis of the Colonisation of Trap Trees by Bark Beetles (Dataset D1)

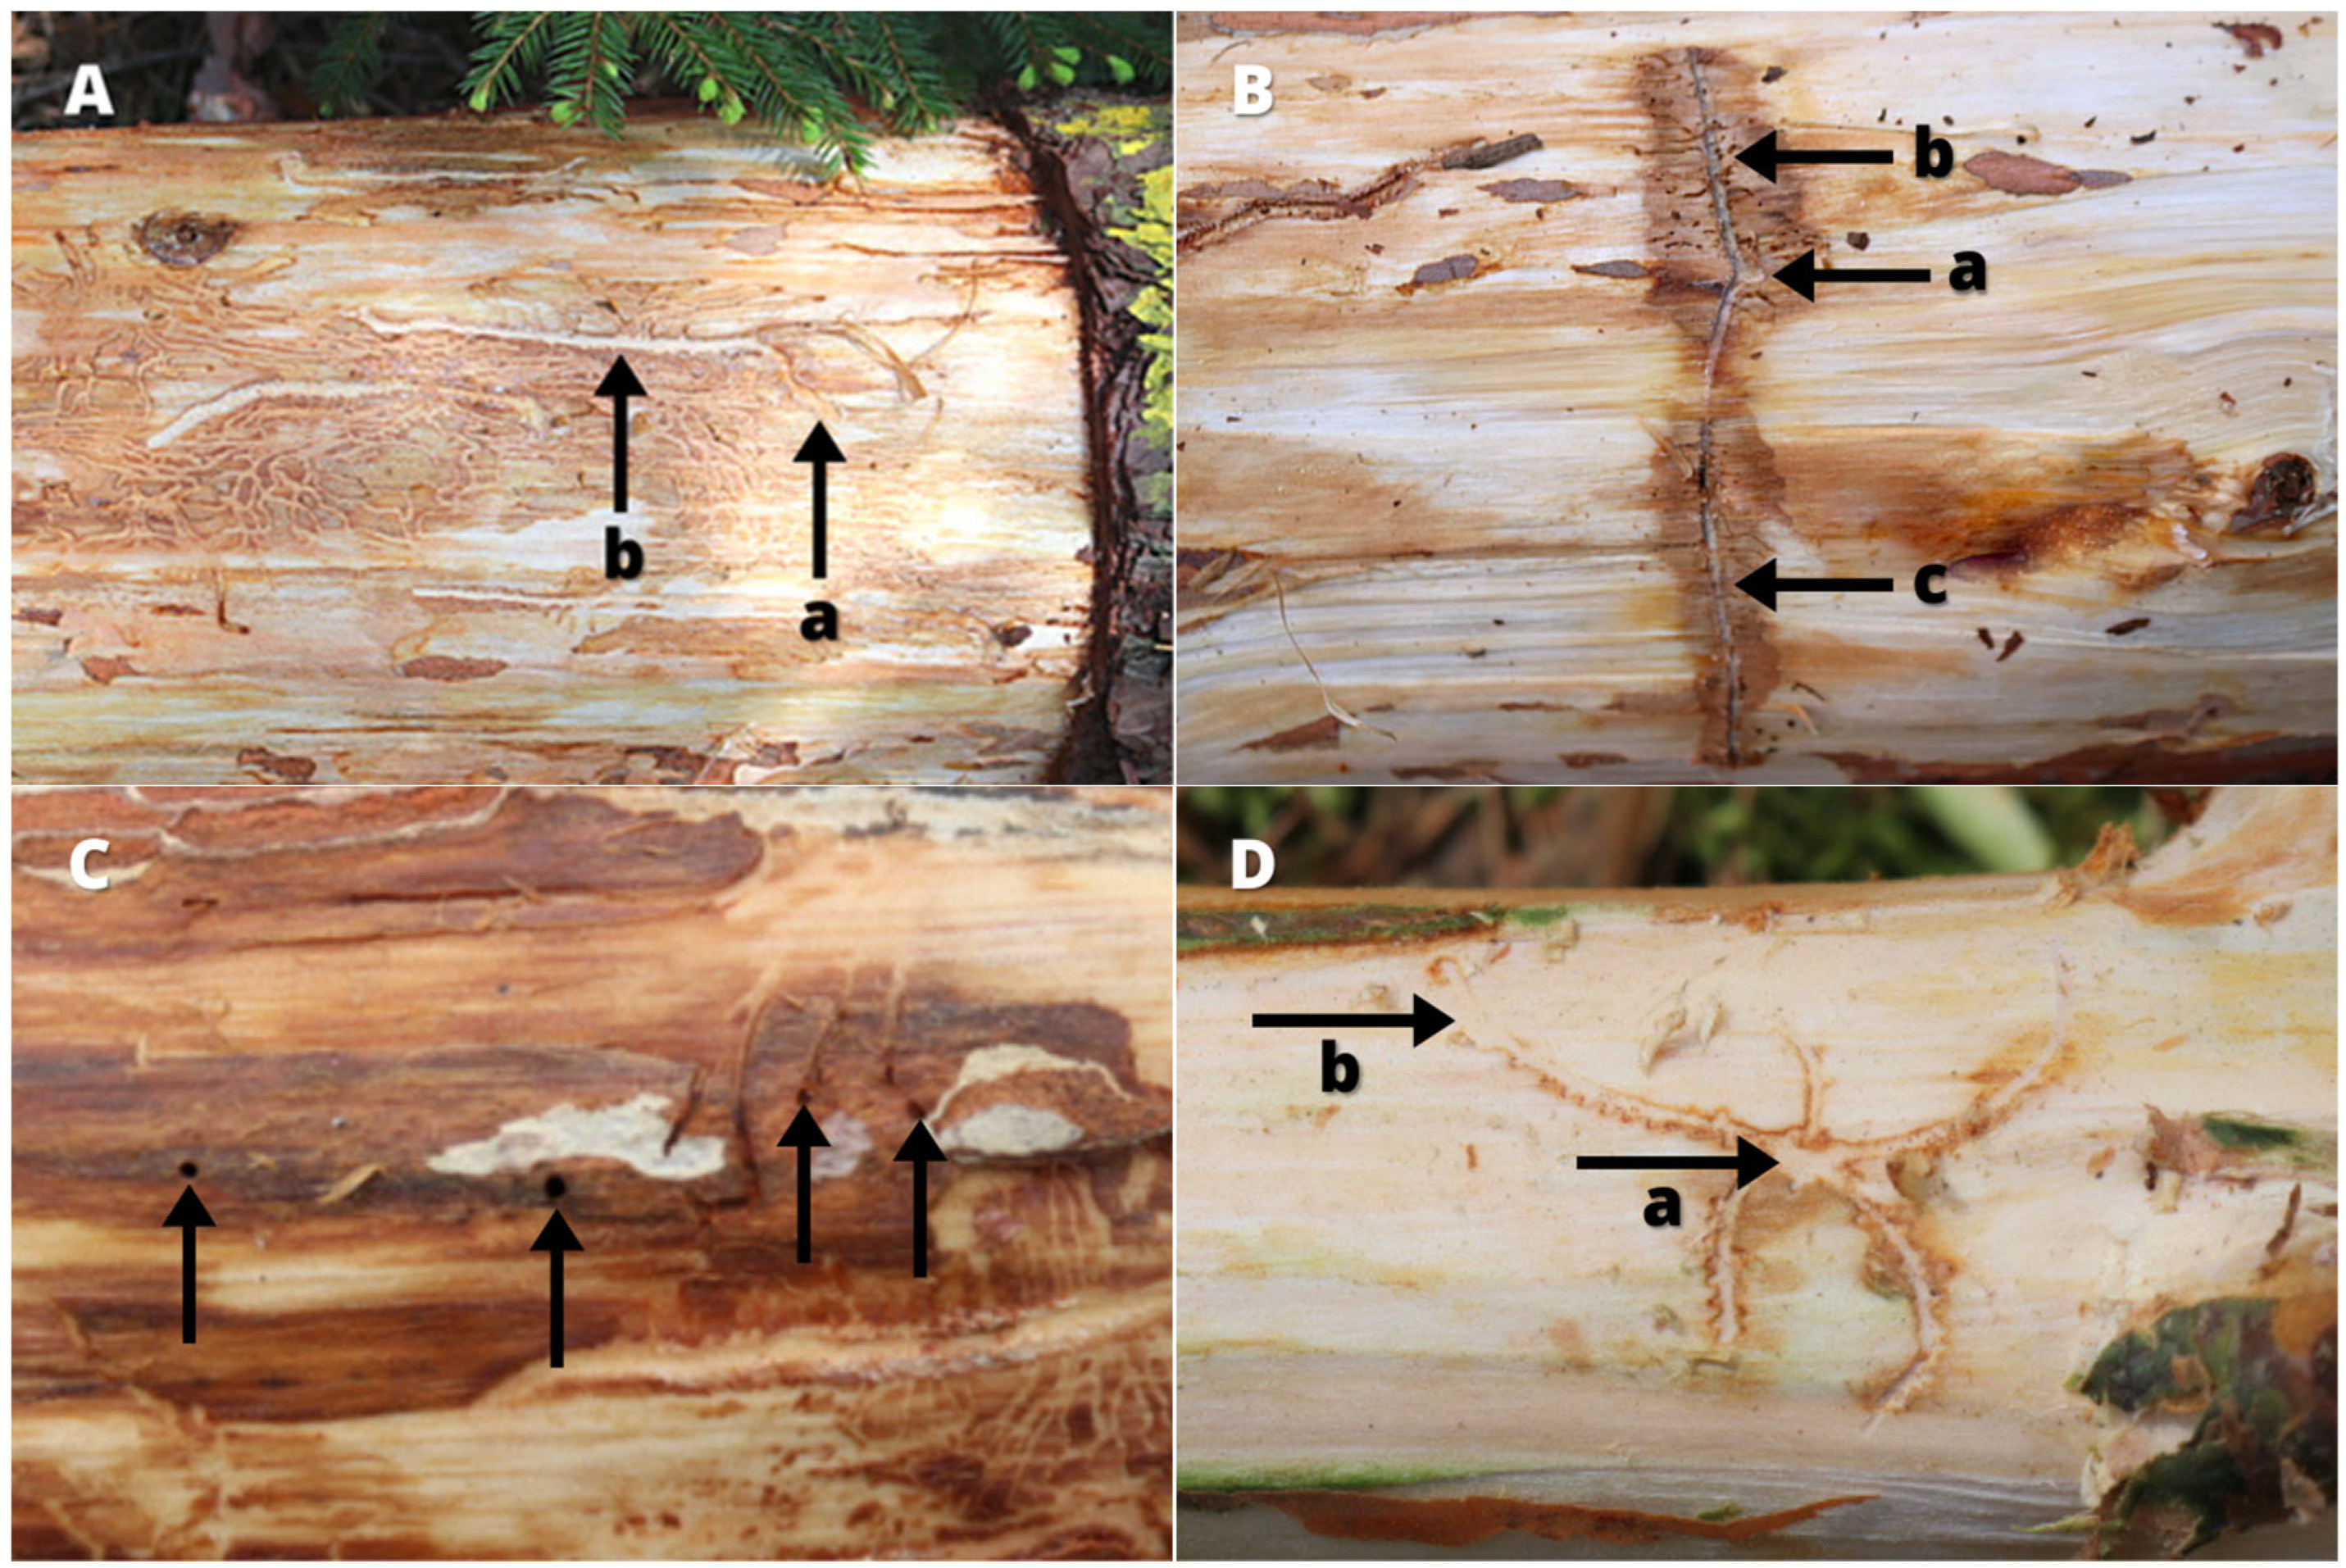
The lengths of the P. sylvestris stems ranged from 16.0 to 31.2 m. In total, 2560 entomological analyses of 2.5% stem length sections were performed. A total of 15,764 galleries of significant bark beetle species were counted across all stems. The main Scolytinae species found in the stems were T. piniperda (8372 galleries) and Tomicus minor Hart. (6768 galleries), infesting 32 and 26 of the sample pine stems, respectively. Other species—Pityogenes bidentatus Herbst. (146 galleries) and Trypodendron lineatum Olivier (478 galleries)—were found at a very low frequency, infesting four and one of the sample stems, respectively (Figure 5).
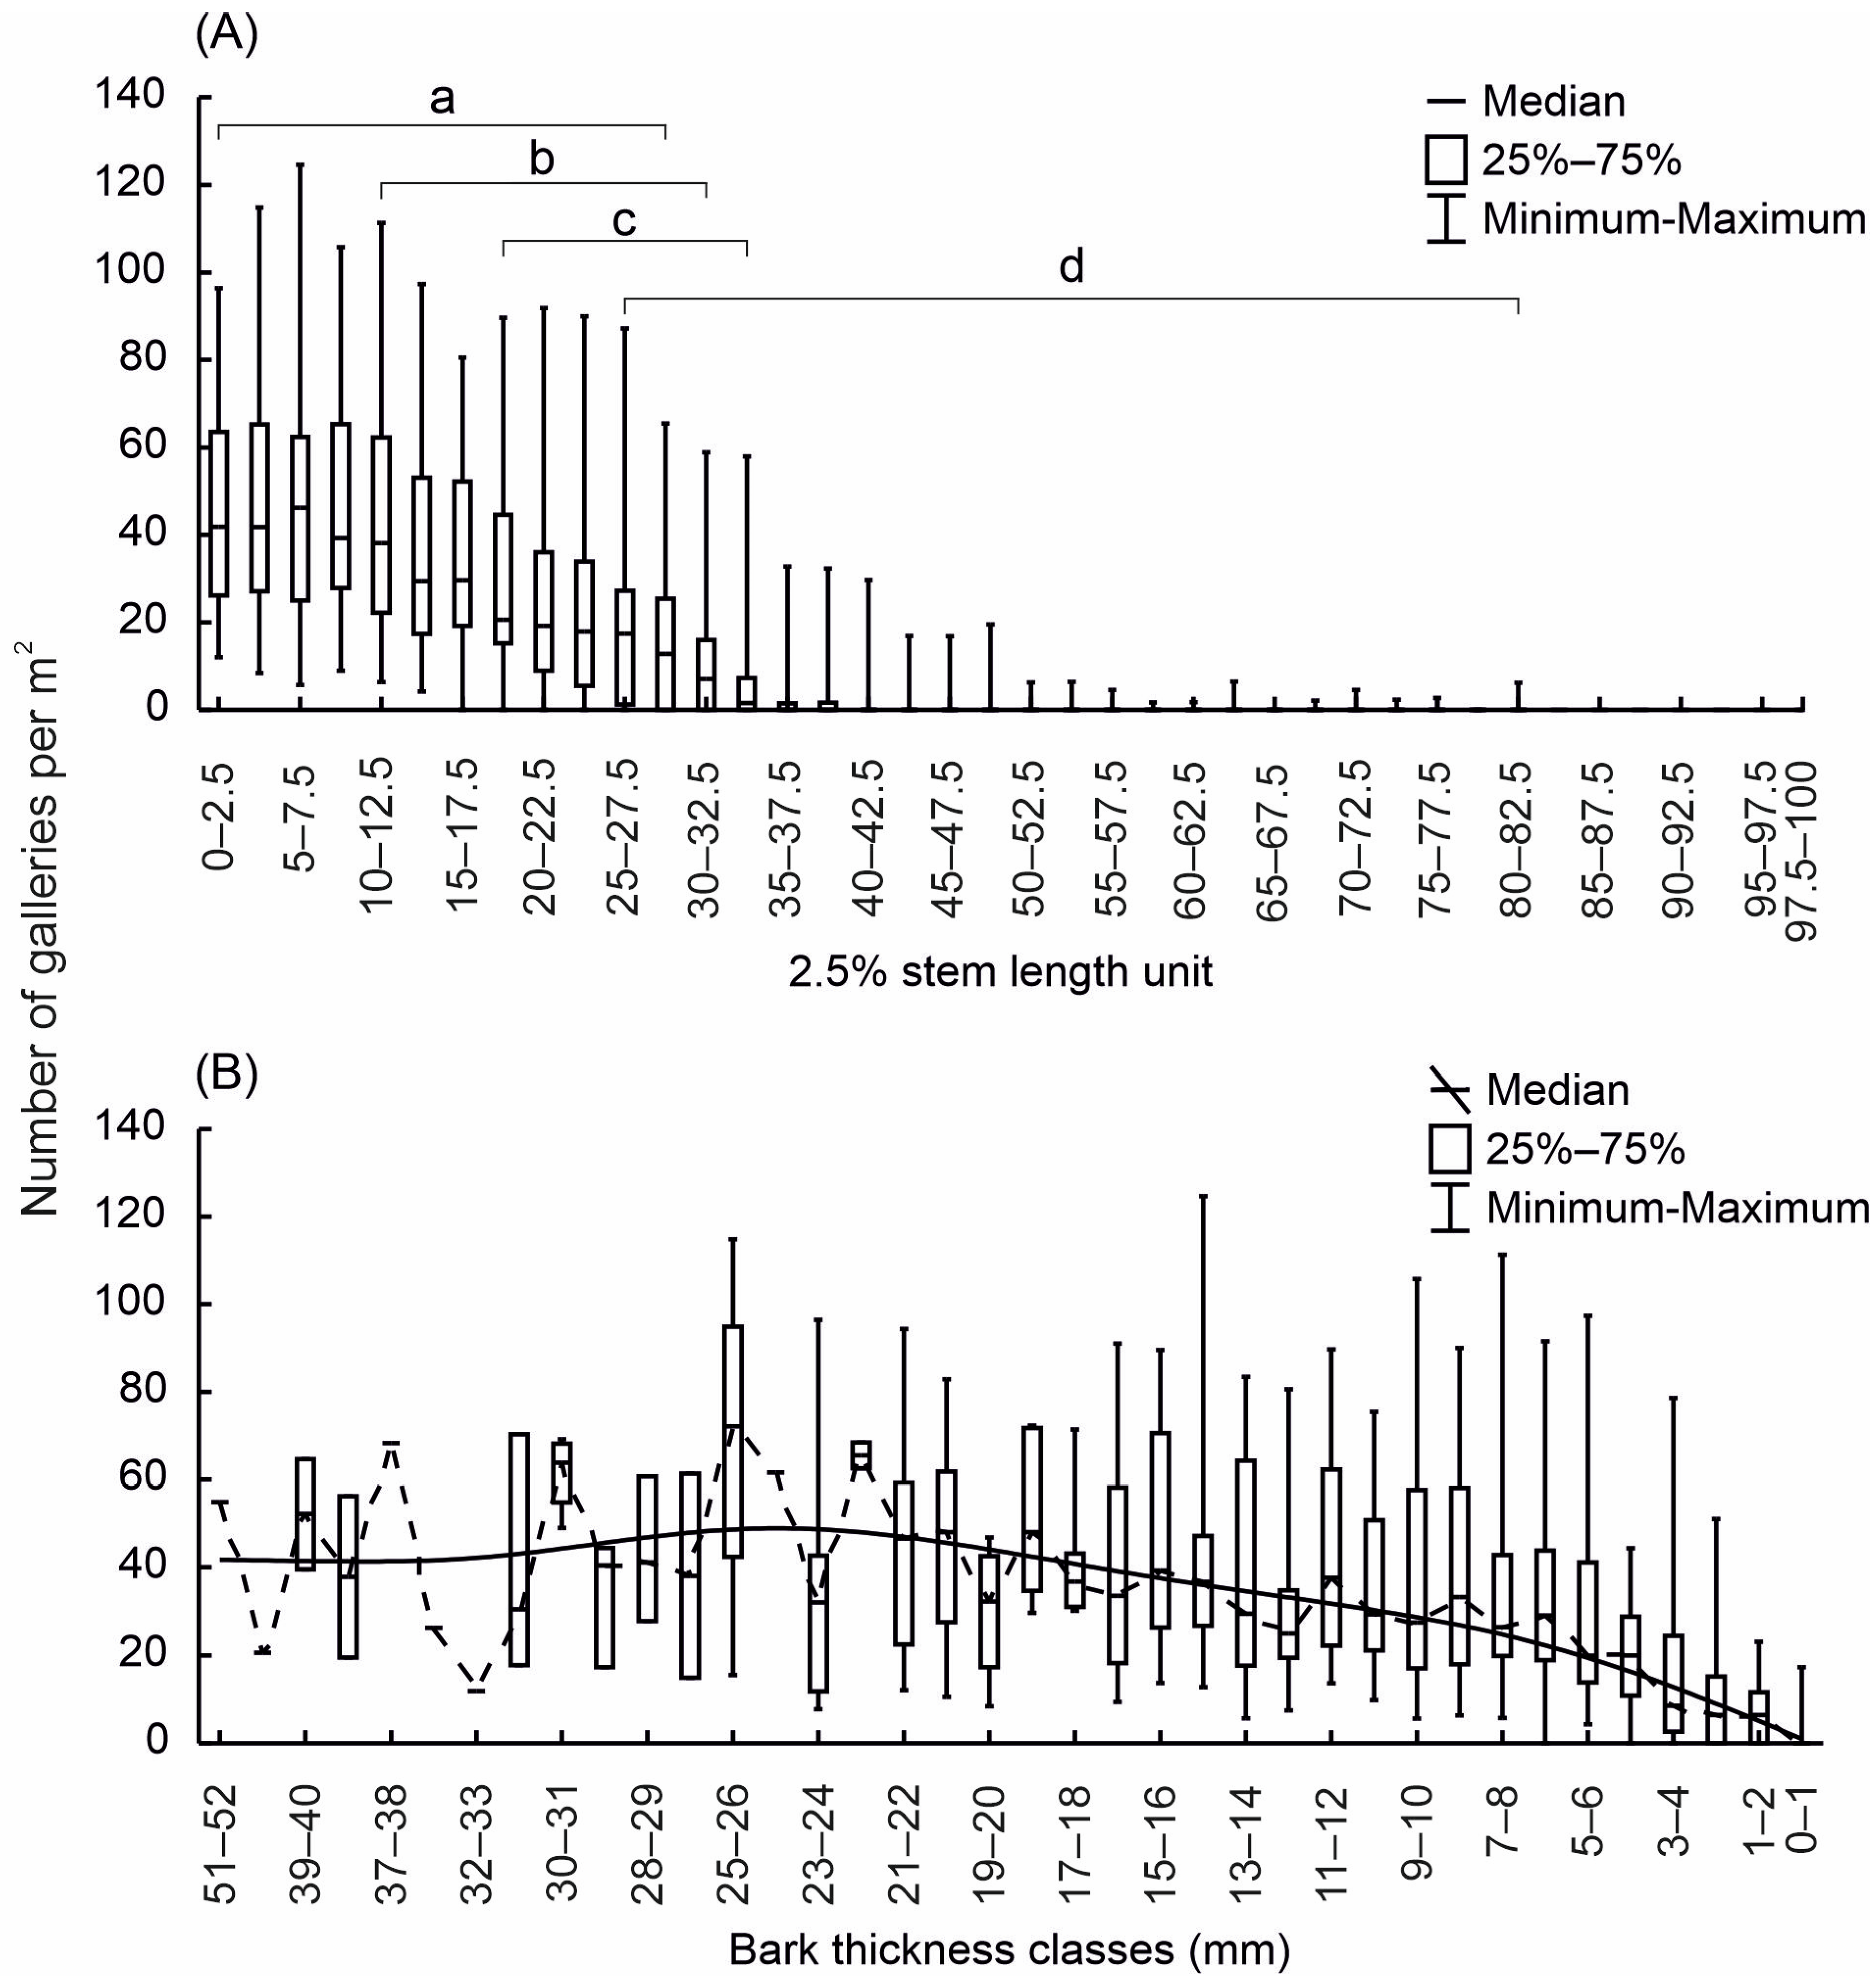
The mean T. piniperda infestation density of the stems was 16.3 ± 1.63 SE galleries/m2. The infested stems in the stands did not indicate the presence of sources of reproduction of T. piniperda. This species mainly infested the thicker parts of stems, extending to a maximum of approximately 80% of their length (Figure 6A). Regarding the distribution of infestation density, a gradual decrease is observed with increasing distance from the thicker end, as indicated by the insignificant differences in the colonisation of the first 12 units (Kruskal–Wallis test: H (39; 1063) = 785.11, p < 0.001; Figure 6A). The levels of infestation of the upper and lower stem sections did not differ significantly (t-test: p = 0.5631).
T. piniperda infested stems belonging to all bark thickness classes (Figure 6B). The smoothed distribution of infestation density (Figure 6B) shows a gradual reduction after reaching the value representing the culmination of colonisation (72.1 galleries/m2). Maximum colonisation was found in bark with a thickness of 14–15 mm (124.7 galleries/m2). Galleries in the thinnest bark (1.7%) were found only in grey-brown bark covering stems in the nodal zone. The niche breadth on stems with a diameter above 40 cm is larger than that on thinner stems (ANOVA: F2,39 = 10.293, p = 0.0004; post hoc LSD procedure for α = 0.05).
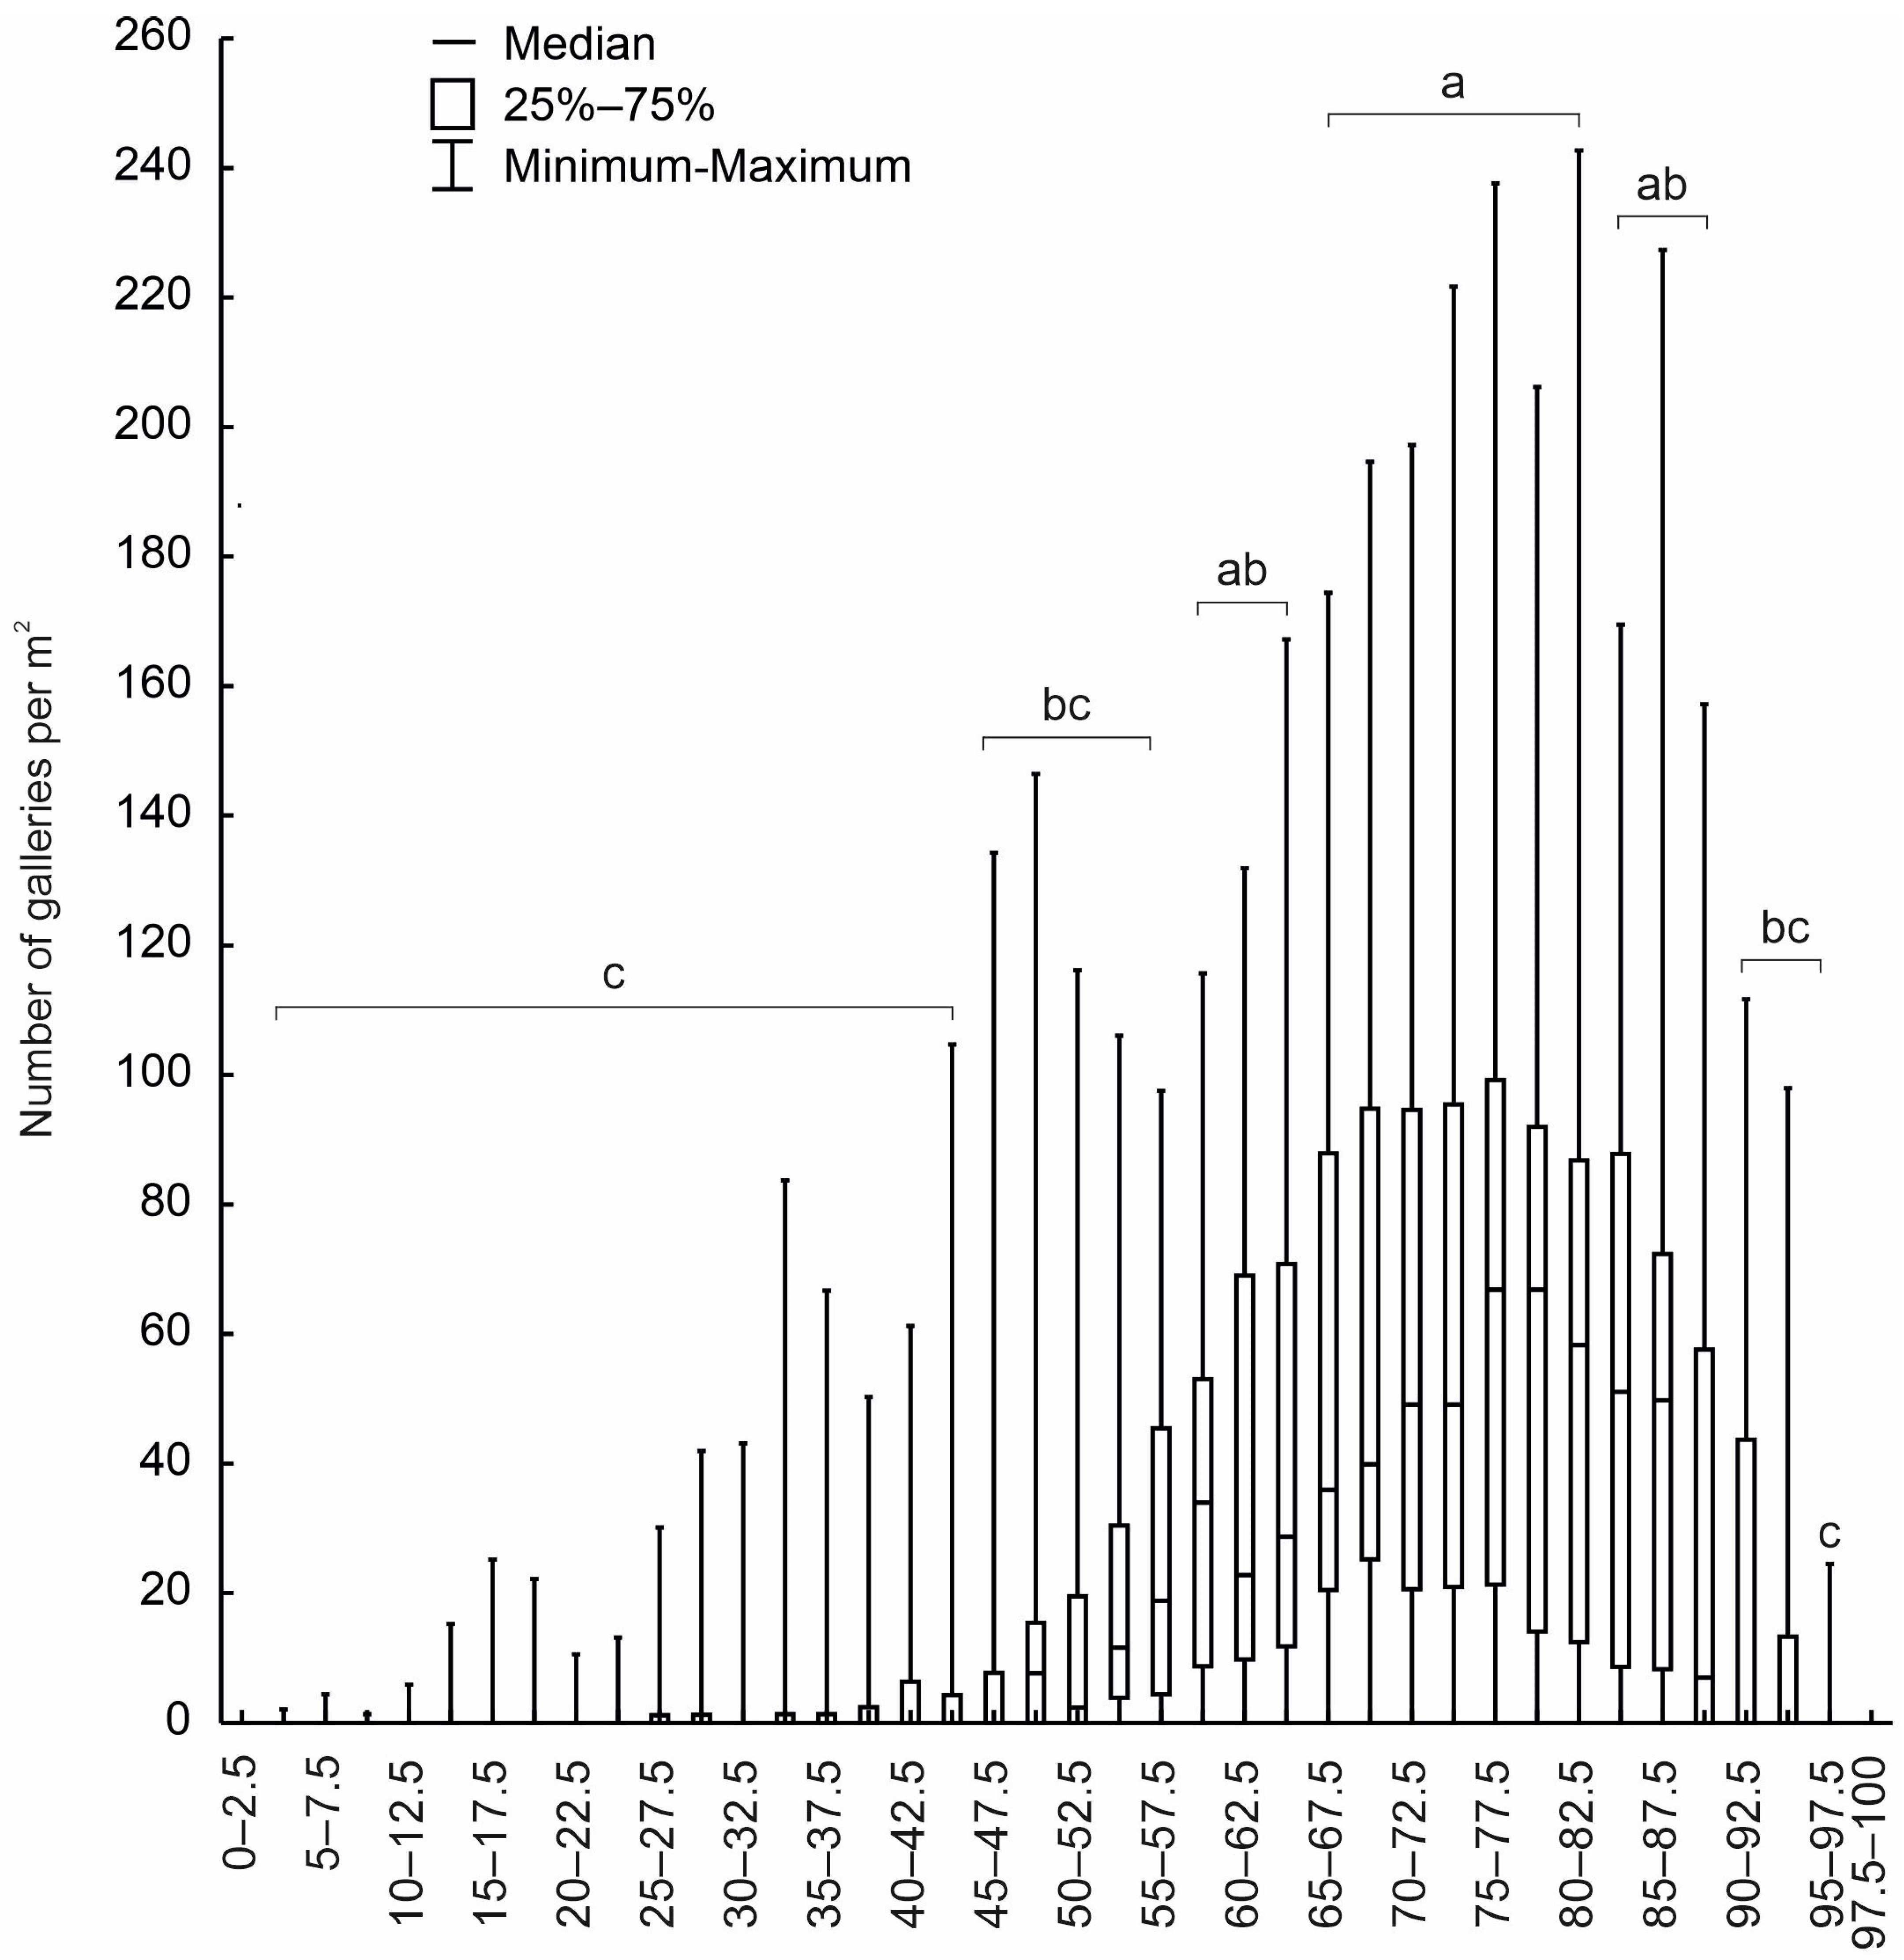
The mean T. minor infestation density of the stems was 13.8 ± 2.75 SE galleries/m2. T. minor infested the stems along their entire length, except for the thickest and thinnest units (Figure 7).
The most favourable conditions for the colonisation of this species occur in the thinner parts of the stems, where the bark is less than 1 mm thick (95% of all galleries). The density of T. minor infestation in the analysed stems decreased with the distance from the most infested unit (Kruskal–Wallis test: H (39; 1040) = 547.28, p < 0.001; Figure 7). The highest infestation was found in unit 75–77.5%. The beetles showed a preference for the lower sections of the stems (t-test: p < 0.001).
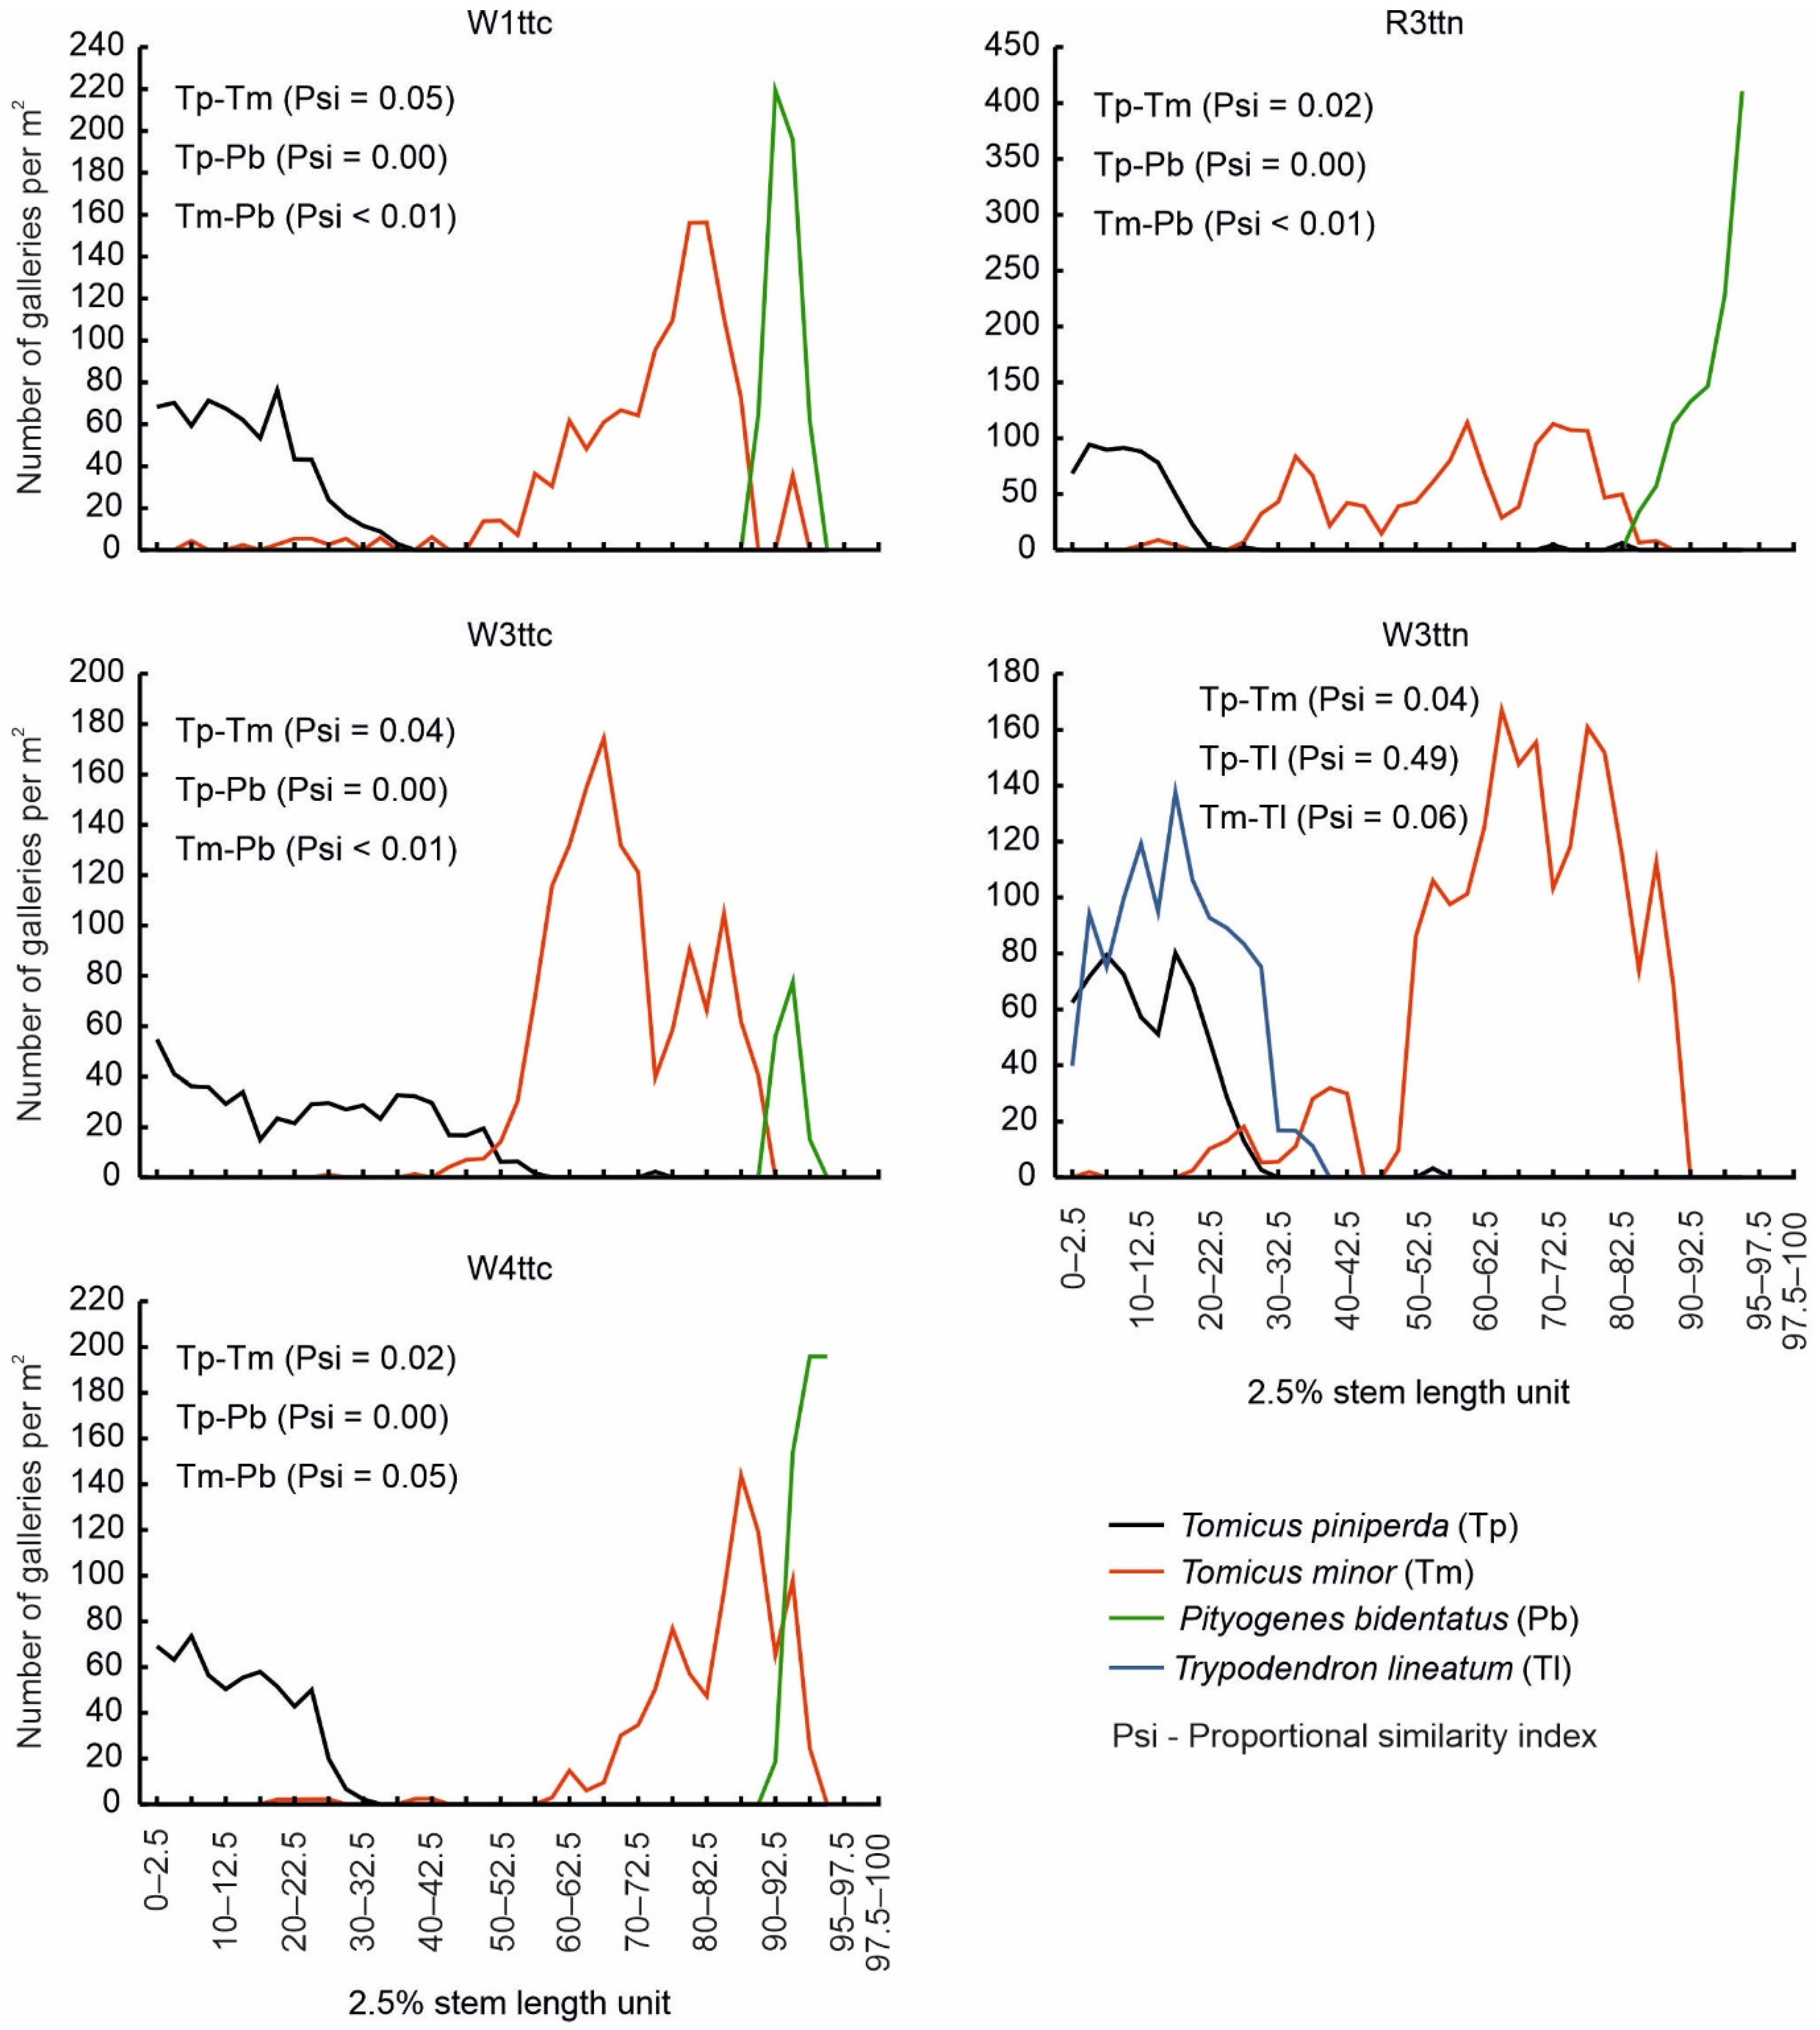
The mean niche breadths occupied by T. piniperda (0.24 ± 0.01 SE) and T. minor (0.23 ± 0.02 SE) on the stems were similar (t-test; p = 0.6680), while those of P. bidentatus and T. lineatum were 0.07 (±0.01 SE) and 0.14, respectively. For all of the analysed stems, the calculated Psi was below the theoretical threshold (0.7), indicating ecological niche separation among the bark beetle species. T. piniperda predominantly occupies the thicker parts of the stems, T. minor prefers the thinner units, and P. bidentatus is mostly found in the final portions. T. lineatum co-occurs primarily with T. piniperda but is restricted to the lower, thicker parts of the stem (Figure 8).

3.2. Analysis of the Colonisation of Windfalls by Tomicus piniperda (Dataset D2)

The lengths of the studied P. sylvestris stems ranged from 18.2 to 30.5 m. In total, 800 entomological analyses of 2.5% stem length sections were performed, with T. piniperda infestation observed on all of them. In total, 2345 galleries were counted on the stems only. The mean T. piniperda infestation densities of the stems in 2022 and 2023 were similar (16.3 ± 1.63 SE and 14.9 ± 1.47 SE galleries/m2, respectively).

3.3. Evaluation of Tomicus Piniperda Niche Breadth on Stems

3.3.1. Parameterisation of the Model

As a result of the statistical analysis, from the initial set of variables, the following were selected as the independent variables that significantly (p < 0.05) described the niche breadth of T. piniperda on the stems:
-
Length of stems with a bark thickness greater than 4 mm (l>4);
-
Density of T. piniperda galleries on the 11th unit du11 (model I) and on the 11th upper section dhu11 (model II) of the stem.
The calculated T. piniperda niche breadth was described using Equation (11) (model I) and Equation (12) (model II):
B ^ = 0.0953 + 0.0147 × l > 4 + 0.0018 × d u 11
B ^ = 0.0885 + 0.0165 × l > 4 + 0.0015 × d h u 11
Scatterplots indicate that the models display good fit to the data. All points fall within the plotted plane (Figure 9A,B). This indicates that the developed models accurately reflect the relationships between the variables.
The values of the coefficients of the models and their statistical evaluation for particular variables are given in Table 3. The constructed models explain approximately 85% (model I) and 83% (model II) of the variation in the T. piniperda niche breadth on the stems. The high values of adjusted coefficients of determination ( R a d j 2 ) confirm that the applied stepwise regression models accurately describe the observed variation in T. piniperda niche breadth. The mean relative errors of estimation are low, amounting to 11.6% (model I) and 12.7% (model II). In both models, the variables used have a similar contribution to the explained variance (p < 0.001; Table 3). The positive signs of the regression coefficients for the variables appearing in the models indicate that the niche breadth increases with (1) an increasing length of stem with a bark thickness greater than 4 mm and (2) an increasing infestation density of the 11th unit (model I) or the 11th upper section (model II).
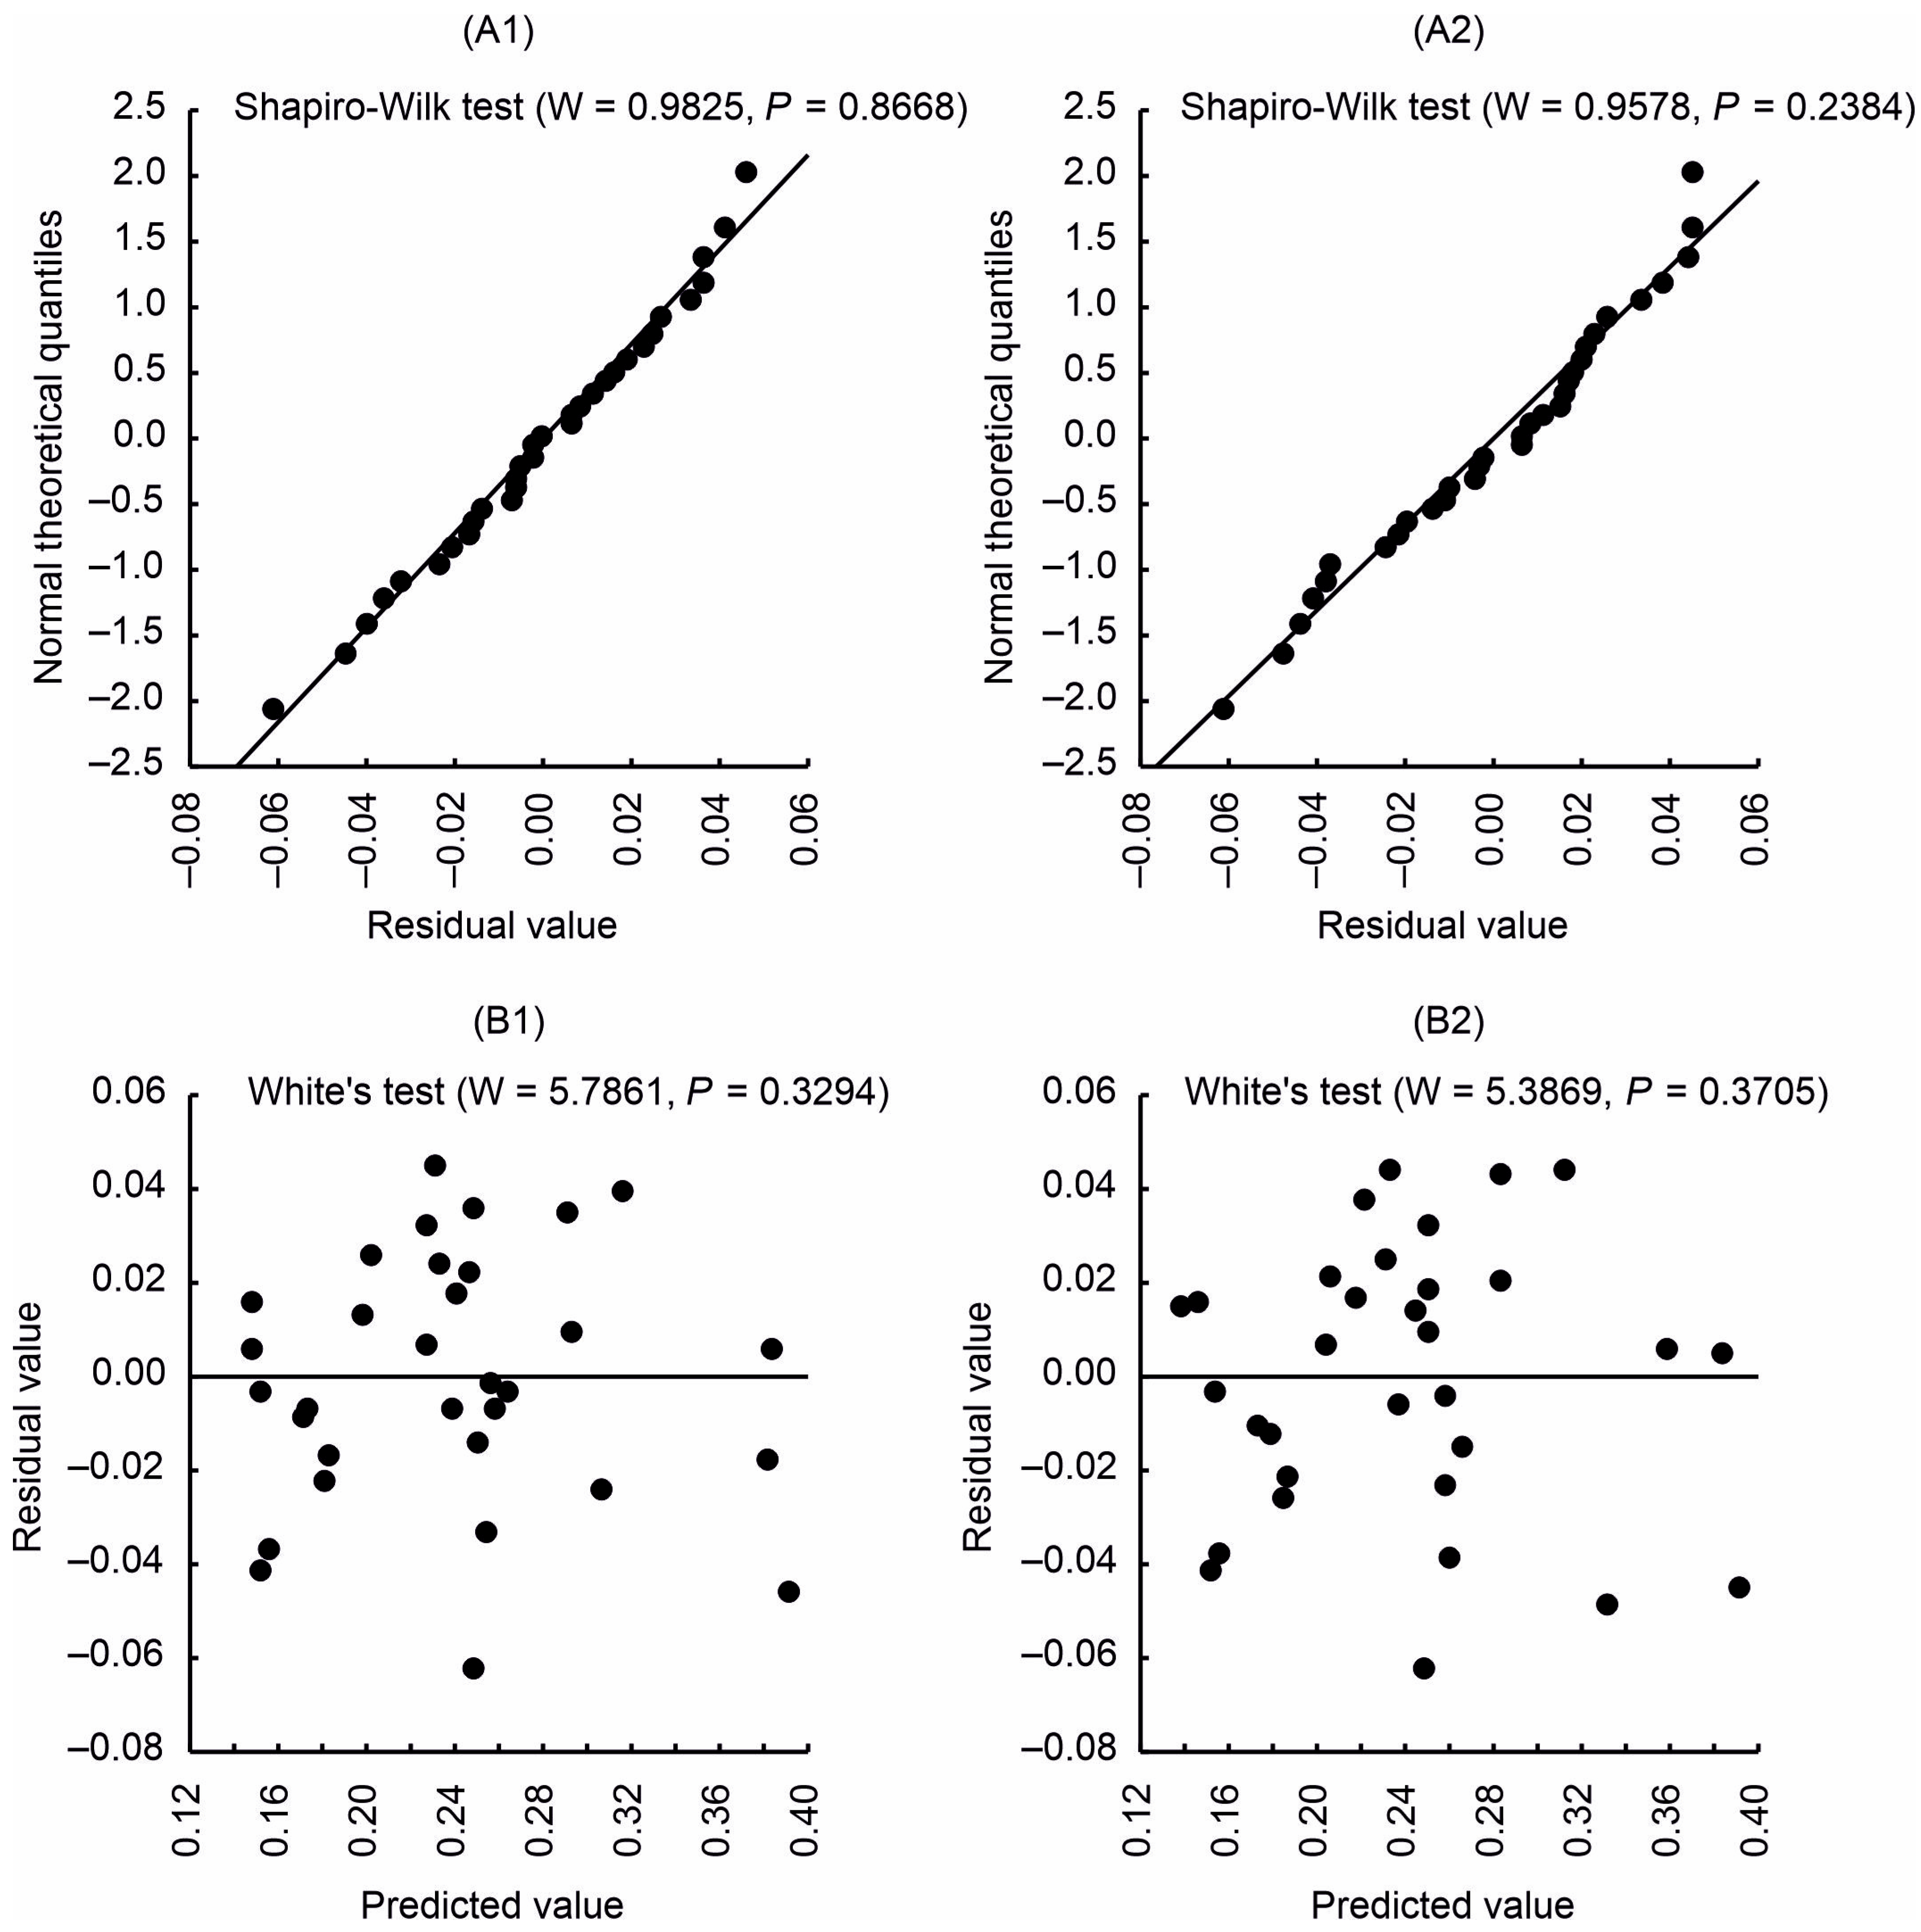
Verification of the assumptions of the stepwise regression analysis showed that the residual distribution corresponded to a normal distribution (Shapiro–Wilk test, Figure 10A) and the residual variance in both models was constant (White’s test, Figure 10B).

3.3.2. Validation of the Model

The accuracy of the method was verified in two ways: (1) for each stem and (2) for all stem samples (Table 4). Generally, the errors for the observed values ( B o ) and predicted values ( B p ) for each stem did not exceed 12%. For the entire sample, the mean observed value ( B ¯ o ) and predicted value ( B ¯ p ) did not differ significantly (t-test, p > 0.05; Table 4). Based on the analyses of accuracy, it is concluded that the presented method is highly accurate for estimating the T. piniperda niche on stems.

4. Discussion

4.1. Methodological Assumptions

First, data collected in protected areas are particularly valuable for scientific research, which is why study areas in forests under various forms of protection were selected. To minimise interference with the national park’s ecosystem (cutting trees), windfalls were used.
Second, the research was carried out in pine monocultures and mixed stands containing pine. When selecting stands for this study, it was assumed that T. piniperda populations may be more numerous in homogeneous Scots pine stands. This may lead to increased competition among individuals competing for limited stem resources and, consequently, to the expansion of their ecological niche.
Third, the spatial distribution of zones in the stand enabled the detection of potential sources of reproduction of T. piniperda. Experimental studies with marked beetles have shown the principal distance of dispersal of a T. piniperda population (95.3%) from pine timber (stored with bark) to neighbouring stands to be 400 m [60].
Fourth, the selection of sample trees enabled the assessment of the niche breadth under conditions of both low and high resource availability. The breadth of the T. piniperda niche shows a positive correlation with the stem diameter of various pine species [36].
Fifth, the choice of sampling method to assess the niche breadth of T. piniperda was justified in the work of Borkowski and Skrzecz [39]. The method of using a uniform distribution of sampling sites is more representative in characterising the effect of environmental variables on the quality of food resources used by bark beetles.
Sixth, the data used for model parameterisation (Dataset D1) and validation (Dataset D2) were collected at different locations and during different time periods. This sampling strategy reduced the risk of model overfitting [61]. The use of heterogeneous data allows for the evaluation of model stability, which is particularly important in the context of climate change.
Conducting scientific research on model construction in commercial stands and protected forests is the optimal research approach. Data for model parameterisation collected in commercial forests, where active forest management is carried out, allow for the impact of forest management practices and various degrees of anthropogenic pressure to be taken into account. This allows the model to be adapted better to a wide range of real-world conditions. Validation data from protected areas come from an environment less altered by humans, allowing us to check whether the model accurately reflects natural processes and whether it is universal regardless of the degree of human interference. This approach—building a model based on data from commercial forests and testing it in protected areas—indicates that the model is universal and can be used both in commercial practice and in scientific research. The Świętokrzyskie Mountains are located in a temperate climate zone, which is characterised by distinct seasons and moderate environmental conditions. As a result, the model will be applicable to a wide range of forest areas with similar climates in Central Europe.

4.2. Evaluation and Validation of the Model

The first variable included in the models is bark thickness (Table 3). The pattern of colonisation of the stems is typical for this species; it is characterised by a reduction in infestation density with increasing distance from the thicker end [19,62,63,64] (Figure 6A). A comparison of the infestation density distribution in different sections (Figure 6A) and in different bark thickness classes (Figure 6B) in the thickest part of the stems suggests weaker stem colonisation in bark thicker than 30 mm. The same phenomenon has been observed in France [65]. It is probable that bark more than 30 mm thick can act as a mechanical barrier that makes it difficult for the beetles to bore down to the phloem.
The model developed by Price [66] used for the description of tree infestation patterns shows a positive correlation between the beetles’ body size, the thickness of the stem, and the niche breadth. A comparison of the niche breadths of the studied species indicates a narrow spatial specialisation for P. bidentatus. As the species with the smallest body size, it inhabits the thinnest unit stem. The niche breadth of this species (0.07) is about three times smaller than that of pine shoot beetles (0.23–0.24), a species of similar body size. T. lineatum (0.14) shows broader spatial specialisation, inhabiting only the lower parts of trunks with increased humidity. This species prefers fresh and moist breeding material, as fungi, including Phialophoropsis ferruginea Math.-Käärik [67], which constitute its food, develop in the galleries. The calculated Psi indices (Figure 8) indicate niche segregation and thus spatial specialisation of bark beetles, consistent with Gause’s rule. The thicker part of the trunk is colonised by T. piniperda, the thinner part by T. minor, and the thinnest part by P. bidentatus. It is interesting to note the colonisation of stems by T. piniperda in the thinnest bark (0–1 mm). Similar results were obtained for the same species in stands belonging to younger age classes [36]. It should be noted that in the thinnest bark, T. piniperda colonised only the nodal zone of stems, covered in grey-brown bark. It may be presumed that these areas provide more favourable conditions for the development of a new generation than those that exist under smooth (orange-red) bark, as it probably provides greater mechanical and thermal protection, while also preventing water loss.
The second variable included in the models is the density of T. piniperda galleries on the 11th unit (model I) or the 11th upper section of the stem (model II). It is well known that intraspecific competition increases niche breadth [33], but the infestation density distribution (Figure 6A) indicates that the beetles effectively avoided competitive pressure. The observed maximum infestation density (<125 galleries/m2) is below the threshold value (<130 galleries/m2), above which competitive interactions occur between individuals in the population [63]. Given the less significant role of the pheromone information system in tree colonisation displayed by T. piniperda [68,69,70], stridulation (mechanical information transmission) by individuals becomes a possible mechanism for preventing excessive population density in a given part of the stem [71,72]. The beetles colonised the circumference of the stems non-uniformly. In spite of the lack of differences in colonisation on the upper and lower sections (one-sample t-test, p > 0.05), it was observed that the beetles preferred the side sections of stems. For this reason, when evaluating the niche breadth with the use of model II, it is necessary to precisely demarcate the boundary between the upper and lower sections. The position of the analysed stem section has important practical implications. As the distance from the base of the stem (thicker end) increases, the bark thickness decreases, facilitating accurate bark removal and improving the precision of gallery counts. On a stem with a length of 30 m, the 11th section included in the model is 75 cm long and is located between 7.5 and 8.25 metres from the thicker end. The time required to carefully debark this unit and count the galleries is approximately 30 min, compared to around 3 h for the basal section. In the thickest part of the stem, the bark is very thick and tightly adherent to the wood, which makes its removal difficult without damaging the structure of the beetle galleries.
The models developed here differ in terms of the degree of interference with the forest ecosystem. The greater invasiveness of model I results not only from the removal of bark from a larger part of the stem surface, but also the fact that counting galleries on the lower section of a stem requires the rotation of the stem, and thus the removal of all branches. An additional advantage of model II is its potential use to determine the number of galleries based on sawdust points [26], which would allow the niche breadth to be determined in a completely non-invasive manner. This method was developed for trap trees. Research has shown that, instead of using felled live trees, windfalls may be used as natural traps. Windfalls are a significant source of reproduction for T. piniperda, as has been observed more in recent years [47,73,74,75,76].
Comparing the results of studies assessing the ecological niche breadth of bark beetles is challenging due to the diversity of the methodological approaches employed. In some investigations, bark thickness is treated as the primary resource axis, while others focus on the distribution and analysis of stem sections. Despite these differences, bark thickness has consistently been shown to be an effective factor in the niche segregation of most bark beetle species associated with P. sylvestris [36] and Norway spruce (Picea abies (L.) H. Karst) [35], supporting its recognition as a key determinant of niche breadth. Another crucial factor influencing niche breadth is resource availability, which is directly related to the total area of accessible resources and inversely related to population density [36]. In this context, bark thickness may exert an indirect effect on niche breadth. Trees with larger diameters—typically older individuals—tend to possess thicker bark, which serves as a preferred microhabitat for certain species, such as T. piniperda. This indirect role of bark thickness has also been confirmed in studies on Pinus ponderosa (Dougl. ex C. Lawson) in the United States, where bark beetles exhibited microsite specialisation depending on bark thickness [34]. The tree health status is another factor frequently considered in studies on the ecological niche of bark beetles. Weakened or dying trees are more frequently colonised, and their physiological condition affects both resource availability and the intensity of interspecific competition [38]. In addition to structural and physiological factors, flight phenology plays a significant role in shaping niche breadth. The early emergence of images can provide a competitive advantage by allowing for rapid colonisation of preferred microhabitats. For example, the early spring flight of T. piniperda facilitates the successful colonisation of stems within the species’ optimal bark thickness range, thereby enhancing reproductive success [36]. Moreover, interspecific differences in spring emergence timing, developmental rates, and the number of annual generations appear to reduce—but not entirely eliminate—competition for phloem resources [37].

4.3. Application in the Analysis of T. piniperda Population Density

In the context of climate change, there may be a significant increase in the breeding base of T. piniperda, caused by, among other things, a decline in tree health and wind damage [3,4,5]. This phenomenon poses new challenges for forest protection against this species. However, the problem of interference with the forest ecosystem is very complex and raises many questions, including the following: Is active protection necessary? What will be the positive and negative effects of gradation? The discussion of these topics is complex and always requires consideration of the specific characteristics of a given forest stand. It should be emphasised that any analysis or discussion only makes sense if the dynamics of T. piniperda abundance in a given stand are known. Knowledge of this bark beetle’s population size is the basis for assessing its economic importance and determining its biological role in the forest ecosystem. The niche breadth, calculated using the developed model, can be used as an independent variable when constructing a population size model [25,41]. This will increase its precision, as it provides spatial and qualitative information that standard population models often overlook. While traditional abundance models are based on averaged trunk colonisation conditions, the niche model provides detailed information on the actual distribution of colonisation on trunk surfaces.

5. Conclusions

Due to the important role of T. piniperda in forest ecosystems, it is necessary to have effective methods for estimating its population; however, methods for the precise estimation of bark beetle niches on breeding material, based on statistical principles, have not yet been developed. The fast and accurate evaluation of niche breadths would facilitate the tracking of the response of bark beetles to changing climatic conditions.
The niche breadth of T. piniperda depends on the length of stems with a bark thickness greater than 4 mm and on the density of T. piniperda galleries on the 11th unit of the stem (model I) or on the upper section of this unit (model II). The method of population estimation is not significantly invasive, since it requires bark removal only from one stem unit or section. This, combined with the option to use windfalls, allows this method to be used even in strictly protected areas.
The method presented in this paper should be tested on a larger sample, then calibrated and adapted to local environmental conditions. A future goal should be the development of global models, e.g., those applicable across forest types, regions, or species, and local models for use in specific stands.

Supplementary Materials

The following supporting information can be downloaded at: https://www.mdpi.com/article/10.3390/su17177744/s1, Results of dendrometric measurements and entomological analyses on trap trees (Microsoft Excel).

Funding

This study was funded by The Ministry of Science and Higher Education in Poland (grant number PZP/2025/0466–SUPB.RN.25.226).

Institutional Review Board Statement

Not applicable.

Informed Consent Statement

Not applicable.

Data Availability Statement

The original contributions presented in this study are included in the article/Supplementary Materials. Further inquiries can be directed to the corresponding author.

Acknowledgments

The author would like to thank Karol Zubek and the workers of the Zagnańsk and Suchedniów Forest Districts for assistance in carrying out the research.

Conflicts of Interest

The author declares no conflicts of interest.

References

  1. The Intergovernmental Panel on Climate Change. Summary for Policymakers. In Global Warming of 1.5 °C. An IPCC Special Report on the Impacts of Global Warming of 1.5 °C Above Pre-Industrial Levels and Related Global Greenhouse Gas Emission Pathways, in the Context of Strengthening the Global Response to the Threat of Climate Change, Sustainable Development, and Efforts to Eradicate Poverty; Masson-Delmotte, V., Zhai, P., Pörtner, H.-O., Roberts, D., Skea, J., Shukla, P.R., Pirani, A., Moufouma-Okia, W., Péan, C., Pidcock, R., et al., Eds.; Cambridge University Press: Cambridge, UK; New York, NY, USA, 2018; pp. 3–24. [Google Scholar] [CrossRef]
  2. Rissanen, K.; Hölttä, T.; Bäck, J.; Rigling, A.; Wermelinger, B.; Gessler, A. Drought effects on carbon allocation to resin defences and on resin dynamics in old-grown Scots pine. Environ. Exp. Bot. 2021, 185, 104410. [Google Scholar] [CrossRef]
  3. McDowell, N.G.; Sapes, G.; Pivovaroff, A.L.; Adams, H.D. Mechanisms of woody-plant mortality under rising drought, CO2 and vapour pressure deficit. Nat. Rev. Earth Environ. 2022, 3, 294–308. [Google Scholar] [CrossRef]
  4. Patacca, M.; Lindner, M.; Lucas-Borja, M.E.; Cordonnier, T.; Fidej, G.; Gardiner, B.; Hauf, Y.; Jasinevičius, G.; Labonne, S.; Linkevičius, E.; et al. Significant increase in natural disturbance impacts on European forests since 1950. Glob. Change Biol. 2023, 29, 1359–1376. [Google Scholar] [CrossRef] [PubMed]
  5. Jaime, L.; Batllori, E.; Lloret, F. Bark beetle outbreaks in coniferous forests: A review of climate change effects. Eur. J. For. Res. 2023, 143, 1–17. [Google Scholar] [CrossRef]
  6. Georgiev, G.; Georgieva, M.; Dimitrov, S.; Iliev, M.; Trenkin, V.; Mirchev, P.; Belilov, S. Remote sensing assessment of the expansion of Ips typographus attacks in the Chuprene Reserve, Western Balkan Range. Forests 2022, 13, 39. [Google Scholar] [CrossRef]
  7. Marini, L.; Økland, B.; Jönsson, A.M.; Bentz, B.; Carroll, A.; Forster, B.; Grégoire, J.C.; Hurling, R.; Nageleisen, L.M.; Netherer, S.; et al. Climate drivers of bark beetle outbreak dynamics in Norway spruce forests. Ecography 2017, 40, 1426–1435. [Google Scholar] [CrossRef]
  8. Cullingham, C.I.; Cooke, J.E.K.; Dang, S.; Davis, C.S.; Cooke, B.J.; Coltman, D.W. Mountain pine beetle host-range expansion threatens the boreal forest. Mol. Ecol. 2011, 20, 2157–2171. [Google Scholar] [CrossRef]
  9. Biedermann, P.H.W.; Müller, J.; Grégoire, J.C.; Gruppe, A.; Hagge, J.; Hammerbacher, A.; Hofstetter, R.W.; Kandasamy, D.; Kolarik, M.; Kostovcik, M.; et al. Bark Beetle Population Dynamics in the Anthropocene: Challenges and Solutions. Trends Ecol. Evol. 2019, 34, 914–924. [Google Scholar] [CrossRef]
  10. Sexton, J.P.; Montiel, J.; Shay, J.E.; Stephens, M.R.; Slatyer, R.A. Evolution of ecological niche breadth. Ann. Rev. Ecol. Evol. Syst. 2017, 48, 183–206. [Google Scholar] [CrossRef]
  11. Krebs, C.J. (Ed.) Niche measures and resource preferences. In Ecological Methodology; Harper & Row: New York, NY, USA, 2014; pp. 597–653. [Google Scholar]
  12. Niemelä, J. Biodiversity monitoring for decision-making. Ann. Zool. Fen. 2000, 37, 307–317. [Google Scholar]
  13. Ankeny, R.A.; Leonelli, S. Model Organisms, 1st ed.; Cambridge University Press: Cambridge, UK, 2020; pp. 1–83. [Google Scholar] [CrossRef]
  14. Raffa, K.F.; Grégoire, J.C.; Lindgren, B.S. Natural history and ecology of bark beetles. In Bark Beetles: Biology and Ecology of Native and Invasive Species; Vega, F.E., Hofstetter, R.W., Eds.; Elsevier Academic Press: Amsterdam, The Netherlands, 2015; pp. 1–40. [Google Scholar] [CrossRef]
  15. Schelhaas, M.J.; Nabuurs, G.J.; Schuck, A. Natural disturbances in the European forests in the 19th and 20th centuries. Glob. Change Biol. 2003, 9, 1620–1633. [Google Scholar] [CrossRef]
  16. Jaramillo, J.; Muchugu, E.; Vega, F.E.; Davis, A.; Borgemeister, C.; Chabi-Olaye, A. Some like it hot: The influence and implications of climate change on coffee berry borer (Hypothenemus hampei) and coffee production in East Africa. PLoS ONE 2011, 6, e24528. [Google Scholar] [CrossRef]
  17. Meddens, A.J.; Hicke, J.A.; Ferguson, C.A. Spatiotemporal patterns of observed bark beetle-caused tree mortality in British Columbia and the western United States. Ecol. Appl. 2012, 22, 1876–1891. [Google Scholar] [CrossRef] [PubMed]
  18. Thom, D.; Seidl, R.; Steyrer, G.; Krehan, H.; Formayer, H. Slow and fast drivers of the natural disturbance regime in Central European forest ecosystems. For. Ecol. Manag. 2013, 307, 293–302. [Google Scholar] [CrossRef]
  19. Lieutier, F.; Långström, B.; Faccoli, M. The Genus Tomicus. In Bark Beetles: Biology and Ecology of Native and Invasive Species; Vega, F.E., Hofstetter, R.W., Eds.; Elsevier Academic Press: Amsterdam, The Netherlands, 2015; pp. 371–426. [Google Scholar]
  20. Ritzerow, S.; Konrad, H.; Stauffer, C. Phylogeography of the Eurasian pine shoot beetle Tomicus piniperda L. (Coleoptera, Scolytidae). Eur. J. Entomol. 2004, 101, 13–19. [Google Scholar] [CrossRef]
  21. Haack, R.A.; Kucera, D. New Introduction-Common Pine Shoot Beetle, Tomicus piniperda L.; Pest Alert NATP-05-93; U.S.D.A. Forest Service, Northeastern Area: Milwaukee, WI, USA, 1993; pp. 1–2. [Google Scholar]
  22. Eager, T.A.; Berisford, C.W.; Dalusky, M.J.; Nielsen, D.G.; Brewer, J.W.; Hilty, S.J.; Haack, R.A. Suitability of some southern and western pines as hosts for the pine shoot beetle, Tomicus piniperda (Coleoptera: Scolytidae). J. Econ. Entomol. 2004, 97, 460–467. [Google Scholar] [CrossRef]
  23. Humble, L.M.; Allen, E.A. Forest biosecurity: Alien invasive species and vectored organisms. Can. J. Plant Pathol. 2006, 28, 256–269. [Google Scholar] [CrossRef]
  24. Kirkendall, L.R.; Faccoli, M.; Ye, H. Description of the Yunnan shoot borer, Tomicus yunnanensis Kirkendall & Faccoli sp. n. (Curculionidae, Scolytinae), an unusually aggressive pine shoot beetle from southern China, with a key to the species of Tomicus. Zootaxa 2008, 1819, 25–39. [Google Scholar] [CrossRef]
  25. Borkowski, A. Regression equations for estimating populations of Tomicus piniperda (L.) on Scots pine (Pinus sylvestris L.). For. Ecol. Manag. 2019, 453, 117578. [Google Scholar] [CrossRef]
  26. Zubek, K.; Czerwik-Marcinkowska, J.; Borkowski, A. A non-invasive method of estimating populations of Tomicus piniperda on Scots pine (Pinus sylvestris L.). Insects 2022, 13, 1071. [Google Scholar] [CrossRef]
  27. Öhrn, P. Seasonal Flight Patterns of the Spruce Bark Beetle (Ips typographus) in Sweden. Phenology, Voltininsm and Development. Bachelor’s Thesis, Swedish University of Agricultural Sciences, Uppsala, Sweden, 2012. [Google Scholar]
  28. Dobbertin, M.; Wermelinger, B.; Bigler, C.; Bürgi, M.; Carron, M.; Forster, B.; Gimmi, U.; Rigling, A. Linking increasing drought stress to Scots pine mortality and bark beetle infestations. Sci. World J. 2007, 7, 231–239. [Google Scholar] [CrossRef]
  29. Wermelinger, B.; Rigling, A.; Schneider Mathis, D.; Dobbertin, M. Assessing the role of bark- and wood-boring insects in the decline of Scots pine (Pinus sylvestris) in the Swiss Rhone valley. Ecol. Entomol. 2008, 33, 239–249. [Google Scholar] [CrossRef]
  30. Rankin, L.J.; Borden, J.H. Competitive interactions between the mountain pine beetle and the pine engraver in lodgepole pine. Can. J. For. Res. 1991, 21, 1029–1036. [Google Scholar] [CrossRef]
  31. Flechtmann, C.A.H.; Dalusky, M.J.; Berisford, C.W. Bark and ambrosia beetle (Coleoptera: Scolytidae) responses to volatiles from aging loblolly pine billets. Environ. Entomol. 1999, 28, 638–648. [Google Scholar] [CrossRef]
  32. Saint-Germain, M.; Drapeau, P.; Buddle, C.M. Landing patterns of phloem- and wood-feeding Coleoptera on Black spruce of different physiological and decay states. Environ. Entomol. 2009, 38, 797–802. [Google Scholar] [CrossRef] [PubMed]
  33. Carscadden, K.A.; Emery, N.C.; Arnillas, C.A.; Cadotte, M.W. Niche breadth: Causes and consequences for ecology, evolution, and conservation. Quart. Rev. Biol. 2020, 95, 179–214. [Google Scholar] [CrossRef]
  34. Paine, T.D.; Birch, M.C.; Švihra, P. Niche breadth and resource partitioning by four sympatric species of bark beetles (Coleoptera: Scolytidae). Oecologia 1981, 48, 1–6. [Google Scholar] [CrossRef]
  35. Grünwald, M. Ecological segregation of bark beetles (Coleoptera, Scolytidae) of spruce. Zeit. Angew. Entomol. 1986, 101, 176–187. [Google Scholar] [CrossRef]
  36. Amezaga, I.; Rodríguez, M.A. Resource partitioning of four sympatric bark beetles depending on swarming dates and tree species. For. Ecol. Manag. 1998, 109, 127–135. [Google Scholar] [CrossRef]
  37. Ayres, B.D.; Ayres, M.P.; Abrahamson, M.D.; Teale, S.A. Resource partitioning and overlap in three sympatric species of Ips bark beetles (Coleoptera: Scolytidae). Oecologia 2001, 128, 443–453. [Google Scholar] [CrossRef]
  38. Wallin, K.F.; Kolb, T.E.; Skov, K.R.; Wagner, M. Forest management treatments, tree resistance, and bark beetle resource utilization in ponderosa pine forests of northern Arizona. For. Ecol. Manag. 2008, 255, 3263–3269. [Google Scholar] [CrossRef]
  39. Borkowski, A.; Skrzecz, I. Ecological segregation of bark beetles (Col., Curculionidae, Scolytinae) in Scots pine. Ecol. Res. 2016, 31, 135–144. [Google Scholar] [CrossRef]
  40. Borkowski, A. Resource partitioning of Scots pine by pine shoot beetles in stands under conditions of stress. Forests 2021, 12, 1336. [Google Scholar] [CrossRef]
  41. Bentz, B.J.; Jönsson, A.M. Modeling bark beetle responses to climate change. In Bark Beetles. Biology and Ecology of Native and Invasive Species; Vega, F.E., Hofstetter, R.W., Eds.; Elsevier Academic Press: San Diego, CA, USA, 2015; pp. 533–553. [Google Scholar]
  42. Pureswaran, D.S.; Meurisse, N.; Rassati, D.; Liebhold, A.M.; Faccoli, M. Climate change and invasions by nonnative bark and ambrosia beetles. In Bark Beetle Management Ecology, and Climate Change; Hofstetter, R.W., Gandhi, K.J.K., Eds.; Academic Press: London, UK, 2022; pp. 3–30. [Google Scholar] [CrossRef]
  43. Grodzki, B.W.; Jakus, R.; Gazda, M. Patterns of bark beetle occurrence in Norway spruce stands of national parks in Tatra Mts. in Poland and Slovakia. J. Pest Sci. 2003, 76, 78–82. [Google Scholar] [CrossRef]
  44. Kärvemo, S.; van Boeckel, T.P.; Gilbert, M.; Grégoire, J.C.; Schroeder, M. Large-scale risk map ping of an eruptive bark beetle–Importance of forest susceptibility and beetle pressure. For. Ecol. Manag. 2014, 318, 158–166. [Google Scholar] [CrossRef]
  45. Pasztor, F.; Matulla, C.; Rammer, W.; Lexer, M.J. Drivers of the bark beetle disturbance regime In Alpine forests in Austria. For. Ecol. Manag. 2014, 318, 349–358. [Google Scholar] [CrossRef]
  46. Olszewski, J.L.; Szałach, G.; Żarnowiecki, G. Klimat. In Monografia Świętokrzyskiego Parku Narodowego; Cieśliński, S., Kowalkowski, A., Eds.; ŚPN Bodzentyn: Kraków, Poland, 2000; pp. 129–145. [Google Scholar]
  47. Grégoire, J.C.; Evans, H.F. Damage and control of BAWBILT organisms an overview. In Bark and Wood Boring Insects in Living Trees in Europe, a Synthesis; Lieutier, F., Day, K.R., Battisti, A., Grégoire, J.C., Evans, H.F., Eds.; Springer: Dordrecht, The Netherlands, 2004; pp. 19–39. [Google Scholar]
  48. Levins, R. Evolution in Changing Environments, 1st ed.; Princeton University Press: Princeton, NJ, USA, 1968; 132p. [Google Scholar]
  49. Hurlbert, S.H. The measurement of niche overlap and some relatives. Ecology 1978, 59, 67–77. [Google Scholar] [CrossRef]
  50. Bolnick, D.I.; Yang, L.H.; Fordyce, J.A.; Davis, J.M.; Svanbäck, R. Measuring individual-level resource specialization. Ecology 2002, 83, 2936–2941. [Google Scholar] [CrossRef]
  51. Hutchinson, G.E. Homage to Santa Rosalia, or why are there so many kinds of Animals? Am. Nat. 1959, 93, 145–159. [Google Scholar] [CrossRef]
  52. TIBCO Software Inc. Statistica, version 13.3 (Data Analysis Software System); TIBCO Software Inc.: Tulsa, OK, USA, 2021. [Google Scholar]
  53. Sokal, R.R.; Rohlf, F.J. Biometry: The Principles and Practice of Statistics in Biological Research, 4th ed.; W.H. Freeman and Company: New York, NY, USA, 2013; 915p. [Google Scholar]
  54. Anderson, V.L.; McLean, R.A. Design of Experiments: A Realistic Approach; Taylor & Francis: London, UK, 2019; p. 440. [Google Scholar] [CrossRef]
  55. Kleinbaum, D.G.; Nizam, A.; Rosenberg, E. Applied Regression Analysis and Other Multi-Variable Methods, 5th ed.; Cengage Learning: Boston, MA, USA, 2013; 1072p. [Google Scholar]
  56. Kozak, A.; Kozak, R. Does cross validation provide additional information in the evaluation of regression models? Can. J. For. Res. 2003, 33, 976–987. [Google Scholar] [CrossRef]
  57. Chatterjee, S.; Hadi, A.S. Regression Analysis by Example, 5th ed.; Wiley: Hoboken, NJ, USA, 2012; 389p. [Google Scholar] [CrossRef]
  58. White, H. A heteroskedasticity-consistent covariance matrix estimator and a direct test for heteroskedasticity. Econometrica 1980, 48, 817–838. [Google Scholar] [CrossRef]
  59. Thompson, S.K. Sampling, 3rd ed.; Wiley: New York, NY, USA, 2012; 472p. [Google Scholar]
  60. Barak, A.V.; McGrevy, D.; Tokaya, G. Dispersal and re-capture of marked, overwintering Tomicus piniperda (L.) (Coleoptera: Scolytidae) from Scotch pine bolts. Great Lakes Entomol. 2000, 33, 69–80. [Google Scholar] [CrossRef]
  61. Tetko, I.V.; Livingstone, D.J.; Luik, A.I. Neural network studies. 1. Comparison of Overfitting and Overtraining. J. Chem. Inf. Comput. Sci. 1995, 35, 826–833. [Google Scholar] [CrossRef]
  62. Saarenmaa, H. Modeling the spatial pattern and intraspecific competition in Tomicus piniperda (Coleoptera: Scolytidae). In Communicationes Instituti Forestalis Fenniae (Finland); Finnish Forest Research Institute: Helsinki, Finland, 1983; pp. 1–40. ISBN 951-40-0634-8. [Google Scholar]
  63. Långström, B. Distribution and production of Tomicus piniperda in pine wood stacks. Sver. Skogsv. Tidsk. 1984, 1, 23–35. [Google Scholar]
  64. Bouhot, L.; Lieutier, F.; Debouzie, D. Spatial and temporal distribution of attacks by Tomicus piniperda L. and Ips sexdentatus Boern. (Col., Scolytidae) on Pinus sylvestris. J. Appl. Entomol. 1988, 106, 356–371. [Google Scholar] [CrossRef]
  65. Jamin, J.K. Contribution à L’étude du Dépérissement Provoqué par les Coléoptères Scolytides sur le Pin Sylvestre en Région Centre; Ecole Nationale des Ingénieurs des Travaux des Eaux et Forêts: Nogent-sur-Vernisson, France, 1977; pp. 1–90. [Google Scholar]
  66. Price, P.W. Insect Ecology, 3rd ed.; Wiley: New York, NY, USA, 1997; 868p. [Google Scholar]
  67. Mayers, C.G.; McNew, D.L.; Harrington, T.C.; Roeper, R.A.; Fraedrich, S.W.; Biedermann, P.H.W.; Castrillo, L.A.; Reed, S.E. Three genera in the Ceratocystidaceae are the respective symbionts of three independent lineages of ambrosia beetles with large, complex mycangia. Fung. Biol. 2015, 19, 1075–1092. [Google Scholar] [CrossRef]
  68. Långström, B.; Hellqvist, C. Pinus contorta as a potential host for Tomicus piniperda L. and T. minor (Hart.) (Col., Scolytidae) in Sweden. Zeitsch. Angew. Entomol. 1985, 99, 174–181. [Google Scholar] [CrossRef]
  69. Niemeyer, H.; Watzek, G.; Lu, N.; Niu, J. Freilandtest zur Attraktivitat von Monoterpenen und Ethanol fur den Borkenkäfer Tomicus piniperda L. (Col., Scolytidae). J. Appl. Entomol. 1996, 120, 265–267. [Google Scholar] [CrossRef]
  70. Poland, T.M.; Groot, P.; Burke, S.; Wakarchuk, D.; Haack, R.A.; Nott, R.; Scarr, T. Development of an improved attractive lure for the pine shoot beetle, Tomicus piniperda (Coleoptera: Scolytidae). Agric. For. Entomol. 2003, 5, 293–300. [Google Scholar] [CrossRef]
  71. Rudinsky, J.A.; Ryker, L.C. Sound production in Scolytidae: Rivalry and premating stridulation of male Douglas-fir beetle. J. Insect Physiol. 1976, 22, 997–1003. [Google Scholar] [CrossRef]
  72. Nilssen, A.C. Spatial attack pattern of the bark beetle Tomicus piniperda L. (Coleoptera: Scolytidae). Norweg. J. Entomol. 1978, 25, 171–175. [Google Scholar]
  73. Långström, B. Windthrown Scots pines as brood material for Tomicus piniperda and T. minor. Silva Fen. 1984, 18, 187–198. [Google Scholar] [CrossRef]
  74. Gilbert, M.; Nageleisen, L.M.; Franklin, A.; Grégoire, J.C. Post storm surveys reveal large-scale spatial patterns and influences of site factors, forest structure and diversity in endemic bark-beetle populations. Lands Ecol. 2005, 20, 35–49. [Google Scholar] [CrossRef]
  75. Komonen, A.; Laatikainen, A.; Similä, M.; Martikainen, P. Ytimennävertäjien kasvainsyönti trombin kaataman suojelumännikön ympäristössä Höytiäisen saaressa Pohjois-Karjalassa. Mets. Aikak. 2009, 2, 127–134. [Google Scholar] [CrossRef]
  76. Öhrn, P.; Björklund, N.; Långström, B. Occurrence, performance and shoot damage of Tomicus piniperda in pine stands in southern Sweden after storm-felling. J. Appl. Entomol. 2018, 142, 854–861. [Google Scholar] [CrossRef]
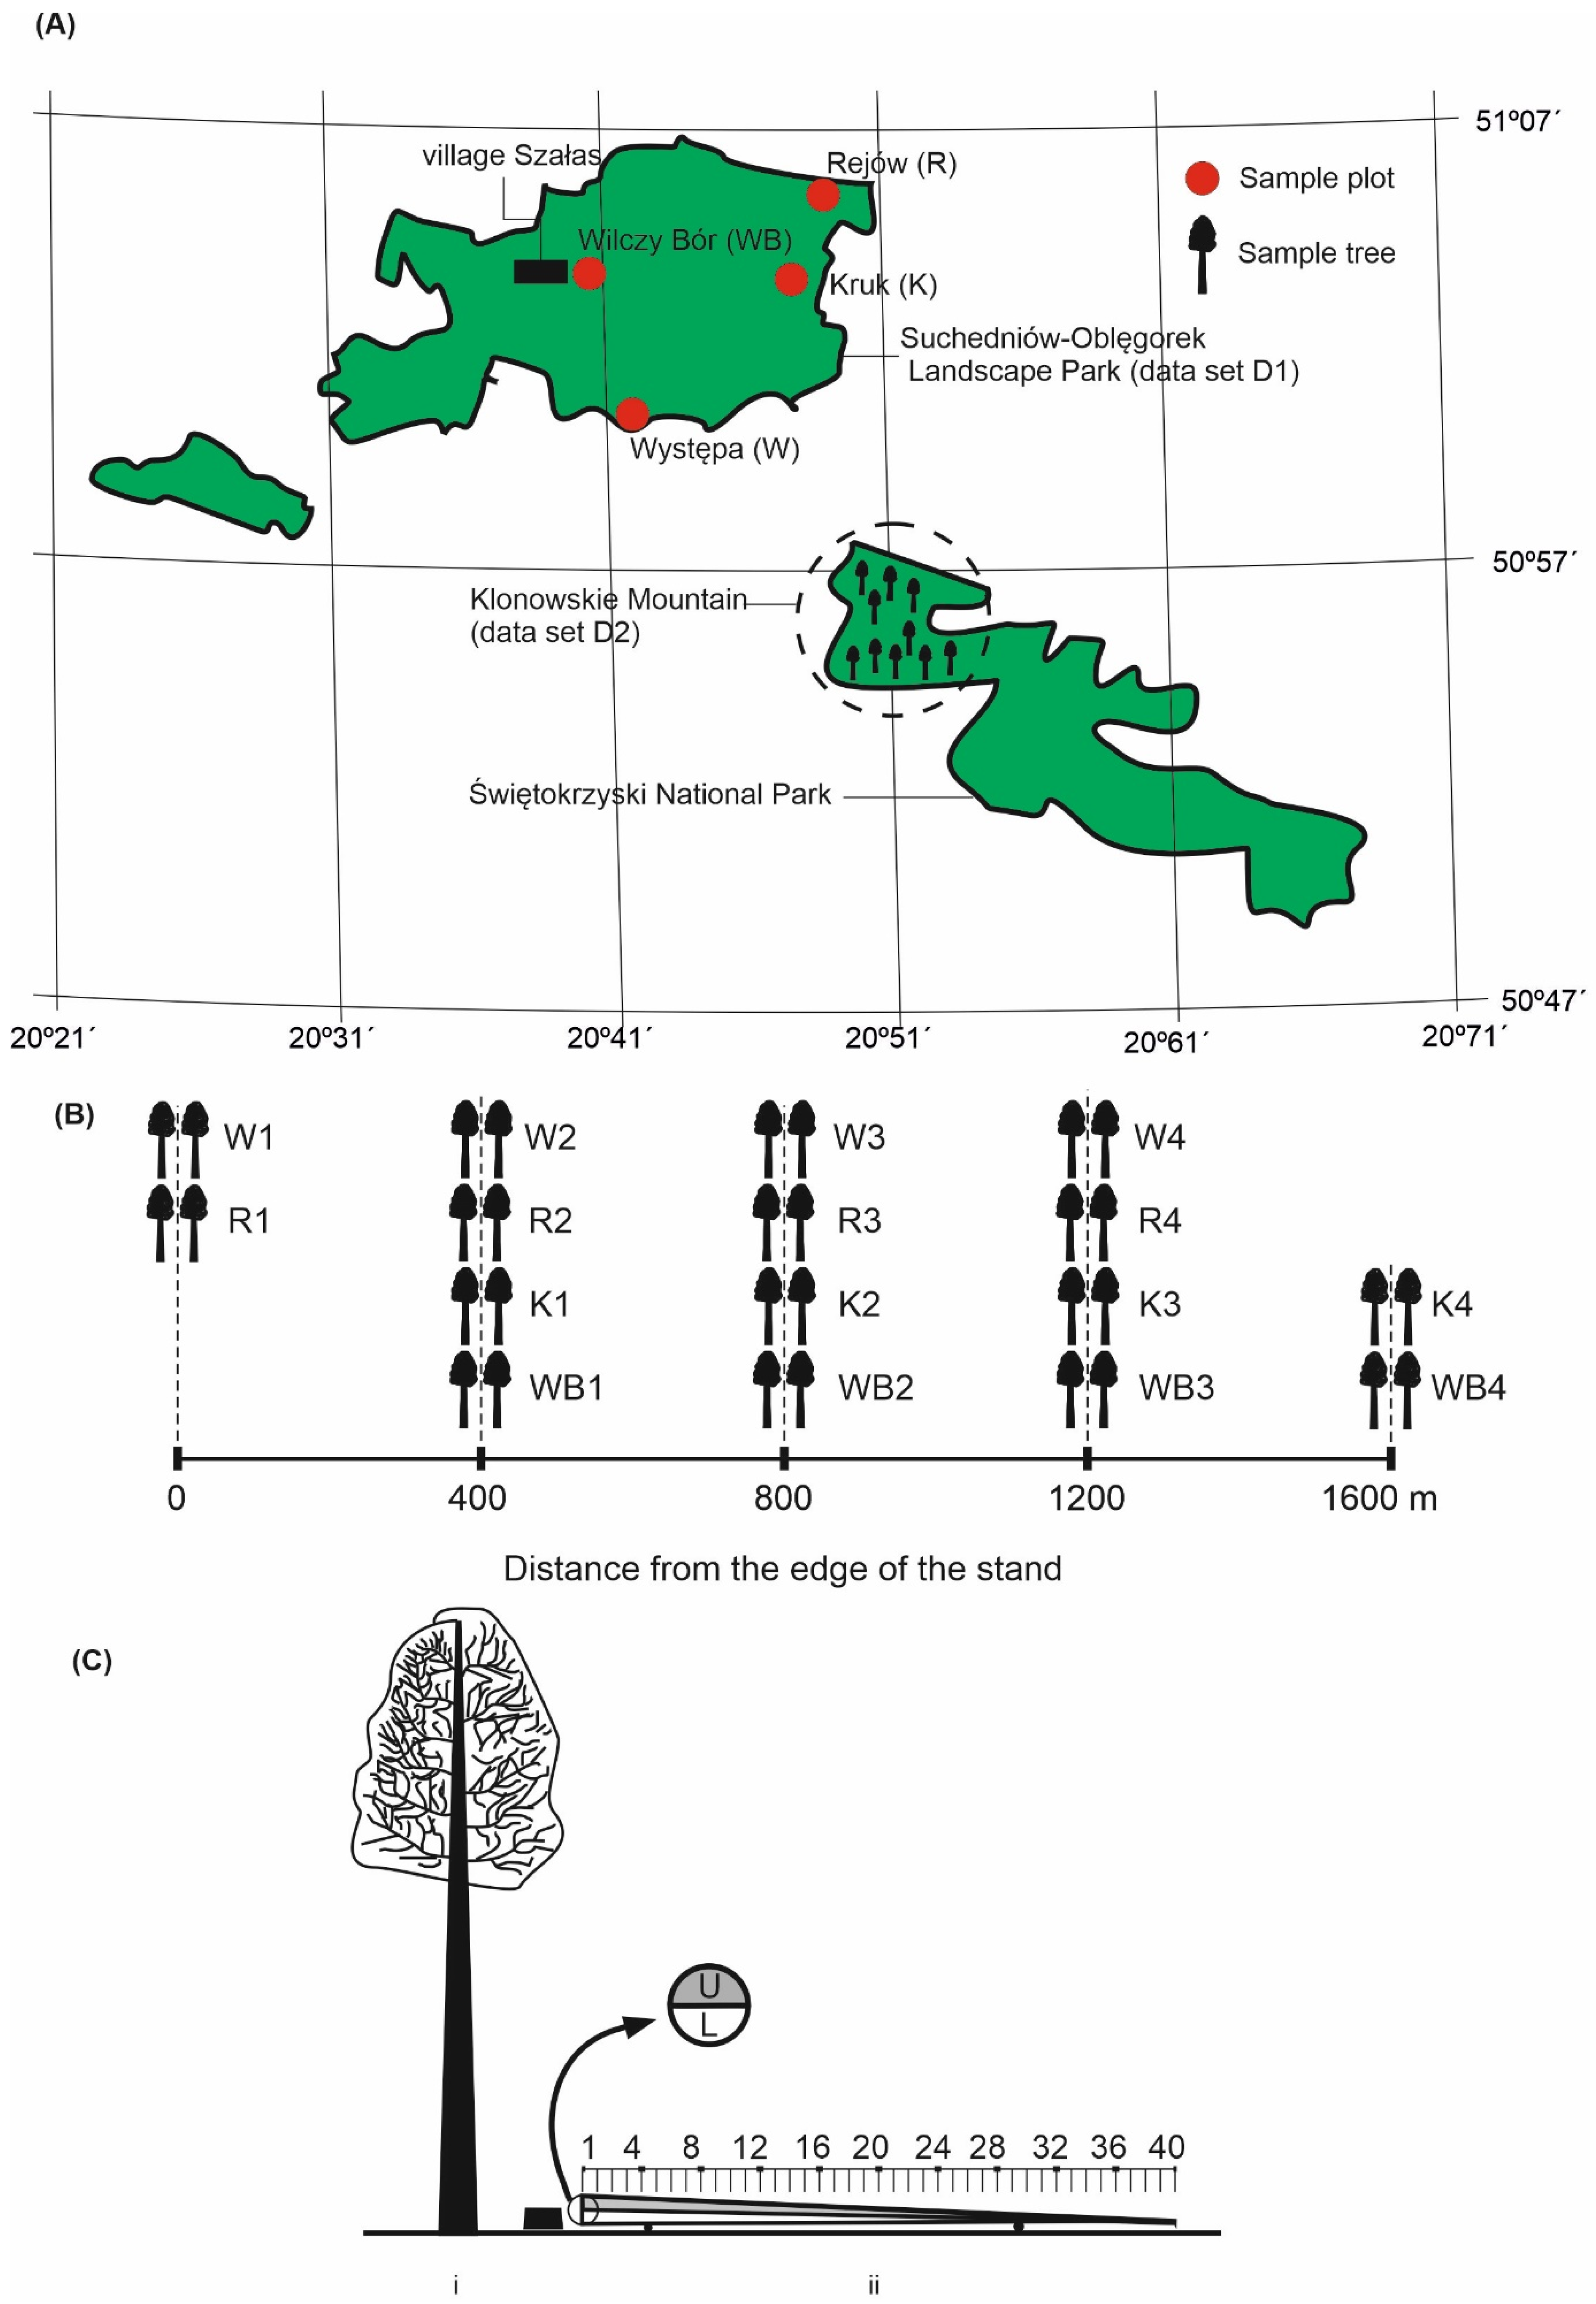
Figure 1. (A) Location of the study area. (B) Location of sample trees in the subdistricts Występa (W1–4), Rejów (R1–4), Kruk (K1–4), and Wilczy Bór (WB1–4). (C) Healthy pine (i) used as a trap tree (ii); letters U and L indicate the upper and lower sections of the trap tree, respectively. Numbers 1, 2, …, 40 indicate stem units.
Sustainability 17 07744 g001
Figure 2. General view of the tree stand and geographical coordinates in the Występa 50°58′53″ N, 20°40′49″ E (A); Rejów 51°04′32″ N, 20°49′01″ E (B); Kruk 51°03′14″ N, 20°48′01″ E (C); and Wilczy Bór 51°03′09″ N, 20°40′24″ E (D) forest subdistricts.
Sustainability 17 07744 g002
Figure 3. An example of measuring the bark thickness of a sample tree was taken at tree breast height. An electronic depth gauge was placed in the hole made with a wood hole saw and the thickness of the bark was measured. The bark thickness value obtained was 29.65 mm.
Sustainability 17 07744 g003
Figure 4. (A) A trap tree laid out on supports. Yellow lines indicate the boundaries of 2.5% stem units; (a) length of a single 2.5% stem unit. The upper and lower parts of the stem (upper and lower sections) were delineated using a white string stretched between nails. (B) Method for determining the midpoint of the stem’s transverse axis.
Sustainability 17 07744 g004
Figure 5. Species of bark beetles identified on trap trees based on galleries. (A) Tomicus piniperda: a—nuptial chamber, b—egg gallery; (B) Tomicus minor: a—nuptial chamber, b, c—shorter and longer arms of the egg gallery, respectively; (C) The arrows indicate holes made by Trypodendron lineatum; (D) Pityogenes bidentatus: a—nuptial chamber, b—egg gallery.
Sustainability 17 07744 g005
Figure 6. Density of Tomicus piniperda galleries on trap trees (Dataset D1). (A) Mean density of galleries for the successive 2.5% stem length unit; a, b, c, d means marked with different letters indicate that they are statistically significant (Kruskal–Wallis test, p < 0.05), (B) real (broken line) and smothed (solid line) distribution of gallery density for the successive bark thickness classes.
Sustainability 17 07744 g006
Figure 7. Mean density of Tomicus minor galleries for the successive 2.5% stem length unit; a, b, c means marked with different letters indicate that they are statistically significant (Kruskal–Wallis test, p < 0.05—Dataset D1).
Sustainability 17 07744 g007
Figure 8. Mean density of bark beetle galleries for the successive 2.5% stem length unit. W–Występa subdistrict, R—Rejów subdistrict; numbers 1–4—plot number in forest subdistrict; ttc, ttn—trees with the largest and smallest diameter in the plot, respectively. Psi—calculated proportional similarity index value. Segregation of niches was assumed to occur when Psi was lower than 0.7.
Sustainability 17 07744 g008
Figure 9. Relationships between Tomicus piniperda niche breadth and stem length with bark thickness greater than 4 mm (l>4) and (A) infestation density on the 11th unit du11 and (B) on the 11th upper section dhu11. Scatterplot with the least-squares fitted plane (A) for model I and (B) for model II (Dataset D1).
Sustainability 17 07744 g009
Figure 10. Residual analysis. (A1,A2) Evaluation of the consistency of the model residual distribution with the normal distribution; Shapiro–Wilk test (A1) model I and (A2) model II. (B1,B2) Estimation of the stability variance of model residuals; White’s test (B1) model I and (B2) model II (Dataset D1).
Sustainability 17 07744 g010
Table 1. Location and characteristics of trap trees (Dataset D1).
Forest
Subdistrict
Distance a
(m)
Trap Tree Code bLength
(m)
Diameter c
(cm)
DBH d
(cm)
Thickness of the dbh Bark
(mm)
Występa (W)0W1ttc22.031.7527.0019.01
W1ttn17.027.2520.2514.94
400W2ttc26.242.7539.7532.98
W2ttn21.630.7522.7521.89
800W3ttc29.055.5043.0026.41
W3ttn22.631.0026.5016.63
1200W4ttc26.033.5028.5019.71
W4ttn22.827.7522.2517.18
Rejów (R)0R1ttc23.230.7525.0022.80
R1ttn19.220.7517.7511.22
400R2ttc29.651.7545.2521.31
R2ttn25.623.7521.0013.07
800R3ttc28.052.0045.5028.37
R3ttn24.831.2527.0016.14
1200R4ttc27.235.2530.2518.01
R4ttn21.226.2521.758.71
Wilczy Bór (WB)400WB1ttc25.635.2532.2519.05
WB1ttn22.026.2520.7510.97
800WB2ttc27.648.5041.7521.97
WB2ttn24.432.5024.5017.64
1200WB3ttc28.457.0049.2520.95
WB3ttn22.830.2525.5017.12
1600WB4ttc24.833.7530.7519.34
WB4ttn24.027.0023.7519.47
Kruk (K)400K1ttc30.455.7551.2540.72
K1ttn26.433.2530.7518.57
800K2ttc29.547.0040.2528.51
K2ttn25.540.0033.7518.21
1200K3ttc31.267.0053.0020.88
K3ttn26.840.0034.0021.78
1600K4ttc27.660.0047.2538.97
K4ttn22.029.5024.5015.41
a distance from the edge of the stand. b numbers 1–4—plot number in forest subdistrict; ttc, ttn—trees with the largest and smallest diameters in the plot, respectively. c stem diameter outside bark at thicker end. d stem diameter at breast height.
Table 2. Characteristics of windfalls (Dataset D2).
Windfall
No.
Length
(m)
Diameter Outsider Bark
at Thicker End
(cm)
Diameter at
Breast Height
(cm)
Thickness of
the dbh Bark
(mm)
127.948.2539.2524.38
230.252.2543.7524.96
323.528.7523.2510.01
426.133.7529.2518.42
525.131.2525.2516.58
630.155.2546.5023.15
725.632.2529.5020.01
825.128.5025.5019.68
928.945.2537.7529.64
1029.558.7546.7535.82
Table 3. Parameters and basic statistics for Equations (11) and (12) (Dataset D1).
No.
Equation
Name of
Variable
Value of
Parameter
SEValue
t-Statistics
pVIFRR2adjRMSEANOVA
F Valuep Level
11Intercept0.09530.01426.7071<0.001
l>40.01470.00216.9233<0.0011.450.92950.85460.027692.113<0.001
du110.00180.00035.8524<0.001
12Intercept0.08850.01545.7544<0.001
l>40.01650.00227.5117<0.0011.290.91480.82570.030274.405<0.001
dhu110.00150.00034.8729<0.001
l>4—the length of the stem unit with bark thickness greater than 4 mm; du11, dhu11—density of T. piniperda galleries on the 11th unit du11 (Equation (11)) and on the 11th upper section dhu11 (Equation (12)) of the stem, respectively; SE—standard error; VIF—variance inflation factor; R—coefficient of correlation; R2adj—adjusted R-squared; RMSE—root mean square error.
Table 4. Example application of the method to compare observed ( B o ) and predicted ( B p ) niche breadth of Tomicus piniperda on stems. The relative error was computed for each stem, and for the sample, the t-test was used (Dataset D2).
Tree No. B o l>4 aEquation (11) bEquation (12) c
du11 d B p Relative
Error (%)
dhu11 e B p Relative
Error (%)
10.2969.3627.340.2824.7320.600.2747.52
20.2487.4037.640.2729.7835.290.2646.43
30.2175.1217.350.2026.9616.850.1988.59
40.1915.7611.690.2015.0311.450.2014.87
50.2447.4016.180.2334.3916.930.2363.24
60.2528.0420.460.2500.8017.320.2472.06
70.2027.4010.230.22210.409.450.22511.54
80.2558.5314.540.2473.2816.590.2540.43
90.1866.905.730.20711.300.000.2028.78
100.3459.3687.190.39012.9993.010.38210.84
Mean ± SD0.244 ± 0.05 0.251 ± 0.06 0.248 ± 0.05
t-test t = −0.2974, p = 0.7696t = −0.2034, p = 0.8411
a length of stem with bark thickness greater than 4 mm. b,c for forms of linear equations, refer to Materials and Methods. d density galleries on the 11th unit. e density galleries on the 11th upper section.
Disclaimer/Publisher’s Note: The statements, opinions and data contained in all publications are solely those of the individual author(s) and contributor(s) and not of MDPI and/or the editor(s). MDPI and/or the editor(s) disclaim responsibility for any injury to people or property resulting from any ideas, methods, instructions or products referred to in the content.