Research on Cage Layout Mode Based on Numerical Simulation of Flow Field Disturbance Response and Suspended Particulate Matter Diffusion: A Case Study of the Nanpeng Island Wind Power Sea Area in Yangjiang City, China
Abstract
1. Introduction
2. Methodology
2.1. Research Sea Area
- Point A: 112.167° E, 21.468° N;
- Point B: 112.167° E, 21.353° N;
- Point C: 112.255° E, 21.376° N.
2.2. Current Velocity Selection
2.3. Mathematical Model
- (1)
- The standard k-epsilon model
- (2)
- Discrete Phase Model (DPM)
- (3)
- MIKE 21 particle dispersion model
2.4. Model Setting
- (1)
- Porous media model
- (a)
- Fish drag coefficient
- (b)
- Net coats drag coefficients
- (c)
- Resistance parameter of raft-rack shellfish aquaculture:
- (d)
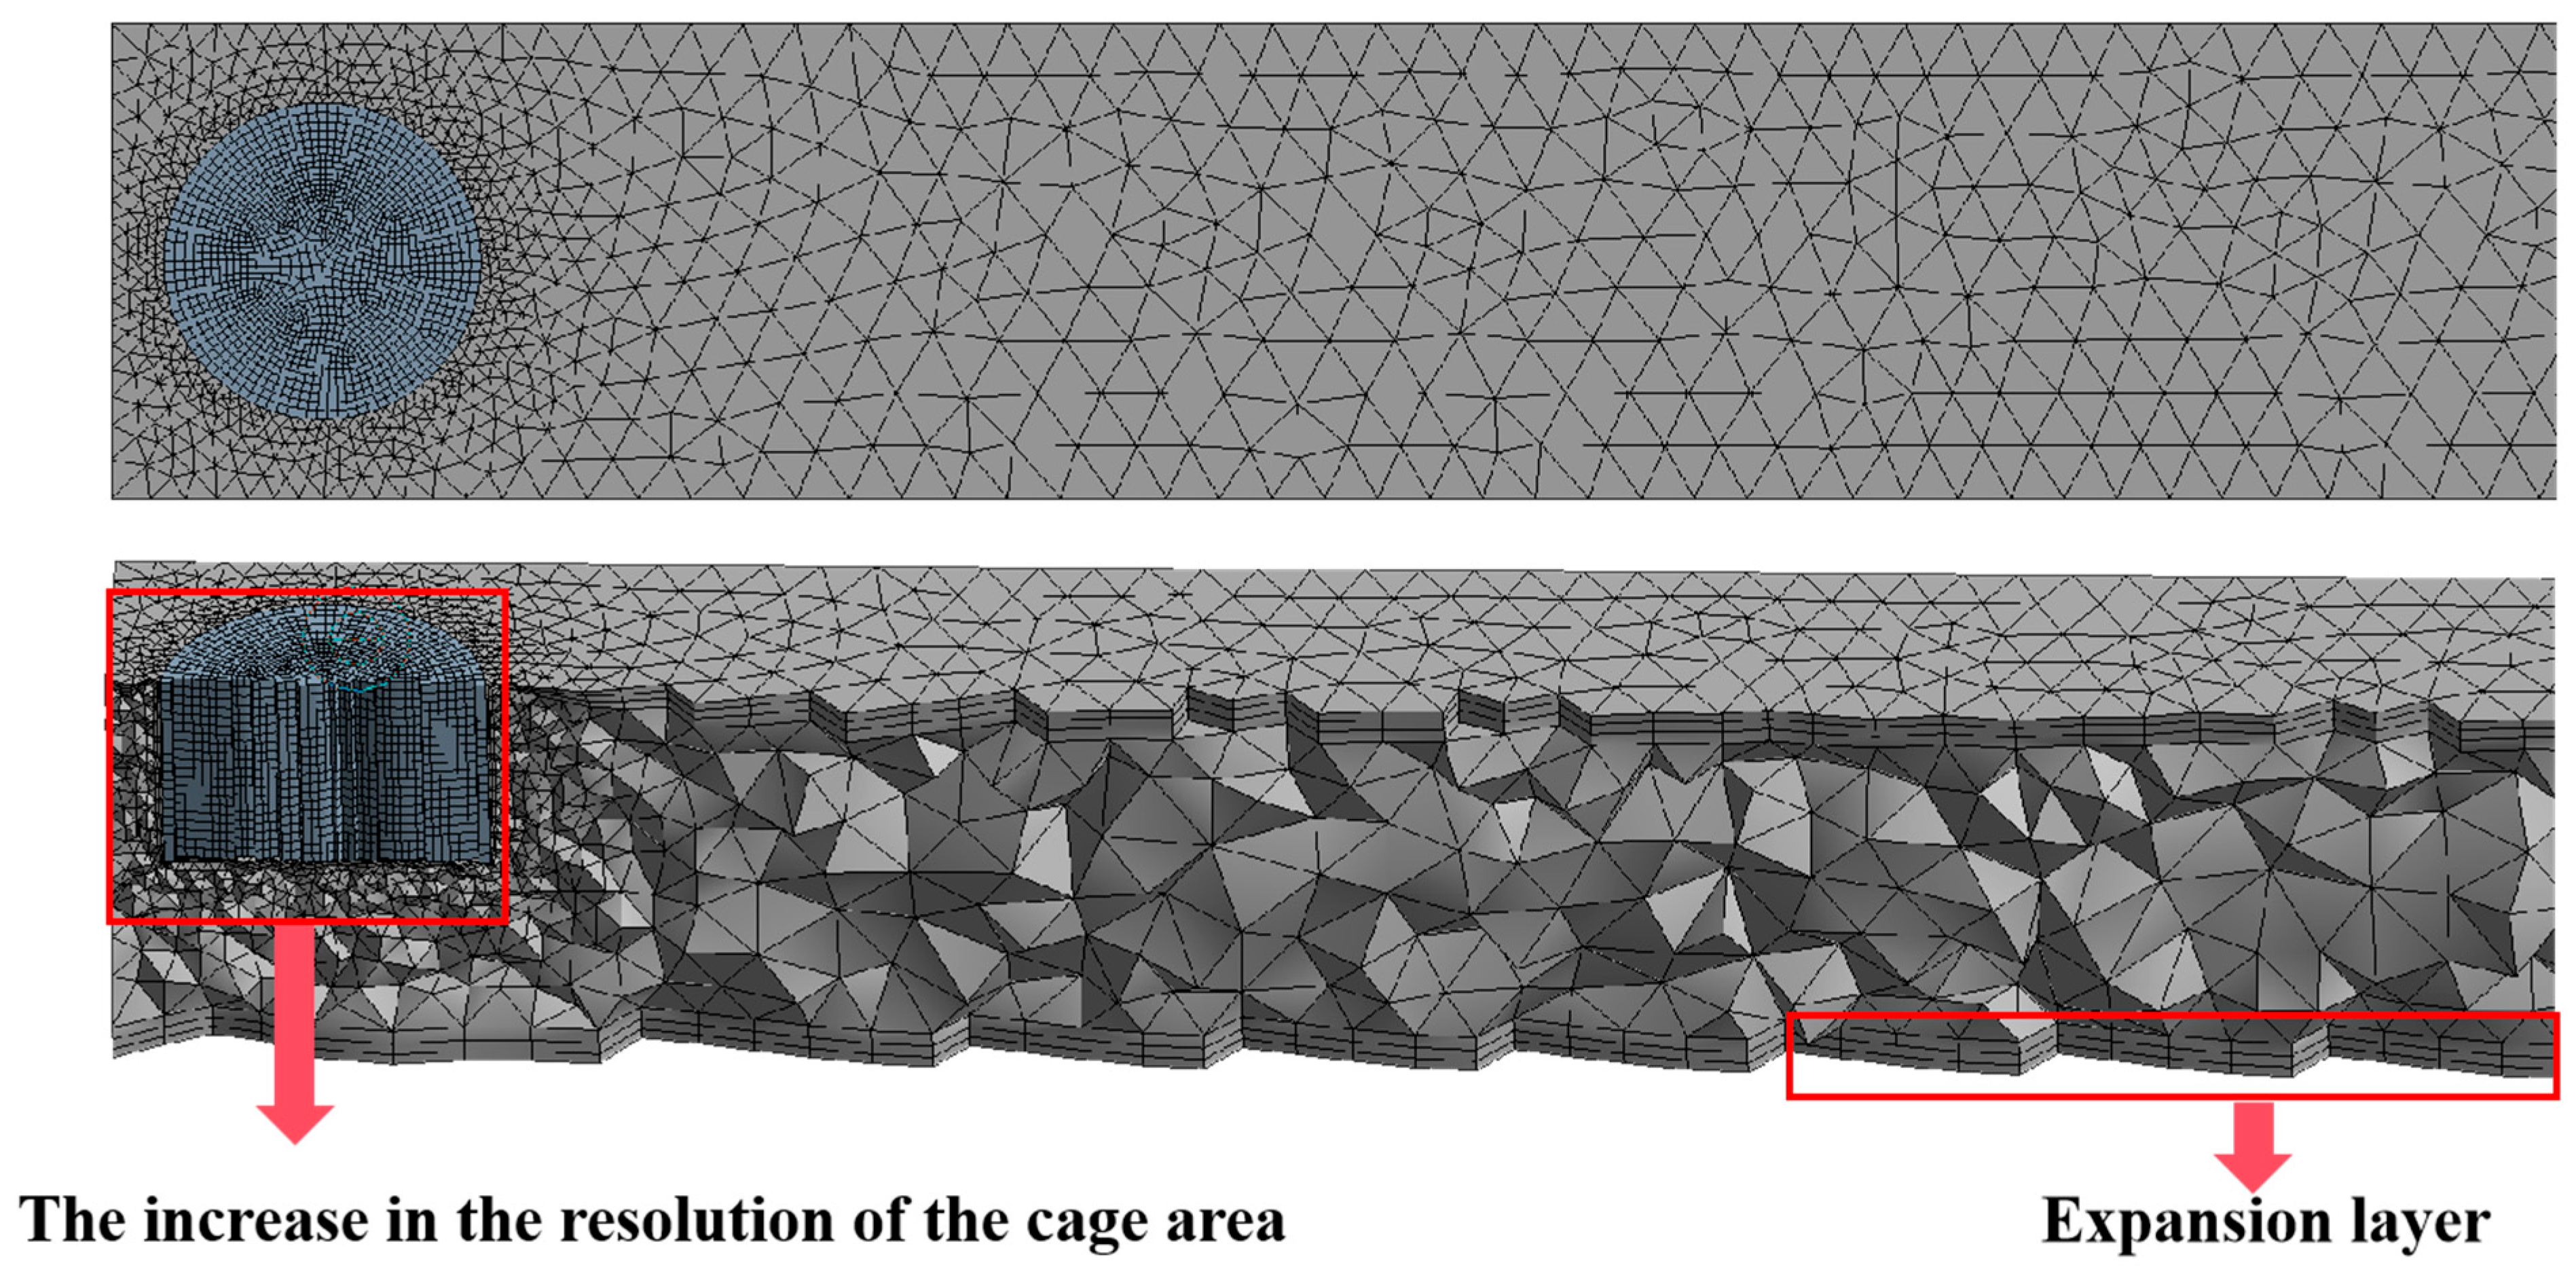
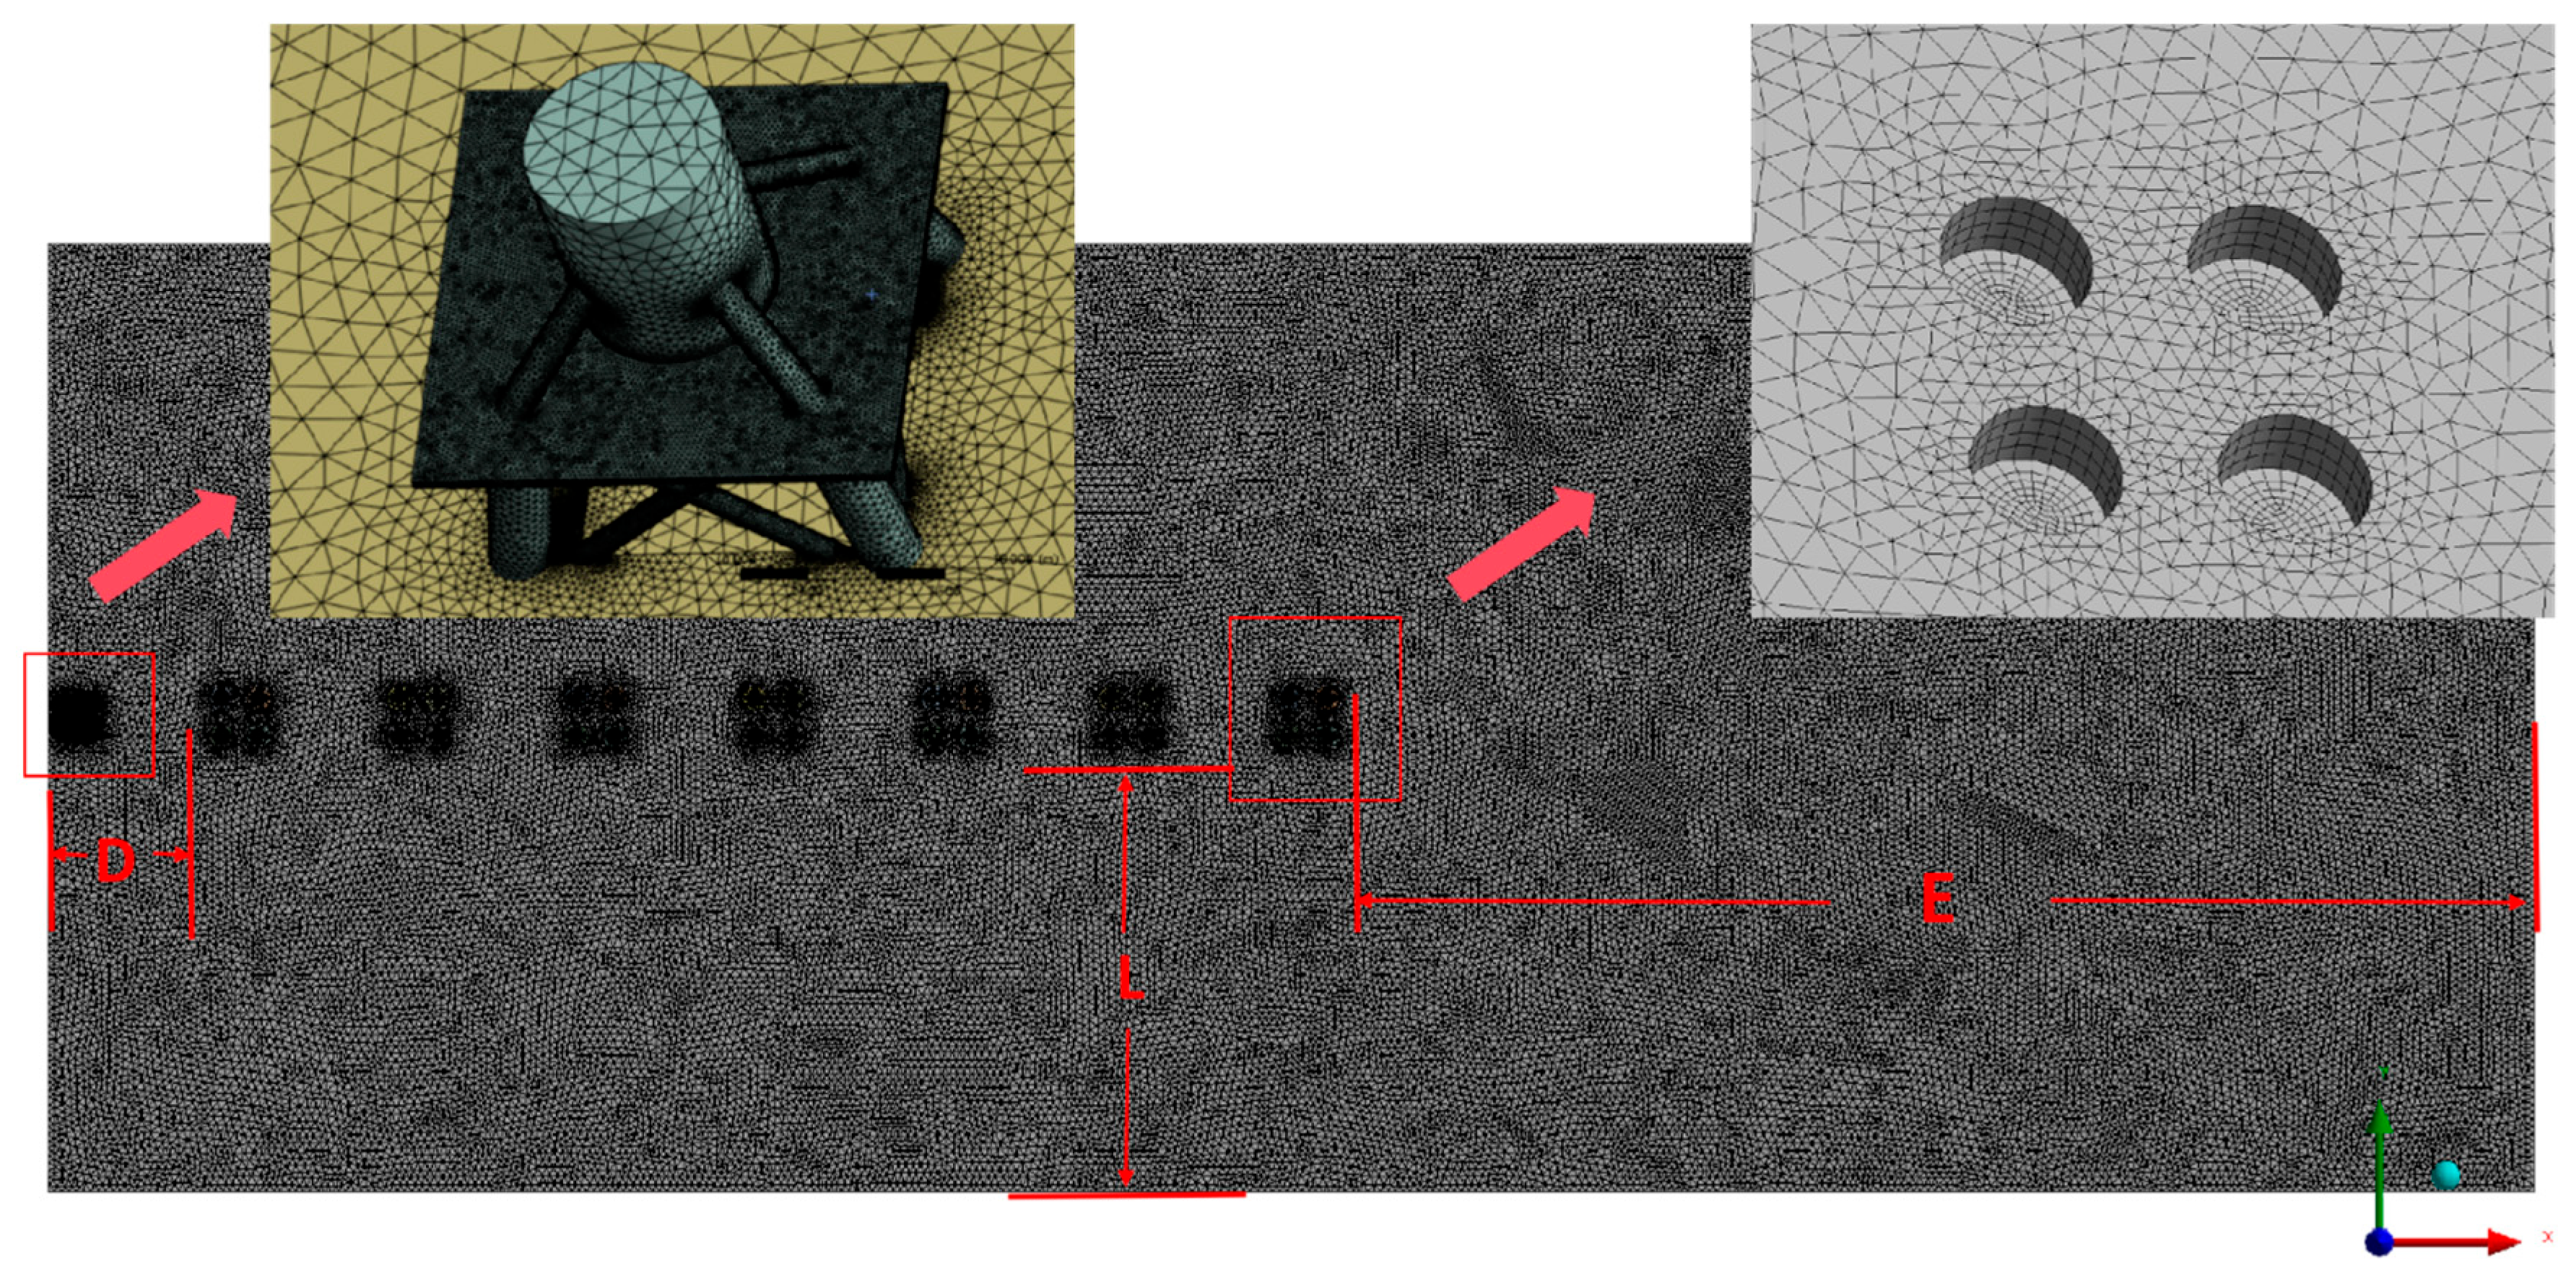
- Mesh Independence VerificationTo make the experimental results more accurate, this study adopted a regionalized mesh division strategy in the model calculation and combined it with the k-ϵ turbulence model to balance the calculation accuracy and efficiency. The specific optimization measures are as follows:
- (i)
- Regionalized mesh density setting. In view of the structure of the cage and the characteristics of the surrounding flow field, the computing domain was partitioned; that is, the background area and the cage densification area were set up in a hierarchical manner to avoid the waste of resources of the uniform mesh throughout the domain, especially the densification mesh near the porous medium interface (such as the cage wall). An increase in local resolution can more accurately capture the flow velocity gradient and pressure abrupt changes, especially in the interaction area between the internal and external flow fields of the cage, ensuring high-resolution simulation of key physical phenomena such as turbulent vortices and shear layer separation.
- (ii)
- Addition of expansion layer. At the wall surface of the cage and the interface of the porous medium, the thickness of the grid is increased layer by layer to ensure that the flow characteristics within the boundary layer (such as the velocity profile and the distribution of turbulent kinetic energy) are accurately analyzed. The setting of the expansion layer not only improves the calculation accuracy of the flow field near the wall, but also significantly reduces the influence of numerical dissipation on the simulation results.
- (iii)
- Optimization of the k-ϵ turbulence model. The standard k-ϵ model is adopted and combined with wall functions to handle the flow in the near-wall region. By adjusting the parameters of the turbulence model (such as the initial values of turbulent kinetic energy k and turbulent dissipation rate ϵ), the adaptability of the model to complex flows (such as wake effects around cages and disturbances caused by fish school activities) was further optimized.
- (iv)
- Verification and iterative optimization. The simulation results are verified through experimental data (such as flow velocity measurement and pressure distribution), and the mesh division and model parameters are iteratively optimized based on error analysis. This process ensures the reliability and scientific nature of the simulation results.
- (e)
- Boundary condition setting
- (f)
- Model verification
- (2)
- Discrete phase particle models (DPM)
- (3)
- MIKE 21
- (a)
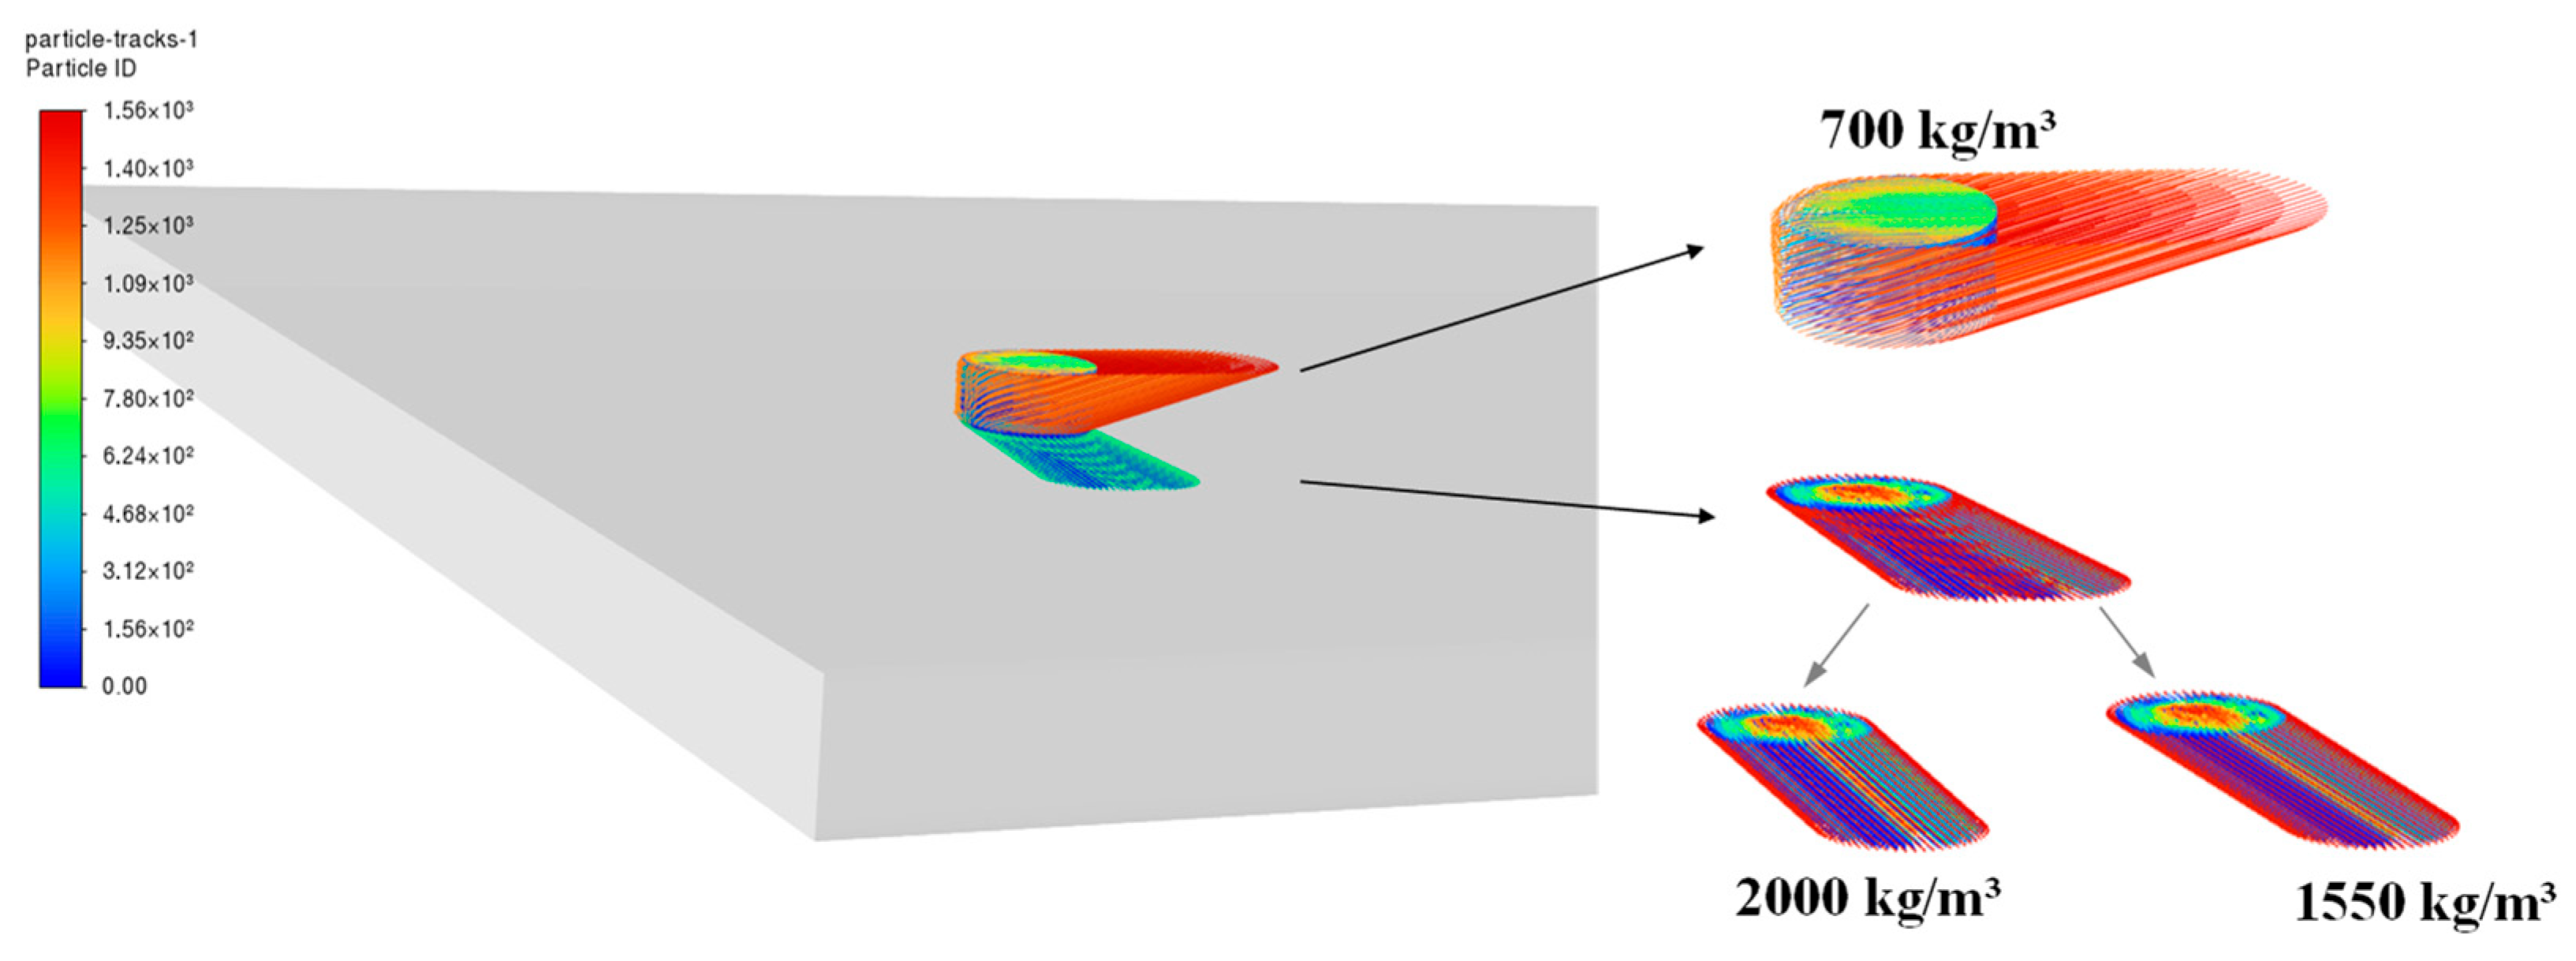
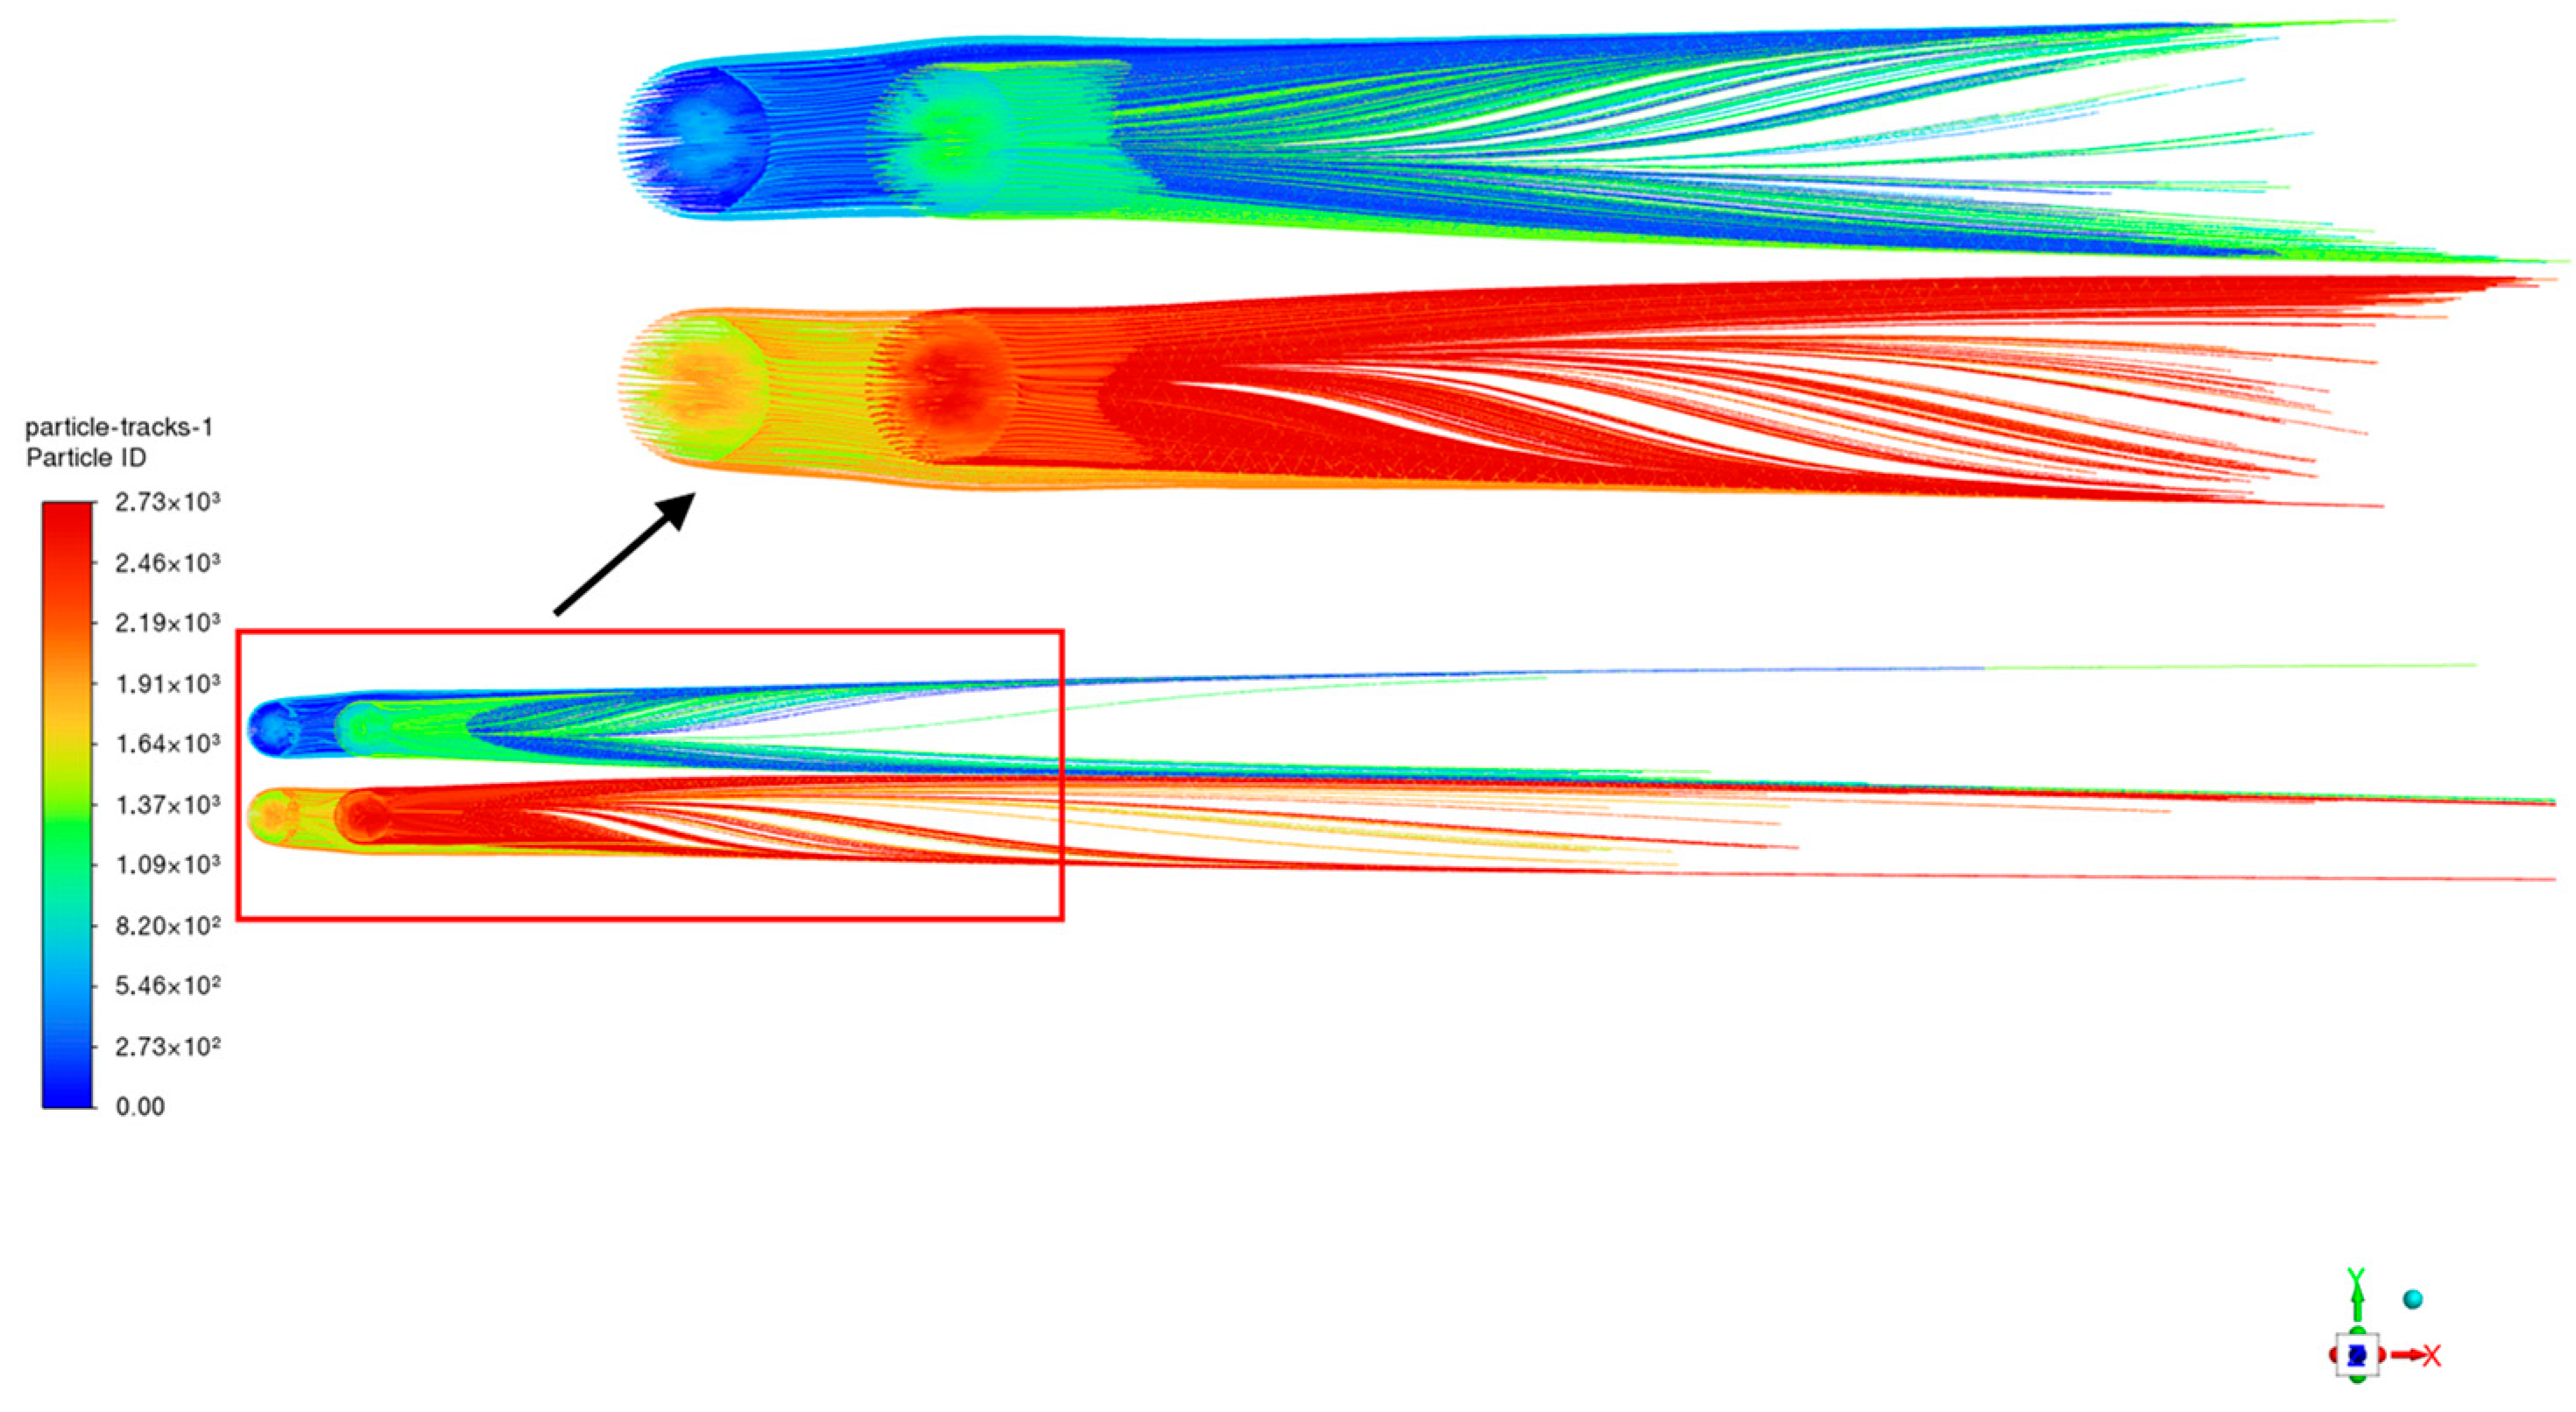
- Particle parameter setting
- (b)
- Boundary condition setting
- (c)
- Mesh sensitivity analysis and model verification
2.5. Scenario Settings
2.5.1. Scenario: Flow Field Disturbance Response
- (1)
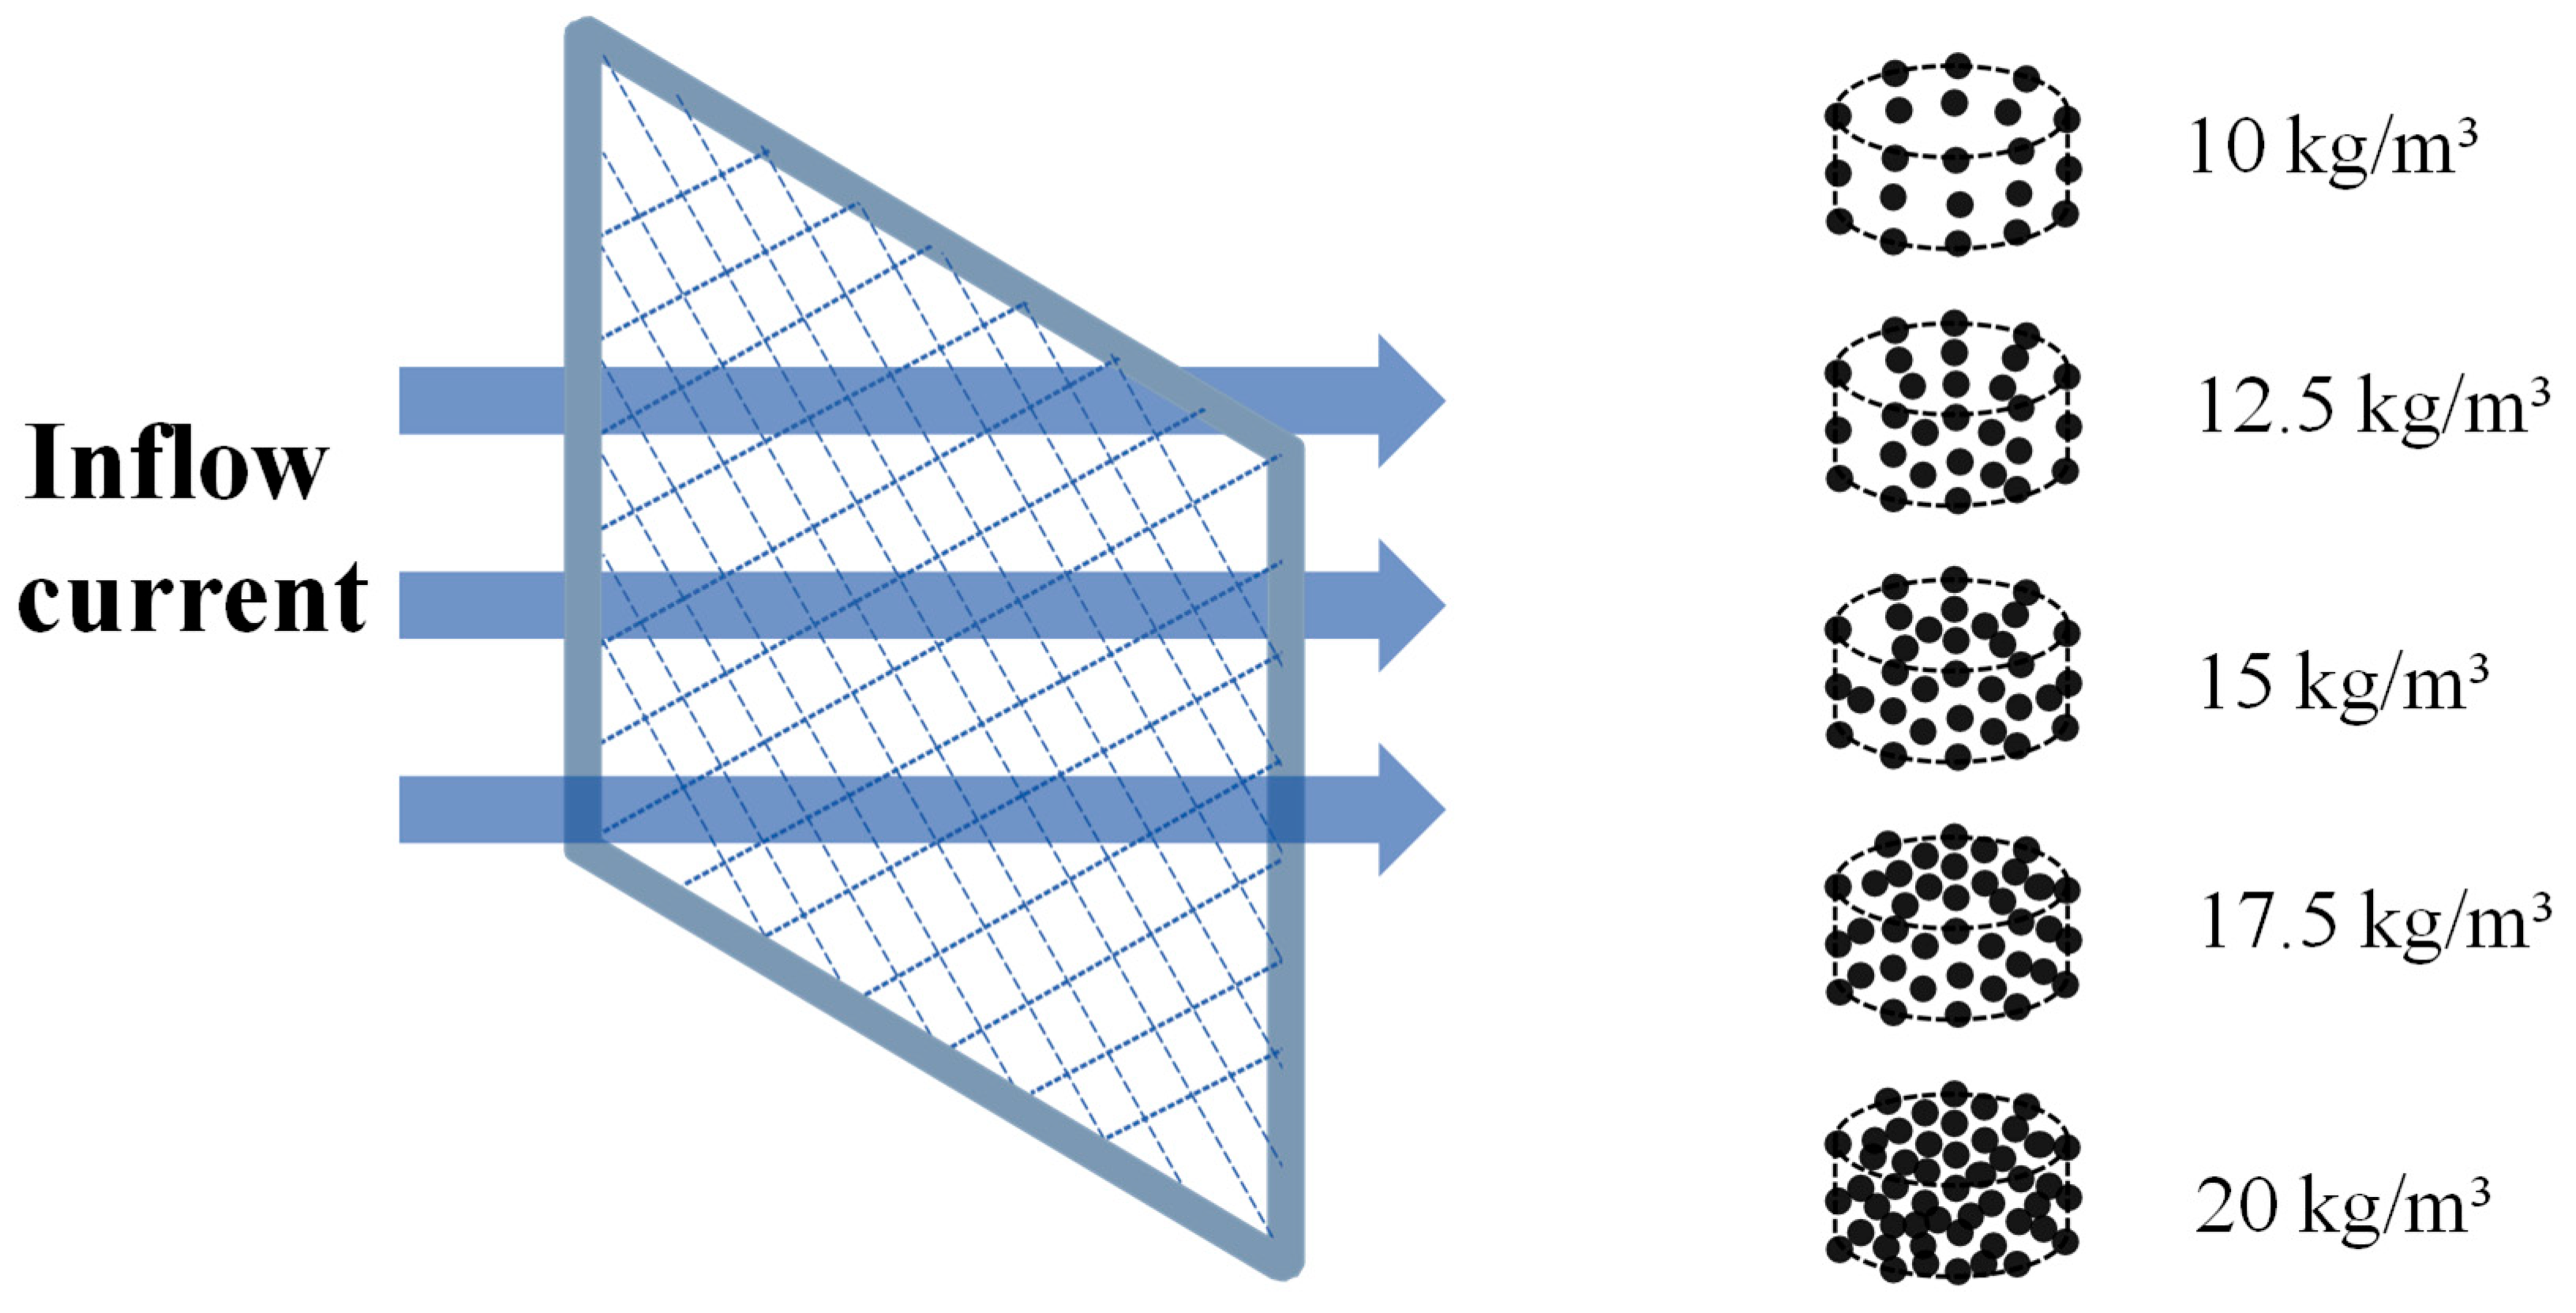
- Stocking density and foundation type
- (a)
- Trachinotus ovatus densities
- (b)
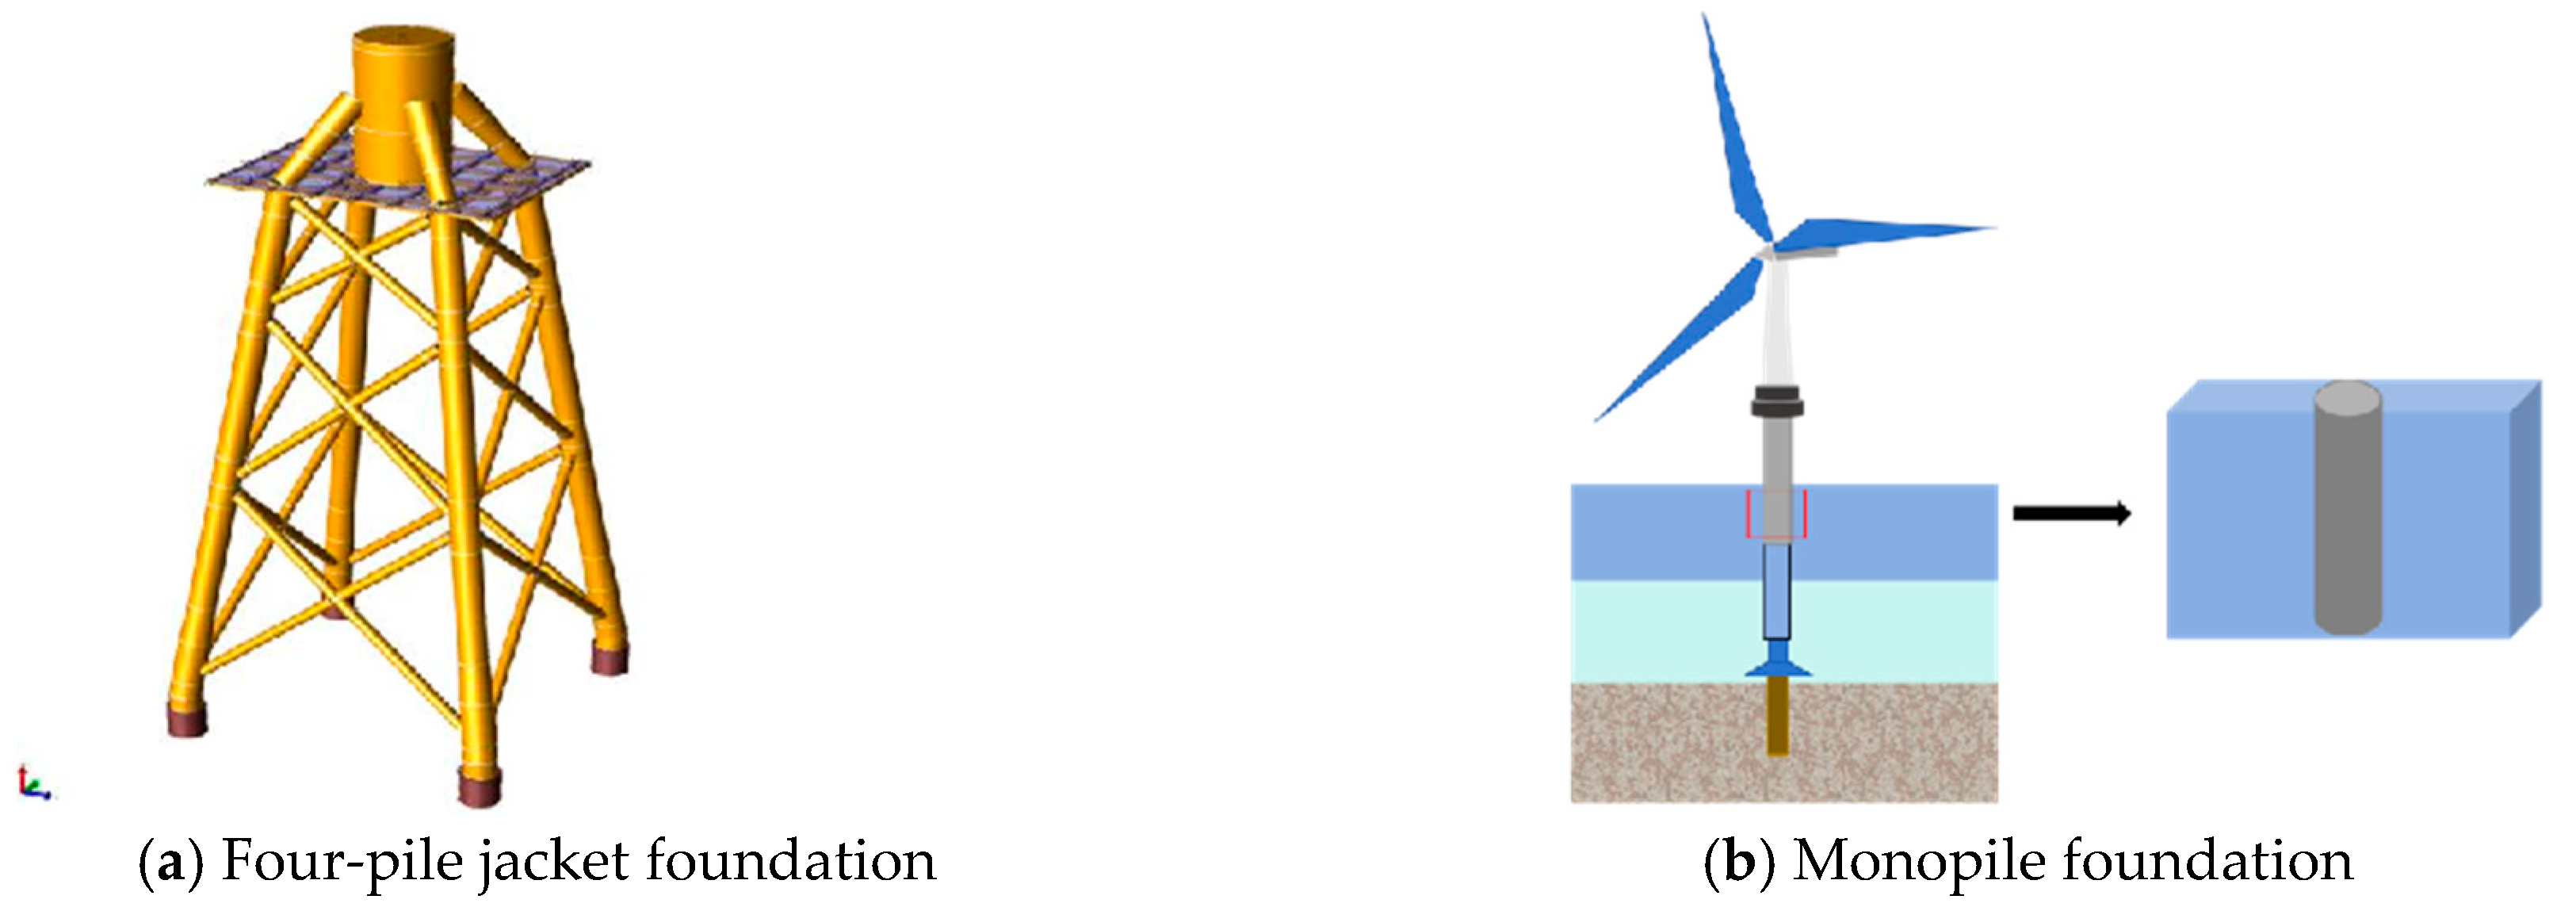
- Pile foundation
- (2)
- Cage layout mode
2.5.2. Scenario: Particle Diffusion
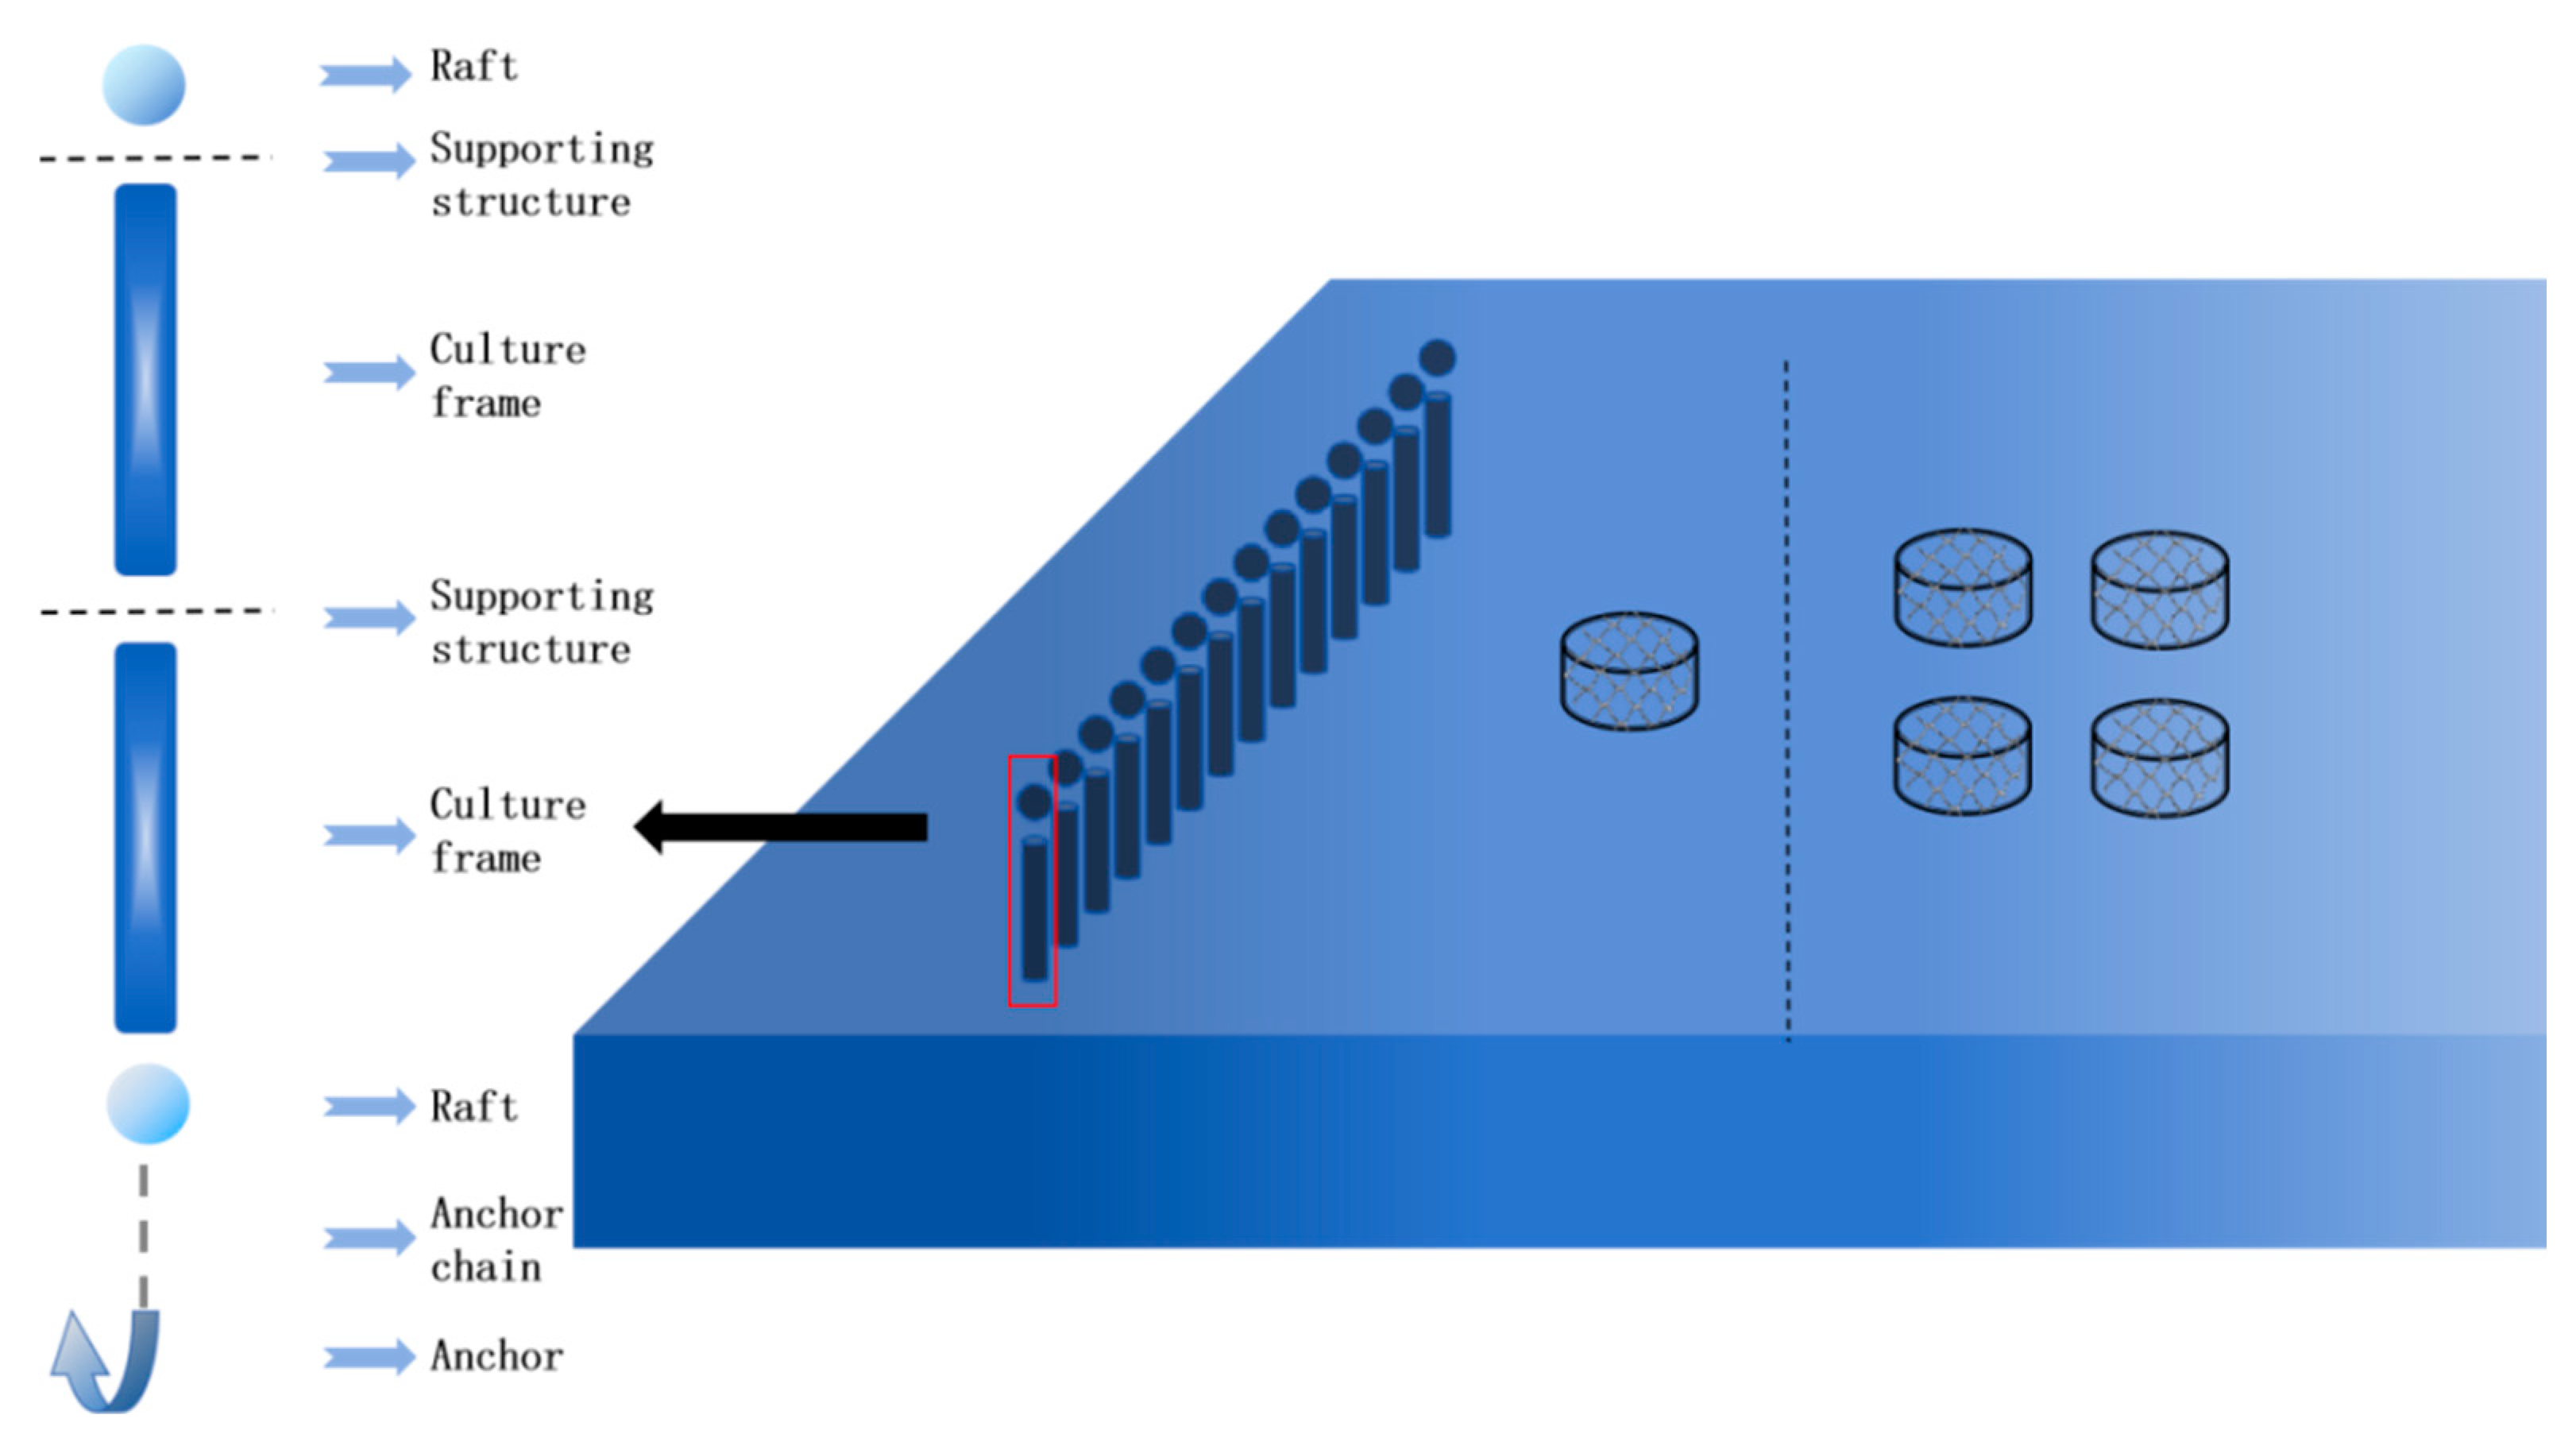
2.5.3. Scenario: Flow-Blocking and Food Filtration Rafts
- (1)
- Unidirectional incident water flow
- (2)
- Actual wind-farm sea area
2.5.4. The Boundary Distances of Different Layout Modes
- (1)
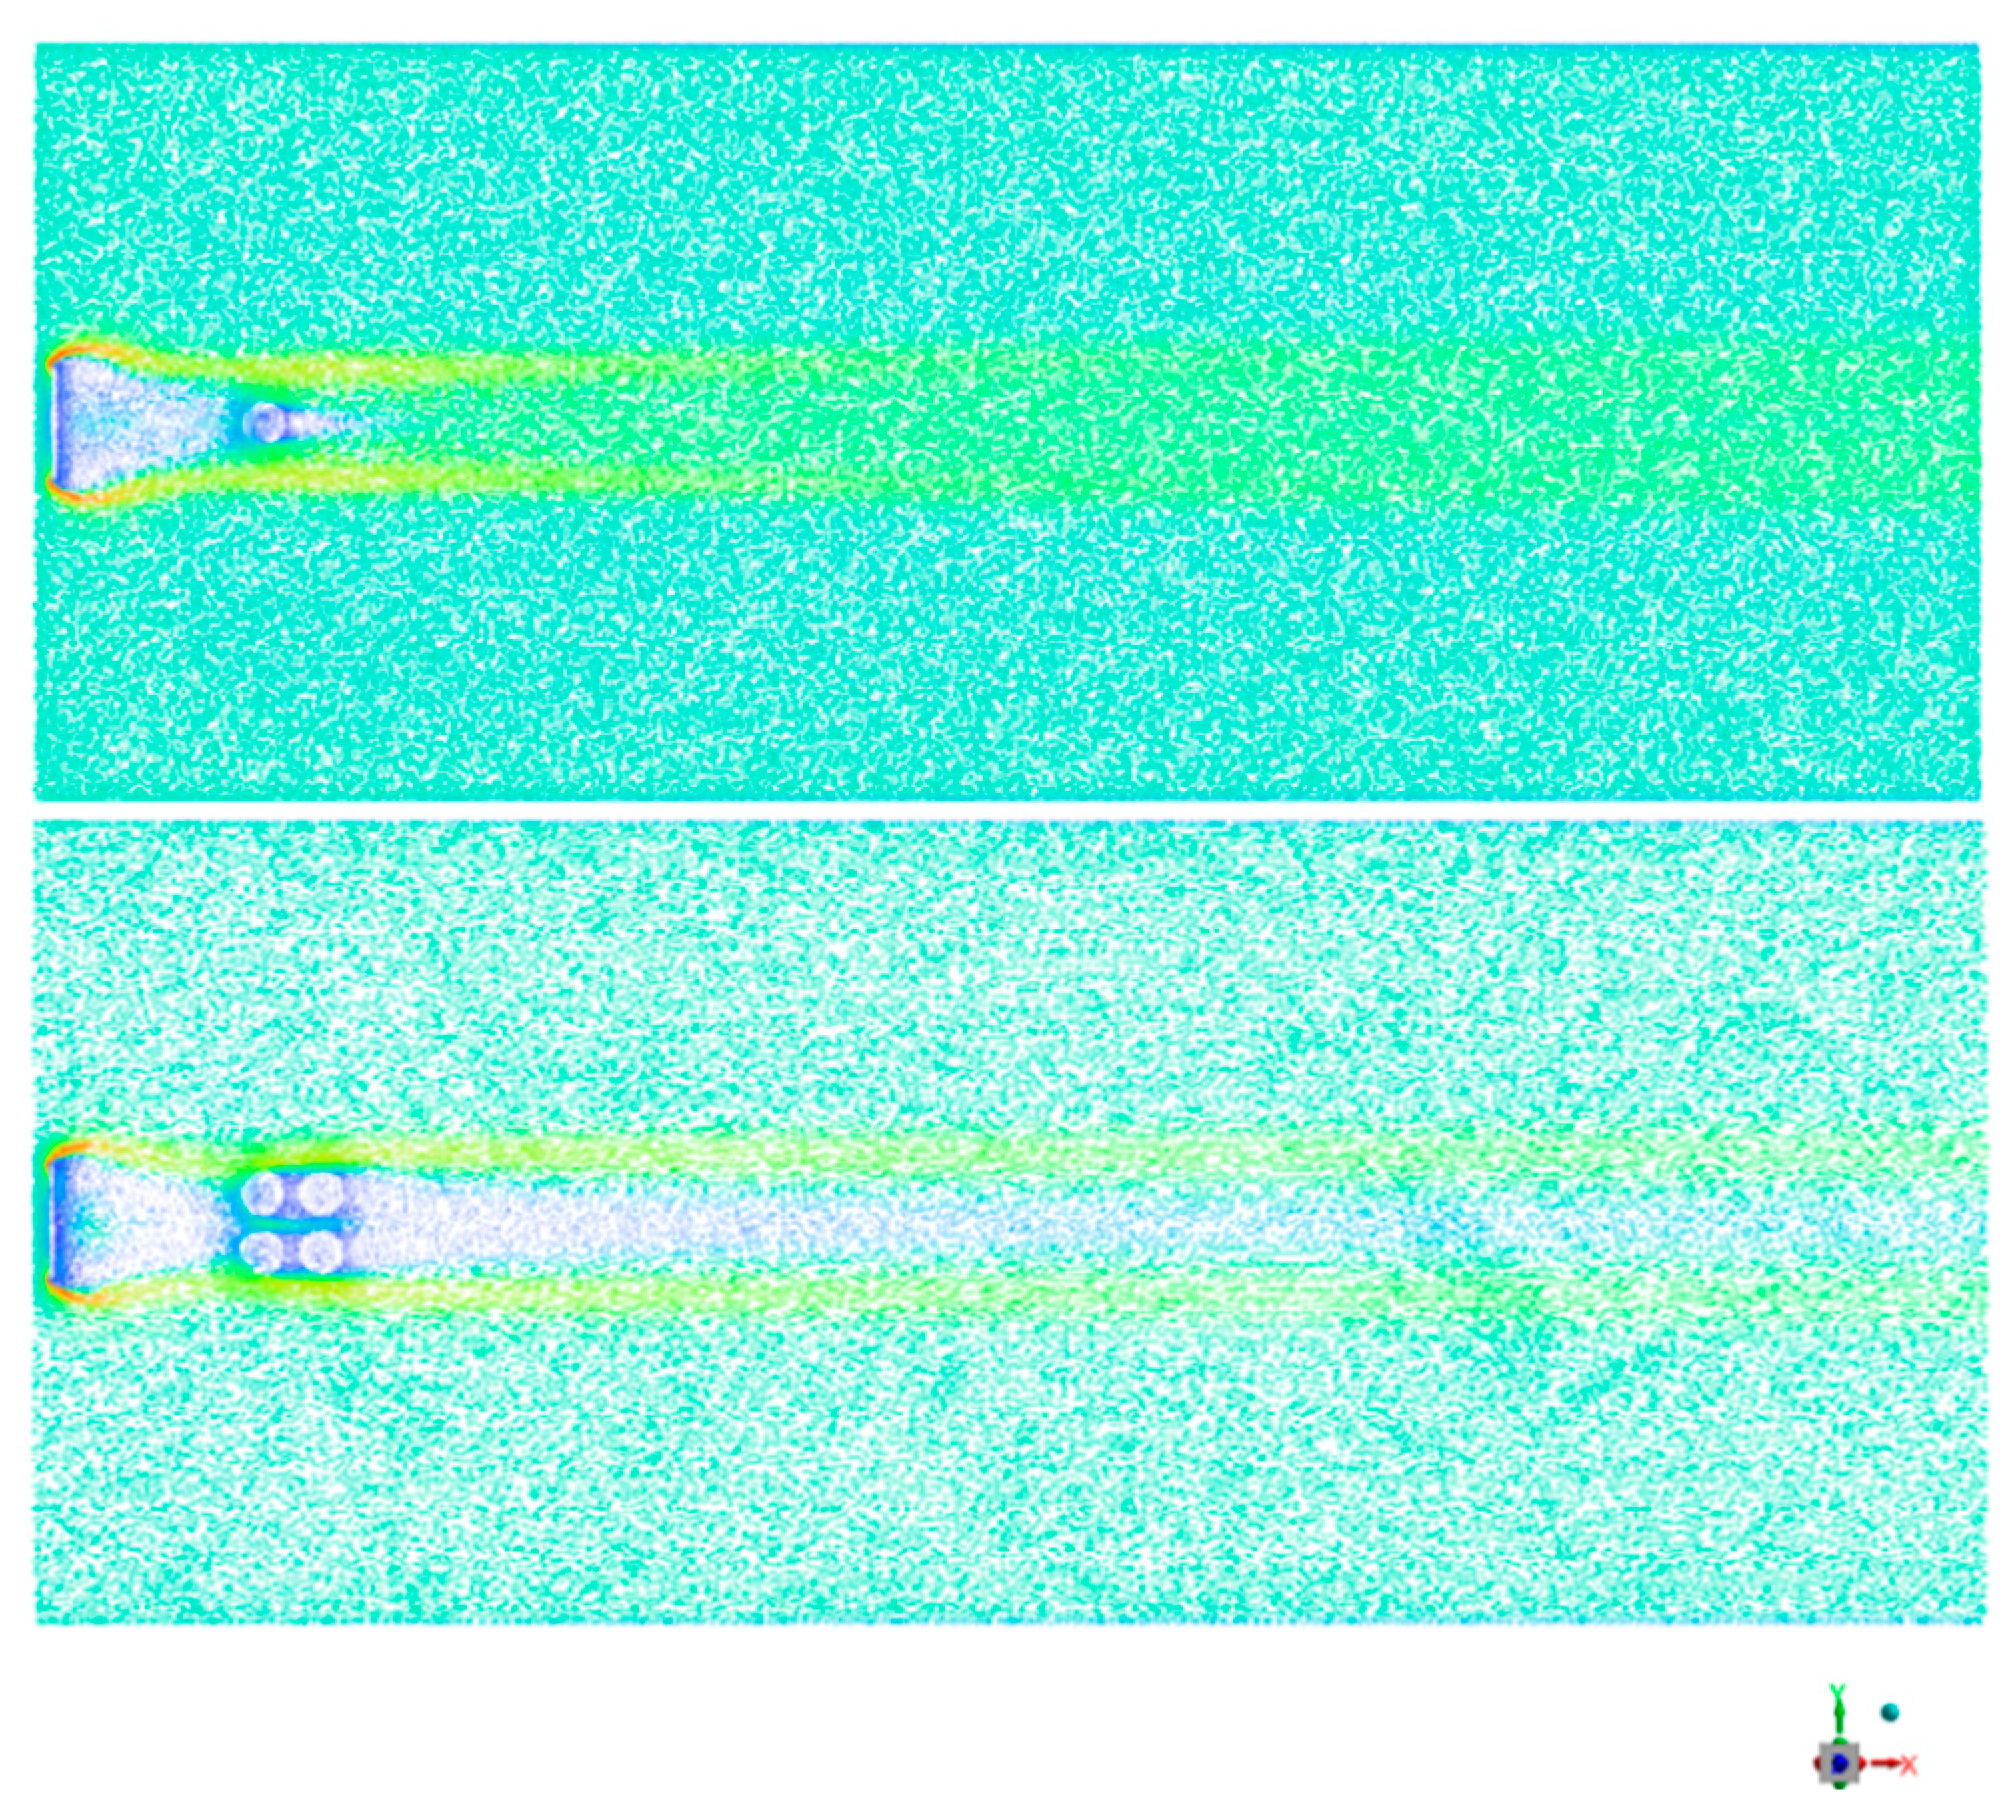
- In the research scenario of “Foundation Type”, due to the size of the pile foundation and the distance layout requirements of the surrounding facilities of the pile foundation, the distance between the flow field entrance and the front wall of the cage has increased. However, the model setting still retains the cage walls in each experimental group in the same X-plane to control the accuracy of the simulation data, and the inflow velocity is also consistent with that of the other experimental groups.
- (2)
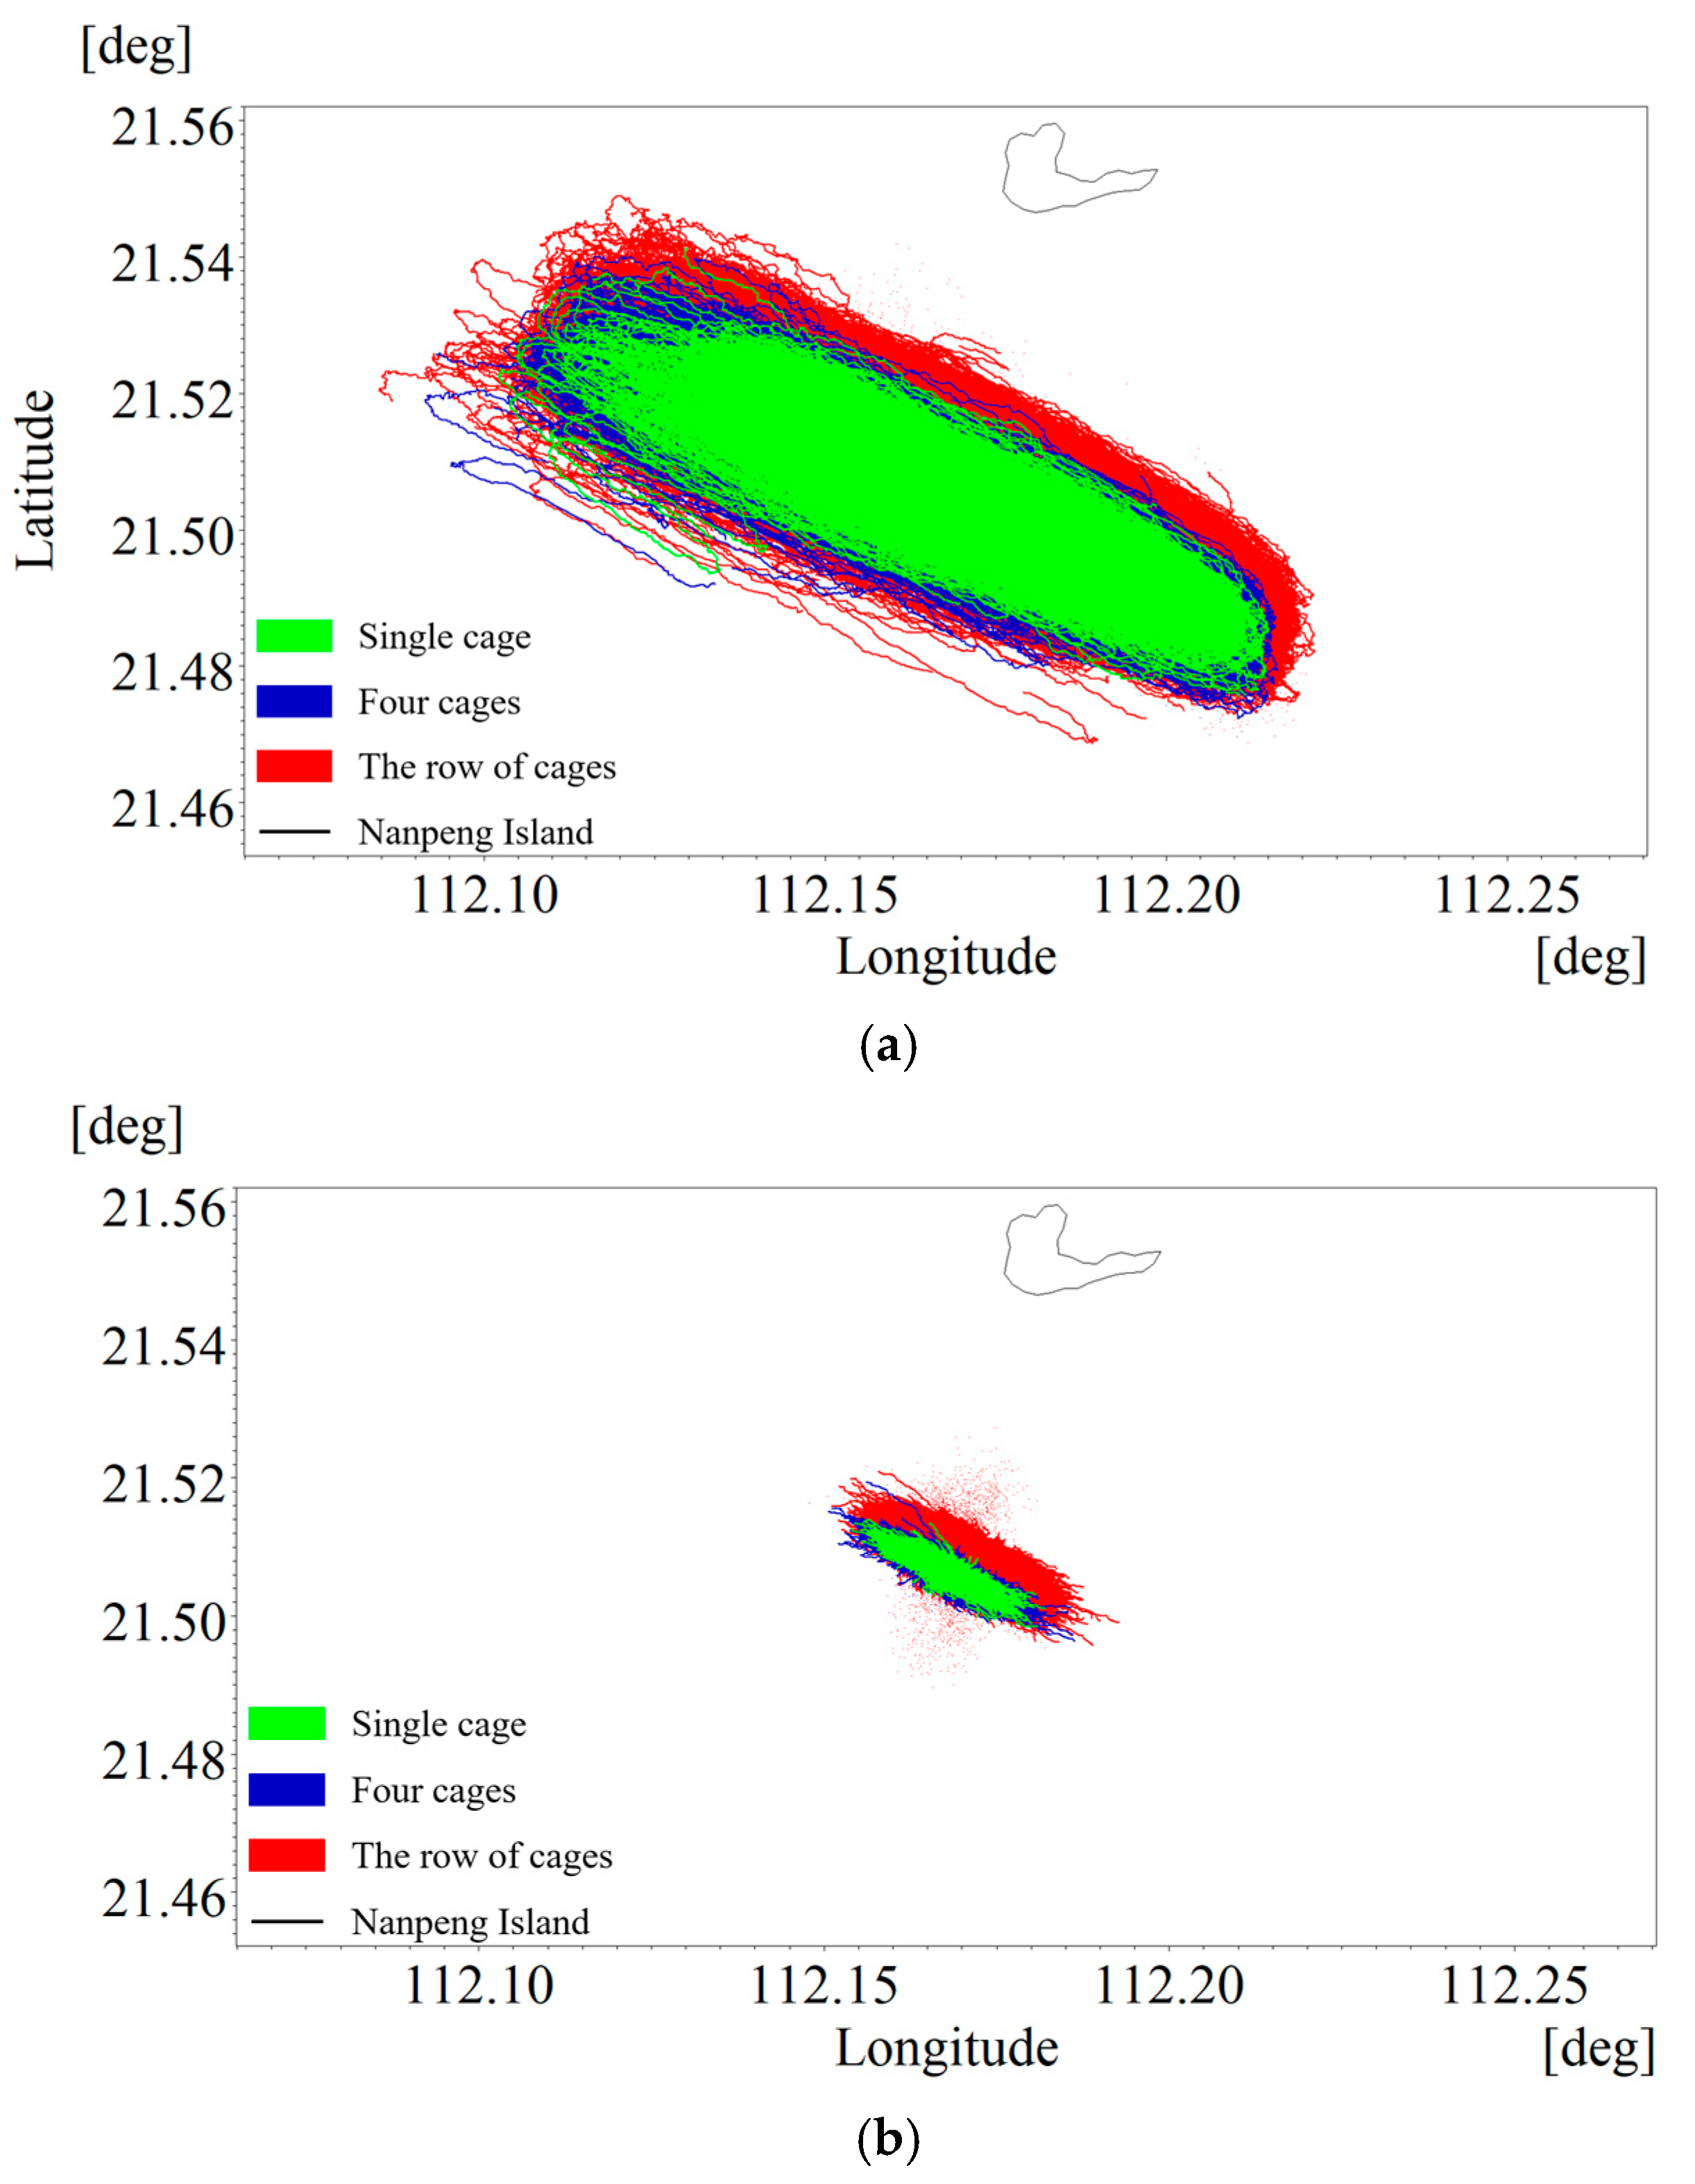
- For the different arrangement methods (single/group/row) used in particle simulation, the distance between the cage and the boundary setting is the same as that in the corresponding layout mode shown in the following table.
3. Results
3.1. Flow Field Disturbance Response
3.1.1. Stocking Densities
3.1.2. Foundation Type
3.1.3. Cage Layout Mode
3.2. Particle Diffusion
3.2.1. Unidirectional Incident Water Flow
3.2.2. Actual Wind Farm Sea Area
3.3. Flow-Blocking and Food Filtration Rafts
3.3.1. Unidirectional Incident Water Flow
- (1)
- Front-positioned raft combination for shellfish culture
- (2)
- Post-positioned raft combination for shellfish culture
- (3)
- Layout mode
3.3.2. Actual Wind Farm Sea Area
3.3.3. Long-Term Operation and Maintenance
- (1)
- Preventive measures
- (2)
- Dynamic Management
- (a)
- Conduct a screening for the pathogens of contaminated organisms before cleaning;
- (b)
- Avoid operations during the peak period of larval release (such as in summer);
- (c)
- Require mandatory onshore cleaning of heavily contaminated/copper-plated cages.
- (3)
- Facility Optimization
- (a)
- Site selection and avoidance: The platform should be at least 4 km away from the main channel, with a water depth greater than 20 m, and located in a stable seabed area.
- (b)
- Navigation safety: Set up dedicated navigation AIDS (warning buoys, LED signal lights), establish an integrated “VHF (Very High Frequency) + unmanned aerial vehicles + electro-optical radar + maritime patrol vessels” monitoring system and issue navigation warnings in real time.
- (c)
- Management Coordination: Obtain permission from the maritime department and conduct navigation assessment, clearly define the operational meteorological thresholds (wave height ≤ 1.5 m, wind speed ≤ level 6), and pre-determine the vessel avoidance plan.
- (4)
- Shipping lane design
4. Discussion
4.1. Physiological Impact Assessment of Farmed Fish Species
4.2. Deformation Assessment of Cages
4.3. Biological Attachment Pollution Assessment
- (1)
- Contamination by cnidarians
- (2)
- Contamination by pathogen vectors
- (3)
- Invasive species spread
- (4)
- Anti-fouling coating particle contamination
- (5)
- Structural changes in the cage
5. Conclusions
Supplementary Materials
Author Contributions
Funding
Institutional Review Board Statement
Informed Consent Statement
Data Availability Statement
Conflicts of Interest
References
- Griffin, R.; Buck, B.; Krause, G. Private incentives for the emergence of co-production of offshore wind energy and mussel aquaculture. Aquaculture 2015, 436, 80–89. [Google Scholar] [CrossRef]
- Lee, D.-W.; Oh, S.-Y.; Park, J.J.C.; Jung, Y.-H.; Kim, H.-J.; Choi, D.M.; Choi, Y.-U.; Han, J. Offshore Wind Farms in South Korea: A Potential Site for Scallop Culture. J. Mar. Sci. Eng. 2023, 11, 1988. [Google Scholar] [CrossRef]
- van den Burg, S.W.K.; Kamermans, P.; Blanch, M.; Pletsas, D.; Poelman, M.; Soma, K.; Dalton, G. Business case for mussel aquaculture in offshore wind farms in the North Sea. Mar. Policy 2017, 85, 1–7. [Google Scholar] [CrossRef]
- Gao, S.; Sun, H.; Zhao, L.; Cao, G.; Liu, W. Research on the comprehensive benefits and driving forces of various typical types of marine development in Jiangsu Province. IOP Conf. Ser. Earth Environ. Sci. 2020, 569, 012034. [Google Scholar] [CrossRef]
- Klebert, P.; Patursson, Ø.; Endresen, P.C.; Rundtop, P.; Birkevold, J.; Rasmussen, H.W. Three-dimensional deformation of a large circular flexible sea cage in high currents: Field experiment and modeling. Ocean Eng. 2015, 104, 511–520. [Google Scholar] [CrossRef]
- Hvas, M.; Folkedal, O.; Oppedal, F. Fish welfare in offshore salmon aquaculture. Rev. Aquac. 2020, 13, 836–852. [Google Scholar] [CrossRef]
- Jónsdóttir, K.E.; Hvas, M.; Alfredsen, J.A.; Føre, M.; Alver, M.O.; Bjelland, H.V.; Oppedal, F. Fish welfare based classification method of ocean current speeds at aquaculture sites. Aquac. Environ. Interact. 2019, 11, 249–261. [Google Scholar] [CrossRef]
- Landmann, J.; Fröhling, L.; Gieschen, R.; Buck, B.H.; Heasman, K.; Scott, N.; Smeaton, M.; Goseberg, N.; Hildebrandt, A. New system design for the cultivation of extractive species at exposed sites-Part 2: Experimental modelling in waves and currents. Appl. Ocean Res. 2021, 113, 102749. [Google Scholar] [CrossRef]
- Johansson, D.; Laursen, F.; Ferno, A.; Fosseidengen, J.E.; Klebert, P.; Stien, L.H.; Vagseth, T.; Oppedal, F. The interaction between water currents and salmon swimming behaviour in sea cages. PLoS ONE 2014, 9, e97635. [Google Scholar] [CrossRef]
- Park, S.-G.; Zhou, J.; Dong, S.; Li, Q.; Yoshida, T.; Kitazawa, D. Characteristics of the flow field inside and around a square fish cage considering the circular swimming pattern of a farmed fish school: Laboratory experiments and field observations. Ocean Eng. 2022, 261, 112097. [Google Scholar] [CrossRef]
- Palstra, A.P.; Planas, J.V. Fish under exercise. Fish Physiol. Biochem. 2011, 37, 259–272. [Google Scholar] [CrossRef]
- Klinger, D.H.; Levin, S.A.; Watson, J.R. The growth of finfish in global open-ocean aquaculture under climate change. Proc. Biol. Sci. 2017, 284, 20170834. [Google Scholar] [CrossRef]
- Nilsen, A.; Hagen, Ø.; Johnsen, C.A.; Prytz, H.; Zhou, B.; Nielsen, K.V.; Bjørnevik, M. The importance of exercise: Increased water velocity improves growth of Atlantic salmon in closed cages. Aquaculture 2019, 501, 537–546. [Google Scholar] [CrossRef]
- Winthereig-Rasmussen, H.; Simonsen, K.; Patursson, Ø. Flow through fish farming sea cages: Comparing computational fluid dynamics simulations with scaled and full-scale experimental data. Ocean Eng. 2016, 124, 21–31. [Google Scholar] [CrossRef]
- Bi, C.-W.; Zhao, Y.-P.; Dong, G.-H.; Zheng, Y.-N.; Gui, F.-K. A numerical analysis on the hydrodynamic characteristics of net cages using coupled fluid–structure interaction model. Aquac. Eng. 2014, 59, 1–12. [Google Scholar] [CrossRef]
- Yu, L.-H.; Zhan, J.-M.; Li, Y.-S. Numerical Simulation of Flow Through Circular Array of Cylinders Using Multi-Body and Porous Models. Coast. Eng. J. 2014, 56, 1450014-1–1450014-26. [Google Scholar] [CrossRef]
- Bi, C.-W.; Zhao, Y.-P.; Dong, G.-H. Numerical study on the hydrodynamic characteristics of biofouled full-scale net cage. China Ocean Eng. 2015, 29, 401–414. [Google Scholar] [CrossRef]
- Rasmussen, H.W.; Patursson, Ø.; Simonsen, K. Visualisation of the wake behind fish farming sea cages. Aquac. Eng. 2015, 64, 25–31. [Google Scholar] [CrossRef]
- Gansel, L.C.; Rackebrandt, S.; Oppedal, F.; McClimans, T.A. Flow Fields Inside Stocked Fish Cages and the Near Environment. J. Offshore Mech. Arct. Eng. 2014, 136, 031201. [Google Scholar] [CrossRef]
- Patursson, O. Flow Through and Around Fish Farming Nets. Ph.D. Dissertation, University of New Hampshire, Durham, NH, USA, 2008. [Google Scholar]
- Bi, C.-W.; Zhao, Y.-P.; Dong, G.-H. Experimental study on the effects of farmed fish on the hydrodynamic characteristics of the net cage. Aquaculture 2020, 524, 735239. [Google Scholar] [CrossRef]
- Zhao, Y.-P.; Bi, C.-W.; Dong, G.-H.; Gui, F.-K.; Cui, Y.; Guan, C.-T.; Xu, T.-J. Numerical simulation of the flow around fishing plane nets using the porous media model. Ocean Eng. 2013, 62, 25–37. [Google Scholar] [CrossRef]
- Karayücel, S.; Çelik, M.Y.; Karayücel, İ.; Öztürk, R.; Eyüboğlu, B. Effects of stocking density on survival, growth and biochemical composition of cultured mussels (Mytilus galloprovincialis, Lamarck 1819) from an offshore submerged longline system. Aquac. Res. 2015, 46, 1369–1383. [Google Scholar] [CrossRef]
- Lauzon-Guay, J.-S.; Hamilton, D.J.; Barbeau, M.A. Effect of mussel density and size on the morphology of blue mussels (Mytilus edulis) grown in suspended culture in Prince Edward Island, Canada. Aquaculture 2005, 249, 265–274. [Google Scholar] [CrossRef]
- Pietrak, M.R.; Molloy, S.D.; Bouchard, D.A.; Singer, J.T.; Bricknell, I. Potential role of Mytilus edulis in modulating the infectious pressure of Vibrio anguillarum 02β on an integrated multi-trophic aquaculture farm. Aquaculture 2012, 326, 36–39. [Google Scholar] [CrossRef]
- Underwood, L.H.; Jeffs, A.G. Settlement and recruitment of fish in mussel farms. Aquac. Environ. Interact. 2023, 15, 85–100. [Google Scholar] [CrossRef]
- Kotta, J.; Stechele, B.; Barboza, F.R.; Kaasik, A.; Lavaud, R. Towards environmentally friendly finfish farming: A potential for mussel farms to compensate fish farm effluents. J. Appl. Ecol. 2023, 60, 1314–1326. [Google Scholar] [CrossRef]
- Montory, J.A.; Chaparro, O.R.; Averbuj, A.; Salas-Yanquin, L.P.; Buchner-Miranda, J.A.; Gebauer, P.; Cumillaf, J.P.; Cruces, E. The filter-feeding bivalve Mytilus chilensis capture pelagic stages of Caligus rogercresseyi: A potential controller of the sea lice fish parasites. J. Fish Dis. 2020, 43, 475–484. [Google Scholar] [CrossRef] [PubMed]
- Davison, W.; Herbert, N.A. Swimming-Enhanced Growth. In Swimming Physiology of Fish: Towards Using Exercise to Farm a Fit Fish in Sustainable Aquaculture; Palstra, A.P., Planas, J.V., Eds.; Springer: Berlin/Heidelberg, Germany, 2013; pp. 177–202. [Google Scholar]
- Hvas, M.; Oppedal, F. Sustained swimming capacity of Atlantic salmon. Aquac. Environ. Interact. 2017, 9, 361–369. [Google Scholar] [CrossRef]
- Barbier, E.; Oppedal, F.; Hvas, M. Atlantic salmon in chronic turbulence: Effects on growth, behaviour, welfare, and stress. Aquaculture 2024, 582, 740550. [Google Scholar] [CrossRef]
- Hvas, M.; Folkedal, O.; Imsland, A.; Oppedal, F. Metabolic rates, swimming capabilities, thermal niche and stress response of the lumpfish, Cyclopterus lumpus. Biol. Open 2018, 7, bio036079. [Google Scholar] [CrossRef]
- Abrahamsen, H.I.; Johannesen, T.T.; Patursson, Ø.; Norði, G.á.; Simonsen, K. Wave-generated currents threaten aquaculture sites. Ocean Eng. 2025, 334, 121574. [Google Scholar] [CrossRef]
- Shim, K.; Klebert, P.; Fredheim, A. Numerical Investigation of the Flow Through and Around a Net Cage. In Proceedings of the ASME 2009 28th International Conference on Ocean, Offshore and Arctic Engineering, Honolulu, HI, USA, 31 May–5 June 2009; pp. 581–587. [Google Scholar]












| Station Name | Longitude | Longitude | Mean Depth (m) | Vertical Mean Flow Rate (cm/s) | Horizontal Mean Flow Rate (cm/s) | Maximum Flow Rate (cm/s) | Average Temperature (°C) |
|---|---|---|---|---|---|---|---|
| NP1 | 112°11′ 29.16″ E | 21°34′ 32.10″ N | 15.89 | 15.03 | 12.23 | 33.43 | 26.35 |
| 17.04 | 18.81 | 13.41 | 35.85 | 21.31 | |||
| NP2 | 112°18′ 28.62″ E | 21°34′ 03.48″ N | 15.33 | 18.93 | 13.34 | 40.58 | 26.19 |
| 17.16 | 15.41 | 8.55 | 21.63 | 21.02 | |||
| NP3 | 112°04′ 37.74″ E | 21°27′ 30.72″ N | 23.56 | 18.76 | 10.87 | 33.16 | 25.96 |
| 24.70 | 18.53 | 13.06 | 35.11 | 21.97 | |||
| NP4 | 112°23′ 05.46″ E | 21°29′ 25.14″ N | 22.25 | 20.36 | 11.16 | 41.57 | 25.98 |
| 23.48 | 21.65 | 15.69 | 40.37 | 21.81 | |||
| NP5 | 112°10′ 47.46″ E | 21°25′ 46.92″ N | 25.22 | 19.58 | 11.38 | 33.98 | 26.04 |
| 26.23 | 18.24 | 12.76 | 34.90 | 22.14 | |||
| NP6 | 112°12′ 28.74″ E | 21°20′ 51.48″ N | 31.20 | 20.40 | 13.22 | 37.71 | 25.55 |
| 32.18 | 28.90 | 18.20 | 40.71 | 22.14 |
| Mesh Resolution (Flow Field/Cage) | Layers of Expansion | ||
|---|---|---|---|
| 1 | 3 | 5 | |
| 2 m/1 m | 2/1–1 | 2/1–3 | 2/1–5 |
| 4 m/2 m | 4/2–1 | 4/2–3 | 4/2–5 |
| 6 m/3 m | 6/3–1 | 6/3–3 | 6/3–5 |
| Parameters | Value |
|---|---|
| Time step | 180 s |
| Time step number | 5280 |
| Operation mode | Low order, fast algorithm |
| Flood and dry | Drying depth 0.005 m, Flooding depth 0.05 m, wetting depth 0.1 m |
| Density | Barotropic |
| Eddy viscosity | Smagorinsky formulation, Constant: 0.28 |
| Bed resistance | Manning number, Constant: 32 |
| Resolution (m) | Mesh Quantity | Average Calculating Time (min) | Average Number of Errors (Time) |
|---|---|---|---|
| 25–49 | 60,000–100,000 cells | 227 | 35 |
| 50–500 | 20,000–50,000 cells | 115 | 2 |
| 500–1000 | 5000–10,000 cells | 48 | 0 |
| Group Spacing (m) | Cage Shape | Mode | Intra-Group Spacing (m) | Velocity (m/s) | ||
|---|---|---|---|---|---|---|
| 0.2 | 0.4 | 0.6 | ||||
| 80 | Square | A | 10 | MF0.2–1 | MF0.4–1 | MF0.6–1 |
| 20 | MF0.2–2 | MF0.4–2 | MF0.6–2 | |||
| B | 0 | MF0.2–3 | MF0.4–3 | MF0.6–3 | ||
| Circular | C | 10 | MF0.2–4 | MF0.4–4 | MF0.6–4 | |
| 20 | MF0.2–5 | MF0.4–5 | MF0.6–5 | |||
| D | 0 | MF0.2–6 | MF0.4–6 | MF0.6–6 | ||
| 90 | Square | A | 10 | MF0.2–7 | MF0.4–7 | MF0.6–7 |
| 20 | MF0.2–8 | MF0.4–8 | MF0.6–8 | |||
| B | 0 | MF0.2–9 | MF0.4–9 | MF0.6–9 | ||
| Circular | C | 10 | MF0.2–10 | MF0.4–10 | MF0.6–10 | |
| 20 | MF0.2–10 | MF0.4–10 | MF0.6–10 | |||
| D | 0 | MF0.2–12 | MF0.4–12 | MF0.6–12 | ||
| 100 | Square | A | 10 | MF0.2–13 | MF0.4–13 | MF0.6–13 |
| 20 | MF0.2–14 | MF0.4–14 | MF0.6–14 | |||
| B | 0 | MF0.2–15 | MF0.4–15 | MF0.6–15 | ||
| Circular | C | 10 | MF0.2–16 | MF0.4–16 | MF0.6–16 | |
| 20 | MF0.2–17 | MF0.4–17 | MF0.6–17 | |||
| D | 0 | MF0.2–18 | MF0.4–18 | MF0.6–18 | ||
| Scenarios | Classification | D (m) | E (m) | L (m) | |
|---|---|---|---|---|---|
| Single C60 circular cage | |||||
| Scenarios | Pile foundation types | D (m) | E (m) | L (m) | |
| Stocking density | / | 80.00 | 1606.00 | 316.00 | |
| Foundation type | Monopile foundations | 112.00 | 1574.00 | 316.00 | |
| Four-pile jacket foundations | 112.00 | 1574.00 | 316.00 | ||
| Cage layout mode | |||||
| Inter-group spacing (m) | Intra-group spacing (m) | D (m) | E (m) | L (m) | |
| 80 | A | 10 | 80.00 | 917.98 | 303.57 |
| 20 | 80.00 | 847.98 | 298.57 | ||
| B | 0 | 80.00 | 987.98 | 291.64 | |
| C | 10 | 80.00 | 889.00 | 301.50 | |
| 20 | 80.00 | 819.00 | 296.50 | ||
| D | 0 | 80.00 | 959.00 | 287.50 | |
| 90 | A | 10 | 80.00 | 857.98 | 303.57 |
| 20 | 80.00 | 787.98 | 298.57 | ||
| B | 0 | 80.00 | 927.28 | 291.54 | |
| C | 10 | 80.00 | 829.00 | 301.50 | |
| 20 | 80.00 | 759.00 | 296.50 | ||
| D | 0 | 80.00 | 899.00 | 287.50 | |
| 100 | A | 10 | 80.00 | 797.98 | 303.57 |
| 20 | 80.00 | 727.98 | 298.57 | ||
| B | 0 | 80.00 | 867.28 | 291.54 | |
| C | 10 | 80.00 | 769.00 | 301.50 | |
| 20 | 80.00 | 699.00 | 296.50 | ||
| D | 0 | 80.00 | 839.00 | 287.50 | |
| Flow-blocking rafts | |||||
| Scenarios | Intra-group spacing (m) | D (m) | E (m) | L (m) | |
| Individual circular cage | / | 80.00 | 1606.00 | 316.00 | |
| One group (four cages) | 10 | 80.00 | 1653.00 | 301.50 | |
| No. 1 | Attenuation Percentage (%) | No. 2 | Attenuation Percentage (%) | No. 3 | Attenuation Percentage (%) | No. 4 | Attenuation Percentage (%) |
| MF0.2–1 | 94.50 | MF0.2–4 | 94.00 | MF0.2–14 | 93.00 | MF0.2–17 | 93.00 |
| MF0.4–1 | 93.00 | MF0.4–4 | 94.50 | MF0.4–14 | 89.00 | MF0.4–17 | 90.50 |
| MF0.6–1 | 92.33 | MF0.6–4 | 93.83 | MF0.6–14 | 89.50 | MF0.6–17 | 90.00 |
| Average | 93.28 | Average | 94.11 | Average | 90.50 | Average | 91.17 |
| No. 5 | Attenuation Percentage (%) | No. 6 | Attenuation Percentage (%) | No. 7 | Attenuation Percentage (%) | No. 8 | Attenuation Percentage (%) |
| MF0.2–3 | 94.50 | MF0.2–6 | 94.00 | MF0.2–15 | 94.00 | MF0.2–18 | 93.50 |
| MF0.4–3 | 70.00 | MF0.4–6 | 70.80 | MF0.4–15 | 68.60 | MF0.4–18 | 69.40 |
| MF0.6–3 | 87.33 | MF0.6–6 | 88.17 | MF0.6–15 | 85.50 | MF0.6–18 | 86.33 |
| Average | 84.01 | Average | 84.32 | Average | 82.70 | Average | 83.08 |
| No. 9 | Attenuation Percentage (%) | No. 10 | Attenuation Percentage (%) | No. 11 | Attenuation Percentage (%) | No. 12 | Attenuation Percentage (%) |
| JF0.2–1 | 94.00 | JF0.2–4 | 94.00 | JF0.2–14 | 92.50 | JF0.2–17 | 93.00 |
| JF0.4–1 | 85.50 | JF0.4–4 | 85.50 | JF0.4–14 | 82.00 | JF0.4–17 | 83.00 |
| JF0.6–1 | 92.33 | JF0.6–4 | 92.17 | JF0.6–14 | 90.50 | JF0.6–17 | 91.00 |
| Average | 90.61 | Average | 90.56 | Average | 89.00 | Average | 89.00 |
| No. 13 | Attenuation Percentage (%) | No. 14 | Attenuation Percentage (%) | No. 15 | Attenuation Percentage (%) | No. 16 | Attenuation Percentage (%) |
| JF0.2–3 | 94.00 | JF0.2–6 | 93.50 | JF0.2–15 | 94.00 | JF0.2–18 | 93.50 |
| JF0.4–3 | 92.75 | JF0.4–6 | 92.00 | JF0.4–15 | 92.50 | JF0.4–18 | 91.75 |
| JF0.6–3 | 92.17 | JF0.6–6 | 92.50 | JF0.6–15 | 91.83 | JF0.6–18 | 91.17 |
| Average | 92.97 | Average | 92.67 | Average | 92.78 | Average | 92.14 |
| No. 17 | Attenuation Percentage (%) | No. 18 | Attenuation Percentage (%) | No. 19 | Attenuation Percentage (%) | No. 20 | Attenuation Percentage (%) |
| CK0.2–1 | 94.50 | CK0.2–4 | 94.00 | CK0.2–14 | 93.00 | CK0.2–17 | 93.00 |
| CK0.4–1 | 93.25 | CK0.4–4 | 92.75 | CK0.4–14 | 91.50 | CK0.4–17 | 91.50 |
| CK0.6–1 | 92.50 | CK0.6–4 | 92.00 | CK0.6–14 | 91.00 | CK0.6–17 | 91.00 |
| Average | 93.42 | Average | 92.92 | Average | 91.83 | Average | 91.83 |
| No. 21 | Attenuation Percentage (%) | No. 22 | Attenuation Percentage (%) | No. 23 | Attenuation Percentage (%) | No. 24 | Attenuation Percentage (%) |
| CK0.2–3 | 94.00 | CK0.2–6 | 81.50 | CK0.2–15 | 87.00 | CK0.2–18 | 93.50 |
| CK0.4–3 | 92.00 | CK0.4–6 | 80.75 | CK0.4–15 | 86.25 | CK0.4–18 | 91.75 |
| CK0.6–3 | 92.00 | CK0.6–6 | 80.83 | CK0.6–15 | 85.83 | CK0.6–18 | 91.17 |
| Average | 92.67 | Average | 81.03 | Average | 86.36 | Average | 92.14 |
| Scenarios | Single Cage | Grouped Cages | ||||
|---|---|---|---|---|---|---|
| Particle type | Floating feed particles | Settling particles | Floating feed particles | Settling particles | ||
| Density (kg/m3) | 700 | 1550 | 2000 | 700 | 1550 | 2000 |
| Adsorption range (m) | 0–20 | 0–75 | 0–64 | 0–45 | 0–80 | 0–71 |
| Unadsorbed range (m) | 0–25~ 0–29 | 0–80~ 0–84 | 0–69~ 0–73 | 0–69~ 0–73 | 0–84~ 0–91 | 0–75~ 0–89 |
| Scenarios | Major Axis (km) | Minor Axis (km) | |
|---|---|---|---|
| Single cage (C60 circular cage) | |||
| floating feed particles | 0.70 g/cm3 | 11.430 | 2.432 |
| sedimentary particles | 1.55 g/cm3 | 2.368 | 0.435 |
| 2.00 g/cm3 | 0.448 | 0.151 | |
| Four cages (Mode type C in Figure 7) | |||
| floating feed particles | 0.70 g/cm3 | 11.580 | 2.991 |
| sedimentary particles | 1.55 g/cm3 | 2.508 | 0.591 |
| 2.00 g/cm3 | 0.521 | 0.199 | |
| Group cages (Mode (b) in Figure 8) | |||
| floating feed particles | 0.70 g/cm3 | 12.52 | 4.126 |
| sedimentary particles | 1.55 g/cm3 | 3.52 | 1.262 |
| 2.00 g/cm3 | 0.540 | 0.538 | |
| Groups | Velocity | ||
|---|---|---|---|
| (0.2 m/s) | (0.4 m/s) | (0.6 m/s) | |
| Individual circular cage (no culture) | 0.056 | 0.120 | 0.183 |
| Individual circular cage (aquaculture) | 0.036 | 0.082 | 0.130 |
| One group (four cages and aquaculture) | 0.046 | 0.101 | 0.164 |
| CK0.2-4/CK0.4-4/CK0.6-4 (no culture) | 0.012 | 0.029 | 0.048 |
| CK0.2-4/CK0.4-4/CK0.6-4 (aquaculture) | 0.009 | 0.025 | 0.041 |
| Mode | Flow Velocity | Farmed Fish | Front-Positioned Raft | Post-Positioned Raft |
|---|---|---|---|---|
| Layout mode 1 | Fast | Highly susceptible to injury. | Yes | No |
| Layout mode 2 | Medium | Moderately susceptible to injury | Yes | Yes |
| Layout mode 3 | Slow | Less susceptible to injury | No | Yes |
| Scenarios | Minimum Width |
|---|---|
| The main channel is open for two-way traffic | 150 m |
| Inland waterway/branch route | 60 m |
| Small operation and maintenance vessels (intertidal zone) | ≥20 m |
| Port roundabout area | Diameter: 300 m |
| Large platform towing (complex waterways) | Temporary expansion & one-way control |
| Unrestricted navigation area operations | ≥1 nautical mile (1.85 km) |
Disclaimer/Publisher’s Note: The statements, opinions and data contained in all publications are solely those of the individual author(s) and contributor(s) and not of MDPI and/or the editor(s). MDPI and/or the editor(s) disclaim responsibility for any injury to people or property resulting from any ideas, methods, instructions or products referred to in the content. |
© 2025 by the authors. Licensee MDPI, Basel, Switzerland. This article is an open access article distributed under the terms and conditions of the Creative Commons Attribution (CC BY) license (https://creativecommons.org/licenses/by/4.0/).
Share and Cite
Ji, M.; Zou, W.; Long, Y.; Ye, J. Research on Cage Layout Mode Based on Numerical Simulation of Flow Field Disturbance Response and Suspended Particulate Matter Diffusion: A Case Study of the Nanpeng Island Wind Power Sea Area in Yangjiang City, China. Sustainability 2025, 17, 7679. https://doi.org/10.3390/su17177679
Ji M, Zou W, Long Y, Ye J. Research on Cage Layout Mode Based on Numerical Simulation of Flow Field Disturbance Response and Suspended Particulate Matter Diffusion: A Case Study of the Nanpeng Island Wind Power Sea Area in Yangjiang City, China. Sustainability. 2025; 17(17):7679. https://doi.org/10.3390/su17177679
Chicago/Turabian StyleJi, Mengqi, Wenhao Zou, Yan Long, and Jinshao Ye. 2025. "Research on Cage Layout Mode Based on Numerical Simulation of Flow Field Disturbance Response and Suspended Particulate Matter Diffusion: A Case Study of the Nanpeng Island Wind Power Sea Area in Yangjiang City, China" Sustainability 17, no. 17: 7679. https://doi.org/10.3390/su17177679
APA StyleJi, M., Zou, W., Long, Y., & Ye, J. (2025). Research on Cage Layout Mode Based on Numerical Simulation of Flow Field Disturbance Response and Suspended Particulate Matter Diffusion: A Case Study of the Nanpeng Island Wind Power Sea Area in Yangjiang City, China. Sustainability, 17(17), 7679. https://doi.org/10.3390/su17177679


