Article

Research on Cage Layout Mode Based on Numerical Simulation of Flow Field Disturbance Response and Suspended Particulate Matter Diffusion: A Case Study of the Nanpeng Island Wind Power Sea Area in Yangjiang City, China

School of Environment and Climate, Jinan University, Guangzhou 510630, China
*
Author to whom correspondence should be addressed.
Sustainability 2025, 17(17), 7679; https://doi.org/10.3390/su17177679
Submission received: 21 July 2025 / Revised: 15 August 2025 / Accepted: 21 August 2025 / Published: 26 August 2025

Abstract

Clarifying the changes in the flow field, trajectory, and range of particulate matter such as input detritus and feces of marine aquaculture in offshore wind farms is of great importance for optimizing the layout of cage culture, preventing water pollution, and promoting the integrated development of wind power and aquaculture. This study designed multiple scenarios based on the basic data of the Nanpeng Island wind farm. The flow field changes were simulated through a k-epsilon model based on the porous medium model, and the particle diffusion range and trajectory were simulated via the discrete phase model (DPM) and the MIKE 21 model. The results showed that flow velocities in the whole area, except in the region near the wind turbine, were unaffected by the monopile or jacket foundation. The center velocities of the cages decreased by 14.58% and 21.45%, respectively, when culture density increased from 12.5 to 20 kg/m3. In the case of one-way inflow, placing rafts upstream of the aquaculture area can effectively slow down the flow velocity, which is reduced by 45.2% and 32.3% at the inlet and center of the cage, respectively. In the case of the occurrence of unidirectional water flow, downstream raft frames, arranged in a triangular pattern, could align with the cage center axis. Under actual sea conditions, the raft frame could be arranged in an elliptical shape around the cage. The ratio of the length of its major axis to that of its minor axis is approximately 3:1.

1. Introduction

The concept of the integrated development of offshore wind power and fishery farming has been proposed in some countries for years. Representatives such as Germany, the Netherlands, Belgium, and South Korea have launched a number of pilot studies on the integration of offshore wind power and sea ranching since 2000 [1,2,3]. China has also begun a similar exploration since 2019. With the successive launch of several demonstration projects, the integration of offshore wind power and sea ranching has entered a substantial development stage [4]. These projects not only help to improve the efficiency of marine resource utilization but also promote the coordinated development of renewable energy and fisheries. These attempts provide new paths to achieve sustainable development goals.
Deep-sea aquaculture has several advantages over traditional land-based and offshore aquaculture [5,6]. It takes place far from the coast, accessing better water environments and more stable marine conditions related to temperature, oxygen levels, and salinity, thus improving the quality of fish farming and reducing human interference [7,8]. However, the flow rate of deep-sea water varies greatly. Both too fast and too slow flow rates can have a significant impact on farmed species. An appropriate flow rate can increase muscle content by promoting the movement of fish [9]. Meanwhile, the input of an appropriate amount of debris and manure produced by aquaculture is conducive to enhancing the biodiversity of the nutrient-poor deep-sea areas. In low flow rate situations, however, excess nutrient input may result in local water pollution, affect the growth of fish, etc. [10]. Correspondingly, although an overly fast flow rate helps to dilute and accelerate the diffusion of waste particles, it also significantly increases the risk of fish injuries [11]. Therefore, clarifying the responses and changes in the flow field and particulate matter diffusion range in the aquaculture sea area under different situations and summarizing the results play a crucial guiding role in carrying out deep-sea aquaculture activities [12,13].
Currently, deep-water cage culture is the most common method used in deep-sea areas. The Nanpeng Island wind farm is one of the most representative examples in the South China Sea. In this study, a validated porous medium model was used to study the effects of culture density, pile foundation, and flow resistance facilities on the flow field. Based on the basic data of Nanpeng Island, two particle diffusion models were used to measure and calculate the particle escape trajectory range under different scenarios. According to the above research results, the paper puts forward some specific layout suggestions. The research results provide a scientific basis for improving the efficiency of aquaculture and optimizing the spatial layout under the integration of wind and fishery.

2. Methodology

2.1. Research Sea Area

The Nanpeng Island offshore wind farm is located in Yangjiang City, Guangdong Province, China, with a sea area of about 58 km2 and a total installed capacity of 400,000 kilowatts. The water depth is between 23–32 m, and the nearest distance from land is about 28 km. Water temperature and salinity fluctuations are minimal. The seabed conditions, flow speeds, light intensity, and light duration remain relatively stable, creating an environment suitable for developing sea farming. The control points of the site are as follows:
  • Point A: 112.167° E, 21.468° N;
  • Point B: 112.167° E, 21.353° N;
  • Point C: 112.255° E, 21.376° N.
The arrangement diagram of the wind turbine generator is shown in Figure 1. A total of 32 pile foundations are monopile, and 41 are four-pile jacket types. The turbines are arranged in five rows, with row spacing of about 11 D and column spacing of about 4.2 D, where D (impeller diameter) is 155 m. The area between the foundations forms a rectangle of 1705 m by 651 m.

2.2. Current Velocity Selection

The initial flow velocities used in simulation and calculation are set using measurement data. Six stations, NP1, NP2, NP3, NP4, NP5, and NP6, evenly distributed across the Yangjiang Nanpeng offshore wind farm, are selected for current speed and direction monitoring in different seasons and weather conditions. The ADCP is used to obtain synchronous continuous measurements for 25 h. Flow velocities of the surface, middle, and bottom of the basin in each station are selected for data analysis. The calculation method of the flow velocity is shown in Supplementary File S1.
Based on measured current data from wind farm observation points, horizontal current velocity is resolved, selecting appropriate intervals (Table 1). The average velocity ranges from 0.05–0.2 m/s, with the highest velocities mainly between 0.3–0.4 m/s. Maximum velocities during spring, moderate, and neap tides are 0.69, 0.55, and 0.82 m/s, respectively, in summer, and 0.59, 0.71, and 0.95 m/s, respectively, in winter. Therefore, the initial flow velocities were set at 0.2 m/s, 0.4 m/s, and 0.6 m/s.

2.3. Mathematical Model

(1)
The standard k-epsilon model
The standard k-epsilon model, one of the most commonly used simulation models in CFD analysis [14], solving the k and epsilon equations to provide information on turbulent velocity and scale inside the cage, was utilized to describe the turbulent motion in the flow. The basic formulas, descriptions, and targeted optimization measures related to the k-epsilon model are shown in Supplementary File S2.
(2)
Discrete Phase Model (DPM)
DPM is a numerical method widely used to simulate the motion and interaction of discrete phases such as solid particles, droplets, or bubbles in fluids. This method can precisely describe the acceleration, deceleration, and rotation of particles in the flow field, as well as the collision behaviors with other particles or walls. The collective behavior of particle groups is analyzed at multiple scales through the principles of statistical mechanics, thereby effectively revealing the macroscopic dynamic characteristics of the particle system. The motion of all particles follows Newton’s second law. The relevant basic formulas and descriptions are provided in Supplementary File S3.
(3)
MIKE 21 particle dispersion model
MIKE 21 software was used to simulate particle dispersion in actual coastal waters. (1) Hydrodynamic Model: The DHI MIKE 21 Flow Model establishes a hydrodynamic numerical model. It simulates two-dimensional free-surface flows, incorporating factors like bathymetry, rainfall/evaporation, wind speed, and underlying surfaces for accuracy. (2) Particle Tracking: The DHI MIKE 21 particle tracking module simulates the dispersion of feces and feed particles and calculates the diffusion trajectory and range of suspended particles. (3) ECO Lab Coupling: The ECO Lab model (DHI’s advanced water quality and ecology tool) is coupled with the hydrodynamic model to simulate dispersion in wind-affected aquaculture areas. This grid-independent module integrates seamlessly with the HD solver within MIKE 21 FM, describing physical processes and ecological interactions under state variables for more realistic ecosystem responses. A custom ECO Lab template couples with the particle module for physical transport calculations. The basic formulas and descriptions are shown in Supplementary File S4.

2.4. Model Setting

(1)
Porous media model
A porous media model was employed to quantify the flow resistance generated by the aquaculture cage. The flow velocity change results were obtained via the standard k-epsilon model in ANSYS FLUENT 2021 R1. Porous media models simulate the presence of porous structures (e.g., filter materials, packing materials) during fluid flow, enabling accurate simulations of complex flow scenarios at reasonable computational costs. Due to the small-scale, flexible nature of fishing nets, this study treats high-density fish populations as a homogeneously distributed entity and uniformly regards the net panels and the cage interior as porous media. [15,16]. Its porosity is the ratio of the volume of fish in the cage to the overall volume of the cage. Such a treatment enables the calculation of the effect of cultured fish on the surrounding water flow in simulations. There are some relevant numerical models that have been developed to simulate the flow field around the cage in the water flow [17,18].
(a)
Fish drag coefficient
The inertial resistance coefficient and viscous resistance coefficient formulas are as follows [19].
D n = D l = 150 D p 2 ( 1 e ) 2 e 3
e = 1
C n = C l = 3.5 D P ( 1 e ) e 3
where e   is the porosity of the culture cage, determined by the volume of cultured fish, D P   is the particle size of the porous medium, and is the volume fraction of fish.
(b)
Net coats drag coefficients
Patursson [20] used the least squares method to determine the porous media coefficient for netting perpendicular to water flow, based on model tests and empirical formulas relating flow velocity and resistance.
D n = 1.11 × 10 7 S n e t 3 + 2.26 × 10 6 S n e t 2
D l = 3.97 × 10 5 S n e t 2 + 1.33 × 10 6 S n e t
C n = 70.2 S n e t 2 + 13.2 S n e t
C l = 31.9 S n e t 2 + 6.93 S n e t
where S n e t   is the density of netting; S n e t   = 2 d/a, d is the diameter of netting line, and a is the mesh leg length.
(c)
Resistance parameter of raft-rack shellfish aquaculture:
V f l o a t = π ( d 2 ) 2 h
V s h e l l = 4 3 π ( l 2 ) 3
ϵ = 1 V t o a t a l , a l l V r e g i o n
Permeability calculation using the Carman–Kozeny equation:
K = ϵ 3 180 D p 2 ( 1 ϵ ) 2
C n = C l = μ K
The inertial resistance coefficient utilizes the second term of the Ergun equation:
D n = D l = 1.75 ρ ( 1 ϵ ) ϵ 3 D p 2
where V f l o a t is the volume of a single pontoon (cylinder) of a single shellfish, V s h e l l is the volume of a shellfish (assumed to be an ellipsoid), ϵ is the porosity, V r e g i o n is the volume of the total area, and K is the permeability. Assume the dynamic viscosity of water is approximately 1 × 10⁻³ Pa-s/m2, and the density ρ is approximately 1000 kg/m3.
(d)
Mesh Independence Verification
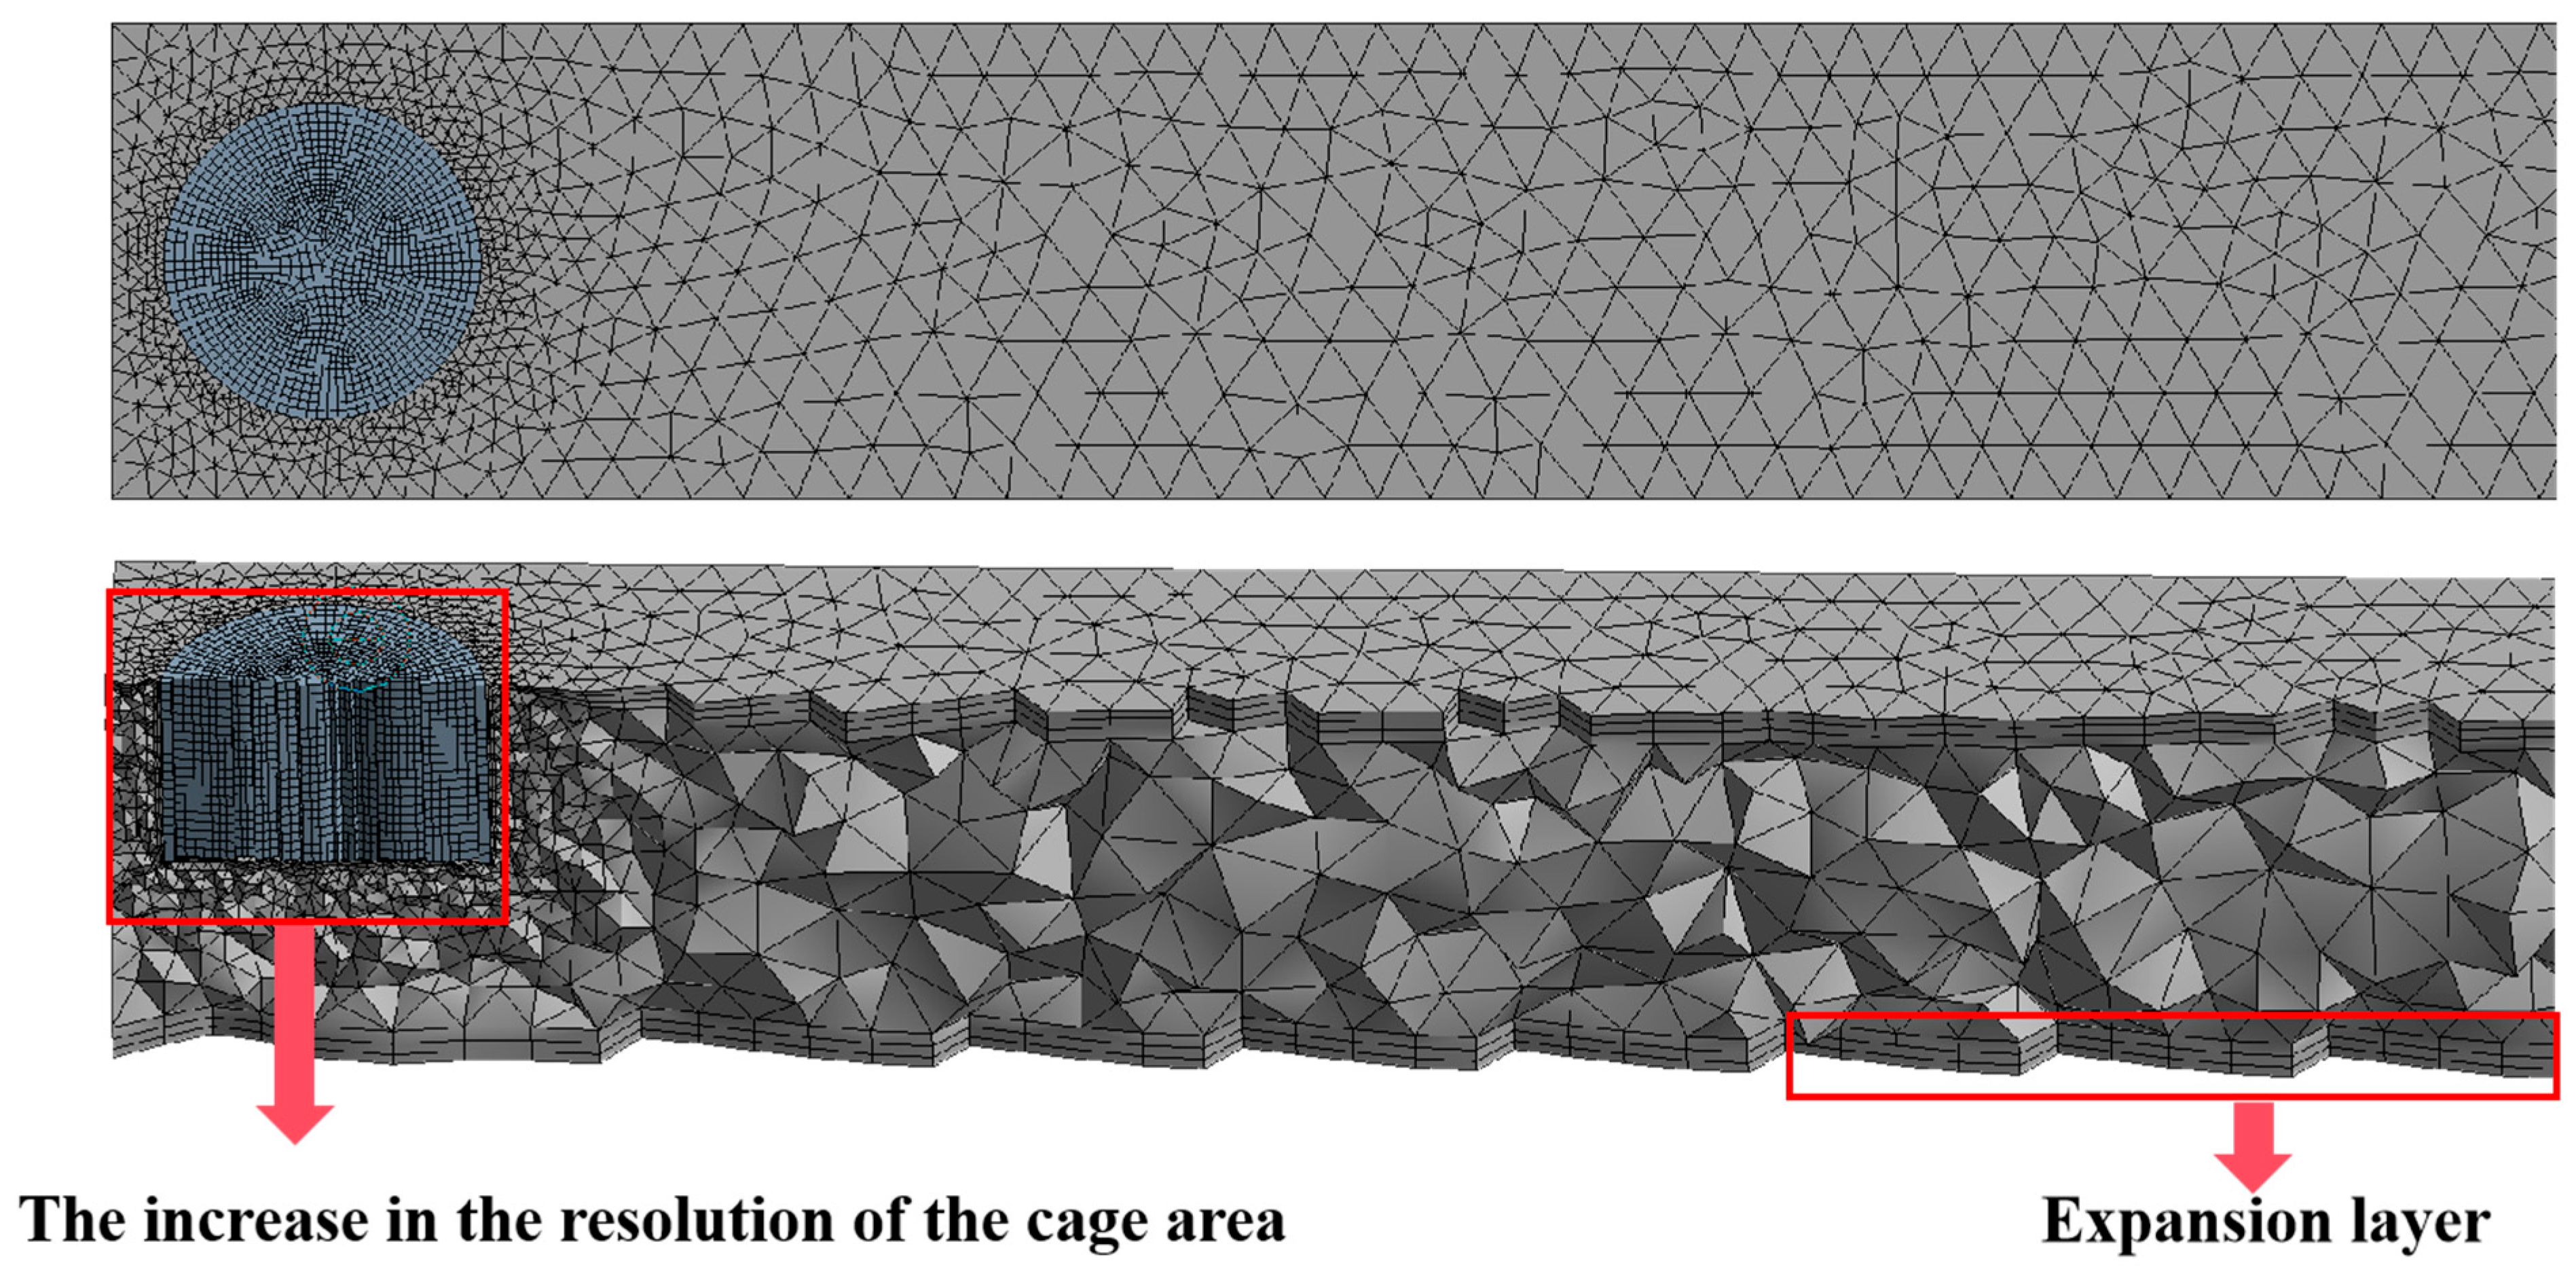
To make the experimental results more accurate, this study adopted a regionalized mesh division strategy in the model calculation and combined it with the k-ϵ turbulence model to balance the calculation accuracy and efficiency. The specific optimization measures are as follows:
(i)
Regionalized mesh density setting. In view of the structure of the cage and the characteristics of the surrounding flow field, the computing domain was partitioned; that is, the background area and the cage densification area were set up in a hierarchical manner to avoid the waste of resources of the uniform mesh throughout the domain, especially the densification mesh near the porous medium interface (such as the cage wall). An increase in local resolution can more accurately capture the flow velocity gradient and pressure abrupt changes, especially in the interaction area between the internal and external flow fields of the cage, ensuring high-resolution simulation of key physical phenomena such as turbulent vortices and shear layer separation.
(ii)
Addition of expansion layer. At the wall surface of the cage and the interface of the porous medium, the thickness of the grid is increased layer by layer to ensure that the flow characteristics within the boundary layer (such as the velocity profile and the distribution of turbulent kinetic energy) are accurately analyzed. The setting of the expansion layer not only improves the calculation accuracy of the flow field near the wall, but also significantly reduces the influence of numerical dissipation on the simulation results.
(iii)
Optimization of the k-ϵ turbulence model. The standard k-ϵ model is adopted and combined with wall functions to handle the flow in the near-wall region. By adjusting the parameters of the turbulence model (such as the initial values of turbulent kinetic energy k and turbulent dissipation rate ϵ), the adaptability of the model to complex flows (such as wake effects around cages and disturbances caused by fish school activities) was further optimized.
(iv)
Verification and iterative optimization. The simulation results are verified through experimental data (such as flow velocity measurement and pressure distribution), and the mesh division and model parameters are iteratively optimized based on error analysis. This process ensures the reliability and scientific nature of the simulation results.
To determine whether the parameter settings are accurate, several key parameters were selected and compared in this study, namely the regionalized mesh resolution and the expansion layer number setting. In addition, uniformly setting the number of iterations to 1000 can meet the requirements that the residual of the continuity equation is reduced to less than 10−4 (the difference between adjacent step solutions approaches 0), and the fluctuation range of the flow velocity at the monitoring points is less than 1% (ensuring stable output).
Through the combination test of nine groups of parameters (see Table 2 for details), the following screening conclusions were established. Among the nine cases, when the number of expansion layers is 1, the boundary layer resolution is insufficient. When the number of expansion layers is 5, the calculation time consumption surges sharply, and the improvement accuracy of the scheme is less than 2%. When the mesh resolution is 2/1, the time consumption for a single case is more than 120 min. When it is 6/3, the output data of the calculation result are small, the fitting accuracy is low, and the resolution of the wake field is insufficient. Therefore, in this study, the parameter settings are selected as 4/2–3; that is, the mesh resolution in the flow field area is 4 m, the mesh resolution in the cage area is 2 m, and the number of expansion layers is set to 3. At this time, the average operation time is approximately 43 min, the output volume is moderate, and both accuracy and efficiency are taken into account.
(e)
Boundary condition setting
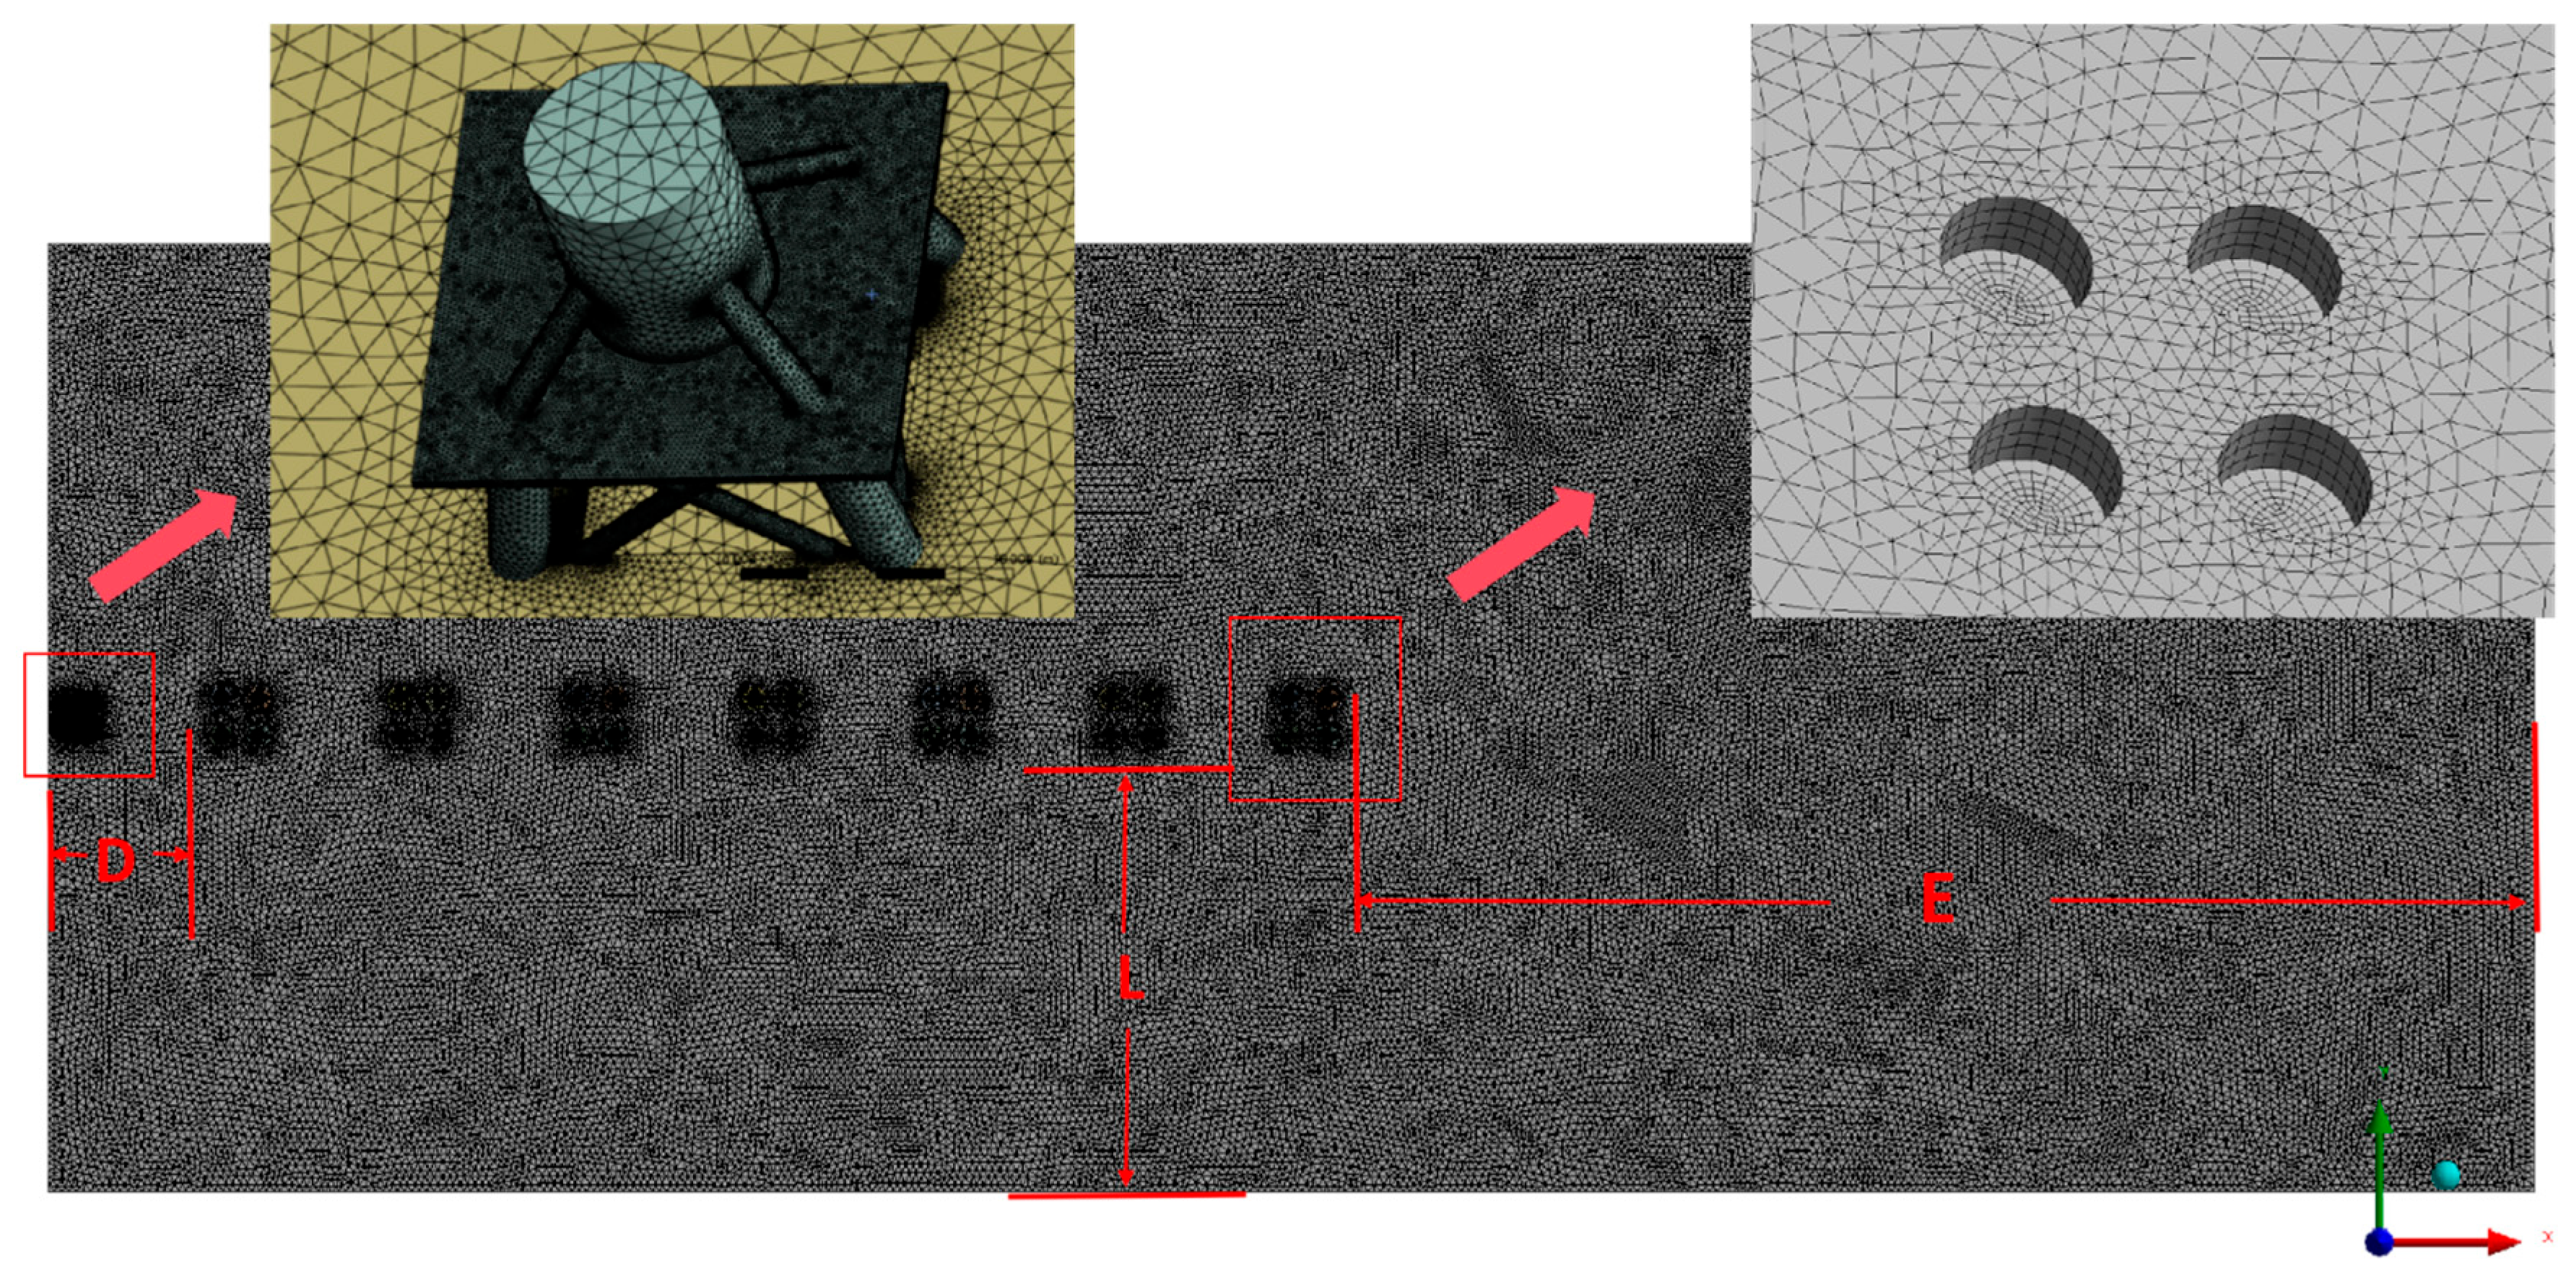
This simulation conducts numerical simulation using the discrete control equation of the Finite Volume Method. The solution adopts the unsteady separation implicit algorithm, and the SIMPLE algorithm is selected for the pressure–velocity coupling, which is conducive to the rapid convergence of the numerical values and the improvement of their accuracy. The positive direction of the X-axis is defined as the direction of water flow, and the positive direction of the Z-axis is defined as the opposite direction of gravity. The inlet adopts a uniform flow profile; that is, U i n = U o (suitable for steady-state condition verification), the outlet is set as a free outflow condition, and the static pressure compensation is set to 0 Pa (relative pressure reference) to avoid backflow distortion. The momentum source term of the cage wall is defined by the parameters of the porous medium, and the side wall/bottom surface/top surface of the flow field adopts a solid wall boundary condition without slip (shear stress is 0). Among them, the main area adopts unstructured tetrahedral grids (adapted to the complex terrain of the aquaculture sea area), and the boundary layer of the cage adopts prism layer mesh to achieve high-precision capture of the boundary layer (Figure 2).
(f)
Model verification
In order to ensure the accuracy and scientific nature of the model calculation, the literature data from refs. [21,22] were used to construct a model employing the same scale and flow conditions. The calculated results were compared with the experimental validation or field measurement results in the literature to assess the consistency between the model calculations and the literature data, thereby verifying the model’s effectiveness. The results calculated by the model are basically consistent with the measured data. All errors are within 2%, which proves that porous media can well-describe the changes in the actual flow field. The relevant charts and descriptions are shown in Supplementary File S5.
(2)
Discrete phase particle models (DPM)
According to characteristics of the Trachinotus ovatus’ floating feed and feces provided in the literature, particle densities were set as 0.70 and 2.00 g/cm3. A representative of middle-lower fish feed of 1.55 g/cm3 was used as the control. In calculation, particles are assumed to free-fall vertically into the water; T. ovatus’ floating feed flows out of the cage from the sidewall, whereas that of middle-lower fish feed (sedimentary) flows from the bottom.
(3)
MIKE 21
(a)
Particle parameter setting
The three particle density settings are the same as those listed above: 0.70, 1.55, and 2.00 g/cm3. Based on the references and experimental data, the individual masses are set to 9.90 mg for floating feed particles (0.70 g/cm3), and 21.21 mg and 28.27 mg for sedimentary particles (1.55 g/cm3 and 2.00 g/cm3, respectively), with settling velocities of 0.81 cm/s and 3.78 cm/s, respectively.
(b)
Boundary condition setting
The model simulated the hydrodynamic conditions within the model domain from 1 April to 10 April 2025. To enhance the reliability of model parameters, initial conditions were set using a hot start approach. This involved simulating the hydrodynamic environment for the preceding month and importing those results as the initial conditions. The specific model parameter settings are shown in the Table 3.
The research range of this model is 111.76° E–112.99° E and 20.51° N–22.04° N. The model adopts an unstructured triangular mesh, and the calculation area includes the Nanpeng Island offshore wind farm and its surrounding sea areas. Among them, the land boundary data and water depth data are derived from the electronic nautical charts of the China Maritime Safety Administration. A total of three open boundaries were set, and the boundary tidal level data were obtained using the Tidal Prediction of Heights tool in DHI MIKE 21. The wind field data are derived from the meteorological reanalysis data provided by the European Center for Medium Range Weather Forecasts (ECMWF), and the data content mainly consists of the horizontal components of wind speed at a height of 10 m above sea level. The model is set with a total of 14,229 nodes and 26,695 triangular units. The mesh and boundary settings are shown in Figure 3.
(c)
Mesh sensitivity analysis and model verification
To ensure the stability of the model, the angle of each triangle should be greater than 30° and less than 120°, and the area ratio of two adjacent triangles should not exceed 1/2. Considering the limitation of computing power, smaller rivers in the land boundary and smaller islands in the ocean have been removed. As shown in Table 4, this study conducted a sensitivity analysis on three parameter configurations. The results indicated that when the resolution was greater than 500, the data output decreased by 15.75%, and the data accuracy dropped sharply. However, when the resolution was less than 50 m and the number of regional meshes to be calculated exceeded 50,000, the operation time was more than 240 min, and the number of error reports increased sharply. Therefore, the horizontal resolution of the regional meshes in this study is set at 50–500 m. At this time, the balance between operation time and data accuracy and quantity can be guaranteed.
The calculation results of the tide level were verified by using the observation data from a specific tide level station on one of the model’s open boundaries. The actual tide level data is based on the hourly observation data from 0:00 on 1 April to 0:00 on 10 April. The tide height reference plane of this tide level station is 170 cm below the average sea level. The tide level verification results show that the simulation results are basically consistent with the high and low tide levels and the phase of the process line in the measured data. The tide level values obtained from the simulation at the corresponding observation points are in agreement with the measured tide level, and the correlation coefficient R is 0.9604. Therefore, this hydrodynamic model can be used to accurately reproduce the tidal current conditions within the study area. The result of the tide level verification is shown in Figure 4.

2.5. Scenario Settings

2.5.1. Scenario: Flow Field Disturbance Response

(1)
Stocking density and foundation type
Assumption: the T. ovatus were cultured in a single C60 circular cage (approximately 19.10 m in diameter) with 0.2 net solidity, and they uniformly distributed within the fish cage.
(a)
Trachinotus ovatus densities
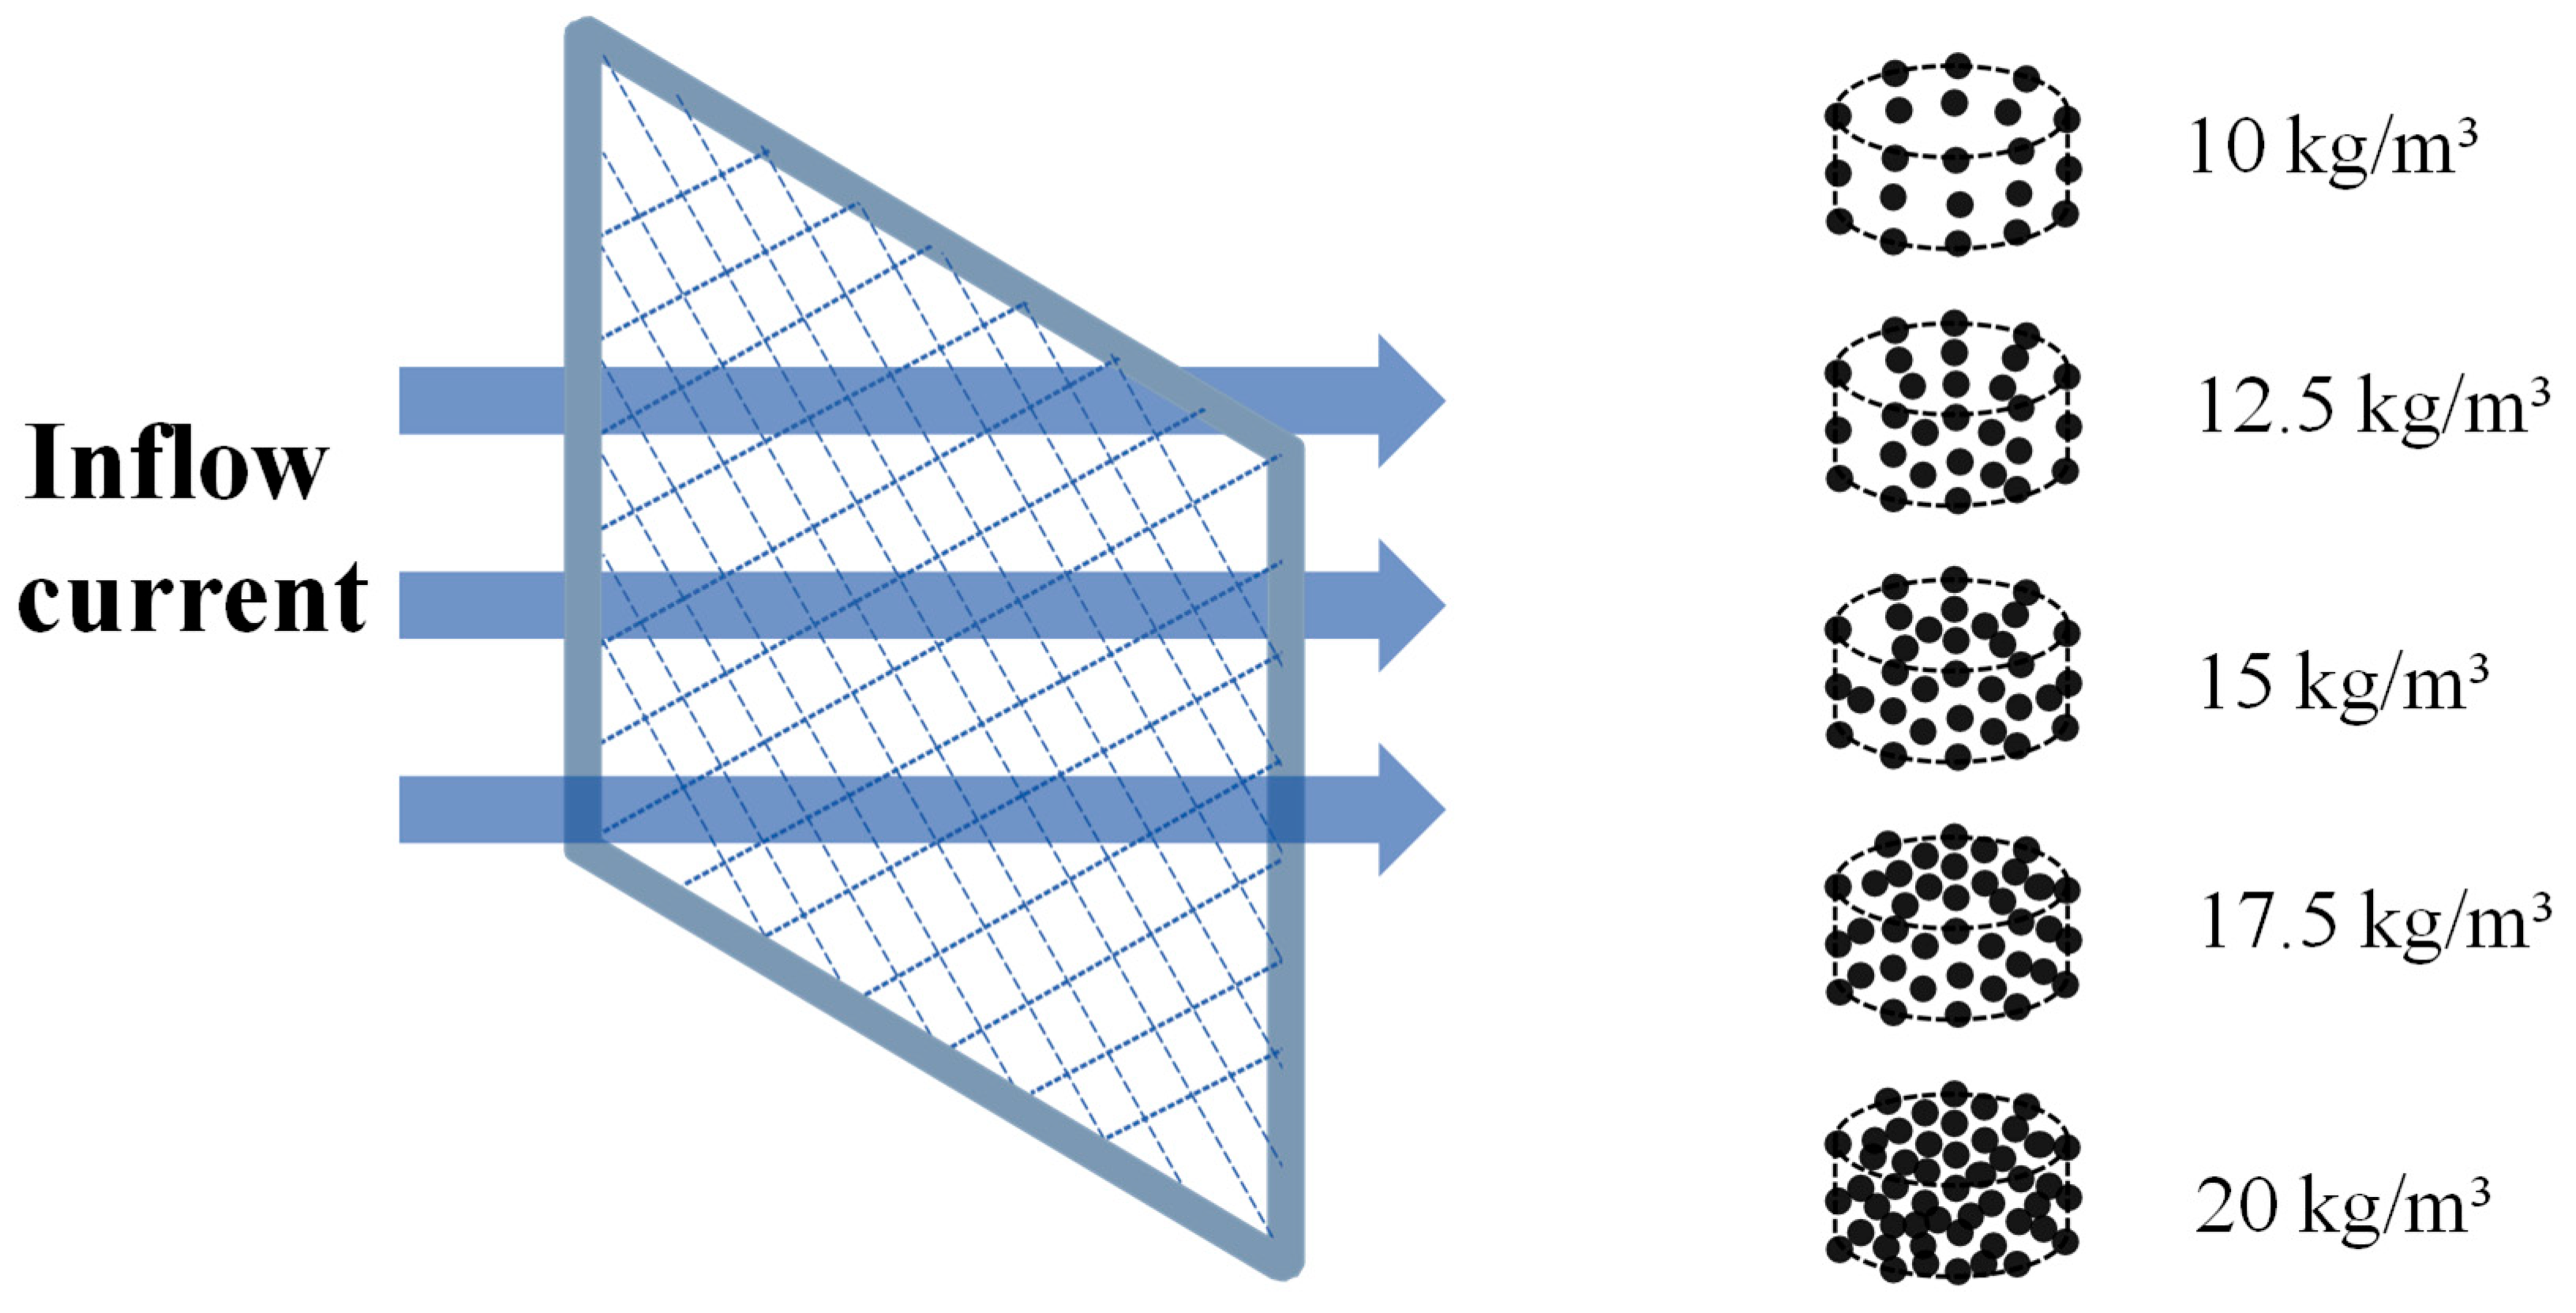
According to the aquaculture technical guidelines for breeding T. ovatus and actual farming conditions, the densities are set at 10, 12.5, 15, 17.5, and 20 kg/m3, respectively. The flow field in a single circular C60 cage without fish is used as the control (Figure 5).
(b)
Pile foundation
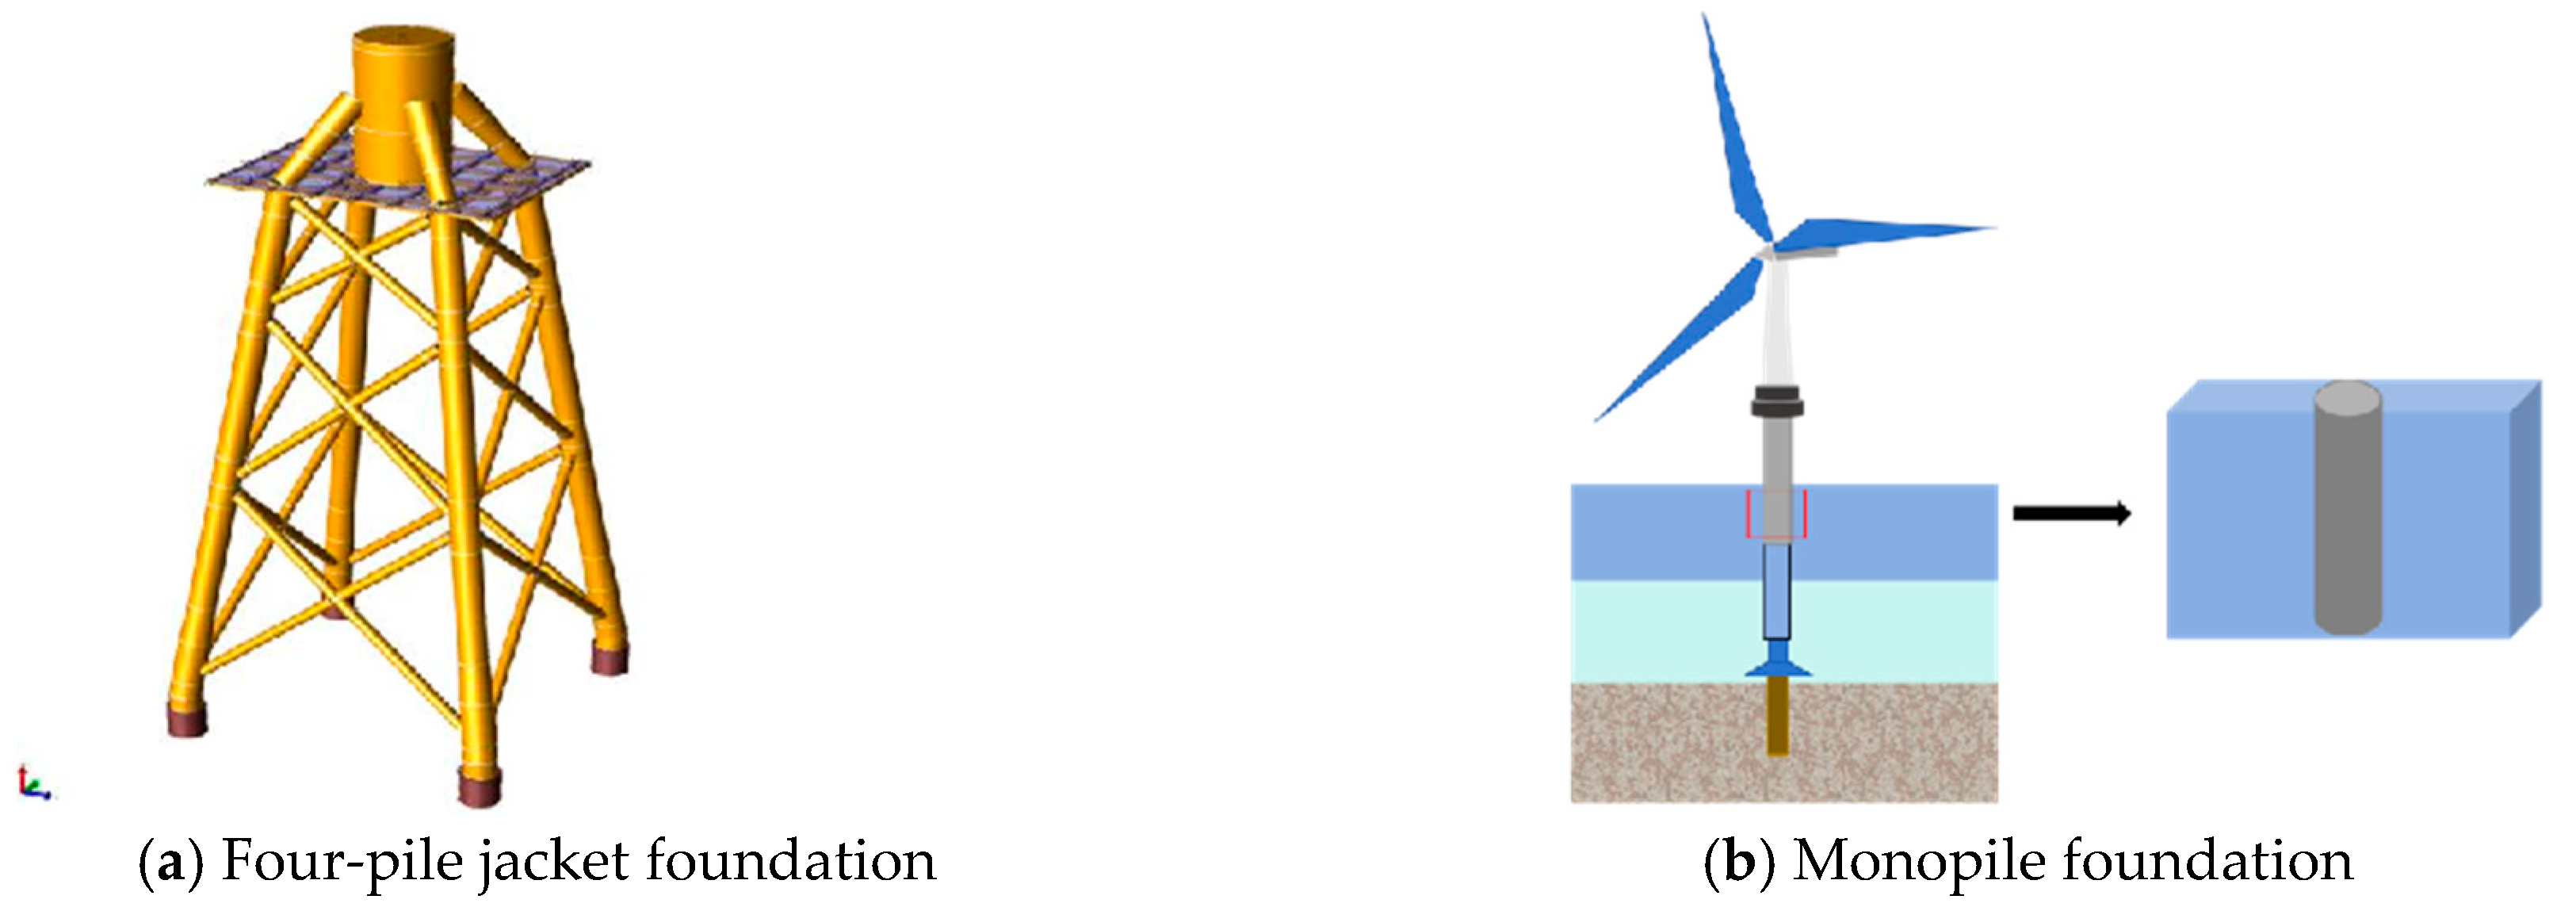
Pile foundation structures may cause variations in the flow field in the aquaculture cage areas. Nanpeng Island wind farm was constructed using monopile and four-pile jacket foundations (abbreviated as “MF” and “JF”), the pipe diameter of the former is about 8 m, and that of the latter is 2.4 m, with 22 m between pile centers (Figure 6).
(2)
Cage layout mode
According to the arrangement of the foundations in the Nanpeng Island wind farm, every four-pile foundation comprised a 1705 m × 651 m rectangular area. The first and the second schematic represent a rectangle formed by four JFs and four MFs, respectively, with the third used as the control, without a foundation.
Both circular and square cages are generally used in aquaculture. Single or assembled groups with four cages were considered in this work. To keep the capacity consistent, the single circular and square cages were approximately 38.20 m in diameter and 33.86 m in side length, whereas the assembled cages were approximately 19.10 m by 16.93 m, respectively. The interspacing between two cages in the assembled cage is set as 10 and 20 m, while the outer spacing between the assembled sample or the larger single cage is set as 80, 90, and 100 m, respectively. There are 18 arrangements in total. The entrance boundary is 80 m from the first row of cages, with the upper edge at the water’s surface. There are four modes shown in Figure 7. The detailed designs are showed in Figure 8.
In the MF scenarios, there are 18 arrangements at each flow velocity, for a total of 54 arrangements (Table 5), those for JF (JF0.2–1–JF0.6–18) and the control (CK0.2–1–CK0.6–18) are the same as above.

2.5.2. Scenario: Particle Diffusion

Based on the cage arrangement mode and the inflow velocity, the DPM model and the MIKE 21 model, respectively, were used to simulate and calculate the escape trajectories, ranges, and boundary points of particulate matter in the scenario of unidirectional incident water flow and the actual sea area of the Nanpeng Island wind farm. Combined with the research results of the flow field disturbance response, targeted layout optimization methods are proposed.

2.5.3. Scenario: Flow-Blocking and Food Filtration Rafts

(1)
Unidirectional incident water flow
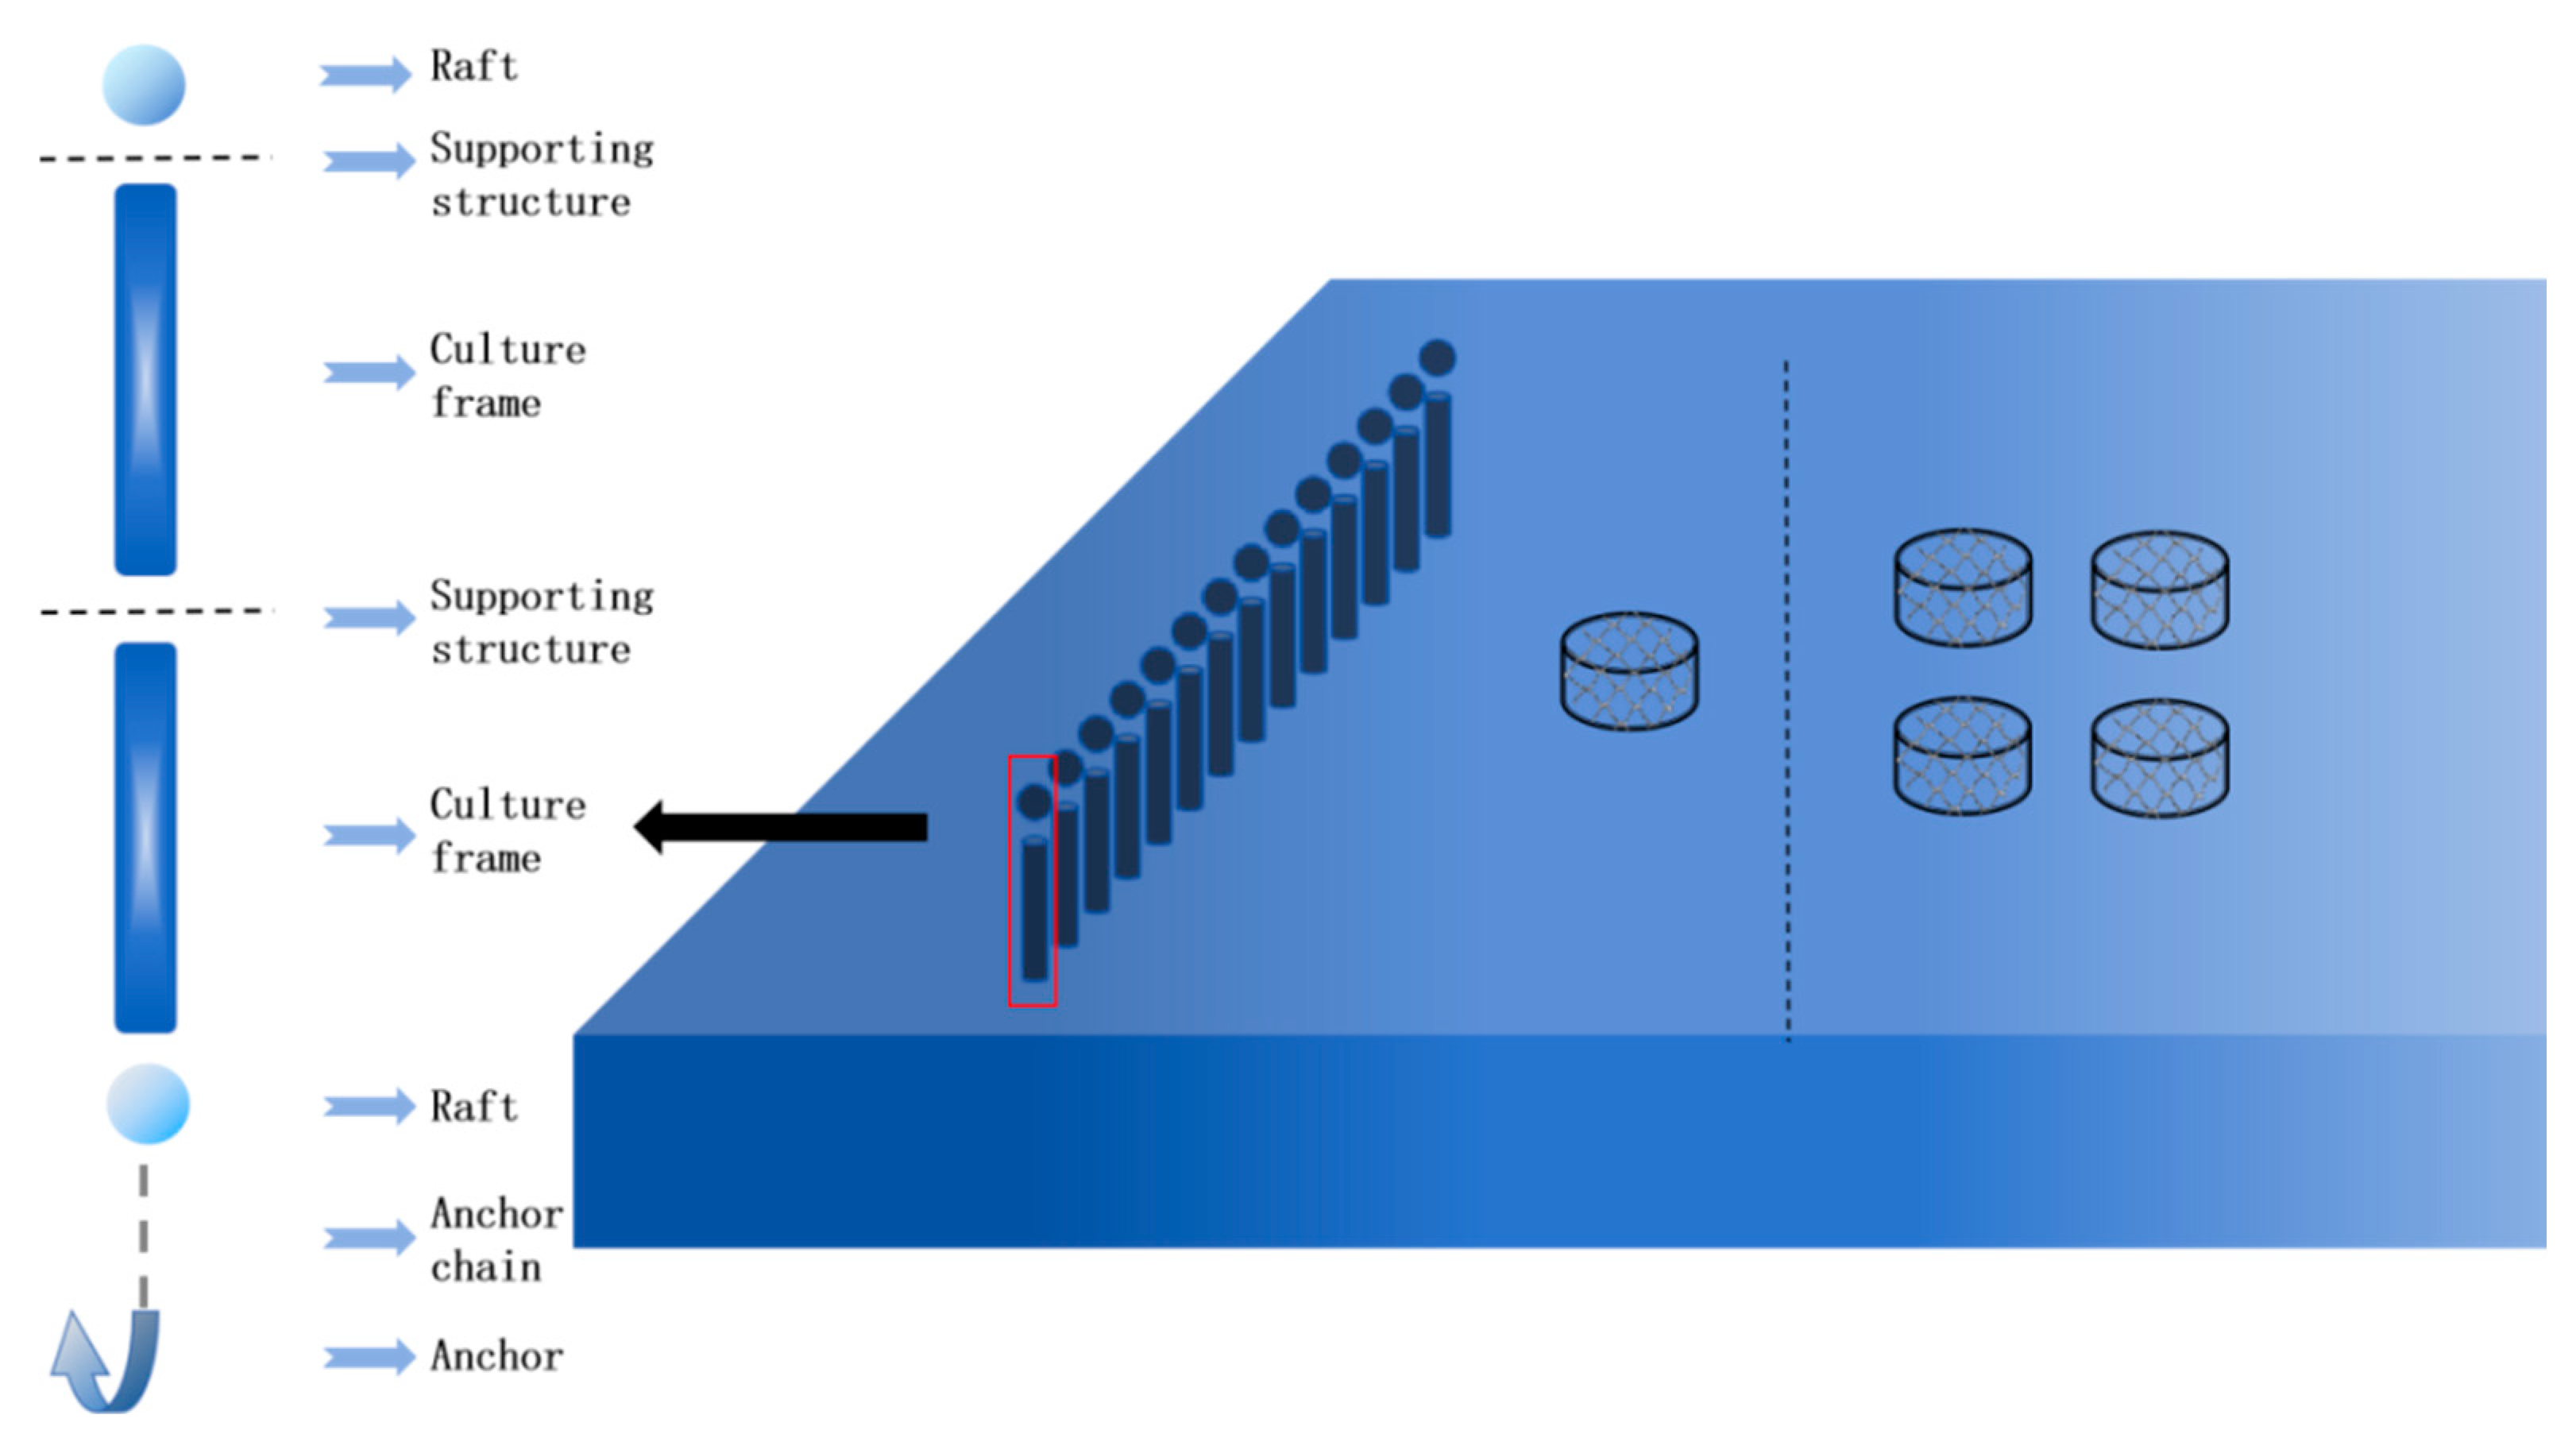
The velocity of the deep sea changes greatly. In some extreme cases, the fast water flow may trap fish into the wall of the cage, causing injury or even death. The flow-blocking raft frames were set in the upstream sea area to study the changes in the flow field in the aquaculture sea area and to determine whether this layout method can effectively reduce flow velocity for fish culture. In this study, a row of floating racks for shellfish farming, totaling 140 lines, was set up in a rectangular area measuring 48 m × 3 m × 8 m as a current barrier (Figure 9). The floating rack is a cylinder with a diameter of 25 cm and a height of 8 m. Assuming shellfish are farmed at a density of 400 per meter, their number reached 3200 ind./line. According to references [23,24], the shellfish were considered to display an average length of 8 cm and a weight of 40 g.
In addition, the localized aquaculture areas with intensive cage layouts may elevate pollution risks due to particle inputs from feed or feces. Mussels are able to filter and feed on suspended particles such as undigested feed and fish feces [25,26] to effectively improve water quality and ecosystems. Therefore, mussels were also used as a post-filtration mechanism in this work [27,28].
(2)
Actual wind-farm sea area
In the scenario where the water flow is unidirectional, the front and rear shellfish rafts, respectively, are used for blocking the flow and filtering food. However, in the actual marine situation, the layout of the rafts will be positioned around a certain point or row in the cage arrangement as the center or the central axis, thus forming a layout pattern of blocking and filtering in coordination. The arrangement mode of the single-row raft frame is the same as that shown in Figure 6. This study will provide targeted raft layout models based on the particle diffusion patterns in the unidirectional incident water flow simulation and the actual marine area simulation of wind farms.

2.5.4. The Boundary Distances of Different Layout Modes

In Table 6, D (Domain) represents the distance from the entrance of the flow field to the boundary of the first row of cages, E (Exit) represents the distance from the boundary of the last row of cages to the exit of the flow field, and L (Lateral) represents the distance from each row of cages to the lateral boundary. This table provides the boundary distances set for different cage layouts in all the scenarios simulated in Section 2.5.1 and Section 2.5.2 The following two points should be noted:
(1)
In the research scenario of “Foundation Type”, due to the size of the pile foundation and the distance layout requirements of the surrounding facilities of the pile foundation, the distance between the flow field entrance and the front wall of the cage has increased. However, the model setting still retains the cage walls in each experimental group in the same X-plane to control the accuracy of the simulation data, and the inflow velocity is also consistent with that of the other experimental groups.
(2)
For the different arrangement methods (single/group/row) used in particle simulation, the distance between the cage and the boundary setting is the same as that in the corresponding layout mode shown in the following table.
The simulation diagram of the overall sea area is shown in Figure 10. The size of the simulated sea area is uniformly set at 1705 × 651 m. Here, the layout mode of the C60 group cages under four-pile jacket foundations is taken as an example.

3. Results

3.1. Flow Field Disturbance Response

3.1.1. Stocking Densities

At farming densities of 10, 12.5, 15, 17.5, and 20 kg/m3, the flow velocity at the center of a single cage was reduced by about 12%, 14.58%, 16.99%, 19.28%, and 21.45%, respectively, compared with the that of the cage not used for fish farming. The flow velocity decreased with density, increasing in a ratio of 0.92% per 1.0 kg/m3.
Considering the behavioral characteristics of T. ovatus, the flow velocity attenuation in the center of the cage should be less than 15%. Therefore, a farming density of 12.5 kg/m3 is used for calculation. As Figure 11 shows, the degree of flow velocity attenuation rises with the increase in initial flow velocity.
Compared with the initial velocity, the flow velocity of the wake that returns to a steady state decreased by about 13.81%, 13.23%, and 13.48%, respectively. Farming density selection should be based on inlet flow velocity. While faster inlet velocities promote quicker wake recovery, they also cause greater turbulence decay.

3.1.2. Foundation Type

The flow velocity at the center of the cage decreased to initial velocity of 36.0%, 30.7%, and 30.5%, respectively, in the cases of MF, JF, and control. However, the flow velocity of the wake returns to the initial 93.42%, 83.02%, and 88.60% levels, respectively (Figure 12). All recovery distances ranged from 200 to 400 m. At distances over 400 m away from the cages, the flow velocity gradually stabilized.
Calculation results showed that the recovery rate of the wake in the direction of the main current in the MF samples is higher than that of the control sea area, and the recovery rate increased as the initial flow velocity intensified. The center and wake flow velocity of the cage are 1.18 and 1.05 times those of the control, respectively. This may be due to the monopile structure tentatively splitting the flow and changing the turbulence scale.
The change trend of flow velocity in the JF samples was nearly consistent with that of the control. This is due to the small diameter of the single pipe in JF barely altering turbulence.

3.1.3. Cage Layout Mode

In the MF (Table 7) samples, with the smallest spacing combination (10 m × 80 m) and the largest spacing combination (20 m × 100 m), employing either square (No. 1 and No. 3) or circular (No. 2 and No. 4) cages, their center flow velocities in the last row decayed by about 91.89% and 92.64%, respectively. With the smallest group spacing (80 m) and the largest group spacing (100 m), using either square (No. 5 and No. 7) or circular (No. 6 and No. 8) cages, their center flow velocities in the last row decayed by about 83.35% and 83.70%, respectively.
In the JF scheme (Table 8), with the smallest spacing combination (10 m × 80 m) and the largest spacing combination (20 m × 100 m), employing either square (No. 9 and No. 11) or circular (No. 10 and No. 12) cages, their center flow velocities in the last row decayed by about 89.81% and 89.78%, respectively. With the smallest group spacing (80 m) and the largest group spacing (100 m), using either square (No. 13 and No. 15) or circular (No. 14 and No. 16) cages, their center flow velocities in the last row decayed by about 92.88% and 92.41%, respectively.
In the control scheme (Table 9), with the smallest spacing combination (10 m × 80 m) and the largest spacing combination (20 m × 100 m), employing either square (No. 17 and No. 19) or circular (No. 18 and No. 20) cages, their center flow velocities in the last row decayed by about 92.63% and 92.38%, respectively. With the smallest group spacing (80 m) and the largest group spacing (100 m), using either square (No. 21 and No. 23) or circular (No. 22 and No. 24) cages, their center flow velocities in the last row decayed by about 89.52% and 86.59%, respectively.
The results of the analysis of significance showed that neither group spacing, inter-group spacing, nor cage shape affected the flow field (p > 0.05), whereas inlet velocities significantly affected the flow field velocity (p < 0.05) in the above three scenarios. There was no interaction between the factors of inter-group spacing, group spacing, and cage shape. However, in the MF samples, it seemed that large cages, both circular and square, obtained greater velocity attenuation than did small cages. In the JF samples, the different sizes of cages resulted in few differences. In the control, there were few differences between the large circular cages and small cages, while large square cages displayed the most obvious decay.
The wake trends of the three scenarios all showed a clear upward trend within 900–1500 m. The flow velocity recovered to approximately 60.00%, 62.19%, and 63.08% of the initial flow velocity under the control, MF, and JF scenarios, respectively 103.

3.2. Particle Diffusion

3.2.1. Unidirectional Incident Water Flow

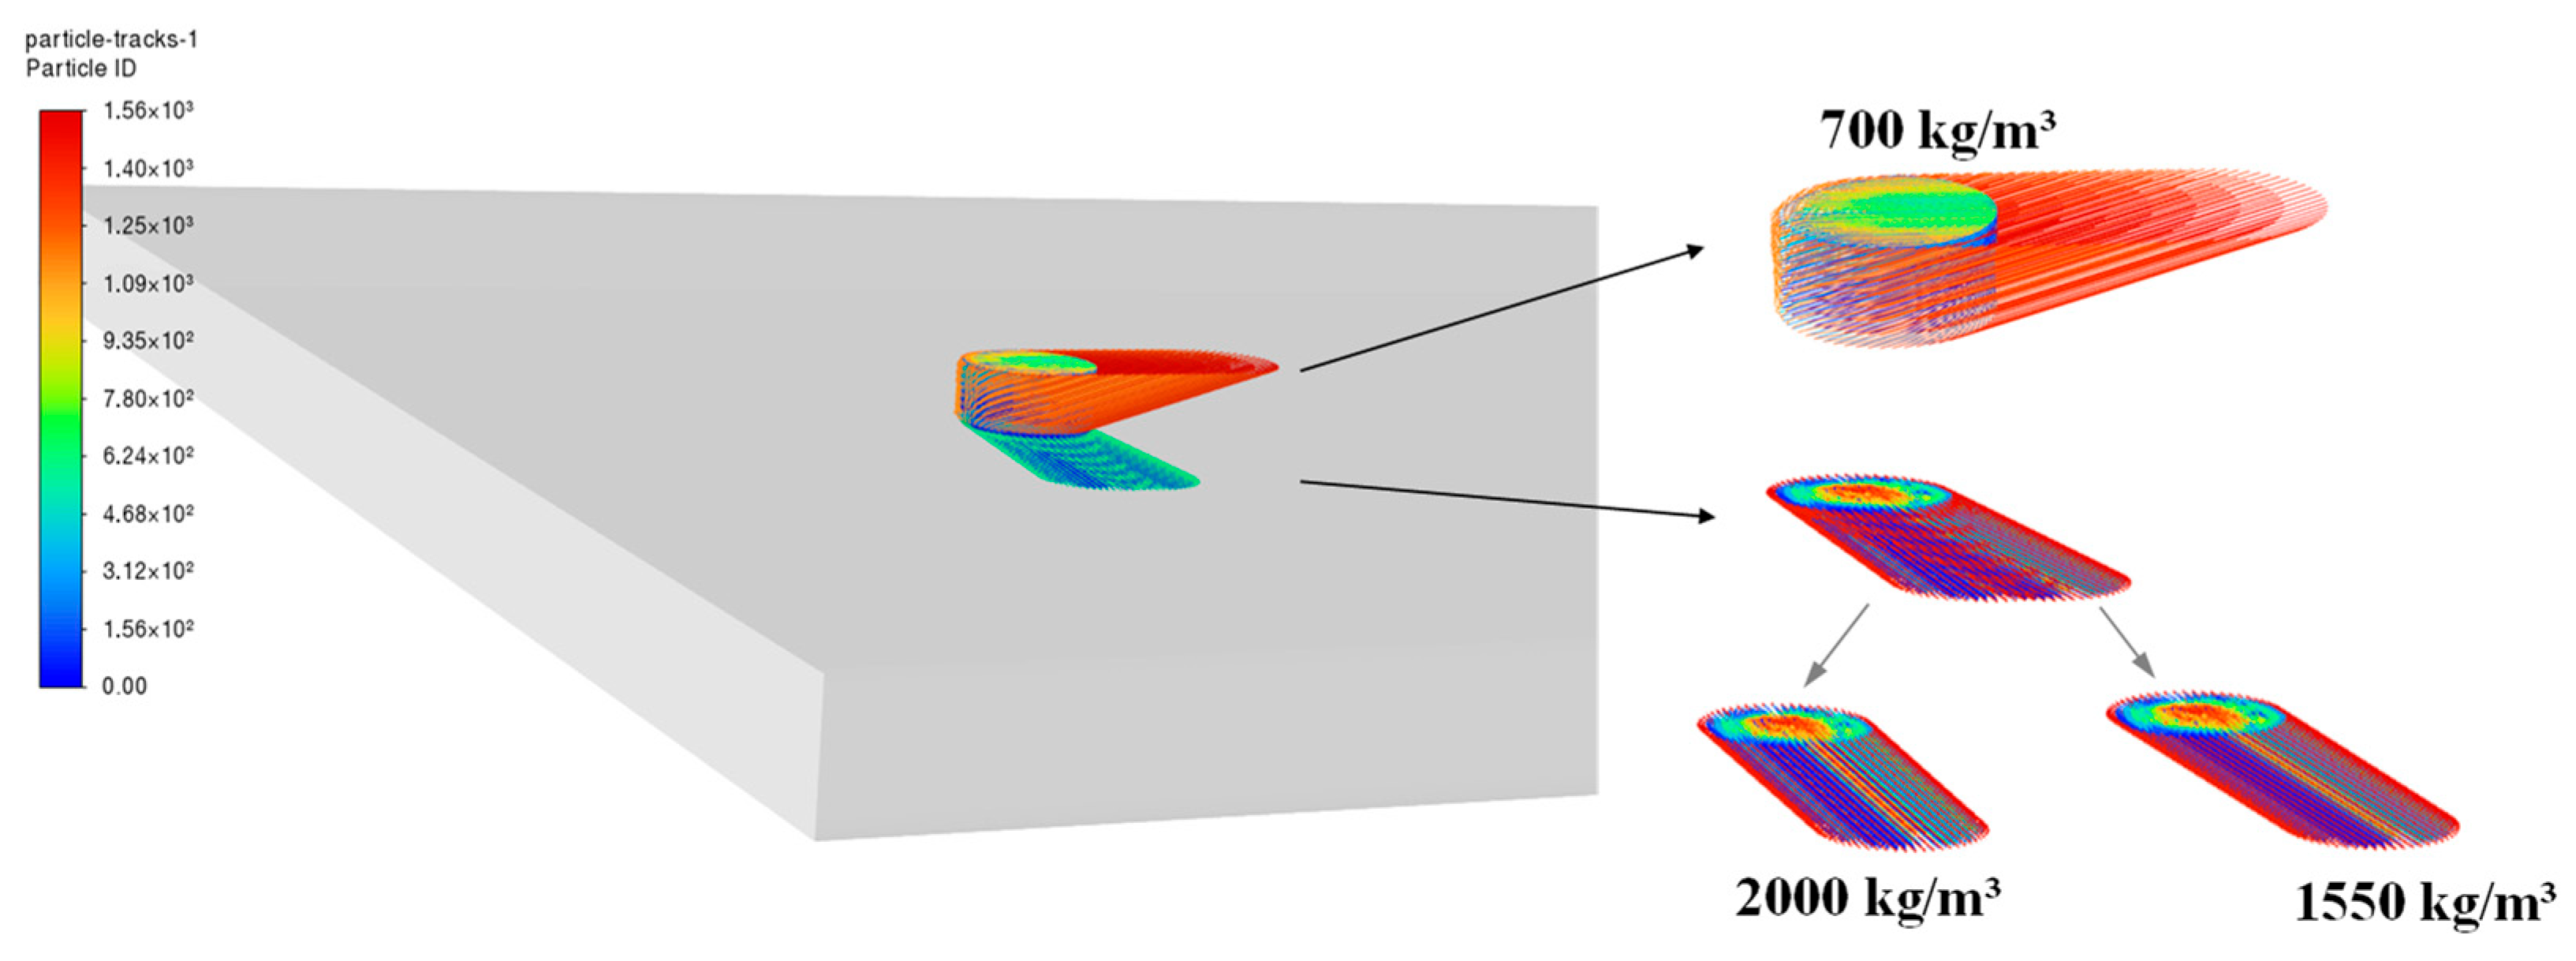
Assuming that particles are adsorbed as they reach the wall of the flow field, at an initial flow velocity of 0.2 m/s, the floating feed particles with a density of 700 kg/m3 dispersed to 20 m away from the outlet of the single cage and 45 m from the outlet of the last row in the group of cages. The sedimentary particles with a density of 1550 and 2000 kg/m3 dispersed to 75 m and 64 m away from the outlet of the single cage, respectively, and 80 m and 71 m from the outlet of the last row in the group cages, respectively (Figure 13).
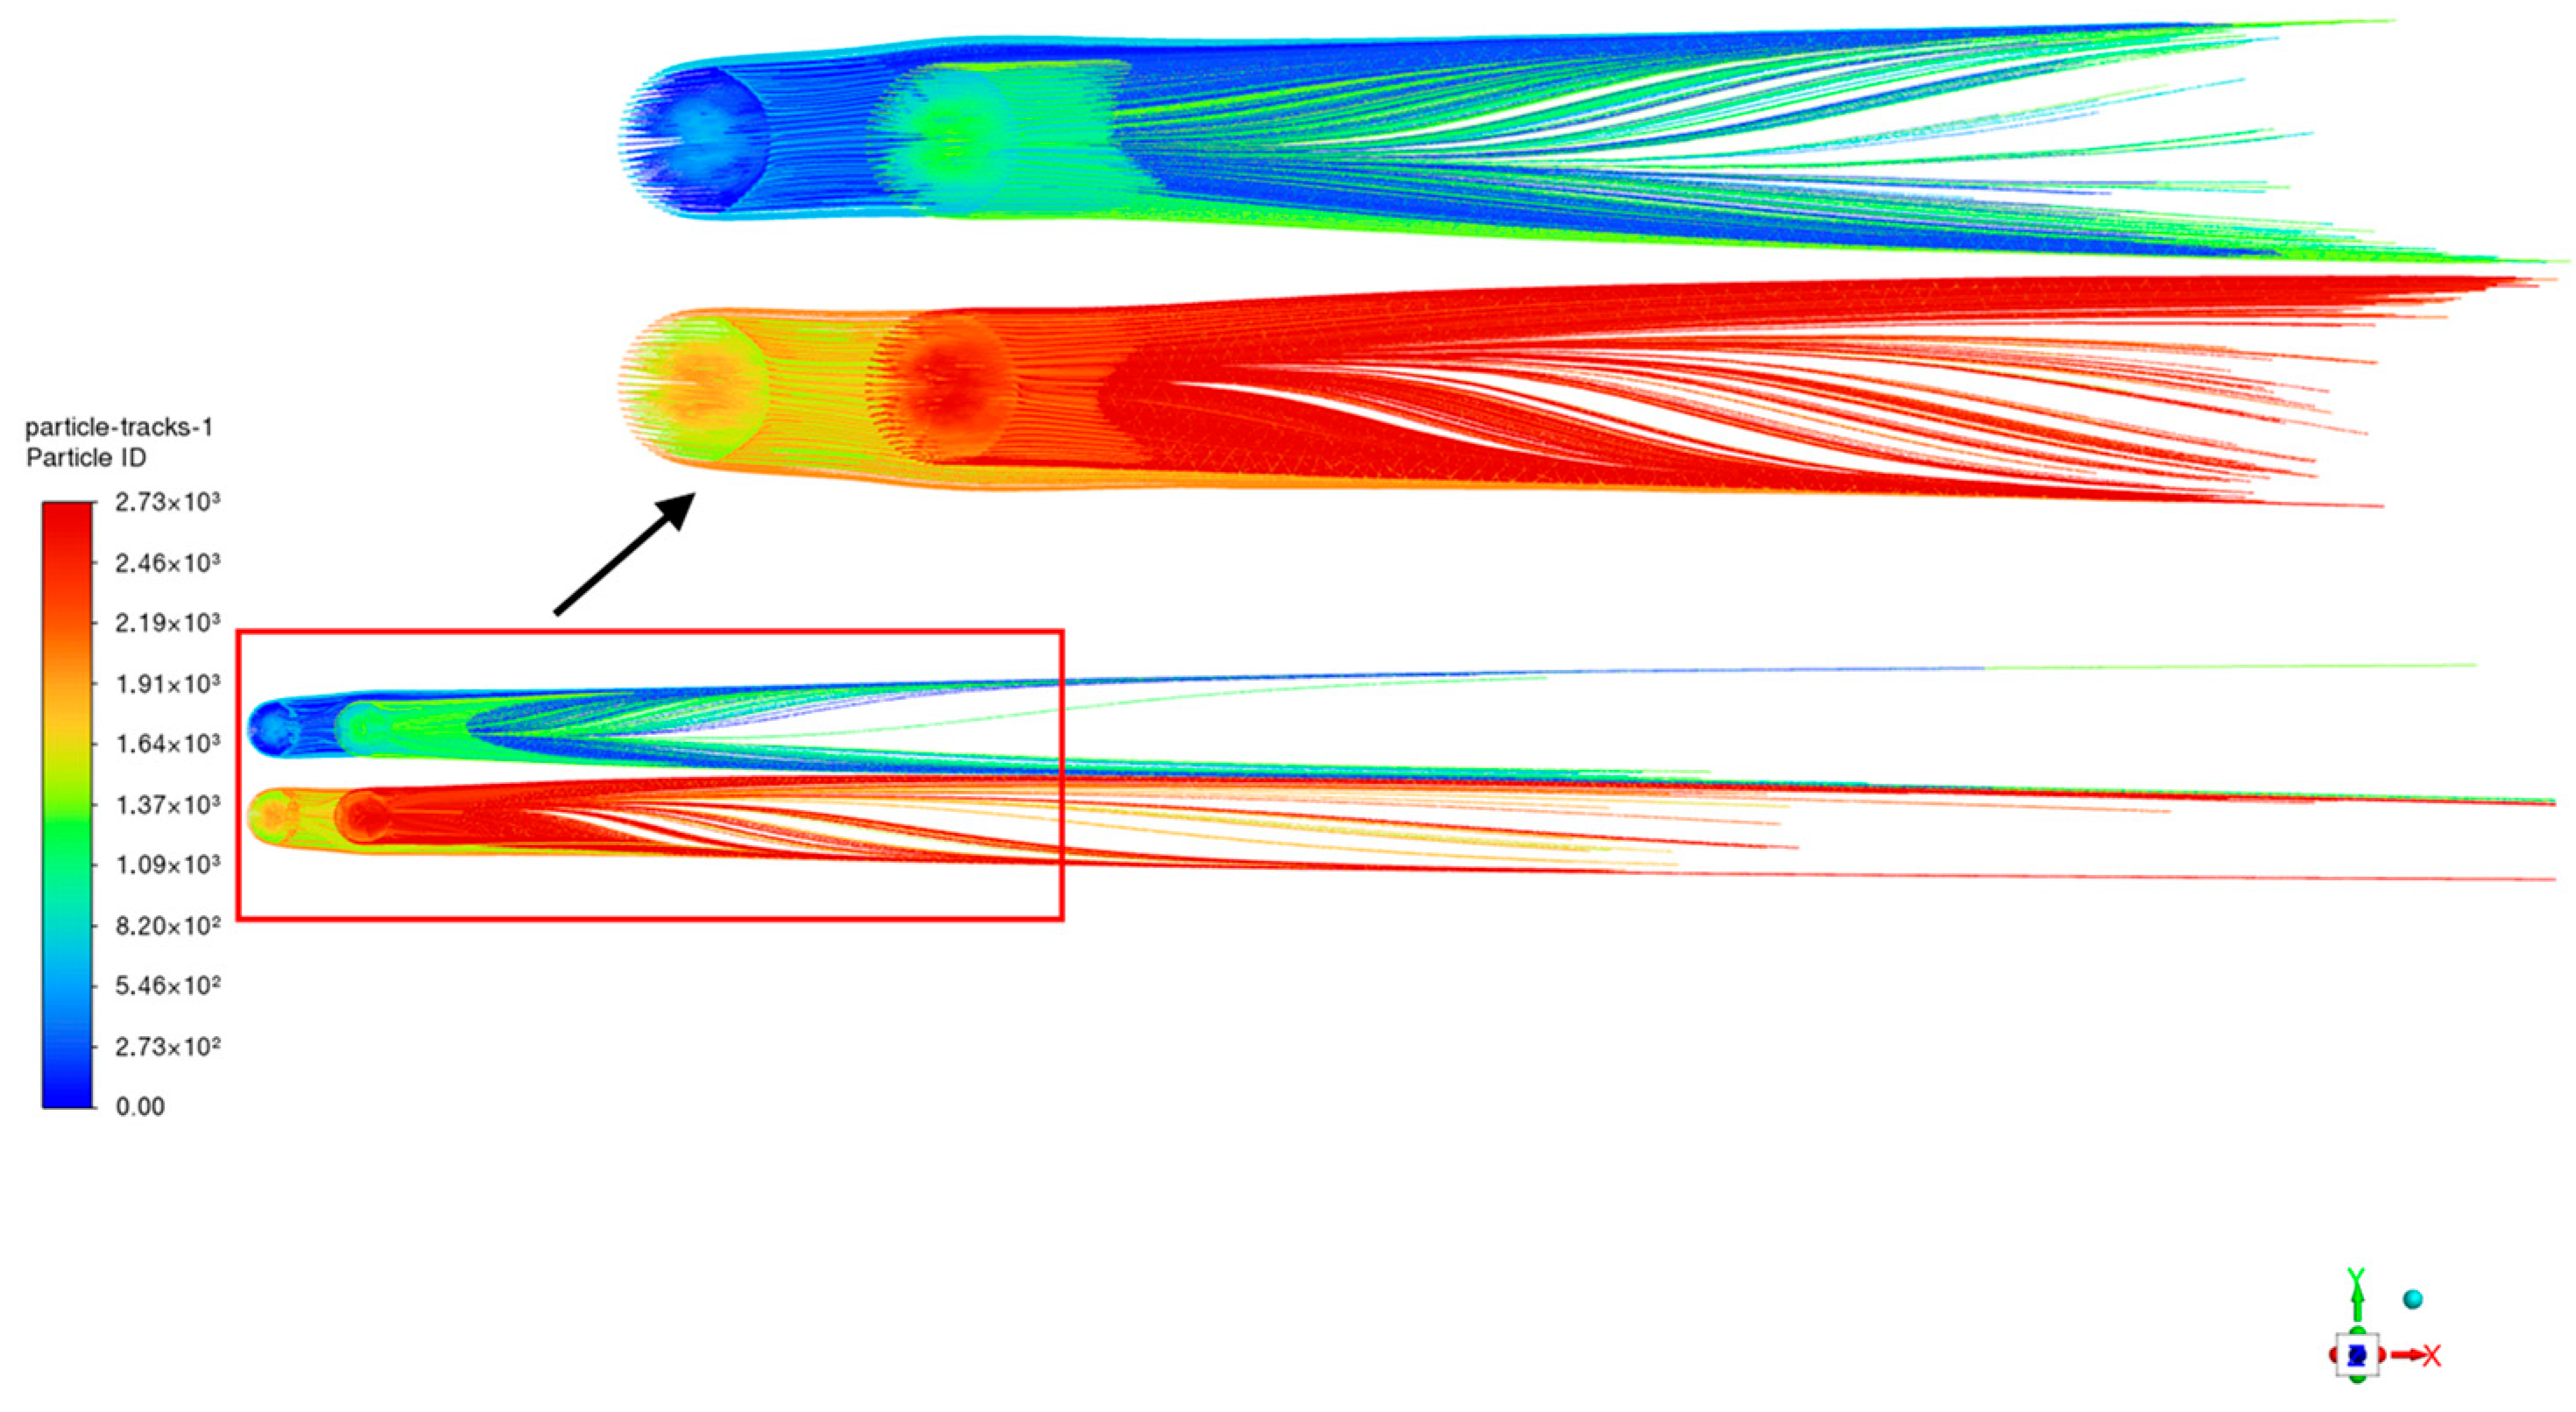
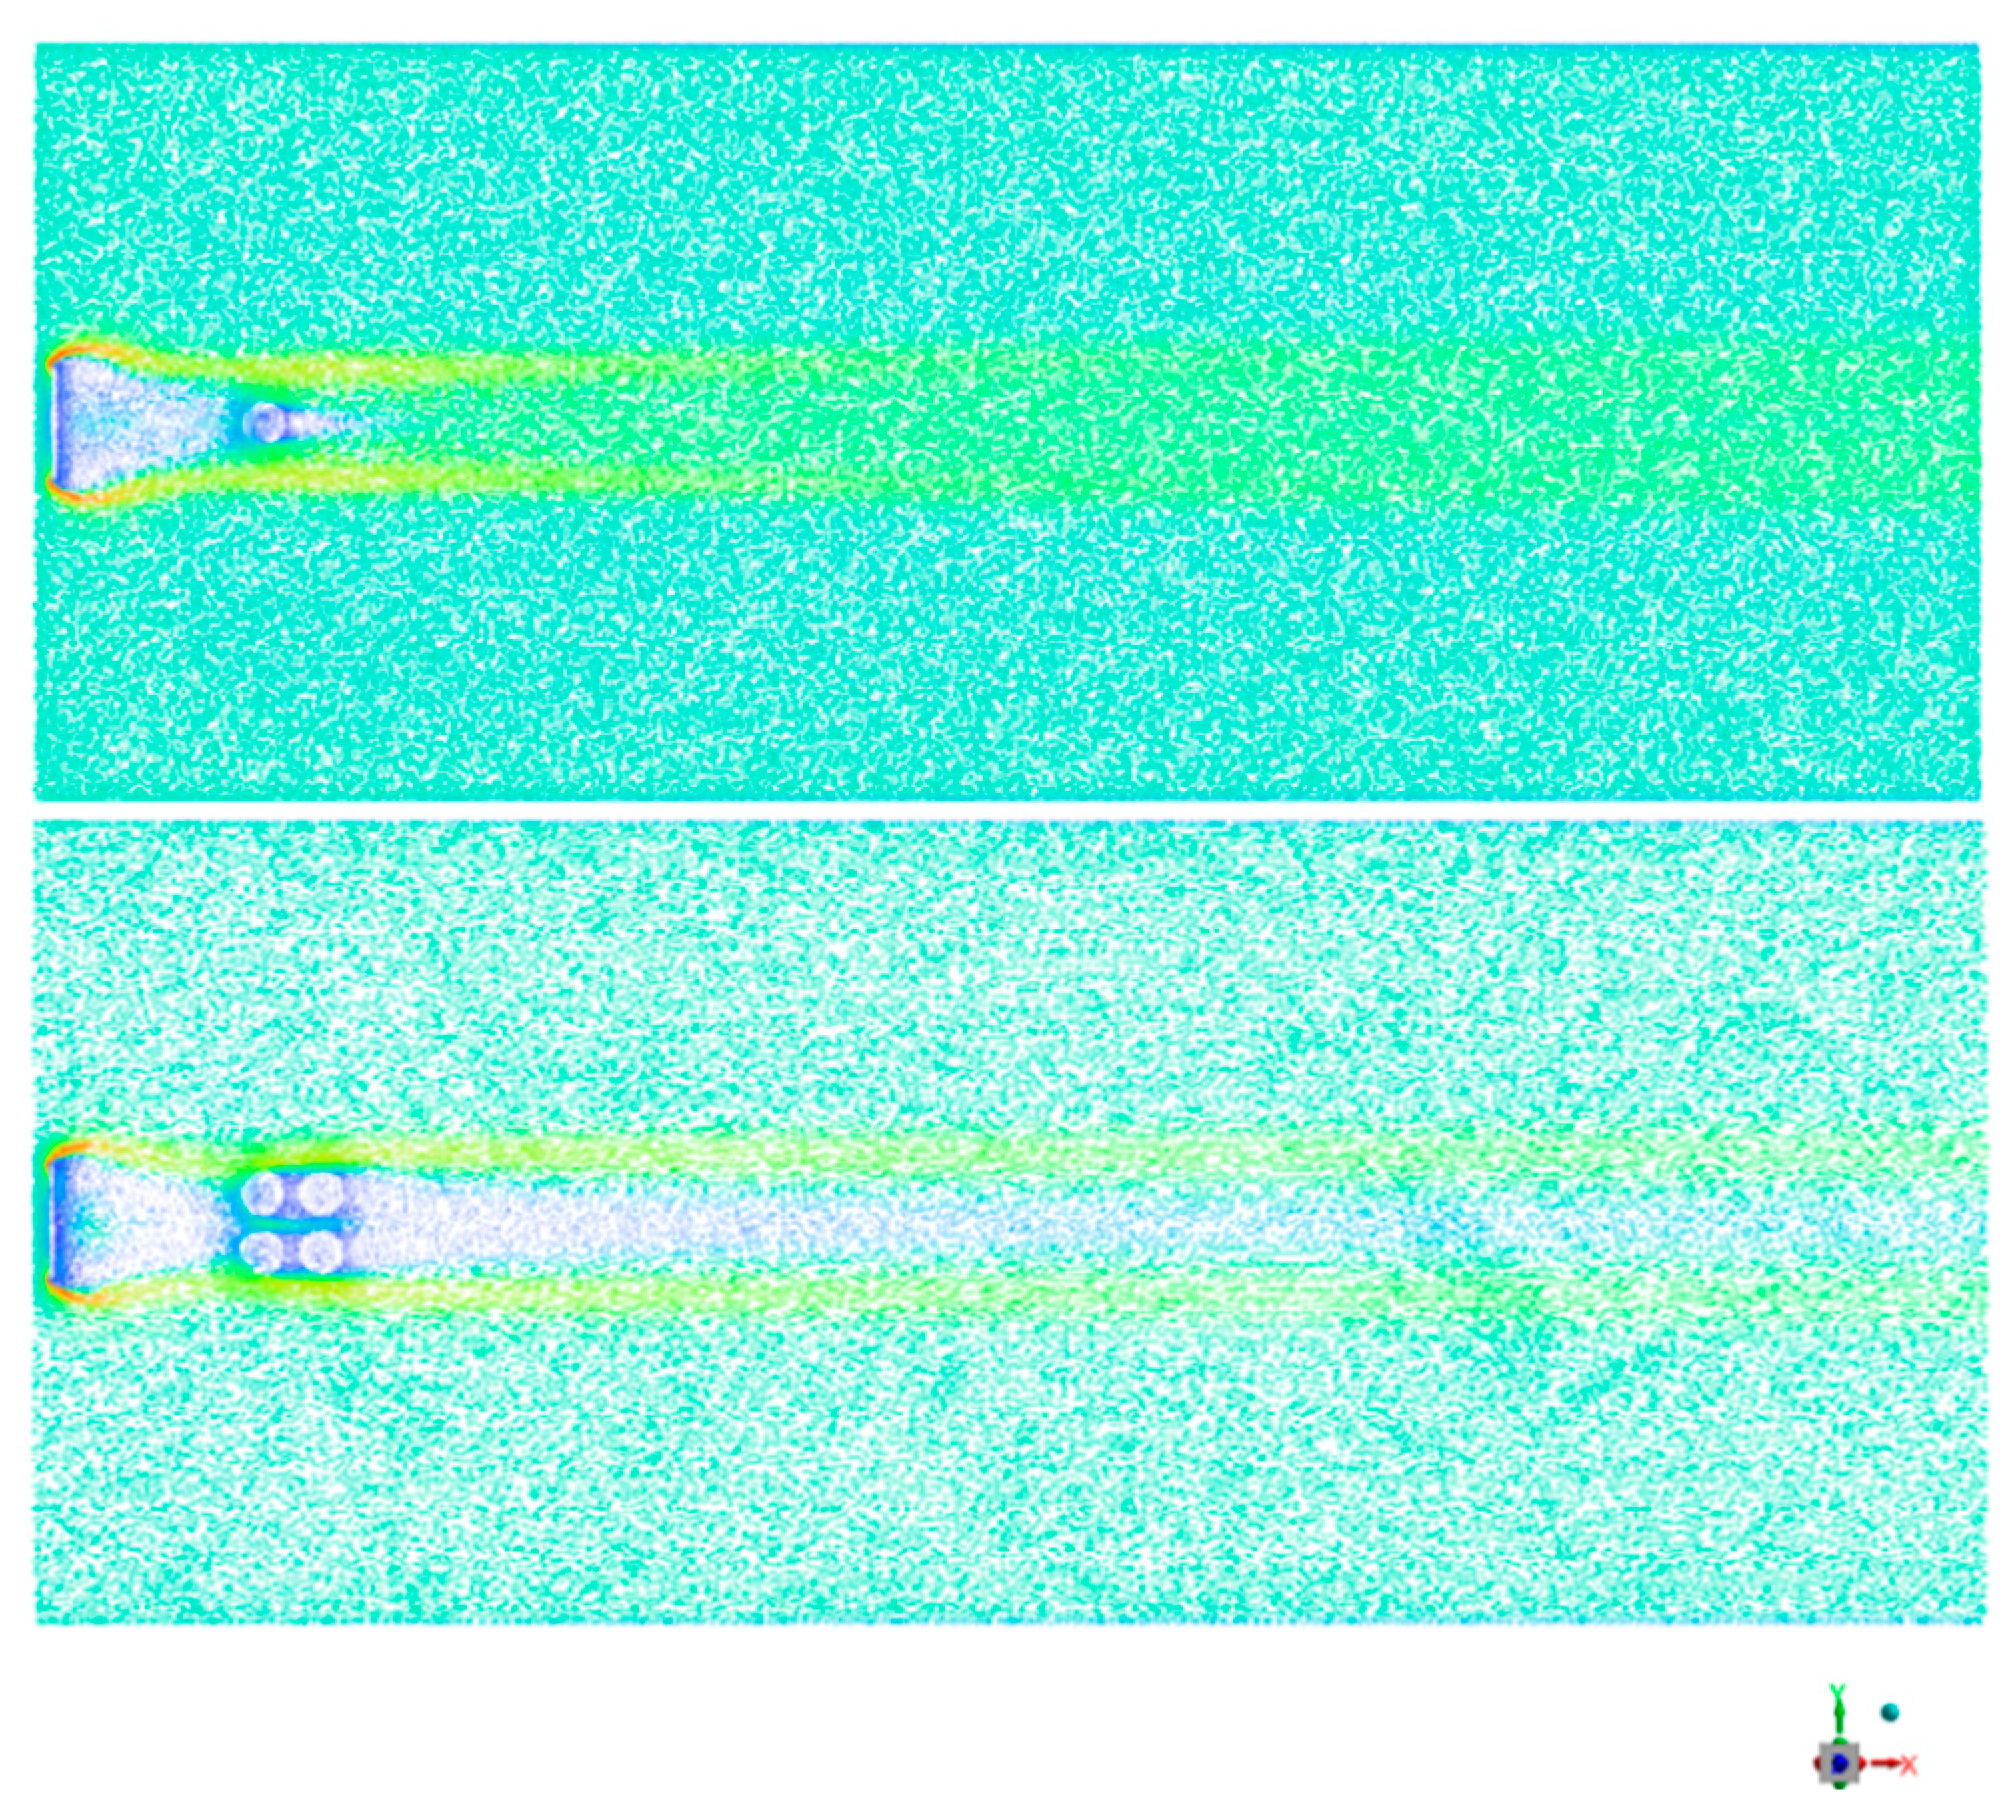
Assuming that particles are not be adsorbed as they reach the wall of the flow field (Figure 14), at an initial flow velocity of 0.2 m/s, with the change in the turbulence scale direction, the concentrated region of floating feed particles and sedimentary particles were both symmetrically distributed along the center line X-axis. As the distance increases, the former develops irregular streamlined patterns further downstream, while the latter distribution becomes more sparse and moves further away from the center line (Figure 15 and Figure 16).
Results show that high-density particles display short, concentrated trajectories, while lower-density particles exhibit longer, more dispersed types. Therefore, floating feed displays a smaller distribution range, with sparse particles and clearer linear trajectories compared to the results for sedimentary feed. As the initial flow velocity increases from 0.2 to 0.6 m/s, the successful movement of the dense sedimentation (escape) particles increases by approximately 4 to 11 m, as shown in Table 10.

3.2.2. Actual Wind Farm Sea Area

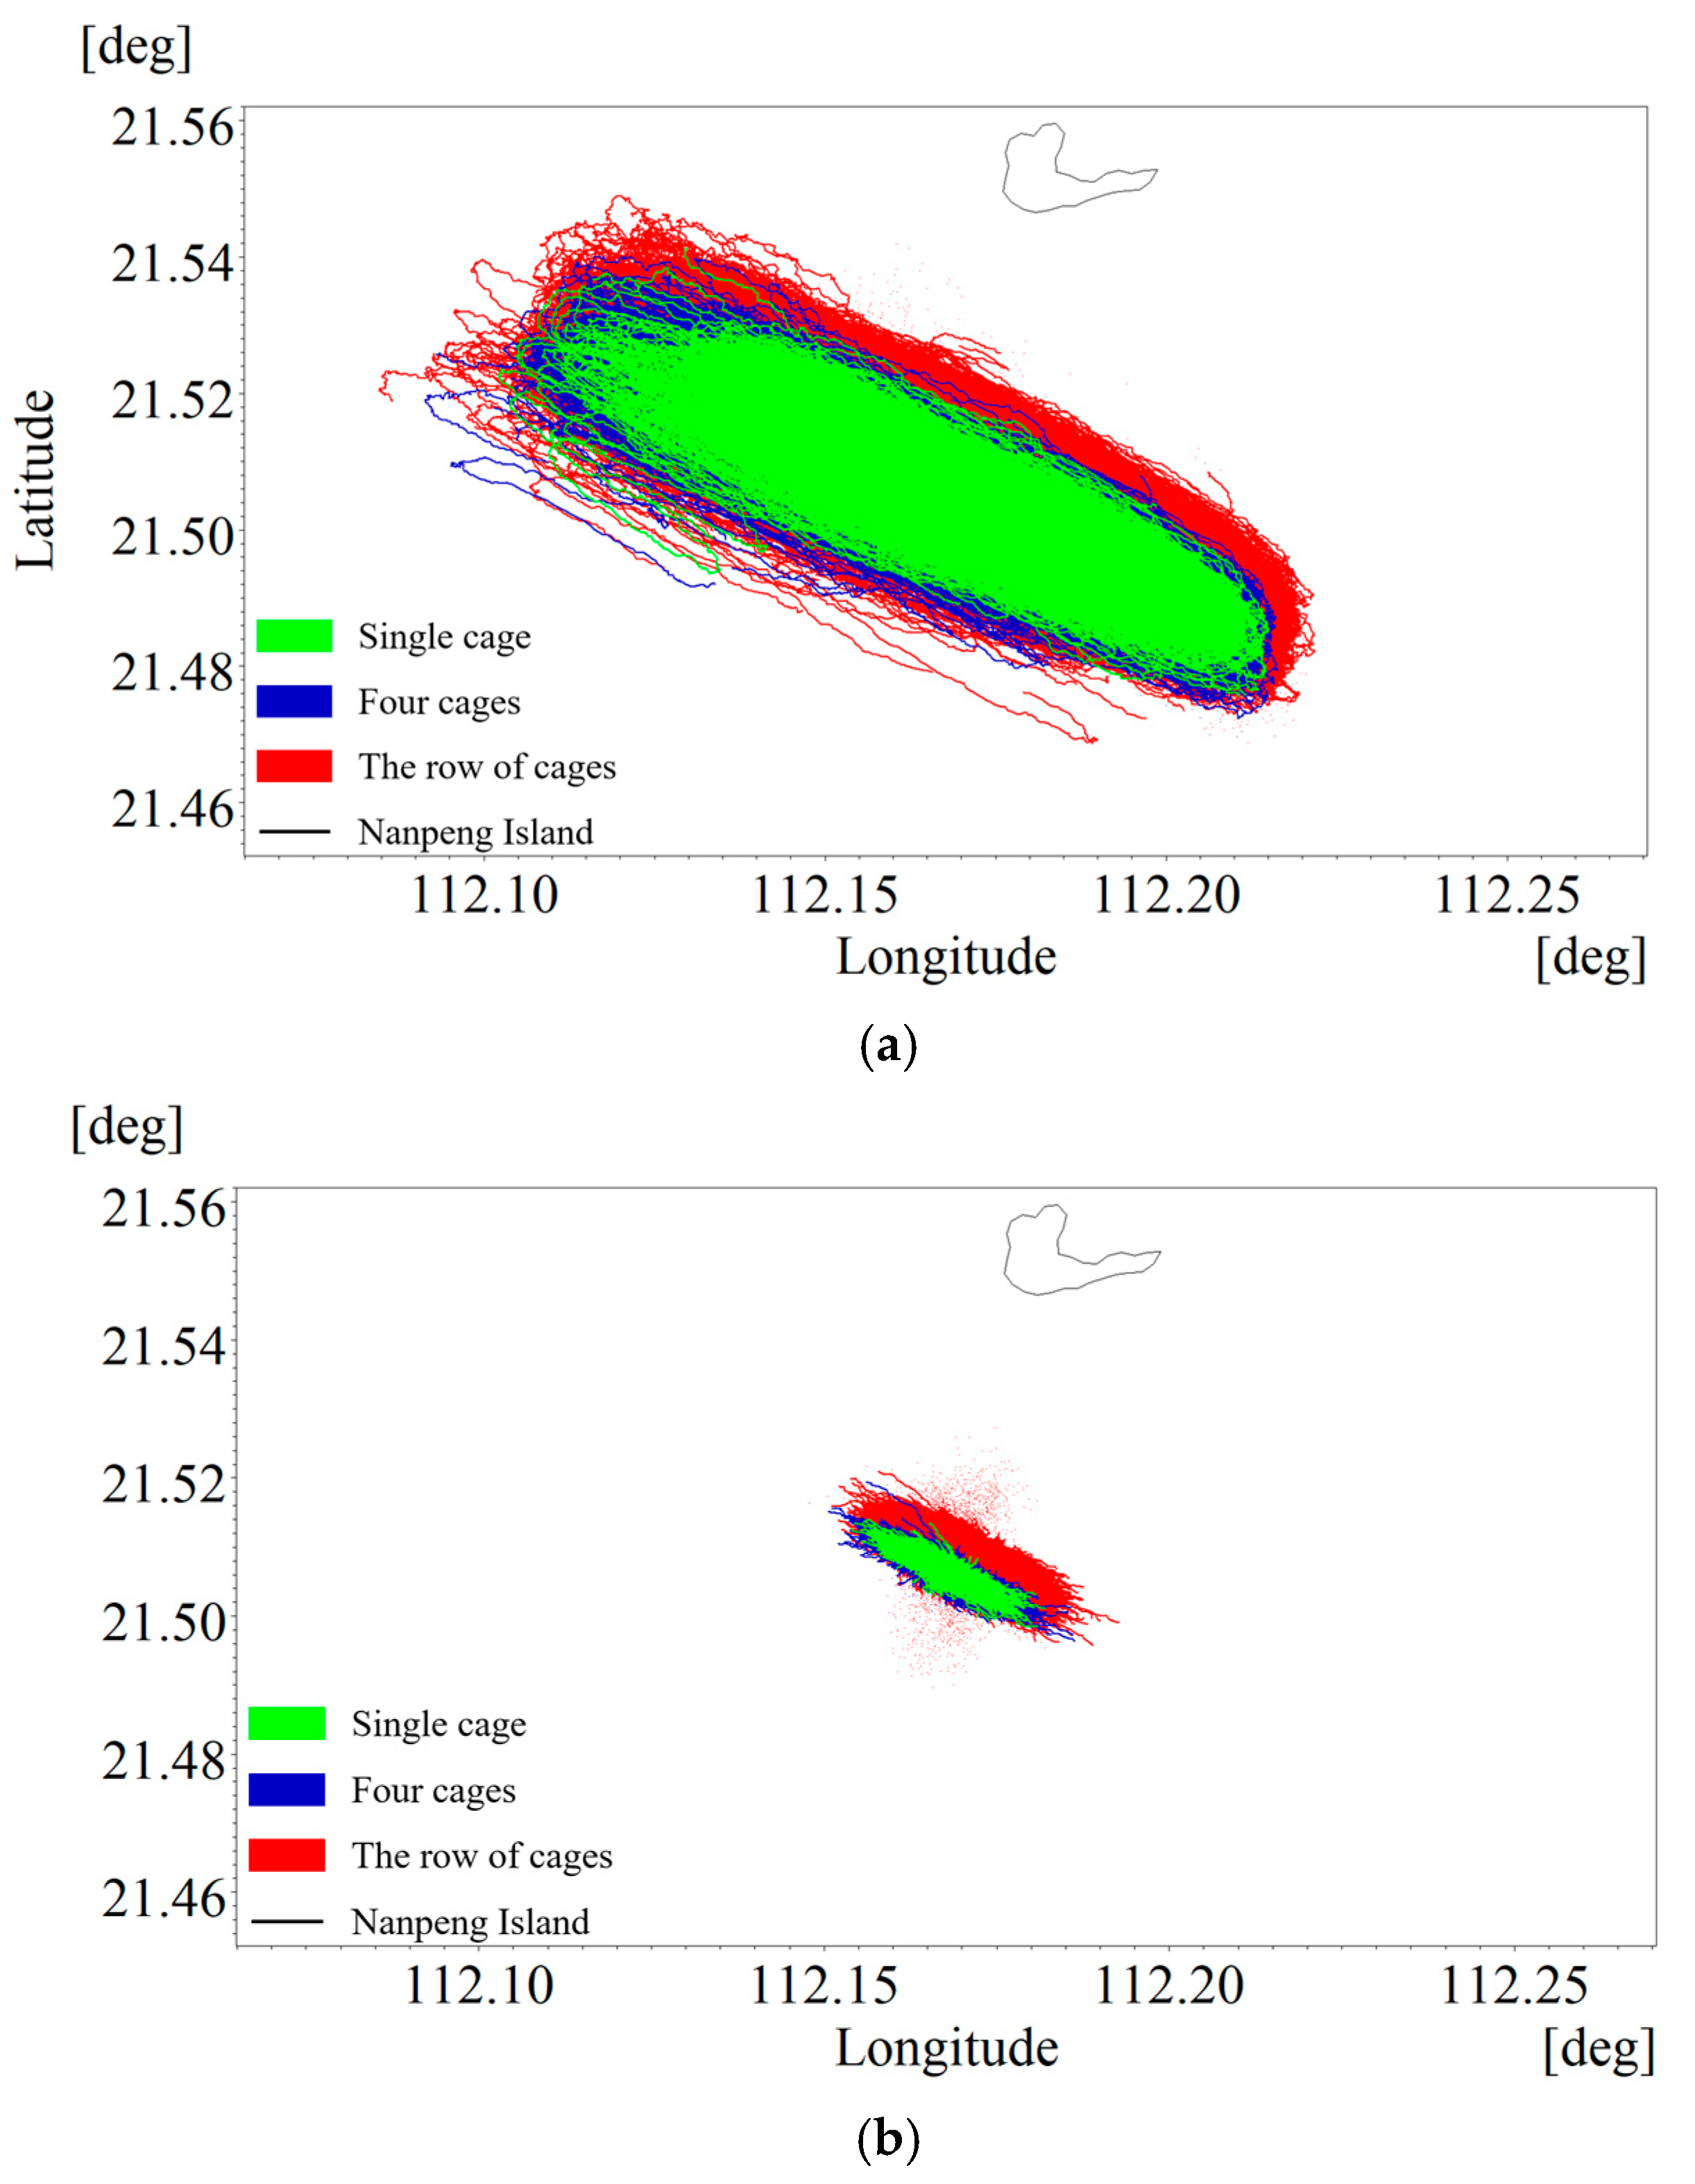
The particle diffusion research was conducted by taking the single cage (C60 circular cage), the circular cages in groups of four (Mode type (C) in Figure 7), and the row of cages (Mode (b) in Figure 8) as examples. The locations of the cages in different scenarios are shown in Supplementary File S6. The comparison under different scenarios is shown in Figure 17. Green represents the single cage scenario, blue represents the four-cage scenario, and red represents the row of cages scenario. The distances between the long and short axes of the elliptical trajectory are shown in Table 11. Its distribution area varies with different scenarios and types of particulate matter.
Hydrological data indicate that the Nanpeng Island offshore wind farm experiences an irregular semi-diurnal tide dominated by reversing currents. After being released within the fish cages, particles exhibit distinct back-and-forth movement with the ebb and flow of the tide, aligning with the direction of the tidal currents. This explains the observed ellipse-like dispersion patterns for all particle types.

3.3. Flow-Blocking and Food Filtration Rafts

3.3.1. Unidirectional Incident Water Flow

(1)
Front-positioned raft combination for shellfish culture
With front-positioned rafts, the inlet and center flow velocity of a single cage decreased by about 45.21% and 37.01%, respectively, and the center flow velocity decreased by about 17.79% in the last row of cages in a group. The wake flow velocity of the single and group cages that returns to a steady state decreased by about 10.61% and 27.60%, respectively, compared with the initial velocity (Table 12).
Front-positioned rafts are effective in reducing flow velocities. In single cages, downstream flow velocity in some areas is faster than in those without rafts, which might be caused by factors such as the vertical water direction and the raft’s structure, resulting in low resistance in the y and z directions, affecting flow direction and speed.
In grouped cages, the flow velocity at some downstream points is faster than that at the same point without the raft frame layout, which might be caused by the raft-rack shellfish culture width matching that of the cage rows, leading to edge turbulence that affects flow velocity inside the cages (Figure 18).
(2)
Post-positioned raft combination for shellfish culture
The shape of the rafts and extent of raft deployment can be modeled using the different particle density dispersion trajectories (Figure 19a,b). Artificial net enclosures can be used to reduce the extent of particle escapement to improve filtering efficiency and cut costs (Figure 19c,d). The farming depth can be chosen based on the water depth of the cages. However, raft deployment based on particle diffusion trajectories may fail to completely filter out particulate matter because the raft structure also affects the flow rate and direction. Layouts should be designed based on practical demand.
(3)
Layout mode
Taking the use of the C60 circular cage layout as an example, there are three main situations, as shown in Table 13. Mode 1 (Figure 20): The flow velocity is relatively high. Front shellfish raft slows down the water flow in the front cages, but the particulate matter can still be dispersed over time without exceeding the local area carrying capacity, eliminating the need for filtration facilities. Mode 2 (Figure 21): The flow velocity is moderate. Front rafts slow water, reducing flow such that the particulate matter cannot disperse in a timely manner (exceeding the carrying capacity), with post-positioned rafts required for filtration. Mode 3 (Figure 22): The flow velocity is slow. No flow-blocking facilities are required. Particulate matter dispersal is insufficient. Post-positioned raft filtration mechanisms are required.

3.3.2. Actual Wind Farm Sea Area

In actual sea areas, the diffusion range of particulate matter shows a quasi-elliptical distribution under different arrangement scenarios. Therefore, the post-filter food raft frame can be arranged in a quasi-elliptical pattern, with the cage row as the central axis. Taking the arrangement of row cages as an example, the diffusion range of particles in the long-axis area is large. This is because the sea area is mainly composed of reciprocating currents in the northwest and southeast directions, supplemented by the superposition of rotational currents. Therefore, it presents a pattern of diffusion at both ends of the central axis, with the cage row as the center. Double- or multi-layer raft frames can be set up in the northwest and southeast directions, while single- or double-layer raft frames can be used in the northeast and southwest directions. Since the diffusion range of the three particle diffusion modes in the northeast direction is larger than that in the southwest direction, adding a single raft frame in this direction is considered for secondary filtering and feeding. The final arrangement is shown in Figure 23. The lengths of X and Y in the Figure 23 are suggested to be adjusted according to the particle diffusion patterns in different scenarios. In this study scenario, the ratio of the short axis to the long axis of the diffusion distance is approximately 1:3.

3.3.3. Long-Term Operation and Maintenance

In response to the impact of biological contamination on the integrity of fish cages and fish welfare, and to enhance the sustainability of the aquaculture system and reduce operation and maintenance costs, this study proposes the following suggestions based on the above layout model:
(1)
Preventive measures
Use improved anti-fouling-coated cages and reduce the cleaning frequency to no more than five times a year.
(2)
Dynamic Management
(a)
Conduct a screening for the pathogens of contaminated organisms before cleaning;
(b)
Avoid operations during the peak period of larval release (such as in summer);
(c)
Require mandatory onshore cleaning of heavily contaminated/copper-plated cages.
(3)
Facility Optimization
(a)
Site selection and avoidance: The platform should be at least 4 km away from the main channel, with a water depth greater than 20 m, and located in a stable seabed area.
(b)
Navigation safety: Set up dedicated navigation AIDS (warning buoys, LED signal lights), establish an integrated “VHF (Very High Frequency) + unmanned aerial vehicles + electro-optical radar + maritime patrol vessels” monitoring system and issue navigation warnings in real time.
(c)
Management Coordination: Obtain permission from the maritime department and conduct navigation assessment, clearly define the operational meteorological thresholds (wave height ≤ 1.5 m, wind speed ≤ level 6), and pre-determine the vessel avoidance plan.
(4)
Shipping lane design
The example we are using is the C60 circular cage layout mode, which is not a strong gravity deep-water cage. Therefore, the following operation and maintenance channel design suggestions are mainly aimed at small operation vessels and inner channels. Referring to the relevant sea area channel standards (Table 14), for vertical ocean current events, the aquaculture sea area can be entered along a channel perpendicular to the ocean current, or pre-current blocking facilities can be arranged in sections to form an operation and maintenance channel in the same direction as the water flow. In view of the actual sea area conditions of this study, a channel with a width of 20 to 60 m can be opened in the southwest direction, where particle diffusion is lower, to facilitate the round trip of operation and maintenance vessels. At the same time, it is necessary to ensure that the distance between the aquaculture work vessel and the wind power pile foundation is greater than 80 m. The specific standards should be adjusted according to the actual conditions of different sea areas.

4. Discussion

The results showed that the flow velocity of the aquaculture areas and the farming fish density are the main factors affecting the cage layout in the wind-fishery region. Different stocking densities and layout patterns should be selected based on different environmental conditions. In this paper, a well-verified scientific model is used to simulate the actual flow rate and particle diffusion. The data are analyzed to quantify the impact of some influencing factors on the flow field and particle diffusion, and a targeted layout pattern is provided. In subsequent research, the influencing factors should be further refined and classified, while also considering the rationality of the design of channels in regards to issues such as operation and maintenance. Therefore, we suggest focusing on the following research directions to carry out the subsequent research plan.

4.1. Physiological Impact Assessment of Farmed Fish Species

A moderate water flow rate is beneficial for fish farmed in cages. It can stimulate voluntary swimming, promote growth, improve feed conversion rate, and enhance cardiovascular health (such as increased cardiac output and improved metabolic rate). However, an excessively low flow rate (especially when accompanied by high temperatures) can significantly increase the risk of hypoxia within the cages, leading to reduced feeding, slow growth, increased lipid deposition, and a decline in quality. Theoretically, an appropriate flow rate can offer additional benefits [29]. On the contrary, a persistently high flow rate will cause fish fatigue, leading to them being pressed against the net wall, resulting in collision damage or even death. High-speed swimming forces fish to rely on explosive swimming (anaerobic metabolism), causing physiological stress such as lactic acid accumulation, metabolic acidosis, elevated cortisol, glycogen depletion, and ion imbalance, which in turn inhibits digestion and growth [6,30]. Therefore, the flow rate in the aquaculture environment should not significantly exceed the swimming capacity of fish over a long period of time.
Different fish species are adapted to different optimal flow speed ranges [7] and exhibit varying responses to environmental changes [9]. For instance, Atlantic salmon can adapt to chronic turbulence, and their growth and welfare indicators are ultimately not affected in the long term [31]. However, the critical swimming speed of Cyclopterus lumpus is low, and it is difficult for them maintain such speeds, so they are not suitable for aquaculture in high flow speed waters [32].
In summary, water current speed significantly influences both the quantity and quality of farmed species. Excessively high or low flow speeds can lead to considerable losses. Therefore, one of the key directions for future research in this field is to deeply explore the physiological and welfare impacts of different flow rates on various fish species in order to better guide deep-sea and far-sea aquaculture practices.

4.2. Deformation Assessment of Cages

Cages exposed to strong flow fields (especially rapids with wave generation) will be subjected to significant water flow loads, leading to structural deformation (such as lateral displacement and lifting of settlement pipes). This deformation will directly reduce the effective aquaculture volume of the cages. A reduction in volume will increase the density of fish, significantly raising the risk of collisions between fish schools and nets. Meanwhile, the deformation of the fish cages interacts with the complex flow fields within them (including the attenuation of flow velocity and the acceleration of water flow beneath the cages), which can affect the swimming behavior and possibly, the feeding activities of fish. In addition, the acceleration of water flow beneath the cages can also affect the transportation and sedimentation process of feed particles, manure, and other sediments, potentially exerting an impact on the aquaculture environment.
Due to the limitations of time and workload (involving multiple factors such as aquaculture density, pile foundation type, cage spacing and shape, and flow-blocking facilities), this study assumed that the cages do not deform in the current, and thus failed to deeply explore the dynamic impact of the interaction between the flow field and the cage structure. Based on the complexity and significance revealed by existing research, such as some studies on the reduction of cage volume and the increase in collision risk caused by wave rapids [33], and relevant measurement of the large deformation and velocity attenuation of cages at high flow rates [5,34], we strongly recommend that future research take the dynamic deformation of cages induced by flow fields and cage layout and its combined effects on aquaculture activities (such as fish behavior, welfare, and sedimentary environment) as a key research direction. To this end, it is necessary to adopt the fluid–structure interaction (FSI) coupled simulation technology that combines computational fluid dynamics (CFD) with structural analysis to accurately evaluate the dynamic structural response of the cage under different process conditions and its impact on the internal flow field and farmed organisms, thereby providing a scientific basis for optimizing the cage design and site selection strategy.

4.3. Biological Attachment Pollution Assessment

The biological contamination that may occur during deep-sea and far-sea cage culture mainly falls into the following types:
(1)
Contamination by cnidarians
The main species are hydra (such as Ectopleura larynx) and sea anemones (such as Anthothoe albocincta), whose nematocysts can release neurotoxins or cardiotoxins. The debris released during the cleaning of high-pressure cages can damage the gills and skin of fish, leading to ulcers or secondary bacterial infections (such as gill rot) and causing abnormal behavior of fish schools (jumping, restlessness).
(2)
Contamination by pathogen vectors
Fouling organisms (such as mussels and hydra) are hosts or intermediate hosts of fish pathogens, including amoeba gill disease pathogen (Neoparamoeba perurans), cage liver disease, hematopoietic necrosis virus, etc. Pathogens released during cleaning may infect nearby fish farms or wild fish schools.
(3)
Invasive species spread
Alien species attached to the cages, such as ascidians (Styela clava), algae (Undaria pinnatifida), and amphipods (Caprella mutica), can still survive after high-pressure cleaning. Their fragments, larvae, or gametes spread with the water flow and may settle in natural habitats or adjacent farms, forming a “stepping-stone invasion”.
(4)
Anti-fouling coating particle contamination
Copper particles will be released when the cages with copper-containing anti-fouling coatings are cleaned. The deposited copper particles will continuously release biocides, poisoning benthic organisms and possibly interfering with the growth and development of fish.
(5)
Structural changes in the cage
Biological contamination caused by adherent organisms can significantly reduce the permeability of the mesh, increase hydrodynamic resistance, and lead to attenuation of the flow field and changes in turbulence. Over time, the hydraulic characteristics of the cage system will evolve dynamically.
In future research, the possible biological pollution situations that may occur when conducting aquaculture activities in typical sea areas should be considered, and the polluting species should be defined. The coefficient of porous media should be adjusted according to the calculation method provided in this study to quantify the impact of biological attachment on aquaculture activities, and regular cleaning work should be carried out to promote the sustainable development of aquaculture.

5. Conclusions

The current velocity in the sea area of the Nanpeng Island offshore wind farm is smooth. The pile foundation has little influence on the change in the flow field of the cage layout, which is suitable for aquaculture activities. In unidirectional water flow incident situation, layout mode 3 is recommended for cage aquaculture in the area of the offshore wind farm. In the actual marine area, layout mode 4 is more suitable for this sea area. The specifications regarding the number of cages and raft coverage should be adjusted according to the hydrodynamic conditions and particle density of the sea area. When deploying deep-water cages, greater consideration should be given to the stocking density of the cultured fish species and the overall density of the cage arrangement in the marine area. This study further considered the possible biological attachment problems in actual aquaculture and proposed targeted cleaning and treatment measures, as well as suggestions for the design of operation and maintenance channels. The method of this study can be used to investigate the changes in the disturbance response of flow fields and the trajectory laws of particulate matter escape in different typical sea areas, as well as guide the layout of deep-water cages by adjusting relevant parameters. This method helps to reduce the cost of aquaculture and improve its economic and environmental benefits.

Supplementary Materials

The following supporting information can be downloaded at: https://www.mdpi.com/article/10.3390/su17177679/s1, Scenario S1: Flow Rate Calculation Method; Scenario S2: The Basic Formulae and Descriptions related to k-epsilon; Scenario S3: The basic formulae and descriptions related to discrete phase model (DPM); Scenario S4: The basic formulae and descriptions related to MIKE 21; Scenario S5: Porous media model validation; Scenario S6: Cage coordinate point in actual sea situation

Author Contributions

Conceptualization, M.J. and J.Y.; methodology, M.J.; software, M.J. and W.Z.; validation, M.J. and W.Z.; formal analysis, M.J.; investigation, M.J.; resources, M.J. and J.Y.; data curation, M.J. and W.Z.; writing—original draft preparation, M.J.; writing—review and editing, M.J., Y.L. and J.Y.; visualization, M.J. and W.Z.; supervision, Y.L. and J.Y.; project administration, J.Y.; funding acquisition, J.Y. All authors have read and agreed to the published version of the manuscript.

Funding

The authors would like to thank the Guangdong Basic and Applied Basic Research Foundation (No. 2024B1515250006, No. 2022A1515240012, No. 2020A1515110534) and the National Natural Science Foundation of China (No. 42107451) for their financial support.

Institutional Review Board Statement

Not applicable.

Informed Consent Statement

Not applicable.

Data Availability Statement

Data is contained within the article or Supplementary Materials.

Conflicts of Interest

The authors declare no conflict of interest.

References

  1. Griffin, R.; Buck, B.; Krause, G. Private incentives for the emergence of co-production of offshore wind energy and mussel aquaculture. Aquaculture 2015, 436, 80–89. [Google Scholar] [CrossRef]
  2. Lee, D.-W.; Oh, S.-Y.; Park, J.J.C.; Jung, Y.-H.; Kim, H.-J.; Choi, D.M.; Choi, Y.-U.; Han, J. Offshore Wind Farms in South Korea: A Potential Site for Scallop Culture. J. Mar. Sci. Eng. 2023, 11, 1988. [Google Scholar] [CrossRef]
  3. van den Burg, S.W.K.; Kamermans, P.; Blanch, M.; Pletsas, D.; Poelman, M.; Soma, K.; Dalton, G. Business case for mussel aquaculture in offshore wind farms in the North Sea. Mar. Policy 2017, 85, 1–7. [Google Scholar] [CrossRef]
  4. Gao, S.; Sun, H.; Zhao, L.; Cao, G.; Liu, W. Research on the comprehensive benefits and driving forces of various typical types of marine development in Jiangsu Province. IOP Conf. Ser. Earth Environ. Sci. 2020, 569, 012034. [Google Scholar] [CrossRef]
  5. Klebert, P.; Patursson, Ø.; Endresen, P.C.; Rundtop, P.; Birkevold, J.; Rasmussen, H.W. Three-dimensional deformation of a large circular flexible sea cage in high currents: Field experiment and modeling. Ocean Eng. 2015, 104, 511–520. [Google Scholar] [CrossRef]
  6. Hvas, M.; Folkedal, O.; Oppedal, F. Fish welfare in offshore salmon aquaculture. Rev. Aquac. 2020, 13, 836–852. [Google Scholar] [CrossRef]
  7. Jónsdóttir, K.E.; Hvas, M.; Alfredsen, J.A.; Føre, M.; Alver, M.O.; Bjelland, H.V.; Oppedal, F. Fish welfare based classification method of ocean current speeds at aquaculture sites. Aquac. Environ. Interact. 2019, 11, 249–261. [Google Scholar] [CrossRef]
  8. Landmann, J.; Fröhling, L.; Gieschen, R.; Buck, B.H.; Heasman, K.; Scott, N.; Smeaton, M.; Goseberg, N.; Hildebrandt, A. New system design for the cultivation of extractive species at exposed sites-Part 2: Experimental modelling in waves and currents. Appl. Ocean Res. 2021, 113, 102749. [Google Scholar] [CrossRef]
  9. Johansson, D.; Laursen, F.; Ferno, A.; Fosseidengen, J.E.; Klebert, P.; Stien, L.H.; Vagseth, T.; Oppedal, F. The interaction between water currents and salmon swimming behaviour in sea cages. PLoS ONE 2014, 9, e97635. [Google Scholar] [CrossRef]
  10. Park, S.-G.; Zhou, J.; Dong, S.; Li, Q.; Yoshida, T.; Kitazawa, D. Characteristics of the flow field inside and around a square fish cage considering the circular swimming pattern of a farmed fish school: Laboratory experiments and field observations. Ocean Eng. 2022, 261, 112097. [Google Scholar] [CrossRef]
  11. Palstra, A.P.; Planas, J.V. Fish under exercise. Fish Physiol. Biochem. 2011, 37, 259–272. [Google Scholar] [CrossRef]
  12. Klinger, D.H.; Levin, S.A.; Watson, J.R. The growth of finfish in global open-ocean aquaculture under climate change. Proc. Biol. Sci. 2017, 284, 20170834. [Google Scholar] [CrossRef]
  13. Nilsen, A.; Hagen, Ø.; Johnsen, C.A.; Prytz, H.; Zhou, B.; Nielsen, K.V.; Bjørnevik, M. The importance of exercise: Increased water velocity improves growth of Atlantic salmon in closed cages. Aquaculture 2019, 501, 537–546. [Google Scholar] [CrossRef]
  14. Winthereig-Rasmussen, H.; Simonsen, K.; Patursson, Ø. Flow through fish farming sea cages: Comparing computational fluid dynamics simulations with scaled and full-scale experimental data. Ocean Eng. 2016, 124, 21–31. [Google Scholar] [CrossRef]
  15. Bi, C.-W.; Zhao, Y.-P.; Dong, G.-H.; Zheng, Y.-N.; Gui, F.-K. A numerical analysis on the hydrodynamic characteristics of net cages using coupled fluid–structure interaction model. Aquac. Eng. 2014, 59, 1–12. [Google Scholar] [CrossRef]
  16. Yu, L.-H.; Zhan, J.-M.; Li, Y.-S. Numerical Simulation of Flow Through Circular Array of Cylinders Using Multi-Body and Porous Models. Coast. Eng. J. 2014, 56, 1450014-1–1450014-26. [Google Scholar] [CrossRef]
  17. Bi, C.-W.; Zhao, Y.-P.; Dong, G.-H. Numerical study on the hydrodynamic characteristics of biofouled full-scale net cage. China Ocean Eng. 2015, 29, 401–414. [Google Scholar] [CrossRef]
  18. Rasmussen, H.W.; Patursson, Ø.; Simonsen, K. Visualisation of the wake behind fish farming sea cages. Aquac. Eng. 2015, 64, 25–31. [Google Scholar] [CrossRef]
  19. Gansel, L.C.; Rackebrandt, S.; Oppedal, F.; McClimans, T.A. Flow Fields Inside Stocked Fish Cages and the Near Environment. J. Offshore Mech. Arct. Eng. 2014, 136, 031201. [Google Scholar] [CrossRef]
  20. Patursson, O. Flow Through and Around Fish Farming Nets. Ph.D. Dissertation, University of New Hampshire, Durham, NH, USA, 2008. [Google Scholar]
  21. Bi, C.-W.; Zhao, Y.-P.; Dong, G.-H. Experimental study on the effects of farmed fish on the hydrodynamic characteristics of the net cage. Aquaculture 2020, 524, 735239. [Google Scholar] [CrossRef]
  22. Zhao, Y.-P.; Bi, C.-W.; Dong, G.-H.; Gui, F.-K.; Cui, Y.; Guan, C.-T.; Xu, T.-J. Numerical simulation of the flow around fishing plane nets using the porous media model. Ocean Eng. 2013, 62, 25–37. [Google Scholar] [CrossRef]
  23. Karayücel, S.; Çelik, M.Y.; Karayücel, İ.; Öztürk, R.; Eyüboğlu, B. Effects of stocking density on survival, growth and biochemical composition of cultured mussels (Mytilus galloprovincialis, Lamarck 1819) from an offshore submerged longline system. Aquac. Res. 2015, 46, 1369–1383. [Google Scholar] [CrossRef]
  24. Lauzon-Guay, J.-S.; Hamilton, D.J.; Barbeau, M.A. Effect of mussel density and size on the morphology of blue mussels (Mytilus edulis) grown in suspended culture in Prince Edward Island, Canada. Aquaculture 2005, 249, 265–274. [Google Scholar] [CrossRef]
  25. Pietrak, M.R.; Molloy, S.D.; Bouchard, D.A.; Singer, J.T.; Bricknell, I. Potential role of Mytilus edulis in modulating the infectious pressure of Vibrio anguillarum 02β on an integrated multi-trophic aquaculture farm. Aquaculture 2012, 326, 36–39. [Google Scholar] [CrossRef]
  26. Underwood, L.H.; Jeffs, A.G. Settlement and recruitment of fish in mussel farms. Aquac. Environ. Interact. 2023, 15, 85–100. [Google Scholar] [CrossRef]
  27. Kotta, J.; Stechele, B.; Barboza, F.R.; Kaasik, A.; Lavaud, R. Towards environmentally friendly finfish farming: A potential for mussel farms to compensate fish farm effluents. J. Appl. Ecol. 2023, 60, 1314–1326. [Google Scholar] [CrossRef]
  28. Montory, J.A.; Chaparro, O.R.; Averbuj, A.; Salas-Yanquin, L.P.; Buchner-Miranda, J.A.; Gebauer, P.; Cumillaf, J.P.; Cruces, E. The filter-feeding bivalve Mytilus chilensis capture pelagic stages of Caligus rogercresseyi: A potential controller of the sea lice fish parasites. J. Fish Dis. 2020, 43, 475–484. [Google Scholar] [CrossRef] [PubMed]
  29. Davison, W.; Herbert, N.A. Swimming-Enhanced Growth. In Swimming Physiology of Fish: Towards Using Exercise to Farm a Fit Fish in Sustainable Aquaculture; Palstra, A.P., Planas, J.V., Eds.; Springer: Berlin/Heidelberg, Germany, 2013; pp. 177–202. [Google Scholar]
  30. Hvas, M.; Oppedal, F. Sustained swimming capacity of Atlantic salmon. Aquac. Environ. Interact. 2017, 9, 361–369. [Google Scholar] [CrossRef]
  31. Barbier, E.; Oppedal, F.; Hvas, M. Atlantic salmon in chronic turbulence: Effects on growth, behaviour, welfare, and stress. Aquaculture 2024, 582, 740550. [Google Scholar] [CrossRef]
  32. Hvas, M.; Folkedal, O.; Imsland, A.; Oppedal, F. Metabolic rates, swimming capabilities, thermal niche and stress response of the lumpfish, Cyclopterus lumpus. Biol. Open 2018, 7, bio036079. [Google Scholar] [CrossRef]
  33. Abrahamsen, H.I.; Johannesen, T.T.; Patursson, Ø.; Norði, G.á.; Simonsen, K. Wave-generated currents threaten aquaculture sites. Ocean Eng. 2025, 334, 121574. [Google Scholar] [CrossRef]
  34. Shim, K.; Klebert, P.; Fredheim, A. Numerical Investigation of the Flow Through and Around a Net Cage. In Proceedings of the ASME 2009 28th International Conference on Ocean, Offshore and Arctic Engineering, Honolulu, HI, USA, 31 May–5 June 2009; pp. 581–587. [Google Scholar]
Figure 1. Fan and cable layout.
Sustainability 17 07679 g001
Figure 2. Mesh boundary settings.
Sustainability 17 07679 g002
Figure 3. Marine area mesh division.
Sustainability 17 07679 g003
Figure 4. Tide level verification.
Sustainability 17 07679 g004
Figure 5. Comparison of cage culture density.
Sustainability 17 07679 g005
Figure 6. Schematic diagram of pile foundation.
Sustainability 17 07679 g006
Figure 7. Mode type.
Sustainability 17 07679 g007
Figure 8. (a) Square cage (side length 16.93 m); (b) C60 circular cage (c); square cage (side length 33.86 m); (d) C120 circular cage.
Sustainability 17 07679 g008
Figure 9. Structural layout.
Sustainability 17 07679 g009
Figure 10. Computing domain diagram.
Sustainability 17 07679 g010
Figure 11. Comparison of three initial flow rates at the same density.
Sustainability 17 07679 g011
Figure 12. Flow rate variations at three different initial flow rates. Note: CK: control area; MF: monopile foundation; JF: jacket foundation.
Sustainability 17 07679 g012
Figure 13. Schematic diagram of particle dispersion and sedimentation in a single cage.
Sustainability 17 07679 g013
Figure 14. Schematic of particle trajectories on fluid walls.
Sustainability 17 07679 g014
Figure 15. Trajectory of floating feed particles in grouped cages.
Sustainability 17 07679 g015
Figure 16. Trajectory of sedimentary feed particles in grouped cages.
Sustainability 17 07679 g016
Figure 17. Particle trajectories. (a) Particle density: 0.70 g/cm3; (b) particle density: 1.55 g/cm3; (c) particle density: 2.00 g/cm3.
Sustainability 17 07679 g017aSustainability 17 07679 g017b
Figure 18. Vector diagram of simulation results.
Sustainability 17 07679 g018
Figure 19. Schematic diagram of raft backing and netting enclosure. (a) Raft layout (floating particles); (b) Raft layout (sedimentary particles); (c) Raft layout (floating particles/artificial net enclosures); (d) Raft layout (sedimentary particles/artificial net enclosures).
Sustainability 17 07679 g019
Figure 20. Layout mode 1.
Sustainability 17 07679 g020
Figure 21. Layout mode 2.
Sustainability 17 07679 g021
Figure 22. Layout mode 3.
Sustainability 17 07679 g022
Figure 23. Layout mode 4.
Sustainability 17 07679 g023
Table 1. Velocity of wind farm sea area.
Station NameLongitudeLongitudeMean
Depth (m)
Vertical Mean
Flow Rate (cm/s)
Horizontal Mean Flow Rate (cm/s)Maximum Flow Rate (cm/s)Average Temperature (°C)
NP1112°11′
29.16″ E
21°34′
32.10″ N
15.8915.0312.2333.4326.35
17.0418.8113.4135.8521.31
NP2112°18′
28.62″ E
21°34′
03.48″ N
15.3318.9313.3440.5826.19
17.1615.418.5521.6321.02
NP3112°04′
37.74″ E
21°27′
30.72″ N
23.5618.7610.8733.1625.96
24.7018.5313.0635.1121.97
NP4112°23′
05.46″ E
21°29′
25.14″ N
22.2520.3611.1641.5725.98
23.4821.6515.6940.3721.81
NP5112°10′
47.46″ E
21°25′
46.92″ N
25.2219.5811.3833.9826.04
26.2318.2412.7634.9022.14
NP6112°12′
28.74″ E
21°20′
51.48″ N
31.2020.4013.2237.7125.55
32.1828.9018.2040.7122.14
Table 2. Parameter setting.
Mesh Resolution (Flow Field/Cage)Layers of Expansion
135
2 m/1 m2/1–12/1–32/1–5
4 m/2 m4/2–14/2–34/2–5
6 m/3 m6/3–16/3–36/3–5
Table 3. Model parameter.
ParametersValue
Time step180 s
Time step number5280
Operation modeLow order, fast algorithm
Flood and dryDrying depth 0.005 m, Flooding depth 0.05 m, wetting depth 0.1 m
DensityBarotropic
Eddy viscositySmagorinsky formulation, Constant: 0.28
Bed resistanceManning number, Constant: 32
Table 4. Parameter configuration.
Resolution (m)Mesh QuantityAverage Calculating Time (min)Average Number of Errors (Time)
25–4960,000–100,000 cells22735
50–50020,000–50,000 cells1152
500–10005000–10,000 cells480
Table 5. Cage layout of MF.
Group Spacing (m)Cage ShapeModeIntra-Group Spacing (m)Velocity (m/s)
0.20.40.6
80SquareA10MF0.2–1MF0.4–1MF0.6–1
20MF0.2–2MF0.4–2MF0.6–2
B0MF0.2–3MF0.4–3MF0.6–3
CircularC10MF0.2–4MF0.4–4MF0.6–4
20MF0.2–5MF0.4–5MF0.6–5
D0MF0.2–6MF0.4–6MF0.6–6
90SquareA10MF0.2–7MF0.4–7MF0.6–7
20MF0.2–8MF0.4–8MF0.6–8
B0MF0.2–9MF0.4–9MF0.6–9
CircularC10MF0.2–10MF0.4–10MF0.6–10
20MF0.2–10MF0.4–10MF0.6–10
D0MF0.2–12MF0.4–12MF0.6–12
100SquareA10MF0.2–13MF0.4–13MF0.6–13
20MF0.2–14MF0.4–14MF0.6–14
B0MF0.2–15MF0.4–15MF0.6–15
CircularC10MF0.2–16MF0.4–16MF0.6–16
20MF0.2–17MF0.4–17MF0.6–17
D0MF0.2–18MF0.4–18MF0.6–18
Note: The four modes A, B, C, and D are shown in Figure 7.
Table 6. Arrangement distance.
ScenariosClassificationD (m)E (m)L (m)
Single C60 circular cage
ScenariosPile foundation typesD (m)E (m)L (m)
Stocking density/80.001606.00316.00
Foundation type Monopile foundations112.001574.00316.00
Four-pile jacket foundations112.001574.00316.00
Cage layout mode
Inter-group spacing
(m)
Intra-group spacing
(m)
D (m)E (m)L (m)
80A1080.00917.98303.57
2080.00847.98298.57
B080.00987.98291.64
C1080.00889.00301.50
2080.00819.00296.50
D080.00959.00287.50
90A1080.00857.98303.57
2080.00787.98298.57
B080.00927.28291.54
C1080.00829.00301.50
2080.00759.00296.50
D080.00899.00287.50
100A1080.00797.98303.57
2080.00727.98298.57
B080.00867.28291.54
C1080.00769.00301.50
2080.00699.00296.50
D080.00839.00287.50
Flow-blocking rafts
ScenariosIntra-group spacing (m)D (m)E (m)L (m)
Individual circular cage/80.001606.00316.00
One group (four cages)1080.001653.00301.50
Table 7. Attenuation percentage of MF samples.
No. 1Attenuation Percentage (%)No. 2Attenuation Percentage (%)No. 3Attenuation Percentage (%)No. 4Attenuation Percentage (%)
MF0.2–194.50MF0.2–494.00MF0.2–1493.00MF0.2–1793.00
MF0.4–193.00MF0.4–494.50MF0.4–1489.00MF0.4–1790.50
MF0.6–192.33MF0.6–493.83MF0.6–1489.50MF0.6–1790.00
Average93.28Average94.11Average90.50Average91.17
No. 5Attenuation Percentage (%)No. 6Attenuation Percentage (%)No. 7Attenuation Percentage (%)No. 8Attenuation Percentage (%)
MF0.2–394.50MF0.2–694.00MF0.2–1594.00MF0.2–1893.50
MF0.4–370.00MF0.4–670.80MF0.4–1568.60MF0.4–1869.40
MF0.6–387.33MF0.6–688.17MF0.6–1585.50MF0.6–1886.33
Average84.01Average84.32Average82.70Average83.08
Table 8. Attenuation percentage of JF samples.
No. 9Attenuation Percentage (%)No. 10Attenuation Percentage (%)No. 11Attenuation Percentage (%)No. 12Attenuation Percentage (%)
JF0.2–194.00JF0.2–494.00JF0.2–1492.50JF0.2–1793.00
JF0.4–185.50JF0.4–485.50JF0.4–1482.00JF0.4–1783.00
JF0.6–192.33JF0.6–492.17JF0.6–1490.50JF0.6–1791.00
Average90.61Average90.56Average89.00Average89.00
No. 13Attenuation Percentage (%)No. 14Attenuation Percentage (%)No. 15Attenuation Percentage (%)No. 16Attenuation Percentage (%)
JF0.2–394.00JF0.2–693.50JF0.2–1594.00JF0.2–1893.50
JF0.4–392.75JF0.4–692.00JF0.4–1592.50JF0.4–1891.75
JF0.6–392.17JF0.6–692.50JF0.6–1591.83JF0.6–1891.17
Average92.97Average92.67Average92.78Average92.14
Table 9. Attenuation percentage of CK samples.
No. 17Attenuation Percentage (%)No. 18Attenuation Percentage (%)No. 19Attenuation Percentage (%)No. 20Attenuation Percentage (%)
CK0.2–194.50CK0.2–494.00CK0.2–1493.00CK0.2–1793.00
CK0.4–193.25CK0.4–492.75CK0.4–1491.50CK0.4–1791.50
CK0.6–192.50CK0.6–492.00CK0.6–1491.00CK0.6–1791.00
Average93.42Average92.92Average91.83Average91.83
No. 21Attenuation Percentage (%)No. 22Attenuation Percentage (%)No. 23Attenuation Percentage (%)No. 24Attenuation Percentage (%)
CK0.2–394.00CK0.2–681.50CK0.2–1587.00CK0.2–1893.50
CK0.4–392.00CK0.4–680.75CK0.4–1586.25CK0.4–1891.75
CK0.6–392.00CK0.6–680.83CK0.6–1585.83CK0.6–1891.17
Average92.67Average81.03Average86.36Average92.14
Table 10. Range of particle escape trajectories.
ScenariosSingle CageGrouped Cages
Particle typeFloating feed particlesSettling particlesFloating feed particlesSettling particles
Density
(kg/m3)
7001550200070015502000
Adsorption range (m)0–200–750–640–450–800–71
Unadsorbed range (m)0–25~
0–29
0–80~
0–84
0–69~
0–73
0–69~
0–73
0–84~
0–91
0–75~
0–89
Table 11. Particle dispersion range.
ScenariosMajor Axis (km)Minor Axis (km)
Single cage (C60 circular cage)
floating feed particles 0.70 g/cm311.4302.432
sedimentary particles1.55 g/cm32.3680.435
2.00 g/cm30.4480.151
Four cages (Mode type C in Figure 7)
floating feed particles 0.70 g/cm311.5802.991
sedimentary particles1.55 g/cm32.5080.591
2.00 g/cm30.5210.199
Group cages (Mode (b) in Figure 8)
floating feed particles 0.70 g/cm312.524.126
sedimentary particles1.55 g/cm33.521.262
2.00 g/cm30.5400.538
Table 12. Flow velocity at the cage center of the last row under different scenarios.
GroupsVelocity
(0.2 m/s)(0.4 m/s)(0.6 m/s)
Individual circular cage (no culture)0.0560.1200.183
Individual circular cage (aquaculture)0.0360.0820.130
One group (four cages and aquaculture)0.0460.1010.164
CK0.2-4/CK0.4-4/CK0.6-4
(no culture)
0.0120.0290.048
CK0.2-4/CK0.4-4/CK0.6-4
(aquaculture)
0.0090.0250.041
Table 13. Layout mode.
ModeFlow VelocityFarmed FishFront-Positioned RaftPost-Positioned Raft
Layout mode 1FastHighly susceptible to injury.YesNo
Layout mode 2MediumModerately susceptible to injuryYesYes
Layout mode 3SlowLess susceptible to injuryNoYes
Note: (a) Layout mode 1: V > 1.5 m/s, the suggested culture density is ≥20 kg/m3; (b) Layout mode 2: 0.6 < V ≤ 1.5 m/s, the suggested culture density is ≥20 kg/m3.; (c) Layout mode 3: V ≤ 0.6 m/s, the suggested culture density is ≤15 kg/m3.
Table 14. Shipping lane standards.
ScenariosMinimum Width
The main channel is open for two-way traffic150 m
Inland waterway/branch route60 m
Small operation and maintenance vessels (intertidal zone)≥20 m
Port roundabout areaDiameter: 300 m
Large platform towing (complex waterways)Temporary expansion & one-way control
Unrestricted navigation area operations≥1 nautical mile (1.85 km)
Disclaimer/Publisher’s Note: The statements, opinions and data contained in all publications are solely those of the individual author(s) and contributor(s) and not of MDPI and/or the editor(s). MDPI and/or the editor(s) disclaim responsibility for any injury to people or property resulting from any ideas, methods, instructions or products referred to in the content.