Article

Does Basin Ecological Compensation Promote Green Economic Development in the Compensated Area?—A Quasi-Natural Experiment Focusing on the Tingjiang-Hanjiang River Basin, China

College of Economics and Management, Nanjing Forestry University, Nanjing 210037, China
*
Author to whom correspondence should be addressed.
Sustainability 2025, 17(16), 7538; https://doi.org/10.3390/su17167538
Submission received: 10 June 2025 / Revised: 16 August 2025 / Accepted: 17 August 2025 / Published: 21 August 2025
(This article belongs to the Section Economic and Business Aspects of Sustainability)

Abstract

Ecological compensation policies have become increasingly important for sustainable watershed management worldwide. Current research primarily examines environmental outcomes, resulting in a limited understanding of their economic impacts, especially concerning green development. This study evaluates the ecological compensation pilot in the Tingjiang-Hanjiang River Basin, using difference-in-differences (DID) and mediation analysis on panel data from 136 counties spanning the 2009–2022 period. The findings indicate that the ecological compensation policy reduced green economic growth by 3.94% in the compensated regions. However, it also promotes ecological protection, as demonstrated in the Wujiang and Yuanjiang River Basins, where compensation standards and methods are designed to encourage conservation. The main challenge to green economic development in the Tingjiang-Hanjiang River Basin during the first two phases of ecological compensation policies is the lack of environmentally focused technological innovation, resulting in limited growth. Heterogeneity analysis reveals that these policies are less effective in restraining activities in economically weaker upstream regions than in more developed downstream areas. Consequently, key requirements for advancing green economic development in the third round of compensation policies are proposed.

1. Introduction

Water ecological compensation (WEC) is a market-based institutional arrangement that balances stakeholder interests while reconciling environmental conservation with economic development [1]. Aligned with China’s 20th National Congress goals for green development and ecological civilization [2,3], WEC incentivizes upstream-downstream collaboration by compensating ecological protectors and charging beneficiaries, thereby improving water quality and ecosystem resilience [4]. Cross-provincial WEC has even broken down administrative barriers through cost-sharing and joint governance [5,6]. Amid growing environmental challenges, WEC has become a vital policy instrument for balancing ecological conservation and economic development, serving as a cornerstone of China’s ecological civilization framework.
China’s cross-provincial WEC mechanism has made significant progress since its launch in 2012 (Xin’an River basins), later extending to the Tingjiang-Hanjiang, Dongjiang, and Jiuzhou River basins [7]. These pilots highlight the mechanism’s key features—cost-sharing, benefit-sharing, and joint governance—which help resolve transboundary disputes and enhance water quality [8,9]. As a comprehensive policy framework, WEC balances ecological and economic development while aligning stakeholder interests [10]. Practical applications confirm its effectiveness in improving ecosystems and optimizing benefit distribution. However, challenges remain, including standardization and funding sustainability, requiring policy innovation and technical solutions. Future efforts should focus on precision, market-driven approaches, and long-term governance to ensure basin sustainability.
Due to the complexity and significance of ecological compensation policies, they have attracted extensive attention from many researchers. The majority of research assessing the efficacy of WEC policies emphasizes their ecological and environmental advantages, since ecological compensation policies aim to enhance the basin’s ecological environment while fostering harmonious economic and environmental development grounded in effective environmental governance. The ecological and environmental impacts of compensation policies have been assessed by scholars through various angles.
Some researchers analyze the ecological and environmental advantages of cross-border WEC policies, focusing on their impact on water quality and the aquatic environment of boundary areas, as well as the underlying mechanisms [11]; some scholars examine how WEC policies affect carbon emissions through the lens of air quality management, utilizing the difference-in-differences model to analyze this relationship areas [12,13], and study carbon emission reduction and green development together [14]; and the dynamic analysis of environmental benefits is also a common topic [15]. Through the research on environmental benefits, it is found that scholarly analysis indicates that basin ecological compensation policies have promoted improvements in water quality and reductions in air pollution development of the ecological environment, indicating that basin ecological compensation policies can have positive effects on the green ecological environment.
Compared with the positive benefits brought to the ecological environment, the economic benefits brought by basin WEC policies are controversial. Many researchers assert that horizontal basin WEC can offset the costs and losses associated with environmental protection by optimizing industrial structures and boosting employment [16]. Additionally, the influence of WEC policies on industrial structures has been studied [17]. Some studies contend that the alterations in industrial structure resulting from horizontal basin WEC exert a certain degree of restraint on economic development [18]. Some scholars contend that WEC policies lead to the creation of an enterprise exit mechanism, which temporarily constrains economic growth as firms withdraw [19]. Specifically, most researchers’ research often focuses on the role of WEC policies on the local economy, especially whether farmers in poor areas increase their income and whether the wealth disparity gap is narrowed: some scholars have found that the implementation of WEC policies has developed ecological agriculture and green tourism, driven the increase in residents’ income, and thus promoted economic development [20,21].
Green total factor productivity (GTFP) serves as a crucial metric for assessing economic quality and sustainability, steering the economy towards a more environmentally friendly and efficient future [22]. In contemporary research, GTFP has emerged as a key metric for assessing production efficiency, demonstrating how firms optimize the use of productive inputs and environmental resources during manufacturing processes [23]. In the topic of high-quality agricultural development, agricultural GFTP has also become an important criterion for measurement [24]. In the financial sector, green financial tools and digital financial technologies drive the growth of GTFP by optimizing capital allocation and enhancing the efficiency of environmental governance; however, it is necessary to strike a balance in financial deepening and ecological regulation [25]. Technologies such as intelligent monitoring, the industrial Internet, and digital twins empower the improvement of GTFP in the digital economy, while it is necessary to prevent the problem of unequal access to technology [26]. In terms of environmental policies, market-incentive tools (such as carbon trading and environmental taxes) can guide green innovation, but the impact of industry heterogeneity needs to be taken into account [27]. Government governance influences regulatory efficiency through performance assessment, fiscal incentives, and policy synergy, while the international climate governance framework further extends GTFP research to the global policy coordination level [28]. Overall, GTFP research integrates micro-level corporate behavior with macro-level development goals, providing a key analytical tool for green transformation. Traditional productivity indicators (such as total factor productivity) do not take environmental constraints into account, while GTFP processes unexpected output through the super-efficiency SBM model and combines it with the dynamic assessment of the GML index, which can more scientifically reflect the true impact of ecological compensation policies on the “quality of green economic growth”.
In summary, significant progress has been made in evaluating the effectiveness of WEC policies, and diverse policy assessment methodologies have provided valuable references for this study. However, the existing research still has the following shortcomings: (1) Most existing studies assess the ecological or economic effects of ecological compensation policies in isolation (such as only focusing on carbon emissions or residents’ income), while this paper simultaneously quantifies the synergy between the environment and the economy through the GTFP framework, revealing the real effects of WEC policies in the green transformation (such as the trade-off between short-term economic pain and long-term ecological dividends). (2) GTFP addresses the deficiency of traditional indicators (such as GDP) in reflecting environmental costs by incorporating non-desired outputs (such as PM2.5 and industrial wastewater) and resource utilization efficiency (labor and capital). (3) The research perspective of GTFP mainly focuses on the enterprise and government levels, while the exploration of regional economy, especially at the county level, is still insufficient.
Addressing the identified research gaps, this study concentrates on the Tingjiang-Hanjiang River Basin as its main research area. Utilizing panel data from 136 counties, districts, and cities in Guangdong and Fujian provinces spanning the 2009 to 2022 period, this study calculates green total factor productivity and employs a difference-in-differences (DID) model. The study assessed the effects and underlying mechanisms of the initial two rounds of WEC policies on the green economic development benefits in the compensated counties of the Tingjiang-Hanjiang River Basin. (1) This study examines whether the WEC policy in the Tingjiang-Hanjiang River Basin can enhance regional green economic development. (2) Is there regional heterogeneity in the green economic development benefits brought about by this policy? What mechanisms do WEC policies employ to advance green economic development?
The contribution of this article lies in the following: on the one hand, based on the results of the first two rounds of WEC policies, insights can be drawn, providing a basis for the formulation of the third round of policies for the study of river basins; on the other hand, it supplements the evaluation research on the comprehensive indicators of the green economy in the WEC.

2. Research Design

2.1. River Basin Research

The Tingjiang River, a major tributary of eastern Guangdong’s Hanjiang River, provides essential water resources for over 10 million residents in downstream cities [29]. In 2016, the Guangdong and Fujian provinces established China’s second cross-provincial WEC mechanism for the Tingjiang-Hanjiang Basin, implementing a “two-way compensation” system covering four Fujian-originating rivers. Through two implementation rounds (2016–2022), this pilot program significantly improved water quality while creating varying impacts on regional economic and green development [30].
The Tingjiang-Hanjiang River Basin demonstrates a complementary ‘ecology-economy’ pattern, where Longyan in Fujian Province serves as an ecological barrier prioritizing water conservation, thereby restricting its economic growth. The downstream section in Chaoshan, Guangdong Province, has formed a dense industrial belt, relying on the high-quality water sources from the upstream to support economic development. A benefit circulation system has been developed, expanding into collaborative models like direct ecological agricultural product supply and technology feedback. This approach creates conditions for ecological protection and regional development, offering a systemic model for cross-provincial river basin governance [31].
The treatment group comprises 15 county-level jurisdictions situated in the Tingjiang River’s upper basin and select headwater areas of the Hanjiang River. The selected areas comprise seven counties (districts) in Fujian Province (Yongding, Changting, Shanghang, Wuping, Liancheng, Pinghe, and Ninghua) and eight counties (districts and cities) in Guangdong Province (Dapu, Fengshun, Chao’an, Jiaoling, Meixian, Wuhua, Pingyuan, and Xingning). For comparative analysis, the remaining 121 county-level administrative units across both provinces serve as the control group. The basin area map is shown in Figure 1.

2.2. Model Design

This research considers the 2016 WEC policy in the Tingjiang-Hanjiang River Basin as a quasi-natural experiment. Our main analysis utilizes a DID approach to evaluate the policy’s effect on regional green economic growth. The baseline model is specified as follows:
G T F P i t = α 0 + α 1 E C P i t + α 2 X i t + μ i + γ t + ε i t
where i denotes the county (district/city) and G T F P i t measures green total factor productivity for region in a year, reflecting its green economic development level. The primary explanatory variable is assigned a value of 1 if the county adopted the WEC policy in a given year, and 0 if not. X i t represents control variables, μ i , γ t with time and region fixed effects captured by and, respectively, ε i t is the error term.
Secondly, the economic development levels between Guangdong and Fujian Provinces differ significantly, resulting in economic disparities among their counties. The WEC policy for river basins can have varying impacts on the green economic development across different economic regions. Therefore, this paper, following the approach of Liu et al. [32], Model (2), examines the interprovincial river basin eco-compensation policy’s varying impacts on green economic growth; this analysis specifically addresses differential effects observed across distinct regional economies.
The study is divided into two subsamples: upstream Fujian Province and downstream Guangdong Province, and introduces the heterogeneity identification variable U P S to assess regional differences. The heterogeneity test model is formulated as follows:
G T F P i t = β 0 E C P i t + β 1 E C P i t × U P S i t + β 2 U P S i t + β 3 X i t + μ i + γ t + ε i t
where U P S i t represents a dummy variable indicating whether it is an upstream area, U P S i t  = 1 indicates belonging to the upstream area, and U P S i t  = 0 indicates not belonging to the upstream area. The explained variable ( G T F P i t ), control variables ( X i t ), etc., are consistent with the baseline regression.
Finally, the lack of an effective technological innovation mechanism is a key factor hindering the WEC policy’s ability to foster green economic development. To further examine the technological innovation mechanism, the analysis utilizes county-level patent metrics, specifically the aggregate count of invention and utility model applications (Ti), as the dependent measure. In line with Jiang [33], a two-step method is employed for the analysis. The model settings are as follows:
G T F P i t = β 0 + β 1 E C P i t + β 2 m e d i u m i t + β 3 X i t + μ i + γ t + ε i t
T i i t = α 0 + α 1 E C P i t + α 2 X i t + μ i + γ t + ε i t
where T i i t is a mediating variable, mainly including the variable of technological innovation.

2.3. Measurement of Green Economic Development Level and Model Setting

2.3.1. The Theoretical Framework of Green Economic Development

This study constructs a comprehensive evaluation index system for green economic development, with GTFP at its core. By adopting the combined Super-SBM-GML model, it systematically integrates input-output variables across three dimensions—economic, environmental, and social. These include input indicators such as capital stock, labor force, and energy consumption, along with desirable/undesirable output indicators like real GDP, residents’ income, and industrial waste emissions. The methodology demonstrates three distinctive advantages: first, model innovation—the super-efficiency SBM addresses measurement biases in traditional DEA models while the GML index ensures intertemporal comparability. Second, policy applicability—it supports micro-mechanism analysis at county-level scale and DID policy effect identification. Third, result robustness—confirmed through multiple validation tests including variable substitution, model comparison, and sample screening.
Compared to alternative methods such as ecosystem service valuation and environmental-economic accounting, GTFP more accurately reflects the transitional economic characteristics of developing countries and aligns closely with Sustainable Development Goals, making it the ideal choice for this research.

2.3.2. Super-Efficiency SBM Model

While traditional DEA models cannot differentiate between efficient DMUs, Tone [34] developed the SBM model to address input-output slackness and radial/angular measurement biases. However, this approach still cannot rank multiple efficient DMUs within the same period. To resolve this limitation, we employ Tone’s [35] super-efficiency SBM model, which integrates super-efficiency concepts with SBM to enable complete efficiency comparisons. The model specification is as follows:
m i n ρ = 1 + 1 m i = 1 m s i x i 0 1 1 n + k r = 1 n s r + y r 0 + l = 1 k s l b l 0
S . t x i 0 j = 1 J λ j x i j + s i , i y r 0 = j = 1 J λ j y i j s r + , r b l 0 = j = 1 J λ j b i j s l + , l λ j 0 , s i 0 , s r + 0 , s l + 0
The objective function measures efficiency, with minimization determining DMU super-efficiency. Let x , y , and b denote inputs, desirable outputs, and undesirable outputs, respectively. For m input variables (i = 1,…,m), s i represents input slack (excess inputs), where x i 0 is the ith input and y r 0 the ith desirable output of DMU0. Similarly,   s l indicates undesirable output slack (reducible bad outputs), with b l 0 being the lth undesirable output.

2.3.3. GML Index Model

While conventional DEA models cannot distinguish between efficient DMUs, Tone’s SBM model addresses input-output slackness and radial/angular measurement biases. However, it remains unable to rank multiple efficient DMUs cross-sectionally. To resolve this, we adopt Oh’s [36] super-efficiency SBM model, which combines super-efficiency principles with SBM to enable complete efficiency comparisons. The model specification is as follows:
G M L t t + 1 x t , y t , b t ; x t + 1 , y t + 1 , b t + 1 = 1 + D 0 t x t , y t , b t 1 + D 0 t x t + 1 , y t + 1 , b t + 1
An oriented output greater than 1 signifies that GTFP has increased compared to the previous period; an output equal to 1 indicates no change; and an output between 0 and 1 signifies a decrease.

2.4. Variable Description and Descriptive Statistics

2.4.1. Explained Variable

GTFP is a measure of productivity that accounts for environmental impacts and resource efficiency, integrating ecological considerations into traditional productivity metrics. This study employs the super-efficiency SBM model with undesirable outputs and the GML index to assess county-level GTFP and evaluate green economic development. Following Peng and Yu [37], the 2009 GTFP is set as a baseline value of 1, and the 2010 GTFP is determined by multiplying the 2009 GTFP by the 2010 GML index. And so on for subsequent years.
Variables for input and output in the SBM-GML Model: (1) Labor Input, this paper refers to Qian et al. [38] and utilizes the year-end employee count in urban units to assess county-level labor input. (2) Capital Input, this paper refers to Hunjra et al. [39], who utilize the loan balance of financial institutions in each county to assess capital input. (3) Expected Output, considering the availability of county-level data, this paper refers to Yuan et al. [40] and selects the regional economic development level and residents’ savings capacity as the expected outputs, measured by the county’s real GDP and urban and rural residents’ savings balance, respectively. (4) Unexpected Output, due to the scarcity of county-level environmental information, this paper refers to Stratoulias [41] and uses PM2.5 concentration and industrial wastewater discharge as unexpected outputs.

2.4.2. Core Explanatory Variable

Ecological Compensation Policy (ECP). ECP is represented as a binary variable, where ECP = 1 indicates policy implementation and ECP = 0 denotes non-implementation. For implementing regions, the value switches from 0 to 1 starting from the policy’s enactment year (2016).

2.4.3. Control Variables

(1) This study on green total factor productivity incorporates industrial structure (Stru) as a control variable. This article employs the methodology of Yang et al. [42] to evaluate county-level industrial structure by analyzing the ratio of output values between tertiary and secondary industries. (2) Population density (Pop). The development of the local green economy is influenced by the region’s population. Both excessive and insufficient population can impact the regional economic development. This article adopts the method of Ma et al. [43] by representing population density expressed as the ratio of a region’s population to its administrative area. (3) Government expenditure intensity (Gov). The financial expenditure intensity of the government on the regional green economy development directly affects the green economic development level of the county (city, district). Therefore, this article refers to the research of Wei et al. [44] and uses local fiscal general budget expenditure (in ten thousand yuan) to measure the local government support. (4) Education level (Edu). The residents’ education level is significantly linked to the region’s green economic development. Consequently, this article adopts the approach outlined by Zheng et al. [30], which uses the ratio of primary and secondary school students to the total population as an indicator of the education level in a county, city, or district. (5) Medical construction level (Medical). The level of medical construction can reflect the local economic development level. This article adopts Yang’s [12] approach, utilizing the ratio of medical institution beds to the total population as an indicator of local medical standards.

2.4.4. Mediating Variable

Following Huang et al. [45], we employ patent data to measure technological innovation (Ti) as our mediating variable. We quantify regional innovation capacity by calculating the total number of utility models and invention patents granted in each county, district, or city.

2.4.5. Data Source

This paper selects the county-level data of Guangdong and Fujian provinces from 2009 to 2022. After excluding counties with significant data gaps, 136 counties (districts, cities) were selected for the study. Data for the indicators are obtained from the ‘China County Statistical Yearbook,’ various prefecture-level city statistical yearbooks, the ‘China Statistical Yearbook,’ and annual average PM2.5 concentration grid data from Dalhousie University’s Atmospheric Composition Analysis Group, analyzed using ArcGIS 10.7 software. The descriptive statistics of the main variables are shown in Table 1.

3. Empirical Analysis Results

3.1. Impact of Basin WEC Policy on Green Economic Development

Table 2 presents the results. Columns (1) and (2) exclude time and region fixed effects, whereas columns (3) and (4) incorporate them. The estimation results indicate that, even without accounting for time and region fixed effects or controlling for other variables, the policy significantly negatively affects green economic development, reducing the green economic level by about 3.9%. Even after accounting for time and region fixed effects, the regression results in column (3) continue to affirm the previous conclusion: the policy’s negative impact remains significant without controlling for other variables. The regression Equation (4) incorporates control variables and accounts for both time and region fixed effects. Empirical findings indicate that the pilot policy significantly restrains green economic development at the 10% significance level, a conclusion supported by robustness checks. Regression analysis reveals that the WEC policy in the Tingjiang-Hanjiang River Basin notably hinders green economic development in compensated regions, with robustness checks affirming this outcome. This suggests potential limitations in the policy’s effectiveness for green economy promotion, warranting further investigation into underlying mechanisms.

3.2. Parallel Trend Test

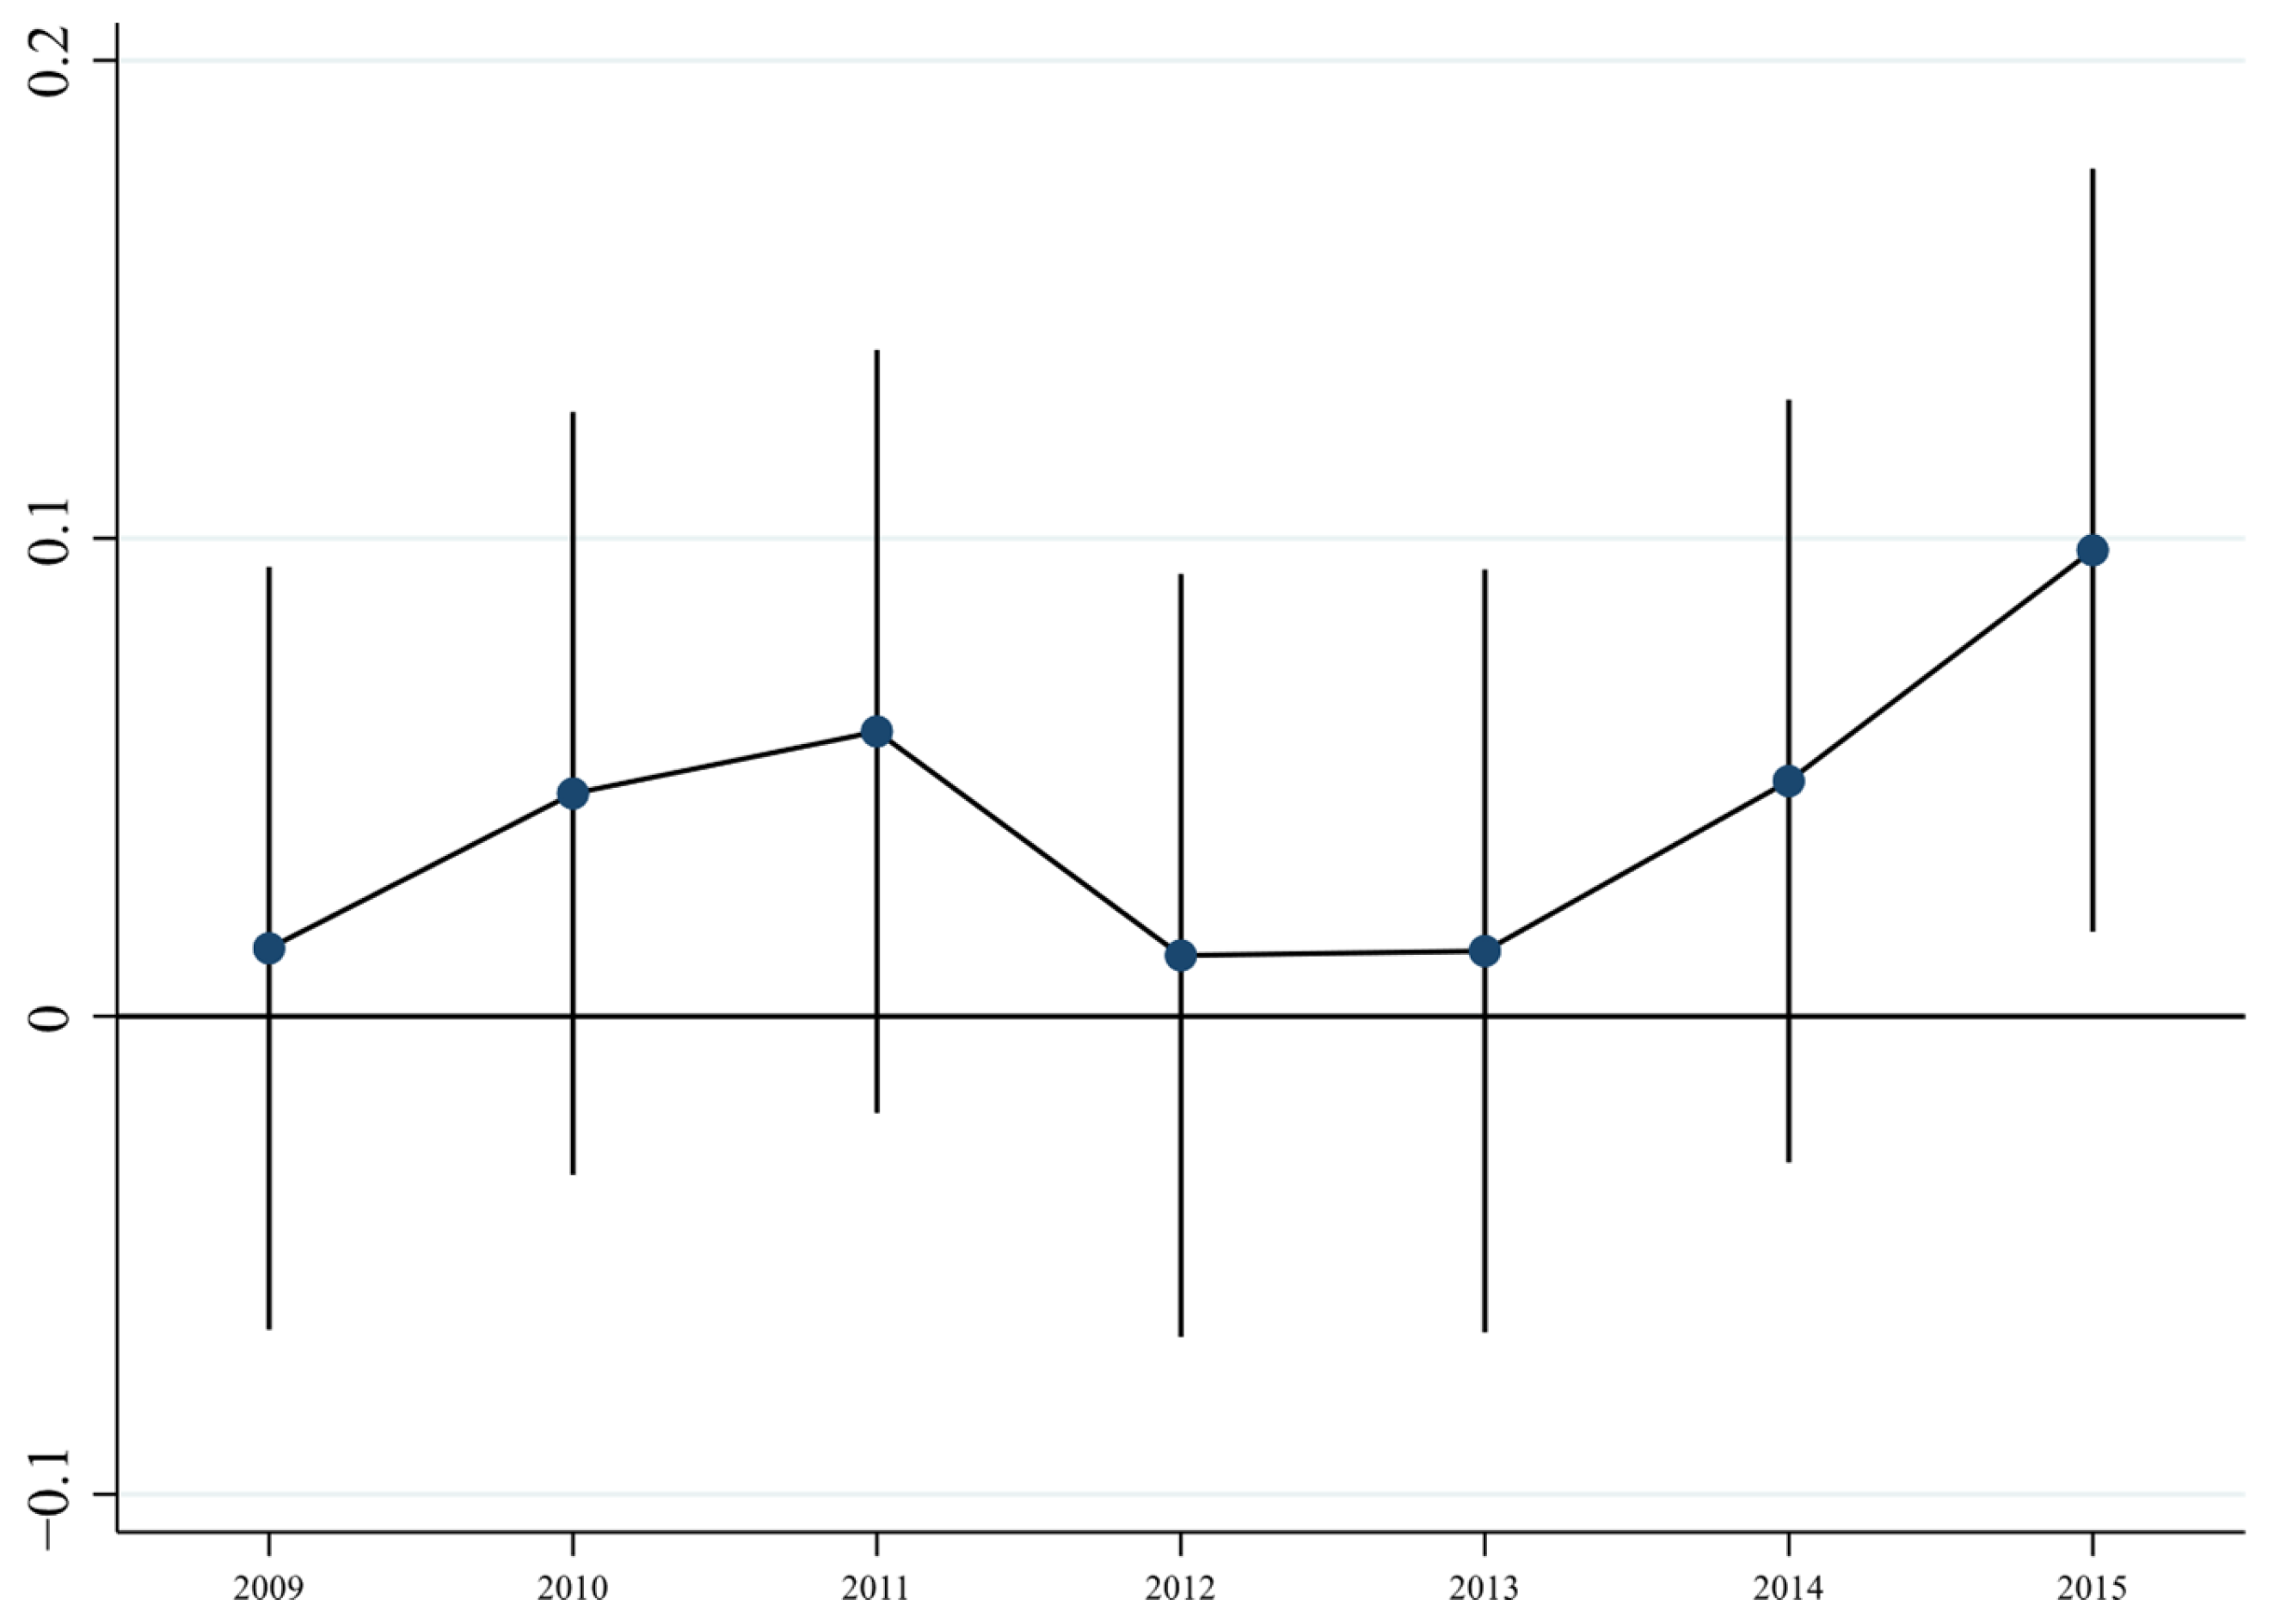
The accuracy of DID estimation results depends on the parallel trend assumption, requiring comparable pre-treatment trends between treatment and control groups. Following Jacobson et al. [46], we conduct a parallel trend test by introducing yearly dummy variables for the pre-policy period (interacted with the treatment group indicator) alongside the core DID term.
As shown in Figure 2, all pre-treatment coefficients are statistically indistinguishable from zero, with no discernible upward or downward trend. While minor fluctuations exist (e.g., a positive point estimate in 2015), their wide confidence intervals indicate no significant effects. These results validate the parallel trend assumption, confirming comparable trajectories between groups before the policy intervention.

3.3. Robustness Test

3.3.1. PSM-DID Estimation

The implementation of non-random policies in the Tingjiang-Hanjiang River Basin could lead to endogeneity concerns. To address this, we employ PSM-DID with three matching approaches (radius, nearest neighbor, and kernel matching) following Ye et al. [47] to ensure pre-treatment comparability.
As shown in Table 3, the PSM-DID estimates (Columns 1–3, including control variables and fixed effects) consistently demonstrate significantly negative coefficients for the policy variable. This indicates that the WEC policy hinders green economic development. The robustness of this finding across matching methods confirms the policy’s adverse impact after addressing selection bias, thereby validating the implementation effectiveness.

3.3.2. Placebo Test

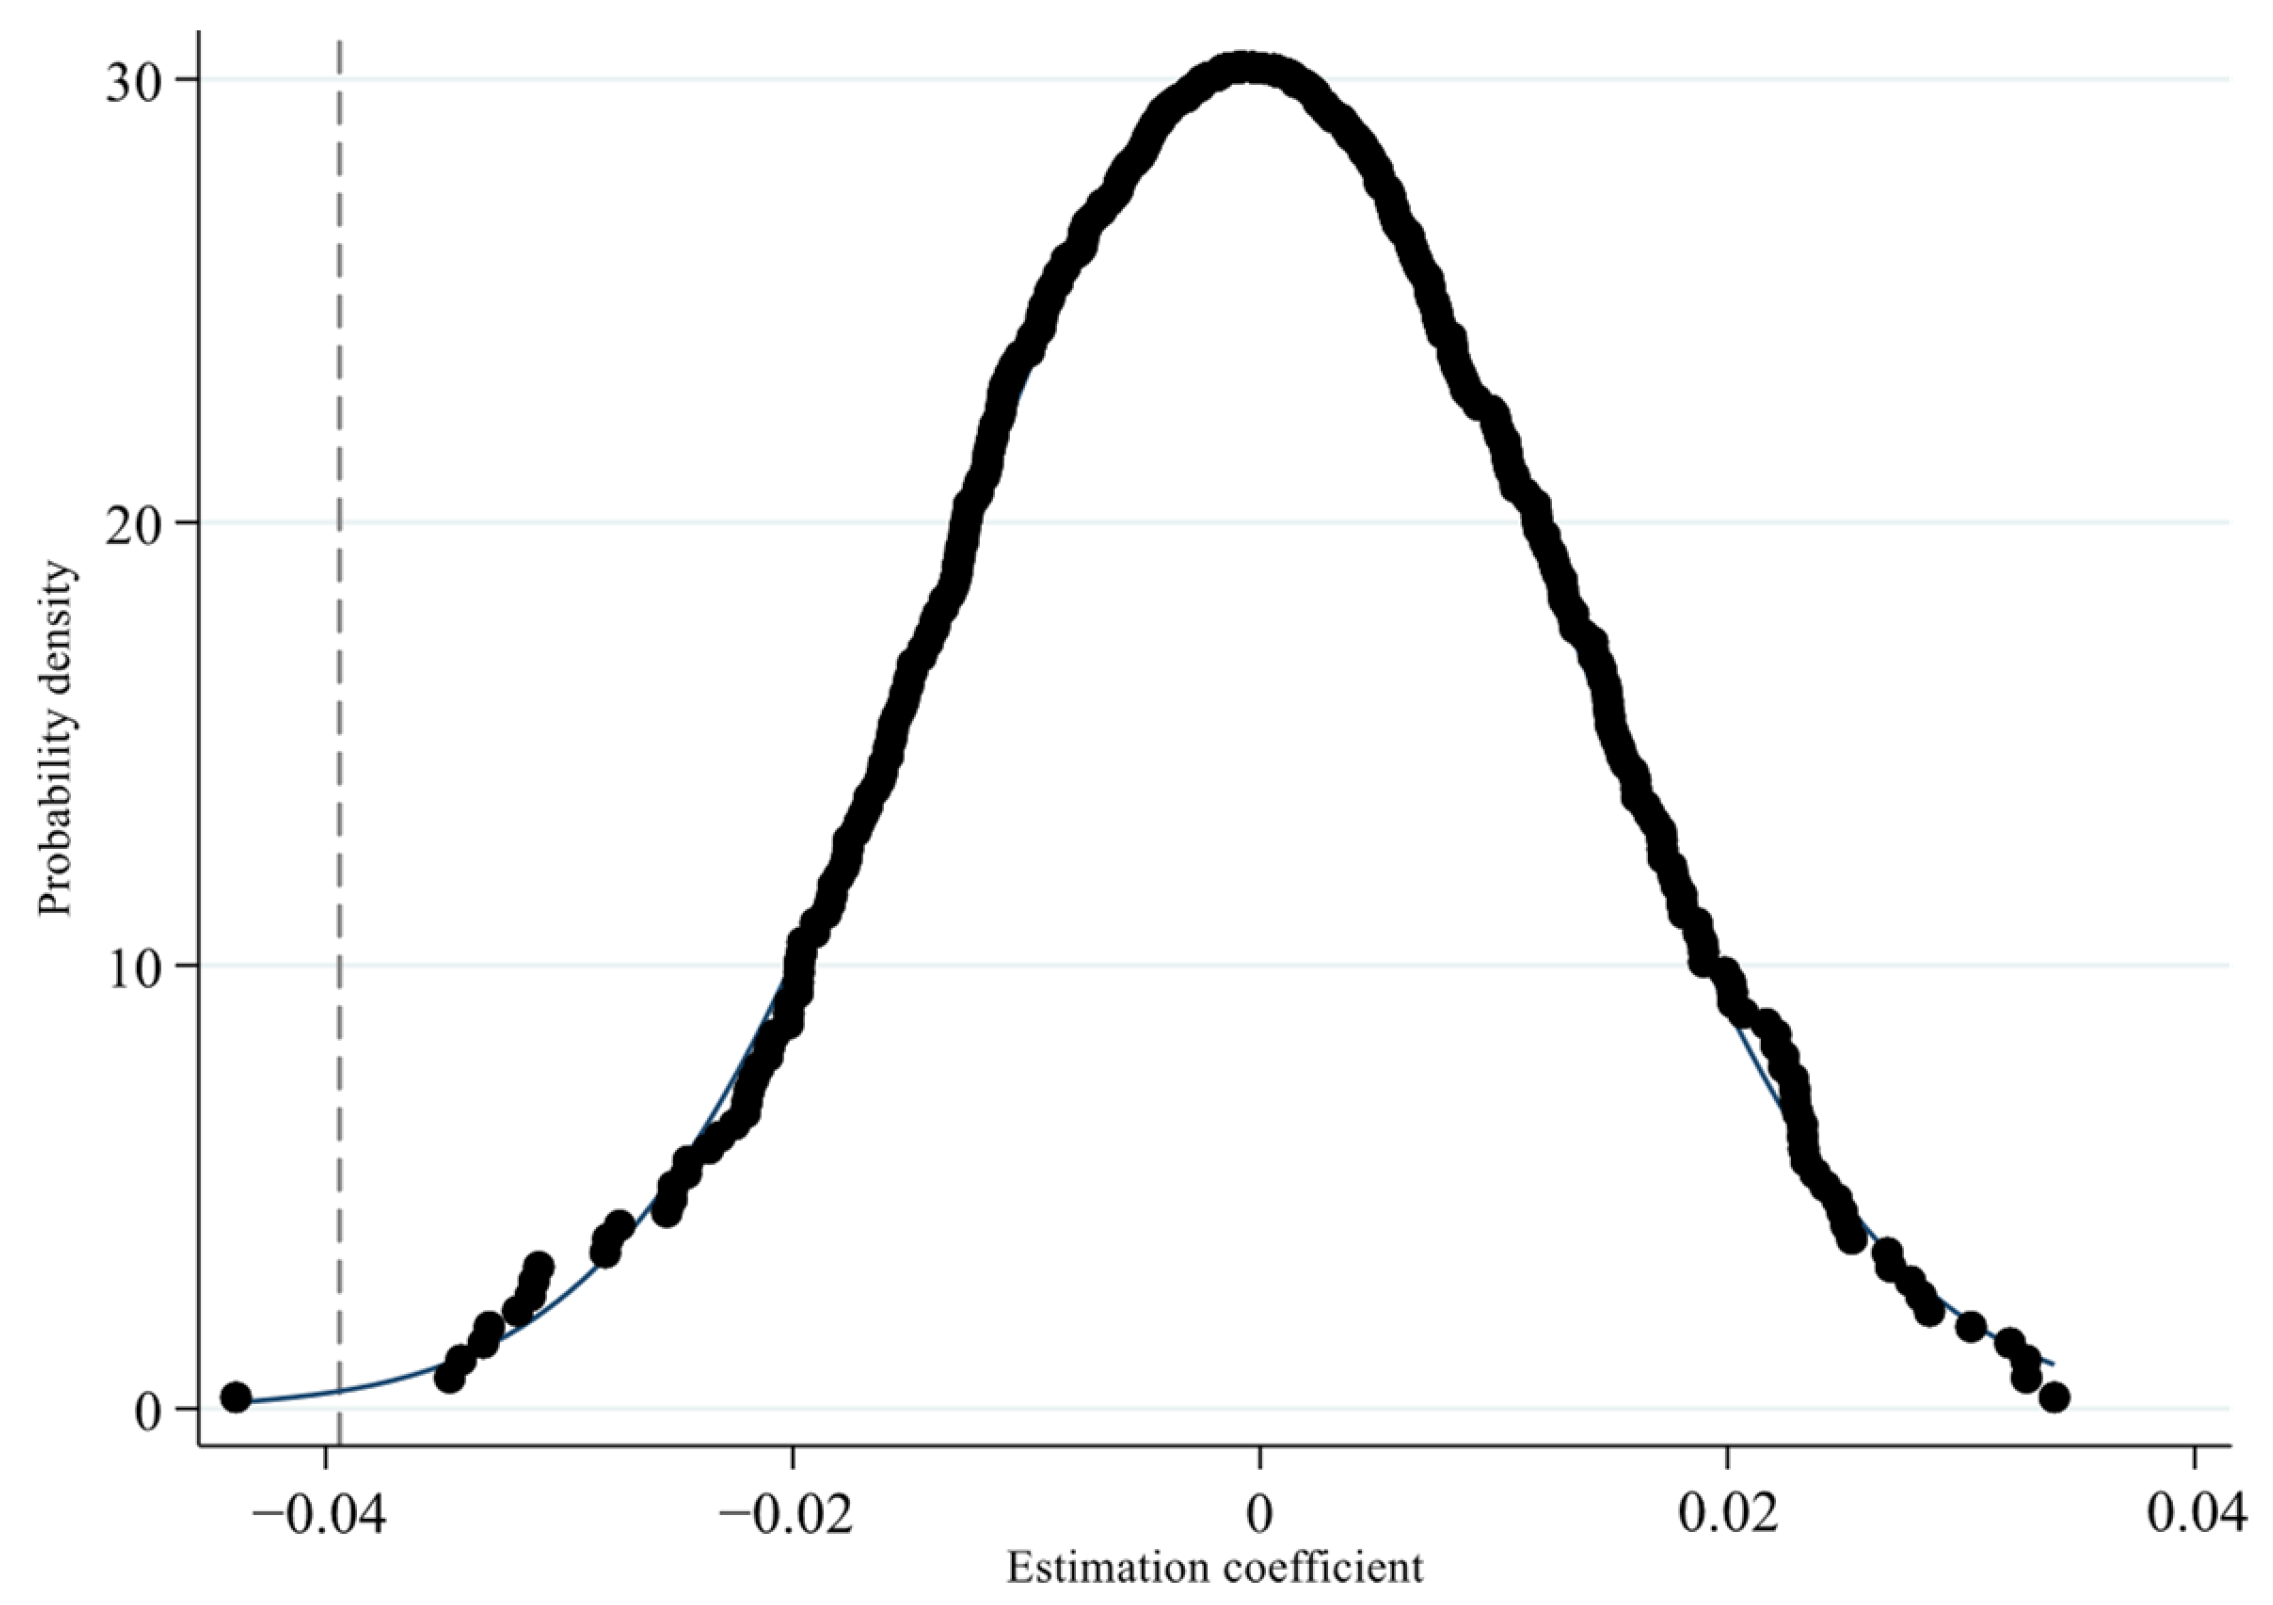
To distinguish the policy effect from random factors, a placebo test involves randomly assigning treatment status over 500 iterations, with 15 treated units per iteration. As shown in Figure 3, the coefficient distribution centers around zero, significantly differing from our benchmark results. This confirms the following: (1) the observed treatment effect is unlikely from random chance, and (2) the WEC policy’s impact on green development represents a genuine causal relationship rather than spurious correlation.

3.3.3. Counterfactual Test

We conduct a counterfactual test by artificially advancing the policy implementation year to 2015. As shown in Table 4, the insignificant coefficients across all specifications (with/without controls and fixed effects) support the validity of our empirical design, confirming the counterfactual assumption holds.

3.4. Heterogeneity Analysis

Figure 4 illustrates a significant decline in green economic development across both regional groups, with varying degrees of reduction. In the downstream region, counties (districts, cities) exhibit stronger economic strength, yet the WEC policy significantly inhibits green economic development. In contrast, the upstream region, characterized by relatively weaker economic strength, faces a reduced inhibitory impact from the policy on green economic development. In the Tingjiang-Hanjiang River Basin, the WEC policy more effectively constrains green economic development in the economically advanced downstream area than in the less developed upstream region.

3.5. Mechanism Test of Technological Innovation

The first two allocations of WEC funds in the Tingjiang-Hanjiang River Basin primarily emphasize ecological restoration and protection, lacking adequate investment in the research, development, and dissemination of green technologies. This allocation pattern hinders the transition of the compensated area’s industrial structure towards green innovation. The absence of effective incentives has hindered local enterprises and industries from advancing in green technology application and innovation, preventing them from driving green economic growth. In the process of government policy implementation, more attention is paid to short-term ecological protection effects, and green technology innovation and industrial upgrading are not organically combined. While relying on WEC funds, the compensated areas lack a systematic innovation-driven path and it is difficult for them to achieve sustainable economic growth through technological innovation, failing to form environmentally optimized technological progress.
Table 5 reveals a significant policy-induced suppression of technological innovation that persists after controlling for covariates and fixed effects, suggesting the WEC mechanism may inadvertently hinder green development through innovation constraints.
Drawing on the environmental technology progress bias model [48], green economic growth efficiency can only be enhanced when technological progress exhibits an environmentally optimized bias. Thus, for the third round of WEC policies to effectively promote sustainable development, it is critical to steer technological innovation toward environmentally favorable pathways.
According to the Porter Hypothesis, well-designed environmental regulations can incentivize corporate technological innovation through the innovation compensation effect, thereby offsetting compliance costs and enhancing long-term competitiveness [49]. However, this study finds that eco-compensation policies have a short-term inhibitory effect on green economic development. The underlying mechanisms may include the following: first, the current allocation of eco-compensation funds suffers from structural imbalances, with excessive focus on end-of-pipe treatment (e.g., pollution cleanup infrastructure). Such resource allocation may crowd out corporate R&D investment, leading to insufficient motivation for green technology innovation [50]. Second, local governments in policy implementation tend to prioritize short-term performance indicators such as water quality compliance, while lacking sufficient incentives to promote long-term green technology transformation, resulting in a binary opposition between “environmental protection and economic development.”
From the perspective of institutional economics, the current design of watershed eco-compensation policies has two key flaws: on the one hand, the policy tools lack direct incentives for green technology innovation, causing compensation-receiving regions to develop a path-dependence on funds and maintain traditional industries rather than drive industrial upgrading. On the other hand, downstream economically developed regions, due to their existing industrial structures (e.g., a high proportion of energy-intensive industries), face greater sunk costs and institutional lock-in effects in green transition, making the policy’s inhibitory impact more pronounced.
The suppression of GTFP essentially reflects the “non-environmental bias” in the direction of technological progress [51]. When innovation factors fail to effectively shift toward clean technologies, eco-compensation policies struggle to trigger the “creative destruction” necessary for green economic growth, thereby failing to achieve synergy between environmental regulation and economic development. This finding provides an important theoretical basis for optimizing the design of eco-compensation policies.

4. Discussion

This study provides empirical evidence from the Tingjiang-Hanjiang River Basin that elucidates the complex relationship between watershed eco-compensation mechanisms and sustainable economic growth. In contrast to the prevailing literature that predominantly highlights the ecological benefits of such policies, our findings reveal significant trade-offs between ecological conservation and economic transformation, offering important theoretical implications for environmental policy research.
The results demonstrate that the initial implementation of WEC mechanisms imposes transitional costs, particularly on pollution-intensive industries, providing direct empirical validation for the “painful adjustment” hypothesis in environmental economics. While the policy’s emphasis on ecological restoration has effectively enhanced water quality and ecosystem resilience, our analysis reveals a critical mechanistic insight: the lack of complementary investments in green technology and industrial upgrading has inadvertently constrained short-term green economic growth.
This finding not only corroborates previous work by Li et al. [18], but more importantly, uncovers the inherent limitations of relying solely on compensation mechanisms to achieve environment–economy synergies. From a theoretical perspective, these results advance our understanding of the differential effects of various environmental policy instruments. Methodologically, our quantitative analysis of how compensation policies affect technological innovation and industrial transformation addresses a significant gap in current research regarding policy mechanism analysis, thereby establishing a stronger scientific foundation for developing more precise environmental policy evaluation models.
Our mechanism analysis yields critical insights into why the WEC policy produced mixed outcomes. Most notably, we identify technological stagnation as a key mediator—a finding with profound implications for sustainable development theory. The significant decline in patent applications within compensated areas demonstrates that the current policy design fails to stimulate environmental innovation, contrary to the Porter Hypothesis. This empirical evidence substantiates the environmental technology bias framework [48], confirming that mere ecological investment is insufficient to drive green growth without parallel advancements in clean technology.
The root cause appears to lie in the structural misallocation of funds: by prioritizing direct ecological protection over R&D, the policy inadvertently creates disincentives for technological upgrading. Comparative evidence from the Wujiang and Yuanjiang River Basins [14] reinforces this interpretation, showing that policies combining compensation with innovation incentives achieve superior outcomes. Our analysis thus advances the field by isolating a crucial design flaw in existing WEC mechanisms—one that explains their limited success in fostering sustainable transitions.

5. Conclusions and Recommendations

The study examines the 2016 eco-compensation policy’s effects on sustainable development in the Tingjiang-Hanjiang River Basin with a particular focus on regional outcomes. Utilizing county-level SBM-GML measurements of green total factor productivity (2009–2022) and a DID approach, we discovered that the WEC policy in the Tingjiang-Hanjiang River Basin resulted in a short-term inhibitory effect of 3.94% on green economic development in the compensation area, equating to an average annual decrease of approximately CNY 473 million in green economic output per county. This outcome reflects the phased costs of policy transformation, mainly resulting from the painful period of adjustment in highly polluting industries. However, in the long term, (1) ecological improvement may lay the foundation for green growth; (2) environmental innovation bias emerged as the primary constraint, as the policy inadequately redirected technological progress toward cleaner production; (3) spatial heterogeneity occurred, with upstream (less-developed) areas showing weaker negative impacts than downstream regions, attributable to industrial structure and regulatory adaptability differences.
Building on these findings, we propose the following implementation strategies: (1) enhancing WEC fiscal efficiency through rigorous monitoring mechanisms to ensure targeted capital allocation, thereby directing greater resources toward eco-friendly industries, technological innovation, and sustainability initiatives. (2) Moreover, the green economic development of the basin compensated area depends on technological advancement and sectoral composition upgrading. Ensuring the third round of WEC policy effectively adjusts the green industrial structure and advances green technological innovation requires efficient resource and fund utilization and oversight. During the initial implementation phases of compensation policies, insufficient support for eco-innovation hampered traditional industry transformation while constraining the expansion of green sectors, ultimately diminishing the anticipated dual economic-environmental benefits. The third phase of policy design should emphasize enhancing innovation capabilities in science and technology, focus on developing green tertiary industries, and refine cross-regional coordination and policy incentives to ensure synchronized upstream and downstream growth, thereby sustaining green economic progress. In the third round of compensation, the promotion of the tertiary industry should be taken as the goal to promote the industrial structure to develop in a more green, innovative, and optimized direction. The ECP aims to enhance collaborative governance between upstream and downstream regions, acknowledging the integrated and cross-regional nature of basin ecological issues. The upstream ‘s ecological quality significantly impacts downstream resource use and economic growth. The WEC policy incentivizes upstream areas by emphasizing that environmental protection benefits both their interests and the basin’s sustainability. In its third phase, the policy focuses on aligning ecological and economic interests across the basin to ensure effective collaborative governance.
This study systematically investigates the river WEC policy’s impact on green economic development in compensated areas, revealing its internal mechanisms. While contributing to the balance between ecological protection and socioeconomic development, several research limitations warrant further exploration: (1) differential effects of compensation standards and fund allocation models on regional green transition; (2) development of a multidimensional policy evaluation framework with dynamic monitoring to assess long-term effects and spatial heterogeneity; (3) establishment of a more scientific WEC mechanism to better support sustainable watershed management.

Author Contributions

Conceptualization, Y.P.; Methodology, Y.P.; Software, Y.P.; Validation, Y.P.; Formal analysis, Y.P.; Investigation, Y.P.; Resources, Y.P.; Data curation, Y.P.; Writing—original draft, Y.P.; Writing—review & editing, A.Y. and B.Z.; Visualization, Y.P.; Supervision, Y.P.; Project administration, Y.P. and A.Y.; Funding acquisition, A.Y. All authors have read and agreed to the published version of the manuscript.

Funding

This study received funding from the project ‘Research on the Collaborative Security Measurement and Development Path of the Water-Energy-Food Nexus System in the Yangtze River Economic Belt’ (grant number 21BGL67), with the article processing charge covered by Chen Yan.

Institutional Review Board Statement

Not applicable.

Informed Consent Statement

Not applicable.

Data Availability Statement

The original contributions presented in this study are included in the article. Further inquiries can be directed to the corresponding author.

Conflicts of Interest

The authors declare no conflict of interest.

References

  1. Wang, Z.Z.; Mao, X.Q.; Zeng, W.H.; Xie, Y.X.; Ma, B.R. Exploring the influencing paths of natives’ conservation behavior and policy incentives in protected areas: Evidence from China. Sci. Total Environ. 2020, 744, 140728. [Google Scholar] [CrossRef]
  2. D’amato, D.; Korhonen, J. Integrating the green economy, circular economy and bioeconomy in a strategic sustainability framework. Ecol. Econ. 2021, 188, 107143. [Google Scholar] [CrossRef]
  3. Guan, X.J.; Liu, M.; Meng, Y. A comprehensive ecological compensation indicator based on pollution damage–protection bidirectional model for river basin. Ecol. Indic. 2021, 126, 107708. [Google Scholar] [CrossRef]
  4. Wang, H.J.; Dong, Z.F.; Xu, Y.; Ge, C.Z. Eco-compensation for watershed services in China. Water Int. 2016, 41, 271–289. [Google Scholar] [CrossRef]
  5. Xu, H.; Chen, L.X.; Li, Q.F. Research on two-way ecological compensation strategy for transboundary watershed based on differential game. J. Environ. Manag. 2024, 371, 123314. [Google Scholar] [CrossRef] [PubMed]
  6. Hu, H.; Tian, G.L.; Wu, Z.; Xia, Q. Cross-regional ecological compensation under the composite index of water quality and quantity: A case study of the Yellow River Basin. Environ. Res. 2023, 238, 117152. [Google Scholar] [CrossRef]
  7. Jiang, K.; Zhang, J.M.; Zhang, L.L.; Wang, D.; Wang, Y.S. Sustainable cooperation in the watershed ecological compensation public-private partnership project: Lessons from China’s Chishui river basin. Socio-Econ. Plan. Sci. 2023, 90, 101730. [Google Scholar] [CrossRef]
  8. Ding, J.P.; Chen, L.X.; Deng, M.H.; Chen, J.F. A differential game for basin ecological compensation mechanism based on cross-regional government-enterprise cooperation. J. Clean. Prod. 2022, 362, 132335. [Google Scholar] [CrossRef]
  9. Yu, J.; Qin, X.; Cheng, S.L.; Chen, J.D. Horizontal ecological compensation policy and water pollution governance: Evidence from cross-border cooperation in China. Environ. Impact Assess. Rev. 2024, 105, 107367. [Google Scholar] [CrossRef]
  10. Dong, X.; Jiang, K. Does individuals’ expected policy utility drive watershed ecological compensation in China’s Xin’an river basin pilot? Ocean. Coast. Manag. 2025, 269, 107797. [Google Scholar] [CrossRef]
  11. Chen, H.T.; Wang, C.C.; Lv, Z.F.; Zhong, Y.; Ren, Q.R.; Ren, J.X.; Wang, Y.Q.; Liu, X.; Luo, L.C. Long-term water quality dynamics and influencing factors under ecological compensation mechanisms: A case study of China’s first cross-provincial ecological compensation watershed. J. Environ. Manag. 2025, 380, 125142. [Google Scholar] [CrossRef] [PubMed]
  12. Yang, Q.Y.; Zhen, Y.; Chen, Y.M. The impact of trans-provincial watershed eco-compensation policy on carbon emissions: Evidence from China. Econ. Anal. Policy 2024, 82, 784–802. [Google Scholar] [CrossRef]
  13. Chen, C.; Zhou, Z.X.; Li, C.; Liu, W. Ecological compensation and breakthrough innovation: Evidence from heavily polluting firms. J. Environ. Manag. 2025, 392, 126682. [Google Scholar] [CrossRef] [PubMed]
  14. Chen, H.T.; Wang, C.C.; Ren, Q.R.; Liu, X.; Ren, J.X.; Kang, G.L.; Wang, Y.Q. Long-term water quality dynamics and trend assessment reveal the effectiveness of ecological compensation: Insights from China’s first cross-provincial compensation watershed. Ecol. Indic. 2024, 169, 112853. [Google Scholar] [CrossRef]
  15. Yi, Y.X.; Yang, M.; Fu, C.Y.; Li, C. Transboundary pollution control with ecological compensation in a watershed containing multiple regions: A dynamic analysis. Water Resour. Econ. 2024, 46, 100242. [Google Scholar] [CrossRef]
  16. Wang, C.C.; Ling, J.J.; Liu, Y.B.; Liu, B.L.; Nan, D. Can air quality ecological compensation improve environmental welfare performance? Based on the “Win–Win–Win” perspective of economy–ecology–welfare. J. Clean. Prod. 2025, 489, 144604. [Google Scholar] [CrossRef]
  17. Wan, L.; Zheng, Q.Q.; Jie, W.; Wei, Z.Y.; Wang, S.Y. How does the ecological compensation mechanism adjust the industrial structure? Evidence from China. J. Environ. Manag. 2022, 301, 113839. [Google Scholar] [CrossRef]
  18. Li, H.L.; Wen, Z.M.; Wan, Y.M.; Hu, J.X. How does the horizontal watershed ecological compensation mechanism effect regional economy?—A county level empirical study on xin’an River basin, China. Ecol. Indic. 2024, 166, 112506. [Google Scholar] [CrossRef]
  19. Wang, H.H.; Xiong, J.X. Governance on water pollution: Evidence from a new river regulatory system of China. Econ. Model. 2022, 113, 105878. [Google Scholar] [CrossRef]
  20. Wang, J.M.; Wang, L.X. Study on the efficiency of air pollution control and responsibility allocation in the Yangtze River Delta region in China from the perspective of ecological compensation. J. Clean. Prod. 2023, 423, 138700. [Google Scholar] [CrossRef]
  21. Jing, P.R.; Sheng, J.B.; Hu, T.S.; Mahmoud, A.; Huang, Y.F.; Li, X.; Liu, Y.; Wang, Y.; Shu, Z.K. Emergy-based sustainability evaluation model of hydropower megaproject incorporating the social-economic-ecological losses. J. Environ. Manag. 2023, 344, 118402. [Google Scholar] [CrossRef]
  22. Li, Z.H.; Wang, Y.L. Tourism industry development, rural digitalization, and green total factor productivity. Financ. Res. Lett. 2025, 81, 107419. [Google Scholar] [CrossRef]
  23. Shen, Z.Y.; Wu, H.T.; Bai, K.X.; Hao, Y. Integrating economic, environmental and societal performance within the productivity measurement. Technol. Forecast. Soc. Chang. 2022, 176, 121463. [Google Scholar] [CrossRef]
  24. Yun, D.; Jia, Z.Q. An investigation into the connection between green total factor productivity in agriculture and high-quality agricultural progress: Based on the mechanism of regional financial development. Financ. Res. Lett. 2025, 81, 107324. [Google Scholar] [CrossRef]
  25. Li, S.J.; Yin, Y.K.; Jiao, Z.Y.; Zhao, Q.Y. Financial investment and green development: How does financialization affect green total factor productivity? Financ. Res. Lett. 2025, 78, 107258. [Google Scholar] [CrossRef]
  26. Cui, X.; Li, P.R. Digital economy, environmental expenditure, and green total factor productivity. Financ. Res. Lett. 2025, 73, 106624. [Google Scholar] [CrossRef]
  27. Chen, H.F.; Niu, D.X.; Gao, Y.B. Research on the impact of energy transition policies on green total factor productivity of Chinese high-energy-consuming enterprises. Energy 2025, 319, 135066. [Google Scholar] [CrossRef]
  28. Liu, L.; Zhao, S.M. Local government debt, financing constraints and firms’ green total factor productivity. Int. Rev. Financ. Anal. 2025, 97, 103874. [Google Scholar] [CrossRef]
  29. Guan, X.J.; Ruan, T.H.; Meng, Y.; Zhang, H.; Wei, J.L. Ecological compensation mechanism controlled by both river ecological water demand and regional water rights. Sci. Total Environ. 2024, 954, 176137. [Google Scholar] [CrossRef]
  30. Zheng, Q.Q.; Wan, L.; Wang, S.Y.; Wang, C.Y.; Fang, W.P. Does ecological compensation have a spillover effect on industrial structure upgrading? Evidence from China based on a multi-stage dynamic DID approach. J. Environ. Manag. 2021, 294, 112934. [Google Scholar] [CrossRef]
  31. Zhao, F.; Shu, X.; Zhao, X.; Guo, M.W. Determinants and action paths of transboundary water pollution collaborative governance: A case study of the Yangtze River Basin, China. J. Environ. Manag. 2024, 360, 121217. [Google Scholar] [CrossRef] [PubMed]
  32. Liu, W.H.; Xie, T.; Wei, X. County-to-City Upgrading, Administrative Power Expansion, and Industrial Land Prices. Econ. Sci. 2022, 6, 39–55. [Google Scholar]
  33. Jiang, T. Mediation Effects and Moderation Effects in Empirical Causal Inference Research. China Ind. Econ. 2022, 5, 100–120. (In Chinese) [Google Scholar] [CrossRef]
  34. Tone, K. A slacks-based measure of efficiency in data envelopment analysis. Eur. J. Oper. Res. 2001, 3, 498–509. [Google Scholar] [CrossRef]
  35. Tone, K. A slacks-based measure of super-efficiency in data envelopment analysis. Eur. J. Oper. Res. 2002, 143, 32–41. [Google Scholar] [CrossRef]
  36. Oh, D. A global Malmguist-Luenberger productivity index. J. Prod. Anal. 2010, 34, 183–197. [Google Scholar] [CrossRef]
  37. Peng, S.Y.; Yu, Y.J. Green development efficiency measurement and influencing factors analysis in the Yangtze River economic Belt, China. Ecol. Indic. 2024, 162, 112025. [Google Scholar] [CrossRef]
  38. Qian, J.L.; Zhou, Y.X.; Hao, Q.Y. The effect and mechanism of digital economy on green total factor productivity—Empirical evidence from China. J. Environ. Manag. 2024, 372, 123237. [Google Scholar] [CrossRef]
  39. Hunjra, A.I.; Zhao, S.K.; Tan, Y.; Bouri, E.; Liu, X.M. How do green innovations promote regional green total factor productivity? Multidimensional analysis of heterogeneity, spatiality and nonlinearity. J. Clean. Prod. 2024, 467, 142935. [Google Scholar] [CrossRef]
  40. Yuan, C.L.; Shang, M.L.; Han, Z.J.; Wang, J.T. Research on the impact of the national ecological demonstration zone on green total factor productivity: Evidence from China. J. Environ. Manag. 2024, 356, 120421. [Google Scholar] [CrossRef]
  41. Stratoulias, D.; Jang, B.; Nuthammachot, N. Evaluation of urban PM2. 5 concentrations over 73 major cities and their association with satellite Aerosol Optical Depth: A global analysis of ambient air pollution. Atmos. Pollut. Res. 2025, 16, 102556. [Google Scholar] [CrossRef]
  42. Yang, J.H.; Liu, P.X.; Zhong, F.L.; Han, N. Subway opening enables urban green development: Evidence from difference-in-differences and double dual machine learning methods. J. Environ. Manag. 2025, 375, 124177. [Google Scholar] [CrossRef] [PubMed]
  43. Ma, J.Q.; Wang, A.B.; Weng, Z.Y. Do policies make a difference? Assessing the impact of China’s air pollution prevention and control action plan on carbon emissions. J. Environ. Manag. 2024, 370, 122685. [Google Scholar] [CrossRef] [PubMed]
  44. Wei, W.W.; Nan, S.X.; Xie, B.B.; Liu, C.F.; Zhou, J.J.; Liu, C.Y. The spatial-temporal changes of supply-demand of ecosystem services and ecological compensation: A case study of Hexi Corridor, Northwest China. Ecol. Eng. 2023, 187, 106861. [Google Scholar] [CrossRef]
  45. Huang, G.F.; Wu, S.Y.; Chen, L.H. The Belt and Road Initiative, Outward Foreign Direct Investment, and Technological Innovation. Financ. Res. Lett. 2025, 77, 106997. [Google Scholar] [CrossRef]
  46. Jacobson, L.S.; LaLonde, R.J.; Sullivan, D.G. Earnings losses of displaced workers. Am. Econ. Rev. 1993, 83, 685–709. Available online: https://www.jstor.org/stable/2117574 (accessed on 16 August 2025).
  47. Ye, M.J.; Liao, L.Y.; Fu, T.Q.; Lan, S.R. Do establishment of protected areas and implementation of regional policies both promote the forest NPP? Evidence from Wuyi Mountain in China based on PSM-DID. Glob. Ecol. Conserv. 2024, 55, e03210. [Google Scholar] [CrossRef]
  48. Ge, P.F.; Liu, T.; Huang, X.L. The effects and drivers of green financial reform in promoting environmentally-biased technological progress. J. Environ. Manag. 2023, 339, 117915. [Google Scholar] [CrossRef]
  49. André, F.J.; Ranocchia, C.; Rubio, S.J. Porter Hypothesis vs. Pollution Haven Hypothesis: Can an environmental policy generate a win-win solution? Energy Econ. 2025, 146, 108477. [Google Scholar] [CrossRef]
  50. Zhang, Y.J.; Song, Y.; Zou, H. Non-linear effects of heterogeneous environmental regulations on industrial relocation: Do compliance costs work? J. Environ. Manag. 2022, 323, 116188. [Google Scholar] [CrossRef]
  51. Acemoglu, D.; Aghion, P.; Bursztyn, L. The environment and directed technical change. Am. Econ. Rev. 2012, 102, 131–166. [Google Scholar] [CrossRef]
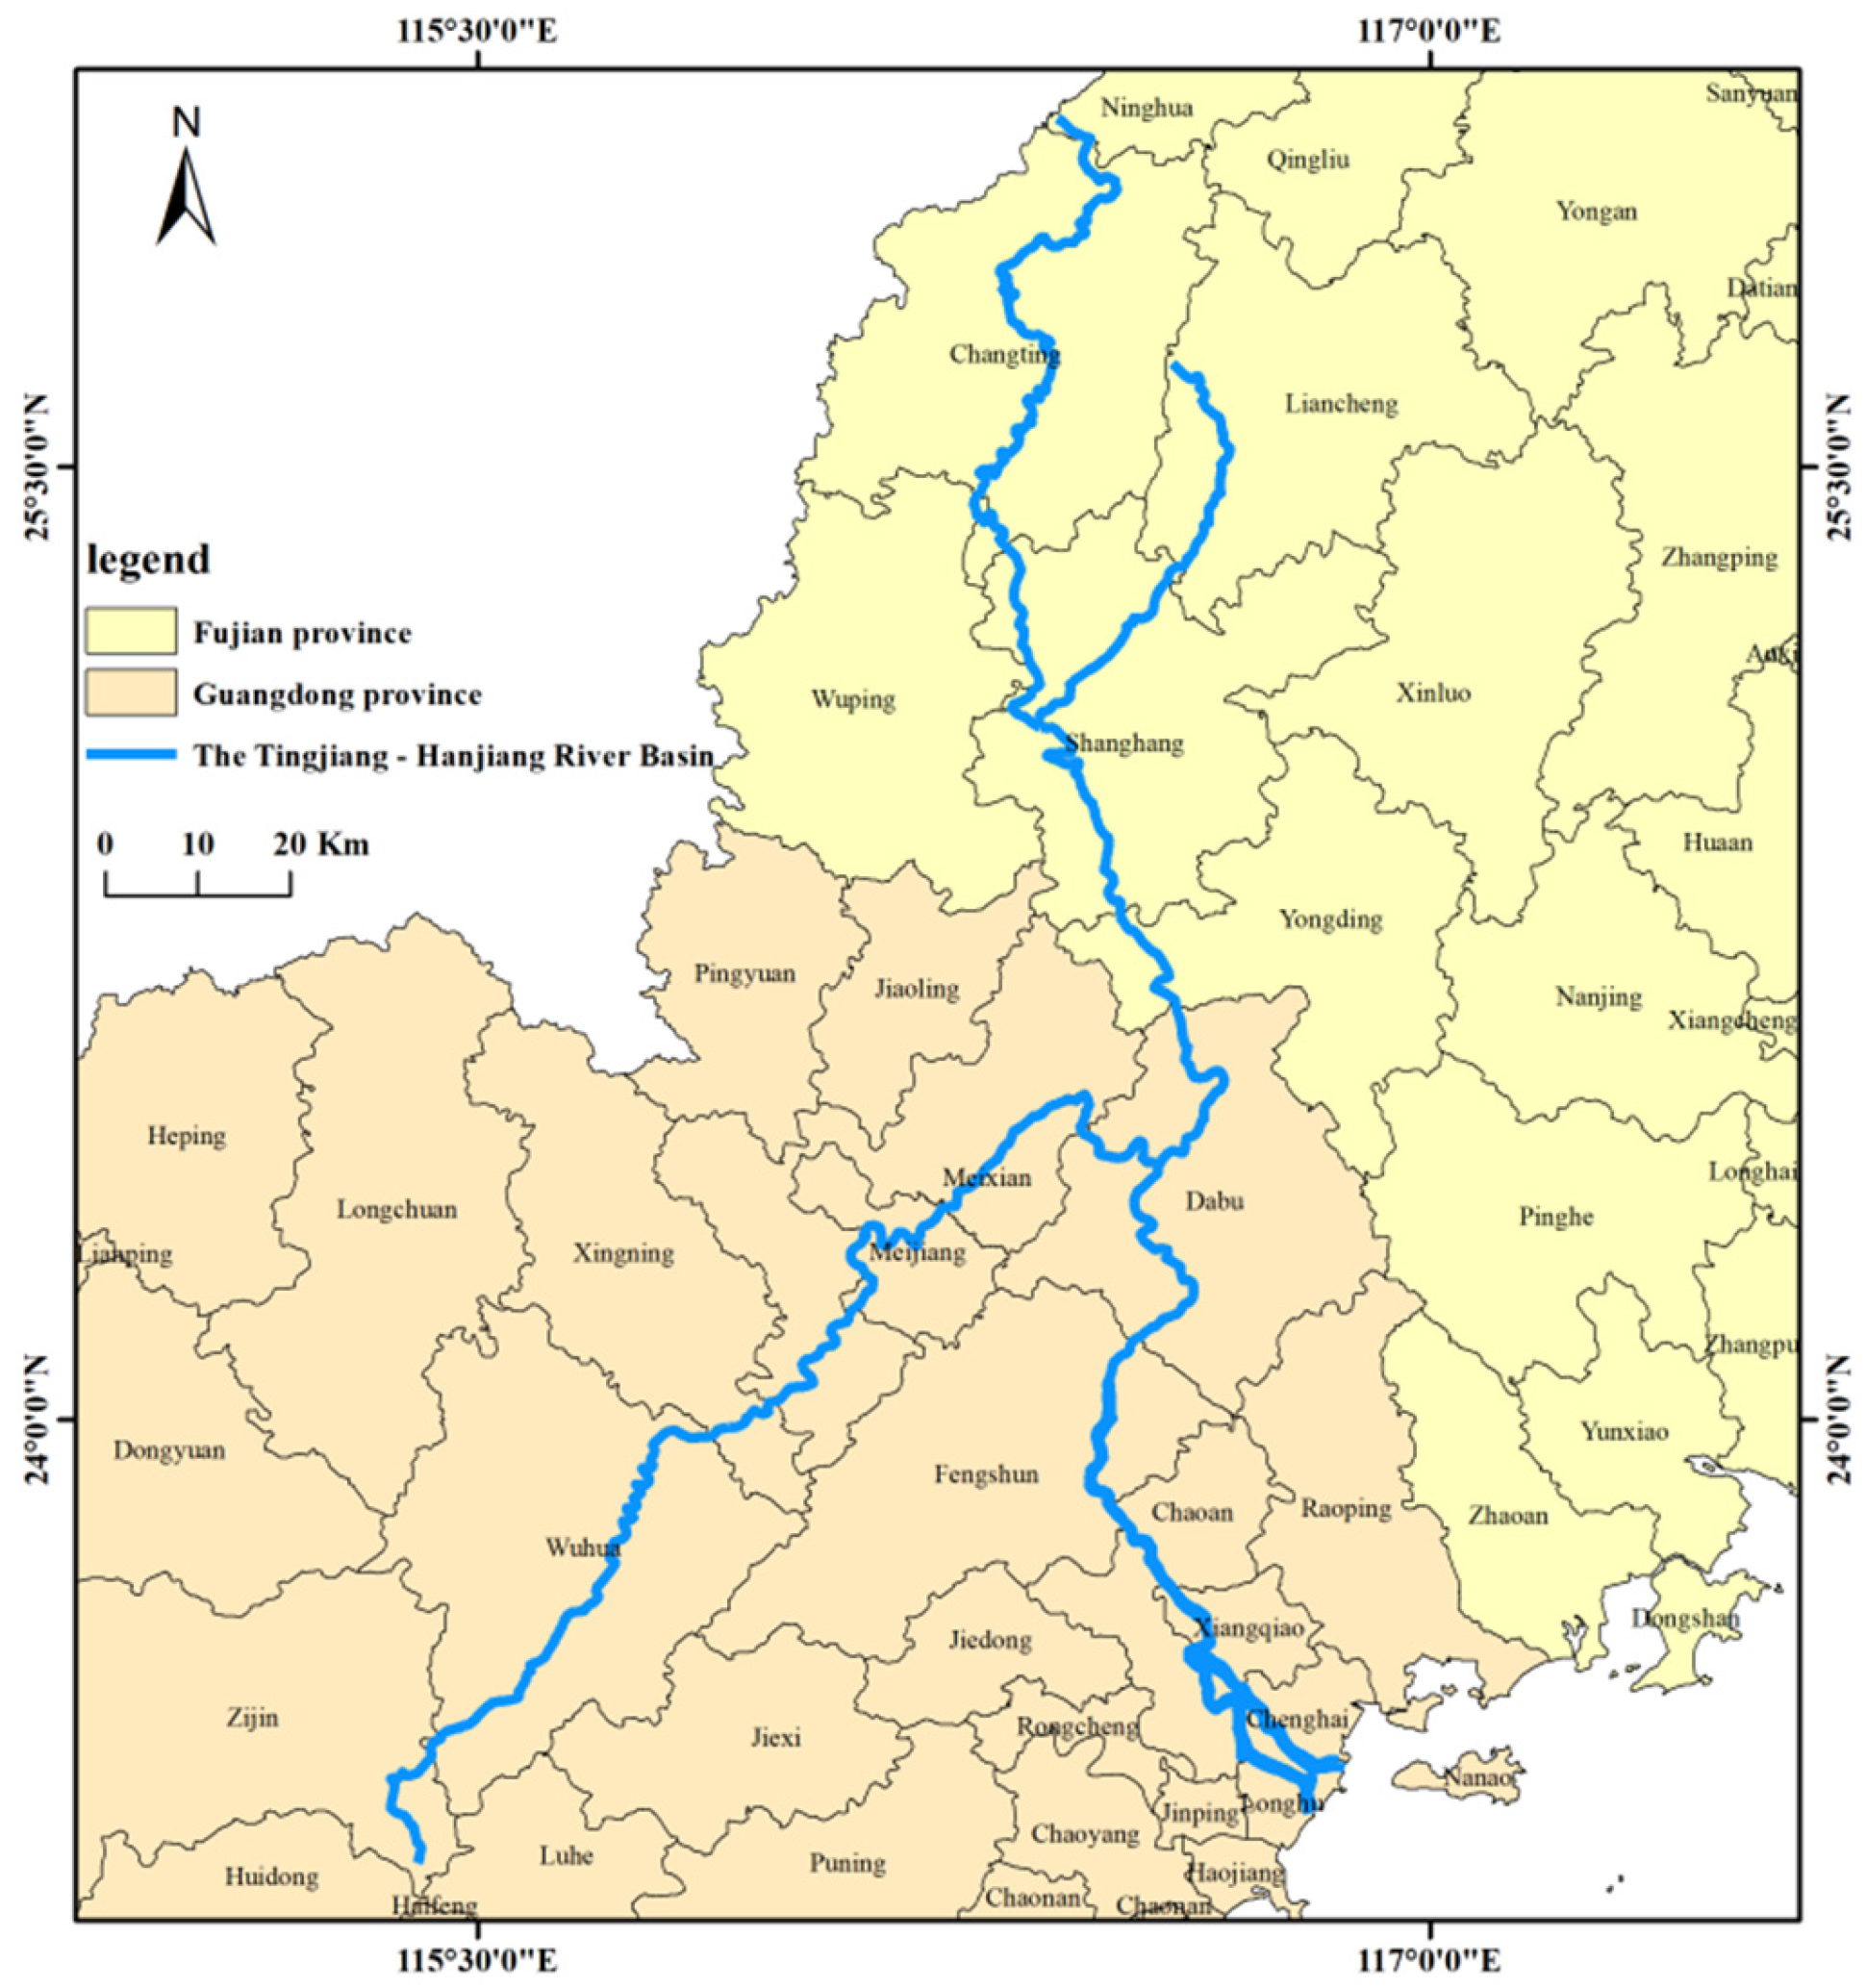
Figure 1. Regional Map of the Tingjiang-Hanjiang.
Sustainability 17 07538 g001
Figure 2. Parallel trends result.
Sustainability 17 07538 g002
Figure 3. Placebo test results.
Sustainability 17 07538 g003
Figure 4. Heterogeneity analysis. Note: The solid dots indicate the marginal coefficients, while the short vertical lines denote the 95% confidence intervals. The dashed line represents the WEC policy’s coefficient value in the benchmark regression, which is −0.044.
Sustainability 17 07538 g004
Table 1. Descriptive Statistics.
VariableObsMeanStMinMax
G T F P 19041.0490.1480.3192.321
P o p 19040.0470.0610.0060.487
S t r u 19041.0670.6940.2026.544
G o v 19040.6710.4520.0525.483
E d u 19040.1290.0470.0341.100
M e d i c a l 19040.0030.0020.0010.018
T i 1904555.3892098.1900.00030,470.000
Table 2. Benchmark regression results.
Variable(1)(2)(3)(4)
G T F P G T F P G T F P G T F P
E C P −0.0394 **−0.0397 **−0.0394 **−0.0359 *
(0.0190)(0.0190)(0.0186)(0.0189)
C o n t r o l NoYesNoYes
c i t y NoNoYesYes
y e a r NoNoYesYes
_ C o n s 1.020 ***0.785 ***1.031 ***0.919 ***
(0.00446)(0.0782)(0.0357)(0.263)
N 1904190419041904
R20.0450.0530.1510.153
Robust standard errors in parentheses *** p < 0.01, ** p < 0.05, * p < 0.1.
Table 3. PSM-DID Regression Results.
VariableProximity MatchingRadius MatchingKernel Matching
(1)(2)(3)
G T F P G T F P G T F P
E C P −0.0364 *−0.0331 *−0.0289 **
(0.0212)(0.0196)(0.0123)
C o n t r o l YesYesYes
c i t y YesYesYes
y e a r YesYesYes
_ C o n s 1.047 ***1.371 ***1.019 ***
(0.141)(0.202)(0.00610)
N 172316321553
R20.1390.1590.027
Robust standard errors in parentheses *** p < 0.01, ** p < 0.05, * p < 0.1.
Table 4. Counterfactual test results.
Variable(1)(2)(3)(4)
G T F P G T F P G T F P G T F P
E C P −0.0212−0.0217−0.0212−0.0173
(0.0192)(0.0192)(0.0189)(0.0190)
C o n t r o l NoYesNoYes
c i t y NoNoYesYes
y e a r NoNoYesYes
_ C o n s 1.018 ***0.776 ***1.032 ***0.926 ***
(0.00483)(0.0784)(0.0357)(0.263)
N 1904190419041904
R20.0390.0480.1490.152
Robust standard errors in parentheses *** p < 0.01.
Table 5. Mechanism test.
Variable(1)(2)
G T F P T i
E C P −0.0359 *−305.4 ***
(0.0189)(88.22)
C o n t r o l YesYes
c i t y YesYes
y e a r YesYes
_ C o n s 0.919 ***6.691 ***
(0.263)(1.229)
N 19041904
R20.1530.776
Robust standard errors in parentheses *** p < 0.01, * p < 0.1.
Disclaimer/Publisher’s Note: The statements, opinions and data contained in all publications are solely those of the individual author(s) and contributor(s) and not of MDPI and/or the editor(s). MDPI and/or the editor(s) disclaim responsibility for any injury to people or property resulting from any ideas, methods, instructions or products referred to in the content.