Article

Evaluating ERA5-LAND and IMERG-NASA Products for Drought Analysis: Implications for Sustainable Water Resource Management

by
Ahmad Abu Arra
1,2,*,
Mehmet Emin Birpınar
1 and
Eyüp Şişman
1,*
1
Department of Civil Engineering, Yildiz Technical University, 34220 Istanbul, Türkiye
2
Department of Civil and Architectural Engineering, An-Najah National University, Nablus 44830, Palestine
*
Authors to whom correspondence should be addressed.
Sustainability 2025, 17(16), 7529; https://doi.org/10.3390/su17167529
Submission received: 6 July 2025 / Revised: 13 August 2025 / Accepted: 18 August 2025 / Published: 20 August 2025

Abstract

Given the growing adverse effects of drought on water resources, agriculture, and various sectors, assessing and evaluating drought and producing high-quality drought maps despite the data scarcity to better understand its impacts and develop effective mitigation strategies is essential. Considering the existing gaps related to drought evaluation, especially in scarce data regions, this research aims to evaluate the efficiency of acceptable time period for drought studies (10–20 years), evaluate the performance of ERA5-LAND and IMERG-NASA precipitation data in estimating the Standardized Precipitation Index (SPI) using different statistical metrics and the innovative drought classification matrix (IDCM), and finally produce and compare high-quality and accurate drought characteristics maps resulted from in situ stations, ERA5-LAND, and IMERG-NASA. The Kocaeli province in Türkiye, which has limited data and is a scarce data region, has been selected as an application. The results ensure that an acceptable time period can be sufficient and provide reliable accuracy for assessing drought with RMSE ranging between 0.09 and 0.23 standard deviation and IDCM ranging between 85% and 97%. NASA IMERG data gave more accurate drought results than ERA5-LAND, and the Pearson correlation ranges between 0.57 and 0.89. Also, in situ data showed longer drought duration, while ERA5-LAND and NASA had higher intensity. This article enables policymakers and decision-makers to manage and plan water resources within the city boundary, ensuring sustainable agricultural, economic, and industrial activities and supporting effective climate change adaptation strategies.

1. Introduction

Drought is a severe, prolonged, and destructive natural phenomenon defined by reduced rainfall, leading to decreased water availability below standard levels [1,2]. Drought has broad and inverse effects due to insufficient rainfall affecting all life aspects, including human life [3], economics [4], agricultural products [5], and the environment [6]. According to the latest report from the United Nations World Water Development [7], about four billion persons across the globe encounter water scarcity for at least one month annually. Based on the World Economic Forum [8], drought and other natural disasters linked to climate change caused up to USD 1.5 trillion in economic losses in the ten years leading up to 2019. Precise and timely drought evaluation and assessment can offer an essential and vital scientific foundation for preventing drought effects [9,10]. Considering different types of drought, which are meteorological, agricultural, hydrological, and socioeconomic droughts, different drought indices have been developed to evaluate drought at different time scales [11]. A meteorological drought is a prolonged period of below-normal precipitation and is often the first sign of a drought. Agricultural drought occurs when soil moisture becomes insufficient to support crop growth, directly impacting agricultural production. Hydrological drought happens when water levels in rivers, dams, and groundwater fall below normal levels, influencing domestic, industrial, and environmental water supplies. Finally, a socioeconomic drought reflects the impacts of water scarcity on the population and economy [11,12]. Drought index calculation is the first step in the drought evaluation and assessment process [13].
Each drought index depends on one or multiple input variables in its calculation, corresponding to a specific drought type. For example, the Standardized Precipitation Index (SPI) and Standardized Precipitation Evapotranspiration Index (SPEI) are used for evaluating and assessing meteorological drought [14,15], the socioeconomic Drought Index (SEDI) is utilized to analyze socioeconomic drought [16]; and the Streamflow Drought Index (SDI) is used for assessing hydrological drought [17]. SPI is recommended and widely used due to its simple procedures and sole reliance on precipitation data without other data, and it has been used in different studies [18,19,20,21]. Understanding the mechanisms behind hydro-climatic extremes like droughts [22,23] across different regions necessitates a foundational understanding of precipitation changes, a crucial input for accurate drought evaluation [24,25]. Regional and local meteorological agencies commonly measure the precipitation at specific locations on a point scale [26], which is used in calculating the meteorological drought indices [27]. However, in situ observational data, such as precipitation, have various limitations, and it is difficult and challenging to accurately and continuously measure in regions facing limited gauges. Also, the data availability limitations may include irregular data collection, missing data in stations in regions with inadequate maintenance, and a deficiency in coverage in mountainous areas [28]. This issue is increased in developing countries where inadequate sources or expertise obstruct the establishment of well-distributed in situ gauges [29]. As a result, these stations often fail to capture spatial variability across wide areas [30,31]. Various gridded climate datasets have been created using in situ station-based, satellite-based, and model-based reanalysis methods [32]. These long-term gridded climate datasets are utilized for research on hydrometeorological data [33] and agricultural sectors [34,35], especially in regions with limited or no in situ station data. Satellite-based precipitation products (SPPs) are reliable data sources offering global coverage. The Global Precipitation Measurement (GPM) mission commenced in 2014 as a successor to the Tropical Rainfall Measuring Mission (TRMM). The GPM mission utilizes advanced precipitation retrieval algorithms applied to signals from various satellite sensors to provide high-resolution precipitation data [36]. Various precipitation data sources include the Climate Prediction Center Morphing Technique (CMORPH) [37], Climate Hazards Group InfraRed Precipitation with Station data (CHIRPS) [38], ECMWF Reanalysis version 5 (ERA5), and Integrated Multi-satellitE Retrievals for Global Precipitation Measurement (IMERG-NASA). Based on different studies in the literature, IMERG is a powerful tool due to its larger geographical coverage, enhanced spatial resolution, and improved accuracy in estimating rainfall [36,39,40].
Recently, with the advanced numerical climatic models and data simulation techniques, model and simulation-based reanalysis data have been developed and considered a reliable source for obtaining worldwide climate information. The European Centre for Medium-Range Weather Forecasts (ECMWF) released the new version of the fifth generation of European ReAnalysis, including land component (ERA5-LAND) in 2019. This data source offers hourly and monthly datasets of 50 climatic variables [41]. The ERA5-LAND covers a spatial resolution of 9 km and a time range from 1950 to 5 days before the present date, as documented by Muñoz-Sabater et al. [41]. Based on the literature, the recently developed ERA5-LAND products have performed better than the previous version [42]. Still, SPPs show better accuracy and performance than the ERA5 datasets [43]. Most of the studies in the literature evaluated the IMERG-NASA and ERA5-LAND data based on precipitation data [30,44], extreme weather [45,46], and heavy precipitation [47].
Based on the literature, ERA5-LAND and IMERG-NASA are increasingly becoming a common choice for various applications [48]. However, many studies have employed it without thoroughly assessing its performance, particularly in drought evaluation contexts. After thoroughly evaluating the literature, both ERA5-LAND and IMERG-NASA precipitation data were evaluated based on different criteria, such as extreme climates. Recent studies across China [49,50] and the Upper Blue Nile Basin [51] have demonstrated that IMERG achieves higher accuracy in detecting meteorological drought via SPI/SPEI indices, with lower bias and stronger agreement with station data, while ERA5-LAND tends to overestimate precipitation unless properly bias-corrected [52]. At the same time, ERA5-LAND remains valuable for agricultural drought assessment, as demonstrated via soil moisture-derived indices in southern China and the Iberian Peninsula, where these were shown to track drought propagation and vegetation stress with high spatial resolution. However, there is a noticeable gap in the literature in assessing their performance in drought evaluation. This gap is primarily in using these data for drought studies without validation, and the validation in the existing literature review did not consider their performance in drought studies. This evaluation and validation are crucial, especially in regions facing data availability challenges, including a limited number of stations or a shorter period than the WMO recommended [53]. Evaluating the reliability and accuracy of IMERG-NASA, and ERA5-LAND for drought evaluation is essential for informed decision-making and effective water resource management.
It is known that observation station data for drought analysis are either non-existent or very limited in most developing and underdeveloped countries. According to WMO [53], at least 20–30 years of data are needed for drought analyses. After all, the acceptable/minimum time period (ATP) is proposed for meteorological drought as 10 years and for hydrological drought as 20 years by Abu Arra and Şişman [29]. At the same time, there are generally a limited number of observation gauge stations with long and continuous data records in metropolitan municipalities in Türkiye. ATP can be defined as the minimum time period for reliable and accurate drought analyses. For example, the meteorological stations within Kocaeli City, the tenth most popular and important city, do not align with the specified, recommended, and acceptable time periods, excluding only one observation gauge station. Therefore, it will not be possible to make comprehensive temporal and spatial drought assessments by taking the existing observation gauge stations as a reference, and it is understood that the relevant data will be limited for a long time. Therefore, high-resolution satellite and reanalysis data sources with the ATP concept are needed as alternatives for drought investigations to be carried out in many regions where observation data are not available and/or high-quality and accurate data cannot be obtained.
Based on the previous literature review and the existing gaps related to drought analysis and evaluation, especially in regions facing data availability challenges, this research significantly contributes to drought studies and the production of high-resolution drought maps using high-resolution rainfall data from IMERG-NASA and ERA5-LAND. This research aims to: (1) ensure and discuss the efficiency and accuracy of the time period specified by WMO, which is 20–30 years as an ideal time period and 50–60 years as an optimal time period, and verify the validity of the acceptable time period proposed by Abu Arra and Şişman [29]; (2) assess the effectiveness of ERA5-LAND and IMERG-NASA precipitation data in estimating the SPI at different time scales (1, 3, 6, and 12 months) and drought classification. These time scales are short, medium, and long time scales, covering meteorological, agricultural, and hydrological droughts. The evaluation process will be done using statistical performance metrics and the innovative drought classification matrix (IDCM) for Kocaeli City, an example of city-based drought evaluation. IDCM is a new metric used to compare two variables based on the drought classification; (3) produce high-quality resolution and accurate drought characteristics maps for Kocaeli City, including duration and intensity; (4) provide a comprehensive and accurate framework using the period specified by WMO, acceptable time period concept, IDCM concept, IMERG-NASA and ERA5-LAND precipitation data, SPI, and interpolation techniques to effectively manage water resources, mitigate the diverse effects of drought and produce high-quality resolution drought maps for city-based drought evaluation. Accurate drought analysis and evaluation with high-resolution and quality drought maps are important and contribute to water resources management and drought plans, especially for small scales such as cities. These tools support informed decision-making and play a critical role in climate change adaptation by enhancing local resilience to increasing drought frequency and severity.

2. Materials and Methods

2.1. Study Area and Data Collection

Kocaeli, located in the northwestern part of Türkiye, is a province known for its strategic location and industrial significance. Kocaeli’s selection as the study region is strongly justified by its vulnerability to drought and the scarcity of high-resolution observational data for effective drought monitoring. The province faces increasing water stress due to rapid industrialization, agricultural activities, geographical diversity, population growth, and climate change-induced rainfall irregularities, highlighting the urgent need for comprehensive drought analyses. Located between the Marmara Sea to the west and the Gebze Peninsula to the east, Kocaeli encompasses a diverse landscape that includes coastal areas, plains, and hills. The province is renowned for its economic activities, hosting a concentration of industrial zones and manufacturing facilities. Kocaeli’s climate is characterized by a blend of Mediterranean and continental influences, with hot, dry summers and cool, wet winters. The region occasionally faces water resource challenges, with precipitation variations impacting water availability. Against this backdrop, studying drought in Kocaeli becomes imperative, and employing tools like the SPI offers a valuable means to assess and understand the temporal patterns and severity of drought events in this dynamic and vital region.

2.1.1. In-Situ Meteorological Stations

In-situ stations are widely recognized as the most reliable source of precipitation data for validating the reanalysis and satellite precipitation data. Monthly precipitation data of Kocaeli province from 25 meteorological stations with different periods were obtained from the Turkish State Meteorological Service (TSMS, Ankara, Türkiye). Of 25 stations, only one (Kocaeli station) has a long time span from 1961 to 2024. Five stations (red ones in Figure 1) were canceled. Eight stations (grey ones in Figure 1) were newly installed in 2017, resulting in 8 years of data (2017–2024). Three stations (blue triangle in Figure 1) have precipitation data for about 20 years (2005–2024). Eight stations (green ones in Figure 1) have a period of about 10 years (2013–2024). For several reasons, including the small area of the study area and the focus on city-based drought evaluation, there is only one station with a long and continuous precipitation data record spanning from 1961 to 2023. The distribution of these meteorological stations within the Kocaeli Province is shown in Figure 1. As can be noticed in Figure 1, these stations are not well distributed over the study area. The selected stations have no missing precipitation values.

2.1.2. ERA5-LAND

According to Muñoz-Sabater et al. [41], ERA5-LAND is mainly created for land surface applications, and its resolution (9 km) is finer than ERA5 (31 km), providing more accurate and high-resolution results. ERA5-LAND is derived and interpolated from ERA5 using the well-known triangular mesh-based linear technique [30]. The ERA5-LAND total precipitation was downloaded from the Climate Data Store (CDS) at https://cds.climate.copernicus.eu (accessed on 15 January 2025) covers the study area. This research used the monthly precipitation ERA5-LAND data for drought evaluation.

2.1.3. IMERG-NASA

In the literature review, it is seen that 0.1° × 0.1° lat/lon. grid resolution IMERG-NASA data, which have been used in many studies in recent years, are frequently used as an alternative source alongside observation data for hydrological modeling and drought research [54]. IMERG has 3 Runs (versions) based on the latency and accuracy of the precipitation data. These runs are: (1) the near-real-time Early Run, which is released only 4 h after real-time, and its accuracy is the lowest; (2) Late Run, which is released 12 h after real-time, and it has more accurate precipitation compared to the first Run; and (3) the Final Run, which can be accessed after 3.5 months after real-time. The final Run is the most accurate data compared to other Runs [54]. In this research, the Final Run was used.

2.2. Methodologies

2.2.1. Standardized Precipitation Index (SPI)

The SPI was introduced by McKee et al. [14]. SPI is only based on the precipitation data at different time scales and is used to calculate meteorological drought. The selection of time scales is crucial for several purposes and different drought types; longer time scales indicate hydrological drought. SPI’s main methodology and concept, like any standardized drought index, is fitting the original dataset into a suitable probability distribution function (PDF), and then the selected function is probabilistically standardized to get the SPI values. The selection process of a suitable PDF must be carried out using one of the goodness-of-fit tests, such as the Chi-Square and Kolmogorov–Smirnov tests [55]. It is essential to note that this probabilistic standardization differs from statistical standardization, a distinction thoroughly examined by Şen and Şişman [56] in their study on SPI calculation. According to the literature, the most suitable PDF for precipitation data is the Gamma function [57]. Table 1 summarizes the drought classification as proposed by McKee et al. [14].

2.2.2. Time Period Specified by WMO and Acceptable Time Period

According to the WMO [53], the ideal years of monthly precipitation values are at least 20–30 years, and the optimal or preferred time period is more than 50–60 years. However, these periods cannot be covered in some regions worldwide, especially in regions facing data availability issues or where new meteorological stations were installed. To overcome this problem, Abu Arra and Şişman [29] proposed a new concept called the acceptable time period, which is between 10 and 20 years, and they proved in their research that using 10 and 20 years for meteorological and hydrological droughts can give high-quality and reliable drought indices. They used several performance metrics, including R2, CC, RMSE, and other metrics, as well as the IDCM, which incorporates the drought classification in the comparison process. In this research, one (Kocaeli) meteorological station meets the optimal period, three stations (Gebze, Gölcük, and Kocaei Havalimanı) meet the ideal time period, and eight stations, some meteorological stations, meet the ideal time period, and some meet the acceptable time period. Subsequently, both ideal and acceptable time periods will be used in this project after the validation process. The validation process will be carried out using the longest station with the help of performance metrics and the IDCM for the SPI. Table 2 below summarizes the time periods with corresponding years.

2.2.3. Innovative Drought Classification Matrix (IDCM)

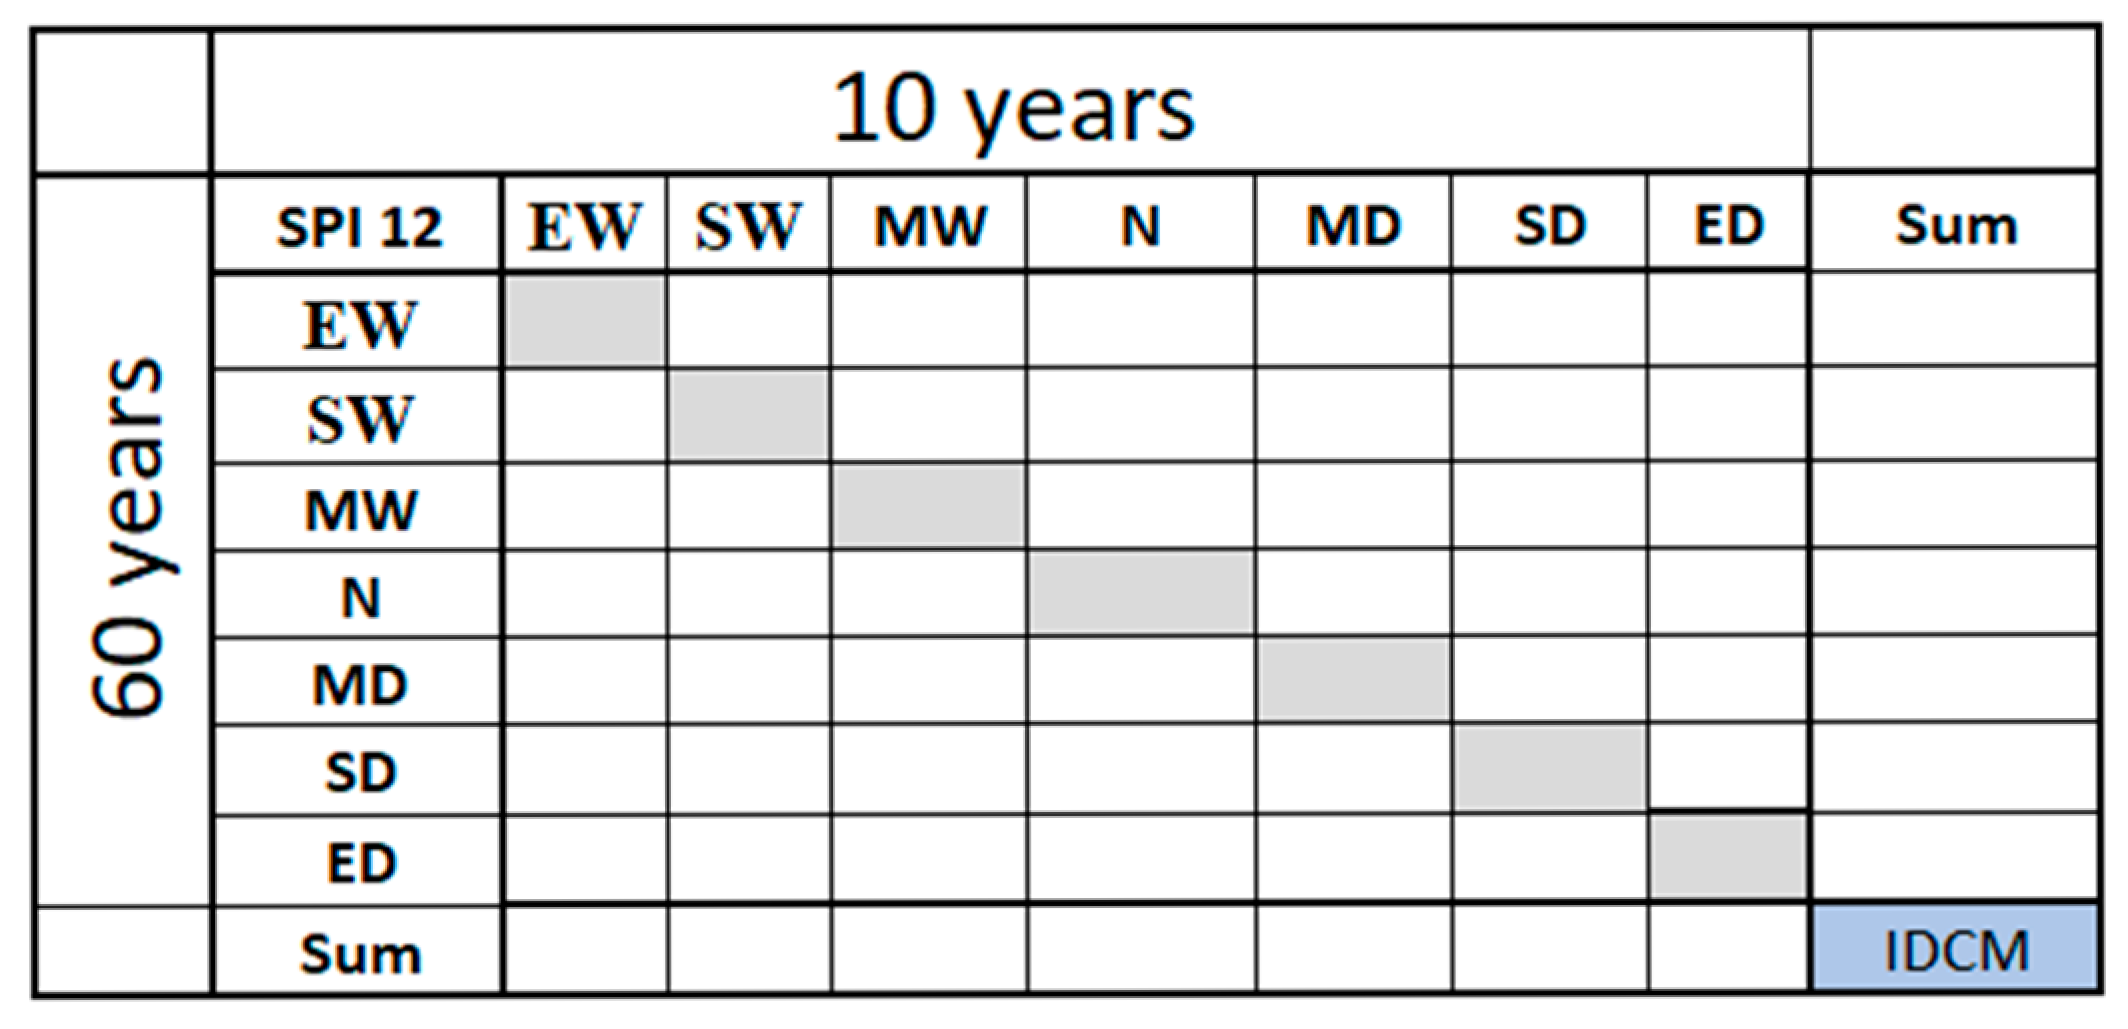
IDCM was introduced by Abu Arra and Şişman [29] as an additional metric and tool for integrating drought classification into comparative analyses. The comparative analysis encompasses various drought indices, geographical areas, and temporal changes. This study employs the IDCM to compare and ensure the validity of the acceptable time period (10–20 years) and the optimal time period. The initial column of the matrix represents the drought classification for the 60-year-based SPI, whereas the initial row denotes the drought classification for the desired time period. Additional information is available in the original article. Figure 2 below presents a comprehensive overview of IDCM.

2.2.4. Comparison Scheme

This research uses different statistical metrics with the IDCM to evaluate ideal and acceptable time periods and compare the results between the in situ-based SPI, NASA-based SPI, and ERA5-LAND-based SPI. The second part measures the accuracy of IMERG-NASA and ERA5-LAND precipitation data in drought index calculation at different timescales. These metrics are the determination of the coefficient (R2), Root Mean Squared Error (RMSE), Mean Absolute Error (MAE), and Pearson’s Correlation Coefficient (CC), Mean Bias Error (MBE), along with IDCM, which is explained in the Section 2.2.3. R2 measures how effectively the model accounts for the variation in the data; values nearer 1 signify a better fit. The degree and direction of the linear relationship between the observed and anticipated values are evaluated by CC. CC assesses the strength and direction of the linear relationship between observed and predicted values. MBE quantifies systematic bias, showing whether a model consistently overestimates or underestimates values. MAE provides an average magnitude of errors without considering their direction, making it useful for understanding overall prediction accuracy. RMSE, which penalizes larger errors more than MAE, is ideal for assessing models where large deviations are critical. These metrics together offer a comprehensive view of model reliability and accuracy, helping in model selection and improvement. These metrics were selected to comprehensively assess all key aspects of model performance in drought studies, including accuracy (R2, CC), bias (MBE), and error magnitude (MAE, RMSE), ensuring a robust evaluation of drought evaluation. These metrics are used to compute the performance between the in-situ-based and model-based results [58]. Table 3 below summarizes the statistical metrics, equations, value ranges, and ideal values [59].

2.2.5. Drought Characteristics

The drought characteristics are an essential component of drought assessment and monitoring. The characteristics of drought are contingent upon the definitions of drought events and may vary according to these criteria. There are two main definitions of a drought event, each with its own concept and thresholds. Subsequently, McKee et al. [14] proposed a specific definition of drought event, including the SPI definition, while Yevjevich [60] proposed the run theory. The distinctions among these concepts were elucidated comprehensively in papers like [61]. According to the definition identified by McKee et al. [14], drought events begin in a certain month when the drought index value falls below −1 and ends in the month when it returns to a positive value. This research used the drought event definition proposed by McKee et al. [14]. The drought characteristics employed in this study can be described as follows [10,14]:
  • Drought duration (D) is the number of months between the starting and ending points.
  • Drought severity (S) is the summation of the SPI values over drought duration.
  • Drought intensity (I) is evaluated by dividing the drought severity by drought duration.

2.2.6. Spatial Interpolation Technique (IDW)

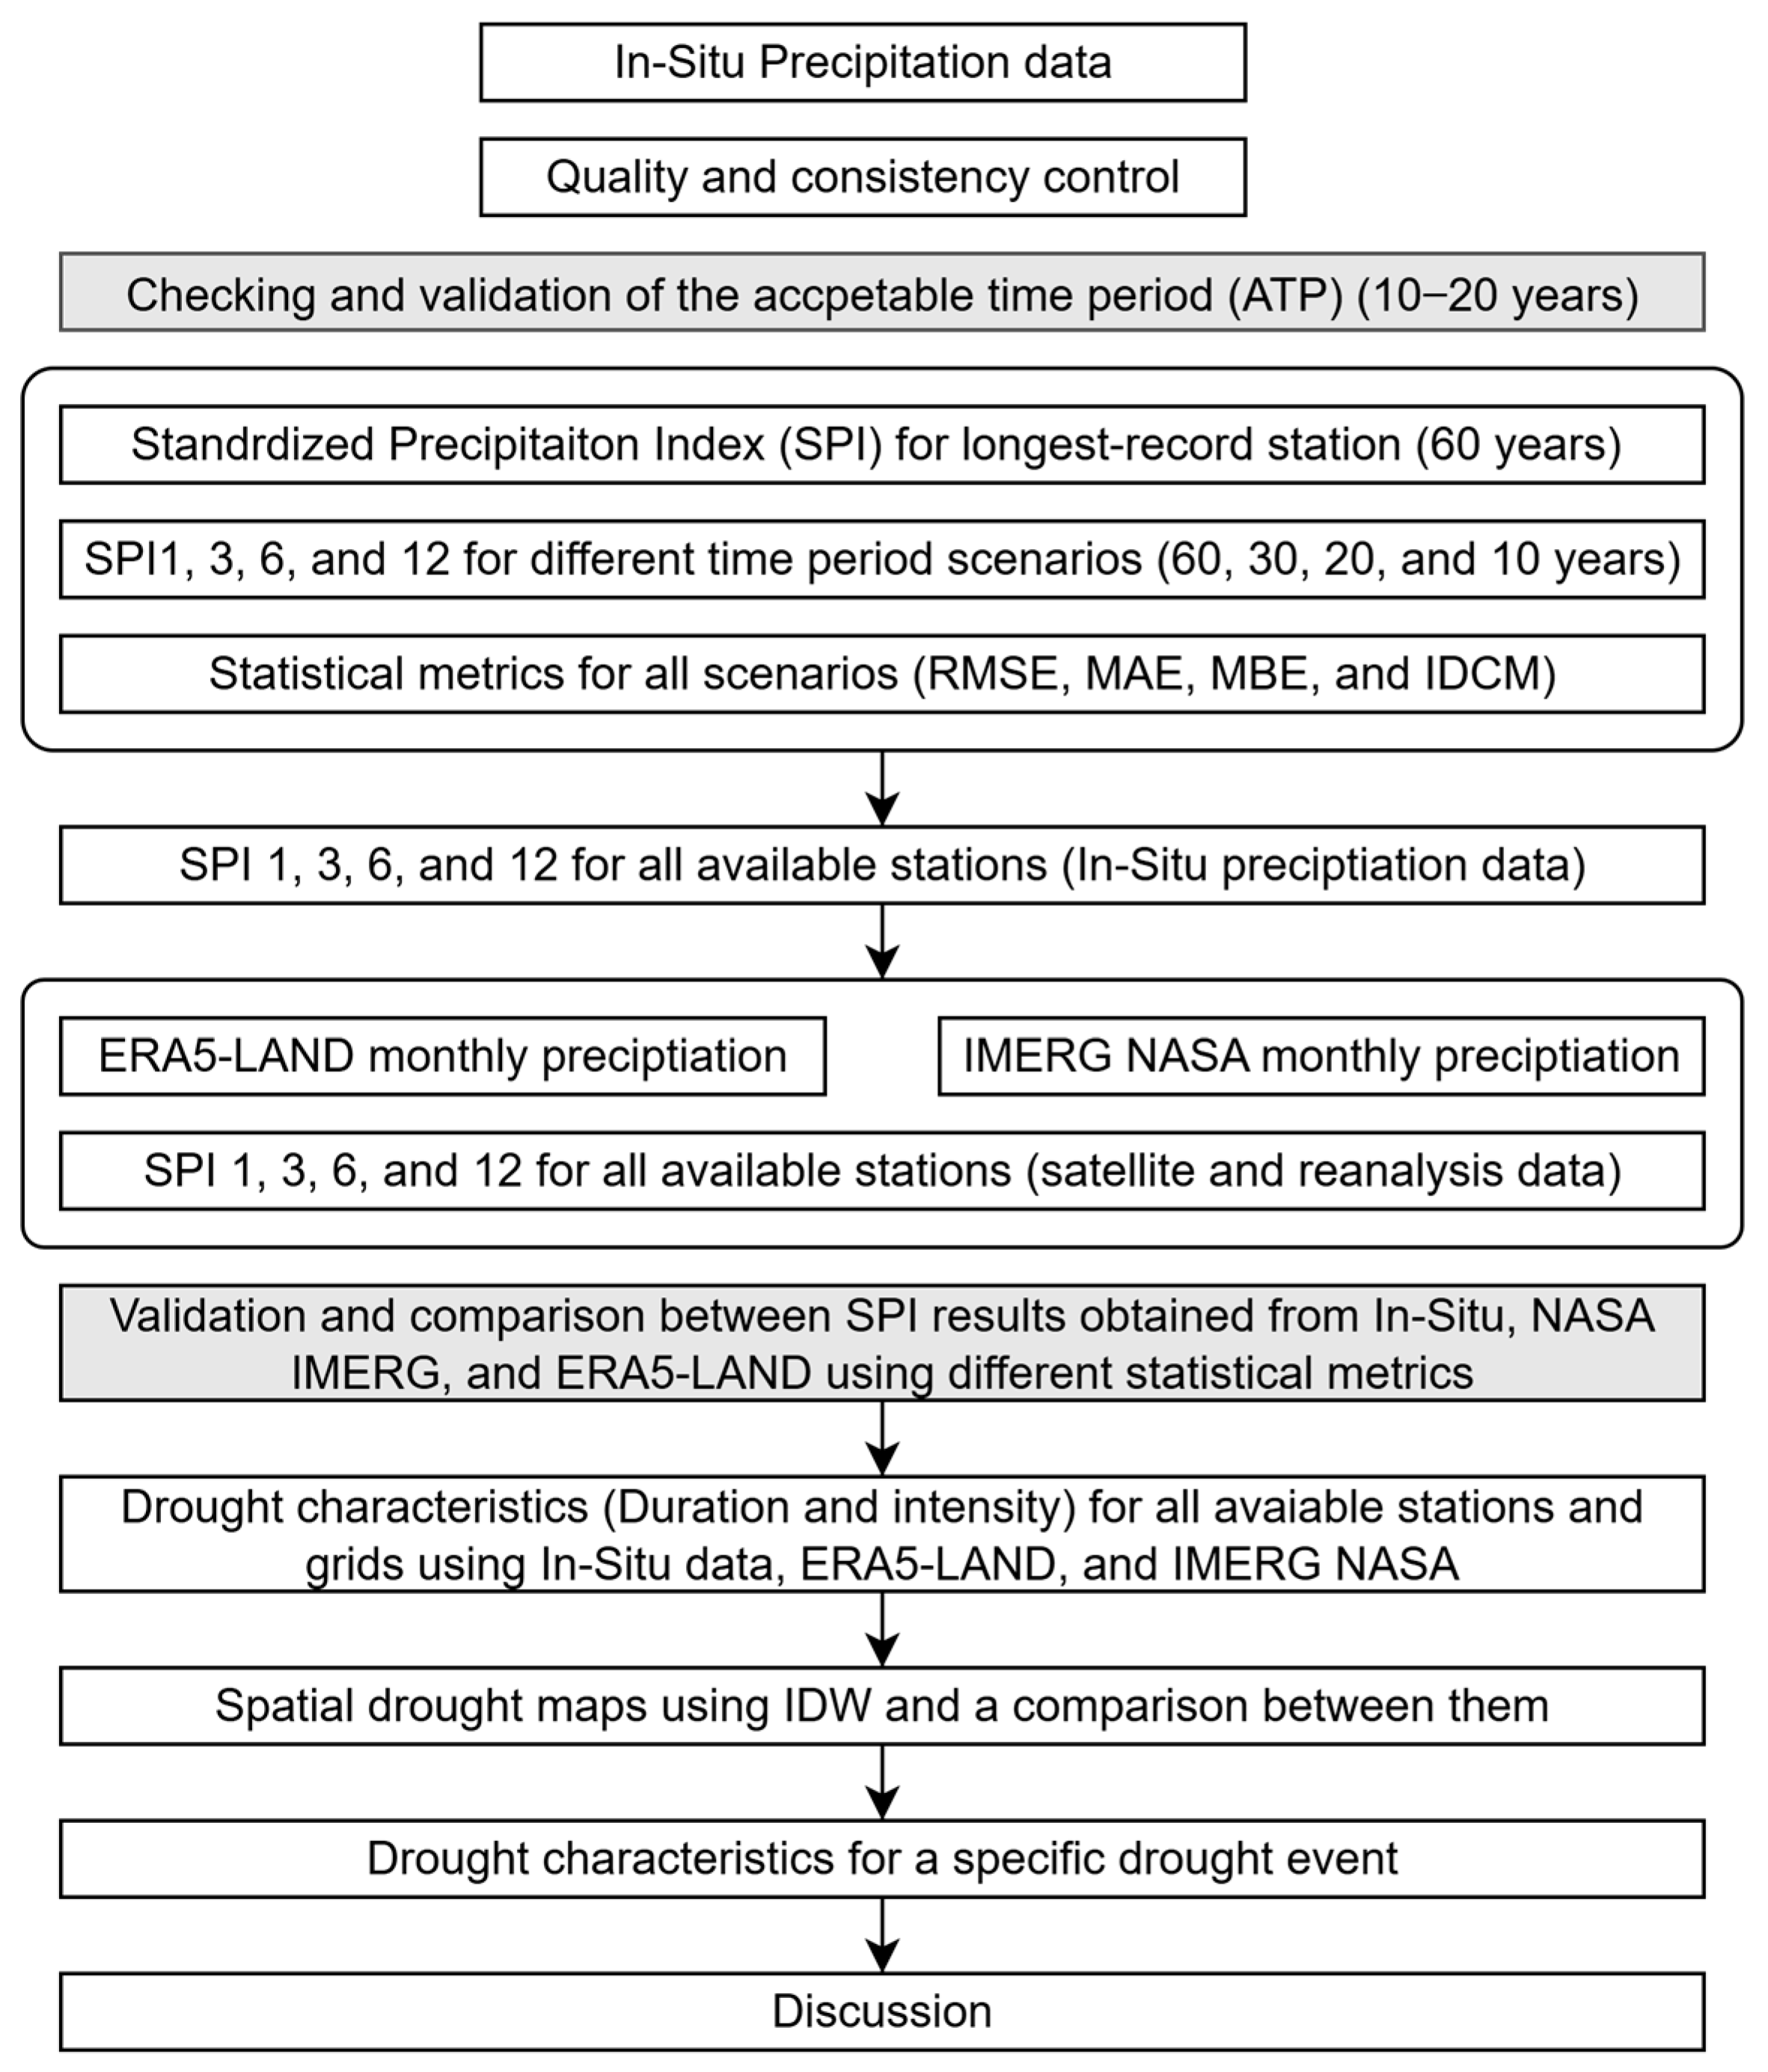
Inverse distance weighting (IDW) is a well-known and widely used interpolation technique used in different aspects, including drought spatial evaluation, giving an estimate of drought index and characteristics at unsampled points using observation station data as inputs. According to Philip and Watson [62], closer points to the desired location have more influence on the estimated value than those farther away. The simplicity of this method makes it popular and widely used in creating drought maps, aiding in the comprehensive analysis and visualization of spatial drought conditions. Abu Arra et al. [63] compared IDW and kriging methods for drought calculation in Istanbul province and showed that the IDW method is better in drought studies. In light of these studies, the IDW method was preferred in this research. Figure 3 shows the methodological flowchart in this research.

3. Results

3.1. Temporal Evaluation Using an Acceptable Time Period and the Time Recommended by WMO

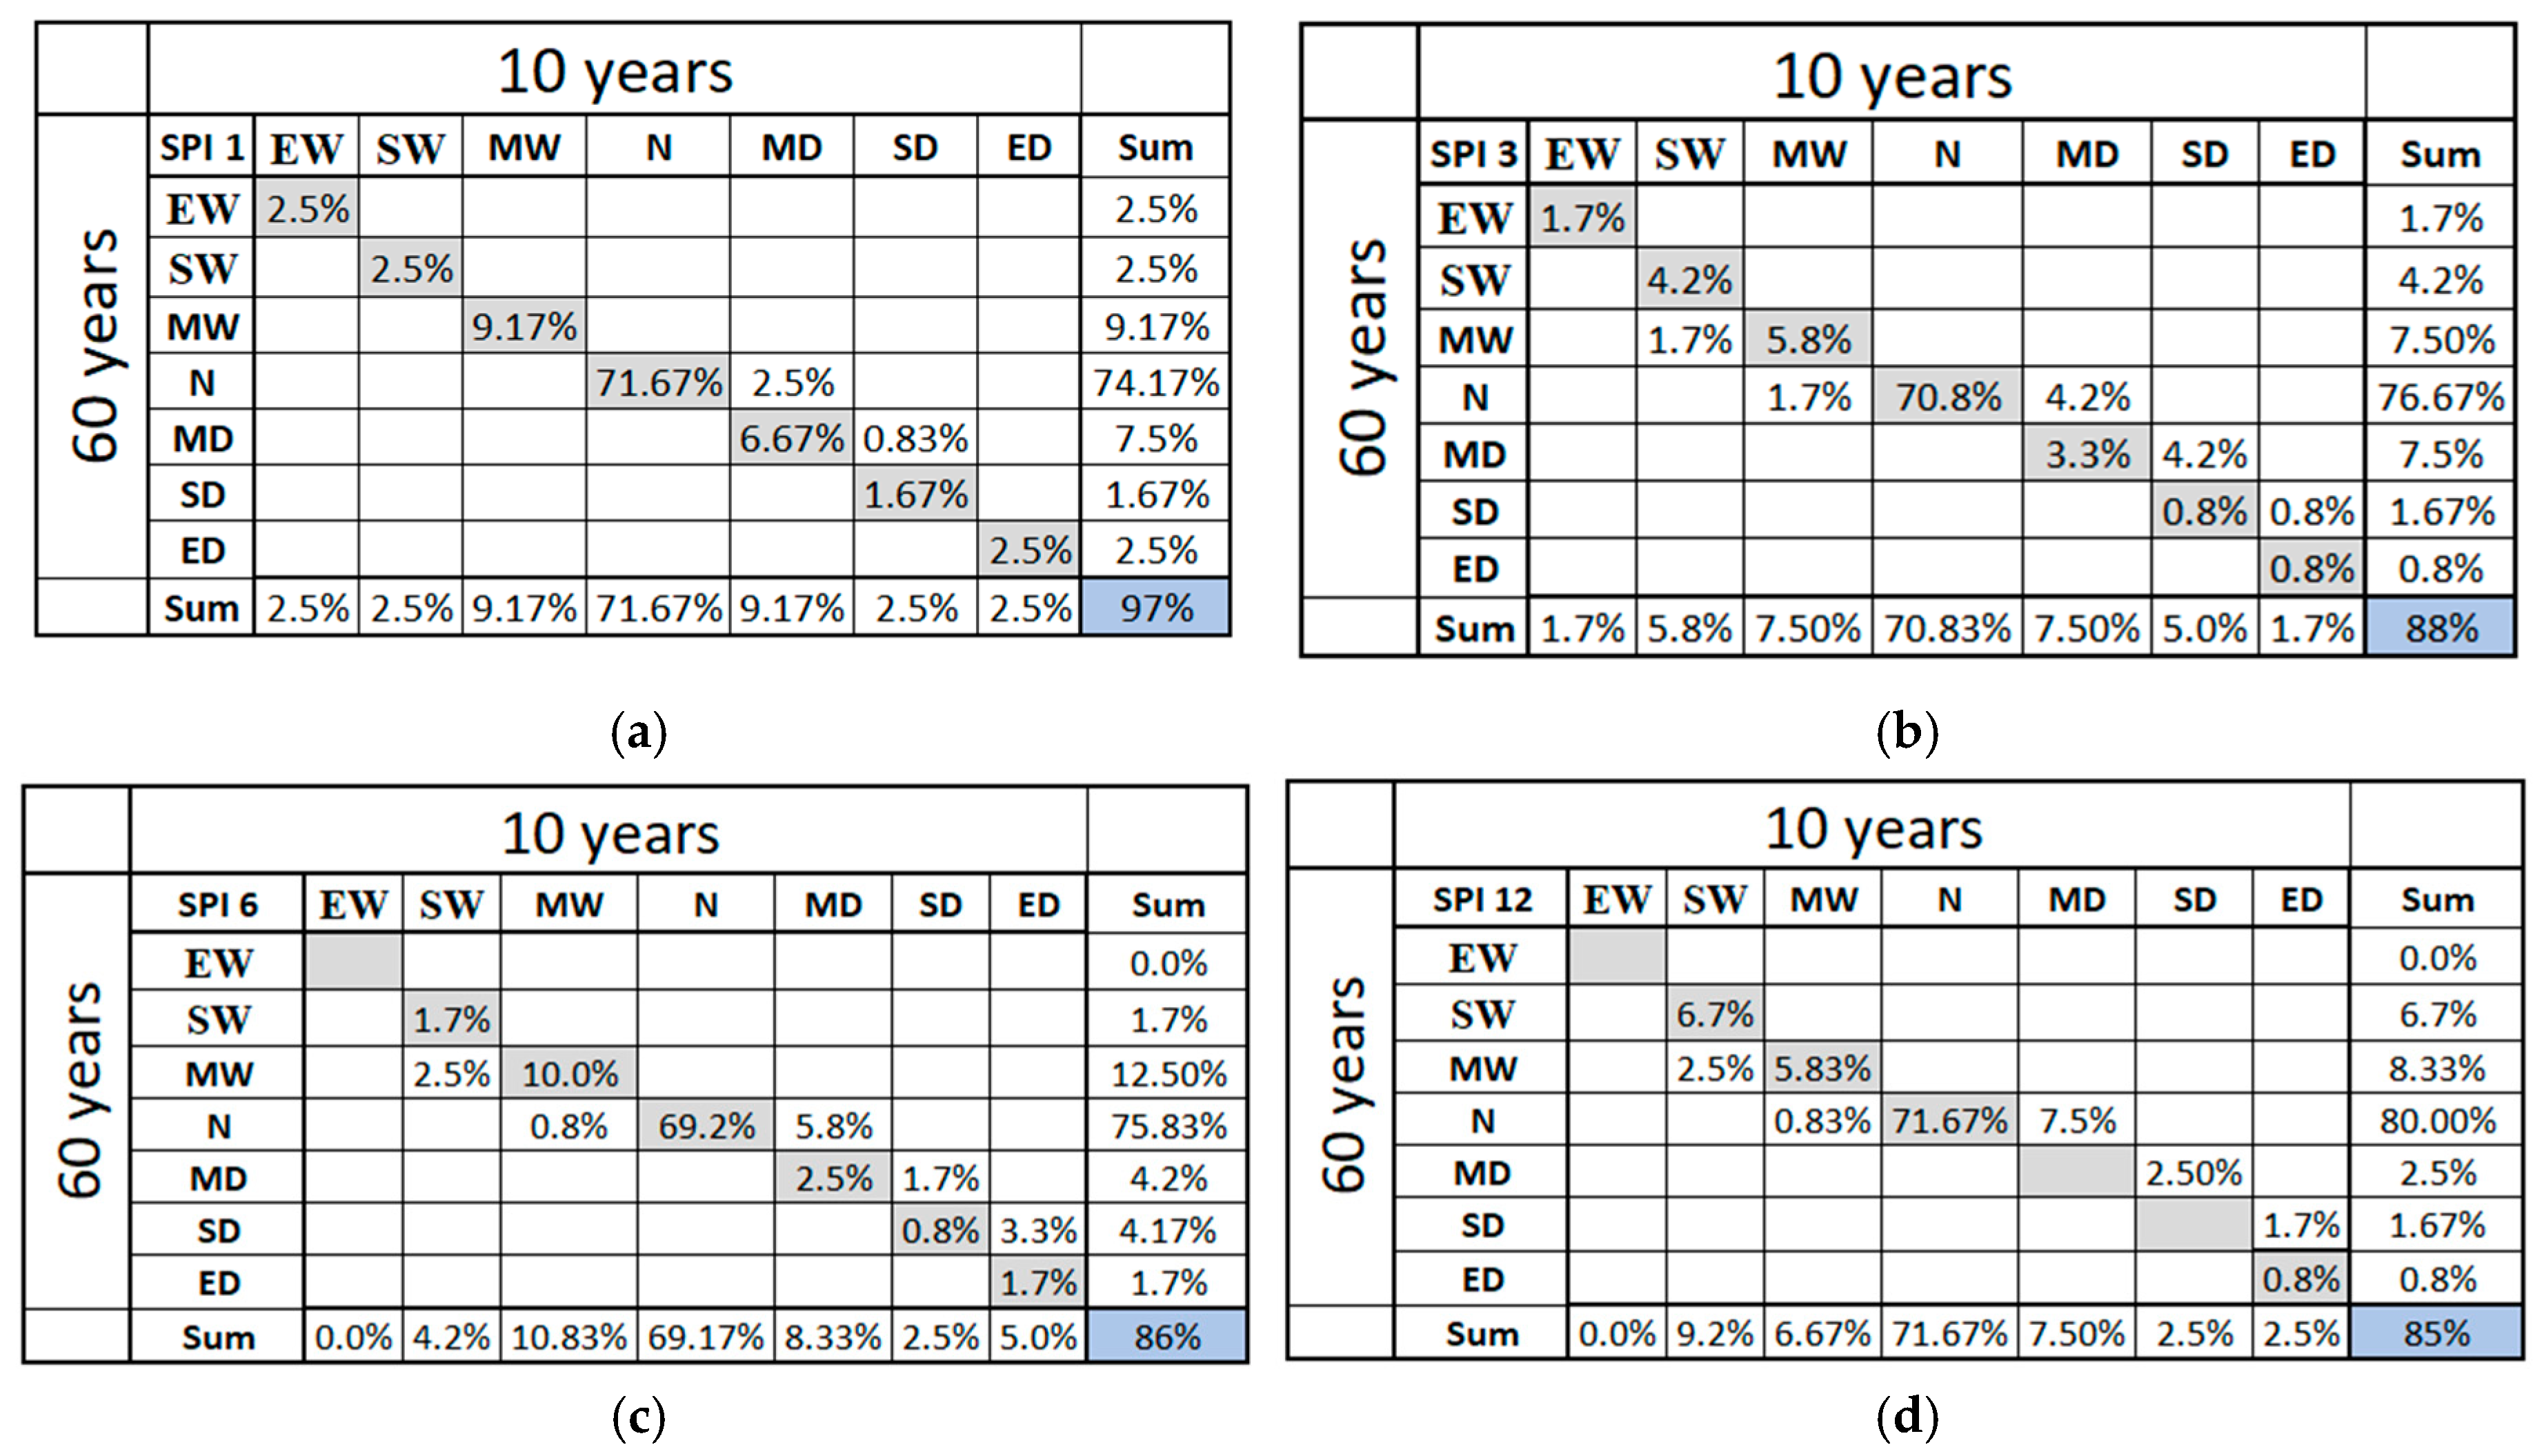
The statistical evaluation results of the SPI calculated using 60-year versus 30-year data reflect the strength of the relationship between the two different time periods. The CC and R2 achieved a very high value (0.99) across all timescales (SPI1, SPI3, SPI6, and SPI12). These values reflect a strong match between the SPI values calculated using 60 years and those calculated using 30 years, indicating the stability of the relationship between the two time periods and that the calculations were not affected by changing the length of the data period. As for the error measures such as RMSE and MAE, the values gradually increased with the increase in the timescale, with the lowest values recorded at SPI1 (0.07 and 0.06, respectively) and increasing at SPI12 (0.21 for both measures) (Table 4). This pattern is expected since SPI at longer timescales tends to contain more time lags, which can lead to greater discrepancy between the calculated values for the two different periods. For the MBE, it was negative in all cases, indicating that values calculated using 30 years tend to be slightly lower than those calculated using 60 years. This difference was small at SPI1 (−0.06) and gradually increased to −0.21 at SPI12, indicating that reducing the data period can lead to a slight underestimation of SPI, especially at longer time periods (Table 4). The IDCM between two time periods reflects the agreement between them in terms of drought classification. At SPI1, this research found a high agreement of 95%, which gradually decreased as the timescale increased to reach 85% at SPI12.
When comparing the SPI values calculated using 60 years with those calculated using 20 years, a similar pattern was observed but with a more pronounced effect since the time period used is smaller (Table 4). The CC and R2 values remained at a very high level (0.99) in all time scales, indicating a very strong relationship between the two time periods, meaning that the time difference did not significantly affect the SPI values. The RMSE and MAE metrics’ values remained close to those recorded in the previous scenario, but with minor changes. For example, the RMSE at SPI1 increased slightly from 0.07 to 0.09, while at SPI3, it remained stable at 0.11. For SPI6, there was a slight improvement in the RMSE (0.08 compared to 0.12 in the previous scenario), while at SPI12, the RMSE value decreased to 0.14 compared to 0.21 in the previous scenario (Table 4). This indicates that the differences resulting from the reduction in the data period are more pronounced at longer periods but remain within an acceptable range. The MBE was negative as in the previous scenario but showed a slight decrease compared to the comparison between 60 and 30 years, especially at SPI12, where the value was −0.14 compared to −0.21 in the previous scenario. For IDCM, the values reflect a slightly larger decrease compared to the previous scenario at SPI3, where it recorded 89% compared to 93%, but remains at high levels at SPI1 and SPI6 (95%), and SPI12, the percentage was 87% compared to 85% in the previous scenario (Table 4).
When comparing the SPI values calculated using 60 years with those calculated using 10 years, the relationship between the two time periods was still strong, as reflected by the CC and R2 values, which were 0.99 across all timescales. For the RMSE, the error values increased as the timescale increased, starting at 0.14 at SPI1 and gradually increasing to 0.23 at SPI12 (Table 4). The MAE measure showed a similar pattern, rising from 0.09 at SPI1 to 0.18 at SPI12, reflecting the increasing divergence between the values calculated using the two time periods. The MBE measure had negative values in all cases, indicating that the values calculated using 10 years were slightly lower than those calculated using 60 years. The difference ranges from −0.08 at SPI1 to −0.15 at SPI12 (Table 4). The IDCM reflected the importance of drought classification using 10 years, agreeing with those calculated using 60 years. SPI1 had a high agreement of 97%, reaching 85% at SPI12 (Figure 4).
Overall, these results show that reducing the period used to calculate the SPI results in small but insignificant differences compared to the values calculated using 60 years, especially at longer periods. This agreed with the original article, proposed an acceptable time period, and proposed using 10–20 years with acceptable reliability and accuracy. At 30 years, the agreement with 60 years is very high, but at 20 and 10 years, some differences started to appear, especially in the RMSE and MBE values, but still providing a strong relationship.

3.2. Comparison SPI Results

Table 5 compares the performances of the SPI derived from the precipitation data of both the NASA IMERG satellite and the ERA5-LAND reanalysis model against the values determined using in situ meteorological station data for Gölcük (17067), Gebze (17639), Kocaeli havalimanı (17068), and Kocaeli (17066) stations (with data equal or longer than 20 years). These criteria measure the extent to which the estimated data are specific to the stations’ unique values, which helps determine the quality of each data’s importance in generalizing across different timescales (SPI1, SPI3, SPI6, SPI12). According to NASA data, the coverage of 20 years for three public releases and 25 years for the fourth station is noted. Table 5 shows that the correlation values (CC) between the SPI values adopted from the station data and the SPI values from IMERG-NASA range between 0.35 and 0.89, while the ERA5-LAND values range between 0.22 and 0.89. For example, at Kocaeli station (17066), the CC is 0.86 for SPI1 for both IMERG and ERA5-LAND, indicating that the data from both sources are well-matched to the underlying SPI data for this purpose. However, at SPI3, a deterioration in the performance of ERA5-LAND is observed, especially at Gölcük station (17067), where the correlation drops to 0.22, indicating a poor agreement with the station data at this timescale. At the same time, IMERG disappears at the height level (0.82). For SPI6 and SPI12, the values differ significantly in the fine range, with ERA5-LAND performing better at some stations than at shorter timescales.
The R2 measures how well the estimated data can explain the variance in the station data, with values closer to 1 indicating higher accuracy. In this study, the R2 for IMERG data ranges from 0.12 to 0.79, while ERA5-LAND ranges from 0.05 to 0.79. The IMERG data generally show better agreement, especially at short timescales such as SPI1 and SPI3, where values reach 0.70 and 0.76 at some stations (Kocaeli havalimanı (17068), and Kocaeli (17066)) (Table 5). However, some low values, such as 0.12 for Gebze station (17639) at SPI12, indicate poor representation of long-term drought variability. On the other hand, ERA5-LAND shows very poor performance at SPI3 at Gölcük station (17067), where the R2 is only 0.05, meaning that the data only explains 5% of the variance in the true values, indicating poor accuracy.
RMSE shows the extent of the absolute differences between the calculated and estimated values between stations and IMERG-NASA or ERA5-LAND grid points, with smaller values reflecting better performance. In Table 5, the RMSE for IMERG-NASA ranges between 0.52 and 1.89, while for ERA5-LAND, it ranges between 0.47 and 1.93 (Table 5). The RMSE values are generally lower for short timescales, such as SPI1, ranging between 0.52 and 0.91 for IMERG-NASA, indicating good estimation accuracy.
In contrast, at SPI3, the RMSE values increase, reaching 1.89 and 1.86 at some stations, which means that the error in the drought estimation becomes larger as the time scale increases (Table 5). At SPI6 and SPI12, the values are relatively lower, where the performance is more stable. For example, the RMSE for Kocaeli station (17066) at SPI12 is 0.53 for both IMERG-NASA and ERA5-LAND, reflecting good estimation accuracy. These results indicate that the performance of IMERG-NASA and ERA5-LAND data varies depending on the length of the SPI time scale and period, as well as the conditions of each station. In general, IMERG-NASA shows a higher agreement with the station data, especially at short timescales, while the performance of ERA5-LAND is more variable, improving at long timescales but showing clear weakness at some stations at SPI3.
MBE and MAE values for IMERG-NASA and ERA5-LAND datasets indicated a general underestimation of SPI values across different timescales. MBE values ranged from −0.18 to −0.01 for IMERG-NASA and −0.20 to −0.07 for ERA5-LAND, with the largest biases observed at SPI12 (−0.18 for IMERG-NASA and −0.20 for ERA5-LAND at Gebze station (17639)) (Table 5). The negative bias suggests a systematic underestimation in both datasets, with ERA5-LAND showing slightly larger biases in some cases. The MAE values, ranging from 0.38 to 1.04 for IMERG-NASA and 0.39 to 1.21 for ERA5-LAND, indicated larger overall deviations, particularly for shorter SPI timescales. The highest errors were recorded at SPI6 and SPI12, where MAE reached 1.04 in IMERG-NASA and 1.21 in ERA5-LAND, highlighting greater discrepancies in these datasets. ERA5-LAND generally exhibited higher MAE values than IMERG-NASA, suggesting larger deviations from observed SPI values. However, lower MAE values at SPI12 (0.38 for IMERG-NASA and 0.39 for ERA5-LAND) indicate improved performance at longer timescales.

3.3. Drought Characteristics Results and Drought Maps

3.3.1. Drought Duration

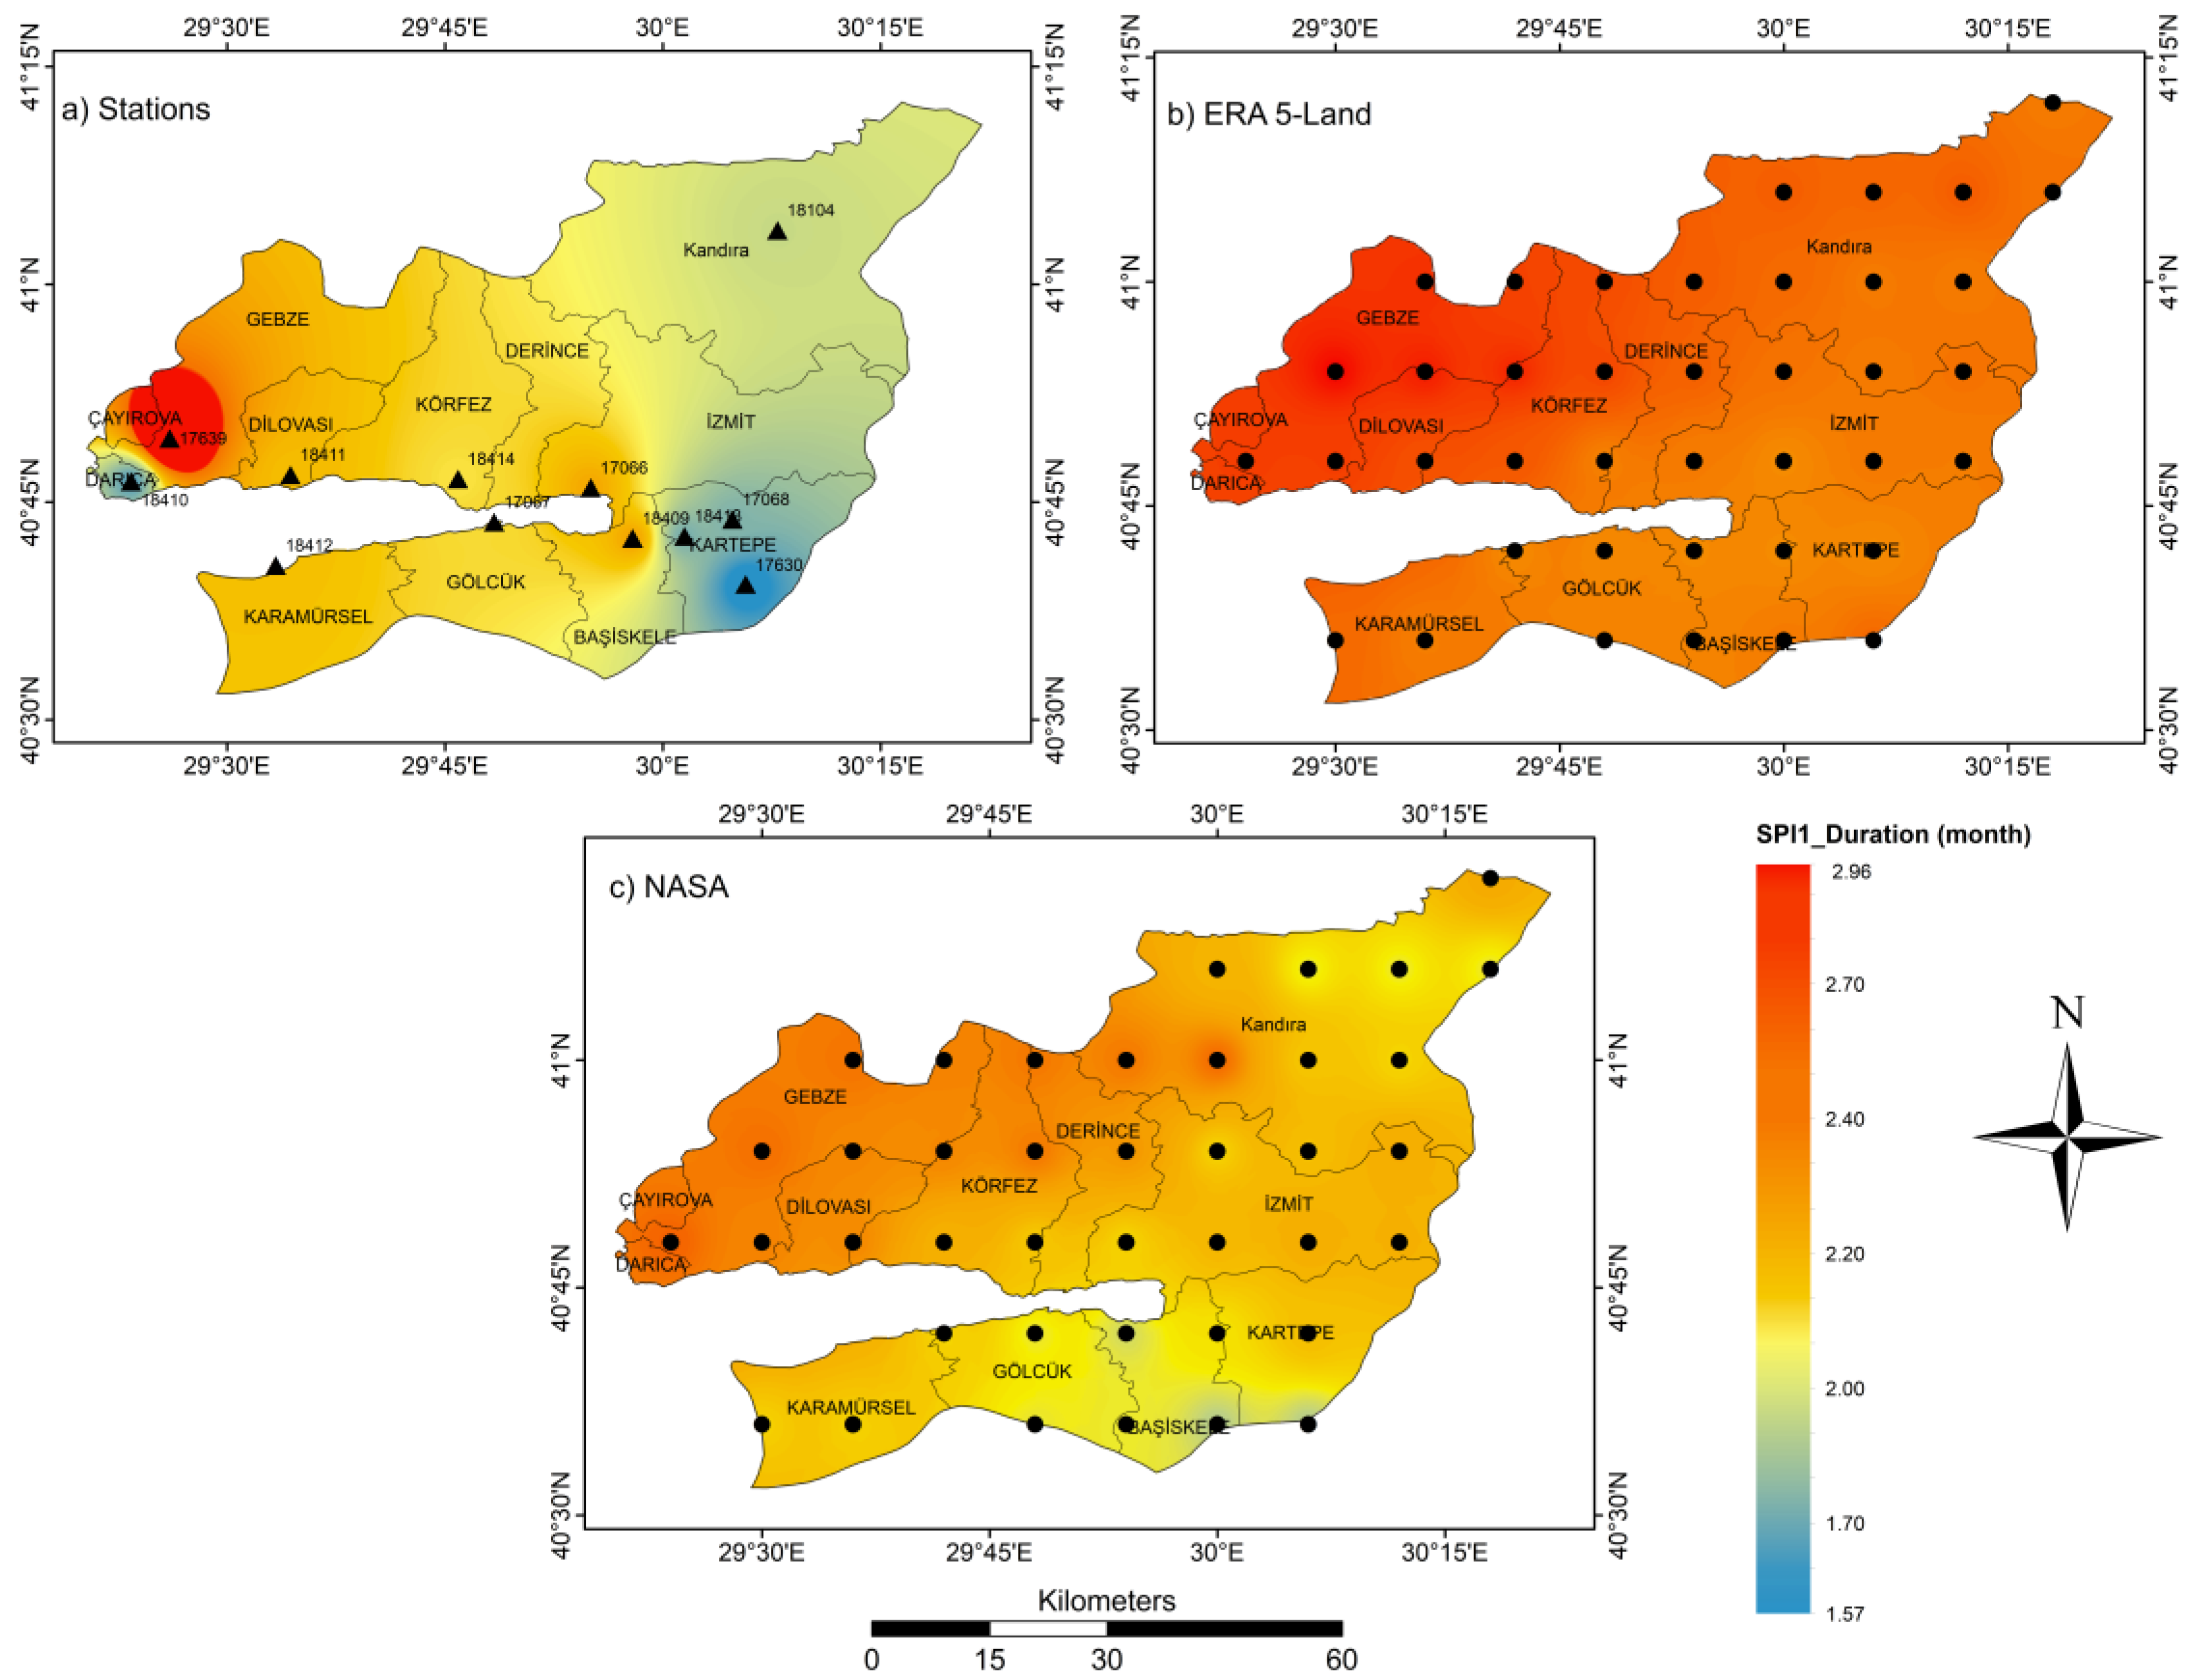
In Figure 5a, the map represents the average monthly drought duration based on the SPI1, calculated using data from 12 available rain stations in the studied area, according to McKee et al.’s [14] definition of drought event. The duration of drought varies greatly between stations, reflecting clear spatial differences. Station 17639 in Çayırova district recorded the highest average drought duration of 2.96 months, indicating that this area experienced longer and more frequent droughts than the rest of the Kocaeli province. Stations 18411, 17066, and 18409 also showed relatively high values, ranging between 2.4 and 2.7 months. In contrast, Darıca and Kartepe districts were the least exposed to drought, recording low average drought duration values of 1.57 and 1.75 months, respectively. In the northeastern province, only one station (18104) has a drought duration of 1.9 months. These spatial differences in drought duration may be due to multiple local influences, such as terrain variations or differences in local climate patterns, as well as the proximity of some stations to coastal areas, which may receive higher rainfall.
In Figure 5b, monthly rainfall data from ERA5-LAND from 1940 to 2024 were used to calculate the average monthly drought duration for the SPI1 based on a 40-point grid covering the entire region. The map shows a more homogeneous pattern compared to the rain station map, reflecting the gridded nature of these data. The values range between 2.4 and 2.96 months, with the highest values concentrated in the northwestern regions such as Gebze and Çayırova, indicating agreement with the results from the rain station data. However, some differences appeared in the interior regions, where drought duration was shorter in regions such as Kartepe and İzmit than in the northern regions (drought duration = 2.4–2.5 months). These results highlight the ability of ERA5-LAND data to provide a more comprehensive spatial distribution of drought. In Figure 5c, the average monthly drought duration for the SPI1 was calculated using NASA rainfall data based on a grid with the same spatial coverage (40 points). The map shows a pattern that was largely similar to the ERA5-LAND map, with slight differences in values. The drought duration ranges between 2.0 and 2.7 months, with the highest values recorded in the northern regions such as Çayırova and Gebze, while the least drought-prone regions, such as Başiskele and Gölcük, have values below 2.1 months. Despite the overall similarity between the ERA5-LAND and NASA maps, there are differences in some locations that may be due to differences in data sources and periods.
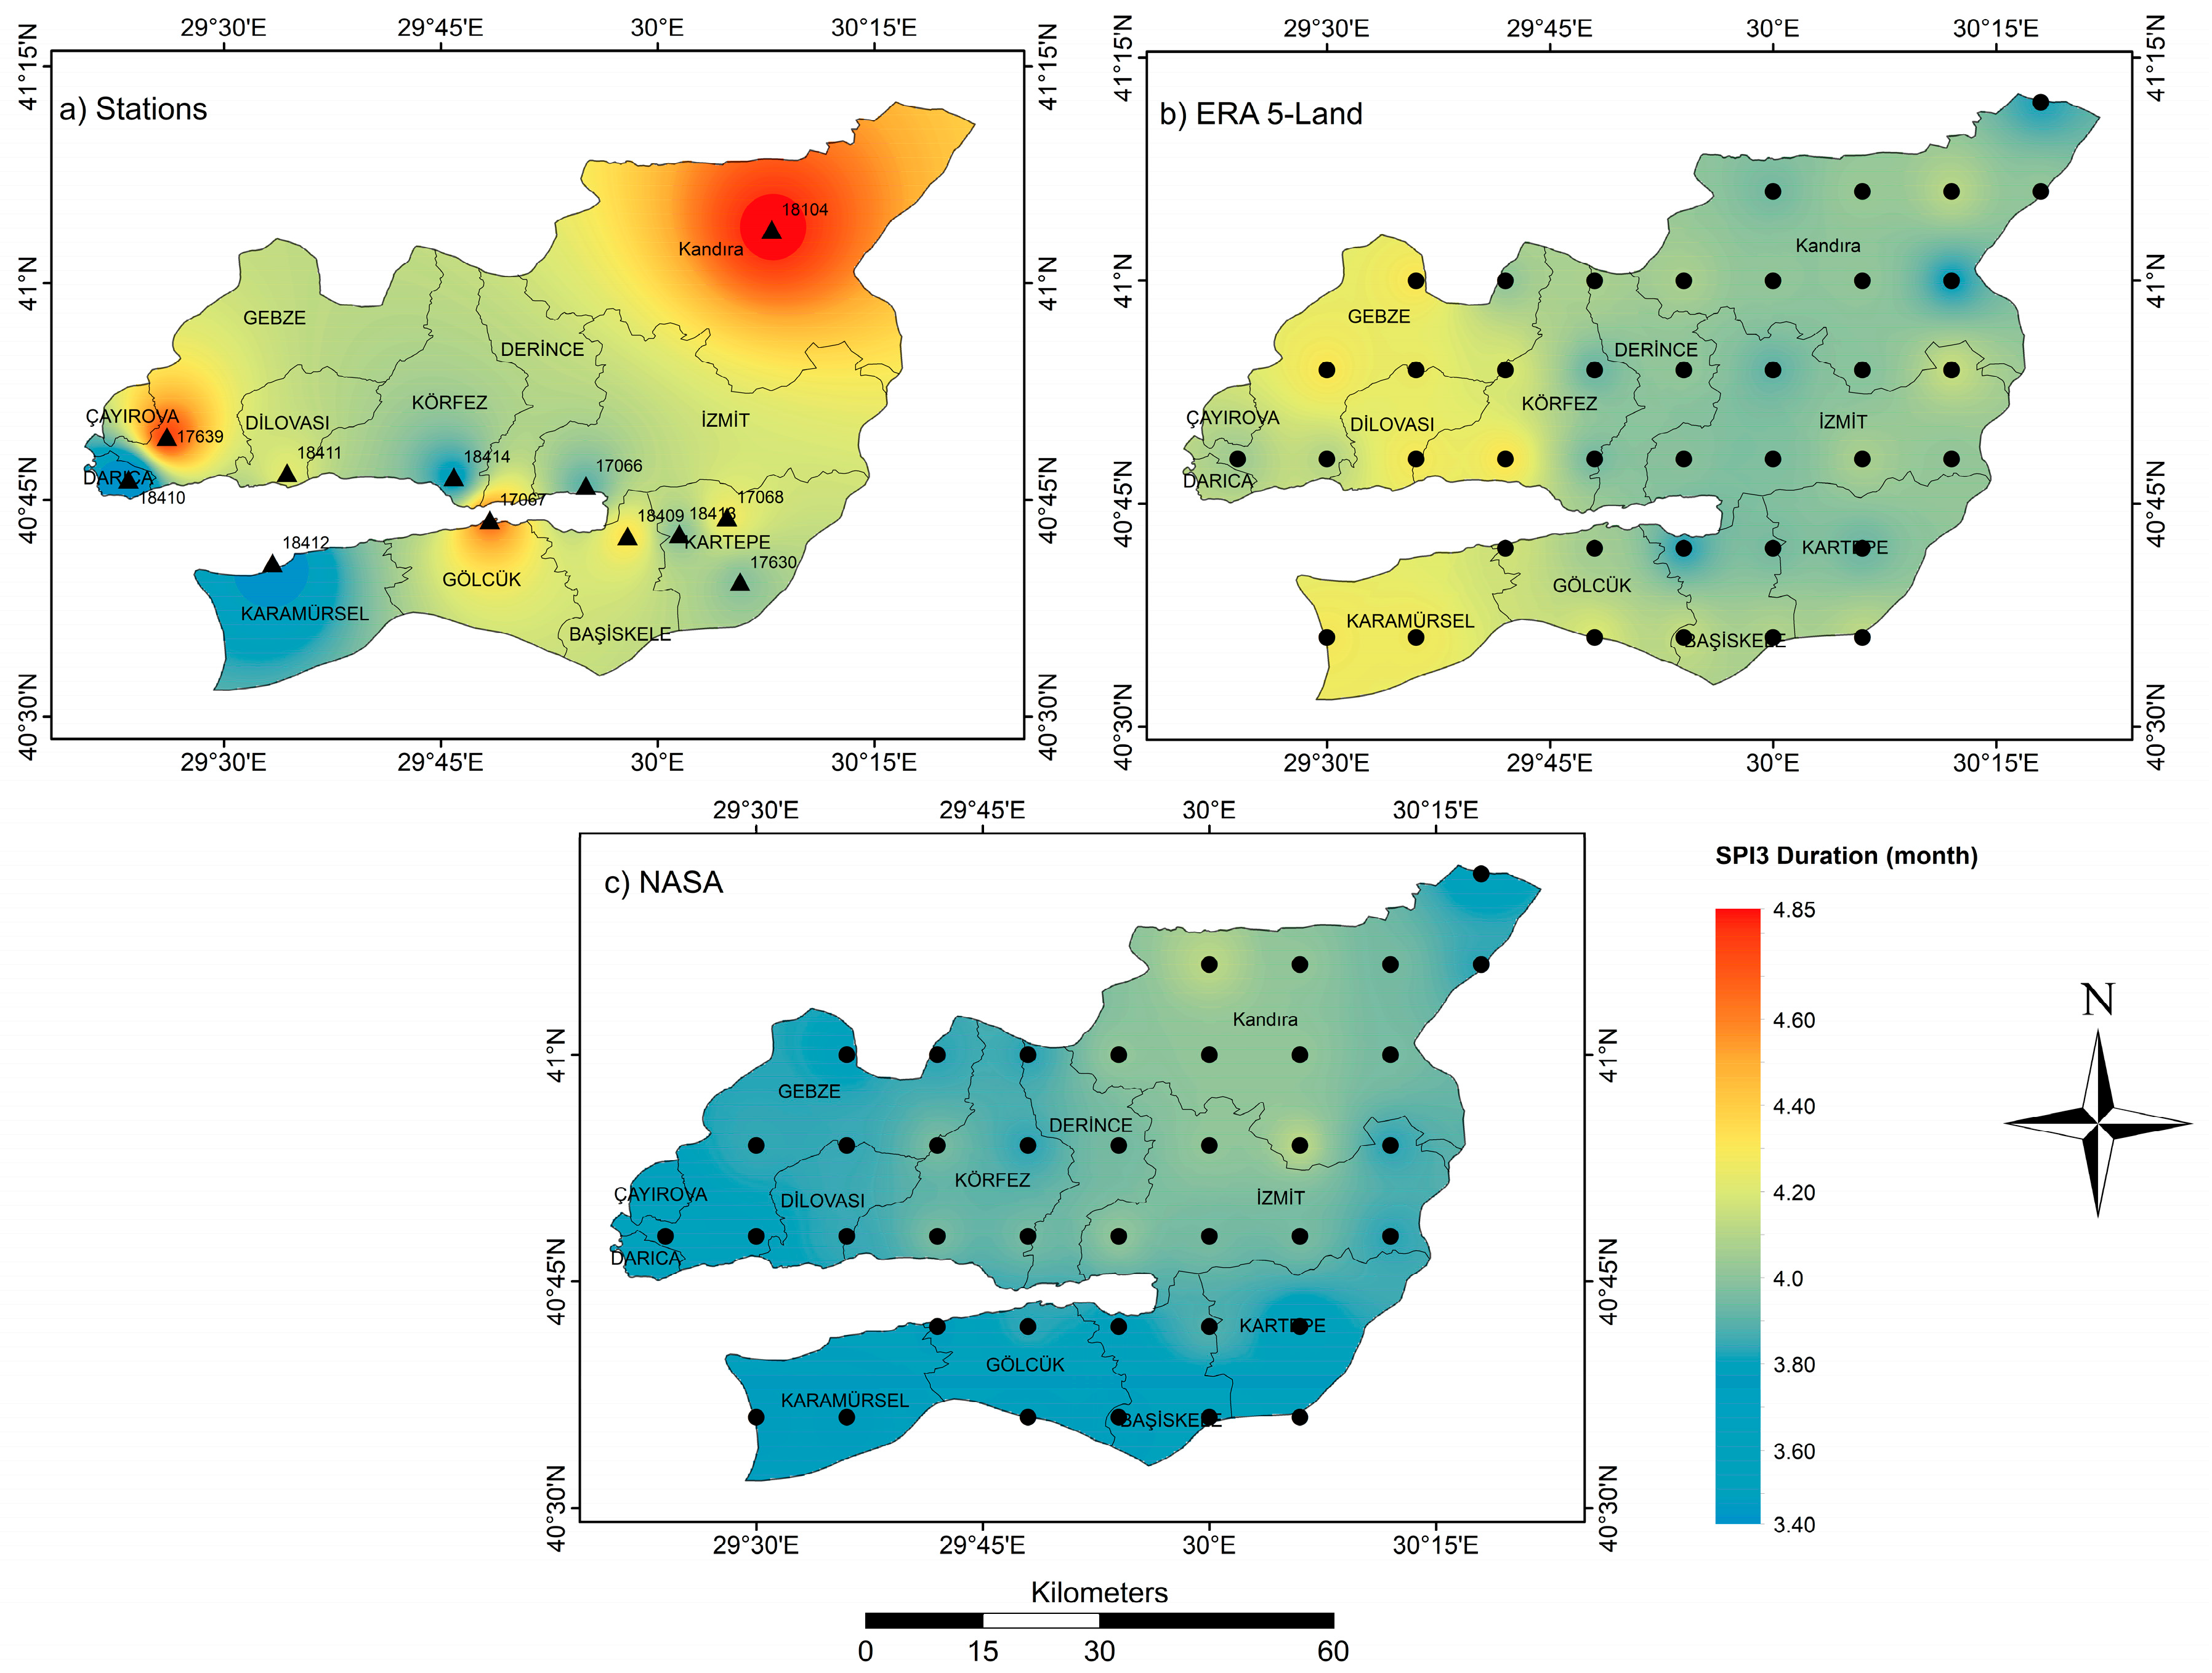
Figure 6 presents the average monthly drought duration in Kocaeli province using the SPI3 derived from three different sources: (a) in situ meteorological stations, (b) ERA5-LAND data, and (c) IMERG-NASA data. This analysis aims to evaluate the spatial differences between the three sources to determine the accuracy of data derived from global models compared to local data. The map of in situ stations (Figure 6a) reflects a significant variation in drought duration between regions, with the highest drought duration recorded in the Kandıra region, with an average of 4.85 months. In contrast, the southwestern regions, such as Karamürsel and Darıca, showed the lowest values for average drought duration, ranging from 3.40 to 3.58 months. These results indicate that the northern and northeastern regions of the province were more prone to prolonged droughts compared to the coastal regions close to the Sea of Marmara, reflecting the influence of topographic and climatic factors on rainfall distribution and drought duration.
In Figure 6b, based on ERA5-LAND data, a more homogeneous spatial pattern was seen compared to the stations. The highest drought duration was recorded in the Gebze, Dilovası, and Karamürsel regions with an average of about 4.3 months, indicating quite a difference between them and the stations; for example, Kandira in the stations map had the highest duration, but in the ERA5-LAND map had a medium duration. Also, the distribution of drought duration appears less diverse across regions. The southern regions, such as Başiskele and Gölcük, showed medium drought duration values of 3.8 to 4.0 months. It is noted that the ERA5-LAND data tend to have less spatial variability between regions and less drought duration compared to in situ stations. This can be attributed to the fact that 40 grids are used, which is better than 12 stations. Figure 6c, based on NASA data, showed a spatial distribution similar to the ERA5-LAND data but with generally lower drought durations compared to other maps. The Kandıra region recorded an average drought duration of 4.2 months, while Başiskele and Karamürsel had values ranging from 3.4 to 3.6 months. This source showed a relatively superior data homogeneity. It is important to note that these results indicate significant differences between the three sources in estimating drought duration. This reflects the importance of using multi-source data to ensure the comprehensiveness and accuracy of climate assessments.
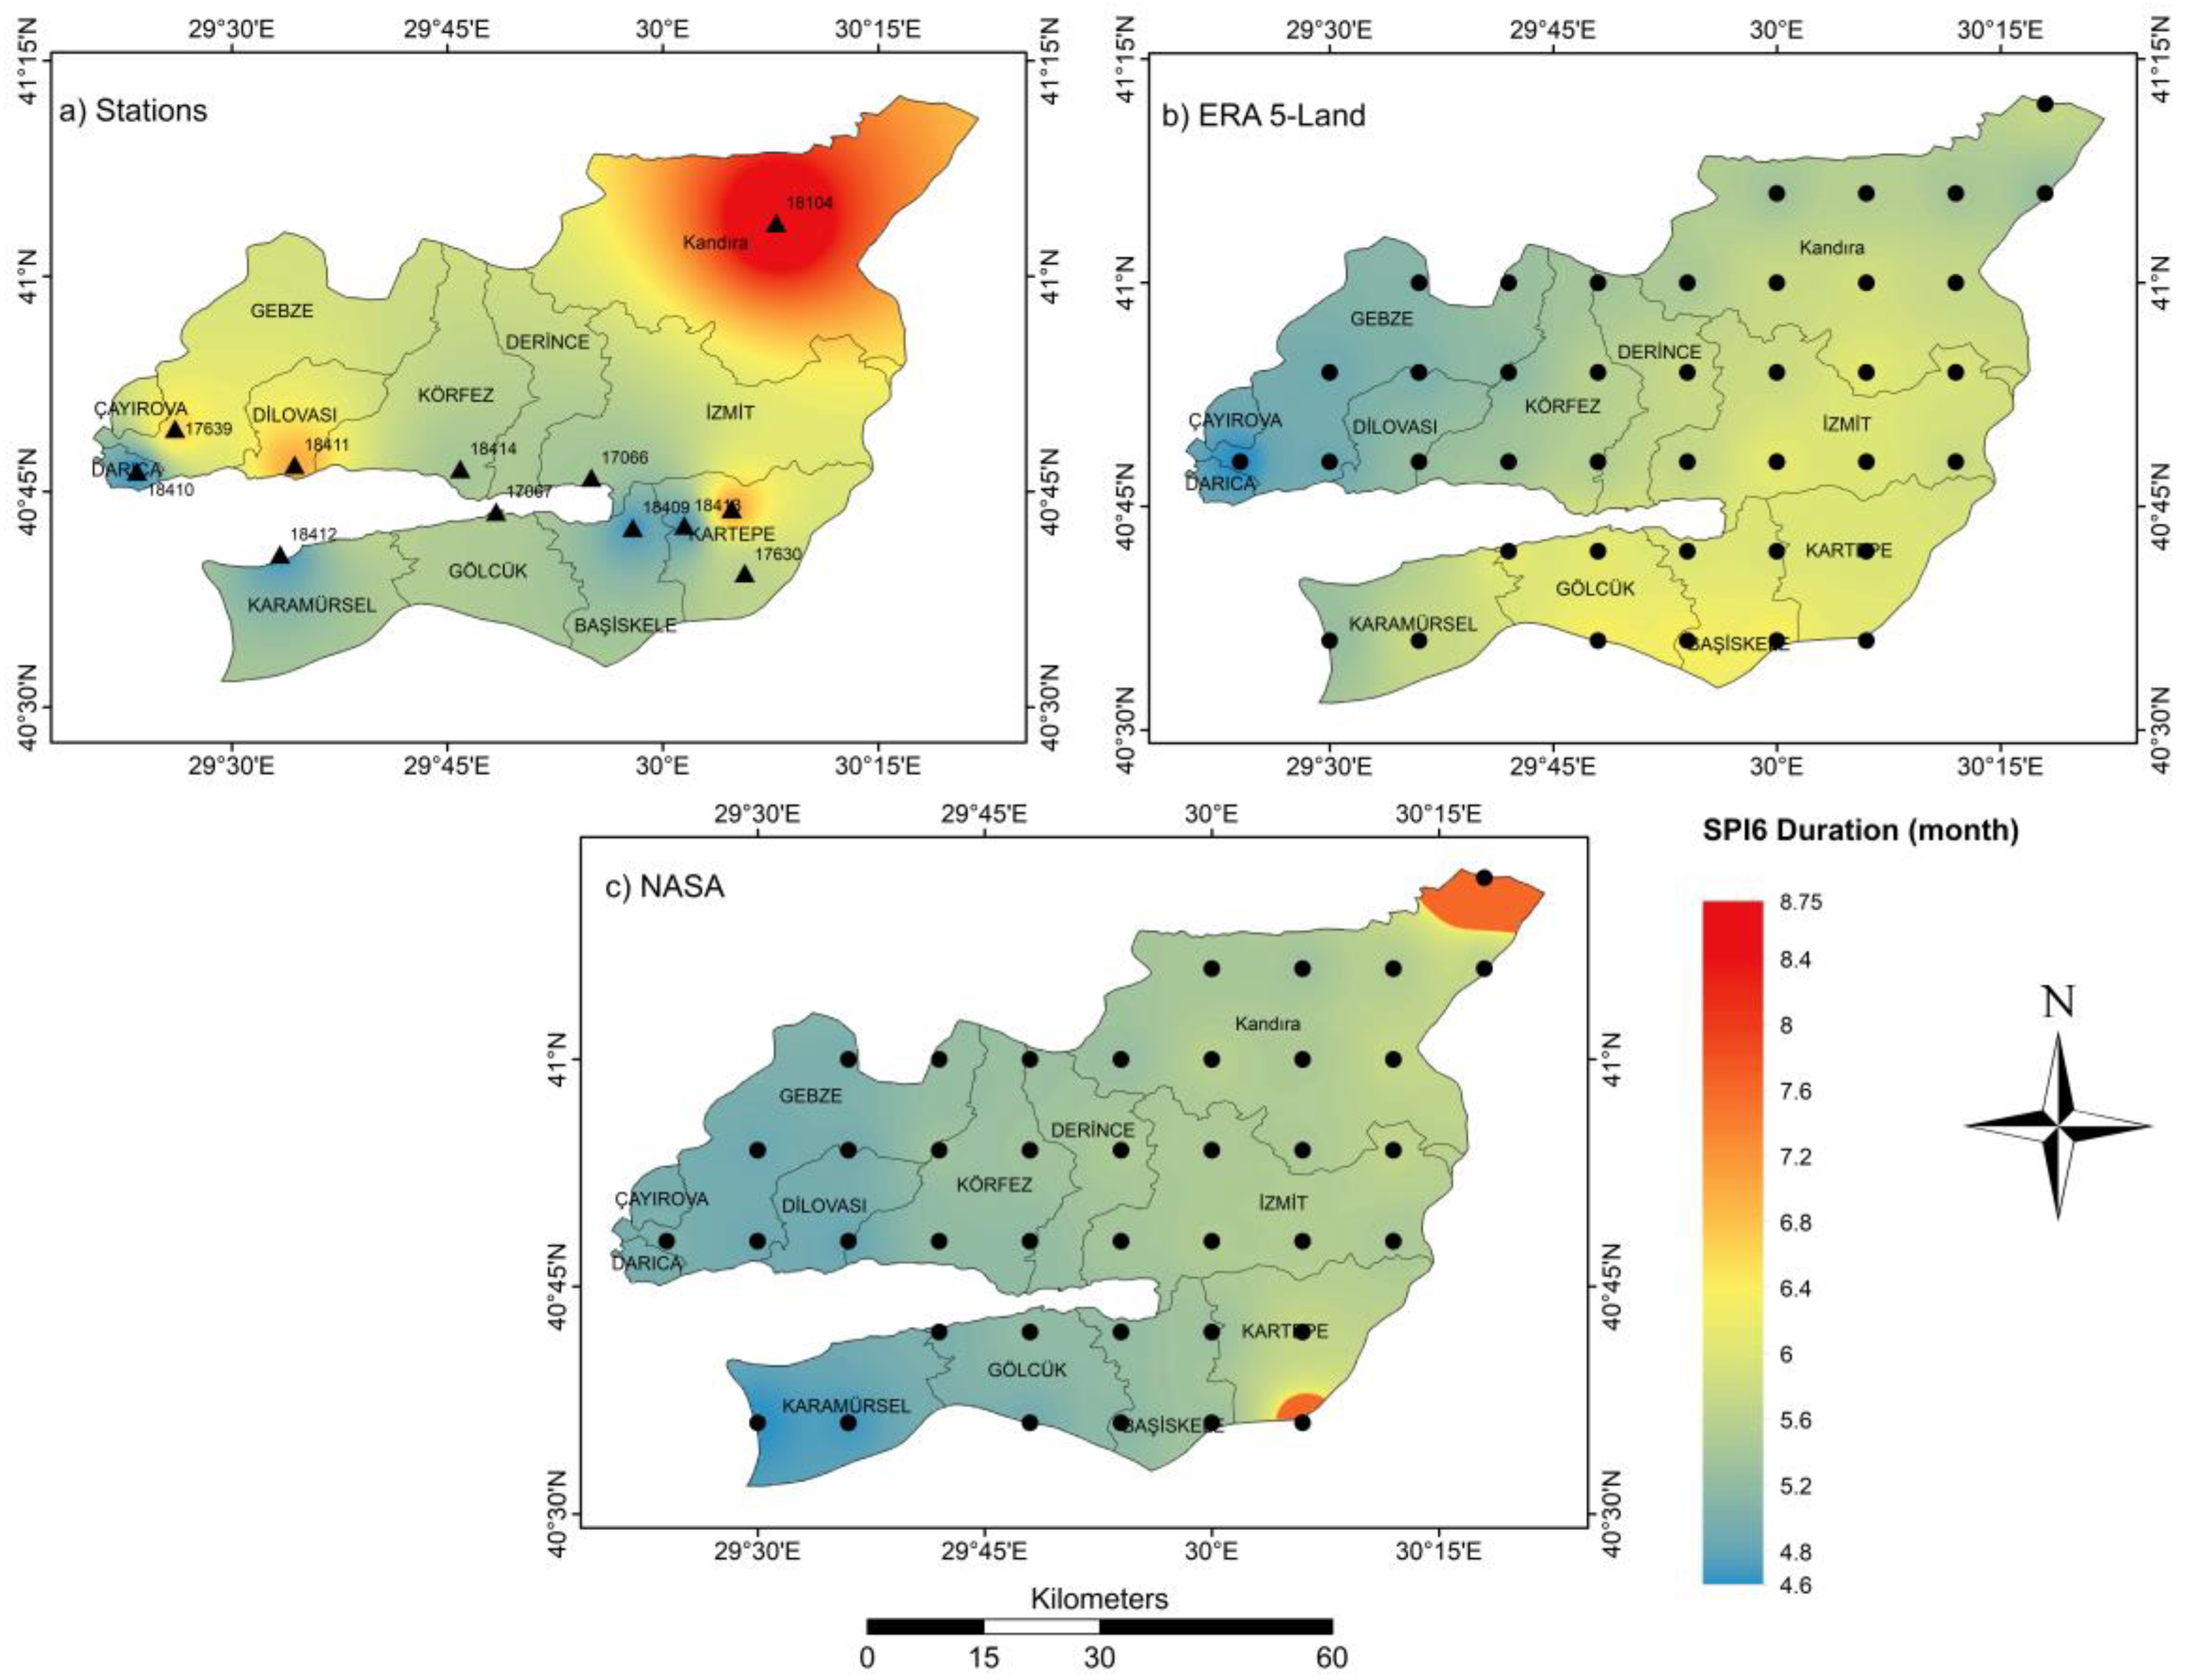
Figure 7 shows the average drought duration in Kocaeli Province using the SPI6 derived from three different datasets: (a) meteorological stations, (b) ERA5-LAND, and (c) IMERG-NASA. Looking at the in situ meteorological station data (Figure 7a), we observed a significant variation in drought duration between different regions within the province. Kandıra region records the highest average drought duration of about 8.7 months, indicating that this region is more prone to prolonged and frequent droughts at short and medium time scales. In contrast, the southwestern regions such as Karamürsel and Darıca showed a shorter drought duration, ranging from 4.8 to 5.2 months, reflecting significant differences in local climate influences and geospatial factors. Figure 7b, based on ERA5-LAND data, showed a more homogeneous spatial pattern with less variation in drought duration between different regions. Although the Kartepe region had the highest drought duration, the maximum value was slightly lower than that of the stations at 6 months.
In contrast, the northwestern regions of Darıca and Çayırova showed the lowest average drought duration values, ranging from 4.6 to 5.0 months. This relative homogeneity is attributed to the gridded nature of the ERA5-LAND data, which is based on global reanalysis models that smooth out the subtle variations that in-situ stations can capture. Figure 7c, based on NASA data, showed a spatial pattern largely similar to that shown in Figure 7b, with slight differences in the maximum values and the northeastern region. The northeastern region recorded an average drought duration of approximately 8.1 months, lower than the values recorded in the station data. Interestingly, the distribution of drought duration appears to be more uniform in the central regions of the region, which may indicate that NASA’s data model can capture regional climate changes effectively. For example, coastal areas such as Darıca, Gebze, and Dilovası showed values between 4.6 and 5.2 months, which were lower than other estimates, reflecting the tendency of NASA data to provide conservative estimates of drought duration.
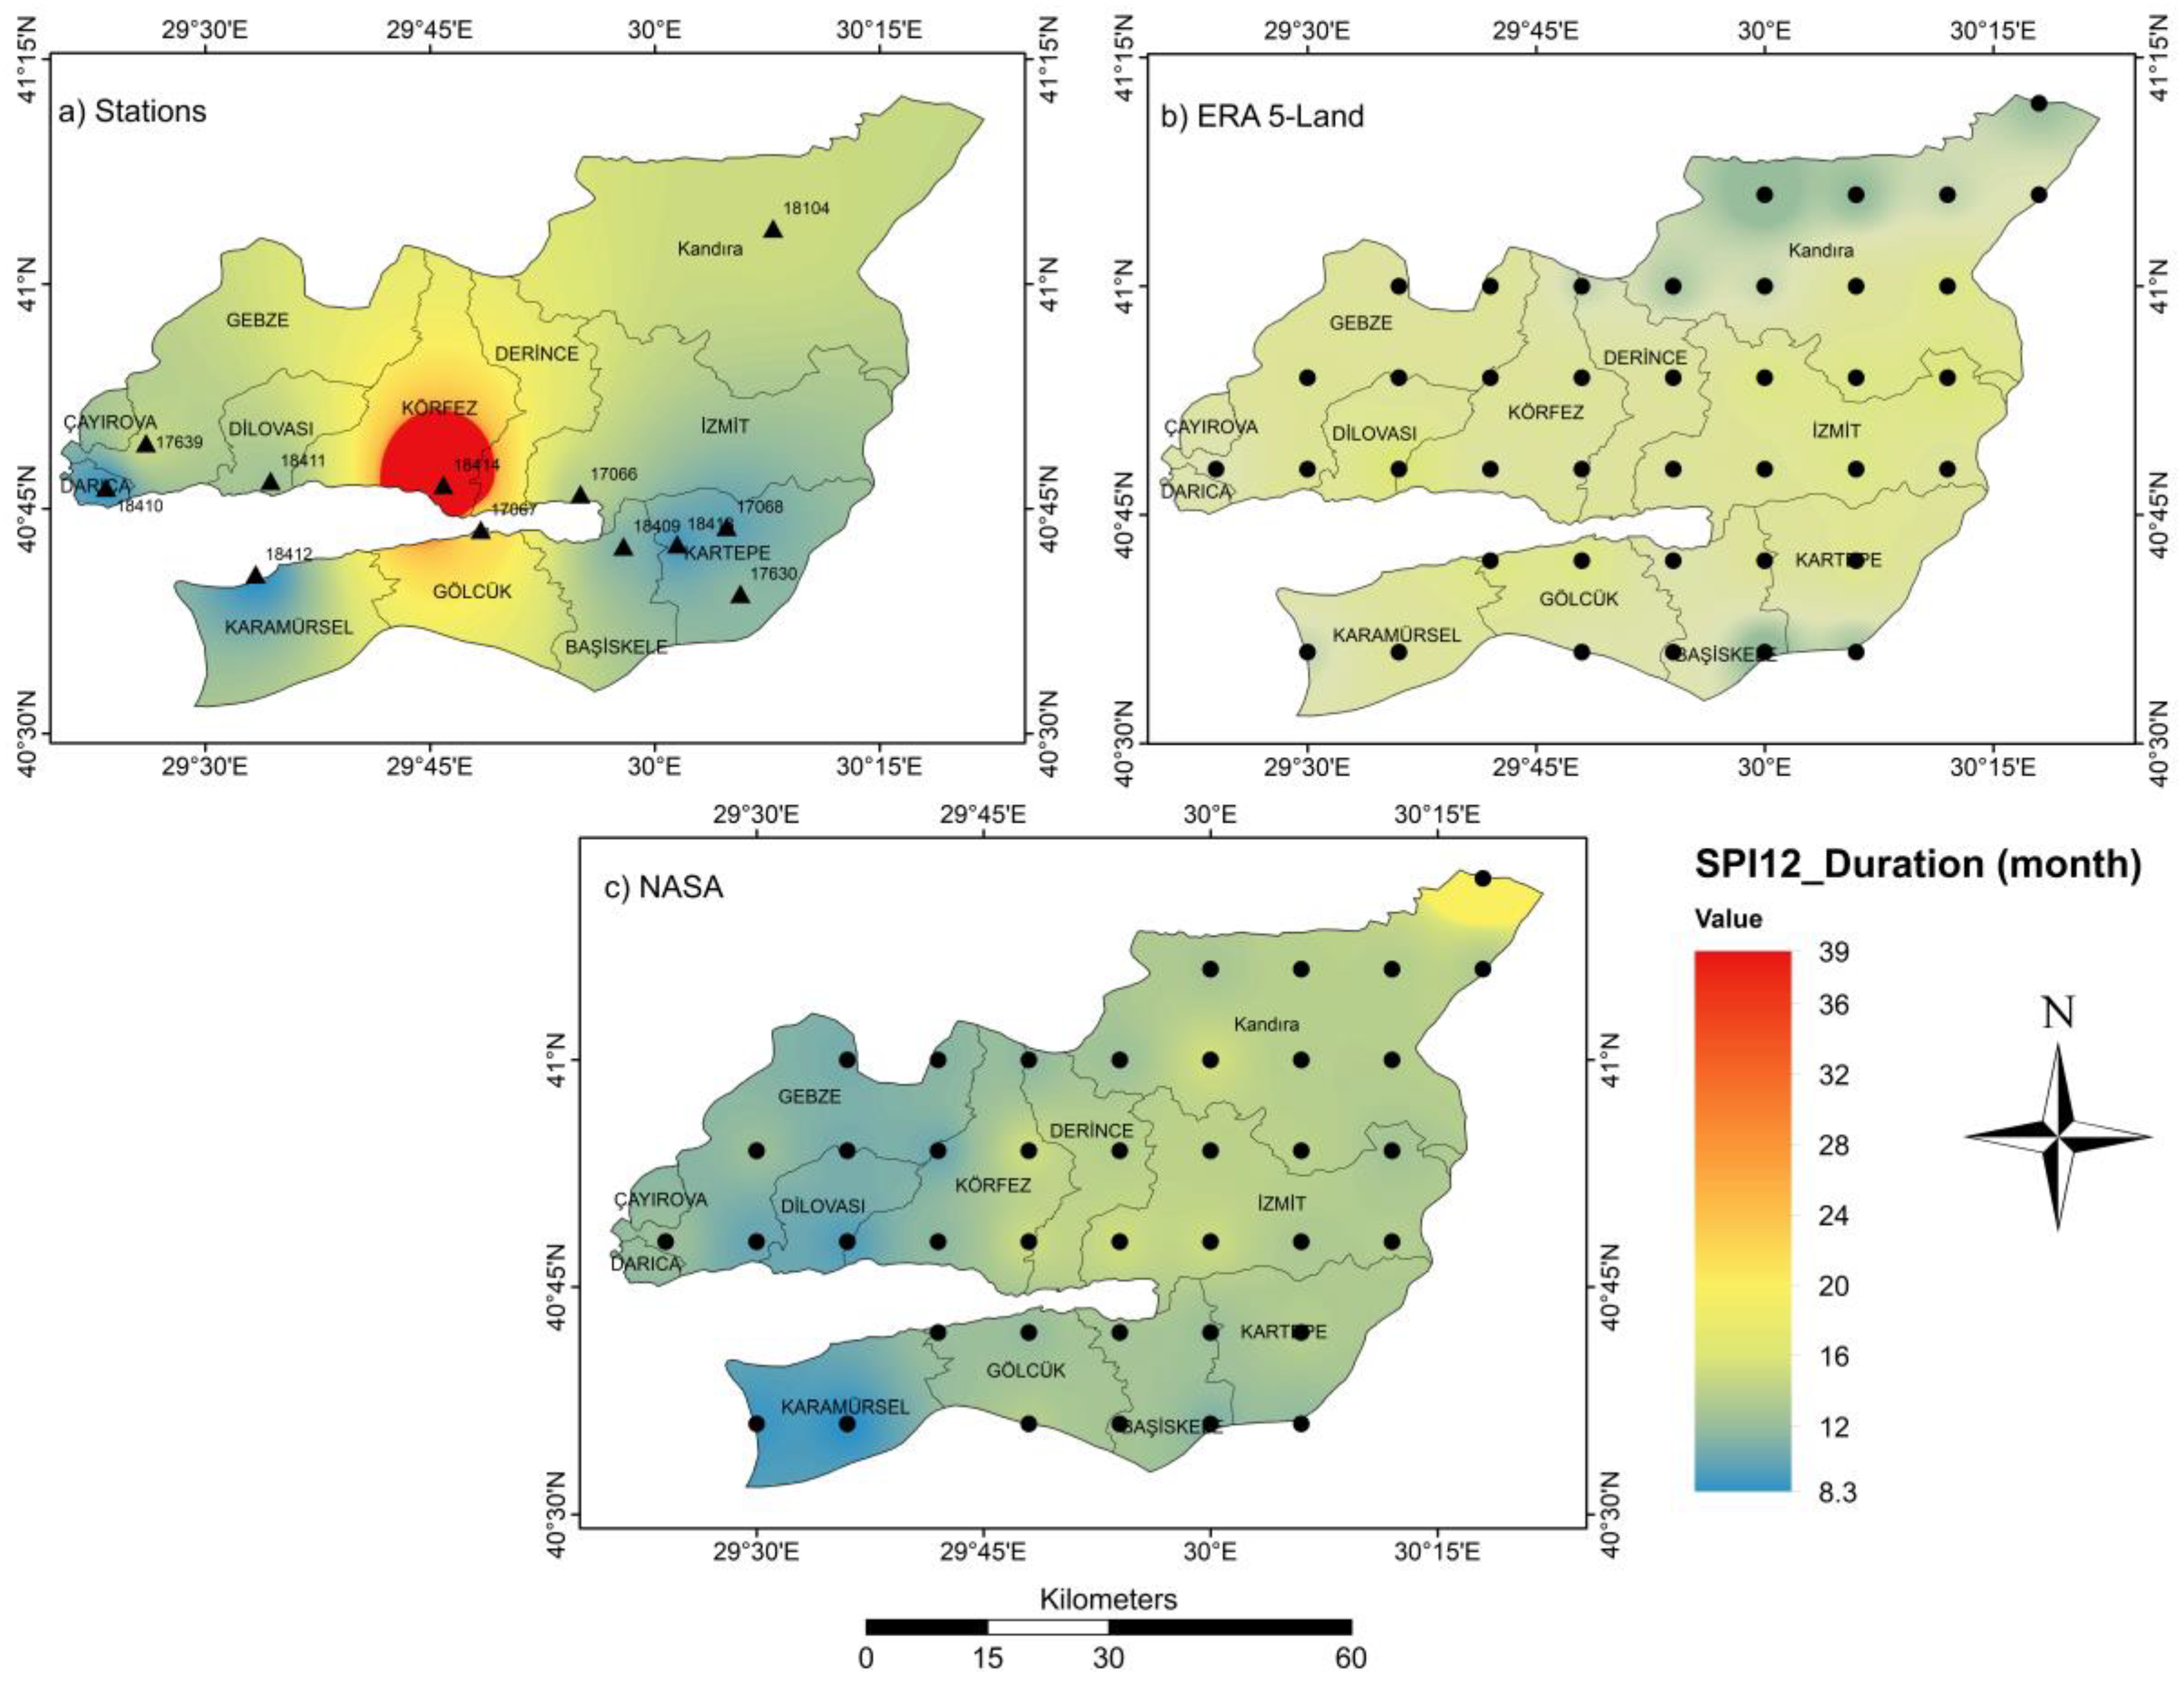
Figure 8 shows the average drought duration in Kocaeli Province using the SPI12 (long timescale) derived from three different datasets: (a) meteorological stations, (b) ERA5-LAND, and (c) IMERG-NASA. Looking at the in situ meteorological station data (Figure 8a), we observed a significant variation in drought duration between different regions within the province. Unlike short and medium timescales, the Körfez showed the maximum drought duration of 39 months, indicating that this region is more prone to prolonged and frequent droughts at long time scales. In contrast, the western regions, such as Karamürsel and Darıca, showed a shorter drought duration, ranging from 8.3 to 12 months. Figure 8 b, based on ERA5-LAND data, showed a more homogeneous spatial pattern with less variation in drought duration between different regions. The drought duration ranged between 12 and 16 months over the study area.
In contrast, the northern regions of Kandıra showed the lowest average drought duration values of 12 months. Figure 8c, based on NASA data, showed a spatial pattern with slight differences in the maximum values in the western region. The duration ranged between 8.3 and 20 months. For example, the northern region showed a maximum duration of 20 months, and the Karamürsel district had a minimum duration of 8.3 months.

3.3.2. Drought Intensity

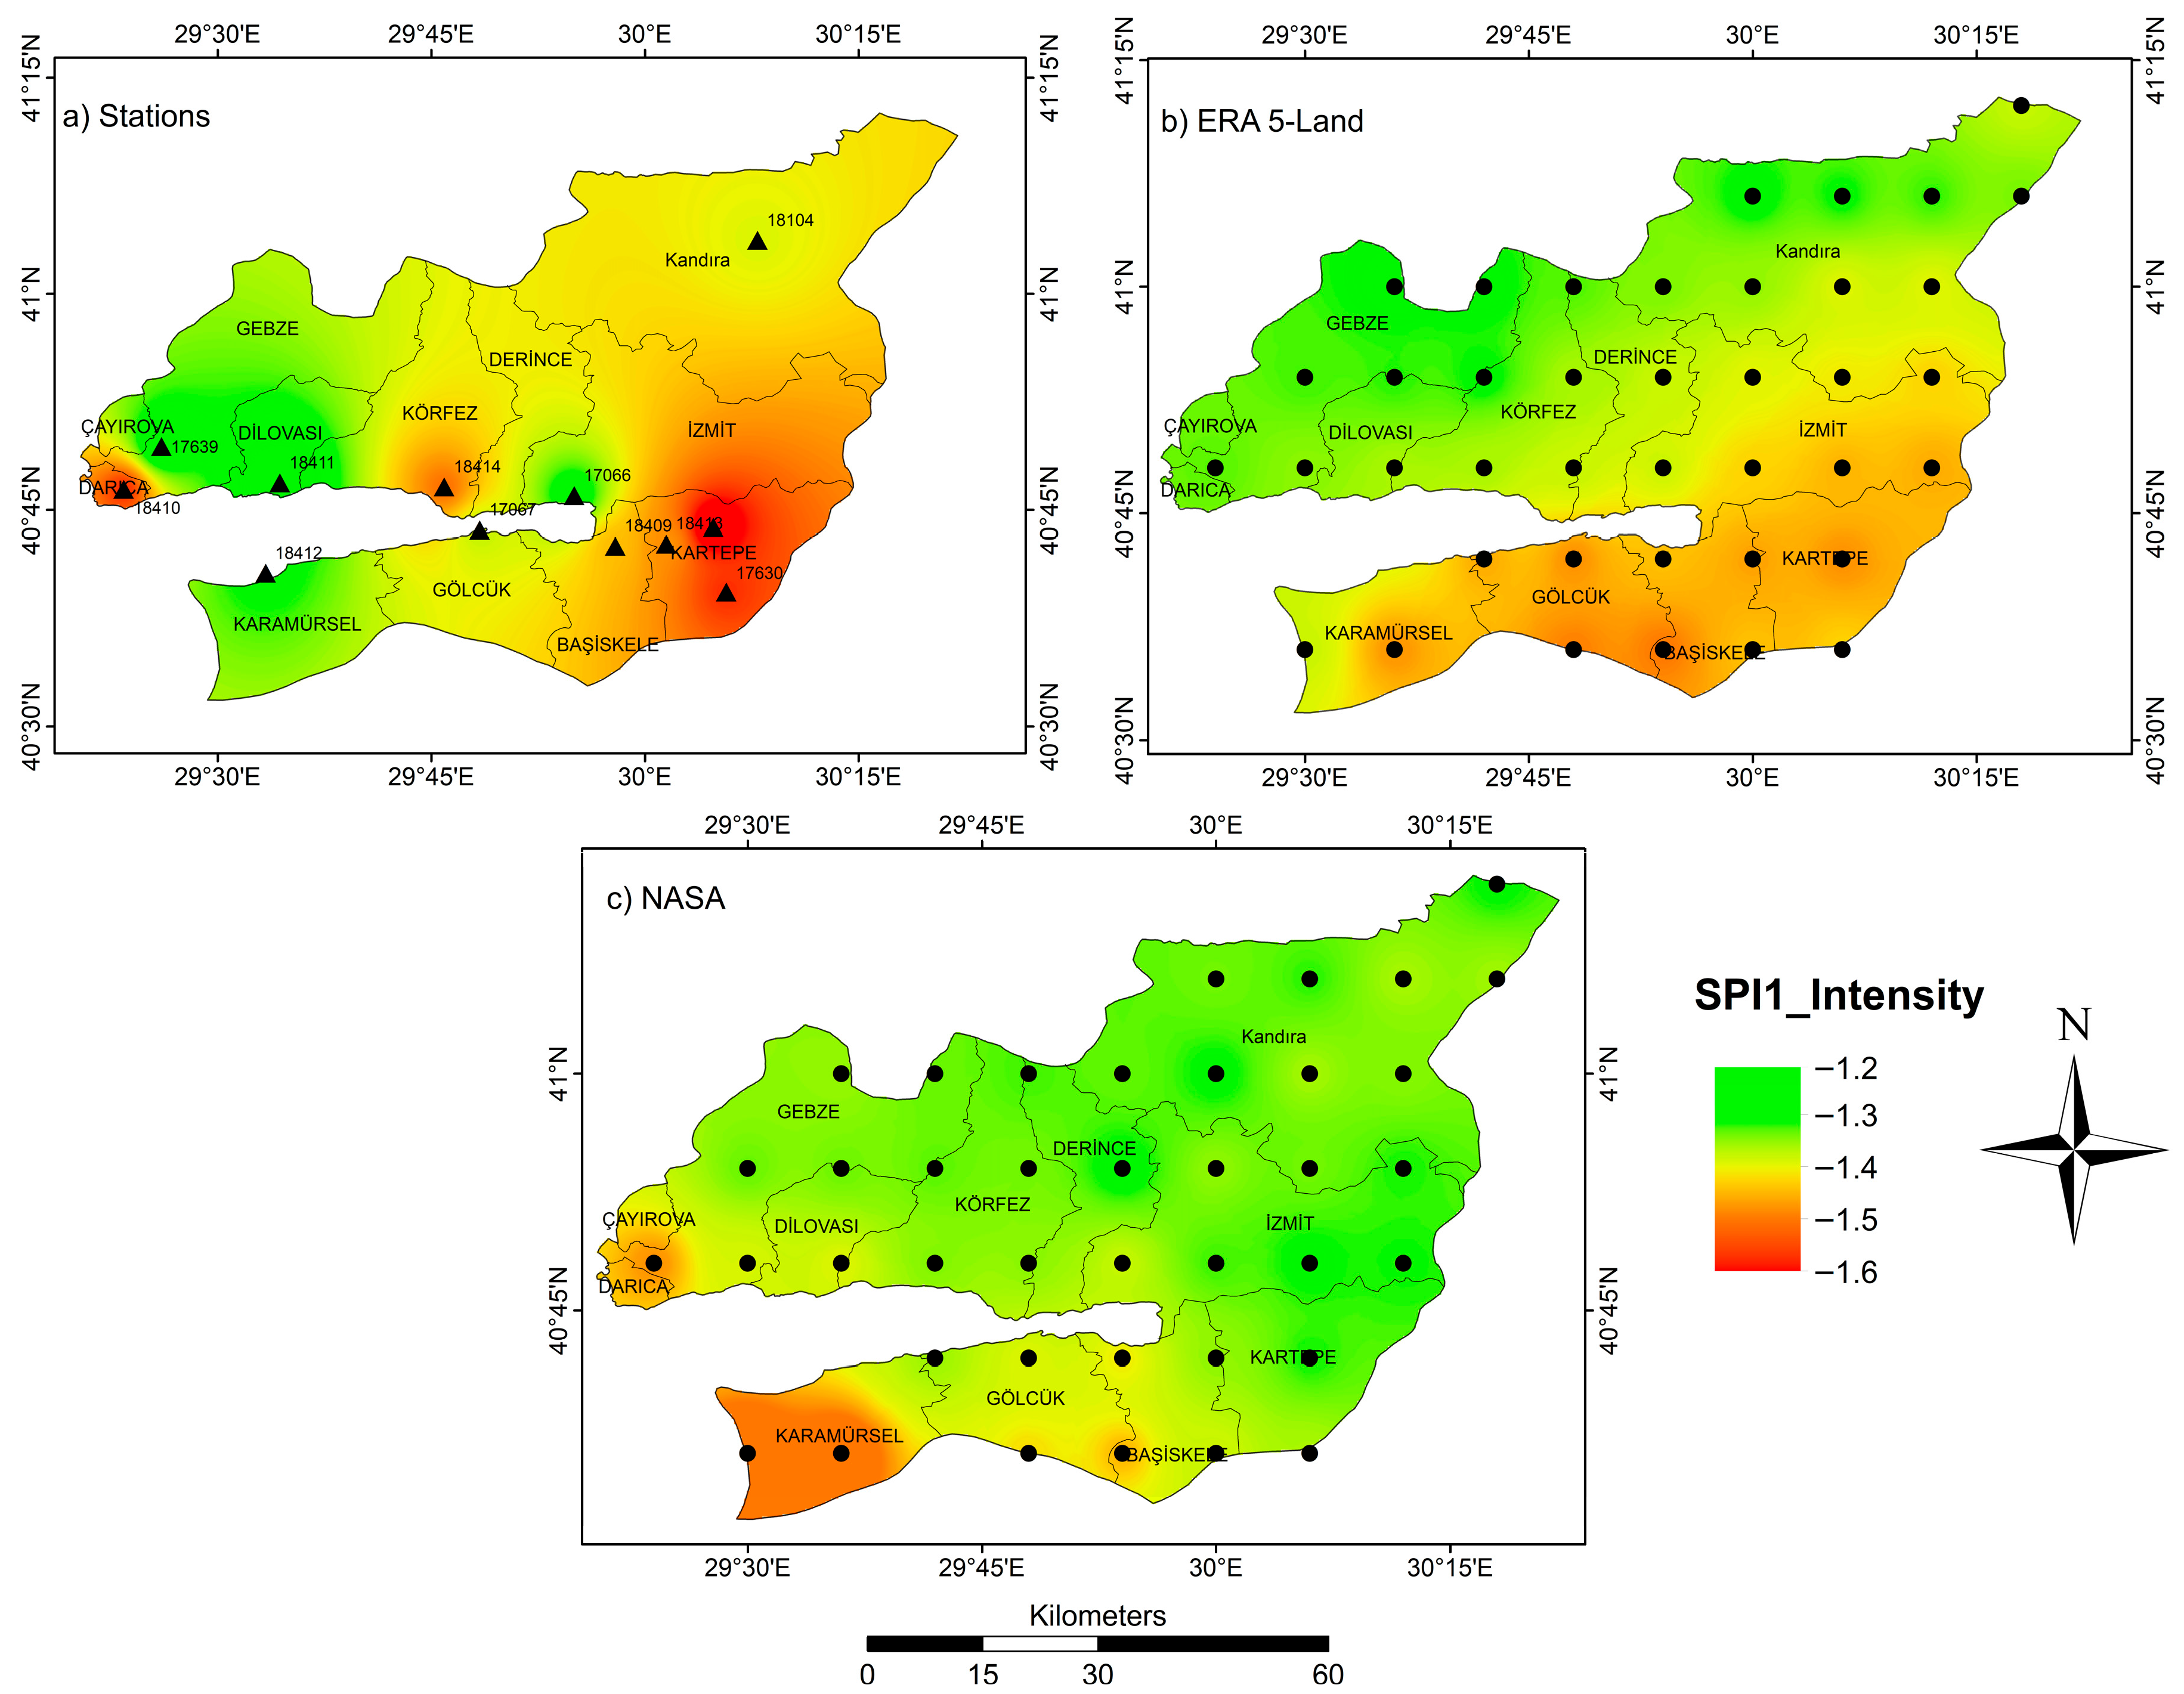
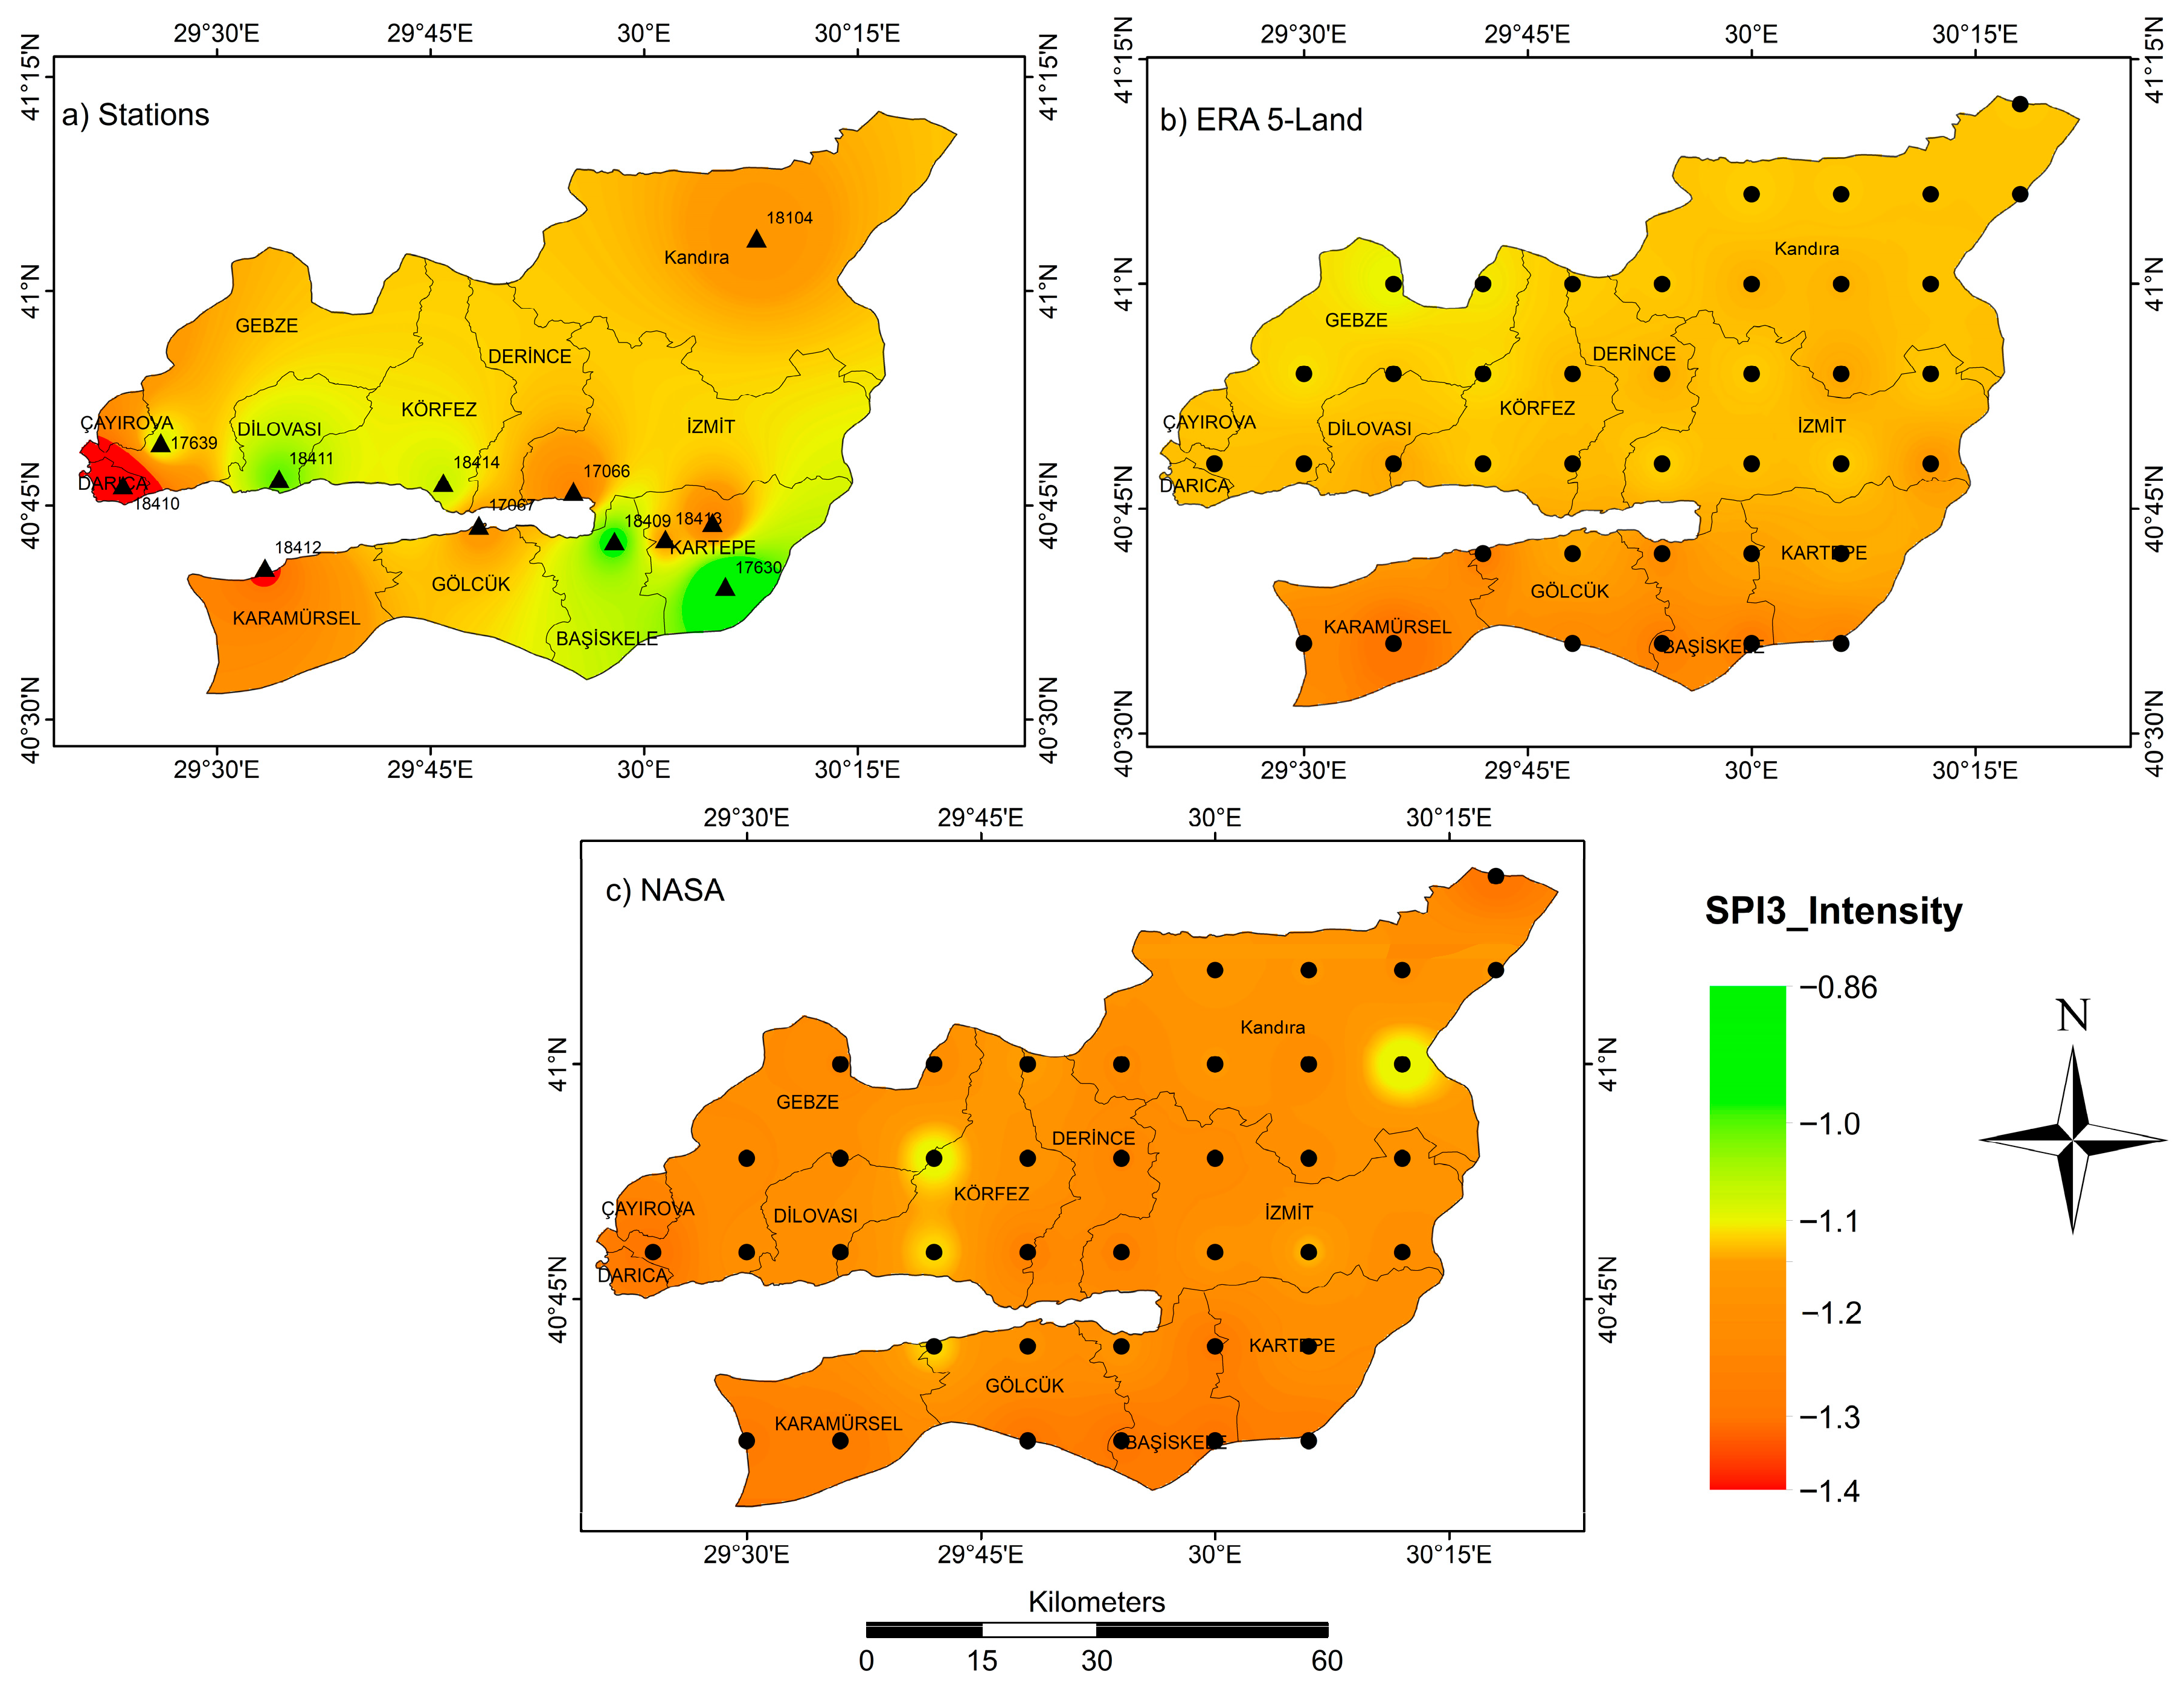
The map shown in Figure 9 reflects the spatial distribution of drought intensity in Kocaeli Province, using the SPI1 derived from three different data sources: (a) in situ-based meteorological stations, (b) ERA5-LAND reanalysis data, and (c) IMERG-NASA satellite data. Analysis of these data shows a variation in drought intensity depending on the data source used. Figure 9a, based on station data, observed that the southeastern regions of the province, especially İzmit, Kartepe, and Başıskele, experienced higher levels of drought, with drought intensity reaching −1.6 according to McKee et al. [14]. In contrast, the northern and western regions, such as Kandıra, Gebze, and Delovasi, showed lower levels of drought, with values ranging between −1.2 and −1.3. This distribution reflects the significant influence of geography and topography on the distribution of rainfall and drought, with mountainous and inland regions experiencing higher rates compared to coastal regions. When comparing the station data with the ERA5-LAND data in Figure 9b, we find a relative match in the spatial distribution of drought intensity, but with some noticeable differences in the intensity of the values. For example, the ERA5-LAND data showed that the drought was less severe in the Kartepe region than the station data, with values ranging between −1.4 and −1.5 instead of −1.6. However, both sources agree that drought affected the southeast of the province more than the northern regions. These slight differences between the two sources may be due to differences in the spatial resolution of the ERA5-LAND data compared to the station data, as the reanalysis data is based on numerical models that combine observations and physical simulations, which may lead to discrepancies in values when compared to direct measurements. As for the NASA data in Figure 9c, we notice that the spatial distribution of drought differed significantly from the other two sources. The data showed that the southwestern regions, especially Karamürsel, were experiencing more severe drought compared to other data, with values reaching −1.5. In contrast, according to NASA data, the Izmit and Kartepe regions appeared to be less affected by drought, suggesting that satellites may detect different patterns of drought distribution depending on the sensing methodology used. These results illustrated the importance of integrating multiple data sources when analyzing climate phenomena such as drought, as each source can provide a different insight depending on the techniques and standards used for measurement.
Figure 10 shows the spatial distribution of drought intensity in Kocaeli province using the SPI3 derived from three data sources: (a) ground-based meteorological stations, (b) ERA5-LAND reanalysis data, and (c) IMERG-NASA satellite data. The maps show a significant variation in drought intensity between the different sources, reflecting the different data collection and analysis methods. In Figure 10a, based on ground-based station data, the results showed that the western regions of the province, especially Çayırova, Darıca, and Karamürsel, experienced higher levels of drought compared to other regions, with drought intensity reaching −1.4 according to the SPI3 and less than SPI1. However, some regions, such as Kartepe and Dilovası, appeared with less severe values, showing a green color reflecting less drought intensity. In contrast, Figure 10b, based on ERA5-LAND data, showed a more homogeneous distribution of drought across the province, with values ranging between −1.15 and −1.3, indicating that reanalysis data tend to underestimate local variability compared to ground station measurements.
Figure 10c, derived from NASA data, showed a relatively different pattern, with most areas of Kocaeli appearing to be affected by moderate to severe drought, with slight variations. The drought intensity ranged between −1.15 and −1.25. These results confirm that using multiple data sources can improve the accuracy of drought analysis, as each source provides complementary information on the nature and intensity of the phenomenon.
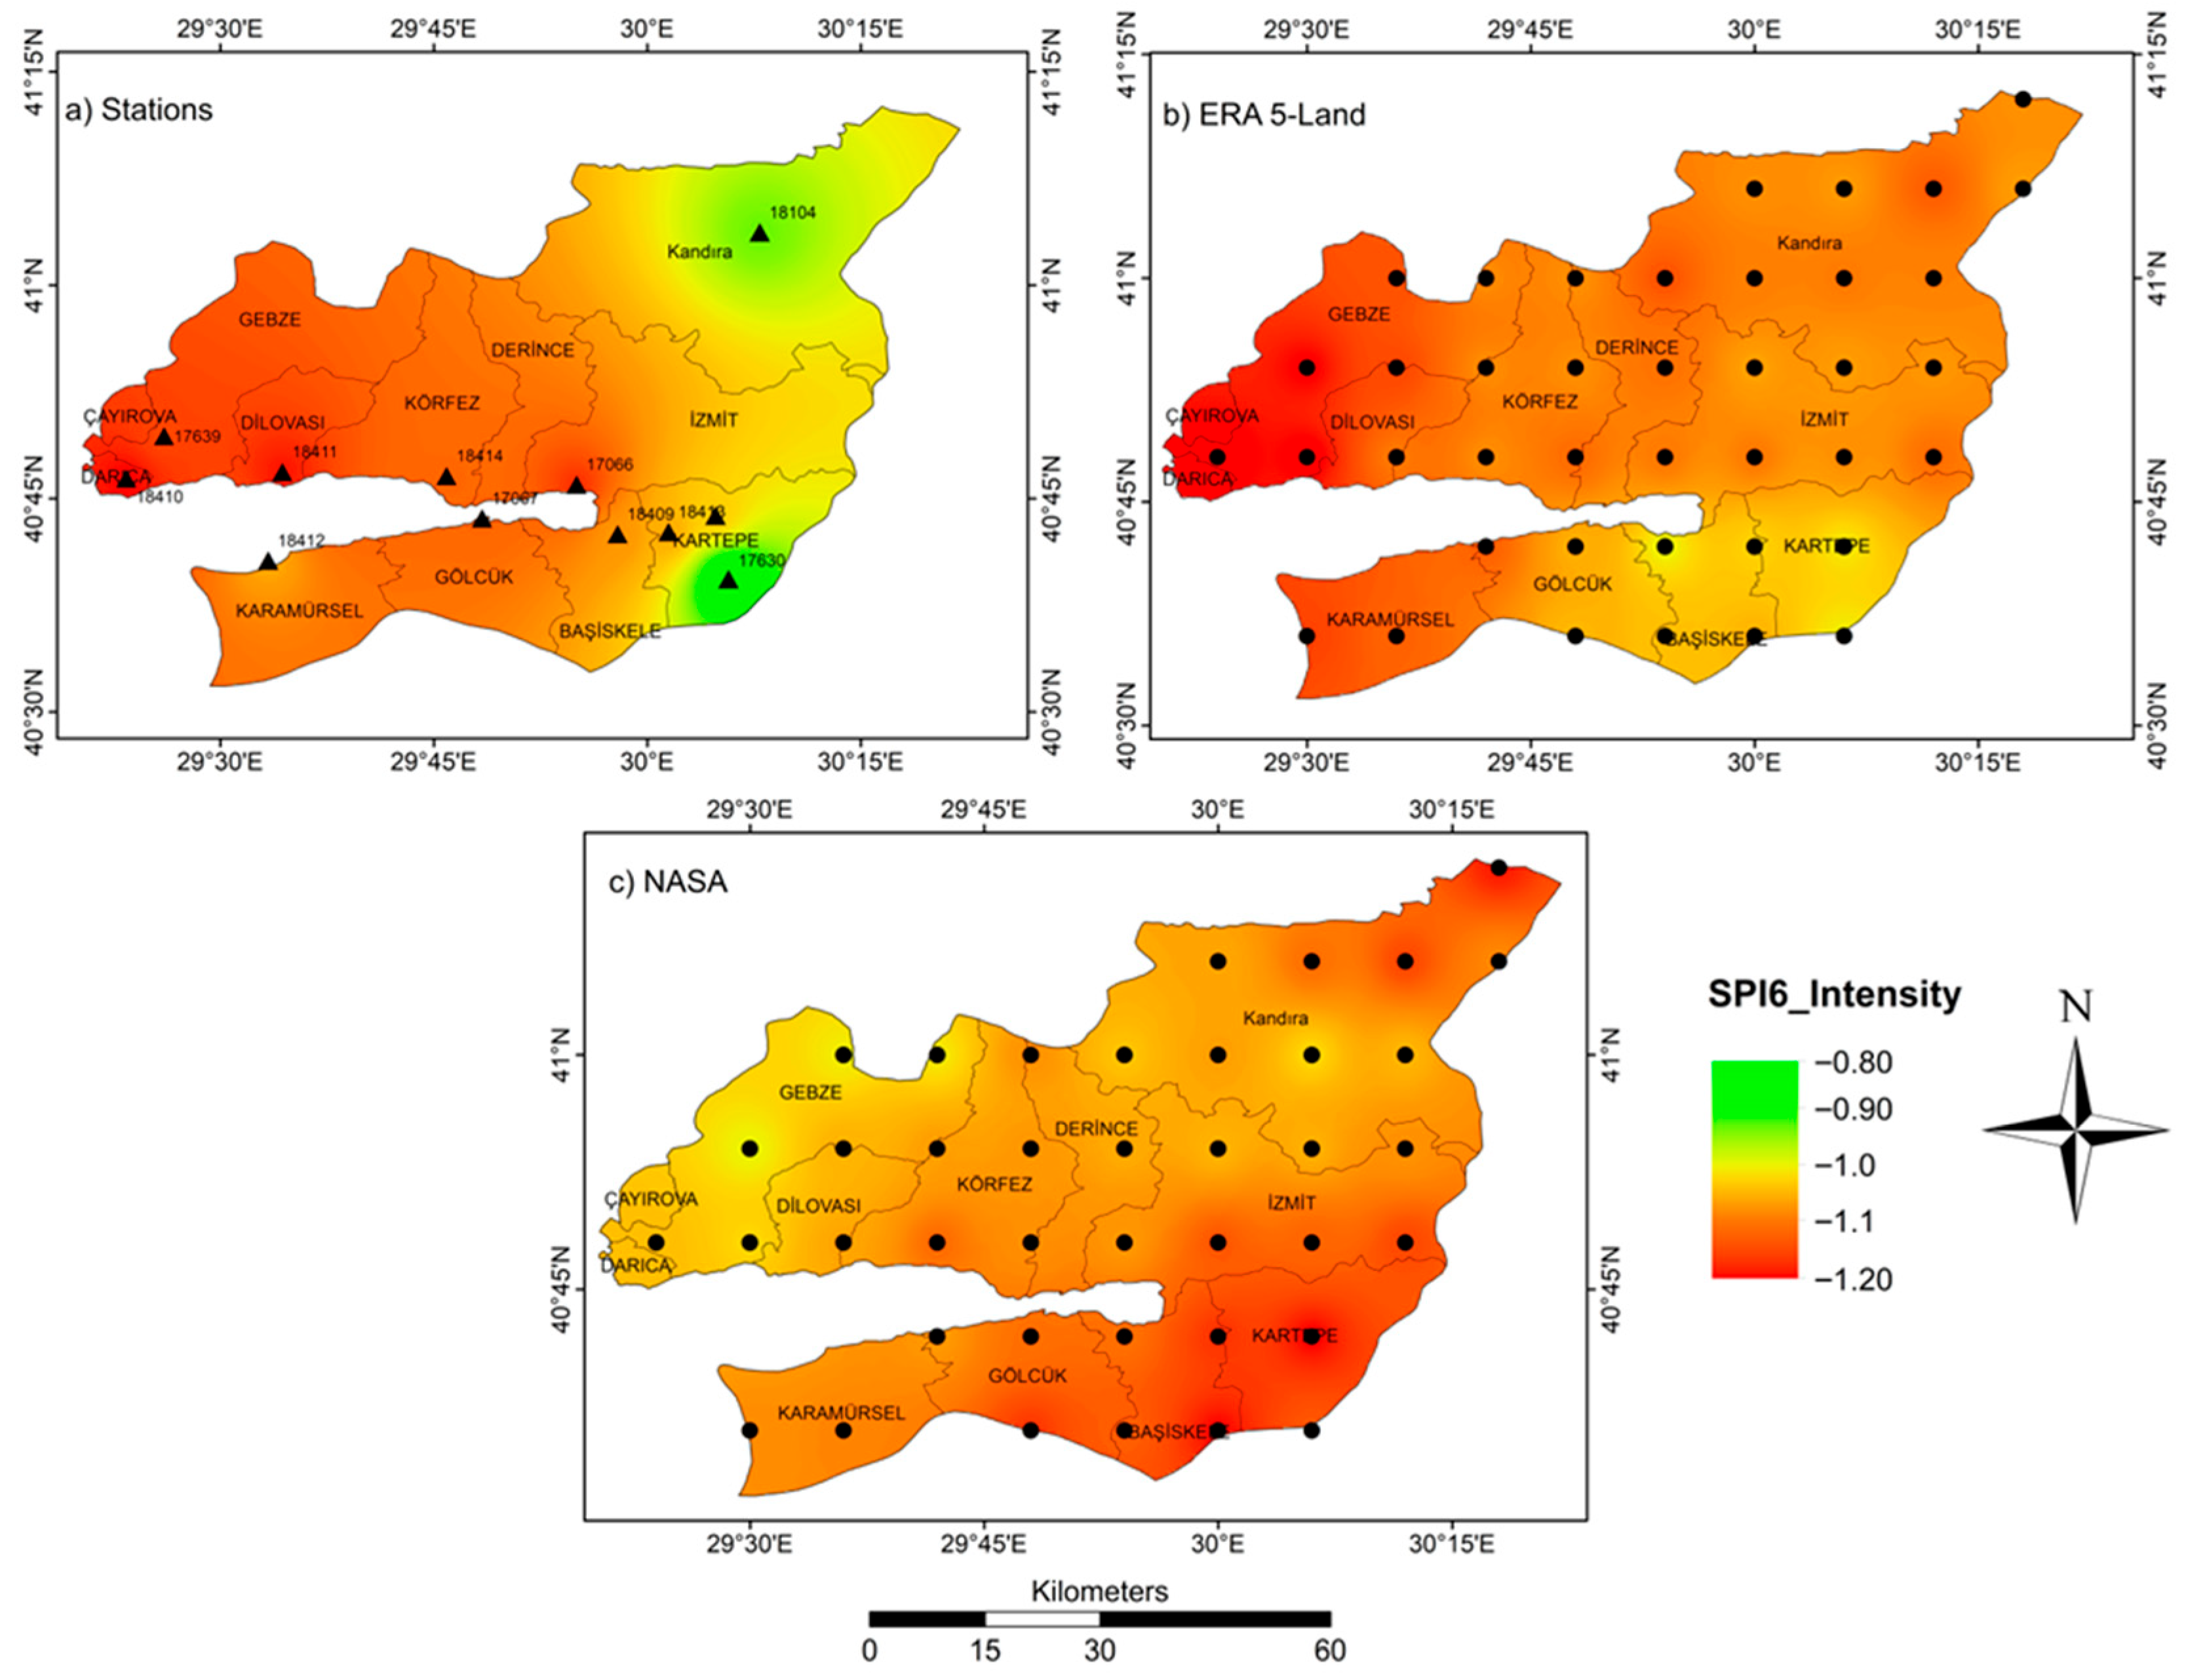
Figure 11 shows the spatial distribution of drought intensity in Kocaeli province using the SPI6, derived from three different data sources. The index reflects drought values over a longer period (six months), making it more stable compared to short-term drought indices such as SPI1 and SPI3. Figure 11a, based on ground-based station data, shows a marked variation in drought intensity between regions, with Çayırova, Gebze, and Dilovası appearing to be the most affected, with values reaching −1.2 less than short timescales. In contrast, some regions, such as Kartepe district and station 18104, showed lower drought rates, reflected in green (−0.8 to −0.9). In contrast, Figure 11b, based on ERA5-LAND data, showed a more homogeneous drought in most parts of the province, with a marked increase in drought in the western regions, especially Çayırova, Dlovası, and Karamürsel, where values reached −1.2. The minimum intensity based on ERA5-LAND was about −1.0, but −0.80 for stations. Figure 11c, based on IMERG-NASA data, showed a somewhat different pattern, with most of the province experiencing moderate drought, with values ranging from −1.0 to −1.2. These differences between the three sources underscore the need for multi-source analysis when assessing drought, as each data source can provide different insights depending on the temporal and spatial resolution of the data used.
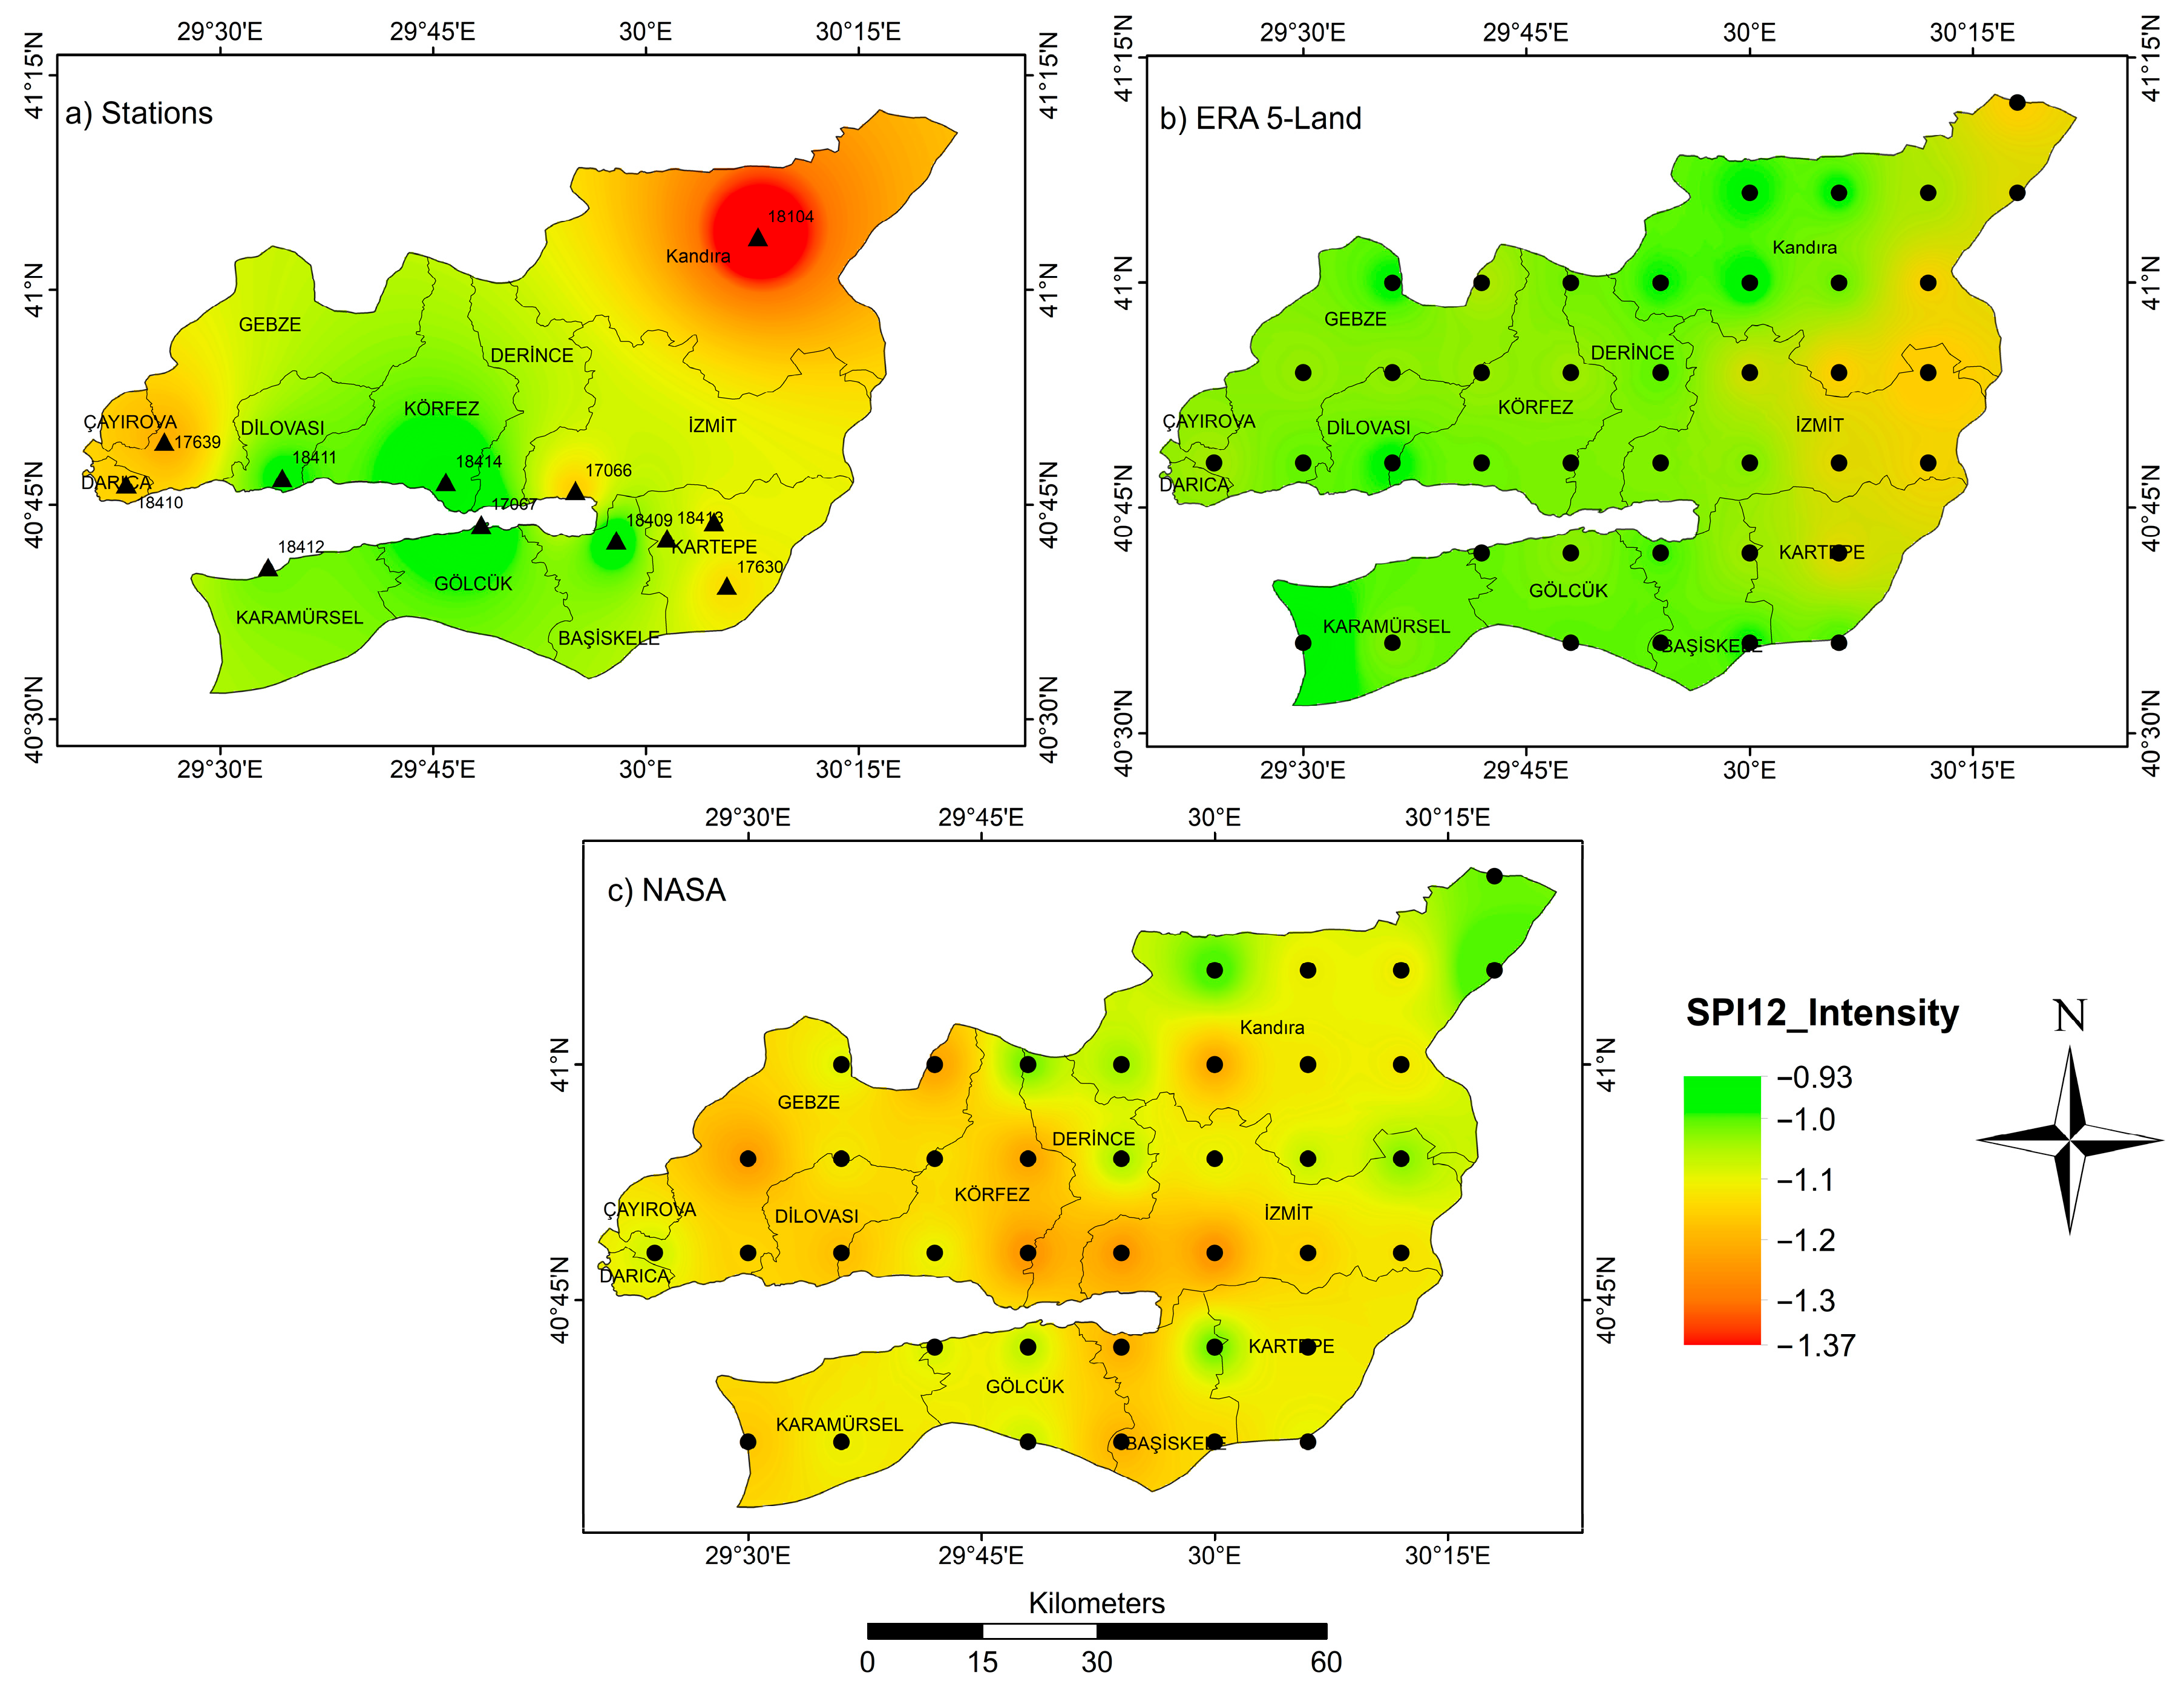
Figure 12 shows the spatial distribution of drought intensity in Kocaeli province using the SPI12, derived from three different data sources. The index reflects drought values over the longest period (12 months), making it more stable compared to short-term and medium-term drought indices such as SPI1, SPI3, and SPI6, resulting in the annual evaluation of drought and adding new perspectives. Figure 12a, based on ground-based station data, the results showed a marked variation in drought intensity between regions, with Kandıra appearing to be the most affected, with values reaching −1.37. In contrast, the coastal regions, such as Dilovası, Köfrez, Gölcük, and Karamürsel districts, showed lower drought rates, reflected in the green color (−0.93 to −1.05). In contrast, Figure 12b, based on ERA5-LAND data, showed a more homogeneous drought in most parts of the province, with a marked increase in drought in the eastern regions, especially İzmit and Kartepe, where values reached −1.1. In other regions, the drought intensity ranged between −0.93 and −1.0. Figure 12c, based on IMERG-NASA data, showed a somewhat different pattern, with most of the province experiencing moderate drought, with values ranging from −1.0 to −1.3. The coastal regions faced the most drought events, up to −1.3. Also, unlike stations and ERA5-LAND, the northeastern region showed the minimum intensity.

3.4. Drought Characteristics for a Specific Drought Event

In this research, only one observation station (17066) can be used for a comprehensive and reliable drought analysis, which is stated to be optimal by WMO [53]. When the surface area, geography, economy, population structure of Kocaeli, and the effects of drought events throughout the province are considered, it is seen that analyses and evaluations based on this single data source are insufficient. Although many stations spread throughout the province are needed to make detailed drought evaluations spatially, only five observation stations can be used for temporal drought analysis today, and their results are controversial from a literature perspective. With the increasing number of observation station data throughout the province in recent years, it is predicted that accurate evaluations on drought cannot be made with classical methods for a long period of approximately 10 years. In addition, it is difficult to say that the current observation station locations and networks throughout the province have sufficient spatial representation for spatial drought analysis and evaluations. Considering these constraints and the noticeable decreases in seasonal rainfalls due to global warming and climate change, which have also been effective in Kocaeli in recent years, makes it inevitable to use reanalysis and alternative satellite-based data sources in research, planning, projects, and applications in terms of combating drought and taking precautions. According to the analyses conducted using all relevant data sources, such as ERA5-LAND in this research, it is seen that very serious drought events have been experienced throughout the province since 1950. It is understood that the drought duration can be 37 months, drought peak values can reach −2.5 and −3 values, drought severity can exceed −40 values, and average drought intensity can reach −1.5 and above in drought events. When the drought analyses conducted are examined, one of the most important drought events in recent years throughout the province was experienced between 2013–2014. After this event, drought investments were planned for water resources, and some of these investments were completed and started to be used. In light of the analyses performed and considering the climate change projection results close to the study region in recent years [64,65], it is considered that Kocaeli will face much more severe drought risks in the future and that it should plan its investments for resistance to drought and water stress in the context of adaptation to climate change without wasting time in the light of the scientific approaches and evaluations of the age. In this context, the drought event and its characteristics that occurred in 2013–2014 were examined and evaluated spatially throughout the province in detail with the help of ERA5-Land and IMERG-NASA data sources within the scope of this research.

3.4.1. Drought Duration

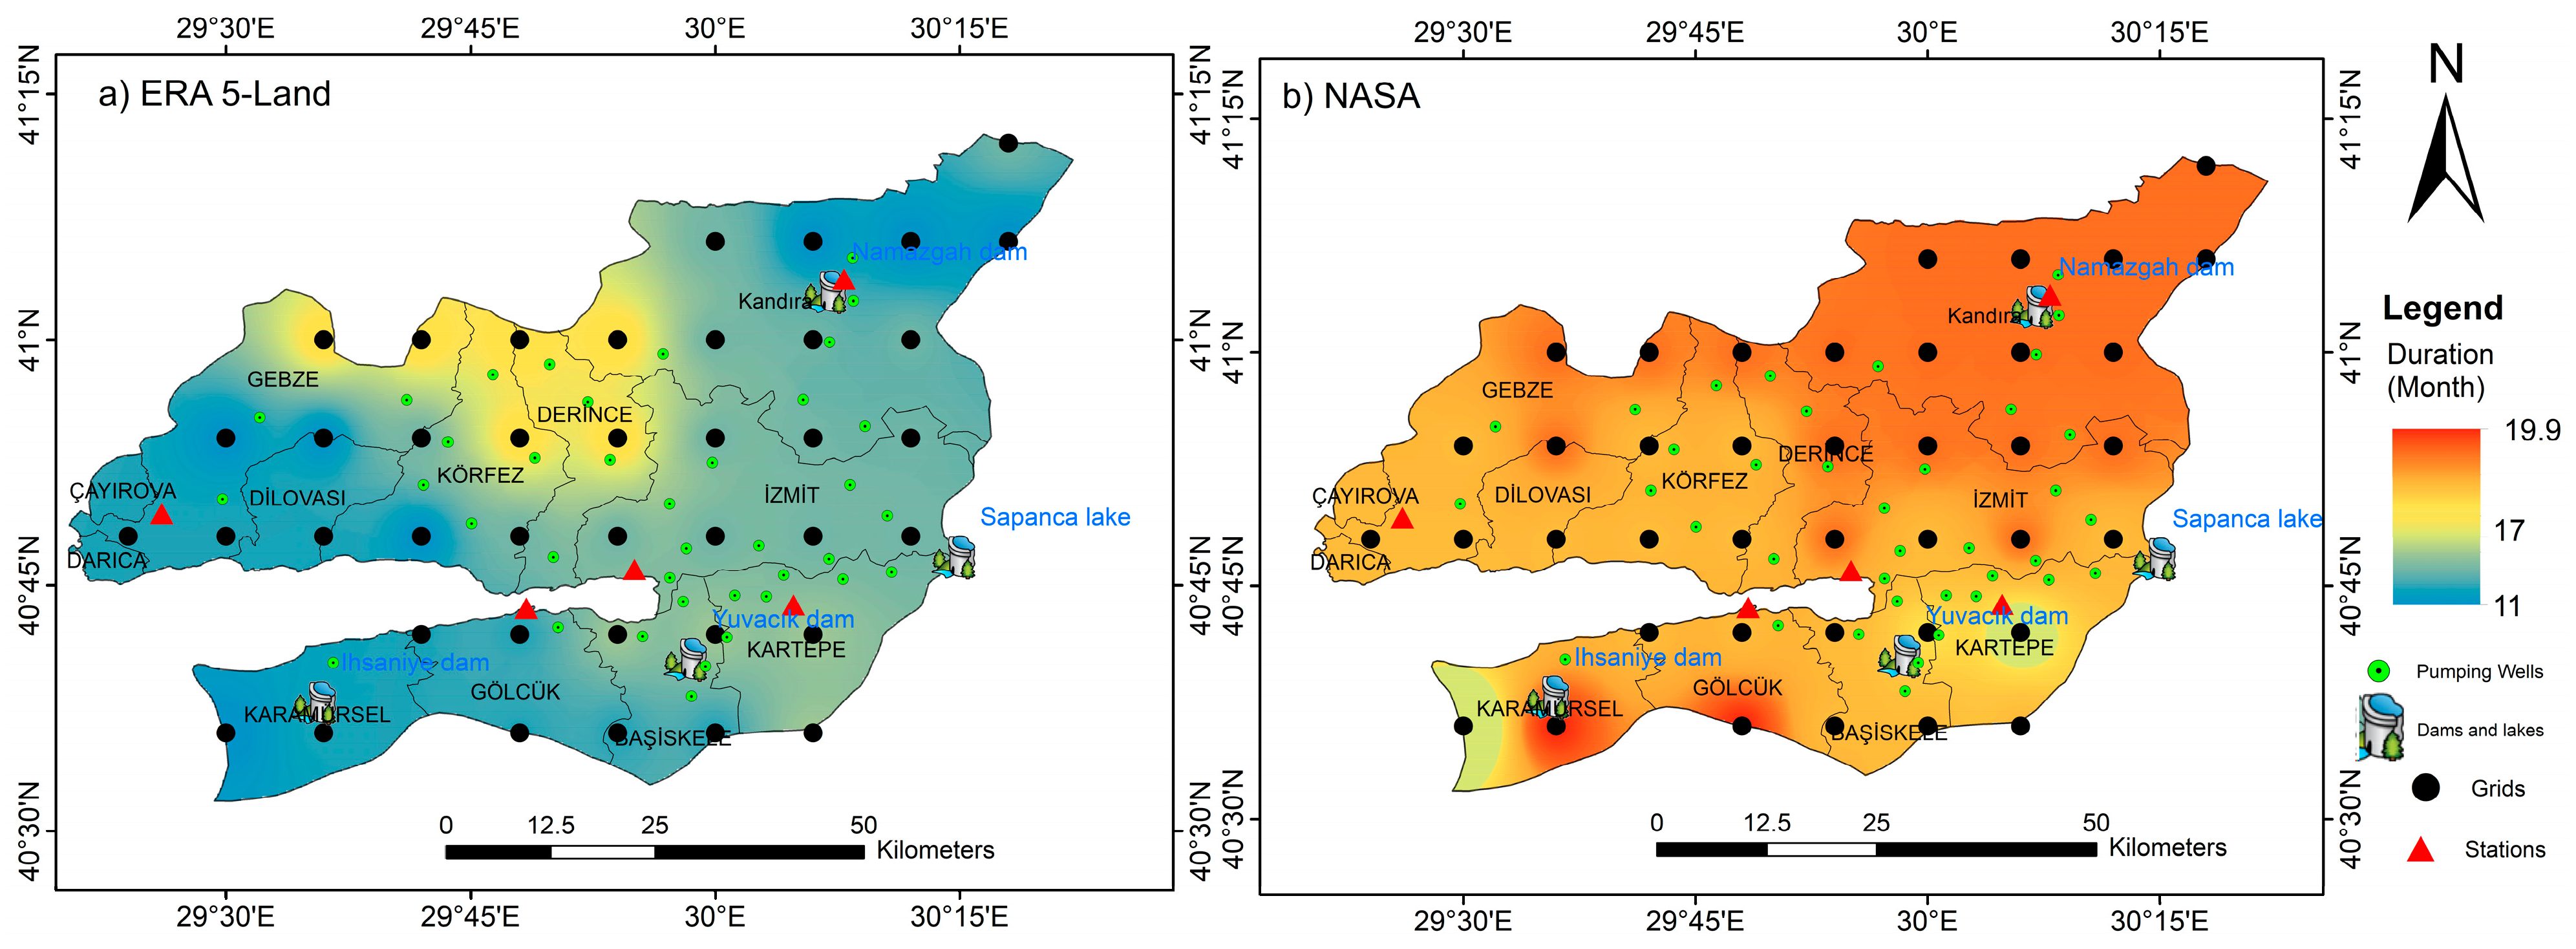
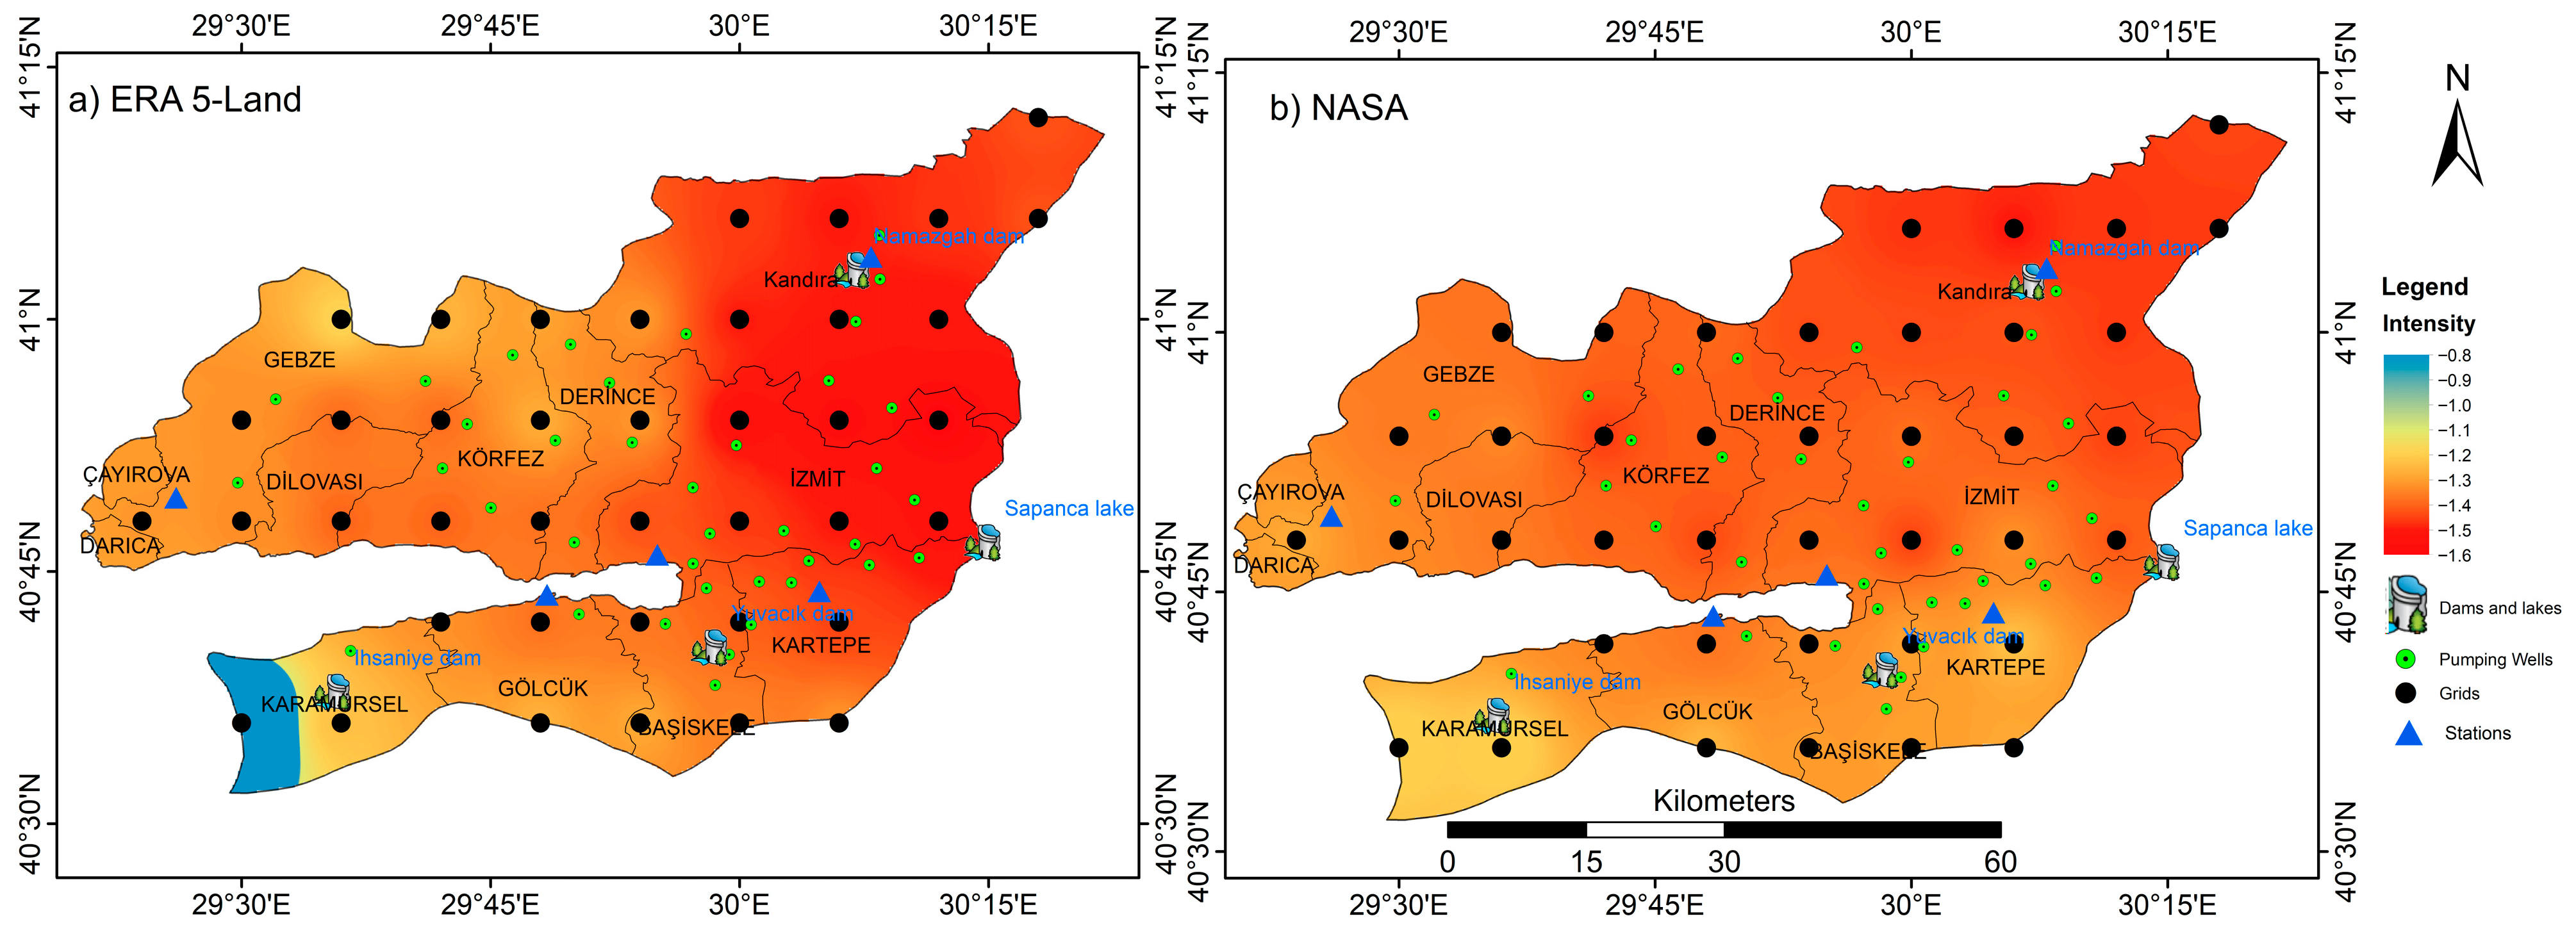
The spatial distribution of drought duration across Kocaeli Province during the severe drought event of 2012–2014 is illustrated in Figure 13. The figure presents data from two distinct sources: ERA5-LAND (Figure 13a) and IMERG-NASA (Figure 13b). Both datasets consistently indicate that the drought impacted the entire province, with noticeable variation in drought duration across districts. According to the ERA5-LAND dataset, the most prolonged drought conditions (up to ~17 months) were concentrated in the north-central parts of the province, especially around Derince. In contrast, relatively shorter durations were observed in southern and western coastal areas, including Karamürsel and Gölcük, with durations near 11 months. The IMERG-NASA product displayed a more prolonged drought duration spatial pattern. Still, it tended to show a slightly more intense and widespread distribution of prolonged droughts, particularly in the northern and central districts such as Gebze, Dilovası, Kandıra, and İzmit, where durations exceeded 19 months in several grid points. Both datasets confirmed that the drought was uniform but rather a province-wide hydrometeorological anomaly, affecting agricultural zones, urban centers, and critical water infrastructure such as dams and lakes (e.g., Namazgah Dam, Sapanca Lake, Yuvacık Dam). The consistency between ERA5-LAND and IMERG-NASA enhances the confidence in their ability to detect and analyze such events where data is scarce.
It is important to highlight that a spatial drought map based on in situ meteorological station data was not produced for this drought event. Before 2014, only five meteorological stations existed within Kocaeli Province. This limited number of observation points makes it statistically and spatially unreliable to interpolate or generate accurate drought intensity or duration maps across such a diverse terrain. Creating drought maps based solely on these sparse stations could result in misleading interpretations and hinder appropriate decision-making. This limitation underscores the critical importance and strength of utilizing satellite and reanalysis datasets such as IMERG-NASA and ERA5-LAND, which provide high-resolution, spatially consistent data across the entire region. These datasets enable comprehensive drought monitoring, especially in areas lacking dense observational networks, thereby significantly enhancing our understanding and preparedness for future drought events.

3.4.2. Drought Intensity

Figure 14 presents the drought intensity distribution across Kocaeli Province during the 2012–2014 drought event, using ERA5-LAND (Figure 14a) and IMERG-NASA (Figure 14b) data. Both datasets capture a widespread and severe drought pattern, with intensity values largely ranging between −0.8 and −1.6, signifying a prolonged and impactful hydrological anomaly over the region. The ERA5-LAND dataset highlights a concentration of stronger drought intensity across the eastern and central districts, including İzmit, Kartepe, and parts of Kandıra, where values dropped below −1.4. In contrast, milder conditions were observed in southwestern regions, such as Karamürsel, where intensity remained around −0.8 to −1.0. Similarly, IMERG-NASA data reveals a comparable spatial trend with more homogeneous drought coverage. Most areas show intensity levels between −1.1 and −1.5, indicating that even traditionally wetter regions experienced significant deficits. The spatial correlation between drought intensity and the distribution of pumping wells and water bodies is evident. Areas with intense drought overlap with high-density groundwater extraction zones and key surface water sources like Yuvacık Dam and Sapanca Lake, demonstrating increased vulnerability in supply and demand sectors. These results highlight the robustness of remote sensing datasets in capturing regional drought characteristics in areas where in situ measurements are insufficient.

4. Discussion

This study aimed to achieve several key objectives: validating the acceptable and ideal time period for drought analysis (10–20 years), assessing the performance of ERA5-LAND and IMERG-NASA monthly precipitation data for drought monitoring, and ultimately producing high-quality resolution drought characteristic maps at different timescales (short, medium, and long) using in situ data, ERA5-LAND, and IMERG-NASA-based SPI. The findings provide valuable insights into the reliability and accuracy of these datasets for drought analysis, especially in data-scarce regions.

4.1. Validation of the Acceptable Time Period

The validation of the acceptable time period proposed by Abu Arra and Şişman [29] for drought monitoring highlights that a 10-year period is sufficient with acceptable accuracy for reliable drought analysis and agrees with the results obtained by the acceptable time period. This result is consistent across various SPI timescales (SPI1, SPI3, SPI6, and SPI12). Shorter periods of less than 10 years produced less stable and inconsistent results. This finding is particularly important for regions with limited historical data [41], where researchers can confidently use a 10–20-year dataset for effective drought analysis without compromising accuracy. Moreover, this time range balances computational efficiency and data representativeness. Also, for short timescales, such as 1 and 3 months, the results were better than medium and long timescales. This can be attributed to the fact that for long scales, such as 12 months, the amount of data is less, and there is a need for longer periods.

4.2. Performance of ERA5-LAND and IMERG-NASA Data

The performance evaluation of ERA5-LAND and IMERG-NASA precipitation data revealed varying levels of agreement with in situ observations. In the existing literature, the performance of these two data sources was evaluated in terms of precipitation and extreme climate indices without considering the drought studies. For example, Ramadhan et al. [66] validated the IMERG product version 6 using gauge data from 2016 to 2020 over the Indonesian Maritime Continent from hourly, daily, monthly, and annual data. There was a strong correlation between the rain gauge and the IMERG-NASA yearly and monthly data, with mean CCs of roughly 0.54–0.78 and 0.62–0.79, respectively. Agreeing with our results with CC of 0.55 to 0.87. Alsumaiti et al. [67] also evaluated the performance of IMERG precipitation data over the United Arab Emirates, and the CC was about 0.7, which also agrees with this research’s results. Gomis-Cebolla et al. [68] evaluated the performance of both ERA5 and ERA5-LAND precipitation data over Spain from 1951 to 2020, and the results showed that there was a general agreement between observations and ERA5-LAND/ERA5 estimates. In general, IMERG-NASA shows a higher agreement with the station data, especially at short time periods, while the performance of ERA5-LAND is more variable, improving at long time periods but showing clear weakness at some stations at SPI3. However, there are still gaps in the accuracy of the estimates, especially with high RMSE values and low R2 in some cases, indicating the need for additional corrections, such as bias correction techniques, to ensure higher accuracy. These results provide important insight into the reliability of these data sources in drought studies, enabling researchers to choose the most appropriate source according to the nature of the study and accuracy requirements.

4.3. Drought Characteristics and High-Resolution Mapping

One of the primary outcomes of this study is producing high-quality resolution drought characteristic maps using SPI derived from in situ, ERA5-LAND, and IMERG-NASA data. These maps illustrate drought duration and intensity across different timescales and provide a comparative view of the spatial distribution of drought events. The drought duration derived from in situ meteorological stations was longer compared to that obtained from ERA5-LAND and IMERG-NASA data. This suggests that ground-based observations capture prolonged dry periods more conservatively, likely due to their localized and direct measurements of precipitation deficits and longer periods. However, the drought intensity for shorter-duration events appeared higher in ERA5-LAND and IMERG-NASA datasets. This is because drought intensity is calculated as the severity divided by duration, meaning that the intensity value becomes larger when the duration is shorter. As a result, while in situ stations provide a more conservative estimate of drought duration, satellite and reanalysis data tend to report more pronounced intensity levels for shorter events. Abu Arra et al. [69] discussed the concept of critical drought and the effects of using different time periods to calculate critical drought events and characteristics. The same concept can be applied here, considering different precipitation/input data for each drought index. This distinction indicates that station-based data may be more reliable when assessing prolonged drought conditions. In contrast, satellite and reanalysis data provide a more sensitive representation for capturing severe but short-lived droughts.
Overall, the results show a general agreement between the in situ station data and the gridded data from ERA5-LAND and IMERG-NASA regarding the spatial distribution of drought duration. However, the gridded data provide a more homogeneous picture, which may marginalize the subtle differences observed by the in situ stations. Therefore, it is recommended to use a combination of in-situ and gridded data to obtain a more comprehensive and accurate analysis of the drought phenomenon.

4.4. Importance and Implications of Satellite and Reanalysis Data in Data-Scarce Regions

The results underscore the potential of ERA5-LAND and NASA data for drought monitoring and mapping in data-scarce regions. While in situ observations remain the most accurate, their limited availability in many regions poses a significant challenge. Although new meteorological stations have been added, totaling around 12–15 in Kocaeli province, their spatial distribution across the study area remains irregular and uneven. This limitation reduces the reliability and consistency of using only in situ station data for comprehensive drought analysis, especially when aiming for regional assessments. Consequently, satellite-based and reanalysis data, such as those from ERA5-LAND and IMERG-NASA, offer significant advantages due to their continuous spatial coverage and high temporal resolution. Therefore, integrating and using satellite and reanalysis data is essential to enhance the accuracy and feasibility of drought monitoring and future climate projections, particularly in data-scarce regions.
In the case of Kocaeli Province, the absence of a spatial drought map based on in situ meteorological station data for the event under study underscores the challenges faced in data-scarce regions. Prior to 2014, there were only five meteorological stations within the province. This sparse network significantly limits the reliability of any interpolation methods used to estimate spatial drought variability and intensity across the region. As a result, drought maps generated solely from this sparse observational data may lead to misleading interpretations and, in turn, suboptimal or misguided decisions in drought response and management. This limitation highlights the critical role and growing importance of satellite-based and reanalysis datasets, particularly in regions with insufficient ground-based monitoring infrastructure.

4.5. Planning and Management of Water Resources with Practical Implications for Climate Change Adaptation

The evaluation of drought in Kocaeli Province highlights the urgent need for comprehensive and sustainable water management strategies to mitigate the increasing impacts of water scarcity. The identified targets, such as enhancing water-use efficiency, promoting the reuse of recycled water, reducing leakage, and strengthening drought-resilient infrastructure, form a critical foundation for addressing current and future drought risks. Key water sources, including the Yuvacık and Namazgah Dams, Sapanca Lake, various ponds, and over 100 groundwater wells, play a vital role in the province’s water supply, underscoring the importance of integrated resource management. In this context, developing high-resolution drought intensity and duration maps is an essential tool for decision-makers, enabling temporal and spatial analysis of drought patterns and supporting the planning of adaptive strategies such as crop pattern optimization and supply–demand balancing. These maps can support implementing and monitoring action plans, ensuring that interventions are targeted, data-driven, and aligned with climate change adaptation efforts, while remaining responsive to Kocaeli’s evolving climate and hydrological conditions.
The 2012–2014 drought significantly impacted water resources and infrastructure across Kocaeli Province. Prolonged reductions in precipitation and soil moisture led to a decline in groundwater recharge, directly affecting pumping wells; many experienced reduced yield or temporary drying. Dams and reservoirs, such as Yuvacık Dam and Namazgah Dam, faced critically low storage levels, straining their ability to meet urban and agricultural water demands. Sapanca Lake, a key surface water source for the region, also showed noticeable depletion. As water availability decreased, demand pressures intensified, particularly in industrial zones and urban centers like İzmit and Gebze, exacerbating the stress on already limited supplies. This drought event exposed the vulnerability of the region’s water infrastructure. It highlighted the urgent need for integrated water management strategies considering surface and groundwater systems under extreme climate conditions. In light of the findings, it is important to note that future research could extend the drought assessment framework to include hydrological and groundwater-based droughts, which are critical for understanding the broader impacts of prolonged precipitation deficits. Integrating ERA5-LAND and NASA precipitation datasets with groundwater and surface water observations could provide a more comprehensive evaluation of drought effects on water resources.
The use of high-resolution satellite and reanalysis datasets such as IMERG-NASA and ERA5-LAND in this study represents a significant advancement in drought monitoring and assessment, particularly in data-scarce regions like Kocaeli. By generating spatially detailed drought intensity and duration maps, the study not only overcomes the limitations of sparse in-situ meteorological networks but also provides a robust foundation for proactive water resource management. These outputs are crucial for informing timely and targeted responses to drought, which are becoming more frequent and severe under the influence of climate change. In this context, the methodology and findings presented in the article contribute directly to climate change adaptation by equipping policymakers and planners with reliable, high-resolution tools to assess vulnerability, anticipate impacts, and implement data-driven strategies for agricultural, industrial, and urban resilience. This work underscores the growing necessity of integrating satellite-based monitoring into regional adaptation frameworks to build long-term climate resilience.

5. Conclusions

This article has three main objectives, including validation of the time period for drought studies, validation of the performance of ERA5-LAND and IMERG-NASA monthly precipitation data for drought analysis compared to in-situ observations in Kocaeli Province, and producing high-quality resolution and accurate drought characteristics maps for Kocaeli City, including duration and intensity. The main key findings can be summarized as follows:
  • The results ensure that using an acceptable and ideal time period of 10–20 years for drought studies can be sufficient and provide reliable accuracy for assessing drought with high correlation (0.99), RMSE ranged between 0.09 and 0.23 standard deviation, and IDCM ranged between 85% to 97%.
  • The results confirm that while in situ data offers high accuracy at specific locations, its sparse and irregular distribution limits its use for regional-scale drought monitoring and mapping.
  • The comparative analysis of drought characteristics using SPI derived from in situ, ERA5-LAND, and IMERG-NASA data reveals that satellite and reanalysis data can capture drought events and durations across different timescales.
  • IMERG-NASA data gave more accurate drought results than ERA5-LAND. For example, the CC for IMERG-NASA data ranged between 0.57 and 0.89, and for ERA5-LAND, 0.22 (for one station at a 3-month timescale) and 0.89.
  • The drought duration derived from in situ stations was longer compared to that obtained from ERA5-LAND and NASA data. However, the drought intensity for shorter-duration events appeared higher in ERA5-LAND and NASA datasets. This is because drought intensity is calculated as the severity divided by duration, meaning that the intensity value becomes larger when the duration is shorter.
  • The resulting drought duration and intensity maps at four different timescales (1, 3, 6, and 12 months) indicate that using different data sources with different spatial and time resolution can highly affect the main results. For example, the drought duration and intensity maps differed among in situ, ERA5-LAND, and NASA-based SPI. For example, the duration of in situ-based SPI1 maps was up to 4.9 months, and for satellite and reanalysis data, it was up to 4.3 months and the intensity for SPI6, the intensity for insitu station ranged between −0.8 and −1.2, but for ERA5-LAND and IMERG-NASA, data ranged between −1.0 and −1.2.
  • The drought analysis results of the ERA5-LAND data source showed that Kocaeli will face extreme drought risks much higher than the most severe drought event of recent years experienced in 2013–2014, and therefore, it is recommended that adaptation actions be implemented urgently for a resilient city, taking into account the effects of climate change.
  • The proposed framework and process empower policymakers and decision-makers to effectively manage and plan water resources within the city boundaries, supporting sustainable agricultural, economic, and industrial activities, while also enhancing resilience through climate change adaptation strategies.

Author Contributions

Conceptualization, A.A.A. and E.Ş.; methodology, A.A.A. and E.Ş.; validation, M.E.B. and E.Ş.; formal analysis, A.A.A. and E.Ş.; investigation, A.A.A. and E.Ş.; resources, M.E.B. and E.Ş.; data curation, A.A.A. and E.Ş.; writing—original draft preparation, A.A.A. and E.Ş.; writing—review and editing, M.E.B. and E.Ş.; visualization, A.A.A. and E.Ş.; supervision, E.Ş.; project administration, E.Ş.; funding acquisition, E.Ş. All authors have read and agreed to the published version of the manuscript.

Funding

This research was funded by the Scientific Research Projects (BAP) Coordination Unit of Yildiz Technical University (Project ID: 6492, Project code: FBA-2024-6492).

Institutional Review Board Statement

Not applicable.

Informed Consent Statement

Not applicable.

Data Availability Statement

All data that support this study’s findings are available from the corresponding author upon reasonable request. The precipitation data are available at: https://cds.climate.copernicus.eu/ (accessed on 25 December 2024); https://gpm.nasa.gov/data/imerg (accessed on 25 December 2024).

Acknowledgments

We would like to thank the Scientific Research Projects (BAP) Coordination Unit of Yildiz Technical University (Project ID: 6492, Project code: FBA-2024-6492) for the support of the project. We would also like to thank the experts for sharing their wisdom with us during this research. The authors would like to acknowledge that this paper is submitted in partial fulfillment of the requirements for the PhD degree at Yildiz Technical University.

Conflicts of Interest

The authors declare no conflicts of interest.

References

  1. Arra, A.A.; Alashan, S.; Şişman, E. Trends of meteorological and hydrological droughts and associated parameters using innovative approaches. J. Hydrol. 2024, 640, 131661. [Google Scholar] [CrossRef]
  2. Habibi, B.; Meddi, M.; Emre, T.; Boucefiane, A.; Rahmouni, A. Drought assessment and characterization using SPI, EDI and DEPI indices in northern Algeria. Nat. Hazards 2024, 120, 5201–5231. [Google Scholar] [CrossRef]
  3. Van Loon, A.F.; Rangecroft, S.; Coxon, G.; Werner, M.; Wanders, N.; Di Baldassarre, G.; Tijdeman, E.; Bosman, M.; Gleeson, T.; Nauditt, A.; et al. Streamflow droughts aggravated by human activities despite management. Environ. Res. Lett. 2022, 17, 044059. [Google Scholar] [CrossRef]
  4. Awolala, D.; Mutemi, J.; Adefisan, E.; Antwi-Agyei, P.; Taylor, A.; Muita, R.; Bosire, E.; Mutai, B.; Nkiaka, E. Economic value and latent demand for agricultural drought forecast: Emerging market for weather and climate information in Central-Southern Nigeria. Clim. Risk Manag. 2023, 39, 100478. [Google Scholar] [CrossRef]
  5. Waseem, M.; Jaffry, A.H.; Azam, M.; Ahmad, I.; Abbas, A.; Lee, J.E. Spatiotemporal analysis of drought and agriculture standardized residual yield series nexuses across Punjab, Pakistan. Water 2022, 14, 496. [Google Scholar] [CrossRef]
  6. Du, C.; Chen, J.; Nie, T.; Dai, C. Spatial–temporal changes in meteorological and agricultural droughts in Northeast China: Change patterns, response relationships and causes. Nat. Hazards 2022, 110, 155–173. [Google Scholar] [CrossRef]
  7. UNESCO UN-Water. United Nations World Water Development Report 2020: Water and Climate Change; UNESCO: Paris, France, 2020. [Google Scholar]
  8. World Economic Forum. This Is What Climate Change Costs Economies around the World. In Proceedings of the World Economic Forum, Davos, Switzerland, 16–20 January 2023; Available online: www.weforum.org (accessed on 25 March 2024).
  9. Sahoo, A.K.; Sheffield, J.; Pan, M.; Wood, E.F. Evaluation of the tropical rainfall measuring mission multi-satellite precipitation analysis (TMPA) for assessment of large-scale meteorological drought. Remote Sens. Environ. 2015, 159, 181–193. [Google Scholar] [CrossRef]
  10. Bayissa, Y.; Tadesse, T.; Demisse, G.; Shiferaw, A. Evaluation of satellite-based rainfall estimates and application to monitor meteorological drought for the Upper Blue Nile Basin, Ethiopia. Remote Sens. 2017, 9, 669. [Google Scholar] [CrossRef]
  11. Mishra, A.K.; Singh, V.P. A review of drought concepts. J. Hydrol. 2010, 391, 202–216. [Google Scholar] [CrossRef]
  12. Lu, Y.; Dai, L.; Yan, G.; Huo, Z.; Chen, W.; Lan, J.; Zhang, C.; Xu, Q.; Deng, S.; Chen, J. Effects of various land utilization types on groundwater at different temporal scales: A case study of Huocheng plain, Xinjiang, China. Front. Environ. Sci. 2023, 11, 1225916. [Google Scholar] [CrossRef]
  13. Abu Arra, A.; Şişman, E. New Insights into Meteorological and Hydrological Drought Modeling: A Comparative Analysis of Parametric and Non-Parametric Distributions. Atmosphere 2025, 16, 846. [Google Scholar] [CrossRef]
  14. McKee, T.B.; Doesken, N.J.; Kleist, J. The relationship of drought frequency and duration to time scales. In Proceedings of the 8th Conference on Applied Climatology, Anaheim, CA, USA, 17–22 January 1993; Volume 17, pp. 179–183. [Google Scholar]
  15. Vicente-Serrano, S.M.; Beguería, S.; López-Moreno, J.I. A multiscalar drought index sensitive to global warming: The standardized precipitation evapotranspiration index. J. Clim. 2010, 23, 1696–1718. [Google Scholar] [CrossRef]
  16. Mishra, A.K.; Singh, V.P. Drought modeling—A review. J. Hydrol. 2011, 403, 157–175. [Google Scholar] [CrossRef]
  17. Nalbantis, I.; Tsakiris, G. Assessment of hydrological drought revisited. Water Resour. Manag. 2009, 23, 881–897. [Google Scholar] [CrossRef]
  18. Hasan, N.A.; Dongkai, Y.; Al-Shibli, F. SPI and SPEI drought assessment and prediction using TBATS and ARIMA models, Jordan. Water 2023, 15, 3598. [Google Scholar] [CrossRef]
  19. Abu Arra, A.; Şişman, E. A comprehensive analysis and comparison of SPI and SPEI for spatiotemporal drought evaluation. Environ. Monit. Assess. 2024, 196, 980. [Google Scholar] [CrossRef]
  20. Mousavi, R.; Johnson, D.; Kroebel, R.; Byrne, J. Analysis of historical drought conditions based on SPI and SPEI at various timescales in the South Saskatchewan River Watershed, Alberta, Canada. Theor. Appl. Climatol. 2023, 153, 873–887. [Google Scholar] [CrossRef]
  21. Taylan, E.D. An Approach for Future Droughts in Northwest Türkiye: SPI and LSTM Methods. Sustainability 2024, 16, 6905. [Google Scholar] [CrossRef]
  22. Abu Arra, A.; Alashan, S.; Şişman, E. A new framework for innovative trend analysis: Integrating extreme precipitation indices, standardization, enhanced visualization, and novel classification approaches (ITA-NF). Nat. Hazards 2025, 12, 1–33. [Google Scholar] [CrossRef]
  23. Alsafadi, K.; Bashir, B.; Mohammed, S.; Abdo, H.G.; Mokhtar, A.; Alsalman, A.; Cao, W. Response of Ecosystem Carbon–Water Fluxes to Extreme Drought in West Asia. Remote Sens. 2024, 16, 1179. [Google Scholar] [CrossRef]
  24. Zhu, G.; Liu, Y.; Wang, L.; Sang, L.; Zhao, K.; Zhang, Z.; Lin, X.; Qiu, D. The isotopes of precipitation have climate change signal in arid Central Asia. Glob. Planet. Change 2023, 225, 104103. [Google Scholar] [CrossRef]
  25. Farhani, N.; Carreau, J.; Kassouk, Z.; Le Page, M.; Lili Chabaane, Z.; Boulet, G. Analysis of multispectral drought indices in Central Tunisia. Remote Sens. 2022, 14, 1813. [Google Scholar] [CrossRef]
  26. Souza, R.D.A.D.; Moura, V.; Paloschi, R.A.; Aguiar, R.G.; Webler, A.D.; Borma, L.D.S. Assessing drought response in the Southwestern Amazon forest by remote sensing and in situ measurements. Remote Sens. 2022, 14, 1733. [Google Scholar] [CrossRef]
  27. Houmma, I.H.; Hadri, A.; Boudhar, A.; Karaoui, I.; Oussaoui, S.; El Khalki, E.M.; Chehbouni, A.; Kinnard, C. Analysis of the Propagation Characteristics of Meteorological Drought to Hydrological Drought and Their Joint Effects on Low-Flow Drought Variability in the Oum Er Rbia Watershed, Morocco. Remote Sens. 2025, 17, 281. [Google Scholar] [CrossRef]
  28. Sun, Q.; Miao, C.; Duan, Q.; Ashouri, H.; Sorooshian, S.; Hsu, K.L. A Review of Global Precipitation Data Sets: Data Sources, Estimation, and Intercomparisons. Rev. Geophys. 2018, 56, 79–107. [Google Scholar] [CrossRef]
  29. Abu Arra, A.; Şişman, E. Innovative Drought Classification Matrix and Acceptable Time Period. for Temporal Drought Evaluation. Water Resour. Manag. 2024, 29, 2811–2833. [Google Scholar] [CrossRef]
  30. Wu, X.; Su, J.; Ren, W.; Lü, H.; Yuan, F. Statistical comparison and hydrological utility evaluation of ERA5-LAND and IMERG precipitation products on the Tibetan Plateau. J. Hydrol. 2023, 620, 129384. [Google Scholar] [CrossRef]
  31. Wałęga, A.; Cebulska, M.; Ziernicka-Wojtaszek, A.; Młocek, W.; Wałęga, A.; Nieróbca, A.; Caloiero, T. Spatial and temporal variability of meteorological droughts including atmospheric circulation in Central Europe. J. Hydrol. 2024, 642, 131857. [Google Scholar] [CrossRef]
  32. Liu, Z.; Xu, J.; Liu, M.; Yin, Z.; Liu, X.; Yin, L.; Zheng, W. Remote sensing and geostatistics in urban water-resource monitoring: A review. Mar. Freshw. Res. 2023, 74, 747–765. [Google Scholar] [CrossRef]
  33. Erhardt, R.; Di Vittorio, C.A.; Hepler, S.A.; Lowman, L.E.L.; Wei, W. Homogenized gridded dataset for drought and hydrometeorological modeling for the continental United States. Sci. Data 2024, 11, 375. [Google Scholar] [CrossRef]
  34. Eitzinger, J.; Daneu, V.; Kubu, G.; Thaler, S.; Trnka, M.; Schaumberger, A.; Schneider, S.; Tran, T.M.A. Grid based monitoring and forecasting system of cropping conditions and risks by agrometeorological indicators in Austria–Agricultural Risk Information System ARIS. Clim. Serv. 2024, 34, 100478. [Google Scholar] [CrossRef]
  35. Silva, E.H.D.L.; Silva, F.D.D.S.; Junior, R.S.D.S.; Pinto, D.D.C.; Costa, R.L.; Gomes, H.B.; Cabral, J.B., Jr.; de Freitas, I.G.F.; Herdies, D.L. Performance assessment of different precipitation databases (Gridded analyses and reanalyses) for the new Brazilian agricultural frontier: SEALBA. Water 2022, 14, 1473. [Google Scholar] [CrossRef]
  36. Hou, A.Y.; Kakar, R.K.; Neeck, S.; Azarbarzin, A.A.; Kummerow, C.D.; Kojima, M.; Oki, R.; Nakamura, K.; Iguchi, T. The global precipitation measurement mission. Bull. Am. Meteorol. Soc. 2014, 95, 701–722. [Google Scholar] [CrossRef]
  37. Joyce, R.J.; Janowiak, J.E.; Arkin, P.A.; Xie, P. CMORPH: A method that produces global precipitation estimates from passive microwave and infrared data at high spatial and temporal resolution. J. Hydrometeorol. 2004, 5, 487–503. [Google Scholar] [CrossRef]
  38. Funk, C.; Peterson, P.; Landsfeld, M.; Pedreros, D.; Verdin, J.; Shukla, S.; Husak, G.; Rowland, J.; Harrison, L.; Hoell, A.; et al. The climate hazards infrared precipitation with stations—A new environmental record for monitoring extremes. Sci. Data 2015, 2, 1–21. [Google Scholar] [CrossRef]
  39. Huffman, G.J.; Bolvin, D.T.; Braithwaite, D.; Hsu, K.; Joyce, R.; Xie, P.; Yoo, S.H. NASA global precipitation measurement (GPM) integrated multi-satellite retrievals for GPM (IMERG). Algorithm Theor. Basis Doc. (ATBD) Version 2015, 4, 30. [Google Scholar]
  40. Jiang, S.; Ren, L.; Xu, C.Y.; Yong, B.; Yuan, F.; Liu, Y.; Yang, X.; Zeng, X. Statistical and hydrological evaluation of the latest Integrated Multi-satellitE Retrievals for GPM (IMERG) over a midlatitude humid basin in South China. Atmos. Res. 2018, 214, 418–429. [Google Scholar] [CrossRef]
  41. Muñoz-Sabater, J.; Dutra, E.; Agustí-Panareda, A.; Albergel, C.; Arduini, G.; Balsamo, G.; Boussetta, S.; Choulga, M.; Harrigan, S.; Hersbach, H.; et al. ERA5-LAND: A state-of-the-art global reanalysis dataset for land applications. Earth Syst. Sci. Data 2021, 13, 4349–4383. [Google Scholar] [CrossRef]
  42. Steinkopf, J.; Engelbrecht, F. Verification, of ERA5 and ERA-Interim precipitation over Africa at intra-annual and interannual timescales. Atmos. Res. 2022, 280, 106427. [Google Scholar] [CrossRef]
  43. Xu, J.; Ma, Z.; Yan, S.; Peng, J. Do ERA5 and ERA5-LAND precipitation estimates outperform satellite-based precipitation products? A comprehensive comparison between state-of-the-art model-based and satellite-based precipitation products over mainland China. J. Hydrol. 2022, 605, 127353. [Google Scholar] [CrossRef]
  44. Xin, Y.; Lu, N.; Jiang, H.; Liu, Y.; Yao, L. Performance of ERA5 reanalysis precipitation products in the Guangdong-Hong Kong-Macao greater bay area, China. J. Hydrol. 2021, 602, 126791. [Google Scholar] [CrossRef]
  45. Tan, M.L.; Armanuos, A.M.; Ahmadianfar, I.; Demir, V.; Heddam, S.; Al-Areeq, A.M.; Abba, S.I.; Halder, B.; Kilinc, H.C.; Yaseen, Z.M. Evaluation of NASA POWER and ERA5-LAND for estimating tropical precipitation and temperature extremes. J. Hydrol. 2023, 624, 129940. [Google Scholar] [CrossRef]
  46. Katsanos, D.; Retalis, A.; Kalogiros, J.; Psiloglou, B.E.; Roukounakis, N.; Anagnostou, M. Performance Evaluation of Satellite Precipitation Products During Extreme Events—The Case of the Medicane Daniel in Thessaly, Greece. Remote Sens. 2024, 16, 4216. [Google Scholar] [CrossRef]
  47. Xin, Y.; Yang, Y.; Chen, X.; Yue, X.; Liu, Y.; Yin, C. Evaluation of IMERG and ERA5 precipitation products over the Mongolian Plateau. Sci. Rep. 2022, 12, 21776. [Google Scholar] [CrossRef]
  48. Yilmaz, M. Accuracy assessment of temperature trends from ERA5 and ERA5-LAND. Sci. Total Environ. 2023, 856, 159182. [Google Scholar] [CrossRef] [PubMed]
  49. Yuan, Y.; Liao, B. Evaluation of multi-source precipitation products for monitoring drought across China. Front. Environ. Sci. 2025, 13, 1524937. [Google Scholar] [CrossRef]
  50. Shangguan, W.; Zhang, R.; Li, L.; Zhang, S.; Zhang, Y.; Huang, F.; Li, J.; Liu, W. Assessment of agricultural drought based on reanalysis soil moisture in Southern China. Land 2022, 11, 502. [Google Scholar] [CrossRef]
  51. Zargar, M.; Bronstert, A.; Francke, T.; Zimale, F.A.; Worku, K.B.; Wiegels, R.; Lorenz, C.; Hageltom, Y.; Sawadogo, W.; Kunstmann, H. Comparison and hydrological evaluation of different precipitation data for a large tropical region: The Blue Nile Basin in Ethiopia. Front. Water 2025, 7, 1536881. [Google Scholar] [CrossRef]
  52. Zhang, R.; Li, L.; Zhang, Y.; Huang, F.; Li, J.; Liu, W.; Mao, T.; Xiong, Z.; Shangguan, W. Assessment of agricultural drought using soil water deficit index based on ERA5-LAND soil moisture data in four southern provinces of China. Agriculture 2021, 11, 411. [Google Scholar] [CrossRef]
  53. Svoboda, M.; Hayes, M.; Wood, D. Standardized Precipitation Index User Guide; World Meteorological Organization: Geneva, Switzerland, 2012. [Google Scholar]
  54. Huffman, G.J.; Bolvin, D.T.; Braithwaite, D.; Hsu, K.L.; Joyce, R.J.; Kidd, C.; Nelkin, E.J.; Sorooshian, S.; Stocker, E.F.; Tan, J.; et al. Integrated multi-satellite retrievals for the global precipitation measurement (GPM) mission (IMERG). Satell. Precip. Meas. 2020, 1, 343–353. [Google Scholar]
  55. Stephens, M.A. Use of the Kolmogorov–Smirnov, Cramer–Von Mises and related statistics without extensive tables. J. R. Stat. Soc. Ser. B Stat. Methodol. 1970, 32, 115–122. [Google Scholar] [CrossRef]
  56. Şen, Z.; Şişman, E. Probabilistic standardization index adjustment for standardized precipitation index (SPI). Theor. Appl. Climatol. 2024, 155, 2747–2756. [Google Scholar] [CrossRef]
  57. Wang, H.; Chen, Y.; Pan, Y.; Chen, Z.; Ren, Z. Assessment of candidate distributions for SPI/SPEI and sensitivity of drought to climatic variables in China. Int. J. Climatol. 2019, 39, 4392–4412. [Google Scholar] [CrossRef]
  58. Şen, Z.; Şişman, E.; Kızılöz, B. A new innovative method for model efficiency performance. Water Supply 2022, 22, 589–601. [Google Scholar] [CrossRef]
  59. Moriasi, D.N.; Arnold, J.G.; Van Liew, M.W.; Bingner, R.L.; Harmel, R.D.; Veith, T.L. Model evaluation guidelines for systematic quantification of accuracy in watershed simulations. Trans. ASABE 2007, 50, 885–900. [Google Scholar] [CrossRef]
  60. Yevjevich, V.M. Objective approach to definitions and investigations of continental hydrologic droughts. Doctoral Dissertation, Colorado State University, Fort Collins, CO, USA, 1967. [Google Scholar]
  61. Abu Arra, A.; Şişman, E. Characteristics of hydrological and meteorological drought based on intensity-duration-frequency (IDF) curves. Water 2023, 15, 3142. [Google Scholar] [CrossRef]
  62. Philip, G.M.; Watson, D.F. A Precise Method for Determining Contoured Surfaces. Aust. Pet. Explor. Assoc. J. 1982, 22, 205–212. [Google Scholar] [CrossRef]
  63. Abu Arra, A.; Şişman, E.; Birpınar, M.E. What is the best spatial interpolation technique for evaluating droughts? Intercont. Geoinf. Days 2023, 6, 278–281. [Google Scholar]
  64. Isinkaralar, O. Bioclimatic comfort in urban planning and modeling spatial change during 2020–2100 according to climate change scenarios in Kocaeli, Türkiye. Int. J. Environ. Sci. Technol. 2023, 20, 7775–7786. [Google Scholar] [CrossRef]
  65. Şan, M.; Nacar, S.; Kankal, M.; Bayram, A. Spatiotemporal analysis of transition probabilities of wet and dry days under SSPs scenarios in the semi-arid Susurluk Basin, Türkiye. Sci. Total Environ. 2024, 912, 168641. [Google Scholar] [CrossRef]
  66. Ramadhan, R.; Yusnaini, H.; Marzuki, M.; Muharsyah, R.; Suryanto, W.; Sholihun, S.; Vonnisa, M.; Harmadi, H.; Ningsih, A.P.; Battaglia, A.; et al. Evaluation of GPM IMERG performance using gauge data over Indonesian maritime continent at different time scales. Remote Sens. 2022, 14, 1172. [Google Scholar] [CrossRef]
  67. Alsumaiti, T.S.; Hussein, K.; Ghebreyesus, D.T.; Sharif, H.O. Performance of the CMORPH and GPM IMERG Products over the United Arab Emirates. Remote Sens. 2020, 12, 1426. [Google Scholar] [CrossRef]
  68. Gomis-Cebolla, J.; Rattayova, V.; Salazar-Galán, S.; Francés, F. Evaluation of ERA5 and ERA5-LAND reanalysis precipitation datasets over Spain (1951–2020). Atmos. Res. 2023, 284, 106606. [Google Scholar] [CrossRef]
  69. Abu Arra, A.; Birpınar, M.E.; Gazioğlu, Ş.A.; Şişman, E. Critical drought characteristics: A new concept based on dynamic time period scenarios. Atmosphere 2024, 15, 768. [Google Scholar] [CrossRef]
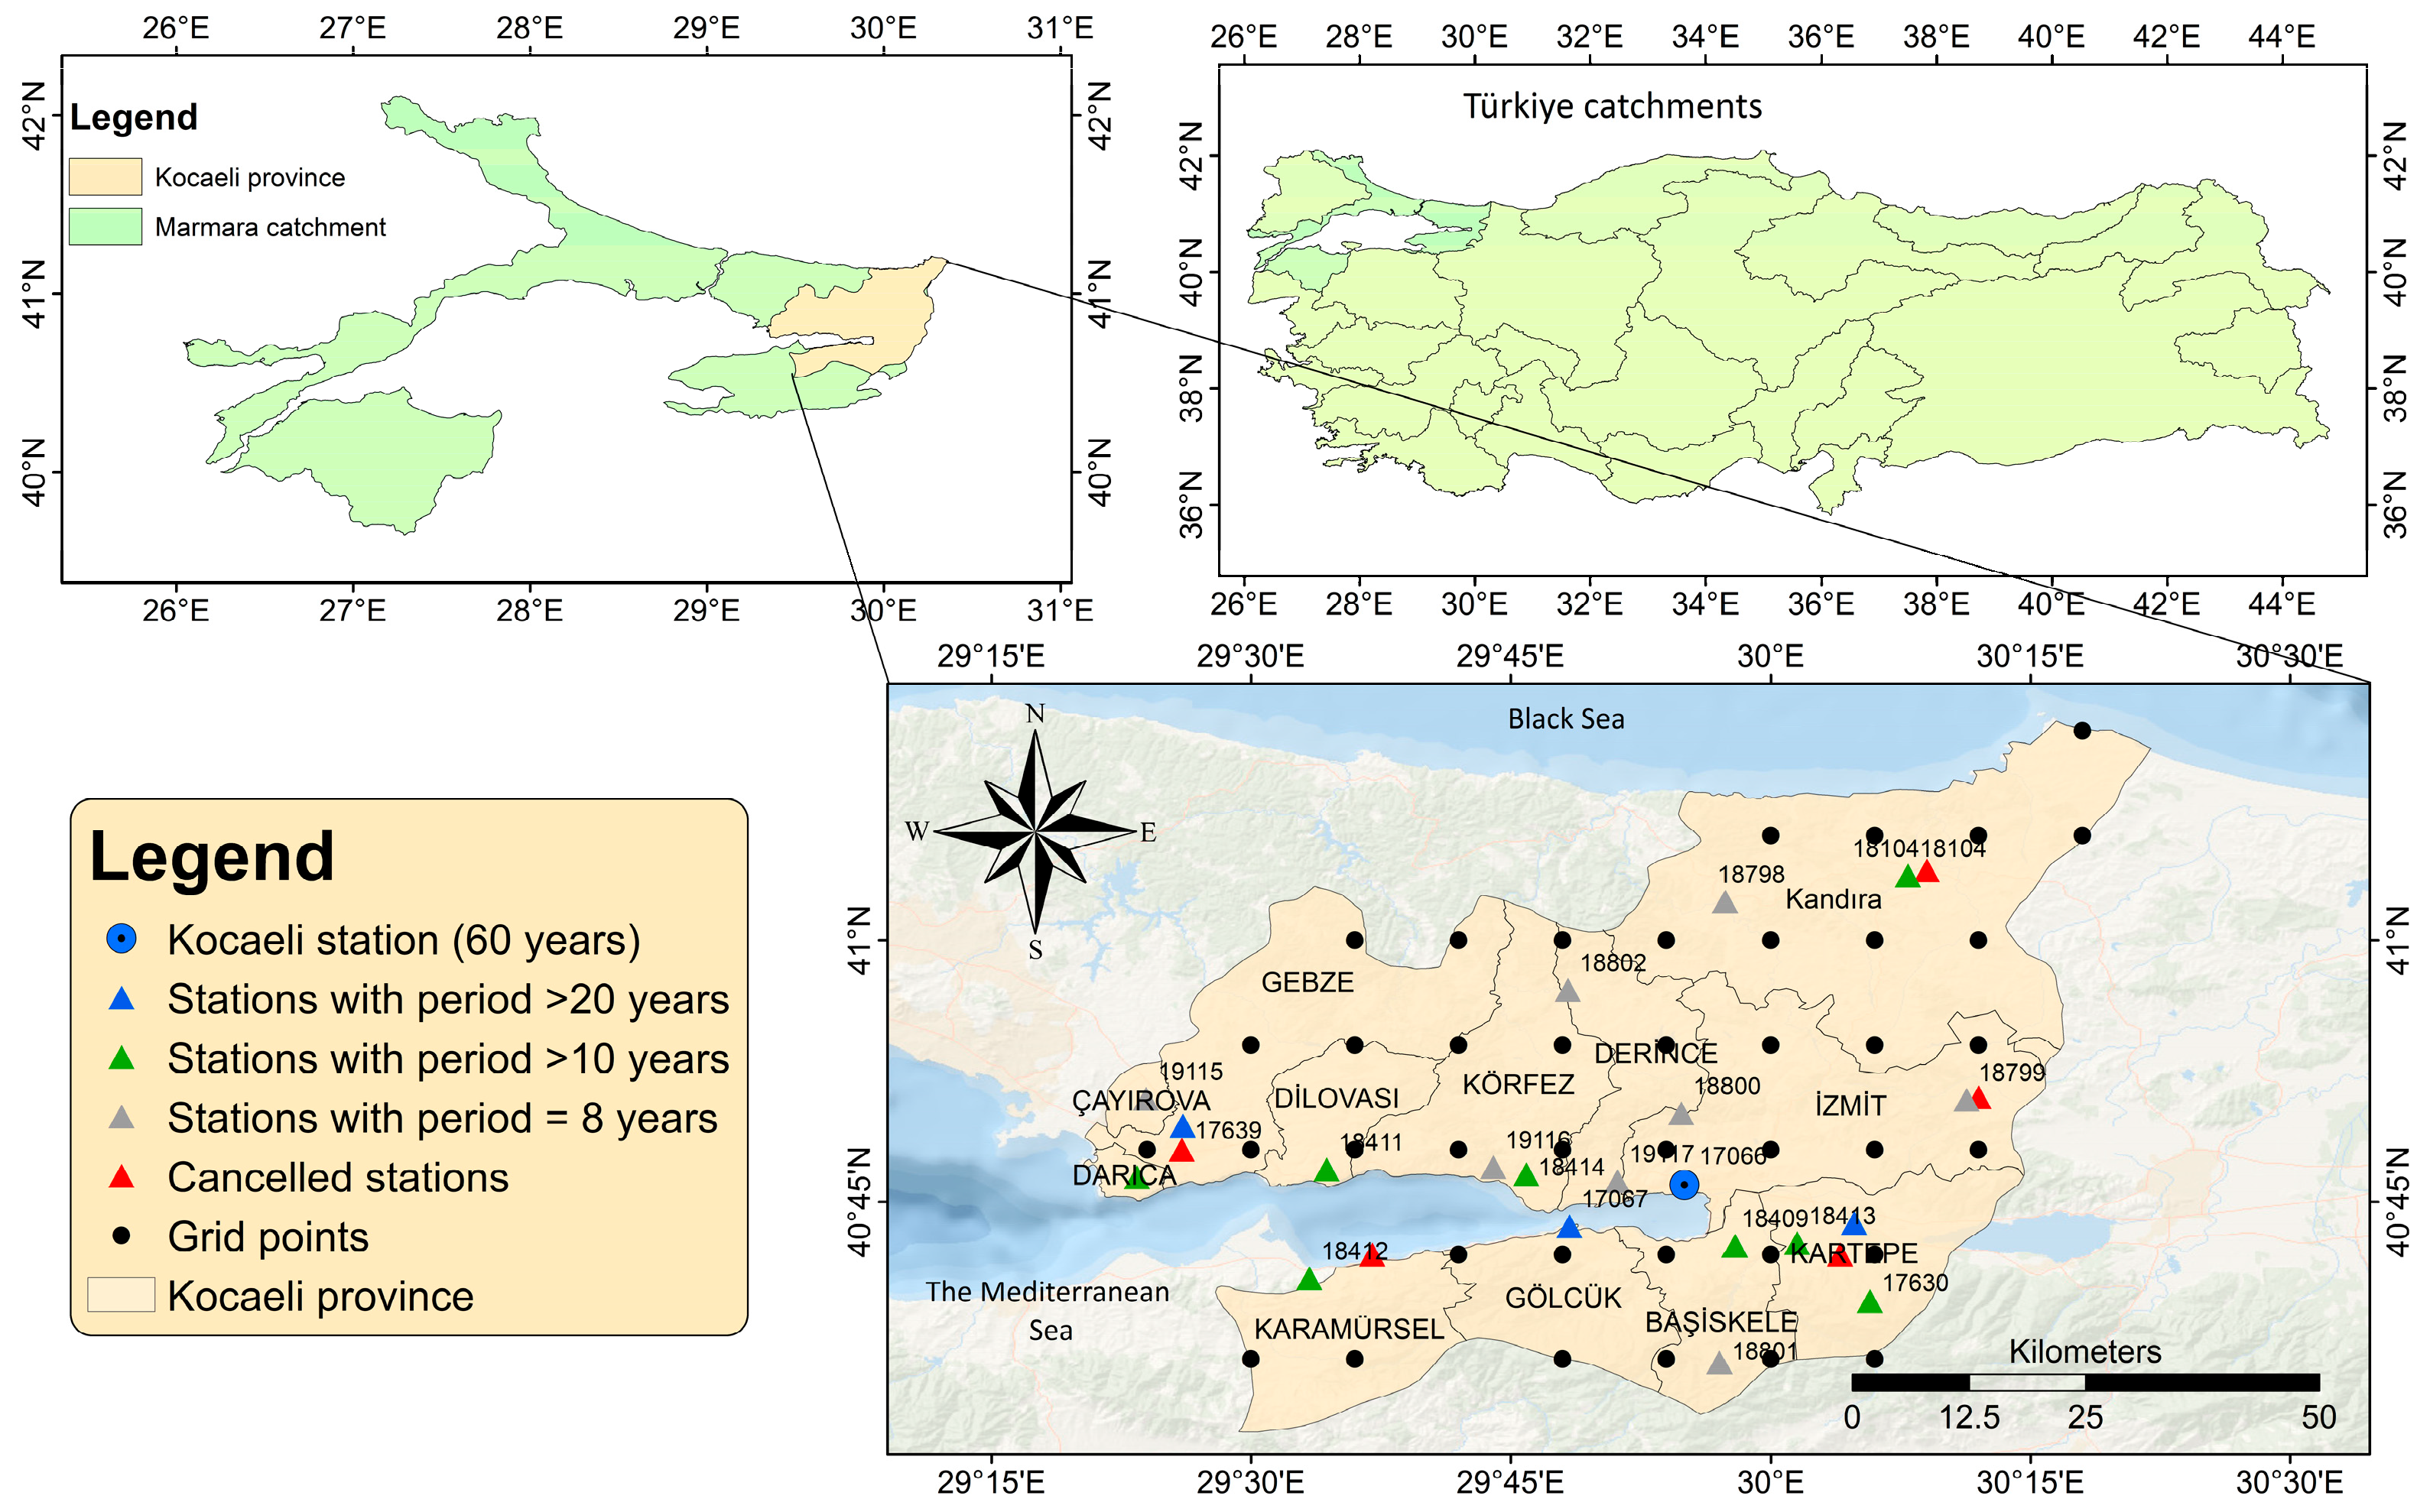
Figure 1. The distribution of in situ meteorological gauge stations with the corresponding ERA5-LAND and NASA grids over the Kocaeli province, Türkiye.
Sustainability 17 07529 g001
Figure 2. Innovative drought classification matrix (IDCM) (Abu Arra and Şişman [29], grey shaded cells indicate the months with the same drought classification, and the blue shaded cell is the summation and percentage of these months).
Sustainability 17 07529 g002
Figure 3. Methodological flowchart.
Sustainability 17 07529 g003
Figure 4. IDCM for 60 years vs. 10 years-based SPI values: (a) SPI1, (b) SPI3, (c) SPI6, and (d) SPI12.
Sustainability 17 07529 g004
Figure 5. Average drought duration over Kocaeli province using SPI1 derived from (a) in situ meteorological stations, (b) ERA5-LAND data, and (c) IMERG-NASA data.
Sustainability 17 07529 g005
Figure 6. Average drought duration over Kocaeli province using SPI3 derived from: (a) In situ meteorological stations, (b) ERA5-LAND data, and (c) IMERG-NASA data.
Sustainability 17 07529 g006
Figure 7. Average drought duration over Kocaeli province using SPI6 derived from (a) in situ meteorological stations, (b) ERA5-LAND data, and (c) IMERG-NASA data.
Sustainability 17 07529 g007
Figure 8. Average drought duration over Kocaeli province using SPI12 derived from (a) in situ meteorological stations, (b) ERA5-LAND data, and (c) IMERG-NASA data.
Sustainability 17 07529 g008
Figure 9. Average drought intensity over Kocaeli province using SPI1 derived from (a) in situ meteorological stations, (b) ERA5-LAND data, and (c) IMERG-NASA data.
Sustainability 17 07529 g009
Figure 10. Average drought intensity over Kocaeli province using SPI3 derived from (a) in situ meteorological stations, (b) ERA5-LAND data, and (c) IMERG-NASA data.
Sustainability 17 07529 g010
Figure 11. Average drought intensity over Kocaeli province using SPI6 derived from (a) in situ meteorological stations, (b) ERA5-LAND data, and (c) IMERG-NASA data.
Sustainability 17 07529 g011
Figure 12. Average drought intensity over Kocaeli province using SPI12 derived from (a) in situ meteorological stations, (b) ERA5-LAND data, and (c) IMERG-NASA data.
Sustainability 17 07529 g012
Figure 13. Spatial distribution of drought duration (in months) over Kocaeli Province during the 2012–2014 drought event, derived from (a) ERA5-LAND and (b) IMERG-NASA datasets. Green circles represent representative pumping wells.
Sustainability 17 07529 g013
Figure 14. Spatial distribution of drought intensity over Kocaeli Province during the 2012–2014 drought event, derived from (a) ERA5-LAND and (b) IMERG-NASA datasets. Green circles represent representative pumping wells.
Sustainability 17 07529 g014
Table 1. Drought classification according to McKee et al. [14].
Drought Index_DI (SPI)Drought ClassificationProbability (%)
2.00 ≤ DIExtreme wet (EW)2.31%
1.50 ≤ DI < 2.00Severe wet (SW)4.42%
1.00 ≤ DI < 1.50Moderate wet (MW)9.22%
−1.00 ≤ DI < 1.00Normal (N)68.1%
−1.50 ≤ DI < −1.00Moderate drought (MD)9.22%
−2.00 ≤ DI < −1.50Severe drought (SD)4.42%
−2.00 > DIExtreme drought (ED)2.31%
Table 2. Time periods with corresponding years.
Time PeriodYears
Ideal time period20–30 years
Optimal time period50–60 years
Acceptable time period10–20 years
Table 3. Summary of statistical metrics [59].
Statistic MetricEquationValue RangeIdeal Value
Correlation Coefficient (CC) C C = i = 1 n T i T ¯ A i A ¯ i = 1 n T i T ¯ 2   i = 1 n A i A ¯ 2 (−1)–(1)1
Coefficient of determination (R2) R 2 = i = 1 n T i T ¯ A i A ¯ i = 1 n T i T ¯ 2   i = 1 n A i A ¯ 2 2 (0)–(1)1
Root Mean Square Error (RMSE) R M S E = 1 n   i = 1 n A i T i 2 (0)–(∞)0
Mean Absolute Error (MAE) M A E = 1 n     i = 1 n A i T i (0)–(∞)0
Mean Bias Error (MBE) M B E = 1 n     i = 1 n A i T i (−∞)–(∞)0
T = 60 year-based or the longest period-based SPI, A= the desired time period-based SPI (for example, acceptable time period-based SPI), n = number of months/samples, T ¯ = mean SPI (60 year-based or the longest period-based SPI), A ¯ = mean SPI (the desired time period-based SPI), and i is the month.
Table 4. Statistical metrics results.
60-30/60-20/60-10SPI1SPI3SPI6SPI12
RMSE0.07/0.09/0.140.11/0.11/0.150.12/0.08/0.160.21/0.14/0.23
MAE0.06/0.07/0.090.09/0.09/0.120.11/0.07/0.120.21/0.14/0.18
MBE−0.06/−0.06/−0.08−0.09/−0.07/−0.07−0.11/−0.07/−0.07−0.21/−0.14/−0.15
IDCM95%/95%/97%93%/89%/88%91%/95%/86%85%/87%/85%
Table 5. Comparison between in situ, IMERG-NASA, and ERA5-LAND-based SPI values using different metrics.
IMERG-NASA ERA5-LAND
SPI11706717639170681706617067176391706817066
CC0.820.550.840.860.730.740.790.86
R20.670.310.700.750.530.550.630.74
RMSE0.590.910.570.520.730.710.681.35
MBE−0.03−0.04−0.02−0.07−0.09−0.14−0.09−0.06
MAE0.410.510.730.361.101.071.100.47
SPI3
CC0.820.600.830.870.220.810.780.87
R20.680.360.690.760.050.650.610.76
RMSE1.891.771.871.861.851.931.861.86
MBE−0.03−0.03−0.03−0.09−0.09−0.13−0.12−0.08
MAE0.430.520.720.351.051.041.100.42
SPI6
CC0.830.560.820.890.640.820.780.89
R20.680.310.680.790.410.680.620.79
RMSE0.590.940.590.470.880.620.740.47
MBE−0.04−0.03−0.04−0.12−0.11−0.17−0.14−0.10
MAE0.450.540.770.341.011.001.060.41
SPI12
CC0.750.350.740.870.610.750.770.87
R20.570.120.540.760.370.560.590.76
RMSE0.721.190.740.531.171.361.230.53
MBE−0.01−0.02−0.04−0.18−0.07−0.18−0.20−0.15
MAE0.580.641.040.380.840.981.010.39
Disclaimer/Publisher’s Note: The statements, opinions and data contained in all publications are solely those of the individual author(s) and contributor(s) and not of MDPI and/or the editor(s). MDPI and/or the editor(s) disclaim responsibility for any injury to people or property resulting from any ideas, methods, instructions or products referred to in the content.