Article

Effectiveness of Installing a Photovoltaic System on a High-Density Building in a Hot Climate Zone

College of Architecture and Planning, Imam Abdulrahman Bin Faisal University, Dammam 31441, Saudi Arabia
Sustainability 2025, 17(16), 7523; https://doi.org/10.3390/su17167523
Submission received: 29 June 2025 / Revised: 15 August 2025 / Accepted: 18 August 2025 / Published: 20 August 2025

Abstract

There is a growing global emphasis on reducing environmental pollution through innovative clean energy technologies, with photovoltaic systems gaining prominence as a sustainable solution. This study presents an integrated approach, combining advanced architectural modeling and dynamic energy simulation to evaluate the utilization of rooftop photovoltaic panels on a high-density higher educational building in Saudi Arabia. Utilizing detailed modeling involving Autodesk Revit and energy simulation through DesignBuilder to Level of Detail 3, the research provides unprecedented accuracy, validated against actual energy consumption data with a remarkable 92.28% precision. Notably, approximately 60% of the rooftop area is identified as suitable for photovoltaic installation, demonstrating a significant capacity to generate 1,028,494.50 kWh annually, covering 61.7% of the building’s energy needs. Financial analysis reveals robust economic benefits, including annual savings of USD 74,938.84, a payback period of under 7 years, and lifetime savings exceeding USD 1.87 million over 25 years. Seasonal variations and surplus energy during winter months are also detailed, highlighting the system’s resilience. Importantly, this study aligns with Saudi Arabia’s “Vision 2030” by showcasing the feasibility and strategic importance of rooftop photovoltaic solutions in urban educational settings within hot-climate regions, offering a pioneering contribution to sustainable urban energy planning.

1. Introduction

Several countries are focusing on reducing their dependence on fossil fuels and transitioning to sustainable energy systems. Renewable energy plays a crucial role in this effort, addressing the challenges of greenhouse gas (GHG) emissions, climate change, and rising global energy demand. This demand is driven by a projected global population increase of 1.3 billion by 2030 [1,2]. By 2030, the Kingdom of Saudi Arabia (KSA) aims to generate 50% of its energy from renewable sources, and the United States and Europe are targeting net-zero energy for residential and commercial buildings by 2050 [3,4]. The European Union (EU) has already surpassed its 2020 goal, reducing GHG emissions by 34% compared to 1900 levels, largely due to increased renewable energy adoption [5]. Energy efficiency regulations for new buildings in the EU also support this progress, as the building sector accounts for over 40% of the region’s total energy consumption. However, more than 160 million buildings in EU countries were constructed before the implementation of these regulations [6].
Renewable energy technologies are selected based on their intended application and spatial requirements. For instance, wind turbines require sufficient space for installation and specific climatic conditions, such as consistent wind at a particular speed. Similarly, solar panels require an adequate area for optimal orientation and positioning, as well as favorable climatic conditions to maximize sunlight exposure while minimizing shading and weather-related effects such as clouds, fog, and snow [7,8]. Among such technologies, photovoltaic (PV) systems have demonstrated remarkable growth and adaptability, providing a sustainable means of harnessing solar radiation. Methods used to estimate solar radiation potential include the digital surface model (DSM), which calculates solar radiation by analyzing sunlight reflected from building surfaces, and light detection and ranging (LiDAR), which generates three-dimensional (3D) surface models as inputs for DSM analysis [9,10]. PV systems are increasingly integrated into buildings, especially rooftops and facades, delivering economic benefits by reducing energy bills and promoting urban sustainability by reducing peak energy demand [11]. Silicon-based solar cells are most commonly used due to their widespread availability and minimal environmental impact. However, successful implementation requires attention to shading, optimal placement, and local climatic conditions to ensure maximum electricity generation efficiency [12,13].
The building sector, responsible for over 40% of global energy consumption and 30% of GHG emissions, is a major focus for energy efficiency improvements. Rising demand for thermal comfort, driven by climate variability, emphasizes the need for innovative solutions such as PV systems. These systems can reduce energy consumption and lower cooling loads through shading effects, particularly in hot and humid climates. Studies have reported a 2% reduction in cooling demand and up to 19% overall energy savings when PV panels cover 75% of a rooftop area [14,15]. Globally, households often aim to cover up to 70% of rooftops with PV systems to maximize these benefits. However, such extended coverage requires large battery storage capacity, and some countries lack access to advanced battery technologies [16]. A commonly overlooked factor is shading from nearby tall buildings or rooftop equipment such as water tanks and air conditioning units. To encourage PV adoption, governments often provide subsidies, especially in countries with high electricity tariffs. In contrast, in countries like Qatar, where electricity is free for national residents, there is little financial incentive for saving measures or PV installation.
High energy consumption is largely driven by the need to meet occupant thermal comfort expectations, which evolve with changing climate conditions. Educational buildings, in particular, incur high energy costs to maintain a stable comfort level, which is essential for students’ well-being and productivity. Several studies have examined how climate influences occupants energy use behavior [17,18,19]. However, these behavioral patterns do not directly apply to educational buildings, which operate under unique conditions. Such buildings typically follow fixed schedules, with activity concentrated on workdays during specific hours, reduced activity levels in summer, and variable operational hours used across the academic year [20,21,22]. In the KSA, which remains heavily dependent on fossil fuels and emits 15 metric tons of CO2 per capita annually, transitioning to renewables presents unique challenges. With energy demand rising by 19% annually, which is driven by population growth and significant infrastructure development, the country aims to generate 9.5 GW of clean energy by 2030 [23]. By the end of 2018, PV projects had reached a total installed capacity of 1.3 GW. For example, the Aramco oil company installed PV panels with a capacity of 10 MW. To promote further renewable energy adoption, policies such as net metering have been introduced to support small-scale PV integration in urban residential areas.
Building energy simulation software, such as EnergyPlus and DesignBuilder, plays an essential role in modeling and estimating buildings’ energy performance. The results of the modeling can be used to understand energy performance and support further analysis to aid building facility management in existing buildings and assist design teams for new constructions. These software applications enable engineers and designers to simulate various building parameters, including building geometry, HVAC systems, occupancy levels, and thermal properties, to estimate building energy consumption. The accuracy of these estimates depends on the precision of the parameters used in developing the simulation model. Therefore, when modeling PV energy production using energy simulation models, several parameters need to be considered. These include orientation, tilt, efficiency, and properties of the panels, as well as building location, weather data, and shading from surrounding buildings. A vital step is analyzing the building’s energy consumption to assess the effectiveness of the system to be potentially installed. The effectiveness can be measured based on whether the system meets the building’s energy demand fully or partially and the investment returns, thereby promoting sustainable building practices and optimizing energy use.
Studies have employed various methods to evaluate the effectiveness of rooftop PV panels in reducing energy consumption, cooling loads, and shading effects. These include satellite imaging, regression analysis, and simulation modeling [24,25]. Among them, simulation tools are widely used due to their ability to model building energy consumption over time based on multiple inputs. The higher the resolution and accuracy of the input data, the better the model simulates real-world conditions. Tools such as EnergyPlus include built-in weather data; however, additional datasets can be imported to improve accuracy. Nonetheless, uncertainties in input data can influence model accuracy, especially when weather data remains a notable area requiring further research [26,27,28]. Simulation tools often rely on historical weather data (typical meteorological years), which may not accurately reflect future climate conditions. Accurate weather inputs are essential for generating reliable simulations that can inform energy policy and emission-reduction strategies [29,30]. Energy simulation tools, such as EnergyPlus and DesignBuilder, are commonly used to estimate energy consumption across various building types, including residential, office, and university buildings. They also allow researchers to explore the integration of systems such as PV panels [31,32,33,34,35,36,37,38] and to analyze building performance throughout the year under changing climate conditions [39,40,41,42,43,44].
PV panel installation has become increasingly common in both new and existing residential buildings. Hoseinzadeh et al. [45] conducted a study in Iran aimed at achieving net-zero energy consumption in residential buildings through PV panel installation. An energy simulation model evaluated the effectiveness of installing an average of 63 m2 of PV panels over eight months of energy simulation. Simulation results showed a reduction in the building’s energy consumption for the heating, ventilation, and air conditioning (HVAC) system from 34 to 7 MW, along with a potential government annual return of USD 15,000. Similarly, Al Huneidi et al. [46] developed a simulation model to analyze energy consumption after rooftop PV installation in a residential villa in Qatar. Their results demonstrated substantial energy saving in hot climates. However, single-building studies often assume optimal conditions, ignoring seasonal variability and other factors such as shading, which limit the generalization of these studies. Dehwah and Asif [47] analyzed the effect of PV panel installation on 33,000 residential buildings in the KSA, simulating energy consumption for 12 months using DesignBuilder and accounting for factors such as solar radiation, panel orientation, and shading. When 25% of rooftops were covered with PV panels, energy consumption dropped by 19%. The higher efficiency gains can be associated with the panel cover assumptions and the system inclusion losses. PV integration has also extended to non-residential buildings. A study by Costanzo et al. [48] estimated energy consumption of a university building using EnergyPlus simulation tool to evaluate the effect of PV panel installation. The model simulated three scenarios: the actual energy consumption, energy efficiency improvement after implementing energy-saving measures, and consumption after PV integration. PV installation led to a 23% reduction in energy use, surpassing expectations by 2%. Similarly, Popa and Brumaru [49] assessed the energy consumption of an office building in Romania using DesignBuilder. PV panels were installed on the facades to improve thermal control in summer and winter, resulting in appreciable energy savings and reduced utility bills. Zheng and Weng [50] aimed to model the effect of PV on energy savings. The study also examines green roofs to help reduce climate change. The case study was conducted in California, US. Future climate conditions for 2050 were modeled to evaluate their impact on building energy consumption and the resulting energy savings. EnergyPlus software was used to estimate PV energy production and input weather data. The results indicate a reduction in energy use when integrating the systems, mainly for the HVAC system. The limitation in modeling green roofs in EnergyPlus is related to the type of plants, as there are limited options, and the fact that they grow is not considered.
Simulation tools also play a notable role in improving building energy consumption performance. An-Naggar et al. [51] developed an energy consumption simulation model for a 100 m2 apartment in Egypt, comparing two scenarios: one with thermal insulation applied to walls and roofs, and another scenario without thermal insulation. Using DesignBuilder, the five-month simulation showed that thermal insulation reduced energy consumption by 40%, considerably lowering utility costs and decreasing CO2 emissions by 30%. Ashrafian [52] investigated the impact of climate change on energy consumption and the associated cost in a five-story school building in Turkey with 480 students. The study used DesignBuilder to estimate the building’s energy consumption over 12 months. A key challenge in developing the simulation model was the uncertainty of weather data, as the initial inputs relied on historical records. This was addressed by incorporating future climate projections, which were validated against past data. The model also evaluated different roof coverages ranging from 20% to 80% with PV panels. The findings highlighted that even in highly efficient buildings, weather and occupant behavior notably influenced energy consumption performance. Collectively, these studies reported higher savings when dealing with small-scale and short-term models. In contrast, large-scale models consider the climate projected in the simulation to yield more conservative estimates. Since occupant presence directly influences energy consumption, several studies have proposed predictive models to estimate future occupancy patterns, which serve as inputs for developing building energy simulation models [53,54].
This paper aims to assess the effectiveness of integrating photovoltaic (PV) systems within a real-world educational building context, measuring their energy production in relation to energy demand and their economic impact. The methodology involves creating an architectural model in Revit to develop a 3D structure and position PV panels, enabling the study of potential shadowing effects. Additionally, a comprehensive simulation model is developed using DesignBuilder for a high-density, higher-education building in KSA. Using the developed simulation model, this research thoroughly assesses the potential electricity generation from the PV system installed on the building’s rooftop. A series of comparative analyses is performed to evaluate the system’s performance across different seasons, offering critical insights into its operational efficiency. Furthermore, a detailed economic analysis is conducted, which includes a complete payback period assessment to determine the financial viability of the PV system over its 30-year lifespan. The results of this research highlight the energy and cost-saving benefits of PV panel integration and underline the importance of coordinated technical, regulatory, and economic strategies. These strategies are essential for achieving long-term energy sustainability and significantly reducing reliance on fossil fuels. The implications of this study contribute to the broader discussion on sustainable energy solutions, making it a valuable resource for policymakers, educational institutions, and the construction industry committed to promoting renewable energy adoption and improving energy efficiency in building design.

2. Materials and Methods

This section outlines the analytical process, which evaluates the effectiveness of integrating PV panels into a high-density higher-education building located in a hot climate.
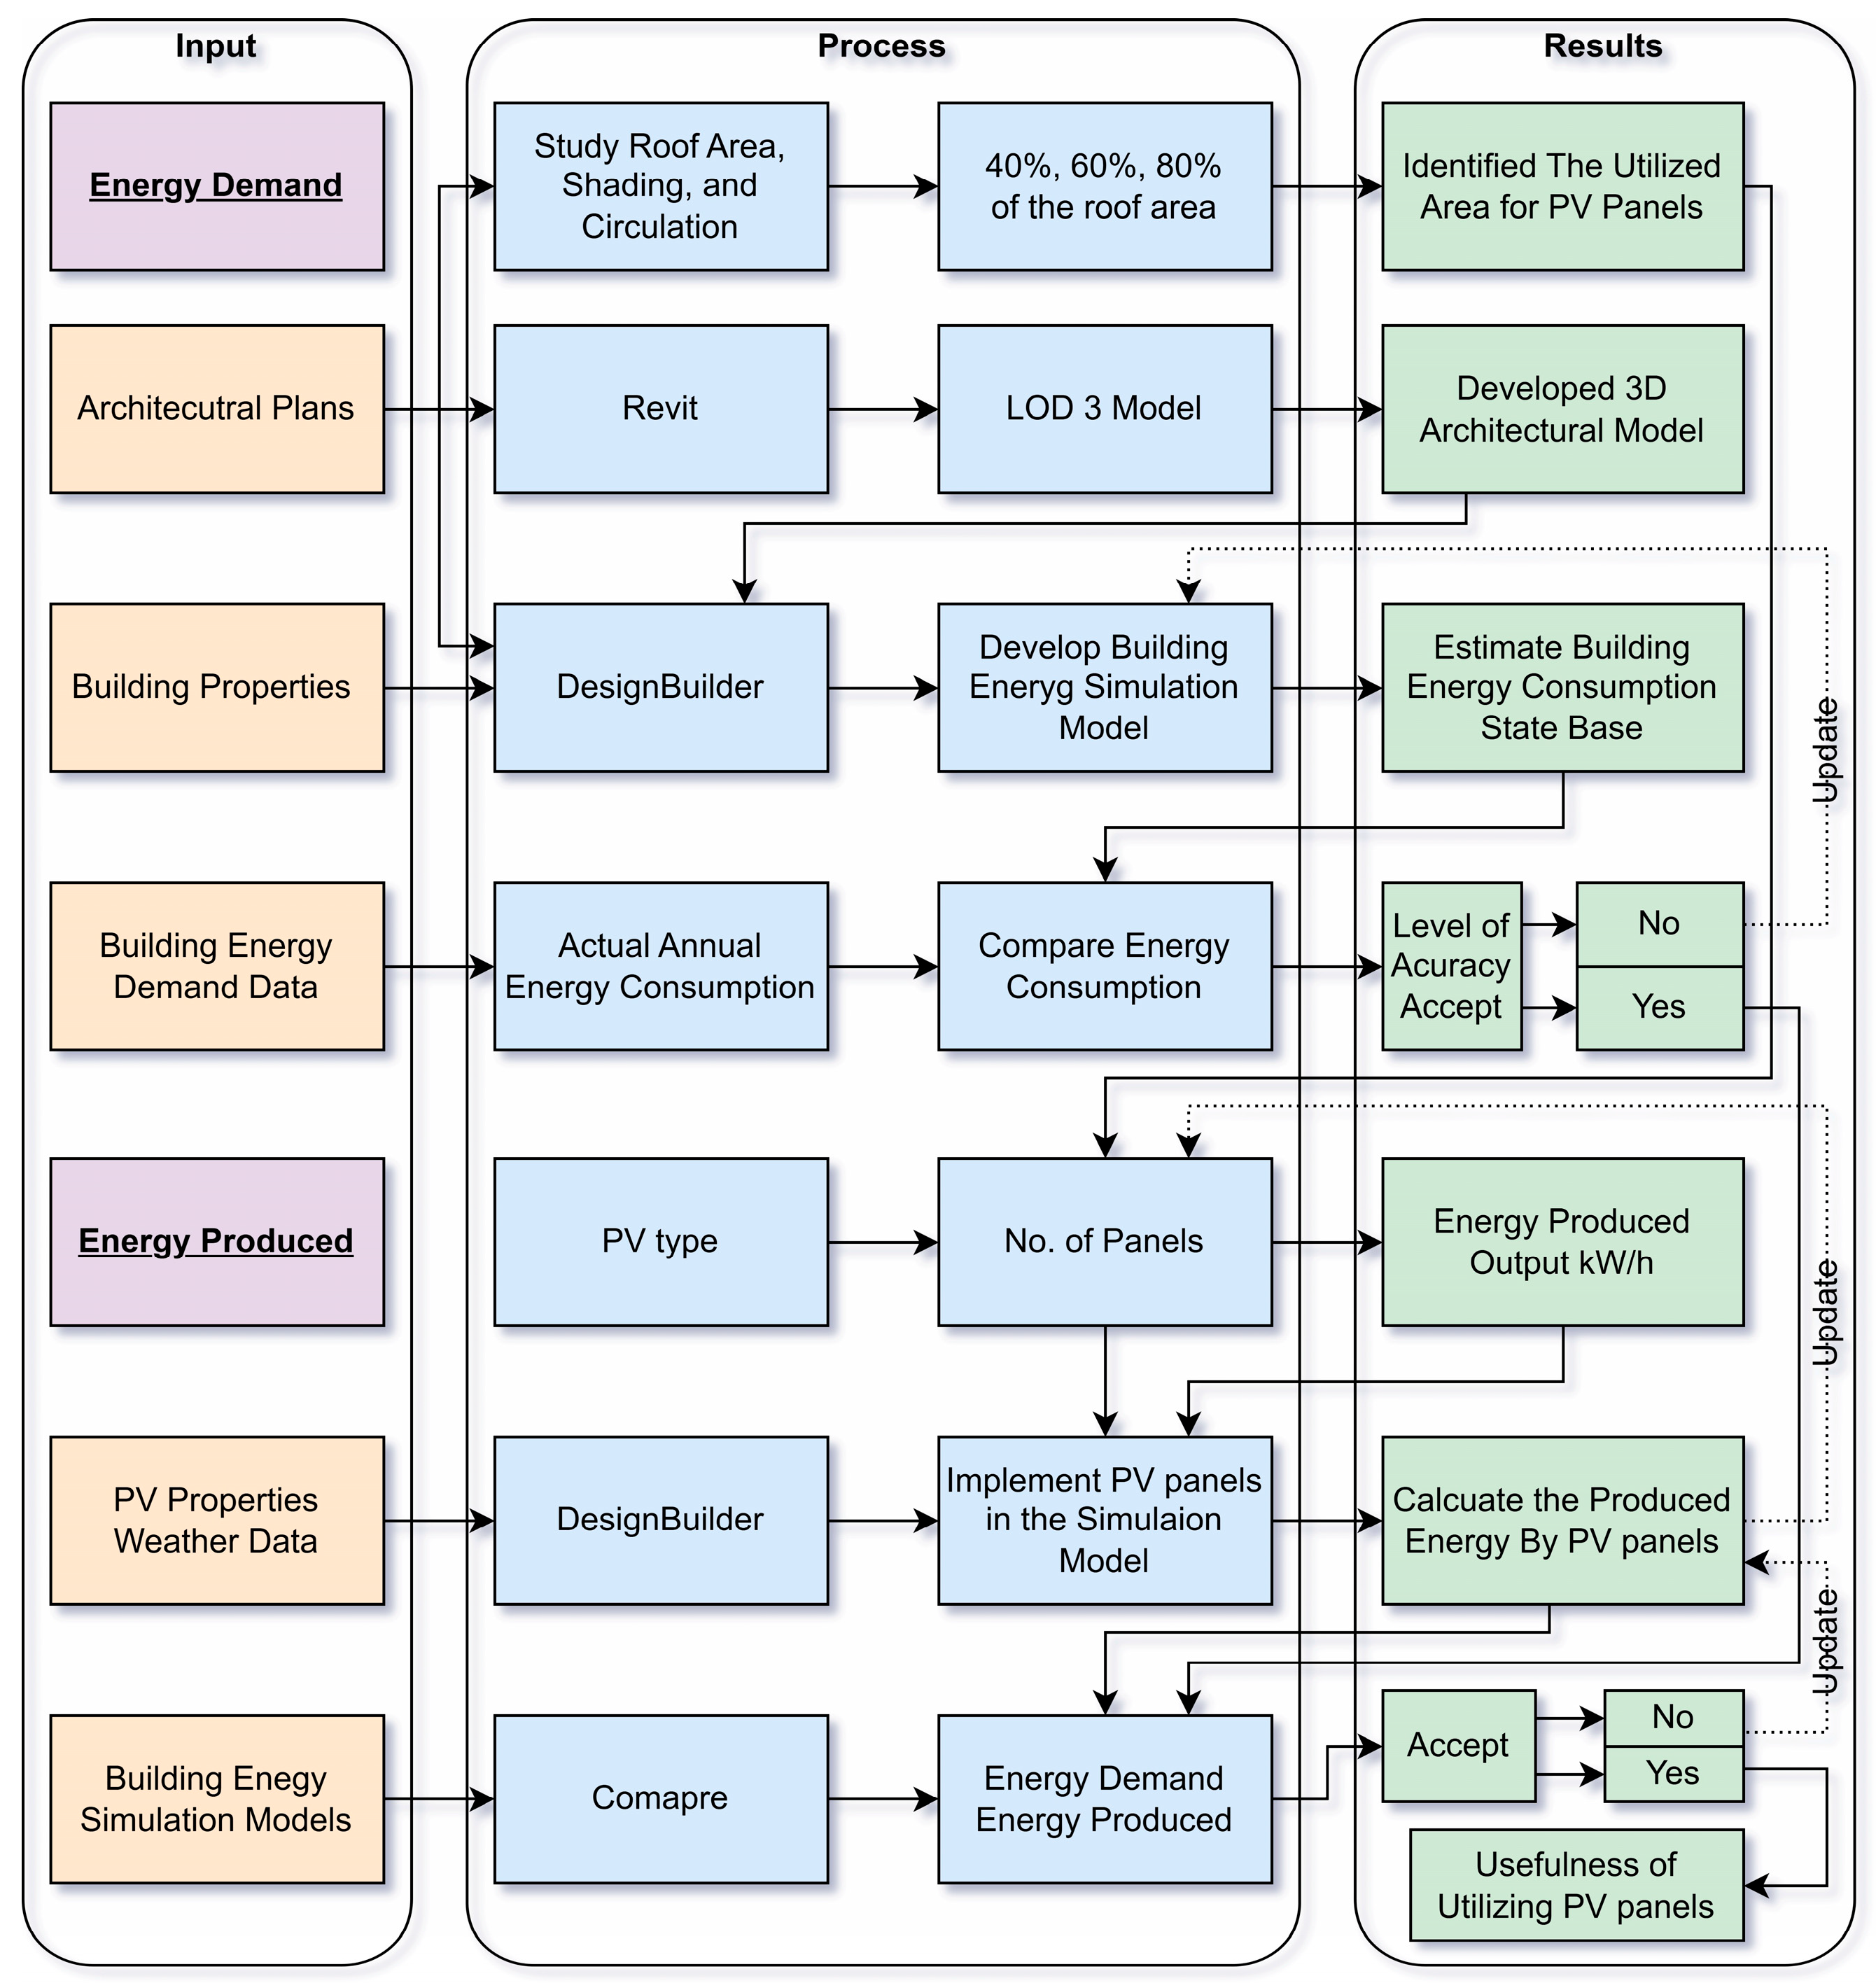
The methodology involved a dynamic building energy consumption simulation, which models and analyzes a building’s energy consumption performance over time based on its energy demand and integrated PV systems. The analysis was carried out in two main phases, as visually summarized in Figure 1. These phases were designed to achieve the study’s objective of assessing the effectiveness of PV panel integration in the reference building. In the first phase, two-dimensional (2D) architectural plans of the reference building were collected to determine the available rooftop area. These plans were used to construct a three-dimensional (3D) model using Autodesk Revit 2025 (v25.4.0.32). The model was then used as input for building energy consumption simulation in DesignBuilder (v7.3.1.003). In the second phase, PV panels were integrated into the simulation model. Inputs included panel specifications and quantities. If the simulated energy output was insufficient, the number of panels was adjusted, and the model was re-run until an acceptable energy production level was achieved. This approach constructs a comprehensive energy consumption model followed by an analysis of energy demand, which has been validated by numerous studies [55,56,57,58,59,60]. It is effective for quantifying the impact of various hypotheses, such as changes in building use, the addition of new systems, or the integration of energy technologies.

2.1. Case Study Building

The case study building is the College of Architecture and Planning at Imam Abdulrahman Bin Faisal University in Dammam, the KSA. Figure 2 shows the building’s exterior envelope. It has a footprint of approximately 8000 m2 and comprises three floors (no basement), with a length of 170 m, a width of 80 m, and a height of 19 m. The total rooftop area is 7175 m2, of which 1004.5 m2 (14%) is occupied by built structures such as rooms, shafts, and skylights. The building is used for academic purposes, housing design studios, classrooms, laboratories, a theater, and faculty offices, along with supported facilities such as a lounge and cafeteria. It is typically occupied during working hours from Sunday to Thursday, between 7:30 a.m. and 7:00 p.m. Notably, it is the only college at the university that allows student access on weekends and holidays owing to the intensive project-based work required in design studios and labs.
The building’s outer walls are made of 500 mm thick precast concrete, while the inner wall panels of offices and classes are made of 80–120 mm aluminum panels. Most of the windows in the offices and classrooms are single-layer sliding windows, each with an area of 5.5 m2. The extensive use of glass in a single layer in the building compromises the thermal insulation of the building. Most of the building energy consumption is attributed to the HVAC system. The HVAC system consists of 21 air handling units (AHUs) with a combined capacity of 285 kW. These systems operate on weekdays from 5:00 a.m. to 5:00 p.m. and remain off on Fridays and Saturdays. Setpoint temperatures are maintained at 19 °C–21 °C during summer and 24 °C–26 °C during winter. The building uses light-emitting diode (LED) lighting. The building’s raw energy consumption data for the year 2024 was obtained from the university’s facilities management department. The average annual energy consumption was 150,480 kWh. The actual energy consumption data can be useful for a first-order approximation of PV demand match to validate the accuracy of the simulation model’s output.

2.2. Building Energy Consumption Simulation

To obtain simulation results that closely reflect actual building performance, a 3D model of the reference building was developed using Autodesk Revit 2025 (v25.4.0.32) and DesignBuilder (v7.3.1.003). The model was based on architectural drawings, system specifications, and property data provided by the university’s engineering department. The architectural plans provided included space dimensions and labels, such as faculty offices, design studios, classrooms, laboratories, conference rooms, auditoriums, and service areas. HVAC and lighting systems details, construction materials, and occupancy schedules were also incorporated to enhance the simulation accuracy. Discrepancies between simulated and actual energy consumption can arise due to uncertainty in occupant attendance and behavioral patterns. Additionally, the weather data used in the software is Typical Meteorological Year (TMY) data, which are weather files that represent average historical conditions, excluding the extreme weather events that occurred during the year. The assumption about building operation in the model at the design performance level is that the software cannot consider issues that arise during operation or the required maintenance that might impact building performance.
Autodesk Revit was used to convert 2D AutoCAD (v 8.8.58.0) drawings into a 3D model that integrated various building elements. Its advanced modeling capabilities ensured compatibility with energy simulation tools [61,62]. The model was developed to a Level of Detail 3 (LOD 3), which includes geometric elements such as walls, floors, windows, and mechanical systems, enhancing the realism of simulation results. DesignBuilder was then used to estimate the building’s energy consumption based on the developed 3D model. The software was chosen for proven reliability and capability to simulate complex buildings under diverse operating conditions [63,64]. DesignBuilder also enables users to assign geographical locations for climate-based analysis. For this study, the weather data corresponding to Dammam, the KSA (LAT 26.4207° N, LON 50.0888° E), was used. The city experiences a hot desert climate (BWh) according to the Köppen climate classification [65], with an average annual temperature of 26.4 °C (79.4 °F). Historical records indicate that temperatures range from a high of 44.4 °C (112 °F) to a low of 10.6 °C (51 °F) [66,67].

2.3. PV Panels

In the second phase of the building energy consumption simulation, PV panels were integrated into the developed 3D model to estimate the amount of energy generated. This output was then compared to the building’s estimated energy demand to evaluate the effectiveness of implementing the PV system. The system’s effectiveness was assessed based on the proportion of energy generated relative to the building’s consumption, as well as the potential reduction in energy costs. Previous studies indicate that rooftop PV coverage may vary depending on building type and usage, with possible coverage rates reaching up to 80% [68,69]. This study aims to maximize the PV panel coverage on the building’s roof, with allowances for circulation, maintenance, and regular cleaning, as the rooftop currently has no other designated function.
Several types and models of PV panels are available. For this study, the selected PV panels reflect models commonly available through local retailers. Specifically, monocrystalline silicon (Mono-Si) panels were chosen due to their high efficiency, derived from a single continuous silicon crystal structure. Additionally, half-cell solar panels, a next-generation variant of traditional solar cells, were selected. These half-cell panels divide the solar cells to improve efficiency, reduce energy losses during operation, and maintain stable output under partial shading or cloudy conditions [70,71,72]. The inverter efficiency usually ranges from 95% to 99%, with an average of 97% for high-efficiency inverters. Several factors can lower the inverter’s efficiency, including loading conditions, temperature, and mismatch between the inverter and module output. System losses can also vary depending on the location of the PV system and nearby structures that may cast shade on the panels. As a result, system loss typically falls between 1 and 2% when quality cable and proper sizing are used, and the system is regularly monitored. Table 1 summarizes the manufacturing specifications of the selected PV panel, which were used as input parameters for the simulation model [73].

3. Results

This section presents the results of the study in four stages: first, identifying the building’s usable rooftop area for PV panel placement; second, developing architectural and energy consumption simulation models to estimate the building’s baseline energy demand; third, analyzing the placement of PV panels using the developed models and estimating the corresponding electricity generation; and finally, assessing the economic benefits, including energy bill savings and the investment payback period.
The initial stage involved identifying the rooftop areas suitable for PV panel placement and those that must remain unused. The rooftop cannot be fully covered with PV panels due to the requirements for circulation spaces (e.g., walking paths and maintenance access), the presence of existing structures such as shafts, skylights, and rooms up to 3.6 m in height, and shaded zones unsuitable for panel installation. The study focused on the rooftop of the university’s architectural building, which has a total area of 7175 m2. Based on the aforementioned constraints, approximately 16% (1148 m2) is allocated for circulation, 14% (1004.5 m2) occupied by existing structures, and 10% (717.5 m2) is shaded, leaving 60% (4305 m2) of the rooftop available for PV panel placement. Figure 3 illustrates the color-coded zoning of the rooftop, highlighting the areas reserved for circulation, shading, and PV panel placement.
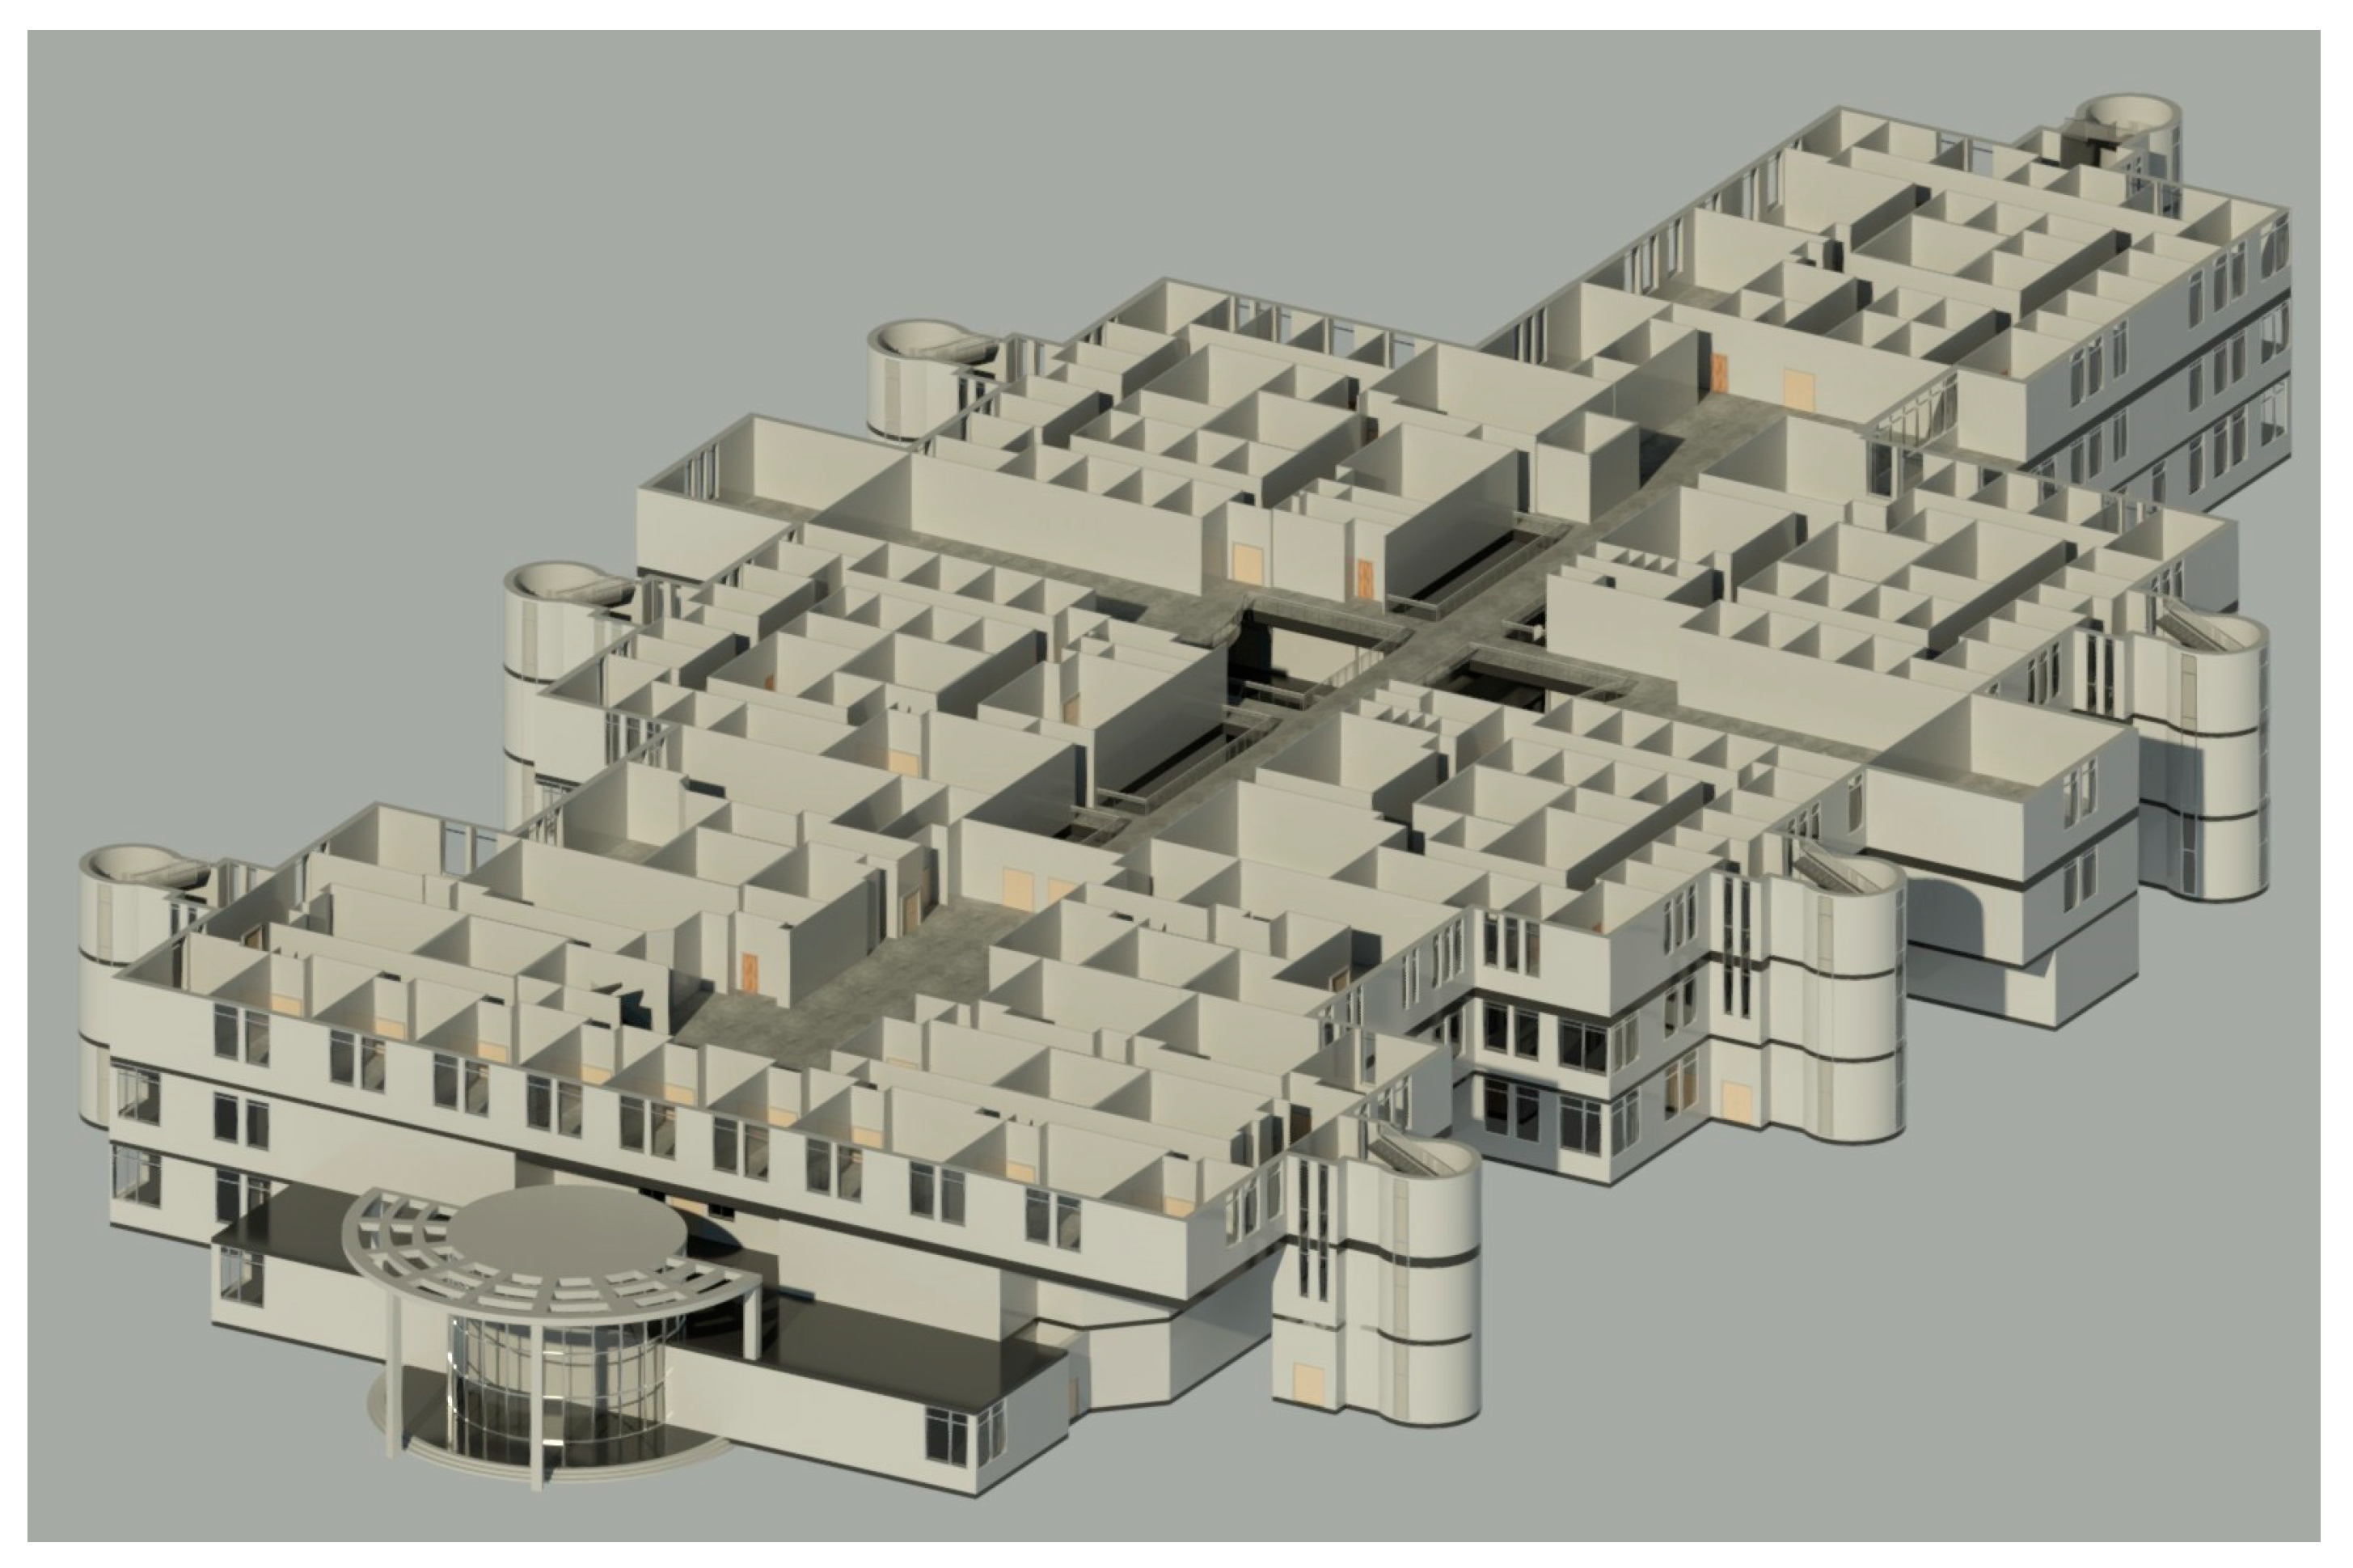
The second stage involved estimating the reference building’s annual energy consumption to estimate its baseline energy demand. This estimation was performed through the development of comprehensive architectural and energy consumption simulation models. Autodesk Revit 2026 (v26.0.10.8) was used to create the architectural model of the building at LOD 3, ensuring higher geometric accuracy and accurate location data compared to previous studies, which typically relied on LOD 1 mass models. Figure 4 shows the internal layout of the building, including interior walls, doors, and windows.
The Revit architectural model was then imported into the DesignBuilder energy consumption simulation software (v7.3.1.003) to develop the comprehensive building energy consumption simulation model. Inputs included detailed HVAC system specifications (as described in Section 2.1), occupancy schedules, lighting types, and other relevant parameters used to estimate the building’s energy consumption.
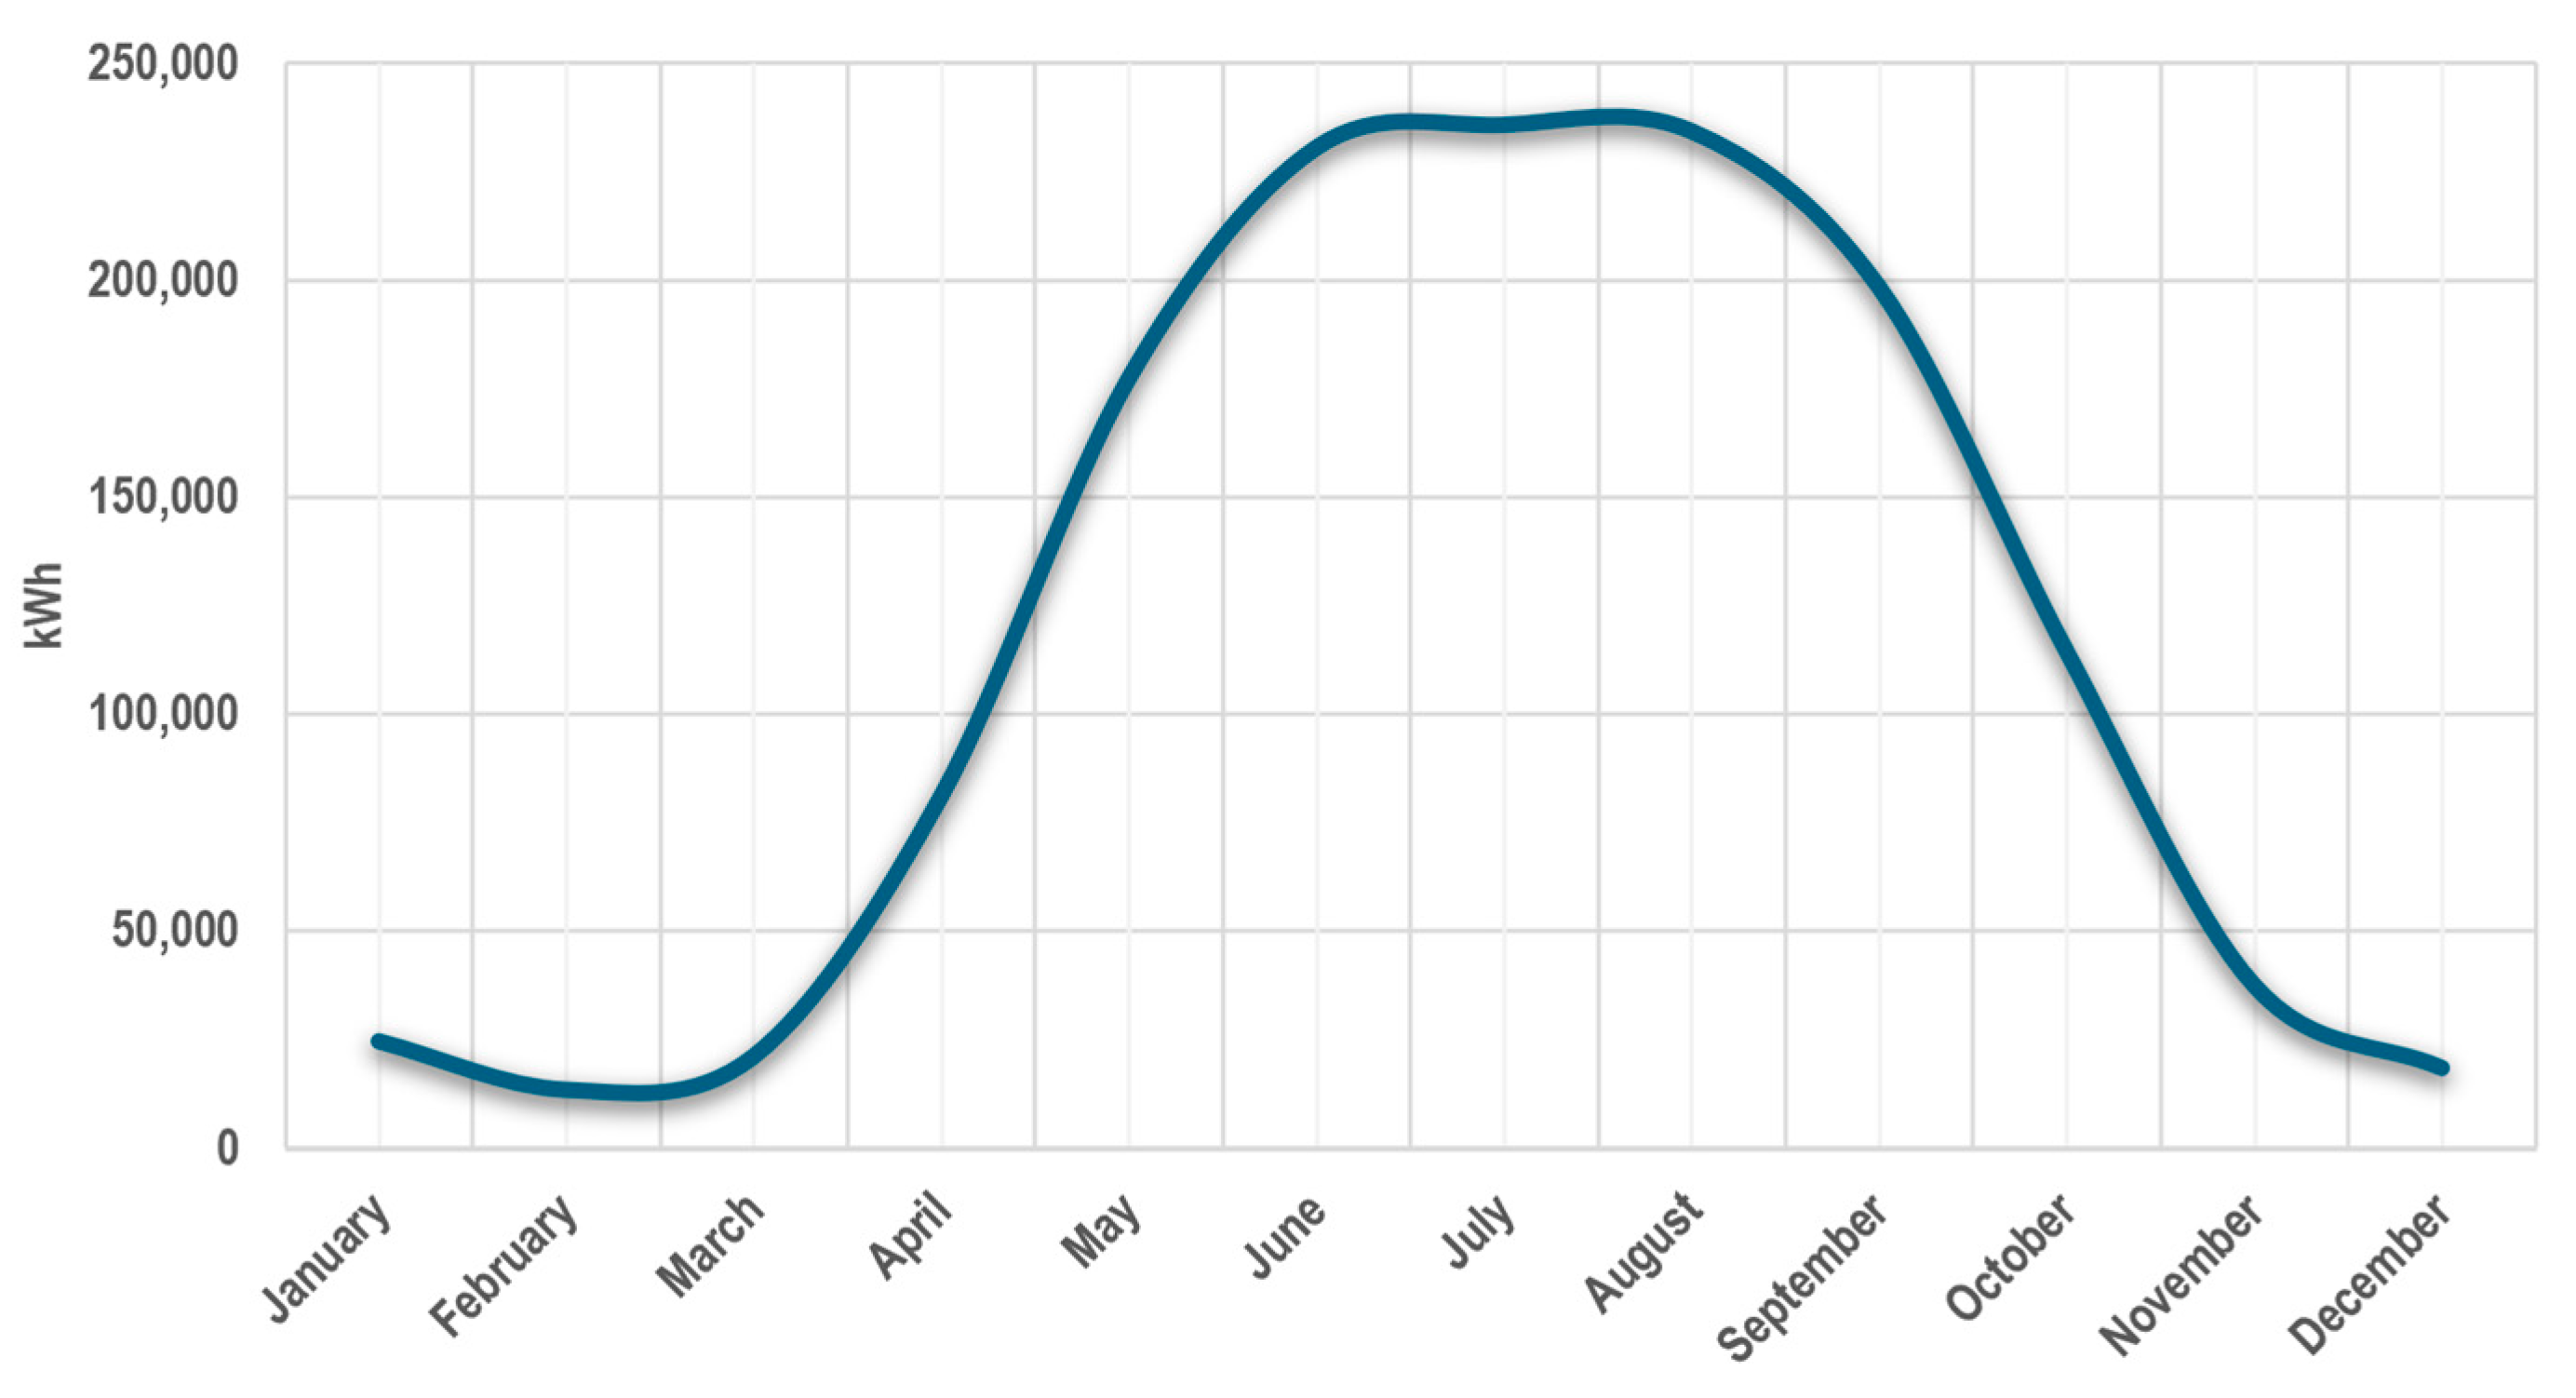
Figure 5 shows the estimated energy consumption results of the case study building using DesignBuilder. The estimated average annual energy consumption of the reference building was 138,860 kWh, corresponding to an accuracy of 92.28% when compared to the actual data of 150,480 kWh provided by the building’s facilities management department. It validates the potential for predictive modeling and decision-making support in similar facilities. Energy consumption reveals a clear seasonal trend, which is strongly influenced by climate conditions. The data underscores the significant impact of cooling loads during the summer months, with June, July, and August showing the highest energy usage, averaging over 230,000 kWh monthly. The high energy demand during summer months is related to extreme ambient temperatures and continuous HVAC operation for building occupants’ thermal comfort, as some classes are ongoing. The temperature in summer often exceeds 45 °C (113 °F), which makes this period crucial in driving energy consumption patterns throughout the year.
In contrast, the substantially lower energy consumption between January and March, as well as in November and December, illustrates how cooler ambient conditions reflect on reduced HVAC demand. The lowest energy consumption was observed in February, at 13,656 kWh. Additionally, occupancy-related factors, such as academic holidays during winter break, are likely to contribute to this decline. There was a steep rise in energy consumption from March to May. In April, energy consumption increased by more than three times, rising to 81,332 kWh compared to 24,825 kWh in January. Energy consumption was higher in May, at 177,448 kWh, marking the beginning of the high consumption period. Notably, May coincides with final exams, suggesting extended building usage during critical academic periods. The sharp decline after August can be associated with lower demand for HVAC systems due to the drop in climate temperature.
The third stage involved placing PV panels within the developed models and calculating the resulting electricity generation. The PV panel placement strategy is shown in Figure 6. PV panels were positioned on the building’s rooftop in the 3D Revit model, which also facilitated shading analysis. Shaded areas caused by existing rooftop structures were avoided during the placement of the PV panels. Subsequently, an energy consumption simulation model incorporating the rooftop PV panel layout was developed in DesignBuilder to estimate electricity generation. As established earlier, 60% of the rooftop area was deemed suitable for PV panel placement. The simulation results indicated that 830 PV panels, covering a total area of 2145 m2, could be accommodated within the usable rooftop space.
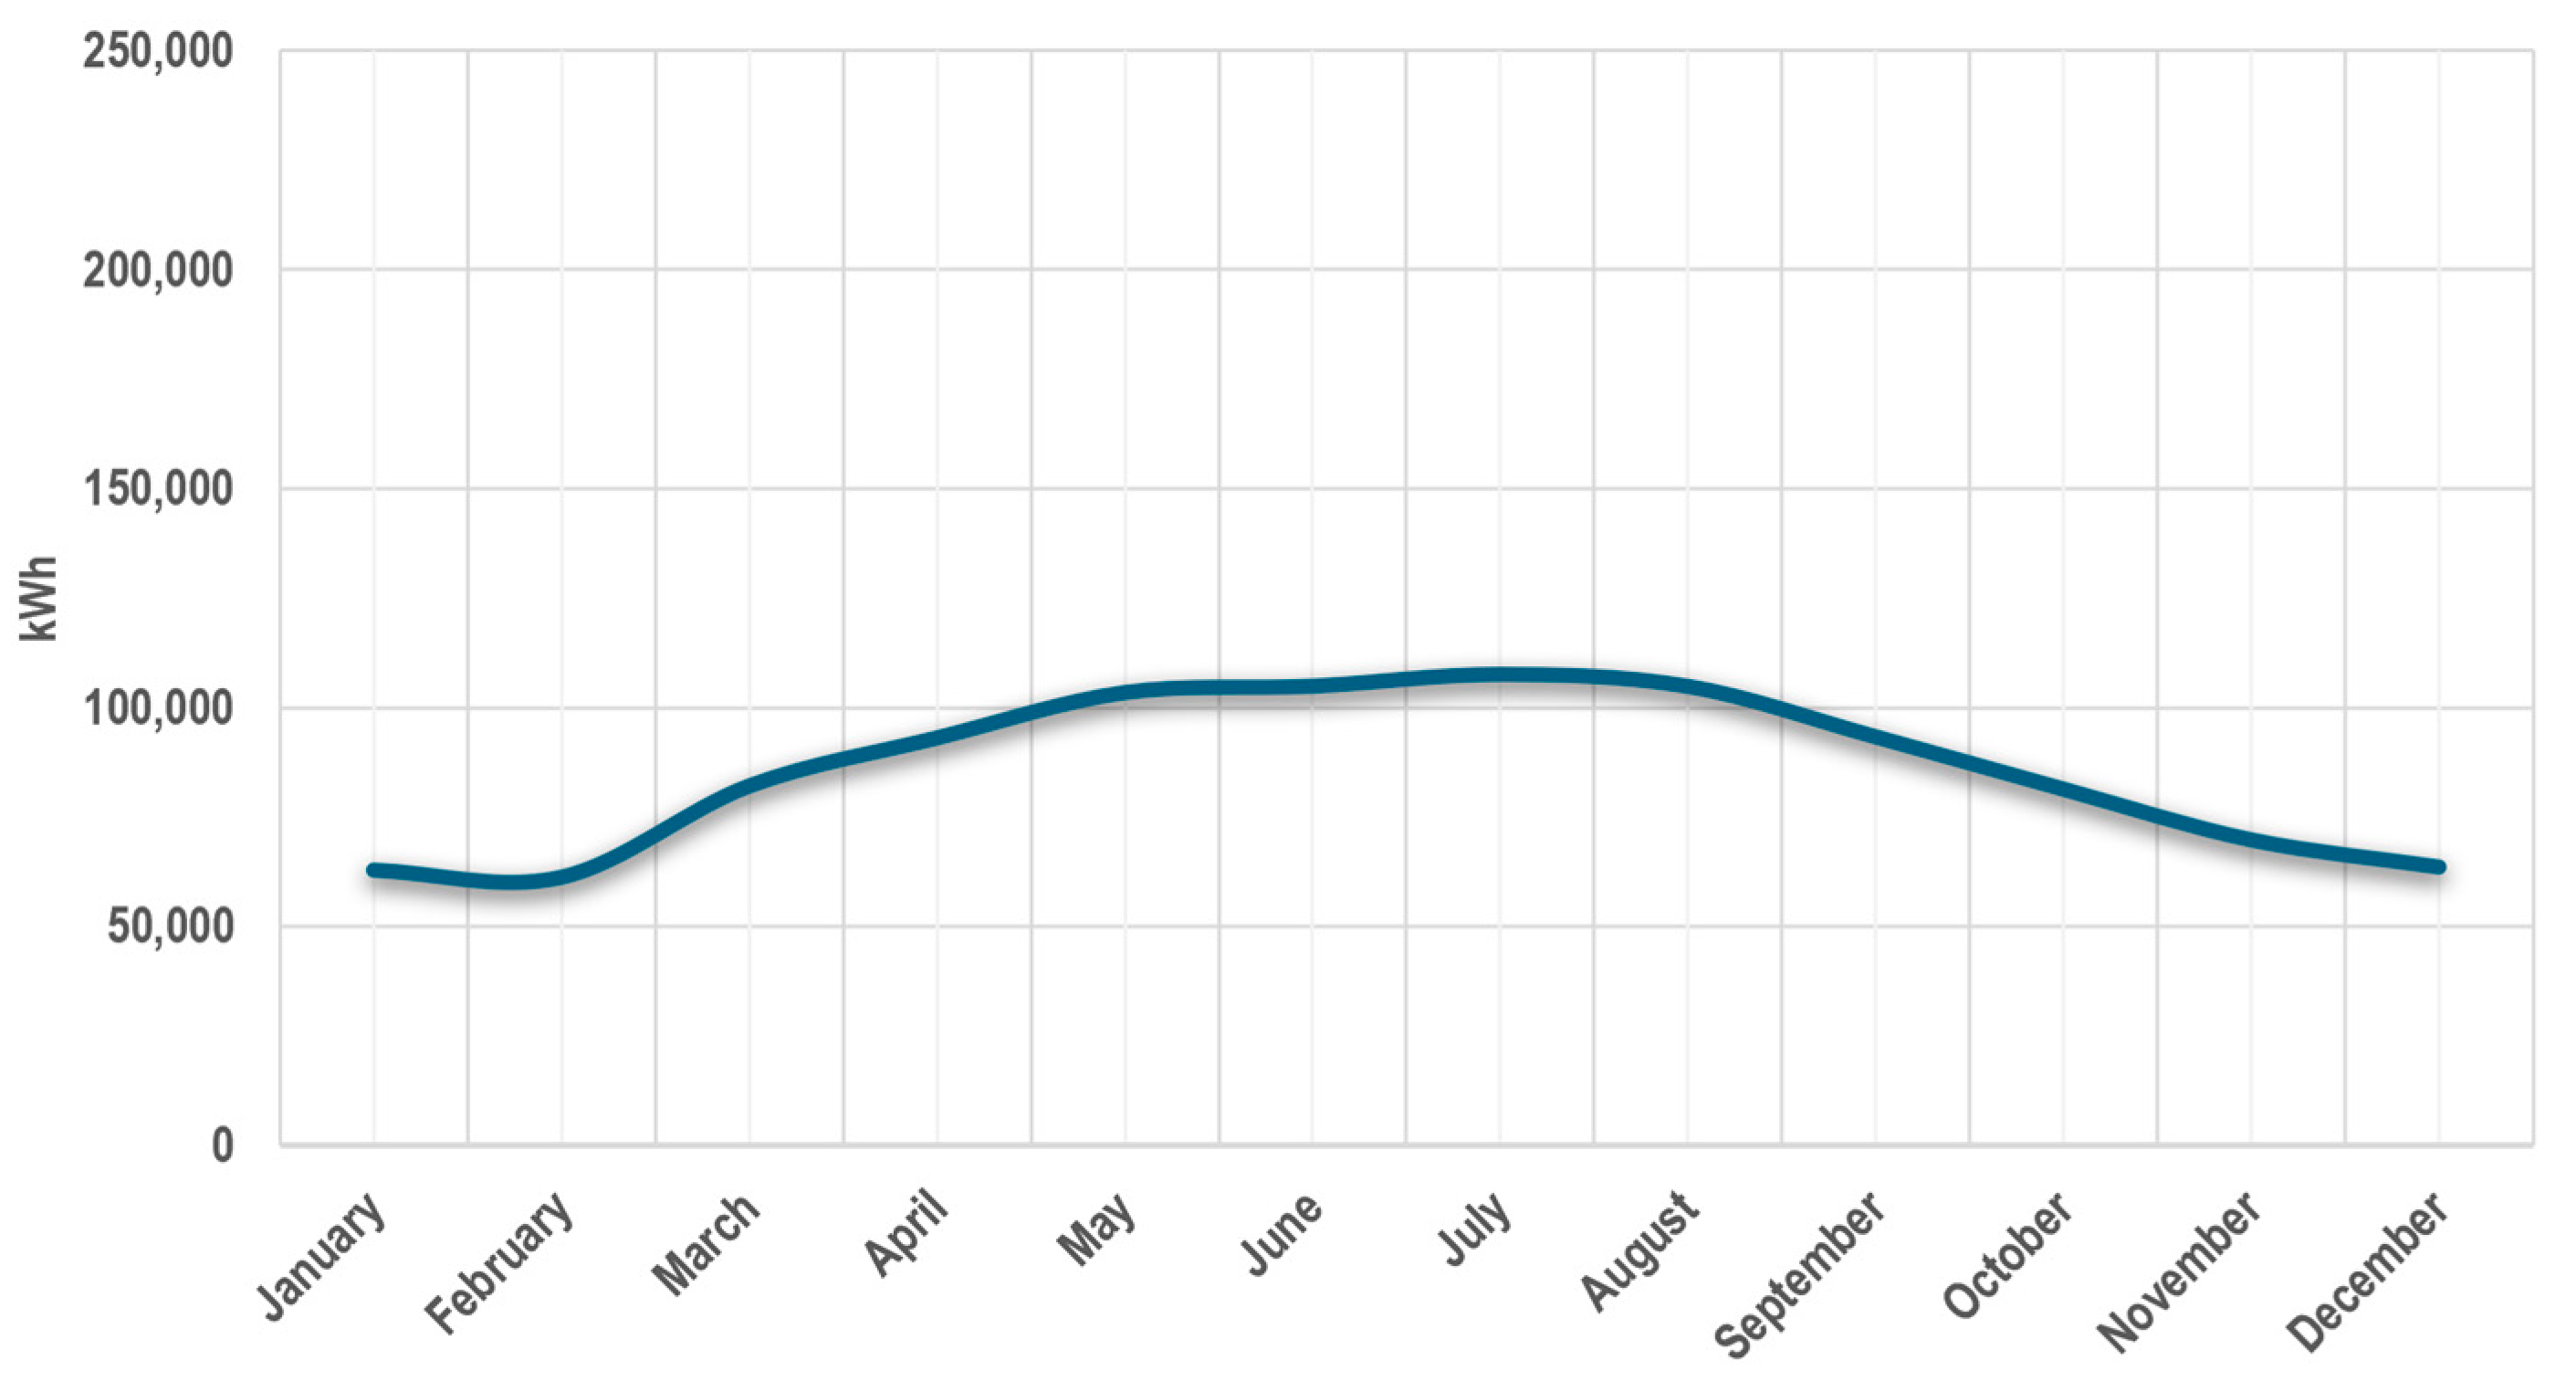
The simulated monthly electricity generation from the PV panels over one year, showing a clear seasonal pattern, as presented in Figure 7. The output is influenced by environmental parameters such as weather conditions (e.g., cloud cover and rainfall), ambient temperature, solar irradiance, and daylight duration. The analysis identified three distinct levels of electricity generation: high, moderate, and low.
Peak electricity generation was recorded in July (107,510 kWh), followed by June (104,824 kWh), August (104,780 kWh), and May (103,365 kWh), reflecting the period of highest solar exposure during the summer months. These conditions enhance photovoltaic conversion efficiency due to longer days and more direct sunlight incidence. A moderate generation level of electricity was observed during March, April, September, and October. During these months, the daylight is still substantial but gradually increasing (in spring) or decreasing (in autumn). March yields the highest in this category with 93,315 kWh, while October had the lowest at 81,430 kWh, possibly due to the early onset of cloudier weather and reduced sunlight angle. The lowest generation levels occurred during winter, from November to February. February recorded the minimum (61,407 kWh), followed by January (63,033 kWh), December (63,741 kWh), and November (69,902 kWh). The reduced electricity generation during this period was primarily due to shortened daylight hours, solar angles, and increased cloud cover. Lower ambient temperatures, which are beneficial to PV efficiency in theory, are often offset by weather-related losses, such as dense cloud layers.
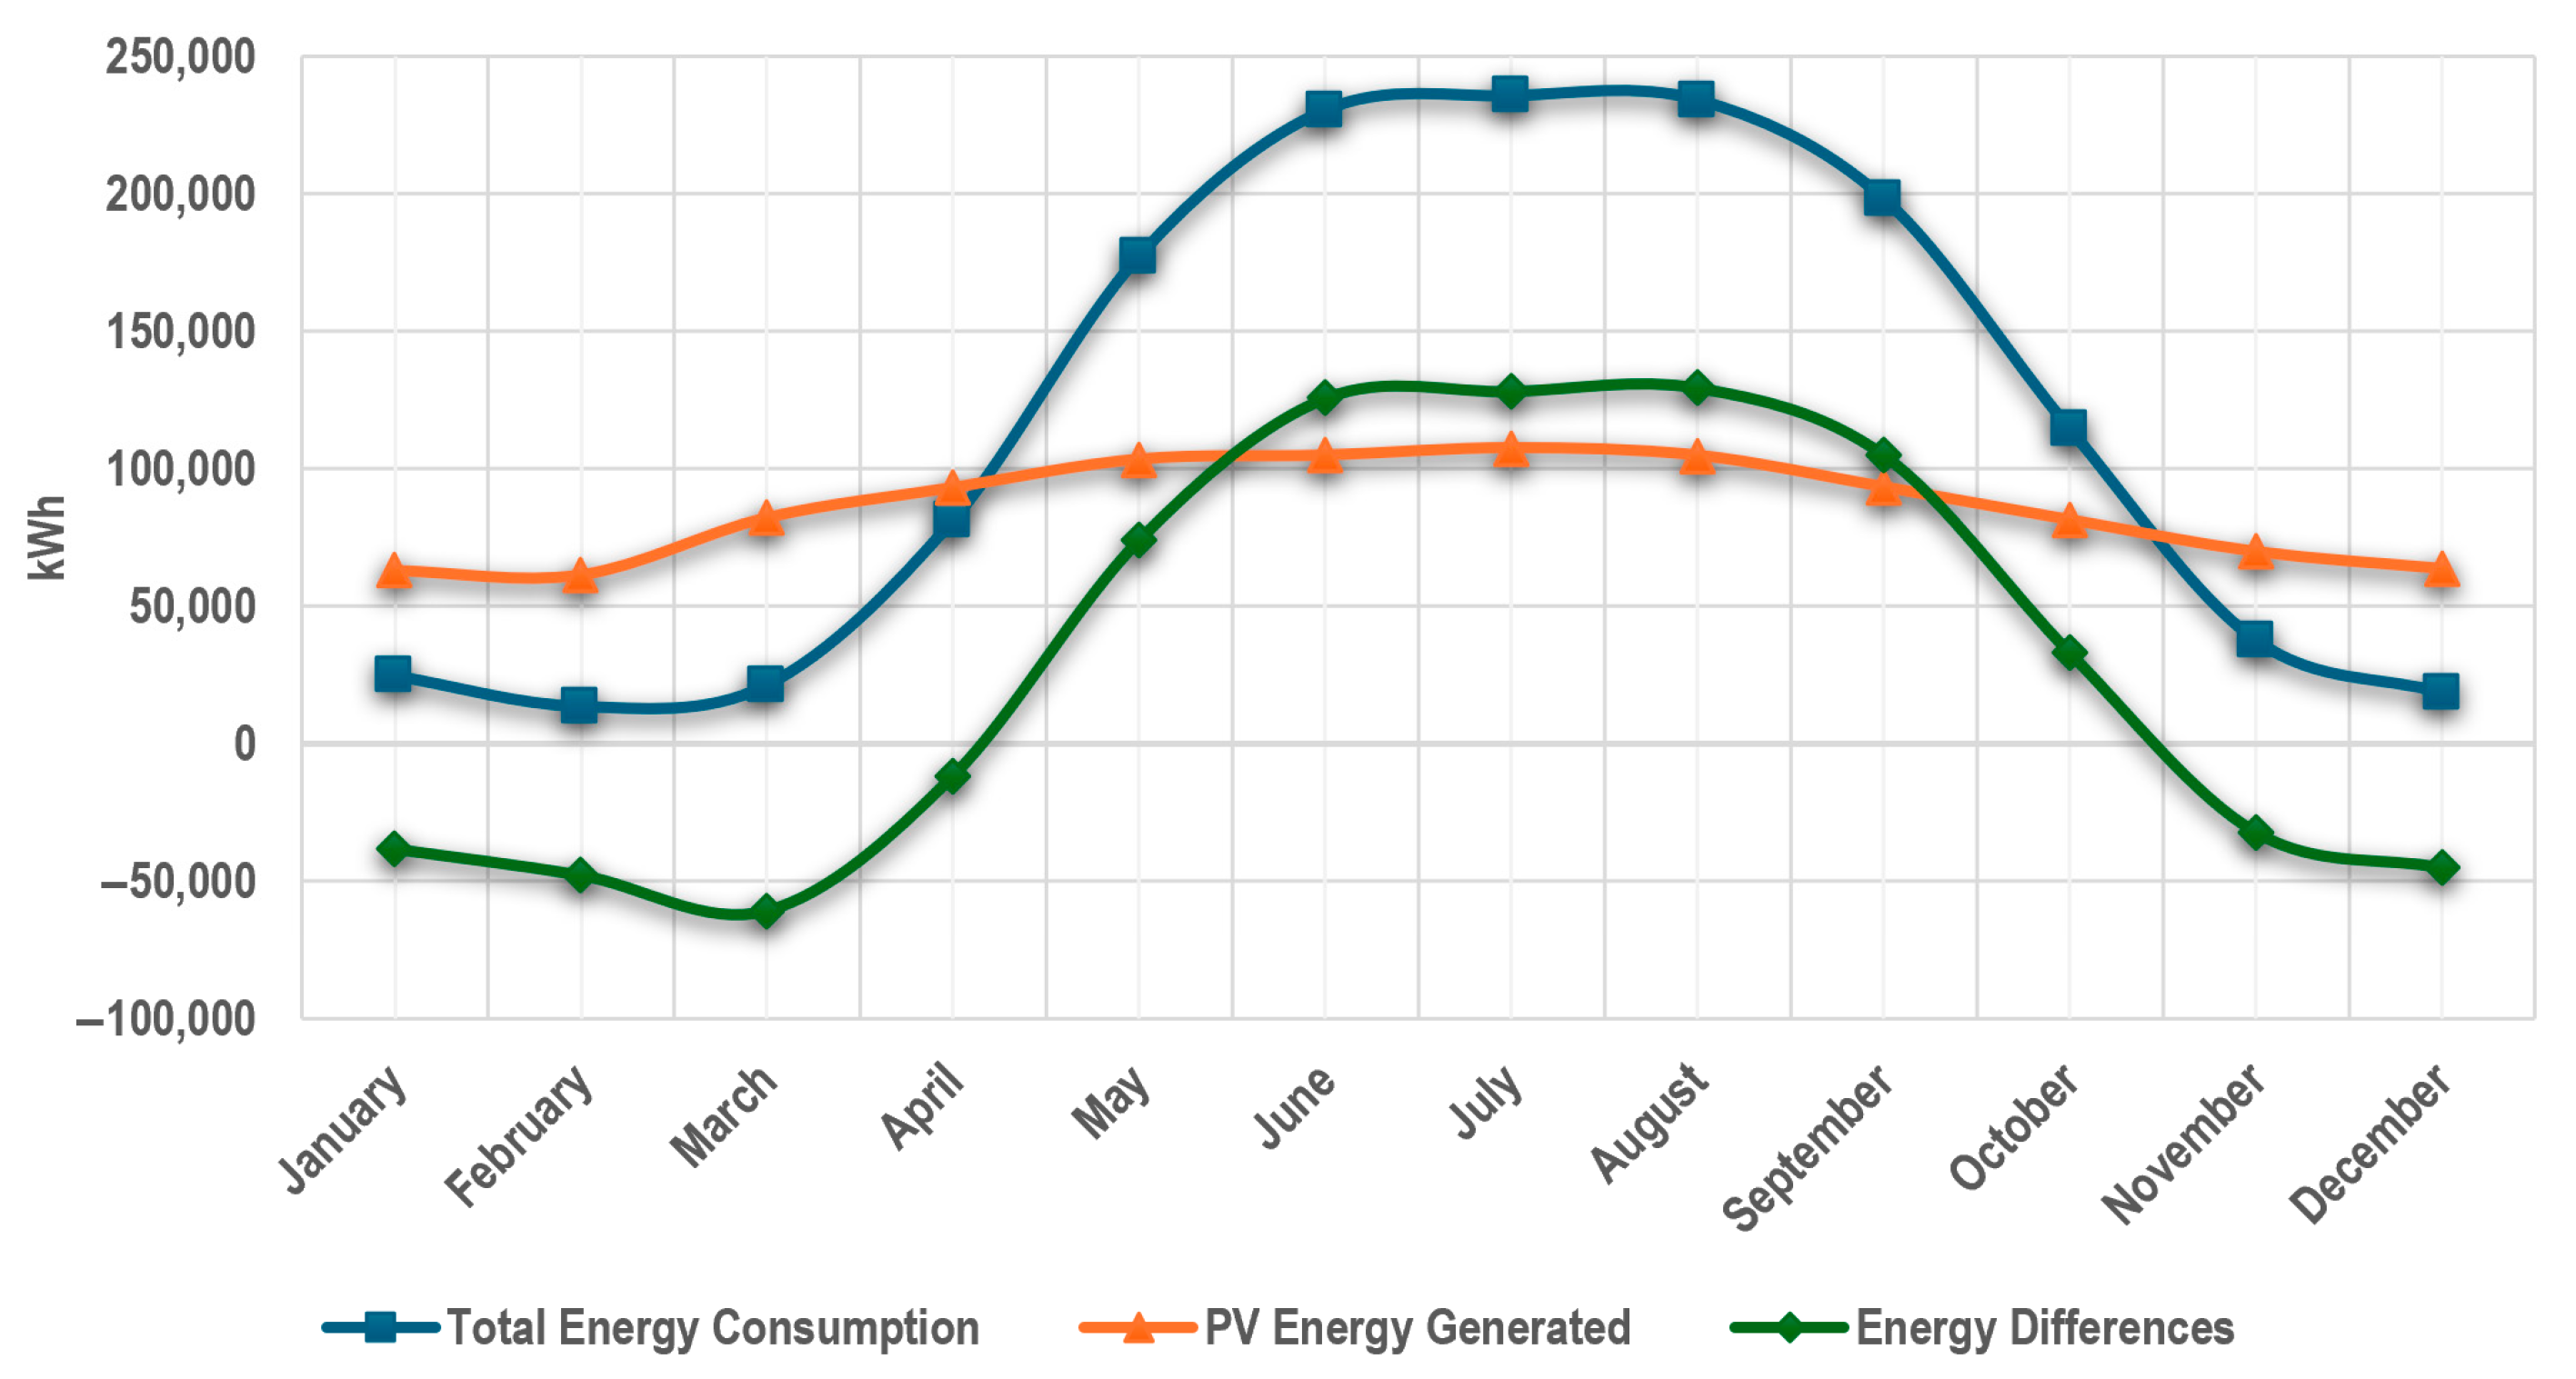
The fourth and final stage involves evaluating the effectiveness of the PV panel installation on a high-density higher-education building by comparing the building’s total estimated annual energy consumption with the electricity generated by the PV panels. This comparative analysis assesses the extent to which the PV panels can meet the building’s energy demands. Table 2 and Figure 8 present the annual energy consumption of the reference building, the electricity generated by the PV panels, and the monthly differences between the two.
The results reveal seasonal variations in the balance between electricity generation and consumption. Surplus energy was recorded during the cooler months—January, February, March, April, November, and December—when the building’s energy demand was comparatively lower. During these months, the PV panels generated more electricity than required, with the excess potentially fed into the grid. The highest surplus, exceeding 60,000 kWh, occurred in March. Conversely, during the summer months (May–August), when outdoor temperatures in Dammam City rose considerably, the building’s cooling loads increased sharply, leading to substantially higher energy demand. During this period, electricity consumption consistently exceeded electricity generation, with the highest deficits recorded in June, July, and August, each exceeding 125,000 kWh. Although the building’s rooftop was fully utilized for PV panel installation, the system could not meet the total energy demand during the peak summer months. This highlights the need for supplementary energy sources—either from the national grid or through battery storage—to ensure uninterrupted operation. Overall, the PV panels generated 1,028,494.50 kWh of electricity annually, covering 61.7% of the building’s total energy demand of 1,666,318.25 kWh. This substantial offset demonstrates the PV panel’s effectiveness in reducing dependence on external energy sources and achieving significant cost savings.
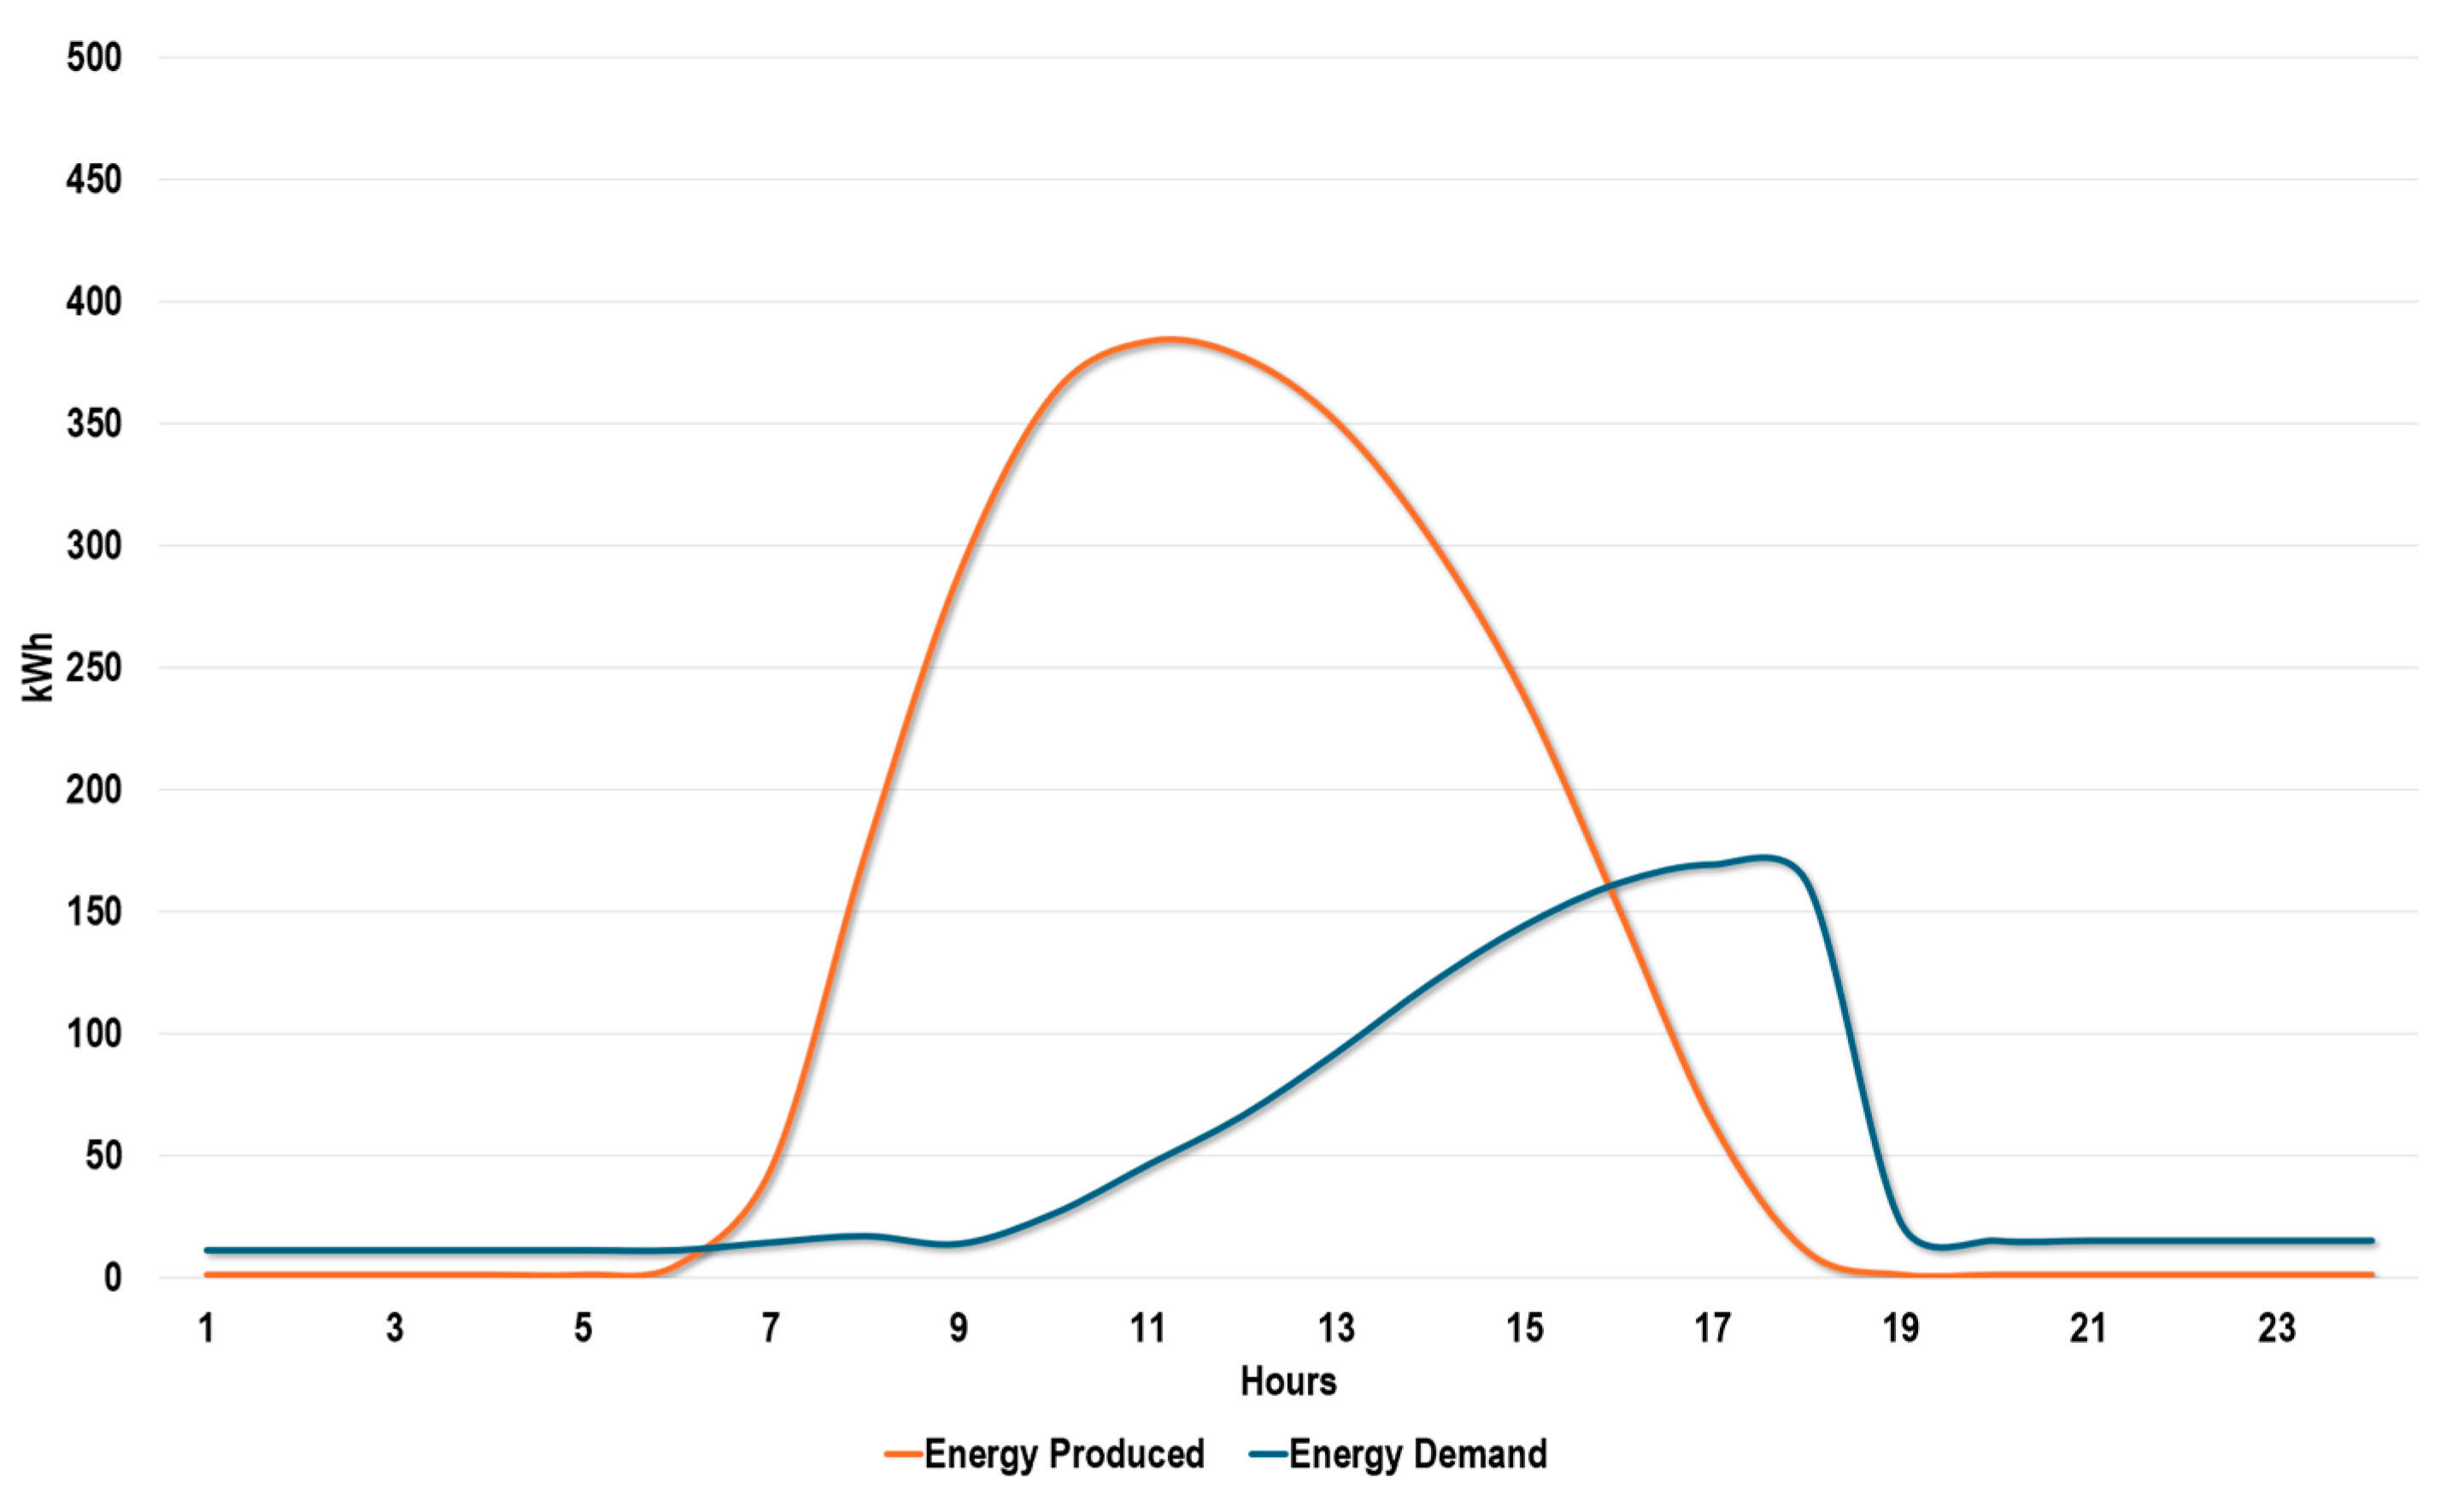
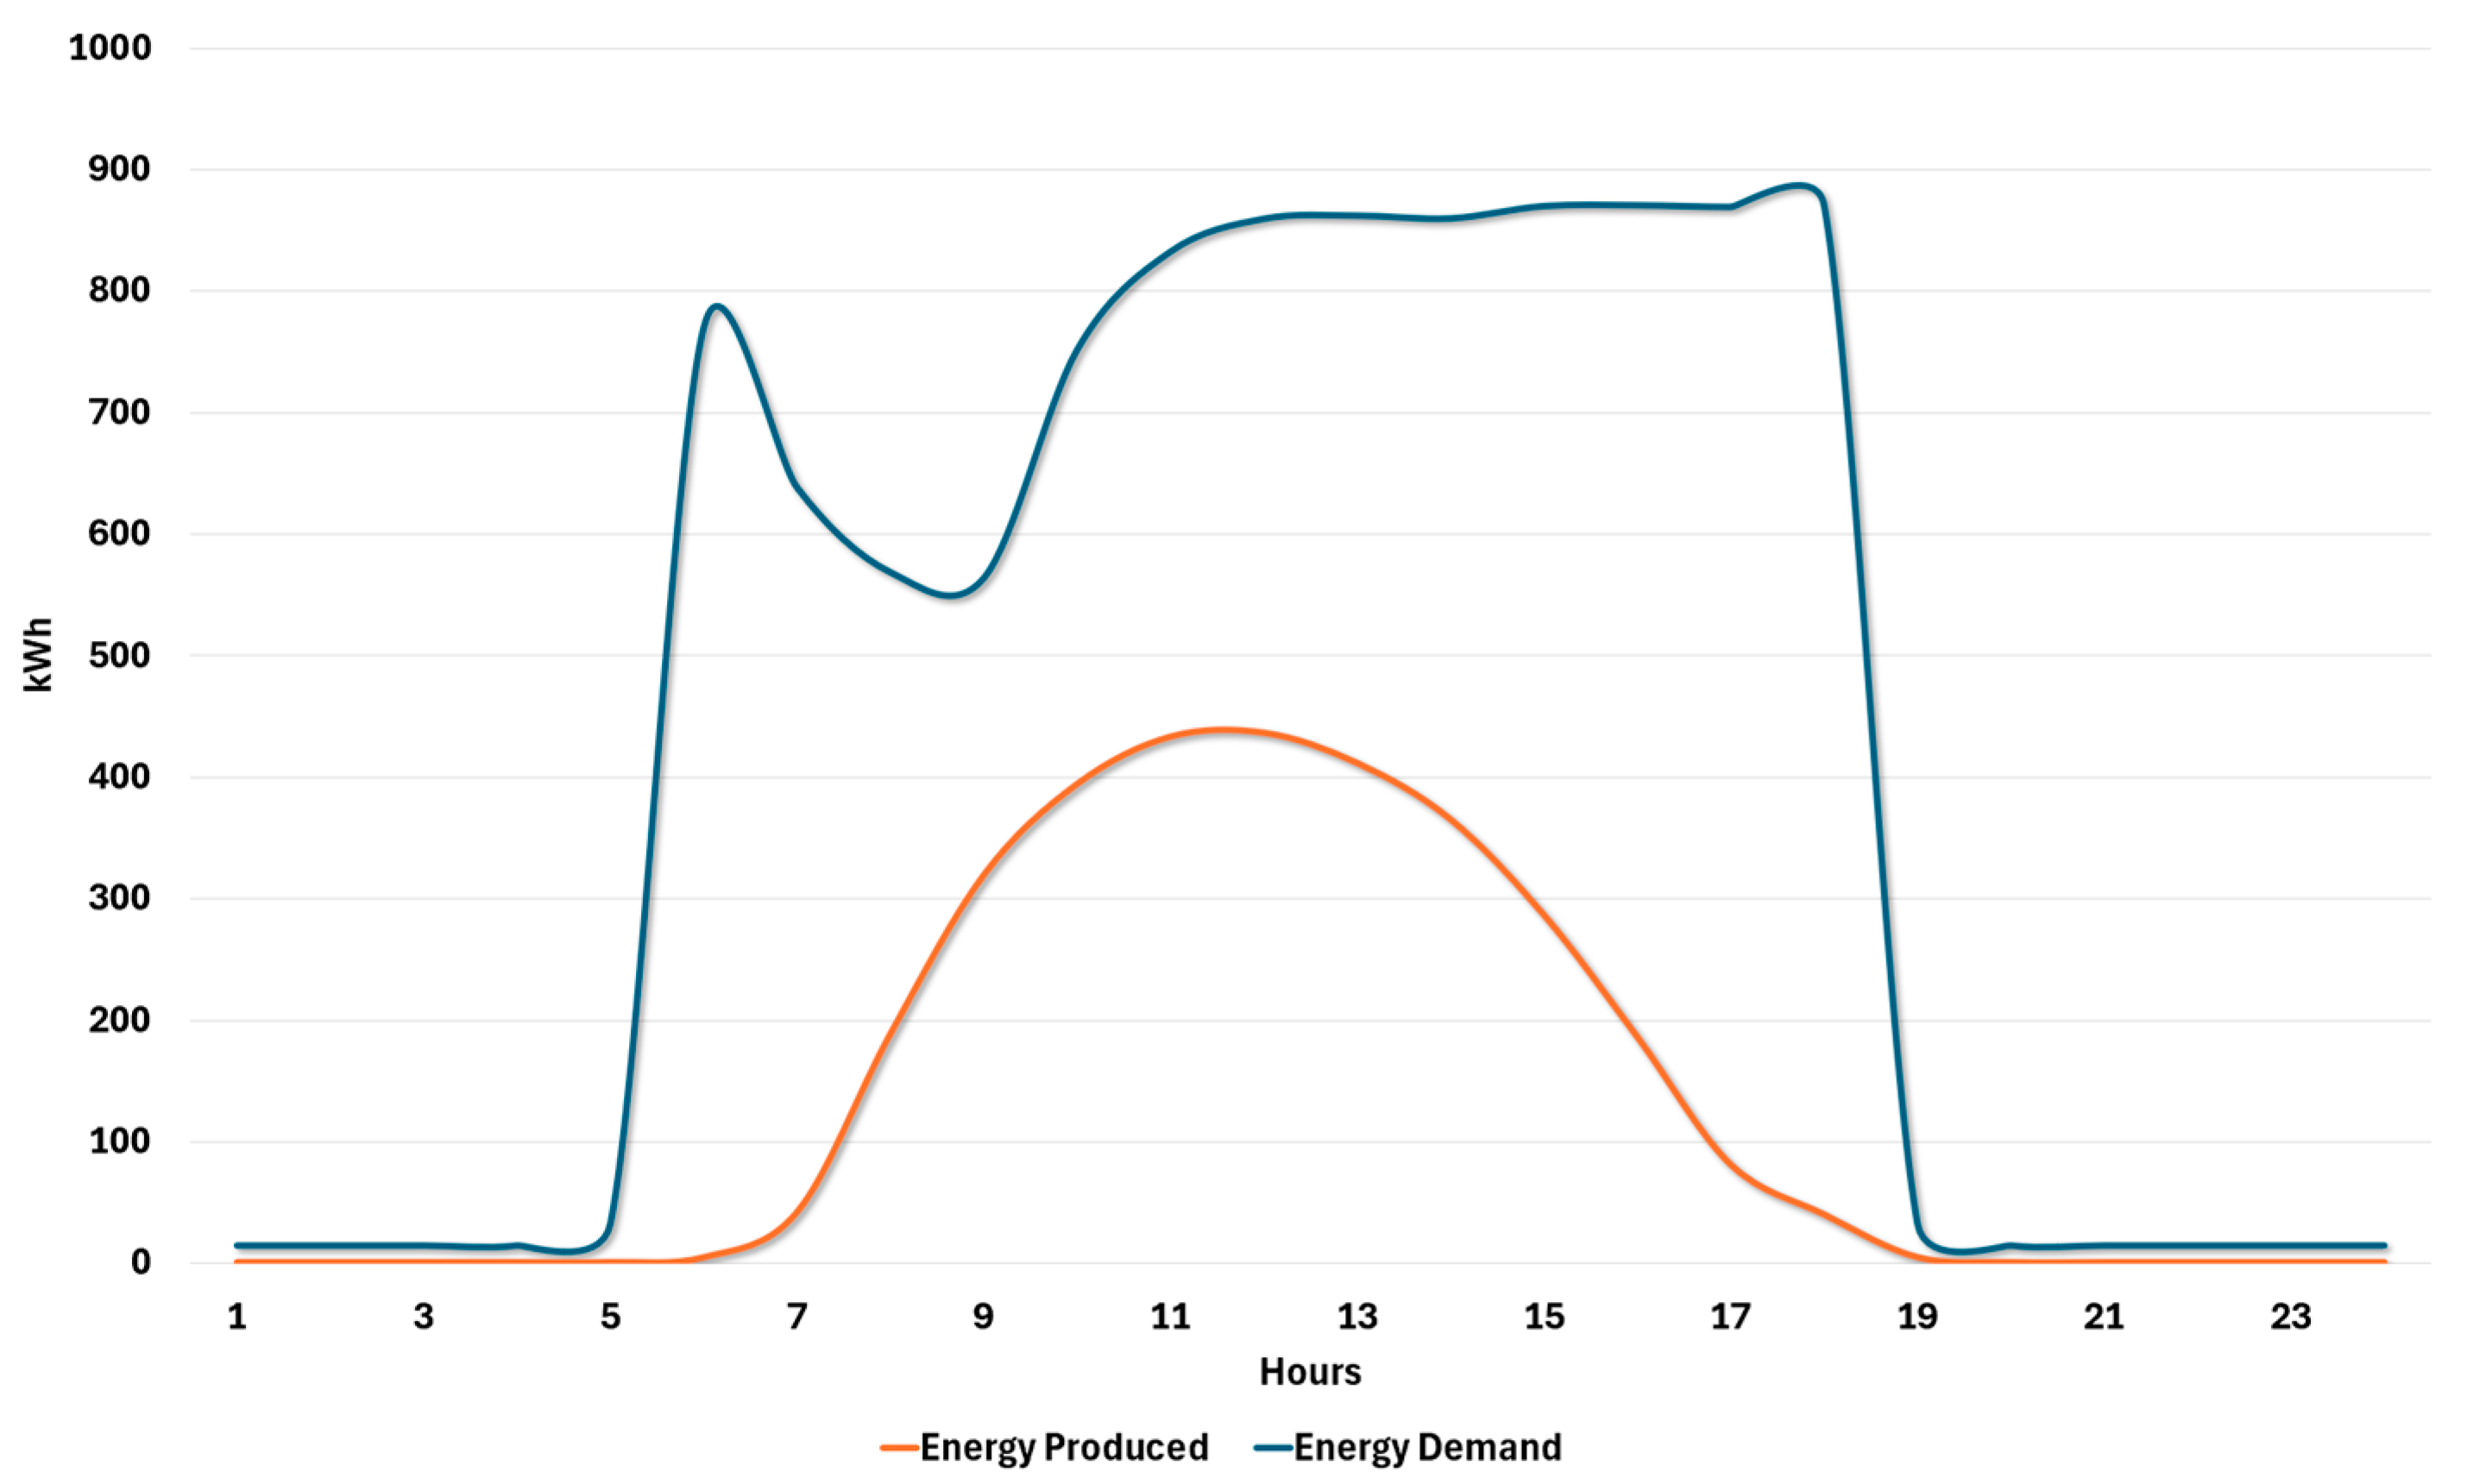
The analysis of hourly energy balance between photovoltaic (PV) generation and building electricity consumption across four representative months shows clear seasonal and daily fluctuations in both supply and demand patterns. Figure 9, Figure 10, Figure 11 and Figure 12 display the average hourly energy for March, April, August, and December, comparing the building’s energy consumption with PV production. In March, as shown in Figure 9, PV output peaks at around 380 kWh between 10:00 and 11:00, resulting in exceeding the building’s relatively low demand caused by cooler temperatures in the hot climate zone, eliminating the need for cooling. Late afternoon demand still requires grid support. A similar profile occurs in November. April, shown in Figure 10, exhibits a different energy profile. The peak energy produced by PV is slightly higher than the building’s energy demand. The PV peaks near 470 kWh at 11:00, marginally higher than the demand, which was around 450 kWh, and occurs from 14:00 to 17:00. The total energy generated by PV over the day can cover about 80% of the energy demand. When distributing the energy produced throughout the day, it fully meets the building’s energy demand from the start of the day until noon. After that, it limits the midday surplus because the demand exceeds PV energy production. This profile also appears in October. In August, as shown in Figure 11, energy demand peaks occurred during the summer months. The energy demand ranged from 850 to 880 kWh between 09:00 and 17:00, while PV peaks at about 430 kWh, accounting for 30% of the consumption. This profile, observed from May to September, limits coverage to a maximum of 40% and highlights the necessity of being connected to the grid. December, as shown in Figure 12, has the lowest PV peak of about 370 kWh at 11:00, typical of winter. However, the low building energy demand allows PV to surpass energy consumption during daylight, except for a small pre-sunrise peak of around 150 kWh. A similar energy profile occurs in January and February.
Collectively, these energy profiles demonstrate a strong seasonal dependence of PV energy production and building energy demand. The seasonal effects of summer and winter are illustrated in the energy profiles, emphasizing the importance of energy management strategies to maximize self-consumption and reduce grid dependence. During winter, excess PV energy produced can be exported to the grid, while in summer, PV output may not fully meet the energy demand, requiring grid purchases. Since the PV system covers roughly 61.7% of annual demand, off-grid operation with battery storage is not necessary, and maintaining a grid connection remains cost-effective.
In terms of evaluating the economic viability of the PV system, an analysis of cost savings and potential investment payback periods was conducted. This required determining the electricity tariff applicable to the reference building, which is categorized as a governmental educational facility. According to the Saudi Electricity Company (Marafiq, Riyadh, Saudi Arabia), the tariff for this category is USD 0.0854 per kWh [74]. The price of electricity in Saudi Arabia remains relatively fixed due to government subsidies. Based on this rate, the annual energy cost for the case study building, calculated using its total electricity consumption of 1,666,318.25 kWh, was compared with the price of the energy produced by the PV system in the first year, which was 1,028,494.50 kWh. Table 3 presents the cost-saving results, showing that the PV system yields annual savings of USD 87,764.86, covering 61.7% of the building’s total electricity expenses. Table 4 provides a monthly breakdown of cost savings, with July recording the highest savings (USD 9174.15) and February the lowest (USD 5240.05). The average monthly savings from PV-generated electricity amounted to USD 7313.74. These results demonstrate that implementing the PV system offers notable economic benefits, particularly in regions with high solar irradiance and abundant sunlight.
To assess the economic benefits of the PV system, a cost–benefit analysis was performed to estimate the investment payback period and overall financial viability. The study incorporated key parameters, including capital expenditure (CAPEX) associated with the installation cost, operational expenditure (OPEX) for annual maintenance, annual savings from electricity generation, and the investment payback period required to recover the initial investment. Table 5 presents the input parameters and calculated values. The capacity of the PV system installed on the building was 1,028,494.50 kWh, achieved using 830 panels. The installation cost was estimated at USD 640 per kW, resulting in a total CAPEX of USD 531,200. The annual maintenance cost (OPEX) was calculated at 1.5% of the total system cost, amounting to USD 7986 per year. The maintenance includes regular inspection, cleaning of dust, and preventive maintenance. The annual net savings were determined by subtracting the maintenance cost from the gross savings based on the PV output and electricity tariff (USD 0.0854/kWh). The annual energy savings were USD 87,764.86, with a net savings amount of USD 79,796.86. In order to calculate the investment payback period, the degradation of PV performance needs to be taken into account. Based on the PV manufacturer’s data, the degradation ratio over 25 years is 1% in the first year and 0.4% in subsequent years. Thus, the profit in the first year, considering energy production with 1% degradation and 1.5% maintenance, is USD 78,987.10, with an energy output of 1,018,209.56 kWh per year. The profit gradually decreases as PV degradation decreases by 0.4%, reaching an accumulation of 10.6% in year 25. By that year, energy production had dropped to 924,828.68 kWh/year, meeting 55.5% of the building’s energy demand. Table 6 displays the energy produced over the PV system’s lifespan, decreasing by 1% and 0.4%, along with the fixed maintenance cost of USD 7968 based on system size, and the resulting profit.
Based on these figures, the investment payback period is calculated for the expected PV system lifespan of 25 years, which was under 7 years. Table 7 summarizes the payback calculation, considering the PV system’s expected lifespan of 25 years. This indicates that the system becomes cost-neutral in under 7 years and continues to generate financial returns for an additional 18 years. Over its operational lifetime, the PV system is projected to save USD 1,873,462, nearly three times the initial investment, demonstrating that rooftop PV integration is a financially profitable and sustainable strategy for enhancing a building’s energy self-sufficiency.
4. Conclusions

This study developed a framework to evaluate the effectiveness and economic viability of rooftop PV system integration for a high-density higher-education building in Dammam, KSA. A multiphase methodology was adopted, involving architectural modeling using Autodesk Revit (v25.4.0.32) and dynamic energy consumption simulation modeling via DesignBuilder (v7.3.1.003). The case study focused on the College of Architecture and Planning at Imam Abdulrahman Bin Faisal University. A comprehensive LOD 3 model was developed, incorporating real operational data, including HVAC configurations, lighting systems, occupancy schedules, and construction materials.
In addition, a high-accuracy energy simulation model was demonstrated, achieving 92.28% compared with the actual building energy consumption. The analysis of the building roof area determined that 60% of the roof area is suitable for PV panel installation after accounting for shading, structural elements, maintenance access, and circulation. The utilized PV system produces 1,028,494.5 kWh, offsetting 61.7% of the building’s 1,666,318.25 kWh electricity demand in the first year and 55.5% after 25 years, considering panel degradation. Seasonal generation profiles revealed a winter energy surplus and a summer shortfall, underscoring the value of coupling PV systems with storage or net metering strategies to balance peak cooling demands.
Economic analysis, based on a prevailing electricity tariff of USD 0.0854/kWh, forecasted average annual savings of USD 74,938.84 after accounting for installation and maintenance costs. Based on the yearly savings, the payback period is under seven years. Over a 25-year lifecycle, the PV system is projected to deliver net financial benefits exceeding USD 1,873,462, which represents nearly a threefold return on investment. These findings not only validate the technical and financial viability of rooftop PV integration in hot-climate institutional buildings but also support the strategic objectives of Saudi Vision 2030 by quantifying the carbon and economic benefits of decarbonizing the built environment. This study offers a replicable framework for sustainable campus planning in similar arid regions.
Future work should involve higher-resolution energy data to improve accuracy and provide more insights into the system. Comparative studies across varied building types and geographic locations in KSA and similar climatic zones would further help generalize the findings and support national-level policy and planning for renewable energy in the education sector.

Funding

This research did not receive any specific grant from funding agencies in the public, commercial, or not-for-profit sectors.

Institutional Review Board Statement

Not applicable.

Informed Consent Statement

Not applicable.

Data Availability Statement

Data will be made available on request.

Conflicts of Interest

The author declares that they have no known competing financial interests or personal relationships that could have appeared to influence the work reported in this paper.

References

  1. Sadigov, R. Rapid growth of the world population and its socioeconomic results. Sci. World J. 2022, 2022, 8110229. [Google Scholar] [CrossRef] [PubMed]
  2. BP. BP Energy Outlook 2030. 2013. Available online: https://www.bp.com/content/dam/bp/business-sites/en/global/corporate/pdfs/energy-economics/energy-outlook/bp-energy-outlook-2013.pdf (accessed on 2 January 2025).
  3. US Green Building Council. Research Anthology of Health-Promoting Building Strategies; US Green Building Council: Washington, DC, USA, 2021. [Google Scholar]
  4. Cao, X.; Dai, X.; Liu, J. Building energy-consumption status worldwide and the state-of-the-art technologies for zero-energy buildings during the past decade. Energy Build. 2016, 128, 198–213. [Google Scholar] [CrossRef]
  5. Liobikienė, G.; Butkus, M. The European Union possibilities to achieve targets of Europe 2020 and Paris agreement climate policy. Renew. Energy 2017, 106, 298–309. [Google Scholar] [CrossRef]
  6. Birchall, S.; Wallis, I.; Churcher, D.; Pezzutto, S.; Fedrizzi, R.; Causse, E. Survey on the Energy Needs and Architectural Features of the EU Building Stock. iNSPiRe Project, BSRIA and EURAC. 2014. Available online: https://www.rispostaserramenti.com/wp-content/uploads/2015/02/REPORT_EURAC0.pdf (accessed on 28 December 2024).
  7. Kondziella, H.; Bruckner, T. Flexibility requirements of renewable energy based electricity systems–a review of research results and methodologies. Renew. Sustain. Energy Rev. 2016, 53, 10–22. [Google Scholar] [CrossRef]
  8. Woldeyohannes, A.D.; Woldemichael, D.E.; Baheta, A.T. Sustainable renewable energy resources utilization in rural areas. Renew. Sustain. Energy Rev. 2016, 66, 1–9. [Google Scholar] [CrossRef]
  9. Tian, B. A LiDAR DSM Based Geometry Modelling Method to Improve Solar Irradiance Simulation and PV Yield Prediction in Urban Environments; Eindhoven University of Technology: Eindhoven, The Netherlands, 2021. [Google Scholar]
  10. Martín-Jiménez, J.; Del Pozo, S.; Sánchez-Aparicio, M.; Lagüela, S. Multi-scale roof characterization from LiDAR data and aerial orthoimagery: Automatic computation of building photovoltaic capacity. Autom. Constr. 2020, 109, 102965. [Google Scholar] [CrossRef]
  11. Baljit, S.S.S.; Chan, H.Y.; Sopian, K. Review of building integrated applications of photovoltaic and solar thermal systems. J. Clean. Prod. 2016, 137, 677–689. [Google Scholar] [CrossRef]
  12. Prishya, A.A.; Chopra, L. Comprehensive review on uses of silicon dioxide in solar cell. Mater. Today: Proc. 2023, 72, 1471–1478. [Google Scholar]
  13. Ushasree, P.M.; Bora, B. Silicon solar cells. In Solar Energy Capture Materials; Royal Society of Chemistry: Cambridge, UK, 2019; pp. 1–55. [Google Scholar] [CrossRef]
  14. Dehwah, A.H.; Asif, M.; Rahman, M.T. Prospects of PV application in unregulated building rooftops in developing countries: A perspective from Saudi Arabia. Energy Build. 2018, 171, 76–87. [Google Scholar] [CrossRef]
  15. Khan, M.M.A.; Asif, M.; Stach, E. Rooftop PV potential in the residential sector of the Kingdom of Saudi Arabia. Buildings 2017, 7, 46. [Google Scholar] [CrossRef]
  16. Alfalah, B. Assessing the Availability and Adoption of Advanced Battery Storage Systems for Solar Photovoltaic Applications in Saudi Arabia Residential Buildings. Energies 2025, 18, 2503. [Google Scholar] [CrossRef]
  17. Akkose, G.; Akgul, C.M.; Dino, I.G. Educational building retrofit under climate change and urban heat island effect. J. Build. Eng. 2021, 40, 102294. [Google Scholar] [CrossRef]
  18. Pereira, L.D.; Raimondo, D.; Corgnati, S.P.; Da Silva, M.G. Energy consumption in schools–A review paper. Renew. Sustain. Energy Rev. 2014, 40, 911–922. [Google Scholar] [CrossRef]
  19. Kim, J.; de Dear, R. Thermal comfort expectations and adaptive behavioural characteristics of primary and secondary school students. Build. Environ. 2018, 127, 13–22. [Google Scholar] [CrossRef]
  20. Alfalah, B.; Shahrestani, M.; Shao, L. Identifying occupancy patterns and profiles in higher education institution buildings with high occupancy density–A case study. Intell. Build. Int. 2023, 15, 45–61. [Google Scholar] [CrossRef]
  21. Alfalah, B. Identifying Occupancy Patterns and Profiles and Their Influence on Energy Performance in High-Density Higher Educational Buildings. Ph.D. Thesis, University of Reading, Reading, UK, 2023. [Google Scholar] [CrossRef]
  22. Wargocki, P.; Wyon, D.P. The effects of moderately raised classroom temperatures and classroom ventilation rate on the performance of schoolwork by children (RP-1257). Hvac&R Res. 2007, 13, 193–220. [Google Scholar]
  23. Hutchins, M. Saudi Arabia begins tender process for 300 MW PV plant. PV Magazine, 20 February 2017. [Google Scholar]
  24. Wang, D.; Qi, T.; Liu, Y.; Wang, Y.; Fan, J.; Wang, Y.; Du, H. A method for evaluating both shading and power generation effects of rooftop solar PV panels for different climate zones of China. Sol. Energy 2020, 205, 432–445. [Google Scholar] [CrossRef]
  25. Fouad, M.M.; Shihata, L.A.; Morgan, E.I. An integrated review of factors influencing the perfomance of photovoltaic panels. Renew. Sustain. Energy Rev. 2017, 80, 1499–1511. [Google Scholar] [CrossRef]
  26. Prataviera, E.; Vivian, J.; Lombardo, G.; Zarrella, A. Evaluation of the impact of input uncertainty on urban building energy simulations using uncertainty and sensitivity analysis. Appl. Energy 2022, 311, 118691. [Google Scholar] [CrossRef]
  27. Goffart, J.; Mara, T.; Wurtz, E. Generation of stochastic weather data for uncertainty and sensitivity analysis of a low-energy building. J. Build. Phys. 2017, 41, 41–57. [Google Scholar] [CrossRef]
  28. Ding, Y.; Shen, Y.; Wang, J.; Shi, X. Uncertainty sources and calculation approaches for building energy simulation models. Energy Procedia 2015, 78, 2566–2571. [Google Scholar] [CrossRef]
  29. Kočí, J.; Kočí, V.; Maděra, J.; Černý, R. Effect of applied weather data sets in simulation of building energy demands: Comparison of design years with recent weather data. Renew. Sustain. Energy Rev. 2019, 100, 22–32. [Google Scholar] [CrossRef]
  30. Erba, S.; Causone, F.; Armani, R. The effect of weather datasets on building energy simulation outputs. Energy Procedia 2017, 134, 545–554. [Google Scholar] [CrossRef]
  31. Zukowski, M.; Kosior-Kazberuk, M.; Blaszczynski, T. Energy and environmental performance of solar thermal collectors and PV panel system in renovated historical building. Energies 2021, 14, 7158. [Google Scholar] [CrossRef]
  32. Bilir, L.; Yildirim, N. Photovoltaic system assessment for a school building. Int. J. Hydrogen Energy 2017, 42, 17856–17868. [Google Scholar] [CrossRef]
  33. Maghrabie, H.M.; Elsaid, K.; Sayed, E.T.; Abdelkareem, M.A.; Wilberforce, T.; Olabi, A.G. Building-integrated photovoltaic/thermal (BIPVT) systems: Applications and challenges. Sustain. Energy Technol. Assess. 2021, 45, 101151. [Google Scholar] [CrossRef]
  34. Dang, H.A.; Nguyen, T.K. Impacts of Roof-top Solar Photovoltaic Modules on Building Energy Performance: Case Study of a Residence in HCM City, Vietnam. In IOP Conference Series: Earth and Environmental Science; IOP Publishing: Bristol, UK, 2020; Volume 505, p. 012014. [Google Scholar]
  35. Deng, G.; Newton, P. Assessing the impact of solar PV on domestic electricity consumption: Exploring the prospect of rebound effects. Energy Policy 2017, 110, 313–324. [Google Scholar] [CrossRef]
  36. Farghaly, Y.; Hassan, F. A simulated study of building integrated photovoltaics (BIPV) as an approach for energy retrofit in buildings. Energies 2019, 12, 3946. [Google Scholar] [CrossRef]
  37. Zhao, J.; Du, Y. A study on energy-saving technologies optimization towards nearly zero energy educational buildings in four major climatic regions of China. Energies 2019, 12, 4734. [Google Scholar] [CrossRef]
  38. Bot, K.; Aelenei, L.; Gomes, M.D.G.; Santos Silva, C. Performance assessment of a building integrated photovoltaic thermal system in mediterranean climate—A numerical simulation approach. Energies 2020, 13, 2887. [Google Scholar] [CrossRef]
  39. Rey-Hernandez, J.M.; Velasco-Gómez, E.; San José-Alonso, J.F.; Tejero-Gonzalez, A.; Rey-Martinez, F.J. Energy analysis at a near zero energy building. A case-study in Spain. Energies 2018, 11, 857. [Google Scholar] [CrossRef]
  40. Alyami, M.; Omer, S. Building energy performance simulation: A case study of modelling an existing residential building in Saudi Arabia. Environ. Res. Infrastruct. Sustain. 2021, 1, 035001. [Google Scholar] [CrossRef]
  41. Fazelpour, F.; Bakhshayesh, A.; Alimohammadi, R.; Saraei, A. An assessment of reducing energy consumption for optimizing building design in various climatic conditions. Int. J. Energy Environ. Eng. 2022, 13, 319–329. [Google Scholar] [CrossRef]
  42. Mahmoud, A.S.; Asif, M.; Hassanain, M.A.; Babsail, M.O.; Sanni-Anibire, M.O. Energy and economic evaluation of green roofs for residential buildings in hot-humid climates. Buildings 2017, 7, 30. [Google Scholar] [CrossRef]
  43. Cárdenas, J.; Osma, G.; Caicedo, C.; Torres, A.; Sánchez, S.; Ordóñez, G. Building energy analysis of Electrical Engineering Building from DesignBuilder tool: Calibration and simulations. In IOP Conference Series: Materials Science and Engineering; IOP Publishing: Bristol, UK, 2016; Volume 138, p. 012013. [Google Scholar]
  44. Rahman, M.; Rasul, M.; Khan, M. Energy Conservation Measures in an Institutional Building by Dynamic Simulation Using DesignBuilder. 2008. Available online: https://www.google.com/url?sa=t&source=web&rct=j&opi=89978449&url=https://acquire.cqu.edu.au/articles/conference_contribution/Energy_conservation_measures_in_an_institutional_building_by_dynamic_simulation_using_DesignBuilder/13424813/files/25828685.pdf&ved=2ahUKEwi4pqOctZaPAxXfj68BHXacAMsQFnoECBYQAQ&usg=AOvVaw0JqTkT4irD6vWrnxXcYFP3 (accessed on 28 June 2025).
  45. Hoseinzadeh, S.; Hadi Zakeri, M.; Shirkhani, A.; Chamkha, A.J. Analysis of energy consumption improvements of a zero-energy building in a humid mountainous area. J. Renew. Sustain. Energy 2019, 11, 015103. [Google Scholar] [CrossRef]
  46. Al Huneidi, D.I.; Tahir, F.; Al-Ghamdi, S.G. Energy modeling and photovoltaics integration as a mitigation measure for climate change impacts on energy demand. Energy Rep. 2022, 8, 166–171. [Google Scholar] [CrossRef]
  47. Dehwah, A.H.; Asif, M. Assessment of net energy contribution to buildings by rooftop photovoltaic systems in hot-humid climates. Renew. Energy 2019, 131, 1288–1299. [Google Scholar] [CrossRef]
  48. Costanzo, V.; Yao, R.; Essah, E.; Shao, L.; Shahrestani, M.; Oliveira, A.C.; Araz, M.; Hepbasli, A.; Biyik, E. A method of strategic evaluation of energy performance of Building Integrated Photovoltaic in the urban context. J. Clean. Prod. 2018, 184, 82–91. [Google Scholar] [CrossRef]
  49. Popa, L.G.; Brumaru, M. Optimizing buildings energy performance through photovoltaic panel integration within a mobile shading system. Procedia Manuf. 2018, 22, 765–772. [Google Scholar] [CrossRef]
  50. Zheng, Y.; Weng, Q. Modeling the effect of green roof systems and photovoltaic panels for building energy savings to mitigate climate change. Remote Sens. 2020, 12, 2402. [Google Scholar] [CrossRef]
  51. An-Naggar, A.S.; Ibrahim, M.A.; Khalil, E.E. Energy performance simulation in residential buildings. Procedia Eng. 2017, 205, 4187–4194. [Google Scholar] [CrossRef]
  52. Ashrafian, T. Enhancing school buildings energy efficiency under climate change: A comprehensive analysis of energy, cost, and comfort factors. J. Build. Eng. 2023, 80, 107969. [Google Scholar] [CrossRef]
  53. Alfalah, B.; Shahrestani, M.; Shao, L. Machine Learning Occupancy Prediction Models-A Case Study. ASHRAE Trans. 2023, 129, 694–702. [Google Scholar] [CrossRef]
  54. Alfalah, B.; Shahrestani, M.; Shao, L. Developing a Hidden Markov model for occupancy prediction in high-density higher education buildings. J. Build. Eng. 2023, 73, 106795. [Google Scholar] [CrossRef]
  55. Mundu, M.M.; Nnamchi, S.N.; Sempewo, J.I.; Uti, D.E. Simulation modeling for energy systems analysis: A critical review. Energy Inform. 2024, 7, 75. [Google Scholar] [CrossRef]
  56. Subramanian, A.S.R.; Gundersen, T.; Adams, T.A. Modeling and simulation of energy systems: A review. Processes 2018, 6, 238. [Google Scholar] [CrossRef]
  57. Vollaro, R.D.L.; Guattari, C.; Evangelisti, L.; Battista, G.; Carnielo, E.; Gori, P. Building energy performance analysis: A case study. Energy Build. 2015, 87, 87–94. [Google Scholar] [CrossRef]
  58. De Rosa, M.; Bianco, V.; Scarpa, F.; Tagliafico, L.A. Heating and cooling building energy demand evaluation; a simplified model and a modified degree days approach. Appl. Energy 2014, 128, 217–229. [Google Scholar] [CrossRef]
  59. Minai, A.F.; Husain, M.A.; Naseem, M.; Khan, A.A. Electricity demand modeling techniques for hybrid solar PV system. Int. J. Emerg. Electr. Power Syst. 2021, 22, 607–615. [Google Scholar] [CrossRef]
  60. Goto, M.; Kitamura, H.; Sagawa, D.; Obara, T.; Tanaka, K. Simulation analysis of electricity demand and supply in Japanese communities focusing on solar PV, battery storage, and electricity trading. Energies 2023, 16, 5137. [Google Scholar] [CrossRef]
  61. Waas, L. Review of BIM-based software in architectural design: Graphisoft archicad VS autodesk revit. J. Artif. Intell. Archit. 2022, 1, 14–22. [Google Scholar] [CrossRef]
  62. Hamad, M. Revit 2018 Architecture; Walter de Gruyter GmbH & Co KG: Berlin, Germany, 2017. [Google Scholar]
  63. Garg, V.; Mathur, J.; Bhatia, A. Building Energy Simulation: A Workbook Using Designbuilder™; CRC Press: Boca Raton, FL, USA, 2020. [Google Scholar] [CrossRef]
  64. Popescu, L.L.; Popescu, R.S. Utilizing Computational Modeling for Real-Time Analysis of Energy Dynamics in Educational Structures. In Proceedings of the 2024 9th International Conference on Energy Efficiency and Agricultural Engineering (EE&AE), Ruse, Bulgaria, 27–29 June 2024; IEEE: New York, NY, USA, 2024. [Google Scholar] [CrossRef]
  65. Arnfield, A.J. Köppen Climate Classification. Encyclopedia Britannica. 2025. Available online: https://www.britannica.com/science/Koppen-climate-classification (accessed on 4 February 2025).
  66. Climate-Data.org (n.d.) Climate: Dammam. Available online: https://en.climate-data.org/asia/saudi-arabia/eastern-province/dammam-3555 (accessed on 4 February 2025).
  67. Time and Date (n.d.) Climate and Weather Averages in Dammam. Available online: https://www.timeanddate.com/weather/saudi-arabia/dammam/climate (accessed on 4 February 2025).
  68. Kotak, Y.; Gago, E.J.; Mohanty, P.; Muneer, T. Installation of roof-top solar PV modules and their impact on building cooling load. Build. Serv. Eng. Res. Technol. 2014, 35, 613–633. [Google Scholar] [CrossRef]
  69. Li, H.X.; Zhang, Y.; Edwards, D.; Hosseini, M.R. Improving the energy production of roof-top solar PV systems through roof design. In Building Simulation; Tsinghua University Press: Beijing, China, 2020; Volume 13, pp. 475–487. [Google Scholar]
  70. Hanifi, H.; Schneider, J.; Bagdahn, J. Reduced shading effect on half-cell modules–measurement and simulation. In Proceedings of the 31st European Photovoltaic Solar Energy Conference and Exhibition (EU PVSEC 2015), Hamburg, Germany, 14–18 September 2015; pp. 2529–2533. [Google Scholar]
  71. Sarniak, M.T. Modeling the functioning of the half-cells photovoltaic module under partial shading in the matlab package. Appl. Sci. 2020, 10, 2575. [Google Scholar] [CrossRef]
  72. Mittag, M.; Pfreundt, A.; Shahid, J.; Wöhrle, N.; Neuhaus, D.H. Techno-economic analysis of half cell modules: The impact of half cells on module power and costs. In Proceedings of the 36th European Photovoltaic Solar Energy Conference and Exhibition (EU PVSEC 2019), Marseille, France, 9–13 September 2019; pp. 1032–1039. [Google Scholar]
  73. V-TAC Europe Ltd., n.d. Technical Specifications: 550W Solar Panel Tier 1 [Model: VT-11895]. Available online: https://www.v-tac.eu/images/certificates/Technical-Specs/11895-550W-Solar-Panel-Tier-Technical-Specs.pdf (accessed on 13 February 2025).
  74. Marafiq. Power Tariff. 2025. Available online: https://www.marafiq.com.sa/en/partnering-with-us/power-tariff/ (accessed on 29 May 2025).
Figure 1. Framework for developing a building energy simulation model and measuring the effectiveness of rooftop PV panels integration on the case study building.
Sustainability 17 07523 g001
Figure 2. Exterior envelope of the College of Architecture and Planning building.
Sustainability 17 07523 g002
Figure 3. Building rooftop zoning: the orange zone indicates primary circulation areas, the pink zone represents existing structures, the gray zone denotes shaded zones, and the blue zone highlights areas suitable for PV panel placement.
Sustainability 17 07523 g003
Figure 4. Developed a 3D model showing the inner details of the building.
Sustainability 17 07523 g004
Figure 5. Estimation of the annual energy consumption of the building using DesignBuilder.
Sustainability 17 07523 g005
Figure 6. Placement of PV panels on the building roof.
Sustainability 17 07523 g006
Figure 7. Electricity produced by utilizing PV panels on the case study building roof over one year.
Sustainability 17 07523 g007
Figure 8. Monthly comparison of total energy consumption, PV energy generation, and their differences throughout the year.
Sustainability 17 07523 g008
Figure 9. Average hourly PV energy produced and building demand profiles in March.
Sustainability 17 07523 g009
Figure 10. Average hourly PV energy produced and building demand profiles in April.
Sustainability 17 07523 g010
Figure 11. Average hourly PV energy produced and building demand profiles in August.
Sustainability 17 07523 g011
Figure 12. Average hourly PV energy produced and building demand profiles in December.
Sustainability 17 07523 g012
Table 1. Manufacturing specifications of the photovoltaic panel.
ParameterValue
Photovoltaic TypeMonocrystalline
Max Power (Pmax)550 W
Max Power Voltage (Vmp)41.96 V
Max Power Current (Imp)13.11 A
Open Circuit Voltage (Voc)49.90 V
Short Circuit Current (Isc)14.00 A
Module Efficiency (%)21.28%
Operating temperature−40~+85 °C
Max System VoltageDC 1500 V
Maximum Series Fuse Rating25 A
Module Efficiency21.28%
Power Tolerance0~+3%
Solar Cell Number144 cells (Half-Cell)
Solar Cells Dimension182 mm × 91 mm
Panel Dimension2279 mm × 1134 mm × 35 mm
Weight29 kg
Warranty25 years
Table 2. Total building energy demand, PV electricity production, and their difference over one year.
MonthConsumed (kWh)Produced (kWh)Difference (kWh)
January24,82563,033+38,208 (Surplus)
February13,65661,407+47,751 (Surplus)
March21,37382,138+60,764 (Surplus)
April81,33293,051+11,719 (Surplus)
May177,448103,365−74,083 (Deficit)
June230,546104,824−125,723 (Deficit)
July235,771107,510−128,261 (Deficit)
August234,316104,780−129,536 (Deficit)
September198,40793,315−105,092 (Deficit)
October114,56581,430−33,135 (Deficit)
November37,68669,902+32,215 (Surplus)
December18,67363,741+45,068 (Surplus)
Table 3. Cost of energy consumption, energy production, and annual savings from utilizing the PV system in the building in the first year.
CategoryValue
Cost of Consumed Electricity (the grid)USD 142,192.49
Value of PV Electricity ProducedUSD 87,764.86
Remaining Cost (bought from the grid)USD 54,427.63
Annual Savings from PV61.7%
Table 4. Calculations of the monthly profits from the electricity generated by the PV system.
MonthPV GenerationValue of PV Electricity
January63,033.145378.83
February61,406.865240.05
March82,137.667009.08
April93,183.067951.62
May103,364.918820.47
June104,823.818944.97
July107,509.559174.15
August104,780.068941.23
September93,183.067951.62
October81,430.096948.70
November69,901.565964.93
December63,740.715439.21
Total1,028,494.50 kWhUSD 87,764.86
Table 5. Cost–benefit analysis including investment, installation, and maintenance costs.
ParameterValue
PV SystemProducing 1,028,494.50 kWh/year
CAPEX640 USD/kW
Total CAPEXUSD 531,200
OPEX7968.00 USD/year
Electricity Price0.0854 USD/kWh
Annual PV Output ValueUSD 87,764.86
Annual Net SavingsUSD 79,796.86
Table 6. Degradation of energy production and the profit for 25 years.
YearDegradationEnergy (kWh)Maintenance (USD)Profit (USD)
11%1,018,209.56796878,987.10
20.4%1,014,136.72796878,639.28
30.4%1,010,080.17796878,292.85
230.4%932,271.94796871,648.02
240.4%928,542.85796871,329.56
250.4%924,828.68796871,012.37
Table 7. Analysis of annual savings and payback period for the initial investment.
ParameterValue
Initial InvestmentUSD 531,200
Annual MaintenanceUSD 7968
Annual Average Profit Over 25 YearsUSD 74,938.84
Payback Period~7 years
PV Lifespan25 years
Net Profit Over 25 YearsUSD 1,873,462
Disclaimer/Publisher’s Note: The statements, opinions and data contained in all publications are solely those of the individual author(s) and contributor(s) and not of MDPI and/or the editor(s). MDPI and/or the editor(s) disclaim responsibility for any injury to people or property resulting from any ideas, methods, instructions or products referred to in the content.