Article

Co-Optimization and Interpretability of Intelligent–Traditional Signal Control Based on Spatiotemporal Pressure Perception in Hybrid Control Scenarios

1
Key Laboratory of Road and Traffic Engineering of the Ministry of Education, Tongji University, Shanghai 201804, China
2
Department of Civil and Environmental Engineering, University of California, Berkeley, CA 94720, USA
3
Department of Electrical and Electronic Engineering, Hong Kong Polytenic University, Hong Kong, China
*
Author to whom correspondence should be addressed.
These authors contributed equally to this work.
Sustainability 2025, 17(16), 7521; https://doi.org/10.3390/su17167521
Submission received: 30 July 2025 / Revised: 15 August 2025 / Accepted: 16 August 2025 / Published: 20 August 2025
(This article belongs to the Special Issue Sustainable Traffic and Mobility—2nd Edition)

Abstract

As cities transition toward intelligent traffic systems, hybrid networks combining AI and traditional intersections raise challenges for efficiency and sustainability. Existing studies primarily focus on global intelligence assumptions, overlooking the practical complexities of hybrid control environments. Moreover, the decision-making processes of AI-based controllers remain opaque, limiting their reliability in dynamic traffic conditions. To address these challenges, this study investigates the following realistic scenario: a Deep Reinforcement Learning (DRL) intersection surrounded by max–pressure-controlled neighbors. A spatiotemporal pressure perception agent is proposed, which (a) uses a novel Holistic Traffic Dynamo State (HTDS) representation that integrates real-time queue, predicted vehicle merging patterns, and approaching traffic flows and (b) innovatively proposes Neighbor–Pressure–Adaptive Reward Weighting (NP-ARW) mechanism to dynamically adjust queue penalties at incoming lanes based on relative pressure differences. Additionally, spatial–temporal pressure features are modeled using 1D convolutional layers (Conv1D) and attention mechanisms. Finally, our Strategy Imitation–Mechanism Attribution framework leverages XGBoost and Decision Trees to systematically analyze traffic condition impacts on phase selection, fundamentally enabling explainable control logic. Experimental results demonstrate the following significant improvements: compared to fixed-time control, our method reduces average travel time by 65.45% and loss time by 85.04%, while simultaneously decreasing average queue lengths and pressure at neighboring intersections by 91.20% and 95.21%, respectively.

1. Introduction

Urban transportation systems worldwide face mounting pressure in mitigating efficiency and sustainability, particularly in reducing traffic congestion, carbon emissions, and energy consumption. Equally critical is ensuring safety for all road users, including motorists, pedestrians, and cyclists, as recent studies have demonstrated persistent safety challenges for vulnerable users even in intelligent traffic management systems [1]. Advances in adaptive traffic signal control (ATSC) [2,3,4] have improved traffic management. Among these, the max-pressure algorithm [5,6] uniquely optimizes local flow by dynamically balancing the pressure between the incoming and outgoing lanes. Although using local pressure measurements could aid coordination with neighboring intersections to some extent, max-pressure controllers still lack guaranteed network-wide coordination and make suboptimal decisions when balancing competing traffic flows. Other ATSC methods also work well in scenarios with predictable demand patterns [7,8] but often struggle to handle the complex spatiotemporal dynamics of real-world networks.
Deep Reinforcement Learning (DRL)-based ATSC has shown great promise in handling complex traffic scenarios through various technical innovations. Early work by Li et al. [9] introduced stacked autoencoders for Q-function approximation, while Liang et al. [10] improved this approach using Double Dueling Deep Q Networks (3DQNs), both significantly reducing traffic delays. Wei et al. [11] further enhanced coordination through graph attention networks. For large-scale implementation, Garg et al. [12] developed vision-based policy gradient methods that adapt well to real-time traffic changes, complemented by Chu et al.’s multi-agent A2C framework [13] for stable network-wide control. Chen et al. [14] contributed a parameter-sharing architecture that boosts urban scalability. From an optimization standpoint, Prashanth and Bhatnagar [15] proved policy gradient methods effective for queue stabilization. Together, these approaches demonstrate DRL’s ability to learn complex traffic patterns and optimize outcomes across different operational conditions.
However, as cities transition toward intelligent traffic management, an underexplored challenge emerges: the hybrid control scenario, where intelligent intersections (e.g., AI-driven signal controllers) coexist with traditional non-intelligent ones. Most existing research assumes completely intelligent networks [16,17,18,19,20], but real-world upgrades happen gradually. In this mixed environment, isolated optimizations may lead to suboptimal coordination between local and neighboring intersections, thereby degrading their collective performance. This is especially problematic when neighboring intersections use reactive strategies like max-pressure. The controller’s reactive, queue-driven nature generates unpredictable pressure waves across the network through its immediate responses to local congestion [21]. Such dynamic fluctuations present a highly non-stationary environment for learning. Some DRL methods may fail under such conditions because they struggle to model the essential spatiotemporal relationships in traffic flow data, especially during abrupt demand shifts.
Despite the theoretical promise of Deep Reinforcement Learning in adaptive traffic signal control, another challenge remains unaddressed in practical implementations. The inherent black-box nature of DRL algorithms obscures the decision logic, raising concerns about how traffic conditions translate into signal phase selection and whether these choices remain reliable under different conditions. Specifically, understanding which traffic features (e.g., queue lengths, delays, flow rates) most significantly influence agent decisions requires deeper investigation. Furthermore, current DRL approaches typically neglect sustainability metrics [16,18,19,22], particularly assessments of network-wide carbon emissions. These shortcomings not only limit system performance but also reduce confidence in intelligent traffic systems, delaying their widespread use.
To bridge these gaps, this study proposes a spatiotemporal pressure perception agent for co-optimizing intelligent–traditional signal control across hybrid networks. The framework centers on a DRL-controlled intelligent intersection surrounded by max–pressure-controlled intersections. This agent dynamically balances queue management and pressure mitigation, and the experimental results quantitatively evaluate its sustainability impacts. The framework of our approach is shown in Figure 1. The main contributions of this paper are:
(1)
Holistic Traffic Dynamo State (HTDS): A novel state representation that holistically captures both incoming and outgoing lane conditions by integrating three key elements classified using the Intelligent Driver Model (IDM)—real-time queue lengths, predicted vehicle merging patterns, and approaching traffic flows through downstream state propagation.
(2)
Neighbor–Pressure–Adaptive Reward Weighting (NP-ARW) mechanism: A reward engineering mechanism is introduced, which calculates pressure differences between corresponding connecting lanes of the DRL-controlled intersection and its neighboring max-pressure intersections. It dynamically adjusts queue penalty weights and adapts reward contributions to redistribute congestion toward lower-pressure regions.
(3)
Comparative Explainable Control via Phase Decision Logic Analysis: Leveraging our Strategy Imitation–Mechanism Attribution framework, which employs XGBoost for strategy imitation and Decision Trees for mechanism attribution. We develop a post hoc interpretation module. This module quantifies feature importance for both cooperative and non-cooperative agents, explicitly uncovers systematic differences in phase-switching logic during conflicting traffic movements, and analyzes decision-making rationale across diverse traffic scenarios. Furthermore, it provides the complete distilled decision tree structure as interpretable decision logic.
The remainder of this paper is organized as follows. Section 2 reviews the relevant literature, focusing on hybrid traffic control scenarios and explainability research. Section 3 details our methodology, including the design of the spatiotemporal pressure perception agent; the Holistic Traffic Dynamo State (HTDS) representation; the Neighbor–Pressure–Adaptive Reward Weighting (NP-ARW) mechanism; the Conv-Attention Traffic Net (CAT-Net) architecture; and a mechanistic interpretability framework. Section 4 presents experimental settings, results, and interpretability analyses. Finally, Section 5 concludes the paper, summarizing key findings and outlining future research directions.

2. Related Work

2.1. Traditional Signal Control

Traditional traffic signal control has progressed through three evolutionary stages characterized by increasing responsiveness yet persistent limitations. Fixed-time [23] control relied on static schedules derived from historical patterns, with Webster’s queuing-theoretic optimization of cycle lengths and green splits [24] proving inefficient under non-stationary traffic conditions. Actuated control introduced vehicle detection via inductive loops for demand-responsive phase extensions [25], but remained fundamentally limited by localized optimization without network coordination [26]. Subsequently, centralized adaptive systems (e.g., SCOOT’s real-time optimization [7] and SCATS’ plan selection [8]) achieved corridor-level synchronization but faced computational intractability at scale [27], sensor dependency [28], and inflexibility during traffic anomalies [29]. These intrinsic limitations of model-based approaches spurred the development of data-driven methods, particularly Deep Reinforcement Learning approaches.

2.2. Intelligent Signal Control

DRL-based ATSC has advanced traffic optimization by learning complex traffic patterns, typically using state representations built from lane-specific metrics such as queue lengths [21,30,31,32] and waiting times [33,34]. Enhanced approaches like Advanced Traffic State (ATS) [35] refine vehicle-level details on lanes, while CoordLight’s Queue Dynamic State Encoding (QDSE) [16] incorporates microscopic vehicle dynamics. However, these methods predominantly assume fully intelligent networks, ignoring the hybrid reality of urban deployments where legacy controllers (e.g., max-pressure) persist. This limitation triggers operational instability when rule-based neighboring intersections generate dynamic pressure fluctuations that create non-stationary conditions beyond conventional DRL’s operational scope. Consequently, agents exhibit degraded decision-making during flow conflicts and frequent training divergence. Emerging holistic sensing technologies [36,37] enable agents to augment observations under partial observability by incorporating real-time vehicle data from exit lanes, enhancing responsiveness to neighbor-induced pressure dynamics.
In addition, reward engineering strategies have been developed to enhance coordinated ATSC learning. Pressure-minimization rewards that leverage intersection pressure to coordinate upstream and downstream traffic flows have demonstrated proven efficacy in balancing network-wide congestion [14,38]. Subsequent refinements introduced reward reshaping techniques to improve agent coordination. Liu et al. [39] proposed γ-Reward and γ-Attention-Reward, utilizing a spatiotemporal replay buffer for hindsight reward revision. Chu et al. [40] incorporated neighbor intersection data via spatial discount factors to augment agent rewards. Zhang et al. [41] weighted inter-agent information through empirical rules or Pearson correlation coefficients, while Yang et al. [22] employed a dual-network architecture to assess neighbor congestion and adjust local rewards. Although these full-network DRL methods demonstrate efficacy, their cooperative mechanisms remain unvalidated in hybrid intelligent–traditional intersection environments. Furthermore, pressure-based approaches frequently demonstrate trade-off effects, improving adjacent intersections at the expense of local performance. In contrast, our reward design leverages pressure indirectly as a congestion indicator to dynamically weight local queue lengths. Crucially, our approach uniquely exploits dynamic pressure fluctuations from adjacent rule-based controllers, simultaneously enhancing performance at both local and neighboring junctions.
To capture the spatiotemporal traffic dynamics, neural network architectures have been extensively developed. The adaptive DRL framework with infused LSTM prediction [42] demonstrated effective traffic evolution modeling by integrating flow forecasting with reinforcement learning control, achieving 18.1% travel time reduction in SUMO simulations. Similarly, GRU networks enable efficient temporal modeling in distributed multi-agent systems, as demonstrated by Huang et al. [43], where GRU-enhanced architectures process neighborhood information to reduce action space dimensionality, achieving 7% lower conflict rates while accelerating training convergence. For integrated spatiotemporal representation, STMARL [18] extracts features via fused Graph Neural Networks (GNNs) and Recurrent Neural Networks (RNNs), while TeDA-GCRL [44] treats individual lanes as graph nodes within a convolutional framework complemented by temporal rewards. Concurrently, attention mechanisms [45] capture spatial relationships effectively. For instance, CoLight [11] employs Graph Attention Networks (GATs) to weight neighborhood importance for multi-agent coordination. However, these networks are designed for fully DRL-controlled intersections and provide no guarantees for coordinating with rule-based intersections. Given the heightened volatility in traffic flow patterns around rule-based intersections, effectively modeling their coordination dynamics with DRL-controlled intersections requires capturing this inherent fluctuation. To address this, we propose the Conv-Attention Traffic Net (CAT-Net) architecture, which integrates 1D convolutional (Conv1D) layers for multi-scale, lane-level temporal feature extraction with multi-head self-attention. This dual-branch design jointly learns evolutionary traffic patterns and dynamically models critical spatial dependencies between upstream and downstream intersections.

2.3. Hybrid Control Scenario

Fixed-time control regulates constant traffic flows through periodic right-of-way allocation, sequentially serving conflicting movements but often wasting green time during low-demand intervals. Conversely, rule-based max-pressure control responds precisely to real-time queue variations by dynamically adjusting phase priorities. These fundamentally distinct operational paradigms necessitate differentiated DRL strategies since predictable signal patterns emerge from fixed-time intersections, while max-pressure controllers generate stochastic traffic fluctuations that complicate coordination. Empirical studies demonstrate that some conventional DRL methods, such as [46], may fail to converge in environments dominated by max-pressure intersections, losing the capacity to resolve conflicting movements and disproportionately prioritizing dominant traffic flows. Effective adaptation, consequently, may benefit from extended perception horizons with optimized state representations to decode traffic oscillation patterns for predictive modeling. Additionally, given the inherent pressure-sensing characteristics of surrounding intersections, pressure-guided reward mechanisms should be explored to potentially facilitate cooperative congestion dissipation throughout the network. Additionally, most existing ATSC studies generally lack sustainability assessments of their methodologies [21,31,47,48].

2.4. Interpretability of DRL-Based Traffic Signal Control

Despite demonstrating significant advantages in traffic signal control, Deep Reinforcement Learning models often function as opaque “black boxes,” lacking transparent decision-making. This opacity hinders real-world deployment, especially in safety-critical traffic management, where understanding decisions is essential. Consequently, exploring interpretability methods for RL-based traffic signal control holds significant theoretical and practical value.
Research primarily focuses on four interpretability methods:
(1)
Model Distillation and Surrogate Models: These techniques extract interpretable approximations (e.g., decision trees, symbolic rules) from complex RL policies. Verma et al.’s PIRL framework [49] uses domain-specific languages and neural-guided search for symbolic strategies. Alternatively, Ault et al. [50] directly constrained policies to interpretable polynomial functions by custom Deep Q-learning. Their derived functions, which are structurally comparable to weighted sums of traffic features resembling fixed-time control rules, achieved performance comparable to deep neural networks in minimizing delay at single intersections.
(2)
Feature Attribution Methods: These approaches quantify the influence of state features on agent decisions. Approaches like SHAP (Shapley Additive exPlanations) and LIME (Local Interpretable Model-agnostic Explanations) identify critical features impacting control logic. For instance, Rizzo et al. [51] pioneered SHAP for RL-controlled roundabouts, revealing detector state impact on phase choice. Schreiber et al. [52] showed that features like “left-turn vehicle count” significantly boosted corresponding phase Q-values in DQN control.
(3)
Visualization: Tools such as MARLens [53] offer intuitive insights in comparative scenarios and interactive analysis. Researchers could observe agent behavior evolution, test hypotheses, and identify training anomalies through coordinated views of metrics like rewards and queue lengths.
(4)
Counterfactual Explanation: It answers “what-if” questions by simulating modified states and actions to assess impact on outcomes. While traffic RL-specific applications are emerging, concepts like “minimal counterfactuals” [54] offer valuable approaches.
In summary, existing research has made significant progress in spatiotemporal pressure perception and intelligent traffic management, particularly in algorithm optimization and system integration. However, critical challenges remain in (1) real-time response mechanisms for hybrid control scenarios, (2) coordination principles between conventional and intelligent controllers, and (3) decision stability under dynamic pressure fluctuations. Our study addresses these challenges through innovative state representation and reward mechanism design, providing a coordinated optimization framework for hybrid control environments.

3. Methodology

3.1. Traffic Terminology

Incoming and Outgoing Lanes: Incoming lanes constitute vehicular entry channels where traffic converges from upstream approaches, while outgoing lanes serve as discharge channels directing vehicles toward downstream intersections. This lane-level connectivity establishes physical pathways for traffic propagation between adjacent intersections. The set of incoming lanes and outgoing lanes is denoted as L i n and L o u t , respectively.
Intersection and Agent: Intersection represents a node in the urban network. Each intersection comprises four directional approaches (North, South, East, West). An agent denotes a DRL controller deployed at a signalized intersection. This study examines hybrid networks where DRL-controlled intersections coexist with rule-based intersections governed by max-pressure algorithms.
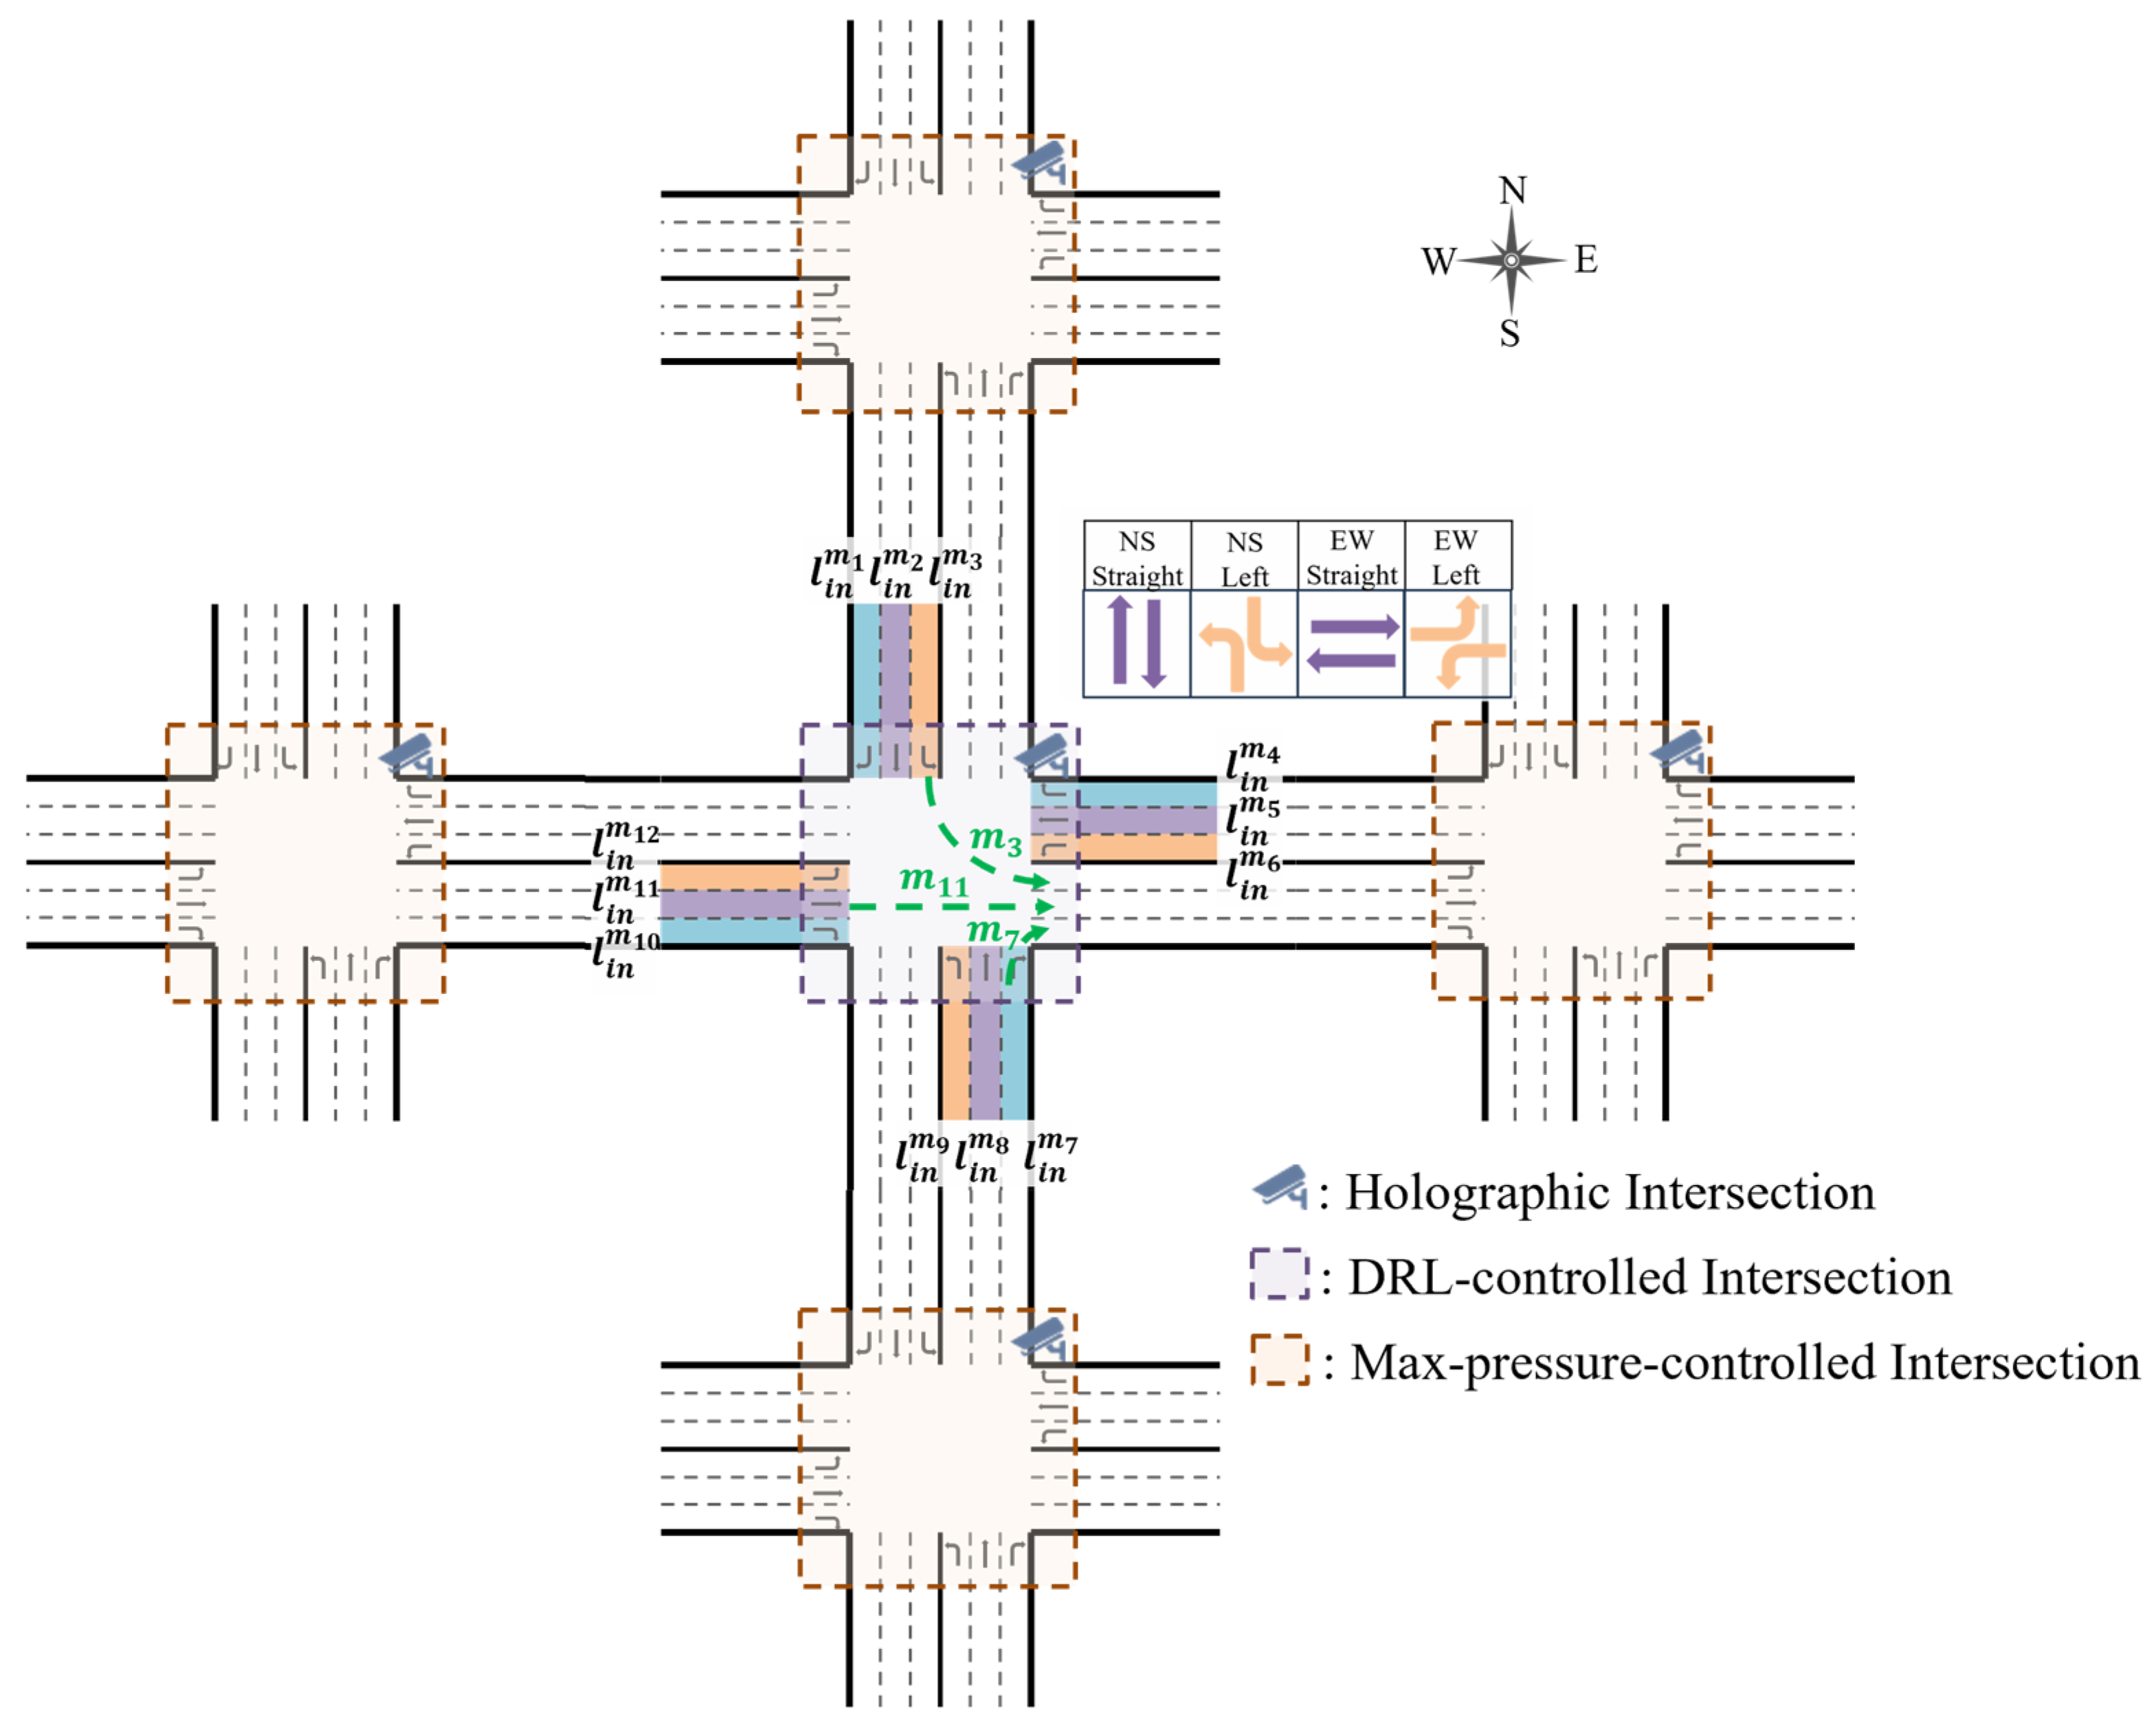
Traffic Network: A traffic network comprises interconnected intersections. Vehicle flows create interdependent traffic dynamics: congestion at one intersection propagates through lane connections to neighbors. Specifically, for an intersection i , its neighboring intersections are defined as j N i . Notably, the DRL-controlled intersection connects to the max–pressure-regulated neighbors through specific road pairs. Each neighbor j links to DRL intersection i via dedicated incoming lanes, denoted as L i n j i and the corresponding outgoing lanes L o u t i j . Our experiments employ a 5-intersection network topology with a central DRL-controlled intersection surrounded by four max–pressure-regulated neighbors, modeling realistic hybrid control scenarios (Figure 2).
Traffic Movement: A traffic movement m M i represents a discrete vehicle trajectory through an intersection i , formally defined as a path connecting an incoming lane l i n m L i n to an outgoing lane l o u t m L o u t . This concept constructs directional flow patterns traversing the intersection’s physical infrastructure, where M i denotes the complete set of movements at the intersection i . While our state representation remains fundamentally lane-grounded, movements provide critical topological relationships for reward formulation.
Signal Phase: A signal phase constitutes a logically grouped set of non-conflicting traffic movements permitted to proceed simultaneously during a designed interval of the signal cycle. Formally, for an intersection with movement set M , each phase P M activates a compatible set of movements where no trajectories spatially conflict.
Pressure: For each incoming lane, the lane pressure p l is calculated as the difference between its queue length ( q i n ) and the corresponding downstream queue ( q o u t ): p l = q i n q o u t . Building upon this lane-level metric, the max-pressure [6] control algorithm selects the signal phase with the maximum total pressure of permitted lanes within each candidate phase. For arterial connections between max-pressure intersection j and DRL-controlled intersection i , the aggregated road pressure constitutes the sum of pressure across all component lanes: l L i n j i p l . In addition, the total pressure of the intersection i is P i = l L i n p l . The pressure at a neighbor’s incoming lanes originates from queues at upstream local intersections, enabling the design of cooperative rewards for DRL agents based on relative congestion states.

3.2. Problem Formulation

The traffic signal control (TSC) problem could be formulated as a Partially Observable Markov Decision Process (POMDP), defined by the tuple S , A , R , T , O , Z , ρ , γ . At time t , the environment’s global state s t S evolves stochastically according to transition dynamics T s t + 1 | s t , a t , while the agent receives partial observations z t = O s t Z due to sensor limitations, selects actions a t A to control traffic signals, and receives scalar rewards r t = R s t , a t at each timestep. Starting from an initial state s 0 ~ ρ , the agent learns a policy π θ a t | z t to maximize the expected discounted return J π θ = E τ ~ π θ t = 0 T γ t r t , where τ = s 0 , a 0 , , s T denotes trajectories with horizon T , and γ [ 0 , 1 ) discounts future rewards, explicitly accounting for partial observability through history-dependent decision-making.

3.3. Spatiotemporal Pressure Perception Agent Design

This section presents fundamental definitions for the core components of our DRL framework: state representation, action space, and reward function.

3.3.1. State

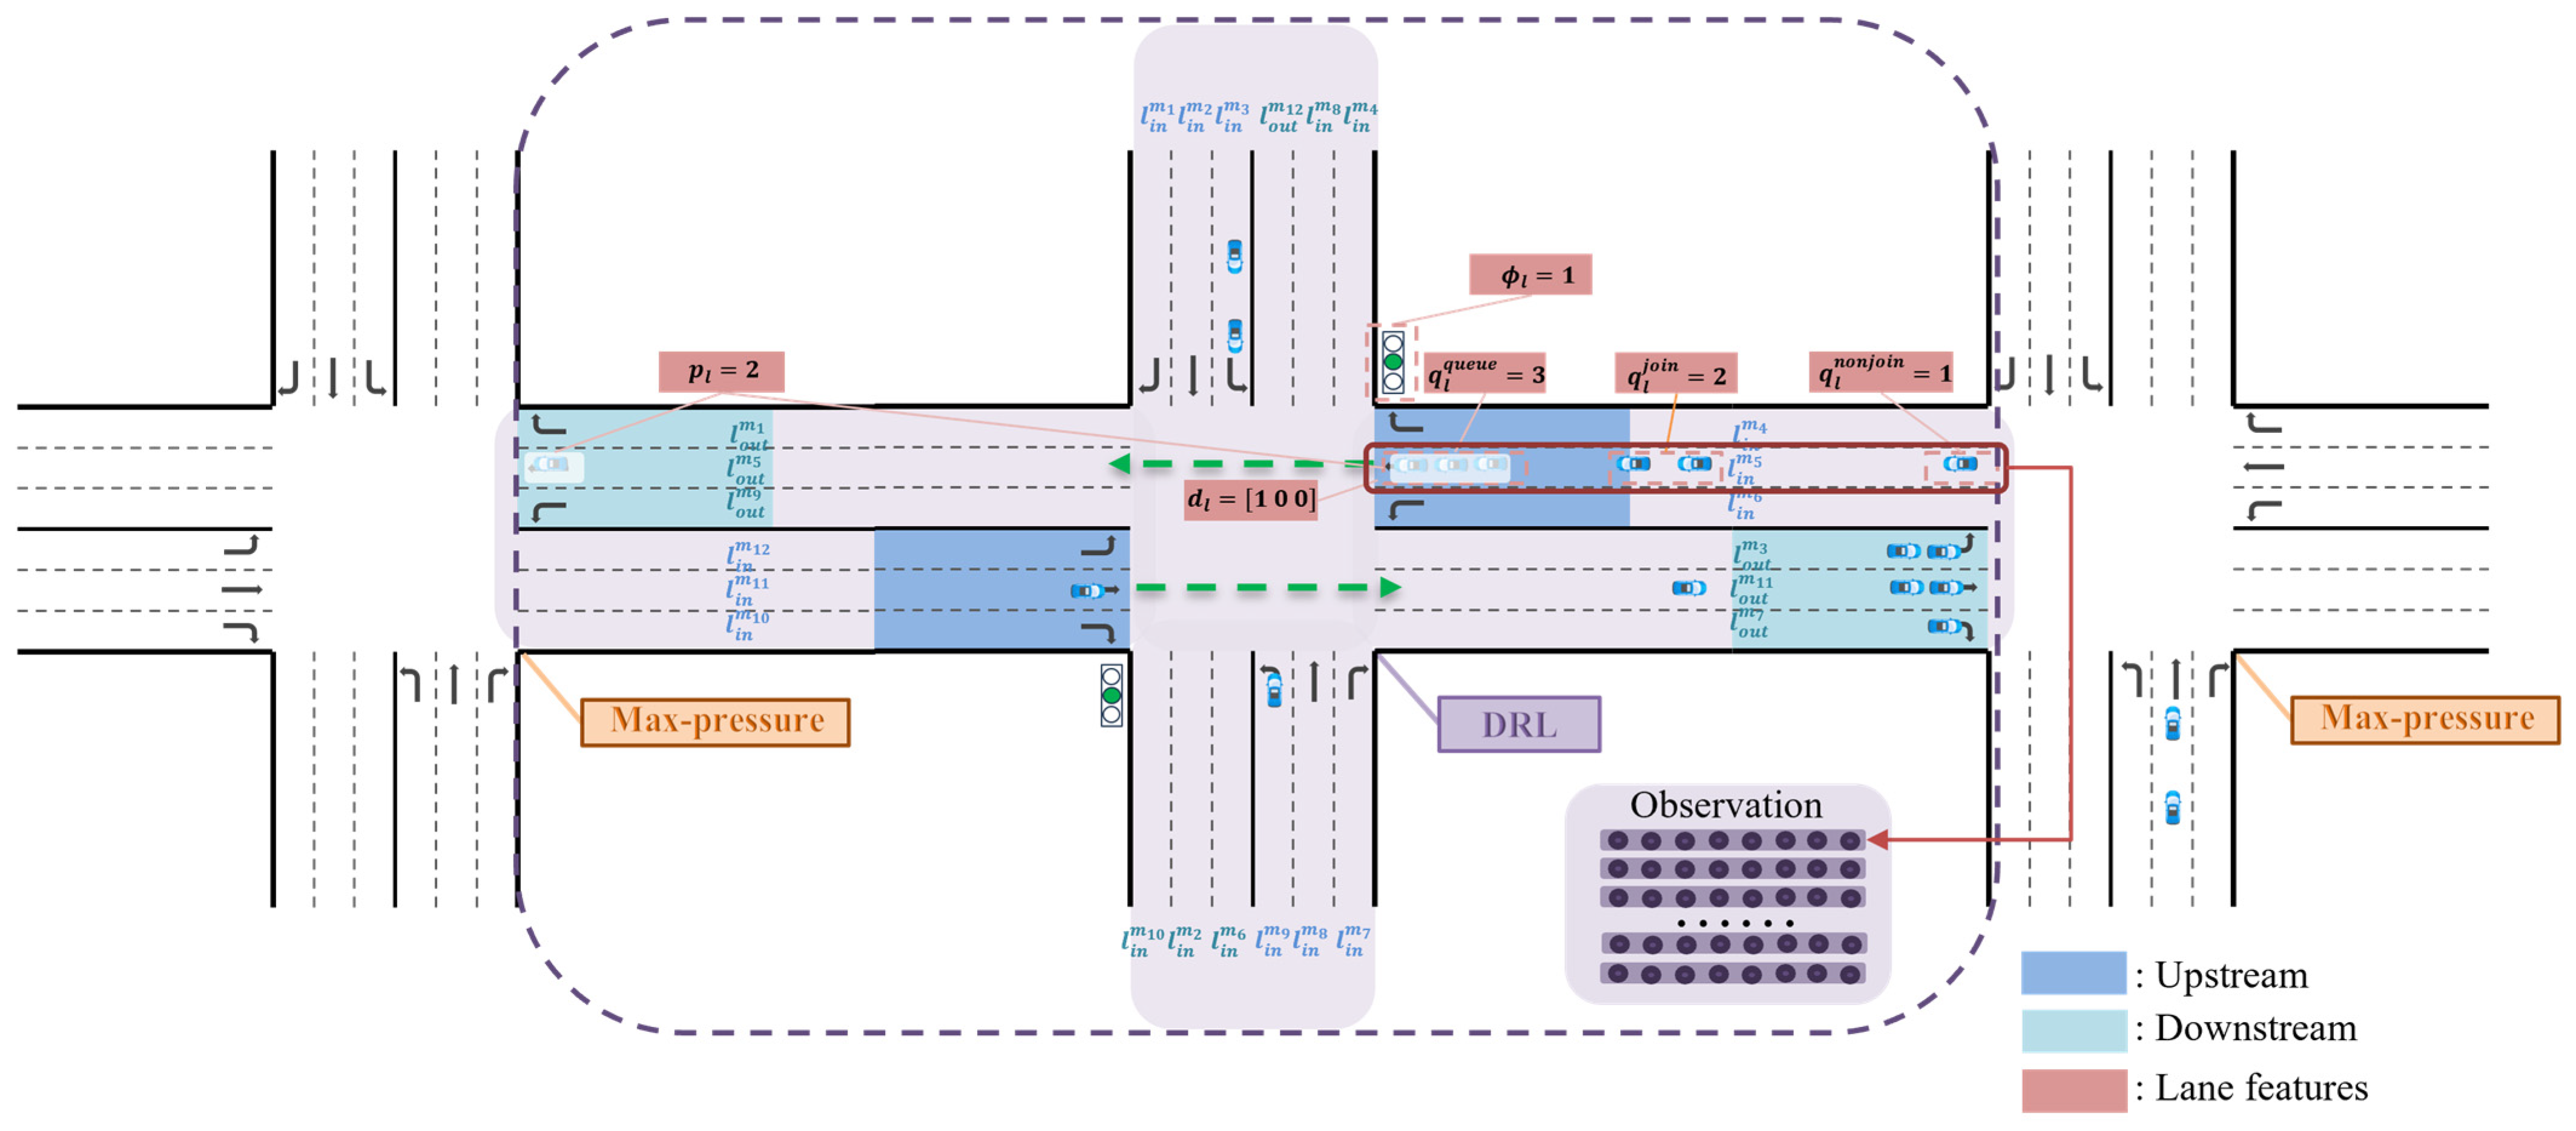
At each decision step, the agent observes local intersection data from digital cameras or induction loop detectors. Existing methods typically aggregate lane-specific metrics from incoming lanes [43,47,55]. Leveraging modern holistic sensing capabilities that provide equally detailed measurements for both incoming and outgoing lanes, we propose the Holistic Traffic Dynamo State. This novel representation (detailed in Section 3.4) integrates refined lane-level features from all approaches, enabling the agent to anticipate traffic fluctuations caused by max-pressure control at adjacent intersections.

3.3.2. Action

In DRL-based traffic signal control, action spaces typically feature phase duration adjustment constrained by minimum/maximum green times [56,57], fixed-phase sequencing with next-phase switching [20,58], cycle-based phase ratio optimization [59,60], or discrete phase selection at fixed intervals [11,14,17,19,35,38]. Among these, our implementation adopts discrete phase selection at fixed intervals using predefined conflict-free configurations (shown in Figure 2), with yellow transitions enforced between phase changes. This approach maintains compatibility with physical signal controllers while balancing operational flexibility through cycle-free adaptability against practical safety constraints.

3.3.3. Reward

Network-wide travel time minimization represents the primary optimization objective for traffic signal control systems. However, direct implementation of this global metric frequently induces training instability and agent non-convergence in decentralized settings [46]. Consequently, existing research predominantly employs validated local reward surrogates, including queue length [22,39], waiting time [10], and accumulated delay [61], which demonstrate strong correlation with system-wide travel time. Building upon queue length optimization’s established efficacy, we introduce a Neighbor–Pressure–Adaptive Reward mechanism (formalized in Section 3.5). This approach dynamically weights local queue lengths using real-time pressure metrics inherent to max–pressure-controlled intersections. By adaptively balancing local and neighborhood queue penalties, the mechanism coordinates distributed congestion dissipation while ensuring training stability.

3.4. Holistic Traffic Dynamo State (HTDS)

3.4.1. Vehicle State Tripartite Decomposition

In the complex dynamic environments generated by max–pressure-controlled intersections, DRL agents require sophisticated state representations to perceive upstream and downstream traffic dynamics, identify neighborhood intersection congestion, and anticipate network-wide pressure propagation. Well-designed state spaces not only accelerate agent convergence but also enable effective network coordination. Existing approaches typically employ either aggregated lane-level traffic metrics [11,22] or grid-based vehicle localization schemes [10]. The former provides oversimplified representations that obscure critical micro-dynamics, while the latter introduces prohibitive computational complexity through excessive granularity. To reconcile precision with practicality, our framework introduces a novel vehicle tripartition methodology that classifies a flow of vehicles into three behaviorally distinct categories. This approach preserves microscopic traffic dynamics while maintaining computational tractability, establishing an optimal balance between observational fidelity and operational efficiency for network control.
Vehicle classification forms the foundation of the state representation, leveraging the Intelligent Driver Model (IDM) [62] to categorize vehicles into three distinct behavioral sets. For each incoming lane l i n at time t , the vehicle set V l is partitioned into three mutually exclusive subsets: queued vehicles Q l (instantaneous speed < 0.1   m / s ), joinable vehicles T l predicted to reach the queue tail within the remaining action time t r e m a i n , and non-joinable vehicles N l that cannot reach the queue within this interval. The queued vehicle set Q l is defined as follows:
Q l = v i : v i < 0.1   m / s ,
The classification algorithm employs IDM physics to predict travel distance through numerical integration of vehicle kinematics:
d p r e d = 0 t r e m a i n v τ + 1 2 a ( τ ) τ d τ ,
where acceleration is dynamically computed using the equation a = a 0 1 v v 0 δ ( s s ) 2 with a dynamic gap s = s 0 + v · T h + v · Δ v 2 a 0 b .
A vehicle is assigned to T l when its predicted travel distance satisfies:
d p r e d p v e h p q u e u e   t a i l ,
where p v e h denotes the current vehicle position ( m )   a n d   p q u e u e   t a i l represents the position of the last queued vehicle ( m ). Then the remaining vehicles on the lane l is assigned to the non-joinable category N l .
The tripartite vehicle classification system generates three metrics that collectively characterize the temporal evolution of lane-level congestion. The current congestion metric q l q u e u e = Q l quantifies vehicles in complete stasis, representing immediate intersection loading and physical queue length. The imminent congestion metric q l j o i n = T l identifies vehicles that will join the queue within the control interval and contribute to queue growth. The non-critical flow metric q l n o n j o i n = N l counts vehicles failing the join condition (formula (3)), representing free-flowing traffic unaffected by current queues that could be safely delayed without congestion spillback. These metrics establish a congestion timeline where q l q u e u e captures present congestion, q l j o i n forecasts near-term loading within the Δ t horizon, and q l n o n j o i n indicates latent demand potential. This temporal stratification enables agents to resolve existing queues through phase activation schemes while preempting queue growth via proactive management of joinable vehicles and strategically optimizing progression for non-critical vehicles during suitable intervals.

3.4.2. State Representation

The Holistic Traffic Dynamo State (HTDS) framework constructs an integrated lane-based state representation s t i for intersection i at time t , capturing microscopic vehicle dynamics and macroscopic pressure propagation through fixed-length tensor encoding. This comprehensive state fuses local operational data with regional congestion dynamics. Specifically, for each lane l , the local features include the current phase activation status ϕ l ( t ) 0 , 1 (where 0 = r e d ,   1 = g r e e n ), directional encoding d l 0 , 1 3 representing turn movements, and lane-specific vehicle dynamics metrics q l q u e u e t , q l j o i n t and q l n o n j o i n t that quantify both present and predicted congestion states. The state further encodes the instantaneous pressure p l ( t ) = q l i n q u e u e ( t ) q l o u t q u e u e ( t ) to quantify real-time traffic load imbalance between upstream and downstream lanes. Then each lane is encoded by six features, including five scalar values and one three-element vector, collectively forming the 8-element representation. The complete lane observation vector is thus formally defined as:
s l i t = q l q u e u e t , q l j o i n t , q l n o n j o i n t , p l t , d l , ϕ l t .
Consequently, the aggregated state of incoming lanes is defined as the set union of all individual lane states:
s i n i t = l L i n i s l i ( t ) .
To model network-wide interactions, the framework employs a holographic approach that captures downstream conditions. This derives features for the outgoing lanes features s o u t i ( t ) at intersection i by mapping features from the incoming lanes ( s i n i ( t ) ) at its neighboring intersections j N ( i ) . The complete state tensor integrates both perspectives:
s t i = s i n i t , s o u t i t .
Practical implementation employs a standardized 24 × 8 tensor representation (24 lanes with 8 numerical elements per lane) utilizing zero-padding for topological flexibility. This holistic representation of the local intersection expands the agent’s perceptual field beyond immediate physical infrastructure constraints. Experimentally validated results demonstrate its effectiveness in enabling the agent to adapt to complex environmental fluctuations caused by max-pressure control. Figure 3 depicts the complete state representation through color-coded elements: red rectangles indicate individual lane states, dark blue rectangles represent upstream approaches, and light blue rectangles denote downstream connections. These 8-element lane vectors collectively form the comprehensive observation space (illustrated by the purple rectangle), which enables the agent to perceive traffic conditions comprehensively.

3.5. Neighbor–Pressure–Adaptive Reward Weighting (NP-ARW)

3.5.1. Neighbor Pressure Perception

Accurately characterizing congestion at max–pressure-controlled intersections could be critically important by leveraging their inherent pressure-explicit representation properties. To this end, our framework introduces a directional relative pressure metric to quantify congestion gradients between DRL-controlled intersections and adjacent neighboring junctions.
Each max-pressure intersection j connects to the DRL intersection i through dedicated road pairs. The incoming lanes receive vehicles from j and the corresponding outgoing lanes discharge vehicles to the intersection j . The relative pressure between intersections i and j is defined as:
Δ p ( i , j ) = l L i n j i p l l L o u t i j p l ,
where L i n j i denotes the set of incoming lanes from the max-pressure intersection j to DRL-controlled intersection i , and L o u t i j represents the set of outgoing lanes from the DRL intersection i to max-pressure intersection j .
This difference captures the pressure flow potential. When Δ p ( i , j ) > 0 , substantial traffic pressure flows from j to i , indicating that congestion is being exported to the intersection i and necessitating promoted discharge from i to j to alleviate pressure imbalance. Conversely, when Δ p ( i , j ) < 0 , excessive outflow from i to j indicates impending congestion at the intersection j , requiring suppressed discharge toward j and redirected flows to alternative neighbors.
This pressure differential metric quantifies traffic accumulation imbalances between neighboring intersections. Positive values indicate upstream queuing at DRL junctions, suggesting available absorption capacity of the max-pressure intersection. In contrast, negative values reveal downstream resistance, implying congestion spillover risks of max-pressure intersection. Building on this quantification of relative pressure-induced congestion states, a dynamic weighting mechanism is developed that modulates reward allocation based on lane-specific queue lengths. This adaptive approach prioritizes discharge directions according to real-time pressure gradients, systematically optimizing network flow distribution.

3.5.2. Reward Reshaping

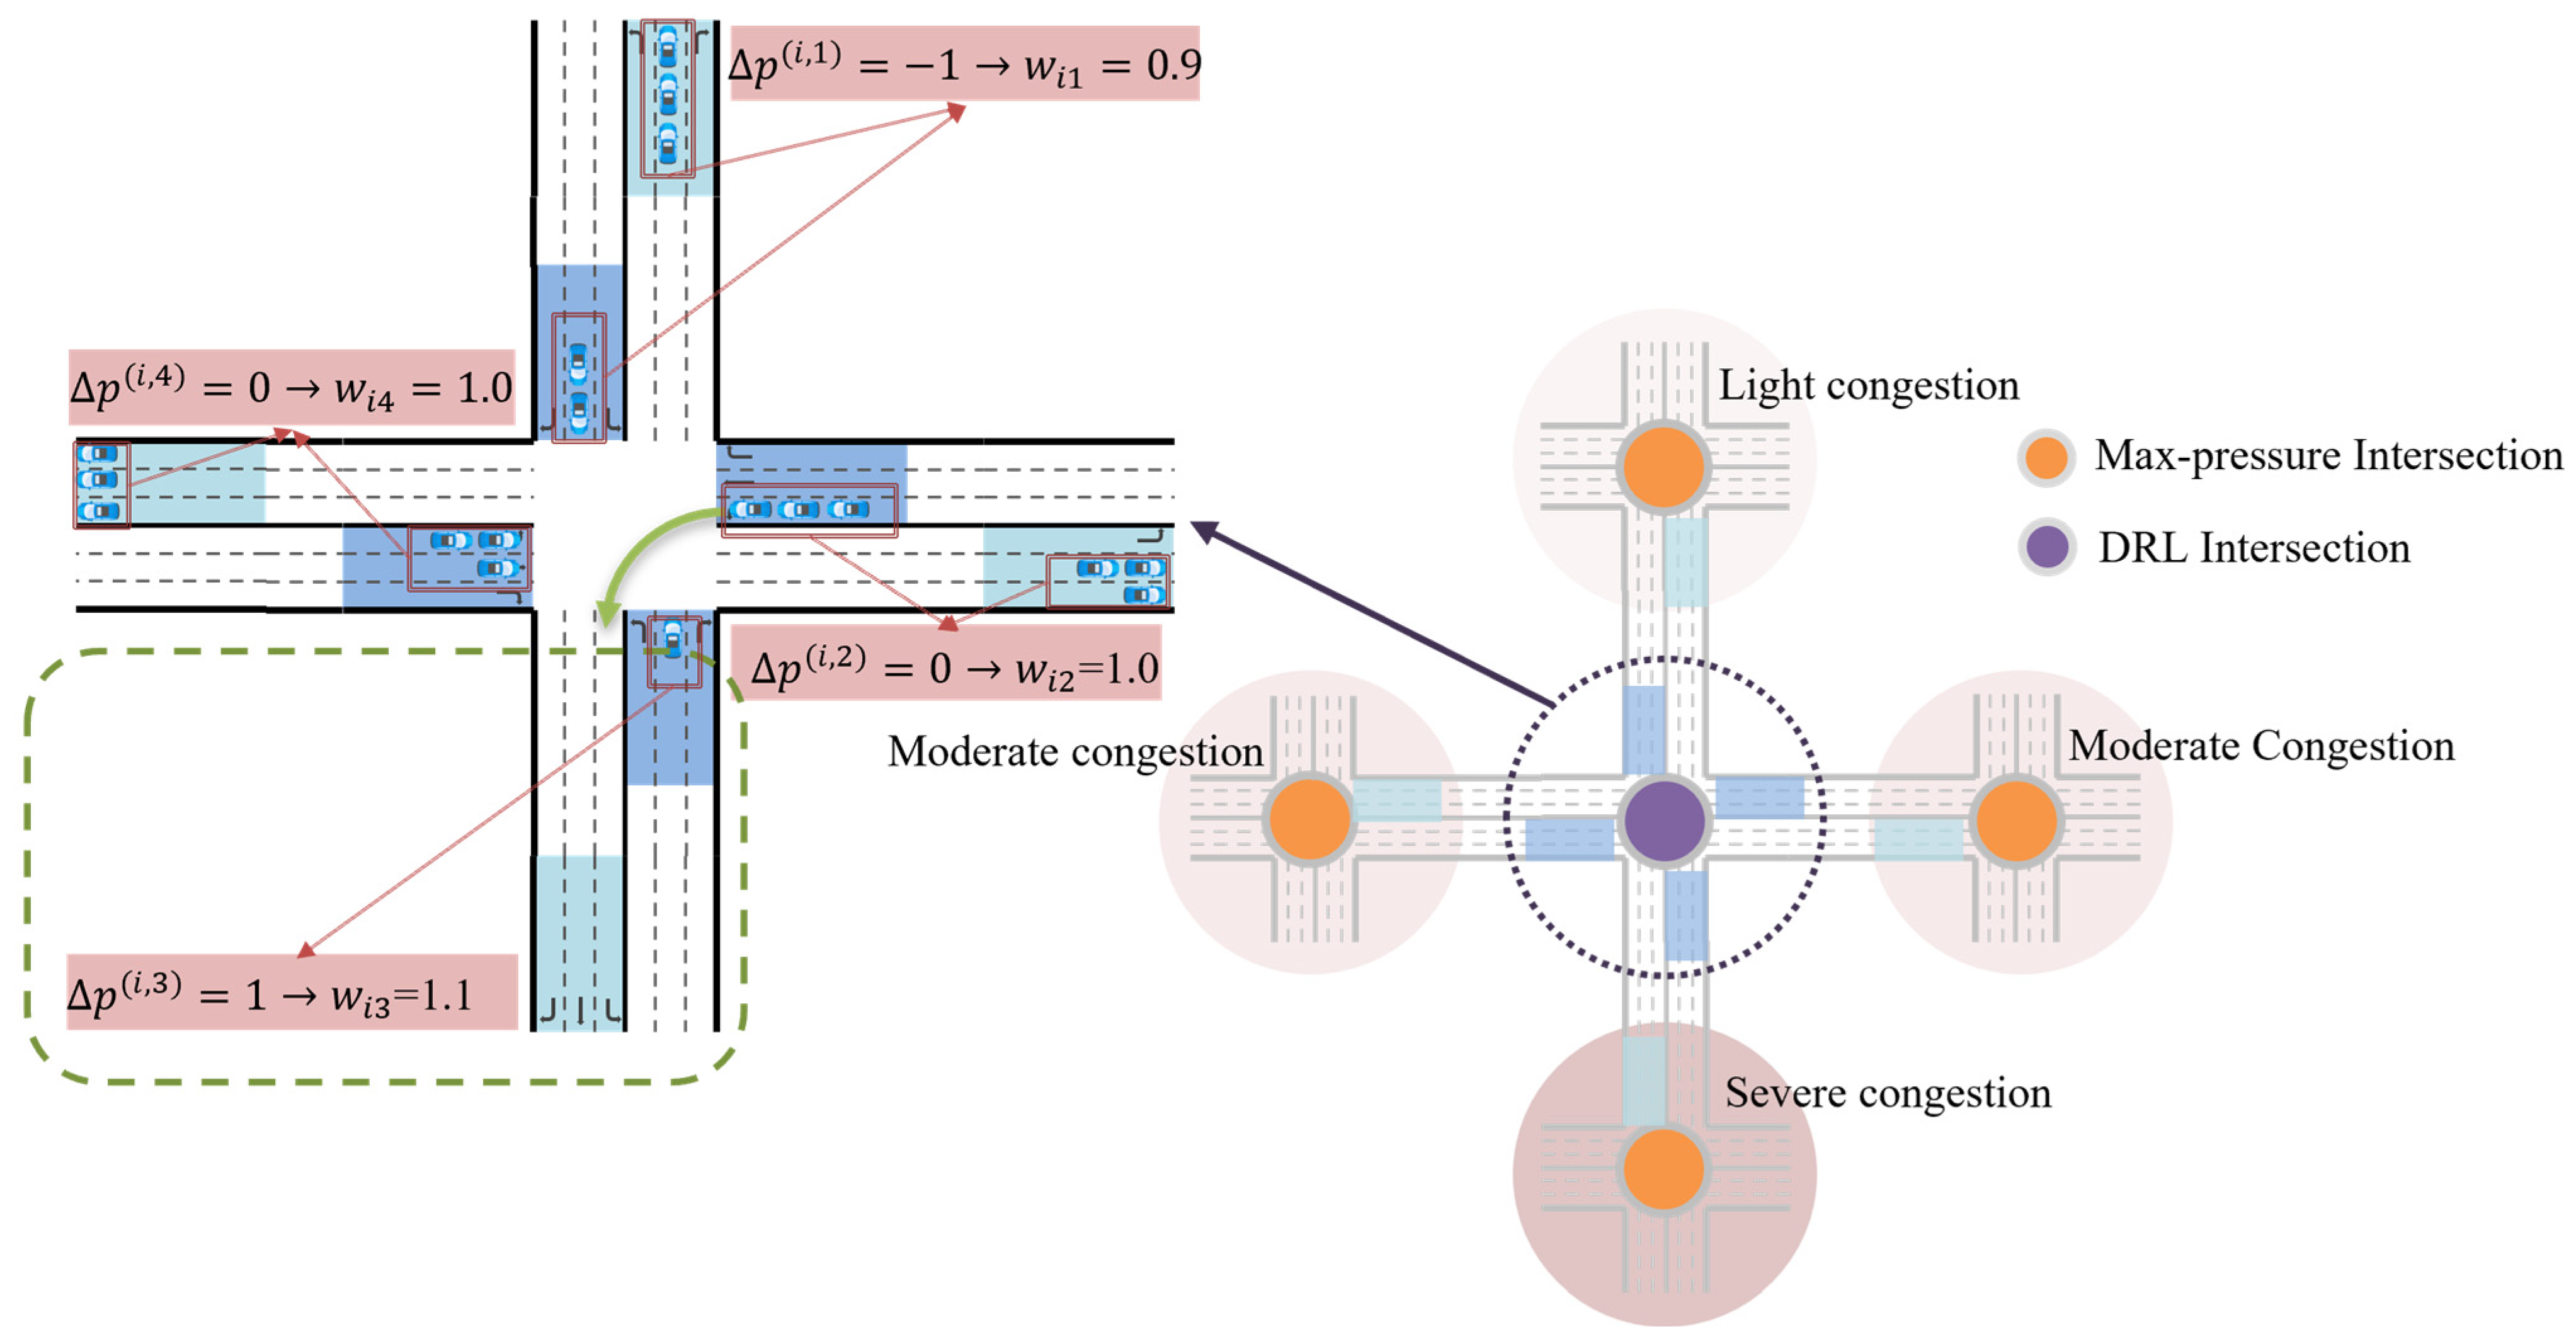
The reward reshaping mechanism Neighbor–Pressure–Adaptive Reward Weighting (NP-ARW) leverages relative pressure perception to dynamically modulate queue-based rewards according to downstream congestion states (Figure 4). For each neighboring intersection j N ( i ) of a DRL intersection i , the relative pressure Δ p ( i , j ) is transformed using t a n h function, chosen for its bounded output range ( 1 , 1 ) that ensures numerical stability during training. While alternative saturation functions (e.g., sigmoid) could be employed, they would require additional scaling operations without providing clear advantages. The transformed pressure values are then linearly mapped to produce congestion-sensitive weight w i j [ 0.5 , 1.5 ] that adaptively modulate reward contributions based on real-time network conditions.
The bounded weighting mechanism ensures training stability by mitigating excessive reward fluctuations while accommodating complex network configurations through movement-level granularity, particularly where individual lanes serve multiple downstream paths. Each movement m discharging toward the neighbor intersection j receives the weight w i j amended according to the downstream congestion state. For instance, movements discharging toward low-congestion neighbors, indicated by large positive relative pressure, receive amplified queue length weights approaching 1.5 to accelerate prioritized discharge. Conversely, movements feeding high-congestion intersections, signaled by diminishing or negative relative pressure, obtain reduced weights near 0.5 to actively suppress outflow contributions. The base reward quantifies the unmodified queue accumulation at the intersection i :
R i = m M i q m q u e u e ,
where M i denotes the set of all movements of intersection i , and q m q u e u e represents the vehicle queue length for movement m . Then the pressure-adapted reward incorporates weights:
R i ^ = m M i ( w i j · q m q u e u e ) ,
where w i j is the relative pressure weight corresponding to the neighbor intersection j connected via movement m .
This Formulation (9) maintains mathematical precision while enabling movement-level incentive calibration, where queue reductions toward uncongested neighbors receive amplified rewards while discharges toward congested junctions obtain suppressed incentives, thereby optimizing network-wide congestion redistribution through targeted discharge modulation.

3.6. Conv-Attention Traffic Net (CAT-Net)

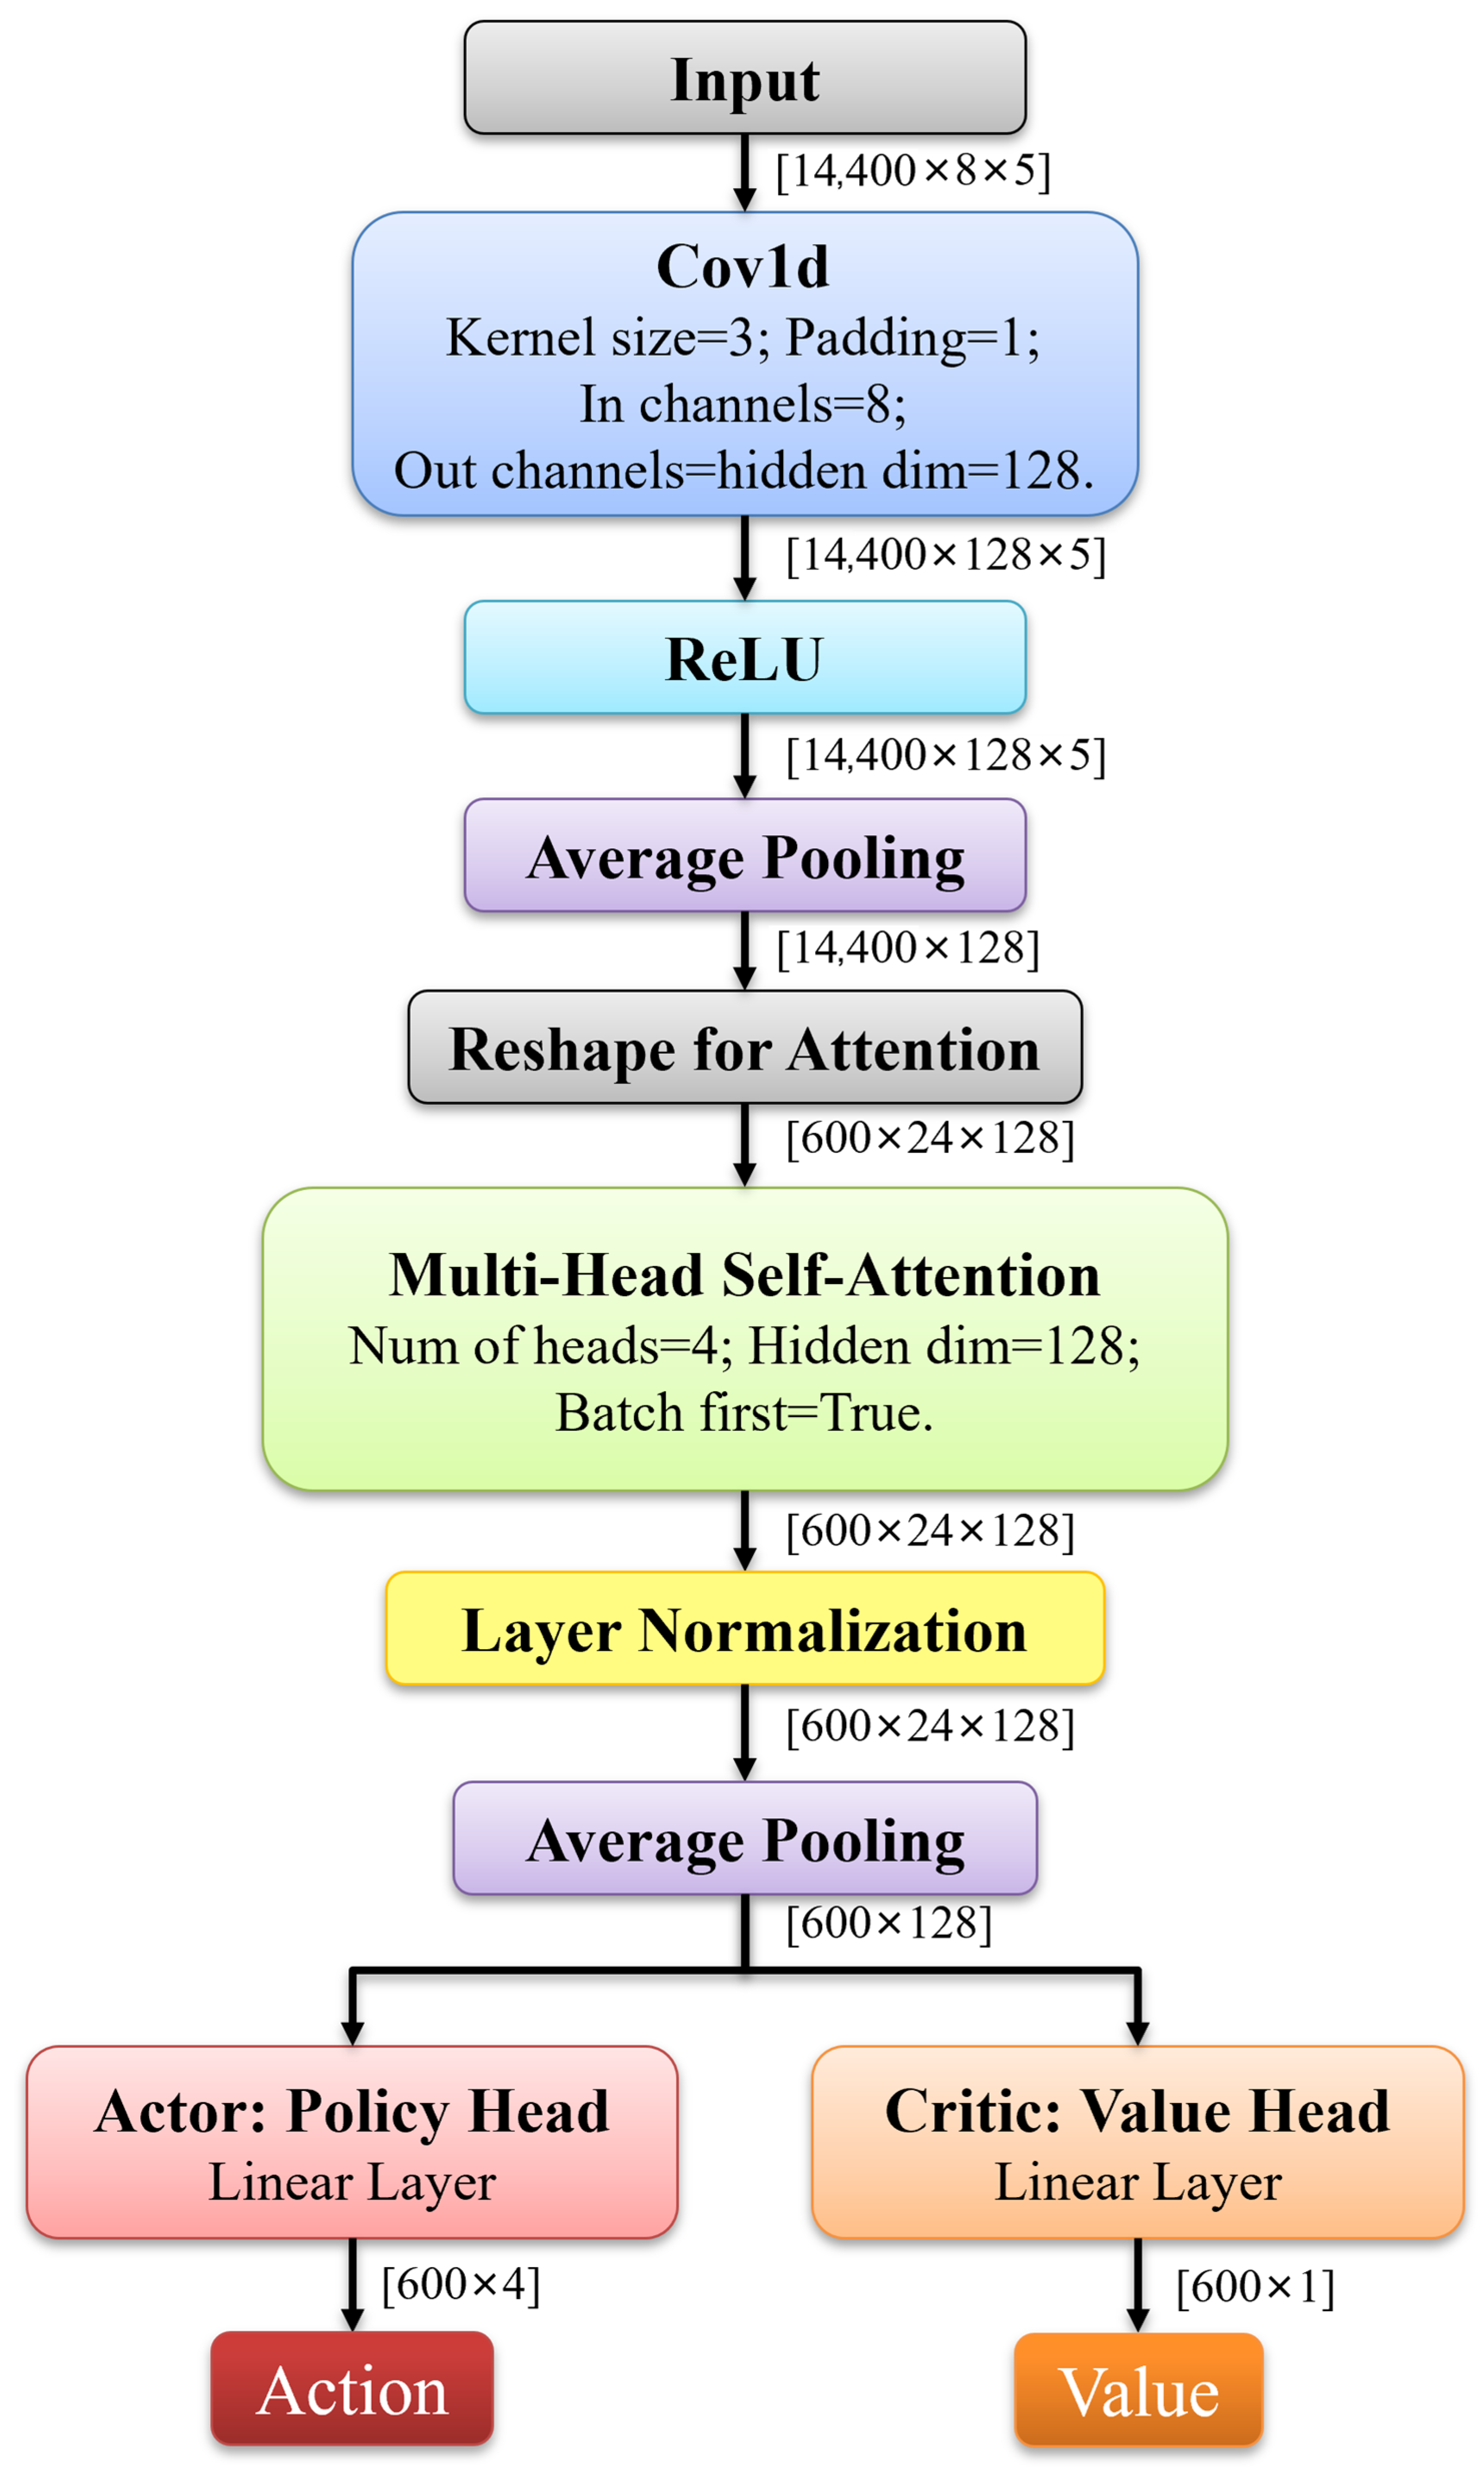
The Conv-Attention Traffic Net (CAT-Net) implements a unified architecture for actor and critic networks, processing high-dimensional traffic states through sequential temporal and spatial feature extraction. The network first reshapes input tensors Χ R B × N × T × M × F containing B batches, N intersections, T timesteps, M movements, and F features per movement.
Temporal feature extraction employs a 1D convolutional layer that detects local traffic patterns across T timesteps using kernel size 3, followed by ReLU activation and temporal averaging to condense features along the time dimension. Spatial relationship modeling subsequently applies multi-head self-attention to compute interaction weights between all movement pairs through parallel attention heads (4 heads), enabling identification of critical spatial relationships like competing flows and corridor dynamics.
Layer normalization stabilizes outputs before movement features are integrated via averaging into a pooled representation. This hierarchical representation feeds specialized output layers where the actor network generates phase selection logits through linear projection, while the critic produces state-value estimates, with both networks sharing identical convolutional and self-attention modules while differing only in final output layers. The architecture achieves computational efficiency by processing temporal features locally before modeling spatial relationships globally, enabling real-time deployment at urban intersections through parameter sharing and optimized feature extraction. The details of CAT-Net are shown in Figure 5, and the details of the learning process are illustrated in Algorithm 1.
Algorithm 1. Spatiotemporal Pressure Perception PPO with HTDS−NP−ARW
Require:Env: E (SUMO); Model: Hidden dim H , Attention heads K , Time series T , Movements M , Features F ; Training: Parallel envs N envs , Batch size B , Epochs E , Minibatch B m i n i , Learning rate α , Clip range ϵ , Discount factor γ , Value loss coeff β v a l , Entropy coeff β e n t .
Ensure:Trained policy network π θ and value network V ϕ   (shared backbone).
Initialization
1: Init π θ , V ϕ with random params; Adam optimizers; buffer B (cap= B ), collector C ( E , π θ ,   N e n v s ), logger L .
Main Loop
2: for iter = 1 to N i t e r do
1. Collect Trajectories via Parallel Environment
3:   Reset envs to s 0 ; τ = .
4:   for  t   =   1 to B / N e n v s do
5:    for each Agent i A do
6:     [HTDS] Observe s t i (Eq.(4)-(6));
7:     Sample action a t i ~ π t i ;
8:    end for
9:     Execute a t i ; Observe next state s t + 1 i and d o n e t i ;
10:     [NP-ARW] Compute w i j (Eq.(7)) and r t i (Eq.(8)-(9)),
11:      τ . append ( ( s t i ,   a t i ,   r t i ,   s t + 1 i , d o n e t i ) ).
12:   end for
13:    B .add (Reshape ( τ ,   [ 1 ,   T ,   M ,   F ] ) ).
2. Compute Advantages and TD Targets
14:   Sample all trajectories from B ;
15:    V t i = V ϕ ( s t i ) and V t + 1 i = V ϕ ( s t + 1 i ) for all i ,   t ;
16:   TD targets y t i = r t i + γ · V t + 1 i · ( 1 d o n e t i ) ;
17:   Advantage estimates A ^ t i = y t i V t i .
3. Update Policies via PPO
18:   for epoch =   1 to E do
19:     D B (shuffled minibatch, B m i n i ).
20:    for  ( s t i ,   a t i ,   A ^ t i , y t i ) D do
21:     [Actor] Compute π t i = π θ ( s t i ) ; log p t i = π t i . ( a t i ) ;
22:      r t i = e x p   ( l o g p t i l o g p t i o l d ) ;
23:      L c l i p i = m i n   ( r t i · A ^ t i , c l i p ( r t i , 1 ϵ , 1 + ϵ ) · A ^ t i ) ;
24:     [Critic] V t i = V ϕ ( s t i ) ; L v a l i = β v a l · M S E ( V t i , y t i ) ;
25:      L e n t i = β e n t · e n t r o p y ( π t i ) ; L t o t a l i = L c l i p i + L v a l i + L e n t i ;
26:    end for
27:    Average total loss over minibatch: L t o t a l = 1 B m i n i · | A | i , D L t o t a l i ;
28:    Zero gradients of π θ and V ϕ ;
29:    Backpropagate L t o t a l ;
30:    Clip gradients to prevent explosion;
31:    Update optimizers for π θ and V ϕ .
32:   end for
4. Log Metrics and Save Models
33:   Log training metrics via L ;
34:   Save model checkpoints ( π θ , V ϕ ) every 5 iterations.
35: end for

3.7. Theoretical Foundations for DRL-Traditional Intersection Coordination

The proposed framework’s theoretical superiority over traditional max-pressure and independent reinforcement learning (IRL) methods lies in its unified optimization of local and network-wide traffic dynamics. Traditional max-pressure controllers excel at local queue balancing but suffer from myopic decision-making, often redistributing congestion to downstream intersections without proactive mitigation. In contrast, our HTDS representation integrates real-time queues, predicted merging patterns, and downstream traffic propagation, enabling anticipatory control that resolves the local-network trade-off inherent in max-pressure.
IRL methods [38,46] optimize isolated intersections by learning policies solely from local observations, neglecting cooperative dynamics with neighboring controllers. This isolation leads to suboptimal coordination in hybrid networks, especially when neighboring intersections employ reactive strategies like max-pressure. Our NP-ARW mechanism addresses this by dynamically adjusting queue penalties based on relative pressure differences, ensuring congestion redistribution aligns with global network states. The adaptive weight adjustment in NP-ARW is designed with bounded parameters ( [ 0.5 ,   1.5 ] ) to ensure stable learning dynamics. These constraints serve two purposes: (1) they prevent excessive reward scaling that could destabilize training by maintaining balanced gradient updates, and (2) they provide inherent noise robustness by limiting the impact of measurement fluctuations on weight adaptation. The bounds were empirically validated and demonstrated optimal performance within this range.
The Conv-Attention Traffic Net (CAT-Net) further ensures spatiotemporal consistency by combining Conv1D layers for lane-level temporal modeling with attention mechanisms that capture intersection dependencies. This architecture guarantees robustness against non-stationarity induced by hybrid control scenarios, a limitation that destabilizes conventional DRL methods.
In summary, our framework transcends the isolation of IRL and the myopia of max-pressure by unifying state representation, reward design, and neural architecture under a theoretically coherent hybrid-adaptive methodology.

3.8. Mechanistic Analysis of DRL Agent’s Control Strategy

To analyze the decision-making mechanisms of DRL agents, this study compares two types: (1) cooperative agents (HTDS-NP-ARW) employing reward-shaping mechanisms, and (2) non-cooperative agents (HTDS) that leverage HTDS space to recognize dynamic environmental fluctuations but lack tailored reward-shaping. An integrated Strategy Imitation–Mechanism Attribution framework, utilizing Gradient Boosted Trees (XGBoost) and Decision Tree models, is developed to systematically characterize differences between these agent strategies in phase selection logic and feature dependency patterns. We implemented decision tree models using Python’s scikit-learn (version 1.6.1) and XGBoost (version 3.0.2) libraries, leveraging their built-in algorithms for decision tree construction and optimization.

3.8.1. Feature Engineering of Phase Selection Strategies

Directly utilizing the high-dimensional raw state space in decision tree modeling, while preserving maximum information, often leads to overly complex tree structures within traffic signal control. These trees exhibit opaque decision rules and heightened sensitivity to sparse feature noise, compromising interpretability.
To enhance interpretability, we introduce traffic-informed feature extraction comprising four key operations. This involves (1) applying Exponential Moving Average (EMA) to all 8 features per lane for temporally smoothing; (2) spatially aggregating 24 lanes into 4 phases based on right-of-way groupings while selecting 4 key features ( q l q u e u e t , q l j o i n t , q l n o n j o i n t , p l t ) per phase, thus yielding 16 core features; (3) calculating the intersection pressure alongside the local average queue length, and (4) deriving the collaborative features by calculating the pressure difference between the local intersection and neighboring intersections (neighbor pressure diff P l o c a l P n e i g h b o r ).
This structured transformation achieves two critical interpretability advantages. Firstly, decision paths now clearly reveal how agents compare features between phases (e.g., selecting phase 1 over phase 2 due to lower pressure). Secondly, they explicitly show evaluations of intersection relationships (e.g., responses to neighbor pressure differences). This moves beyond primitive decisions driven solely by lane-isolated metrics such as queue lengths.

3.8.2. XGBoost-to-Decision Tree Distillation for Interpretable Control Policies

While decision trees (DTs) offer inherent interpretability through their “if-then” structure, training them directly on compressed features risks underfitting due to reduced information, compromising both fidelity and interpretability. Consequently, we propose a two-tier distillation framework.
First, an XGBoost teacher model closely approximates the DRL agent’s policy with high decision fidelity, leveraging its capacity to handle high-dimensionality and its efficient optimization via second-order Taylor approximation of the objective function:
O b j = i l y i , y ^ i + k Ω ( f k ) ,
where l y i , y ^ i denotes loss function and Ω ( f k ) represents the regularization term that controls model complexity to mitigate overfitting.
However, as an ensemble model, XGBoost intrinsically lacks clear decision logic. To address this limitation, a student DT model [63] is distilled from the trained XGBoost teacher using knowledge distillation. The distillation process minimizes the Kullback–Leibler divergence loss:
L o s s d i s t i l l = i k p ^ i k l o g ( p i k ) ,
where p ^ i k and p i k denote soft probabilities from the teacher and student models, respectively. This transfers the teacher’s probabilistic knowledge, including decision boundaries and class relationships, to the interpretable student model.
To simultaneously preserve the teacher’s probabilistic insights and respect ground-truth labels, we optimize a composite loss function:
L o s s = α L o s s d i s t i l l + ( 1 α ) ( i k y i k l o g ( p i k ) ) ,
where y i k is the one-hot encoded true action, p i k is the student tree’s predicted probability, and α [ 0 , 1 ] balances soft-label distillation against hard-label supervision. This hybrid approach enables the distilled DT to closely approximate the teacher’s decision boundaries, maintain fidelity to ground-truth actions, and achieve transparent “if-then” interpretability.
Consequently, the distilled DT achieves predictive accuracy comparable to the XGBoost teacher while providing substantially enhanced interpretability. Its explicit decision paths offer transparent explanations of the agent’s control logic.

3.8.3. Quantifying Feature Attribution in Phase Decisions with SHAP Values

To quantify the marginal contribution of each feature to the agent’s phase selection decisions beyond the structural insights provided by decision paths, we employ the SHAP framework. This computes the feature-specific Shapley value ϕ j for every prediction instance generated by the decision tree model. The SHAP value for the feature j is defined as
ϕ j = S N \ j S ! N S 1 ! N ! ( v ( S j v ( S ) ) ) ,
where N denotes the complete feature set, S represents a feature subset, and v ( S ) is the model’s output given the subset S . This approach precisely isolates each feature’s influence on phase selection decisions.

4. Experiment and Results

4.1. Experiment Settings

Simulator: Simulations are executed in Simulation of Urban Mobility (SUMO) [64], with episodes capped at 1500 s. A hybrid control topology was constructed, featuring a central DRL-controlled intersection coordinated with four peripheral max-pressure intersections. This configuration enables rigorous investigation of coordination capabilities between Deep Reinforcement Learning and max–pressure-controlled intersections.
Parameter Setting: Signal control operates at fixed 5 s intervals, maintaining current phases extends green lights by 5 s, while phase transitions initiate 3 s yellow clearance periods for expiring green signals. Vehicle dynamics follow the Intelligent Driver Model parameterized with maximum acceleration a 0 = 2.6   m / s 2 , desired velocity v 0 = 13.89   m / s 2 , acceleration exponent δ = 4 , minimum safe distance s 0 = 2.5   m , time headway T h = 1.0   s , and comfortable deceleration b = 4.5   m / s 2 . The proximal policy optimization implementation utilizes Adam optimization with a uniform learning rate of 5 × 10 5 across both actor and critic networks. Training configurations include a discount factor γ = 0.9 , policy clip ratio = 0.2 , entropy coefficient = 0.01 , and gradient clipping at maximum norm 40. The sampling regimen processes 2400-step batches (6 parallel environments × 200 simulation steps × 2 episodes) through 10 optimization epochs per iteration, utilizing 128-dimensional hidden layers in neural architectures.
Dataset: To investigate the coordination mechanisms of DRL-controlled intersections operating under max-pressure control within their surrounding traffic environment, we designed a controlled traffic flow scenario with the following characteristics: vehicles are generated exclusively from the outermost incoming roads of four fixed-time signalized intersections positioned at the network boundaries. The synthetic traffic flow follows a periodic pattern consisting of four 5 -min intervals: during the first and third intervals, vehicles enter at 600 vehicles per hour per road in both west–east and south–north directions, while the second and fourth intervals feature reduced inflow rates of 300 vehicles per hour per road. The majority of vehicles maintain straight-through trajectories, intentionally creating conflict points between orthogonal traffic flows. This experimental design specifically examines how different intersection control strategies balance and resolve competing directional demands while maintaining network throughput.

4.2. Compared Methods

4.2.1. Traditional Baselines

Three conventional traffic signal control methods were implemented as benchmarks:
Fixed-time control [23]: A predetermined signal timing scheme with constant cycle lengths and phase splits, optimized offline based on historical traffic data.
Webster’s method [24]: An adaptive timing strategy that dynamically adjusts cycle length and green splits according to real-time traffic demands while maintaining predetermined phase sequences.
Max-pressure control [6]: A distributed control policy that maximizes network throughput by maintaining pressure balance across intersections, where pressure is defined as the difference between upstream and downstream queue lengths.

4.2.2. DRL Baselines

We evaluated two Deep Reinforcement Learning approaches:
Efficient-MP [65]: An enhanced max-pressure controller that employs Efficient Pressure (EP) as a more discriminative state representation while retaining the original max-pressure control framework.
LSTM-PPO [66]: A temporal-aware DRL agent combining Long Short-Term Memory (LSTM) networks with Proximal Policy Optimization, where traffic states are encoded as value vectors and temporal dependencies are captured through recurrent connections.
For a comprehensive comparison, we proposed and examined two variants of our method:
HTDS-NP-ARW: The complete proposed method integrating Holistic Traffic Dynamo State representation and Neighbor–Pressure–Adaptive Reward Weighting mechanism.
HTDS (ablation variant): It retains the base HTDS architecture and CAT-Net without the NP-ARW component to assess the specific contribution of the adaptive reward mechanism. This version maintains identical state representation capabilities but uses no weights for queue length penalties.

4.3. Evaluation Metrics

During training, the model’s convergence was monitored using the average travel time (ATT) metric, defined as the mean duration between vehicle entry and exit times across all vehicles in the network A T T = 1 N v = 1 N t e n d v t s t a r t v , where N is the total vehicle count, t s t a r t v denotes the entry time of the vehicle v into the network, and t e n d v indicates either the actual exit time or a maximum threshold of 1500   s if the vehicle fails to reach the destination before the simulation termination.
For comprehensive performance assessment during evaluation, we employed the following three key metrics: (1) network-wide travel time, measuring overall traffic efficiency; (2) intersection pressure, quantifying local congestion levels; and (3) carbon emissions, assessing environmental impact. This multi-metric evaluation enables a comprehensive evaluation of both operational efficiency and sustainability outcomes.

4.4. Results

4.4.1. Comparison of Convergence

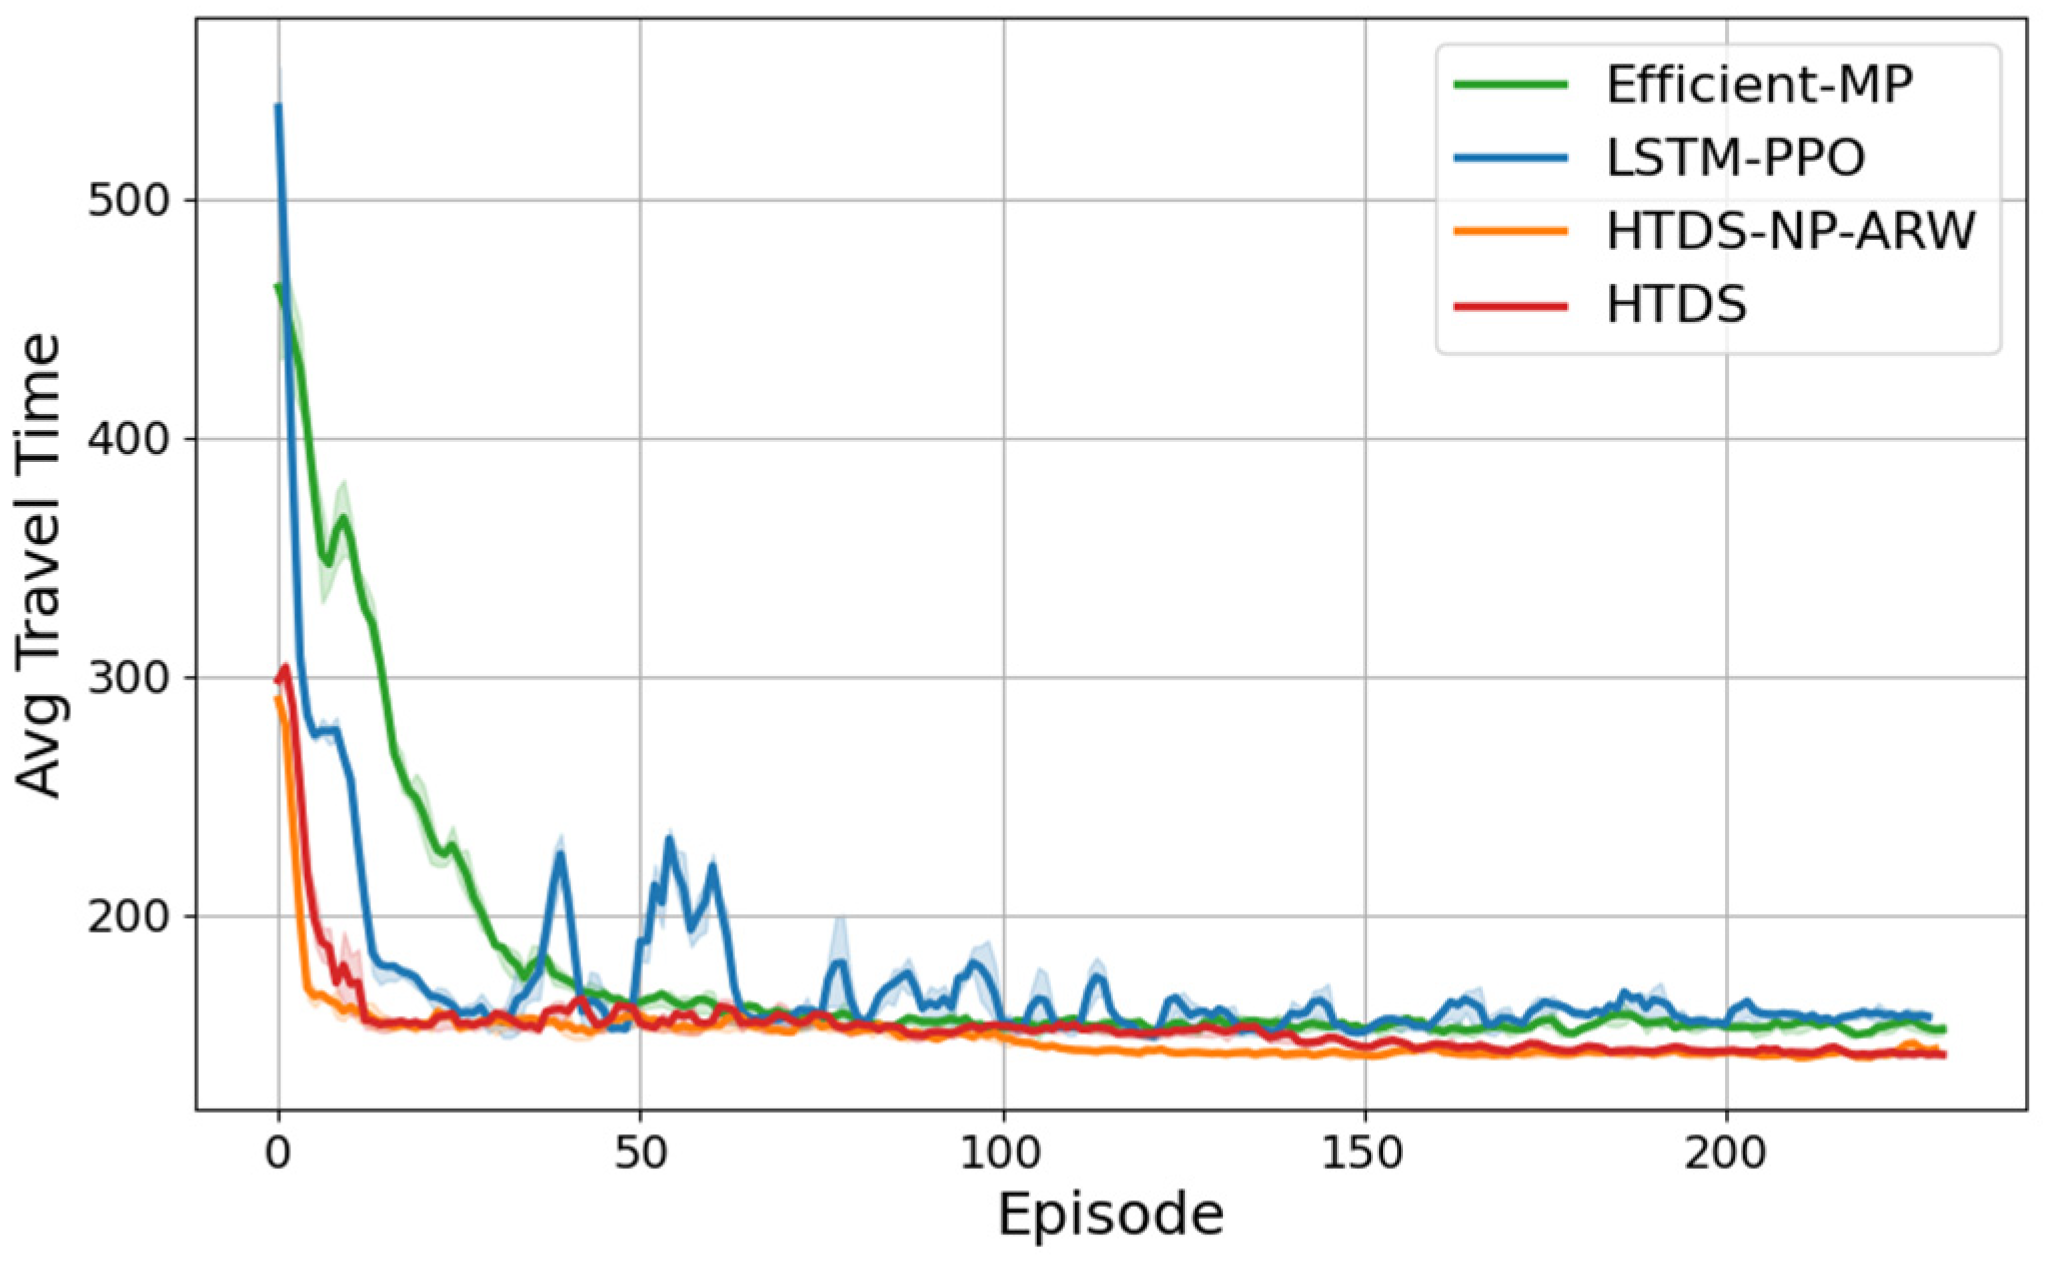
Figure 6 presents the mean ± IQR convergence curves of average travel time for different DRL approaches. The experimental results reveal that some conventional DRL methods [46] fail to maintain traffic balance in max–pressure-controlled environments, where the agents could not properly coordinate north–south and east–west flows. This leads to directional imbalance, with congestion persisting in one direction while the other remains underutilized. Furthermore, even some state-of-the-art DRL methods designed for fully intelligent networks exhibit limited adaptability to such mixed control scenarios.
Notably, our proposed HTDS-NP-ARW and its ablation variant HTDS converge to comparable ATT levels, suggesting that the HTDS architecture, particularly its spatial-temporal state representation and CAT-Net module, plays a dominant role in capturing the rapid dynamics induced by max-pressure environments. Further analysis confirms that the NP-ARW reward mechanism provides additional optimization guidance, effectively balancing local queue clearance with neighborhood congestion mitigation.

4.4.2. Evaluation of Performance

Table 1 presents a comprehensive evaluation of network performance under various control methods, including average travel time, loss time, CO2 emissions, as well as queue lengths and pressure metrics at both the local DRL-controlled intersection and neighboring intersections. The results demonstrate that our proposed spatiotemporal pressure perception agent, integrating HTDS representation and NP-ARW reward mechanism, significantly reduces network-wide average travel time and loss time while effectively decreasing average queue lengths at neighboring intersections. Compared to fixed-time control, the method reduces average travel time by 65.45% and loss time by 85.04%. Notably, it also decreases average queue lengths and pressure at neighboring intersections by 91.20% and 95.21%, respectively. Compared to other DRL methods, our approach achieves a better balance between queue lengths and pressure at neighboring intersections, highlighting its superior coordination capability.
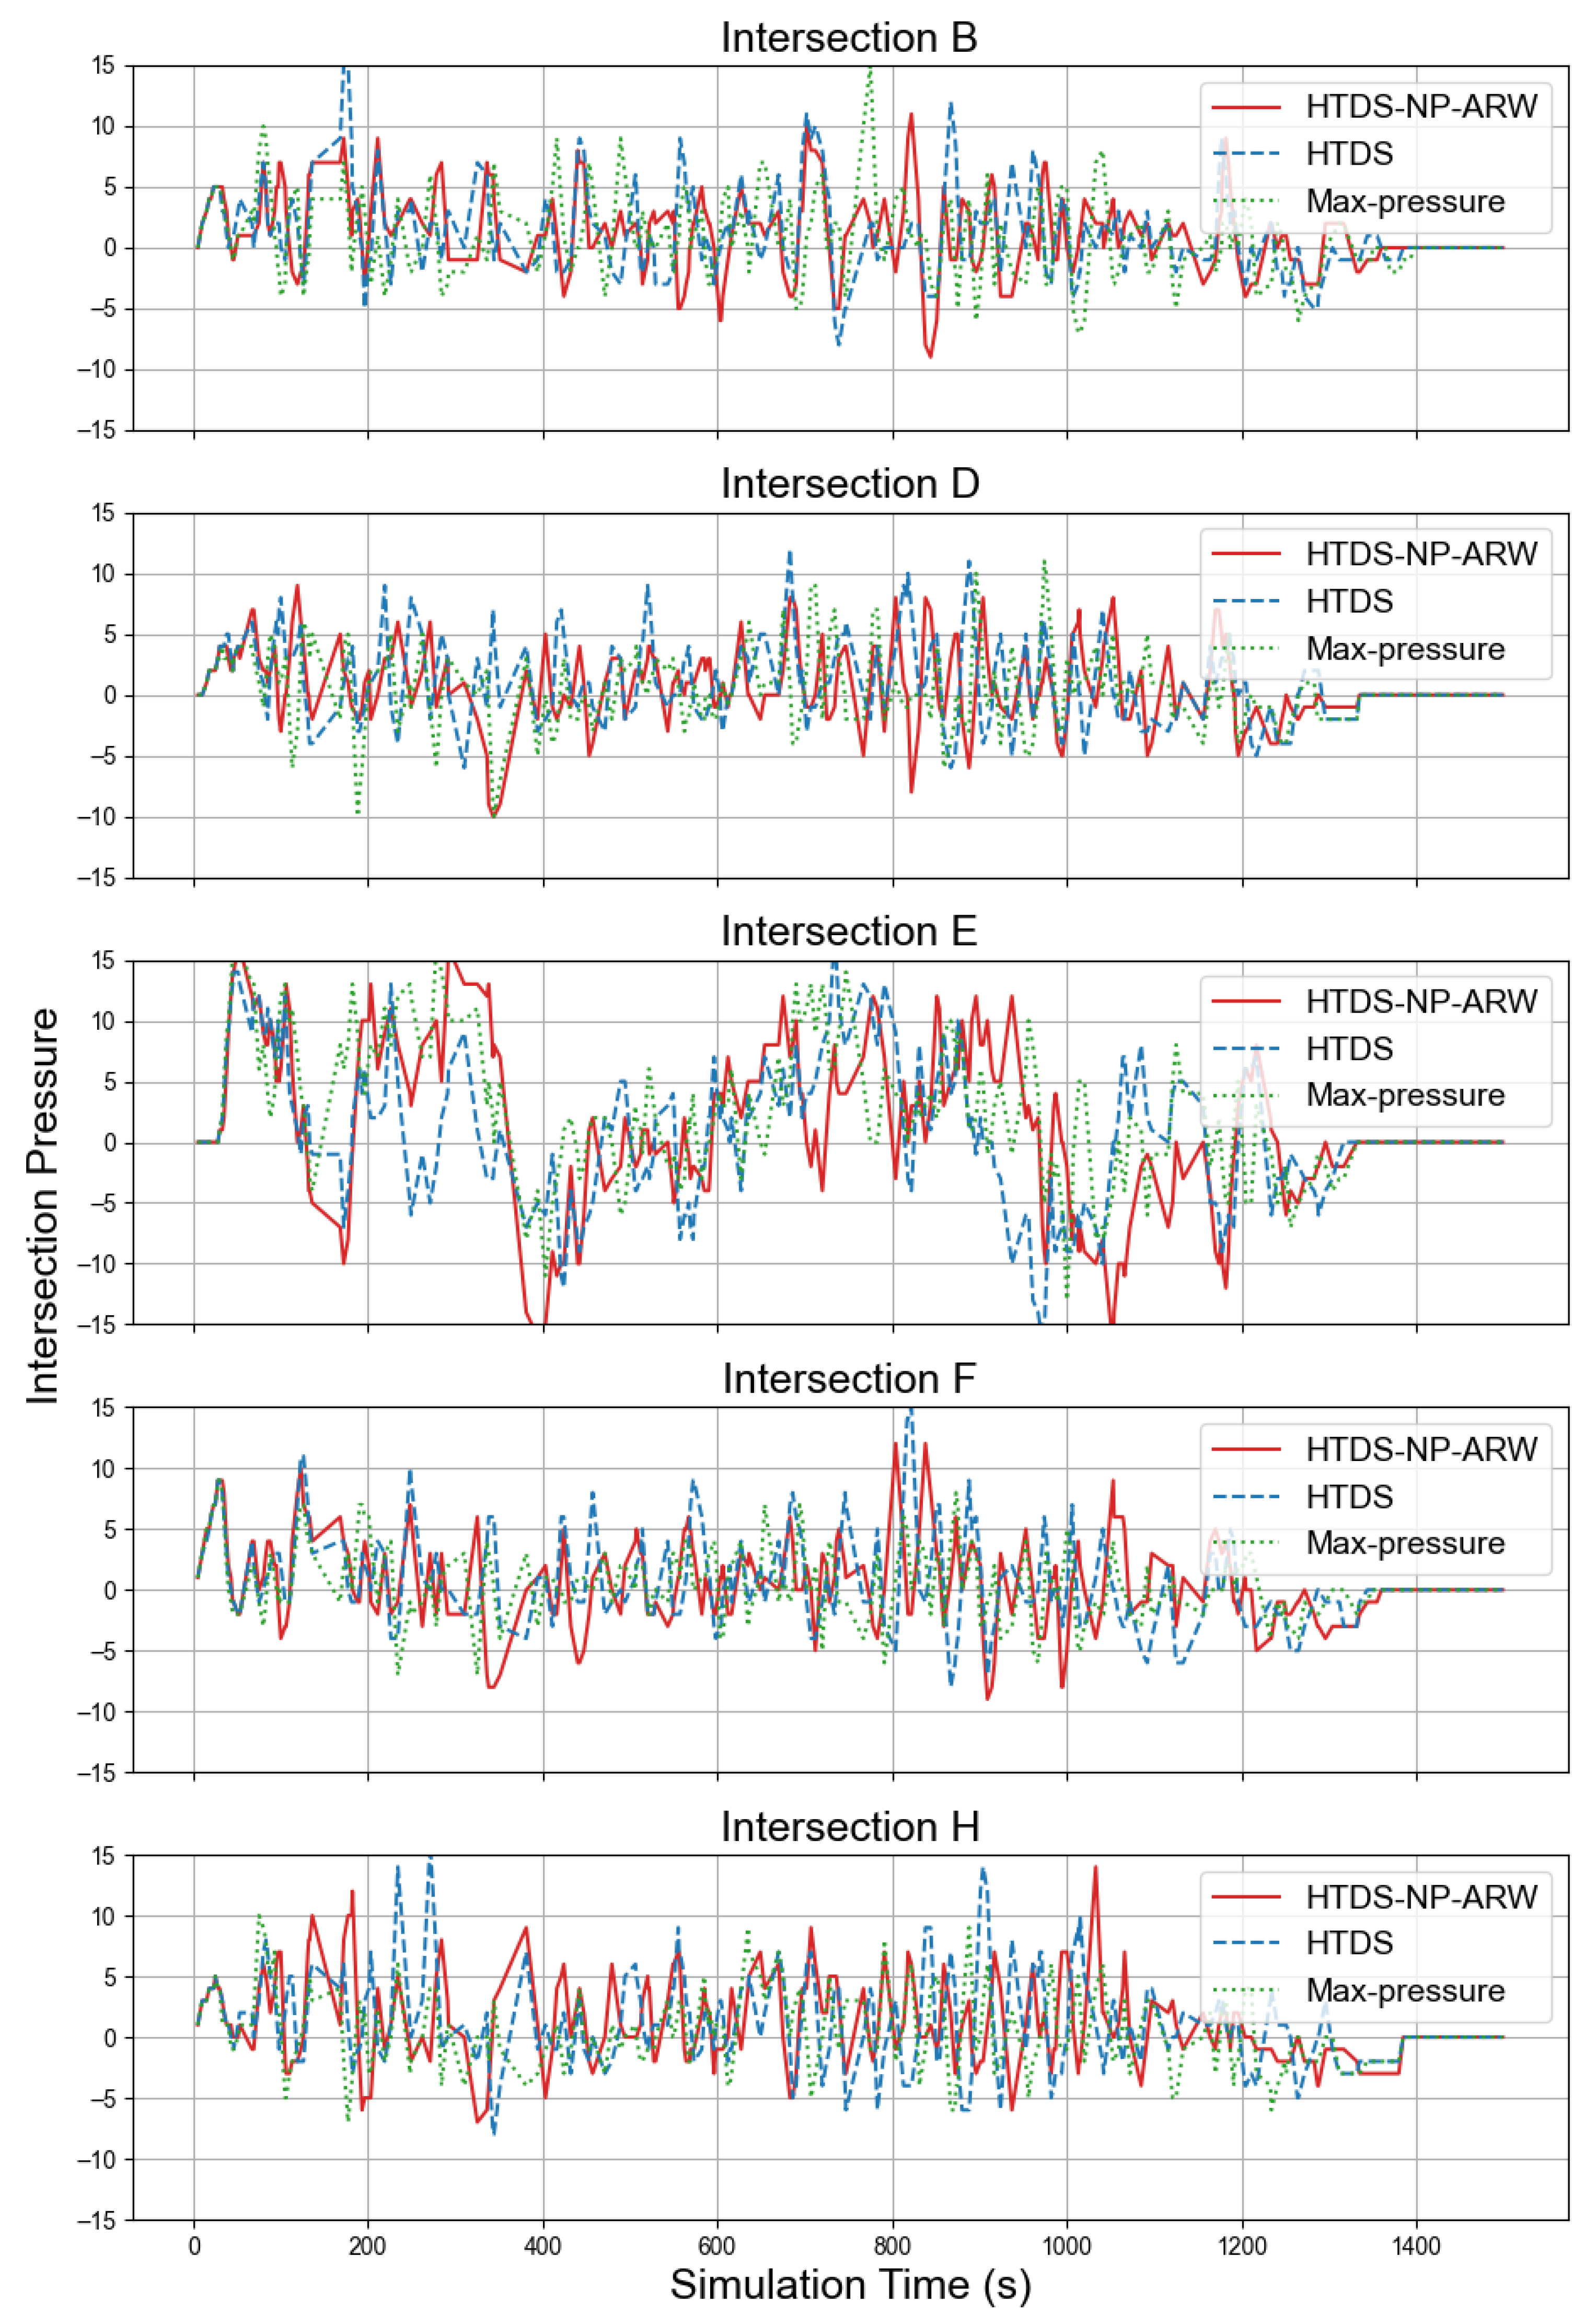
While the HTDS method without reward guidance shows better local intersection performance (queue: 3.46; pressure: 0.60), its network-wide efficiency is slightly lower, with an average travel time of 142.11 s compared to 140.24 s for HTDS-NP-ARW. The HTDS representation captures complex traffic dynamics, while the NP-ARW reward mechanism further optimizes pressure balance across intersections. In contrast, the max-pressure control strategy minimizes neighboring intersection pressure (0.47) but compromises local performance, resulting in higher local pressure (2.29) compared to other methods. Figure 7 and Figure 8 present the temporal evolution of queue lengths and intersection pressures across all five intersections under three control strategies: max-pressure, HTDS, and HTDS-NP-ARW.
From a sustainability perspective, fixed-time control results in the lowest CO2 emissions (4.76 k g / h ). This is probably due to prolonged vehicle idling, although it comes at the cost of significantly longer travel times. In comparison, HTDS and HTDS-NP-ARW methods reduce congestion through dynamic adjustments but introduce more active vehicle movements, leading to moderately higher emissions (5.26–5.29 k g / h ). This trade-off suggests that frequent signal switching and acceleration in DRL-controlled systems may increase localized emissions despite improving overall traffic flow [67,68]. Future work should incorporate explicit emission optimization objectives to achieve a better balance between network efficiency and environmental sustainability.

4.4.3. Feature Importance Ranking

HTDS-NP-ARW agent and HTDS agent were deployed separately in identical simulation environments for 10 runs each. At every decision timestamp, we collected ( s t i , a t i , r t i ) trajectory data and transformed raw states into features in Section 3.8.1. These engineered features were then input to XGBoost models (max depth = 8) to approximate agent policies, with restricted complexity to ensure interpretability.
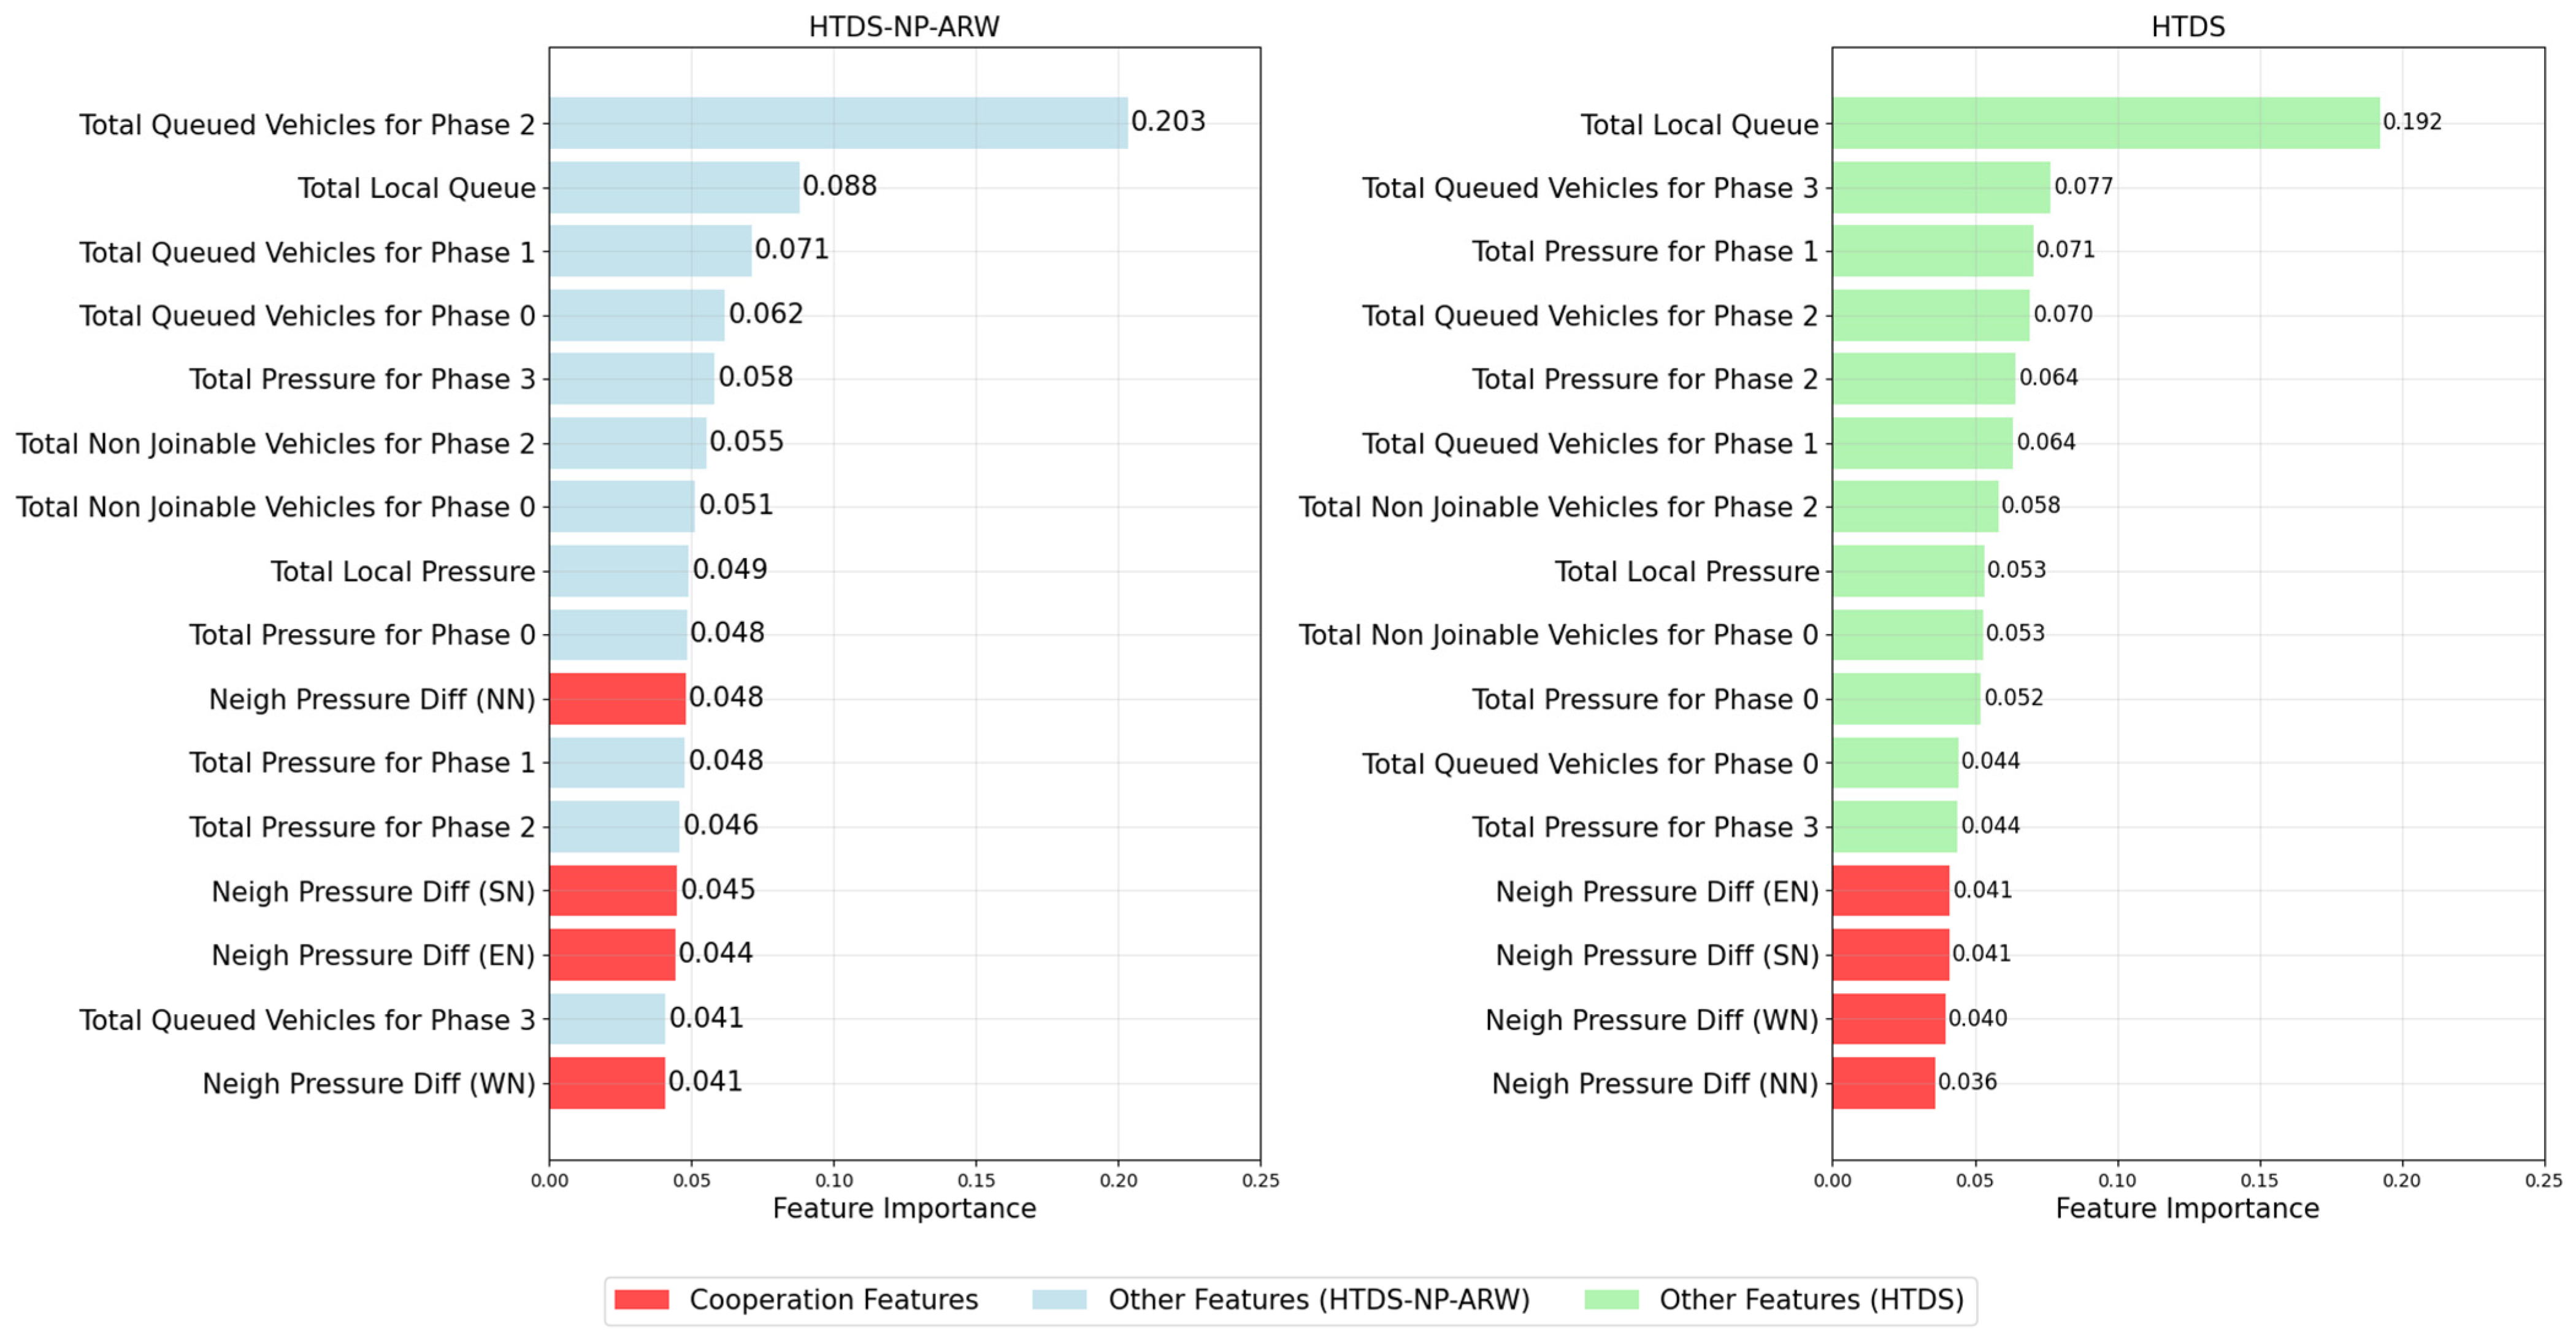
As shown in Figure 9 and Table 2, SHAP value analysis reveals distinct strategic priorities between agents: collaborative features contribute 19.48% to cooperative agent (HTDS-NP-ARW) decisions versus 14.39% for non-cooperative agent (HTDS), while local features dominate HTDS decisions (17.41% vs. 13.16%). This divergence manifests concretely in directional sensitivity patterns: the cooperative agent demonstrates heightened responsiveness to neighborhood pressure differentials, particularly southern neighbor (SN: 0.1516) and eastern neighbor (EN: 0.1136) orientations, exceeding the HTDS agent’s values in three of four directions. Conversely, the HTDS agent prioritizes immediate local conditions, evidenced by its heavy reliance on queue length (0.2965) and pressure (0.2234). These findings empirically confirm that HTDS-NP-ARW effectively integrates neighboring intersections’ congestion dynamics into control strategies, while HTDS operates primarily through localized self-interest metrics.

4.4.4. Phase-Action Decision Logic Analysis

Through model distillation with grid search over hyperparameters: max   d e p t h   3 , 4 , 5 , 6 ,   min   s a m p l e s   l e a f   10 , 30 , 50 , 100 , and α { 0.0 ,   0.2 , 0.4 , 0.6 , 0.8 , 1.0 } . HTDS-NP-ARW achieved optimal performance (71.2% accuracy) at max   d e p t h = 6 ,   min   s a m p l e s   l e a f = 100 , and soft-label weight α = 0.4 . This represents a significant 11.2-point improvement over non-distilled decision trees ( 60%) under identical parameters.
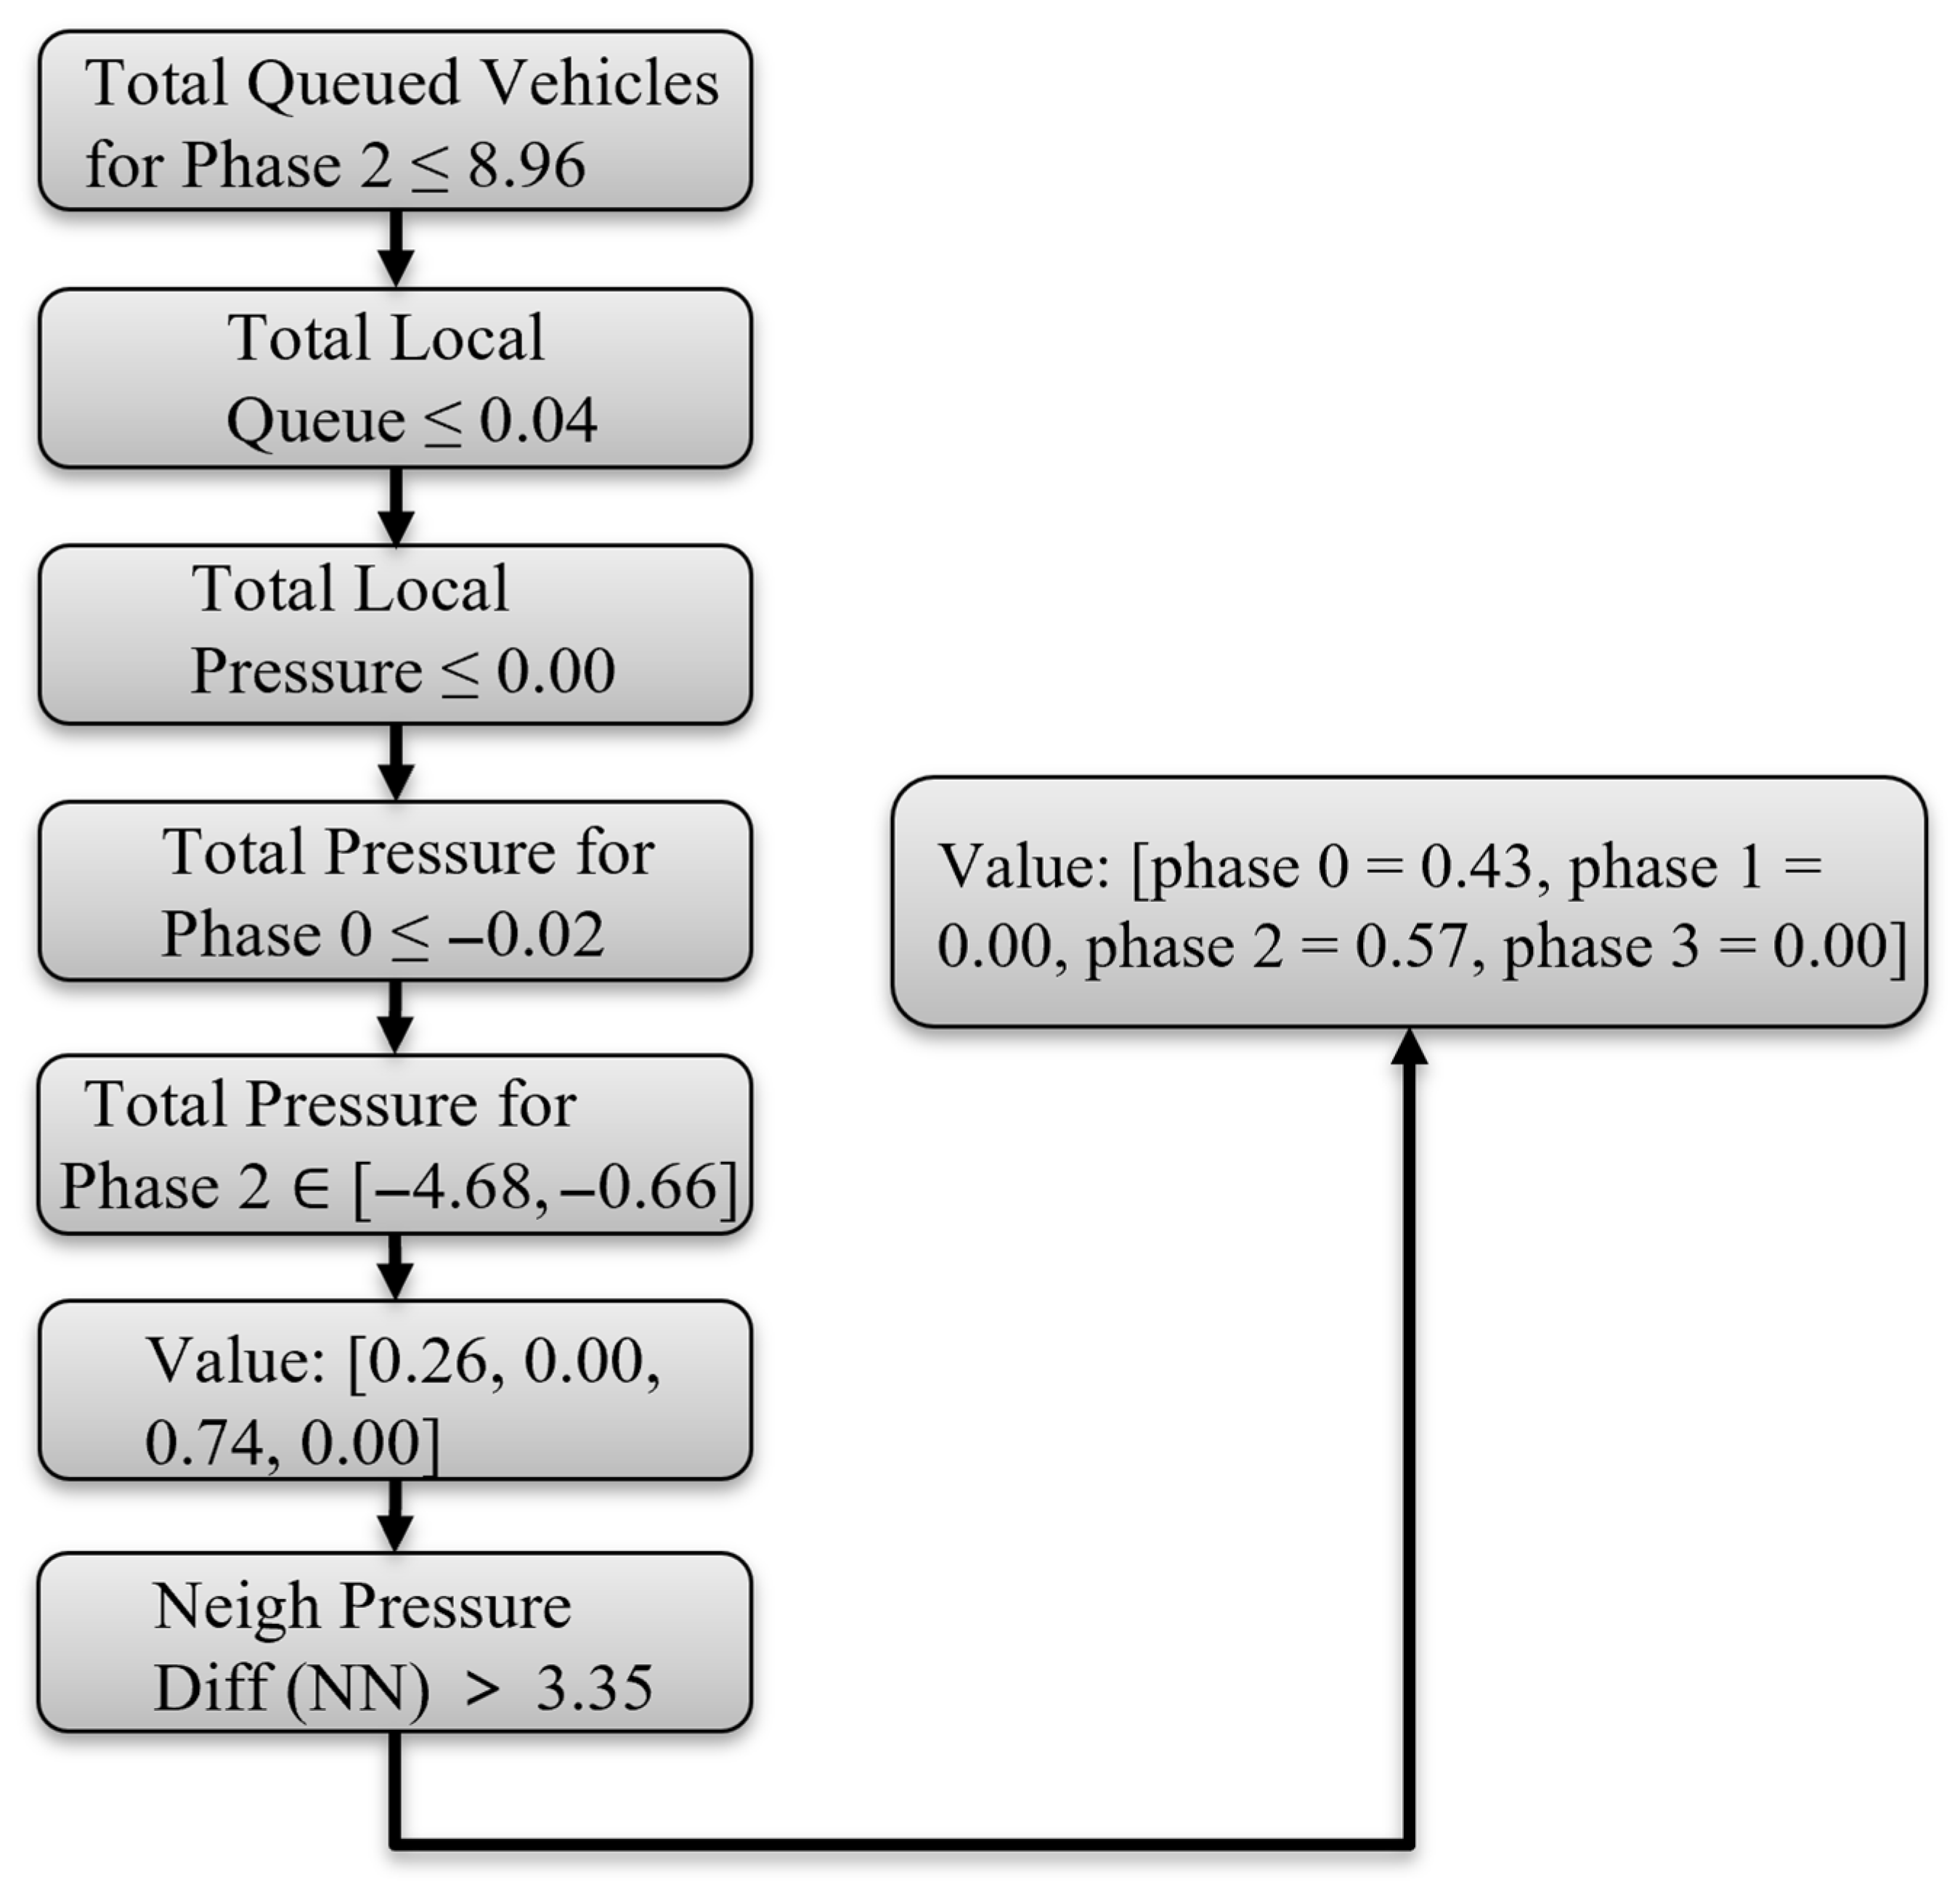
The distilled tree reveals hierarchical decision-making that incorporates neighboring intersection information. Figure 10 and Figure 11 present two example decision paths that highlight this structure.
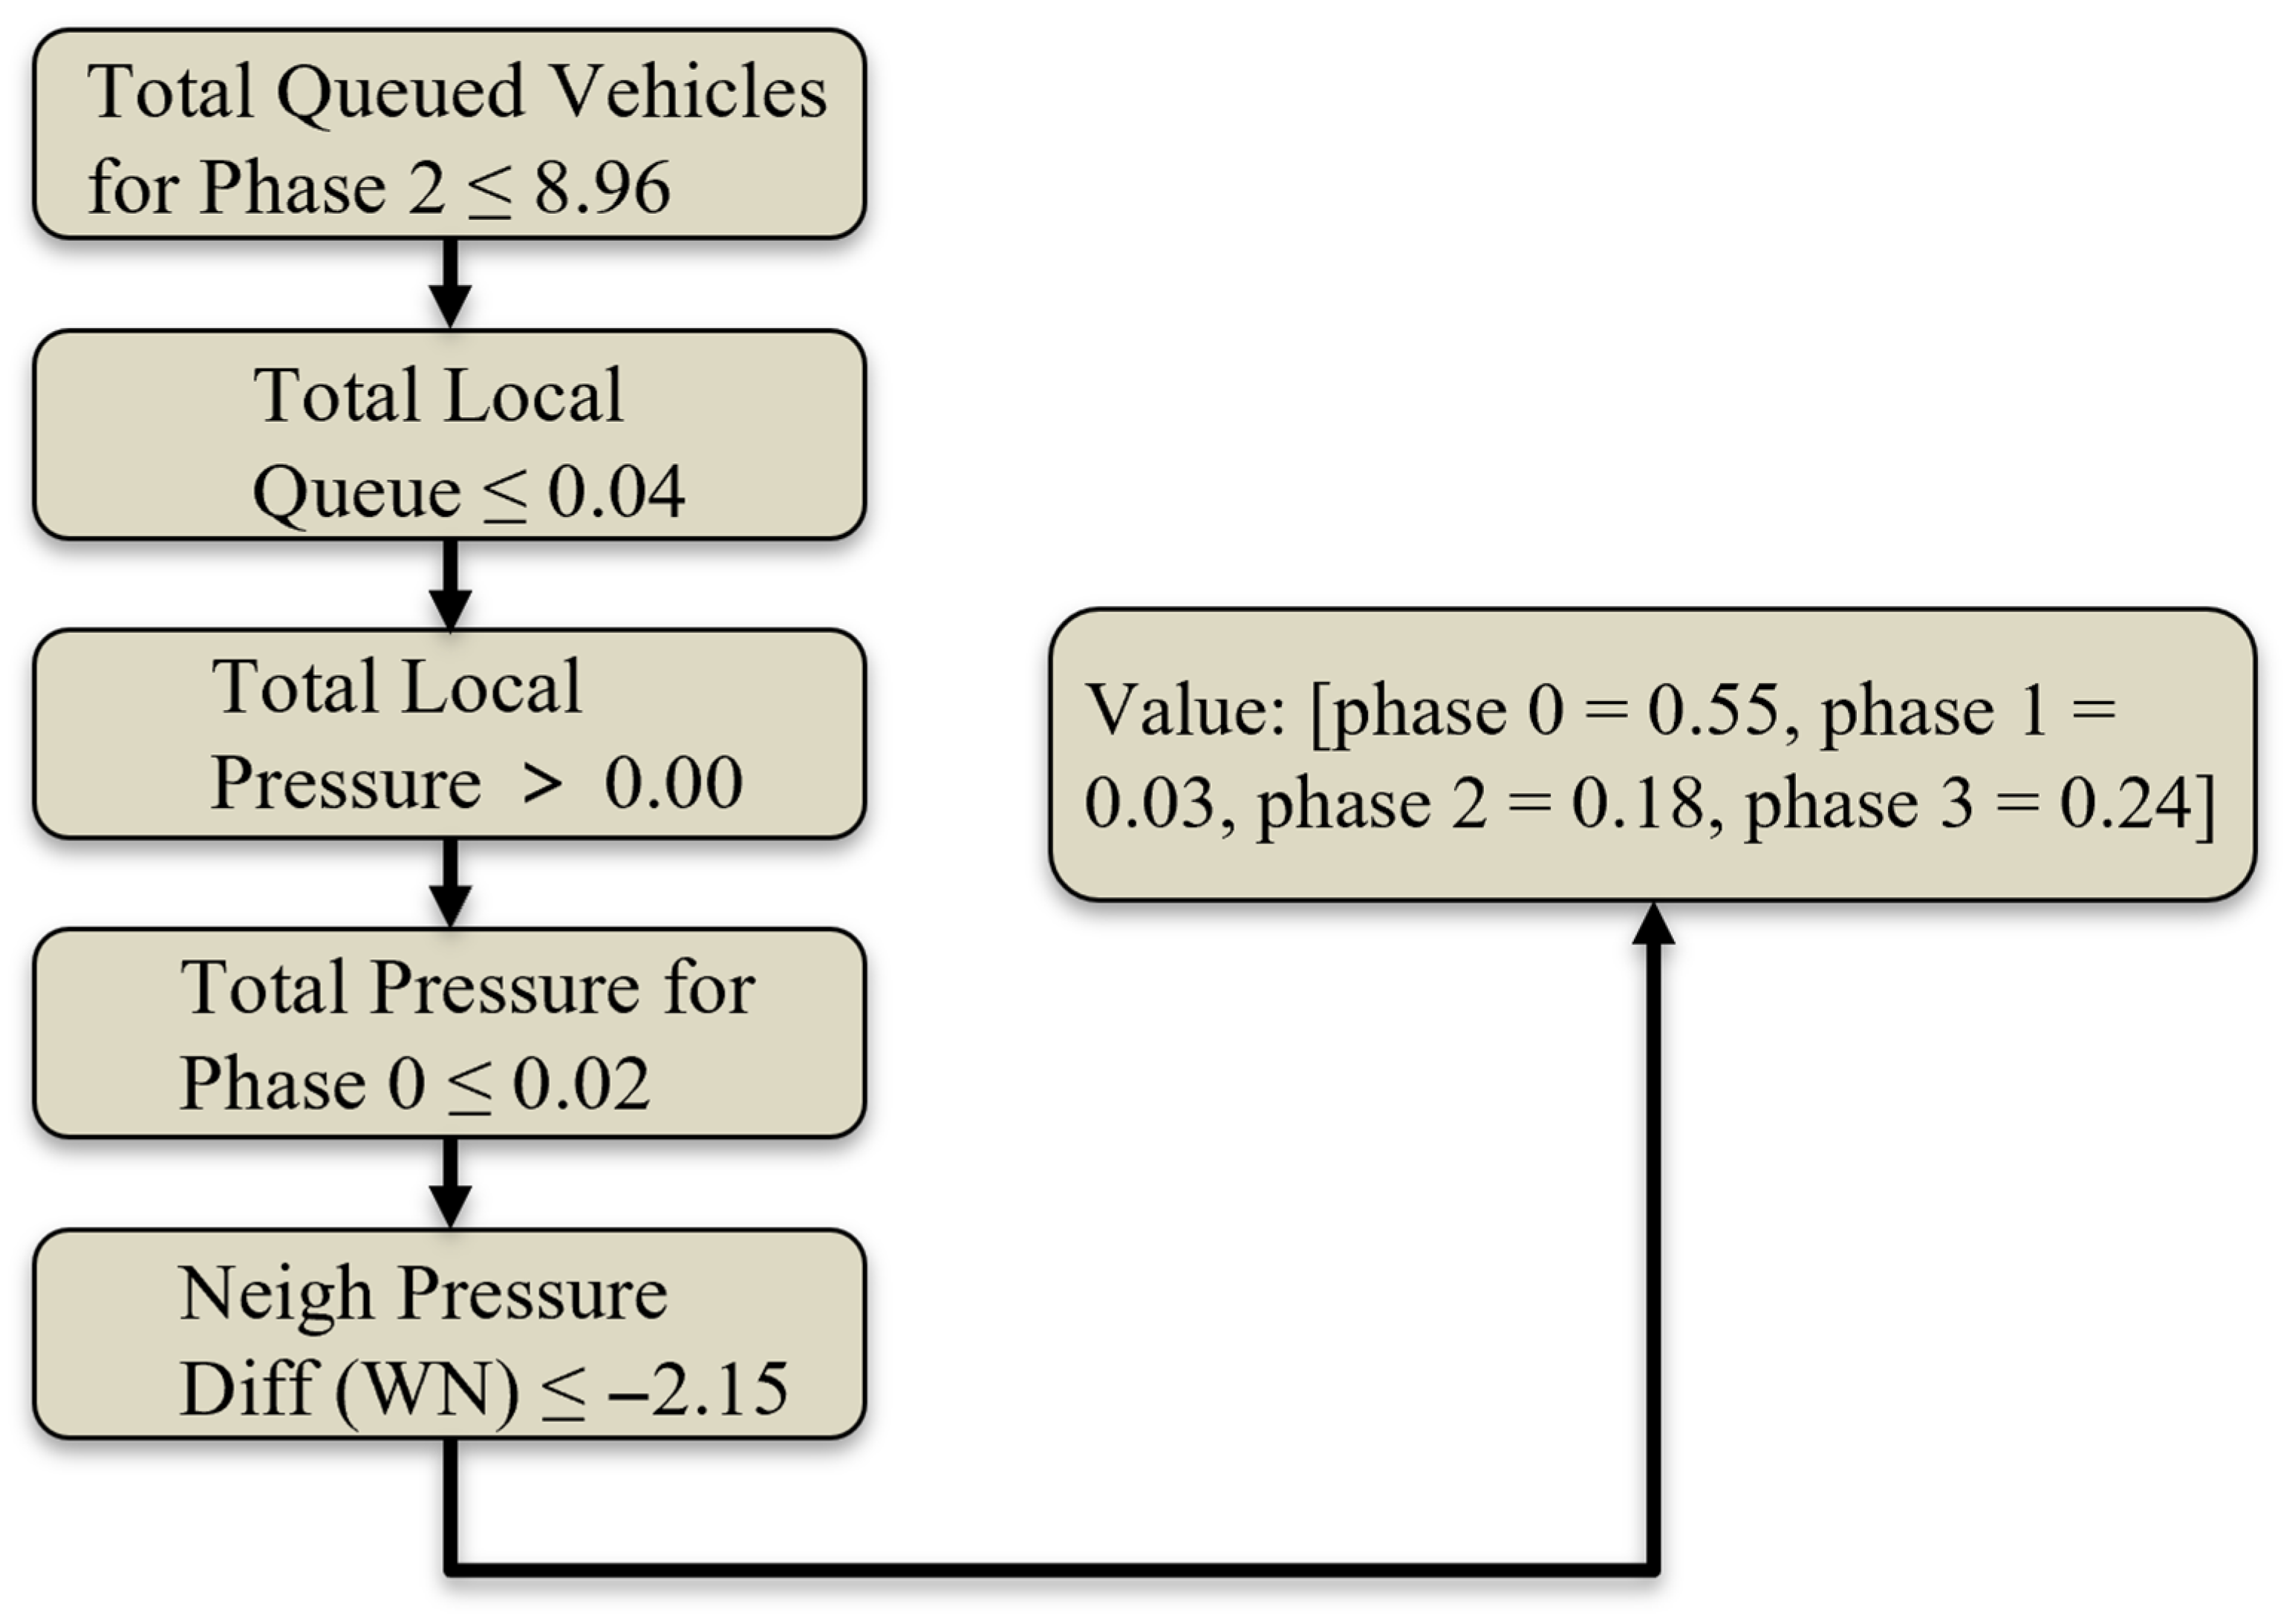
In Figure 10, path 1 is activated when a comprehensive “manageable local congestion” criterion is met, including Total Queued Vehicles for Phase 2 (EW-Straight) does not exceed 8.96 (indicating unsaturated flow), Total Local Queue remains below 0.04 (signifying low overall queuing), Total Local Pressure is non-positive (no significant buildup in the current phase), Total Pressure for Phase 0 (NS-Straight) is at most 0.02 (favorable short-term conditions for north–south movements), and the Total Pressure for Phase 2 lies within [ 4.68 ,   0.66 ] (moderate east–west pressure).
When these local conditions are satisfied, the model evaluates the neighbor pressure difference (Neigh Pressure Diff) for the northern neighboring intersection; if this difference is smaller than 3.35 , the probability of selecting the EW-Straight phase rises to 0.74 , thereby prioritizing congestion relief at the northern intersection, whereas if the Neigh Pressure Diff (NN) exceeds 3.35, the agent rebalances its decision, allocating a 0.43 probability to NS-Straight and 0.57 to EW-S straight. This dynamic trade-off balances local efficiency with neighbor assistance.
Path 2 (Figure 11) demonstrates cooperative yielding. The agent first confirms negligible local congestion: Total Queued Vehicles for Phase 2 does not exceed 8.96 , Total Local Queue stays below 0.04 , Total Local Pressure is non-positive and Total Pressure for Phase 0 is at most 0.02 . These conditions ensure both the current phase and NS-through movements are within capacity.
When these local criteria are met, the model evaluates the Neigh Pressure Diff metric for the western neighboring intersection. If this difference falls to 2.15 or below, indicating that the western neighbor’s load is markedly lighter than the agent’s, the probability of selecting the NS-Straight phase (phase 0) rises to 0.55 , while the EW-Straight phase probability drops to 0.18 . The remaining probabilities are allocated to SN-Left ( 0.03 ) and EW-Left ( 0.24 ). The “local-first to neighbor-driven” decision hierarchy of path 2 demonstrates that under minimal local demand and favorable neighbor conditions, the agent strategically prioritizes north–south throughput by deferring east–west service while maintaining nonzero probabilities for alternative movements to preserve operational flexibility.
The two paths reveal that neighbor considerations systematically follow local condition verifications, directly aligning with SHAP analysis, where neighbor features exhibit secondary yet substantial contributions. This confirms a sequential decision logic involving local assessment, neighbor evaluation, and cooperative action. Phase-switching probabilities dynamically adapt to cross-intersection conditions while prioritizing local efficiency optimization. The full distilled decision tree documenting this hierarchical decision-making process is provided in Appendix A, which contains the complete set of interpretable rules and their corresponding action probabilities across all observed traffic scenarios. This comprehensive documentation enables verification of the agent’s control logic and facilitates practical implementation by traffic engineers, as it translates the DRL policy into human-understandable decision pathways while preserving the original performance characteristics.

5. Conclusions

This study addresses the challenges of hybrid traffic signal control environments, where Deep Reinforcement Learning (DRL)-controlled intersections coexist with traditional max–pressure-controlled neighbors. The proposed spatiotemporal pressure perception agent, integrating the Holistic Traffic Dynamo State (HTDS) representation and Neighbor–Pressure–Adaptive Reward Weighting (NP-ARW) mechanism, effectively balances local efficiency and network-wide coordination. The Conv-Attention Traffic Net (CAT-Net) further enhances the agent’s ability to model spatiotemporal features, ensuring efficient and adaptive decision-making.
Experimental results demonstrate that the HTDS, which combines real-time queue data, predicted vehicle merging patterns, and approaching flows, enables the agent to capture complex traffic dynamics. The NP-ARW mechanism, by dynamically adjusting queue penalties based on relative pressure differences with neighboring intersections, significantly reduces average queue lengths and pressure at neighboring intersections while maintaining strong local performance.
Interpretability analysis using XGBoost and Decision Trees methods, as well as SHAP values, reveals that the cooperative agent (HTDS-NP-ARW) incorporates neighbor pressure dynamics more prominently compared to the non-cooperative variant, confirming the effectiveness of the proposed reward mechanism in promoting network-level coordination. This transparency addresses a key limitation of black-box AI controllers, enhancing reliability in real-world applications.
In summary, the proposed framework advances hybrid traffic signal control primarily by improving operational efficiency. Future work will focus on scaling the approach to larger networks, integrating more detailed emission models, and exploring multi-objective optimization to explicitly enhance sustainability alongside efficiency and energy consumption.

Author Contributions

Conceptualization, Y.X. and G.Q.; methodology, Y.X., G.Q. and H.Z.; software, J.Z. and K.T.; validation, Y.X. and G.Q.; formal analysis, G.Q. and E.C.; investigation, Y.X. and J.Z.; resources, H.Z.; data curation, K.T. and J.Z.; writing—original draft preparation, Y.X. and G.Q.; writing—review and editing, H.Z. and E.C.; visualization, K.T.; supervision, H.Z.; project administration, H.Z.; funding acquisition, H.Z. All authors have read and agreed to the published version of the manuscript.

Funding

This research was funded by the National Key Research and Development Program (Grant No. 2023YFE0209300), the National Natural Science Foundation of China Project (Grant No. 52302414 and No. 52372319), 2024 Shanghai “Science and Technology Innovation Action Plan” International Scientific and Technological Cooperation Program (No. 24510714400), and the Fundamental Research Funds for the Central Universities.

Institutional Review Board Statement

Not applicable.

Informed Consent Statement

Not applicable.

Data Availability Statement

The data presented in this study are available on request from the corresponding author.

Conflicts of Interest

The authors declare no conflicts of interest.

Appendix A

Figure A1. Decision tree of hierarchical decision-making process. Node color intensity indicates classification confidence (darker = higher proportion of correct predictions).
Sustainability 17 07521 g0a1

References

  1. Macioszek, E.; Wyderka, A.; Jurdana, I. The bicyclist safety analysis based on road incidents maps. Sci. J. Silesian Univ. Technol. Ser. Transp 2025, 126, 129–147. [Google Scholar] [CrossRef]
  2. Lowrie, P. Scats, Sydney Co-Ordinated Adaptive Traffic System: A Traffic Responsive Method of Controlling Urban Traffic. 1990. Available online: https://trid.trb.org/View/488852 (accessed on 15 August 2025).
  3. Cools, S.-B.; Gershenson, C.; D’Hooghe, B. Self-organizing traffic lights: A realistic simulation. In Advances in Applied Self-Organizing Systems; Springer: London, UK, 2008; pp. 41–50. [Google Scholar]
  4. Little, J.D.; Kelson, M.D.; Gartner, N.H. MAXBAND: A Versatile Program for Setting Signals on Arteries and Triangular Networks. 1981. Available online: https://dspace.mit.edu/bitstream/handle/1721.1/1979/SWP-1185-08951478.pdf?sequence=1 (accessed on 15 August 2025).
  5. Varaiya, P. The max-pressure controller for arbitrary networks of signalized intersections. In Advances in Dynamic Network Modeling in Complex Transportation Systems; Springer: Berlin/Heidelberg, Germany, 2013; pp. 27–66. [Google Scholar]
  6. Varaiya, P. Max pressure control of a network of signalized intersections. Transp. Res. Part C-Emerg. Technol. 2013, 36, 177–195. [Google Scholar] [CrossRef]
  7. Hunt, P.; Robertson, D.; Bretherton, R.; Royle, M.C. The SCOOT on-line traffic signal optimisation technique. Traffic Eng. Control 1982, 23, 190–192. [Google Scholar]
  8. Lowrie, P. Scats—A Traffic Responsive Method of Controlling Urban Traffic; Roads and Traffic Authority: Darlinghurst, NSW, Australia, 1992.
  9. Li, L.; Lv, Y.; Wang, F.-Y. Traffic signal timing via deep reinforcement learning. IEEE/CAA J. Autom. Sin. 2016, 3, 247–254. [Google Scholar] [CrossRef]
  10. Liang, X.; Du, X.; Wang, G.; Han, Z. A deep reinforcement learning network for traffic light cycle control. IEEE Trans. Veh. Technol. 2019, 68, 1243–1253. [Google Scholar] [CrossRef]
  11. Wei, H.; Xu, N.; Zhang, H.; Zheng, G.; Zang, X.; Chen, C.; Zhang, W.; Zhu, Y.; Xu, K.; Li, Z. Colight: Learning network-level cooperation for traffic signal control. In Proceedings of the 28th ACM International Conference on Information and Knowledge Management, Beijing, China, 3–7 November 2019; pp. 1913–1922. [Google Scholar]
  12. Garg, D.; Chli, M.; Vogiatzis, G. Deep reinforcement learning for autonomous traffic light control. In Proceedings of the 2018 3rd IEEE International Conference on Intelligent Transportation Engineering (ICITE), Singapore, 3–5 September 2018; pp. 214–218. [Google Scholar]
  13. Chu, T.; Wang, J.; Codecà, L.; Li, Z. Multi-agent deep reinforcement learning for large-scale traffic signal control. IEEE Trans. Intell. Transp. Syst. 2019, 21, 1086–1095. [Google Scholar] [CrossRef]
  14. Chen, C.; Wei, H.; Xu, N.; Zheng, G.; Yang, M.; Xiong, Y.; Xu, K.; Li, Z. Toward a thousand lights: Decentralized deep reinforcement learning for large-scale traffic signal control. Proc. AAAI Conf. Artif. Intell. 2020, 34, 3414–3421. [Google Scholar] [CrossRef]
  15. Prashanth, L.; Bhatnagar, S. Reinforcement learning with average cost for adaptive control of traffic lights at intersections. In Proceedings of the 2011 14th International IEEE Conference on Intelligent Transportation Systems (ITSC), Washington, DC, USA, 5–7 October 2011; pp. 1640–1645. [Google Scholar]
  16. Zhang, Y.; Goel, H.; Li, P.; Damani, M.; Chinchali, S.; Sartoretti, G. Coordlight: Learning decentralized coordination for network-wide traffic signal control. IEEE Trans. Intell. Transp. Syst. 2025, 26, 8034–8049. [Google Scholar] [CrossRef]
  17. Goel, H.; Zhang, Y.; Damani, M.; Sartoretti, G. Sociallight: Distributed cooperation learning towards network-wide traffic signal control. arXiv 2023, arXiv:2305.16145. [Google Scholar]
  18. Wang, Y.; Xu, T.; Niu, X.; Tan, C.; Chen, E.; Xiong, H. STMARL: A spatio-temporal multi-agent reinforcement learning approach for cooperative traffic light control. IEEE Trans. Mob. Comput. 2020, 21, 2228–2242. [Google Scholar] [CrossRef]
  19. Lin, J.; Zhu, Y.; Liu, L.; Liu, Y.; Li, G.; Lin, L. Denselight: Efficient control for large-scale traffic signals with dense feedback. arXiv 2023, arXiv:2306.07553. [Google Scholar]
  20. Wei, H.; Zheng, G.; Yao, H.; Li, Z. Intellilight: A reinforcement learning approach for intelligent traffic light control. In Proceedings of the the 24th ACM SIGKDD International Conference on Knowledge Discovery & Data Mining, London, UK, 19–23 August 2018; pp. 2496–2505. [Google Scholar]
  21. Cai, C.; Wei, M. Adaptive urban traffic signal control based on enhanced deep reinforcement learning. Sci. Rep. 2024, 14, 14116. [Google Scholar] [CrossRef] [PubMed]
  22. Yang, M.; Wang, Y.; Yu, Y.; Zhou, M. Mixlight: Mixed-agent cooperative reinforcement learning for traffic light control. IEEE Trans. Ind. Inf. 2023, 20, 2653–2661. [Google Scholar] [CrossRef]
  23. Koonce, P. Traffic Signal Timing Manual; Federal Highway Administration: Washington, DC, USA, 2008.
  24. Webster, F.V. Traffic Signal Settings; Transportation Research Board: Washington, DC, USA, 1958. [Google Scholar]
  25. Roess, R.P.; Prassas, E.S.; McShane, W.R. Traffic Engineering; Pearson/Prentice Hall: Hoboken, NJ, USA, 2004. [Google Scholar]
  26. Papageorgiou, M.; Diakaki, C.; Dinopoulou, V.; Kotsialos, A.; Wang, Y. Review of road traffic control strategies. Proc. IEEE 2003, 91, 2043–2067. [Google Scholar] [CrossRef]
  27. Papageorgiou, M. An integrated control approach for traffic corridors. Transp. Res. Part C-Emerg. Technol. 1995, 3, 19–30. [Google Scholar] [CrossRef]
  28. Stevanovic, A. Adaptive Traffic Control Systems: Domestic and Foreign State of Practice; The National Academies Press: Washington, DC, USA, 2010. [Google Scholar]
  29. Henry, J.-J.; Farges, J.L.; Tuffal, J. The PRODYN real time traffic algorithm. In Control in Transportation Systems; Elsevier: Amsterdam, The Netherlands, 1984; pp. 305–310. [Google Scholar]
  30. Zheng, Y.; Luo, J.; Gao, H.; Zhou, Y.; Li, K. Pri-DDQN: Learning adaptive traffic signal control strategy through a hybrid agent. Complex Intell. Syst. 2025, 11, 47. [Google Scholar] [CrossRef]
  31. Bouktif, S.; Cheniki, A.; Ouni, A.; El-Sayed, H. Deep reinforcement learning for traffic signal control with consistent state and reward design approach. Knowl.-Based Syst. 2023, 267, 110440. [Google Scholar] [CrossRef]
  32. Cai, S.; Fang, J.; Xu, M. XLight: An interpretable multi-agent reinforcement learning approach for traffic signal control. Expert Syst. Appl. 2025, 273, 126938. [Google Scholar] [CrossRef]
  33. Koohy, B.; Stein, S.; Gerding, E.; Manla, G. Reward Function Design in Multi-Agent Reinforcement Learning for Traffic Signal Control. 2022. Available online: https://ceur-ws.org/Vol-3173/1.pdf (accessed on 15 August 2025).
  34. Rafique, M.T.; Mustafa, A.; Sajid, H. Reinforcement Learning for Adaptive Traffic Signal Control: Turn-Based and Time-Based Approaches to Reduce Congestion. arXiv 2024, arXiv:2408.15751. [Google Scholar]
  35. Zhang, L.; Wu, Q.; Shen, J.; Lü, L.; Du, B.; Wu, J. Expression might be enough: Representing pressure and demand for reinforcement learning based traffic signal control. In Proceedings of the 39th International Conference on Machine Learning, Baltimore, MD, USA, 17–23 July 2022; pp. 26645–26654. [Google Scholar]
  36. Azfar, T.; Ke, R. Traffic Co-Simulation Framework Empowered by Infrastructure Camera Sensing and Reinforcement Learning. arXiv 2024, arXiv:2412.03925. [Google Scholar] [CrossRef]
  37. Xia, X.; Gao, L.; Chen, Q.A.; Ma, J.; Zheng, Z.; Luo, Y.; Alshammari, F.; Xiang, X. Enhanced Perception with Cooperation Between Connected Automated Vehicles and Smart Infrastructure. 2025. Available online: https://escholarship.org/uc/item/7sd5c485 (accessed on 15 August 2025).
  38. Wei, H.; Chen, C.; Zheng, G.; Wu, K.; Gayah, V.; Xu, K.; Li, Z. Presslight: Learning max pressure control to coordinate traffic signals in arterial network. In Proceedings of the 25th ACM SIGKDD International Conference on Knowledge Discovery & Data Mining, Anchorage, AK, USA, 4–8 August 2019; pp. 1290–1298. [Google Scholar]
  39. Liu, J.; Zhang, H.; Fu, Z.; Wang, Y. Learning scalable multi-agent coordination by spatial differentiation for traffic signal control. Eng. Appl. Artif. Intell. 2021, 100, 104165. [Google Scholar] [CrossRef]
  40. Chu, T.; Chinchali, S.; Katti, S. Multi-agent reinforcement learning for networked system control. arXiv 2020, arXiv:2004.01339. [Google Scholar] [CrossRef]
  41. Zhang, C.; Tian, Y.; Zhang, Z.; Xue, W.; Xie, X.; Yang, T.; Ge, X.; Chen, R. Neighborhood cooperative multiagent reinforcement learning for adaptive traffic signal control in epidemic regions. IEEE Trans. Intell. Transp. Syst. 2022, 23, 25157–25168. [Google Scholar] [CrossRef]
  42. Tseng, Y.-T.; Ferng, H.-W. Adaptive DRL-Based Traffic Signal Control with an Infused LSTM Prediction Model. In Proceedings of the International Conference on Industrial, Engineering and Other Applications of Applied Intelligent Systems, Kitakyushu, Japan, 1–4 July 2025; pp. 291–302. [Google Scholar]
  43. Huang, P.; Wang, P.; Li, X.; Jin, X.; Yao, S. Adaptive Distributed Training for Multi-Agent Reinforcement Learning in Multi-Objective Traffic Signal Control. 2025. Available online: https://papers.ssrn.com/sol3/papers.cfm?abstract_id=5332828 (accessed on 15 August 2025).
  44. Lin, W.-Y.; Song, Y.-Z.; Ruan, B.-K.; Shuai, H.-H.; Shen, C.-Y.; Wang, L.-C.; Li, Y.-H. Temporal difference-aware graph convolutional reinforcement learning for multi-intersection traffic signal control. IEEE Trans. Intell. Transp. Syst. 2023, 25, 327–337. [Google Scholar] [CrossRef]
  45. Vaswani, A.; Shazeer, N.; Parmar, N.; Uszkoreit, J.; Jones, L.; Gomez, A.N.; Kaiser, Ł.; Polosukhin, I. Attention is all you need. Adv. Neural Inform. Process. Syst. 2017, 30, 6000–6010. [Google Scholar]
  46. Zheng, G.; Zang, X.; Xu, N.; Wei, H.; Yu, Z.; Gayah, V.; Xu, K.; Li, Z. Diagnosing reinforcement learning for traffic signal control. arXiv 2019, arXiv:1905.04716. [Google Scholar] [CrossRef]
  47. Wang, L.; Zhang, G.; Yang, Q.; Han, T. An adaptive traffic signal control scheme with Proximal Policy Optimization based on deep reinforcement learning for a single intersection. Eng. Appl. Artif. Intell. 2025, 149, 110440. [Google Scholar] [CrossRef]
  48. Haddad, T.A. Deep Reinforcement Learning for Multi-intersection Traffic Signal Control: A New Cooperative Approach. In Proceedings of the Sixth International Symposium on Informatics and Its Applications (ISIA), Msila, Algeria, 10–December 2024. [Google Scholar]
  49. Verma, A.; Murali, V.; Singh, R.; Kohli, P.; Chaudhuri, S. Programmatically interpretable reinforcement learning. In Proceedings of the International Conference on Machine Learning, Stockholm, Sweden, 10–15 July 2018; pp. 5045–5054. [Google Scholar]
  50. Ault, J.; Hanna, J.P.; Sharon, G. Learning an interpretable traffic signal control policy. arXiv 2019, arXiv:1912.11023. [Google Scholar]
  51. Rizzo, S.G.; Vantini, G.; Chawla, S. Reinforcement learning with explainability for traffic signal control. In Proceedings of the 2019 IEEE Intelligent Transportation Systems Conference (ITSC), Auckland, New Zealand, 27–30 October 2019; pp. 3567–3572. [Google Scholar]
  52. Schreiber, L.; Ramos, G.d.O.; Bazzan, A.L. Towards explainable deep reinforcement learning for traffic signal control. In Proceedings of the LatinX in AI Workshop@ ICML, Virtually, 19 July 2021. [Google Scholar]
  53. Zhang, Y.; Zheng, G.; Liu, Z.; Li, Q.; Zeng, H. MARLens: Understanding multi-agent reinforcement learning for traffic signal control via visual analytics. IEEE Trans. Vis. Comput. Graph. 2024, 31, 4018–4033. [Google Scholar] [CrossRef]
  54. Saulières, L. A Survey of Explainable Reinforcement Learning: Targets, Methods and Needs. arXiv 2025, arXiv:2507.12599. [Google Scholar] [CrossRef]
  55. Zhang, G.; Chang, F.; Huang, H.; Zhou, Z. Dual-objective reinforcement learning-based adaptive traffic signal control for decarbonization and efficiency optimization. Mathematics 2024, 12, 2056. [Google Scholar] [CrossRef]
  56. Aslani, M.; Mesgari, M.S.; Wiering, M. Adaptive traffic signal control with actor-critic methods in a real-world traffic network with different traffic disruption events. Transp. Res. Part C-Emerg. Technol. 2017, 85, 732–752. [Google Scholar] [CrossRef]
  57. Aslani, M.; Seipel, S.; Mesgari, M.S.; Wiering, M. Traffic signal optimization through discrete and continuous reinforcement learning with robustness analysis in downtown Tehran. Adv. Eng. Inf. 2018, 38, 639–655. [Google Scholar] [CrossRef]
  58. Mannion, P.; Duggan, J.; Howley, E. An experimental review of reinforcement learning algorithms for adaptive traffic signal control. Auton. Road Transp. Support Syst. 2016, 47–66. [Google Scholar]
  59. Casas, N. Deep deterministic policy gradient for urban traffic light control. arXiv 2017, arXiv:1703.09035. [Google Scholar] [CrossRef]
  60. Abdoos, M.; Mozayani, N.; Bazzan, A.L. Traffic light control in non-stationary environments based on multi agent Q-learning. In Proceedings of the 2011 14th International IEEE Conference on Intelligent Transportation Systems (ITSC), Washington, DC, USA, 5–7 October 2011; pp. 1580–1585. [Google Scholar]
  61. Wan, C.-H.; Hwang, M.-C. Adaptive traffic signal control methods based on deep reinforcement learning. In Intelligent Transport Systems for Everyone’s Mobility; Springer: Berlin/Heidelberg, Germany, 2019; pp. 195–209. [Google Scholar]
  62. Treiber, M.; Hennecke, A.; Helbing, D. Congested traffic states in empirical observations and microscopic simulations. Phys. Rev. E 2000, 62, 1805. [Google Scholar] [CrossRef]
  63. Hinton, G.; Vinyals, O.; Dean, J. Distilling the knowledge in a neural network. arXiv 2015, arXiv:1503.02531. [Google Scholar] [CrossRef]
  64. Lopez, P.A.; Behrisch, M.; Bieker-Walz, L.; Erdmann, J.; Flötteröd, Y.-P.; Hilbrich, R.; Lücken, L.; Rummel, J.; Wagner, P.; Wießner, E. Microscopic traffic simulation using sumo. In Proceedings of the 2018 21st International Conference on Intelligent Transportation Systems (ITSC), Maui, HI, USA, 4–7 November 2018; pp. 2575–2582. [Google Scholar]
  65. Wu, Q.; Zhang, L.; Shen, J.; Lü, L.; Du, B.; Wu, J. Efficient pressure: Improving efficiency for signalized intersections. arXiv 2021, arXiv:2112.02336. [Google Scholar] [CrossRef]
  66. Huang, L.; Qu, X. Improving traffic signal control operations using proximal policy optimization. IET Intel. Transp. Syst. 2023, 17, 592–605. [Google Scholar] [CrossRef]
  67. Zhang, G.; Chang, F.; Jin, J.; Yang, F.; Huang, H. Multi-objective deep reinforcement learning approach for adaptive traffic signal control system with concurrent optimization of safety, efficiency, and decarbonization at intersections. Accid. Anal. Prev. 2024, 199, 107451. [Google Scholar] [CrossRef]
  68. Guo, J.; Cheng, L.; Wang, S. CoTV: Cooperative control for traffic light signals and connected autonomous vehicles using deep reinforcement learning. IEEE Trans. Intell. Transp. Syst. 2023, 24, 10501–10512. [Google Scholar] [CrossRef]
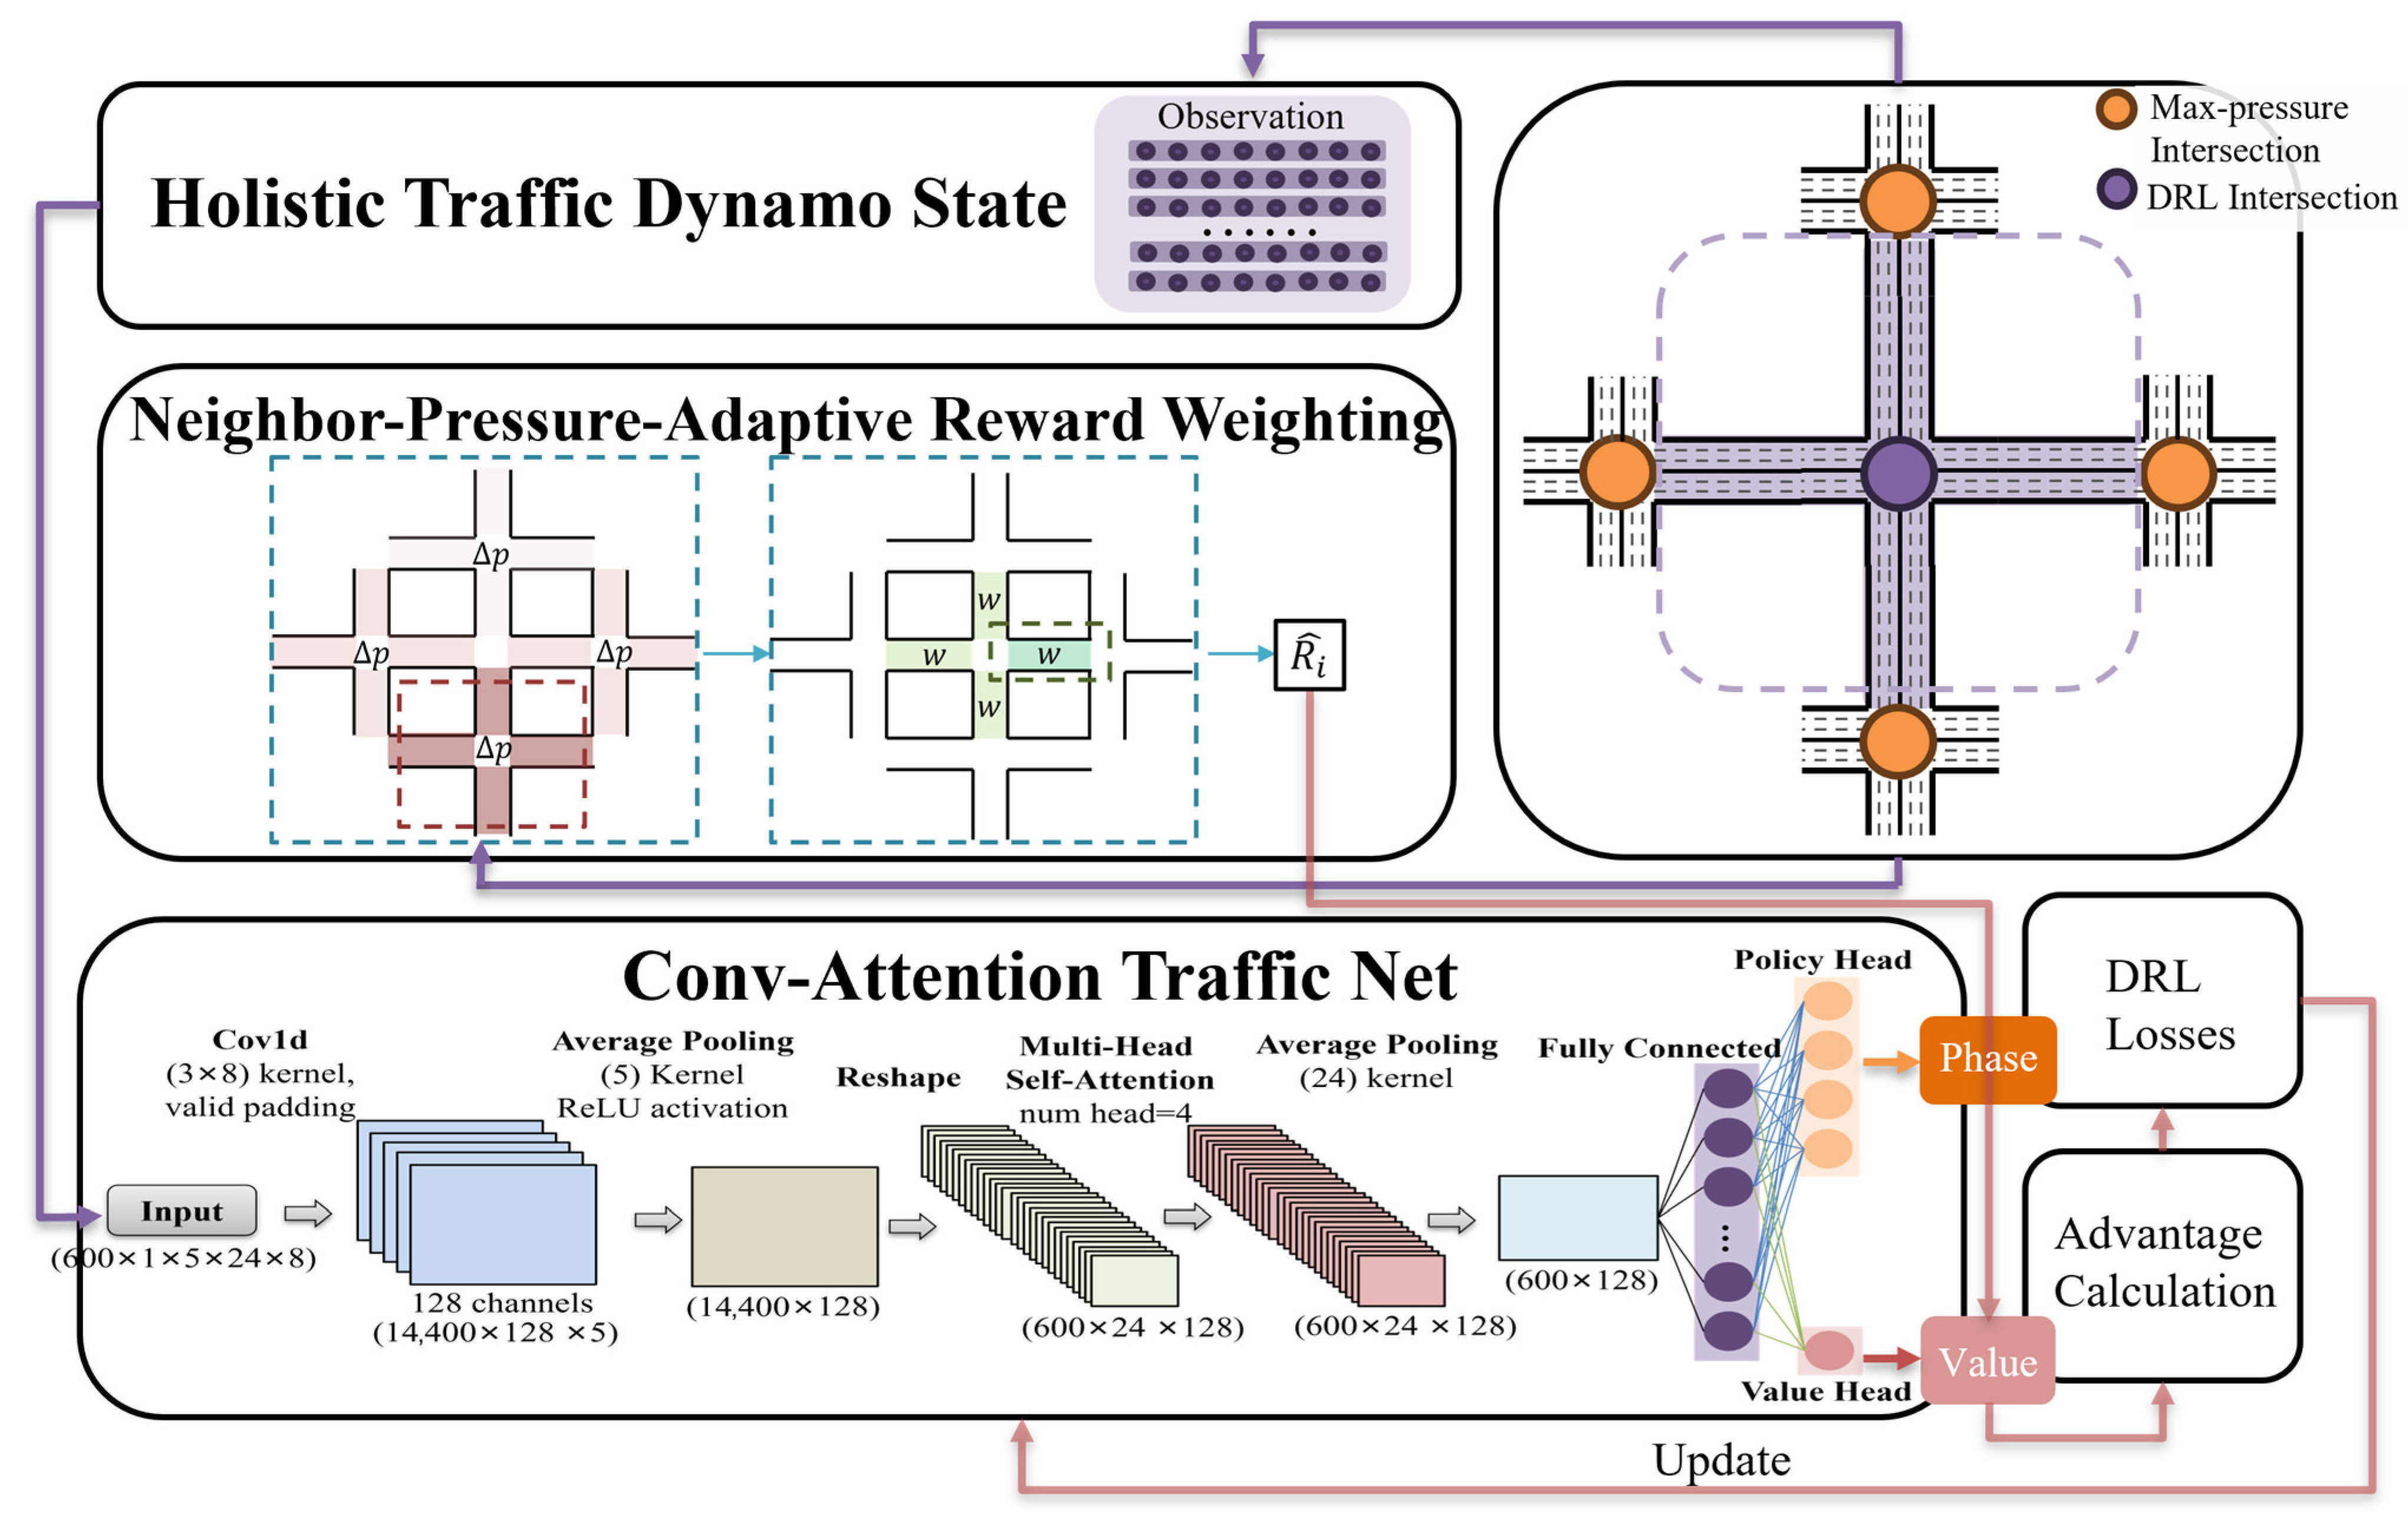
Figure 1. The framework of the spatiotemporal pressure perception agent.
Sustainability 17 07521 g001
Figure 2. Traffic network.
Sustainability 17 07521 g002
Figure 3. The illustration of the proposed state representation HTDS, e.g., the incoming lane s l i n m 5 = [ 3   2   1   2   1   0   0   1 ] in this case.
Sustainability 17 07521 g003
Figure 4. The illustration of the Neighbor–Pressure–Adaptive Reward Weighting mechanism.
Sustainability 17 07521 g004
Figure 5. Structure of CAT-Net.
Sustainability 17 07521 g005
Figure 6. Convergence curve of average travel time.
Sustainability 17 07521 g006
Figure 7. Queue length profiles under three control methods.
Sustainability 17 07521 g007
Figure 8. Intersection pressure profiles under three control methods.
Sustainability 17 07521 g008
Figure 9. Feature importance ranking of cooperative (HTDS-NP-ARW) vs. non-cooperative (HTDS) agent.
Sustainability 17 07521 g009
Figure 10. Example Decision Path 1: Conditional cooperation for east–west straight traffic.
Sustainability 17 07521 g010
Figure 11. Example Decision Path 2: Cooperative yielding for north–south straight traffic.
Sustainability 17 07521 g011
Table 1. Comparative performance evaluation of different control methods.
MetricsFixed-TimeWebsterMax-
Pressure
Efficient-MPLSTM-PPOHTDSHTDS-
NP-ARW
Average Travel Time ( s )405.90215.21147.07148.87151.43142.11140.24
Average Loss Time ( s )312.66122.0453.5455.158.947.7646.77
CO2 Emission ( k g / h )4.765.745.825.505.195.295.26
DRL
Intersection
Queue23.0315.034.794.458.493.463.76
Pressure1.065.992.291.415.250.600.61
Neigh
Intersection
QueueNN14.325.131.571.253.141.351.54
WN14.425.480.911.921.881.300.91
EN14.665.200.821.482.061.071.05
SN14.775.561.911.252.941.491.61
PressureNN16.481.960.671.060.691.130.96
WN18.082.330.330.340.180.820.82
EN18.532.270.330.390.130.600.7
SN16.173.000.551.110.5791.040.84
Average Queue of Neigh14.545.341.301.472.511.301.28
Average Pressure of Neigh17.322.390.470.730.490.900.83
Note. Bold values emphasize optimal performance metrics. Queue length is measured by the number of vehicles, and NN = Northern Neighbor, WN = Western Neighbor, EN = Eastern Neighbor, SN = Southern Neighbor.
Table 2. SHAP values of feature contributions for cooperative (HTDS-NP-ARW) vs. non-cooperative (HTDS) agent.
FeaturesHTDS-NP-ARWHTDS
Collaborative FeaturesNeigh Pressure Diff (NN)0.10690.0887
Neigh Pressure Diff (WN)0.09760.1297
Neigh Pressure Diff (EW)0.11360.0730
Neigh Pressure Diff (SN)0.15160.1441
SHAP Contribution Percentage 19.48%14.39%
Local FeaturesTotal Local Pressure0.13330.2234
Total Local Queue0.22340.2965
SHAP Contribution Percentage13.16%17.41%
Disclaimer/Publisher’s Note: The statements, opinions and data contained in all publications are solely those of the individual author(s) and contributor(s) and not of MDPI and/or the editor(s). MDPI and/or the editor(s) disclaim responsibility for any injury to people or property resulting from any ideas, methods, instructions or products referred to in the content.