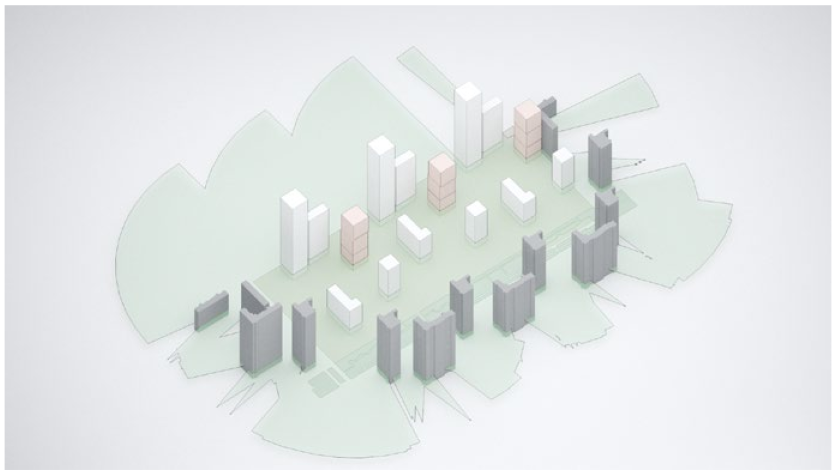
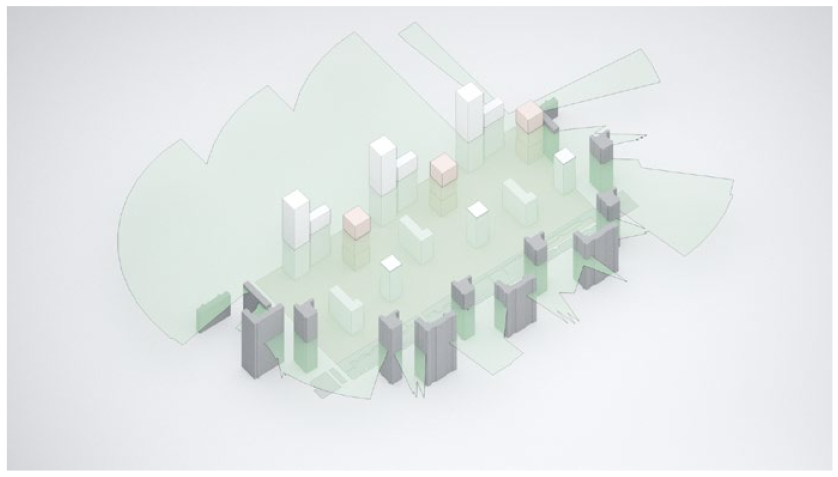
Article

An Integrated Multi-Objective Optimization Framework for Environmental Performance: Sunlight, View, and Privacy in a High-Density Residential Complex in Seoul

Division of Architecture, Dankook University, Yongin 16890, Republic of Korea
*
Author to whom correspondence should be addressed.
Sustainability 2025, 17(16), 7490; https://doi.org/10.3390/su17167490
Submission received: 12 July 2025 / Revised: 10 August 2025 / Accepted: 11 August 2025 / Published: 19 August 2025

Abstract

This study presents a multi-objective optimization framework for enhancing environmental performance in high-density residential complexes, addressing the critical balance between sunlight access, visual openness, and ground-level privacy. Applied to Helio City Phase 3 in Seoul—a challenging case with 2026 units surrounded by adjacent blocks—the research developed a sequential three-stage optimization strategy using computational design tools. The methodology employs Ladybug simulations for solar analysis, Galapagos genetic algorithms for view optimization, and parametric modeling for privacy assessment. Through grid-based layout reconfiguration, tower form modulation, and strategic conversion of vulnerable ground-floor units to public spaces, the optimized design achieved 100% sunlight standard compliance (improving from 64.31%), increased average visual openness to 66.31% (from 39.48%), and eliminated all privacy conflicts while adding 30 residential units. These results demonstrate that computational optimization can significantly surpass conventional planning approaches in addressing complex environmental trade-offs. The framework provides a replicable methodology for performance-driven residential design, offering quantitative tools for achieving regulatory compliance while enhancing residents’ experiential comfort in dense urban environments.

1. Introduction

1.1. Background and Purpose

Amid the rapid urbanization of Seoul, the 1970s saw the emergence of high-density apartment complexes aimed at maximizing land use efficiency and expanding housing supply, driven by a sharp rise in land prices. In particular, the development of large-scale apartment complexes began in earnest with the construction of Gwangmyeong Apartments and the Model Apartment Complex. During this period, low-rise, plate-type apartments of five stories became the dominant housing form. In the 1980s, with continued economic growth and diversification of socio-economic conditions, there arose a demand for improved housing quality and diversity in residential types, leading to large-scale apartment developments in areas such as Jamsil and Gangnam. Subsequently, in the 1990s, the development of new towns on the outskirts of Seoul and in the greater metropolitan area became more active, focusing on increasing the housing supply rate and maximizing floor area ratio. Floor area ratio, defined as the total building floor area divided by the site area, is a key regulatory metric limiting development density in Korean urban planning. As a result, standardized 15-story plate-type apartments were extensively supplied, accelerating the trend toward high-rise, high-density development [1].
Entering the 2000s, qualitative aspects of housing—such as living environment, location, and facility standards—gained prominence. Simultaneously, improvements in urban landscapes, advancements in construction technology, and the sophistication of structural systems contributed to the dominance of high-rise tower-type apartments of over 35 stories as the primary residential form [2]. Meanwhile, as apartment buildings became taller, building spacing regulations were also relaxed. Article 167 of the 1973 Enforcement Decree of the Building Act required a distance between facing buildings equal to the height of the structure in the direction of sunlight-receiving windows. However, in 1992, the regulation was eased to 0.8 times the building’s height, and in 2010, it was further relaxed to at least 0.5 times the height of each building segment. These legal and institutional changes facilitated the adoption of tower-type buildings and accelerated vertical development, further intensifying resident demands for residential amenities such as views, sunlight, and connectivity to community spaces [3].
Under the current Building Act, residential complexes must meet one of two standards for sunlight access, either securing at least two hours of direct sunlight on the winter solstice or ensuring a prescribed setback distance from neighboring property boundaries. However, in practice, residential design and planning often rely on the mechanical and uniform application of setback standards rather than performance-based design through sunlight simulation. This approach exacerbates disparities in sunlight access among buildings and units within a complex and may ultimately reduce the overall residential quality [4].
The building form and spacing between residential blocks not only affect access to sunlight but also critically influence interior openness and the pedestrian experience in outdoor spaces. Plate-type buildings, due to their large frontal facades, often exhibit significant performance differences in sunlight and views depending on their location within the complex. In contrast, tower-type buildings offer advantages in terms of spatial openness and securing view corridors, but the number of units that can simultaneously achieve optimal levels of both sunlight and views is relatively limited [5]. Additionally, lower-floor units are more exposed to pedestrians’ sightlines, which may result in privacy violations and visual discomfort. These issues can significantly reduce residents’ environmental satisfaction [6].
Within the same complex, environmental performance varies significantly among units in terms of sunlight, views, and external spatial experience. These disparities contribute to declining urban housing quality and foster disconnection within residential communities. In response, this study aims to integrate environmental performance evaluation with parametric design methodologies to derive design alternatives that simultaneously consider optimal view conditions and acceptable levels of sunlight exposure, with a focus on tower-type residential buildings. Specifically, this research analyzes strategies to improve views that can be applied to the entire residential complex and evaluates acceptable sunlight access rates. It further proposes design methods that enhance both visual continuity and privacy, particularly for lower-floor units. Through this, the study seeks to contribute to the improvement of environmental performance and residential satisfaction in high-density apartment complexes.
Therefore, this study addresses several critical research questions. First, it explores how multiple environmental performance criteria can be systematically integrated into a unified optimization framework for high-density residential design. Second, it examines the trade-offs between sunlight access, visual openness, and privacy in densely packed residential configurations. Third, it investigates to what extent algorithmic optimization can improve environmental performance while maintaining or exceeding existing development density. The primary objective is to develop and validate a replicable multi-objective optimization framework that can guide performance-based design decisions in high-density residential planning.

1.2. Scope and Method

The study site is Jamsil Helio City, a large-scale apartment complex completed in 2018, which was redeveloped from the Garak Siyoung Apartments originally built in 1986 as low-rise five-story apartment blocks. Helio City comprises residential towers ranging in height from 10 to 35 stories, with a floor area ratio (FAR) of 285.98%. The development includes 84 residential buildings and a total of 9510 units, making it one of the largest reconstruction projects in Seoul.
Unlike other major redevelopment complexes near Seokchon Lake in Jamsil, which typically adopted uniform 35-story residential blocks due to urban planning height restrictions since the mid-2000s, Helio City represents the first case in which the Public Architect System was introduced in a housing reconstruction project. Through collaboration between resident associations, public administrators, and public architects, the project incorporated eco-friendly design considerations that included the creation of green residential parks within the complex and the integration of surrounding landscape and skyline continuity.
Helio City Complex 3 was selected as the case study for three critical reasons. First, it represents a typical high-density reconstruction project common in Seoul’s urban redevelopment. Second, its location at the complex’s northern edge, surrounded by other Complexes, creates the most challenging environmental conditions, making it an ideal test case for optimization. Third, with 2026 units across 18 buildings of varying heights (13–35 floors), it provides sufficient complexity and diversity for comprehensive performance evaluation.
This study aims to comprehensively evaluate actual environmental performance at Helio City—including solar access, view quality, and pedestrian-level experience—and to develop design alternatives that maximize environmental performance while maintaining the existing development density. To achieve this, the research employs Ladybug and Galapagos simulation tools, along with custom-developed Grasshopper scripts, to perform parametric optimization based on multiple performance indicators.
The research methodology consists of five key steps. First, a review of existing literature was conducted to analyze prior studies that integrated multiple indicators such as sunlight, view, and pedestrian environment, and to validate the selection of simulation tools. Second, based on solar radiation data for Seoul from 2009 to 2023, the solar performance of Helio City was analyzed, and a residential block layout model was developed to maximize sunlight satisfaction rates. Third, to improve view quality, the View Obstruction Ratio (VOR) of each residential tower was calculated, and optimal building forms were determined accordingly. Fourth, to enhance pedestrian-oriented outdoor spaces, a new circulation strategy and visibility analysis were performed, which informed the design refinement of lower-level building forms to ensure both sunlight access and privacy protection at the pedestrian level. Fifth, the three key environmental performance indicators—sunlight, view, and privacy—were integrated to propose a balanced, optimized design model at the scale of the entire residential complex.
The remainder of this paper is organized as follows: Section 2 reviews relevant literature and analyzes the case study site characteristics. Section 3 presents the multi-objective optimization methodology. Section 4 discusses the results and comparative analysis. Section 5 concludes with key findings and broader implications, while Section 6 addresses limitations and future research directions.

2. Prior Research and Urban Architectural Characteristics of the Study Site

2.1. Implications from Previous Studies

In recent years, multi-objective optimization (MOO) techniques at the early design stage have emerged as a critical tool for ensuring building performance in the fields of architecture and urban planning. By simultaneously considering various performance indicators, MOO allows for the development of design strategies that balance efficiency and environmental comfort from the initial stages of design.
Optimization studies for high-rise residential buildings often focus on individual performance aspects in isolation. Consequently, integrated approaches that address multiple objectives simultaneously remain relatively rare. In an effort to overcome this limitation, a growing body of research has begun to incorporate a broader set of performance parameters into comprehensive evaluation frameworks.
For example, ShanShan Wang et al. (2021) [7] examined the trade-offs between sunlight access, view quality, and thermal environment in high-rise residential complexes in China. They emphasized the need for adaptable design strategies that allow designers to prioritize different performance metrics based on project-specific goals. Similarly, Bing Xia et al. (2021) [8] investigated the impact of urban block forms on environmental performance and demonstrated, through empirical analysis, that modular residential block systems can achieve a balanced performance across multiple indicators, including solar exposure and thermal comfort. These studies highlight the potential of multi-objective optimization techniques to coordinate complex and competing design variables.
Meanwhile, increased attention to the environmental quality of lower-level spaces within residential complexes has prompted growing interest in issues such as privacy and pedestrian experience. Mok Eui-Gyun et al. (2016) [6], based on surveys of residents living on lower floors, proposed the need for differentiated design strategies for these spaces and highlighted their potential application. In addition, Park Chan-Gyu (1994) [9] analyzed the relationship between residential floor level and occupant satisfaction, arguing that the psychological and environmental advantages of lower-level units should also be considered in residential planning. A summary of these prior studies, organized by topic, is presented in Table 1.
Nevertheless, existing research tends to be skewed toward either indoor environmental conditions—such as daylighting, views, thermal comfort, and noise—or external pedestrian environments, including visual obstruction, privacy, and street-level activation. Integrated approaches that consider both aspects in tandem remain limited. Therefore, this study proposes a parametric optimization-based design methodology that addresses both indoor and outdoor environmental qualities in a unified manner, with particular focus on resolving the trade-offs among three critical performance indicators: sunlight access, view quality, and privacy.

2.2. Urban Planning Concepts and Characteristics of the Study Site

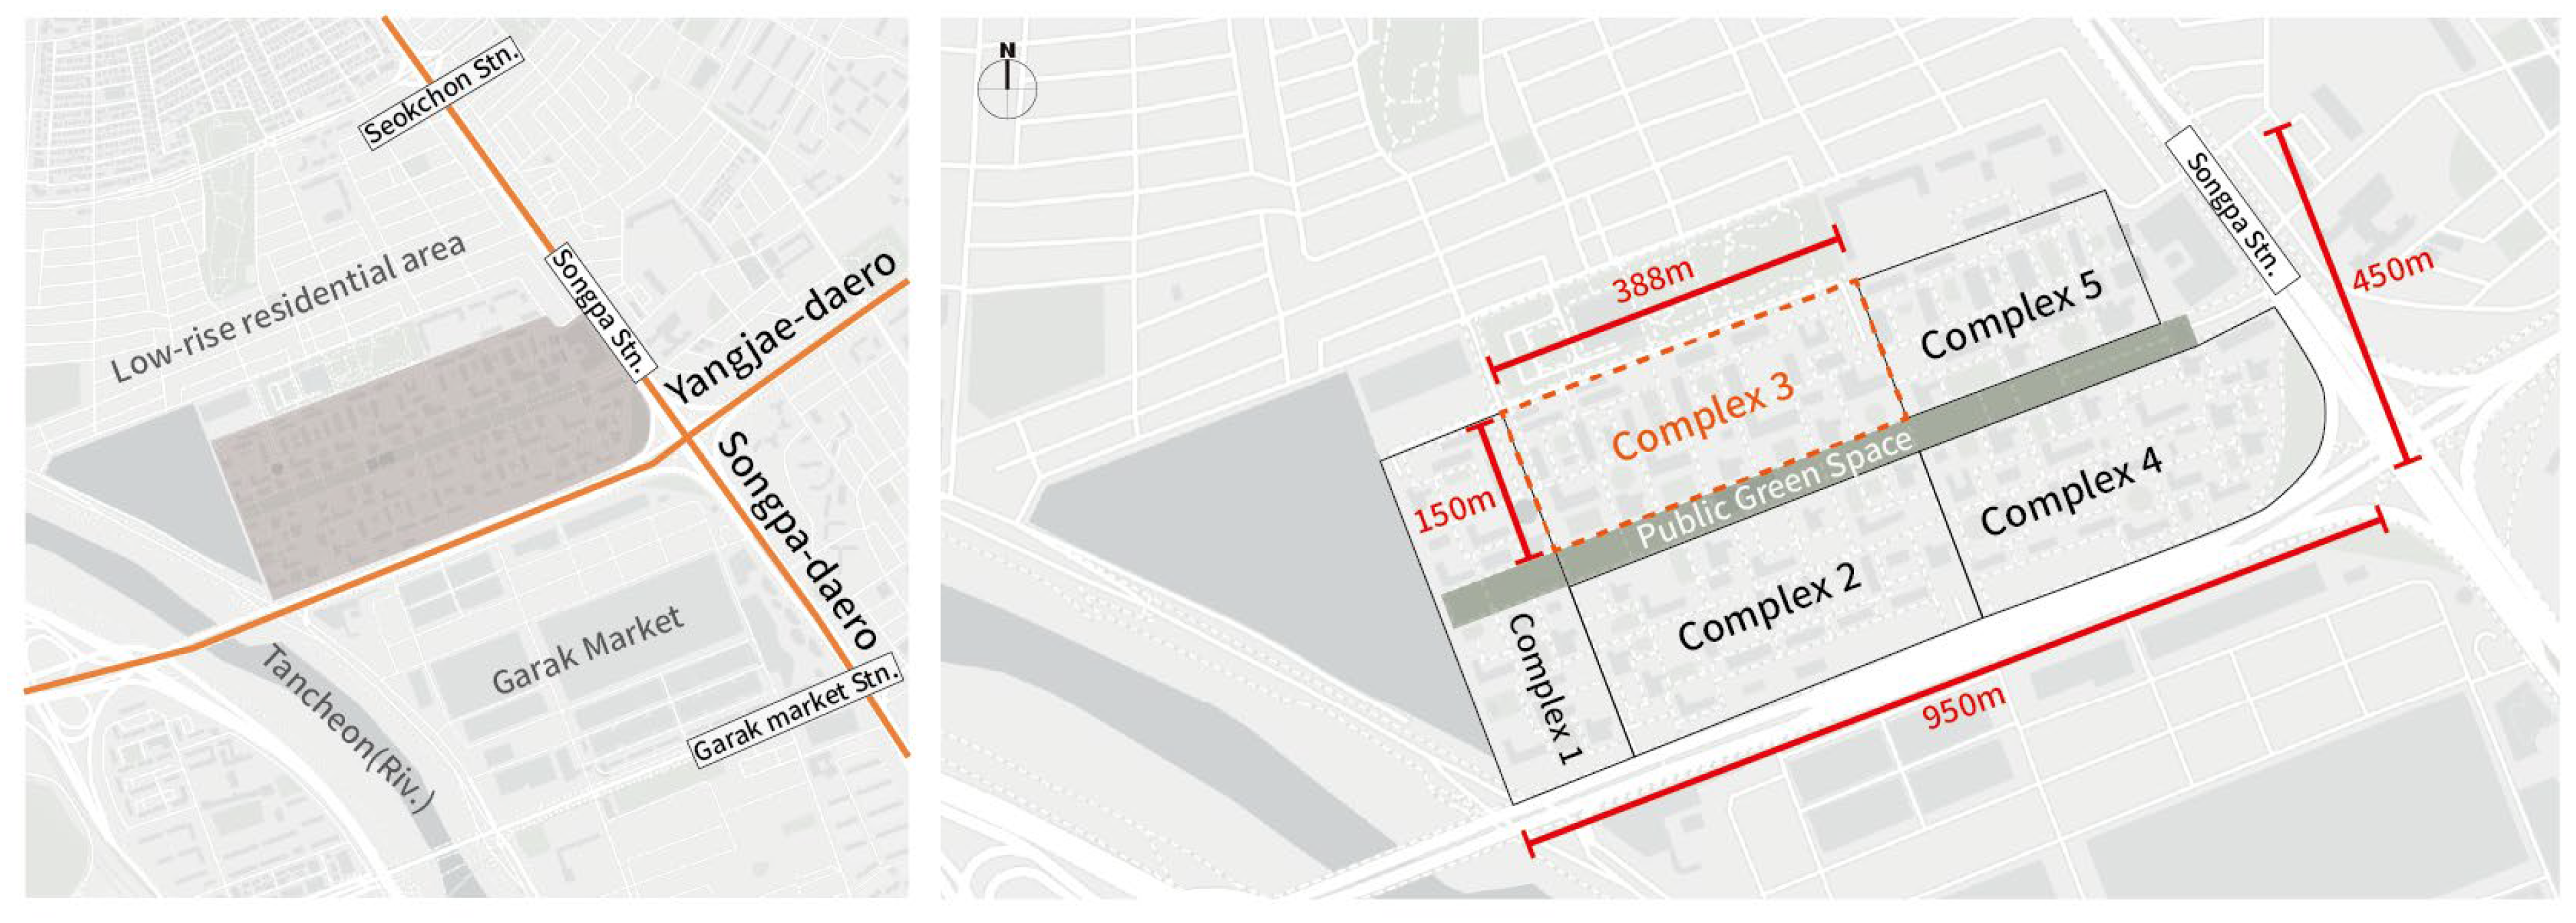
The study site, Helio City, is located on the periphery of the Jamsil area in Songpa-gu, Seoul (Figure 1). Jamsil was developed according to the “Jamsil District Comprehensive Development Master Plan” established in 1974, which introduced a radial road system. This structure emphasizes spatial unity by connecting the urban core with its periphery through a series of linear corridors [10]. The site is bordered by low-rise residential areas to the north, Garak Market and Yangjae-daero to the south, Songpa-daero to the east, and the Tancheon Stream to the west—resulting in excellent access to both transportation infrastructure and natural surroundings. In addition, the site is within walking distance of Songpa Station on Seoul Subway Line 8, and is also close to Seokchon Station on Line 9 and Garak Market Station on Line 8, making it one of the most well-connected locations within Songpa-gu (Figure 2).
Helio City covers a total site area of 346,570.50 m2 and is composed of five sub-complexes, forming a super-large-scale residential development. A linear park approximately 1 km in length runs through the center of the site, and surface parking areas have been minimized to maximize green space. The internal green area alone amounts to approximately 127,000 m2. The residential towers were planned at varying heights to simultaneously ensure solar access and preserve view corridors, reflecting design characteristics that respond to both environmental and spatial considerations.
Although Helio City was designed with attention to solar access and view quality, environmental performance varies between sub-complexes and among individual buildings. In particular, Sub-Complex 3, located at the northern edge of the site, is surrounded by Sub-Complexes 1, 2, and 5. As a result, its outward views are limited, and it is more susceptible to zones of permanent shadow caused by adjacent towers. Furthermore, while Sub-Complexes 1, 2, and 4 face an eight-lane road approximately 35 m wide, Sub-Complex 3 is adjacent only to a two-lane road, placing it at a relative disadvantage in securing both sunlight and views. Therefore, this study selects Sub-Complex 3 as the primary subject of analysis—given its vulnerability in terms of solar and view performance—with the goal of deriving design alternatives that optimize environmental performance within the constraints of the existing urban context.

2.3. Building Typologies, Configurations, and Development Density

Helio City has a building coverage ratio (BCR) of 19.42% and a floor area ratio (FAR) of 285.98%, meeting the legal maximum FAR limit of 300%. The residential complex consists of 84 buildings, which can be broadly categorized into three typologies: hybrid, tower, and slab-type blocks. These buildings vary in height from 10 to 35 stories, accommodating a diverse range of forms. An overview of the entire Helio City complex and Sub-Complex 3 is provided in Table 2, while Figure 3 illustrates the layout and typology distribution of residential buildings within Sub-Complex 3.
Sub-Complex 3 consists of a total of 18 residential buildings, including 4 hybrid types, 4 tower types, and 10 slab types. These buildings range in height from 13 to 35 stories, and the total number of residential units is 2026, accounting for approximately 21% of the entire Helio City development. A total of 23 unit floor plan types have been applied within Sub-Complex 3, allowing for a wide variety of unit sizes, from small to large, to accommodate diverse household compositions.
Most of the residential towers are designed with a centrally located core, shared by 2 to 4 units per floor. Some lower-floor sections utilize a piloti structure—open ground-level spaces without residential units—to improve solar access and circulation efficiency. The continuous solar access rate across Sub-Complex 3 is 64.31%, while the building coverage ratio is 17.09% and the floor area ratio is 255.55%, indicating a slightly lower development density compared to the overall average of Helio City.

2.4. Criteria for Ensuring Sunlight Access, View Quality, and Lower-Level Privacy

2.4.1. Sunlight Access Standards for Multi-Family Housing

Seoul, South Korea, is located at 37°34′ N latitude, 126°57′ E longitude, with an elevation of approximately 87 m above sea level, and falls within the humid continental climate zone. Winters are cold and dry, while summers are hot and marked by strong seasonal variation. The annual average temperature is approximately 12.5 °C, with the lowest monthly average of −2.4 °C occurring in January and the highest of 25.7 °C in August. Notably, winter solar radiation levels are relatively high. In fact, west-facing buildings often receive higher annual solar radiation compared to south-facing ones. As a result, excessive solar gain can become problematic for west-oriented residential spaces, and several studies have recommended orienting living rooms closer to the south to improve sunlight access in residential buildings [11].
Under current regulations stipulated in Article 53 of the Building Act [Building Act, 2024] [12] and Article 86 of its Enforcement Decree [Enforcement Decree of Building Act, 2024] [13], design standards for sunlight access in multi-family housing allow compliance through one of two conditions: A building must maintain a setback from the adjacent site boundary equal to at least half the height of each building segment (applicable for buildings exceeding 8 m in height); or Each unit must receive at least 2 h of continuous sunlight between 9:00 a.m. and 3:00 p.m. on the winter solstice. Additionally, domestic court rulings often refer to a benchmark of 4 cumulative hours of sunlight between 8:00 a.m. and 4:00 p.m. on the winter solstice as a standard for protecting sunlight access rights. The Green Building Certification System also evaluates residential units based on whether they receive 4 cumulative hours of solar exposure per unit [14].
In general, to ensure sunlight access, buildings should be spaced sufficiently apart so that front-facing structures do not block sunlight from reaching rear-facing ones [11]. Under current regulations, if the 2-h continuous sunlight requirement is met, there is no additional mandate for inter-building distances. However, in practice, most multi-family housing developments adhere to the minimum legal separation distances, leading to standardized and often inadequate layouts. Such regulations make it difficult to provide equitable sunlight access to all residential units. Therefore, this study aims to develop a building layout strategy in which every unit’s living room receives at least 2 continuous hours of sunlight on the winter solstice, ensuring performance-based compliance across the entire complex.

2.4.2. Standards for Securing View Quality

According to previous studies, a survey conducted among residents and real estate agents across five multi-family housing complexes in Busan Metropolitan City revealed that view quality (32%) and sunlight access (25%) ranked as the top two factors influencing housing purchases [15]. In addition, the Korea Housing Industry Research Institute identified “comfort” as the most important residential selection factor in its report Future Residential Trends. This suggests that the comfort of the external environment, particularly in terms of sunlight and view access, plays a critical role in residential decision-making alongside indoor conditions.
Despite the growing importance of view and sunlight access in multi-family housing, quantitative analyses of view conditions are often insufficiently addressed during actual design and planning stages [16]. To address this gap, the present study establishes quantitative analysis criteria for view environments, focusing on visual openness ratio as a key metric. The view evaluation framework is structured as follows: Selection of view points, Classification of target views (e.g., natural landscapes) and view obstructions (e.g., adjacent buildings), Definition and calculation of the visual openness ratio.
The analysis differentiates view conditions across three vertical categories—lower, middle, and upper floors—to allow for vertical comparison and to propose optimized designs that minimize view obstruction.
The viewpoint is set in the living room, as it is the most actively used space in the apartment. The horizontal field of view was set to 180 degrees in consideration of the view toward the external landscape. Positive view elements include natural features such as the sky, mountains, rivers, streams, oceans, and lakes. Biologically, humans tend to prefer natural scenery. Conversely, adjacent buildings are considered obstructive elements in the view field. The visual intrusion zone is limited to a radius of 450 m from the viewpoint, based on visual perception theory that defines the middle-depth visual recognition range for humans to be approximately 450 m [17] (Table 3).
Key indicators used to evaluate the visual openness of the residential environment include the facade openness ratio, facade obstruction index, facade building coverage ratio, and view obstruction ratio. These indicators show significant correlations with various site planning factors such as building coverage ratio (BCR), floor area ratio (FAR), road coverage ratio, and green space ratio (Table 4). In particular, the facade obstruction index and facade building coverage ratio can serve as more strongly view-related quantitative evaluation tools compared to other indicators [18].
In this study, the visual openness ratio was calculated based on the three-dimensional facade obstruction assessment method proposed by An et al. (2024) [19]. This method is defined by the following formula:
Facade Occlusion Rate = (Obstructed Area by Apartment Buildings) ÷ (Total Obstruction Area) × 100
However, previous studies have not presented absolute numerical criteria for acceptable facade occlusion levels. Instead, evaluations were made through relative comparisons among housing types—linear, tower, and hybrid—using statistical indicators such as average facade occlusion, maximum and minimum values, and the gap between them. These indicators were then used to qualitatively grade the view conditions. Accordingly, this study also evaluates the before-and-after changes in visual openness through the same indicators to assess the significance of optimization.
Nevertheless, the facade occlusion method in previous research quantifies visual privacy from the perspective of external observers, measuring the degree of facade exposure from outside. Applying this directly to the current study is inappropriate, as it reflects only external views and fails to capture the inner visual experience of residents. Moreover, given the large number of living rooms, applying high-precision 3D analysis to each would be computationally excessive and inefficient, especially considering that rooms in similar positions would yield little meaningful difference. Therefore, this study follows the conceptual framework of facade occlusion analysis but introduces two key improvements: representative sampling by floor and discrete reconstruction of facade occlusion patterns (Table 5). These allow for the redefinition of a visual openness assessment method based on the internal view of residents within the apartment complex.
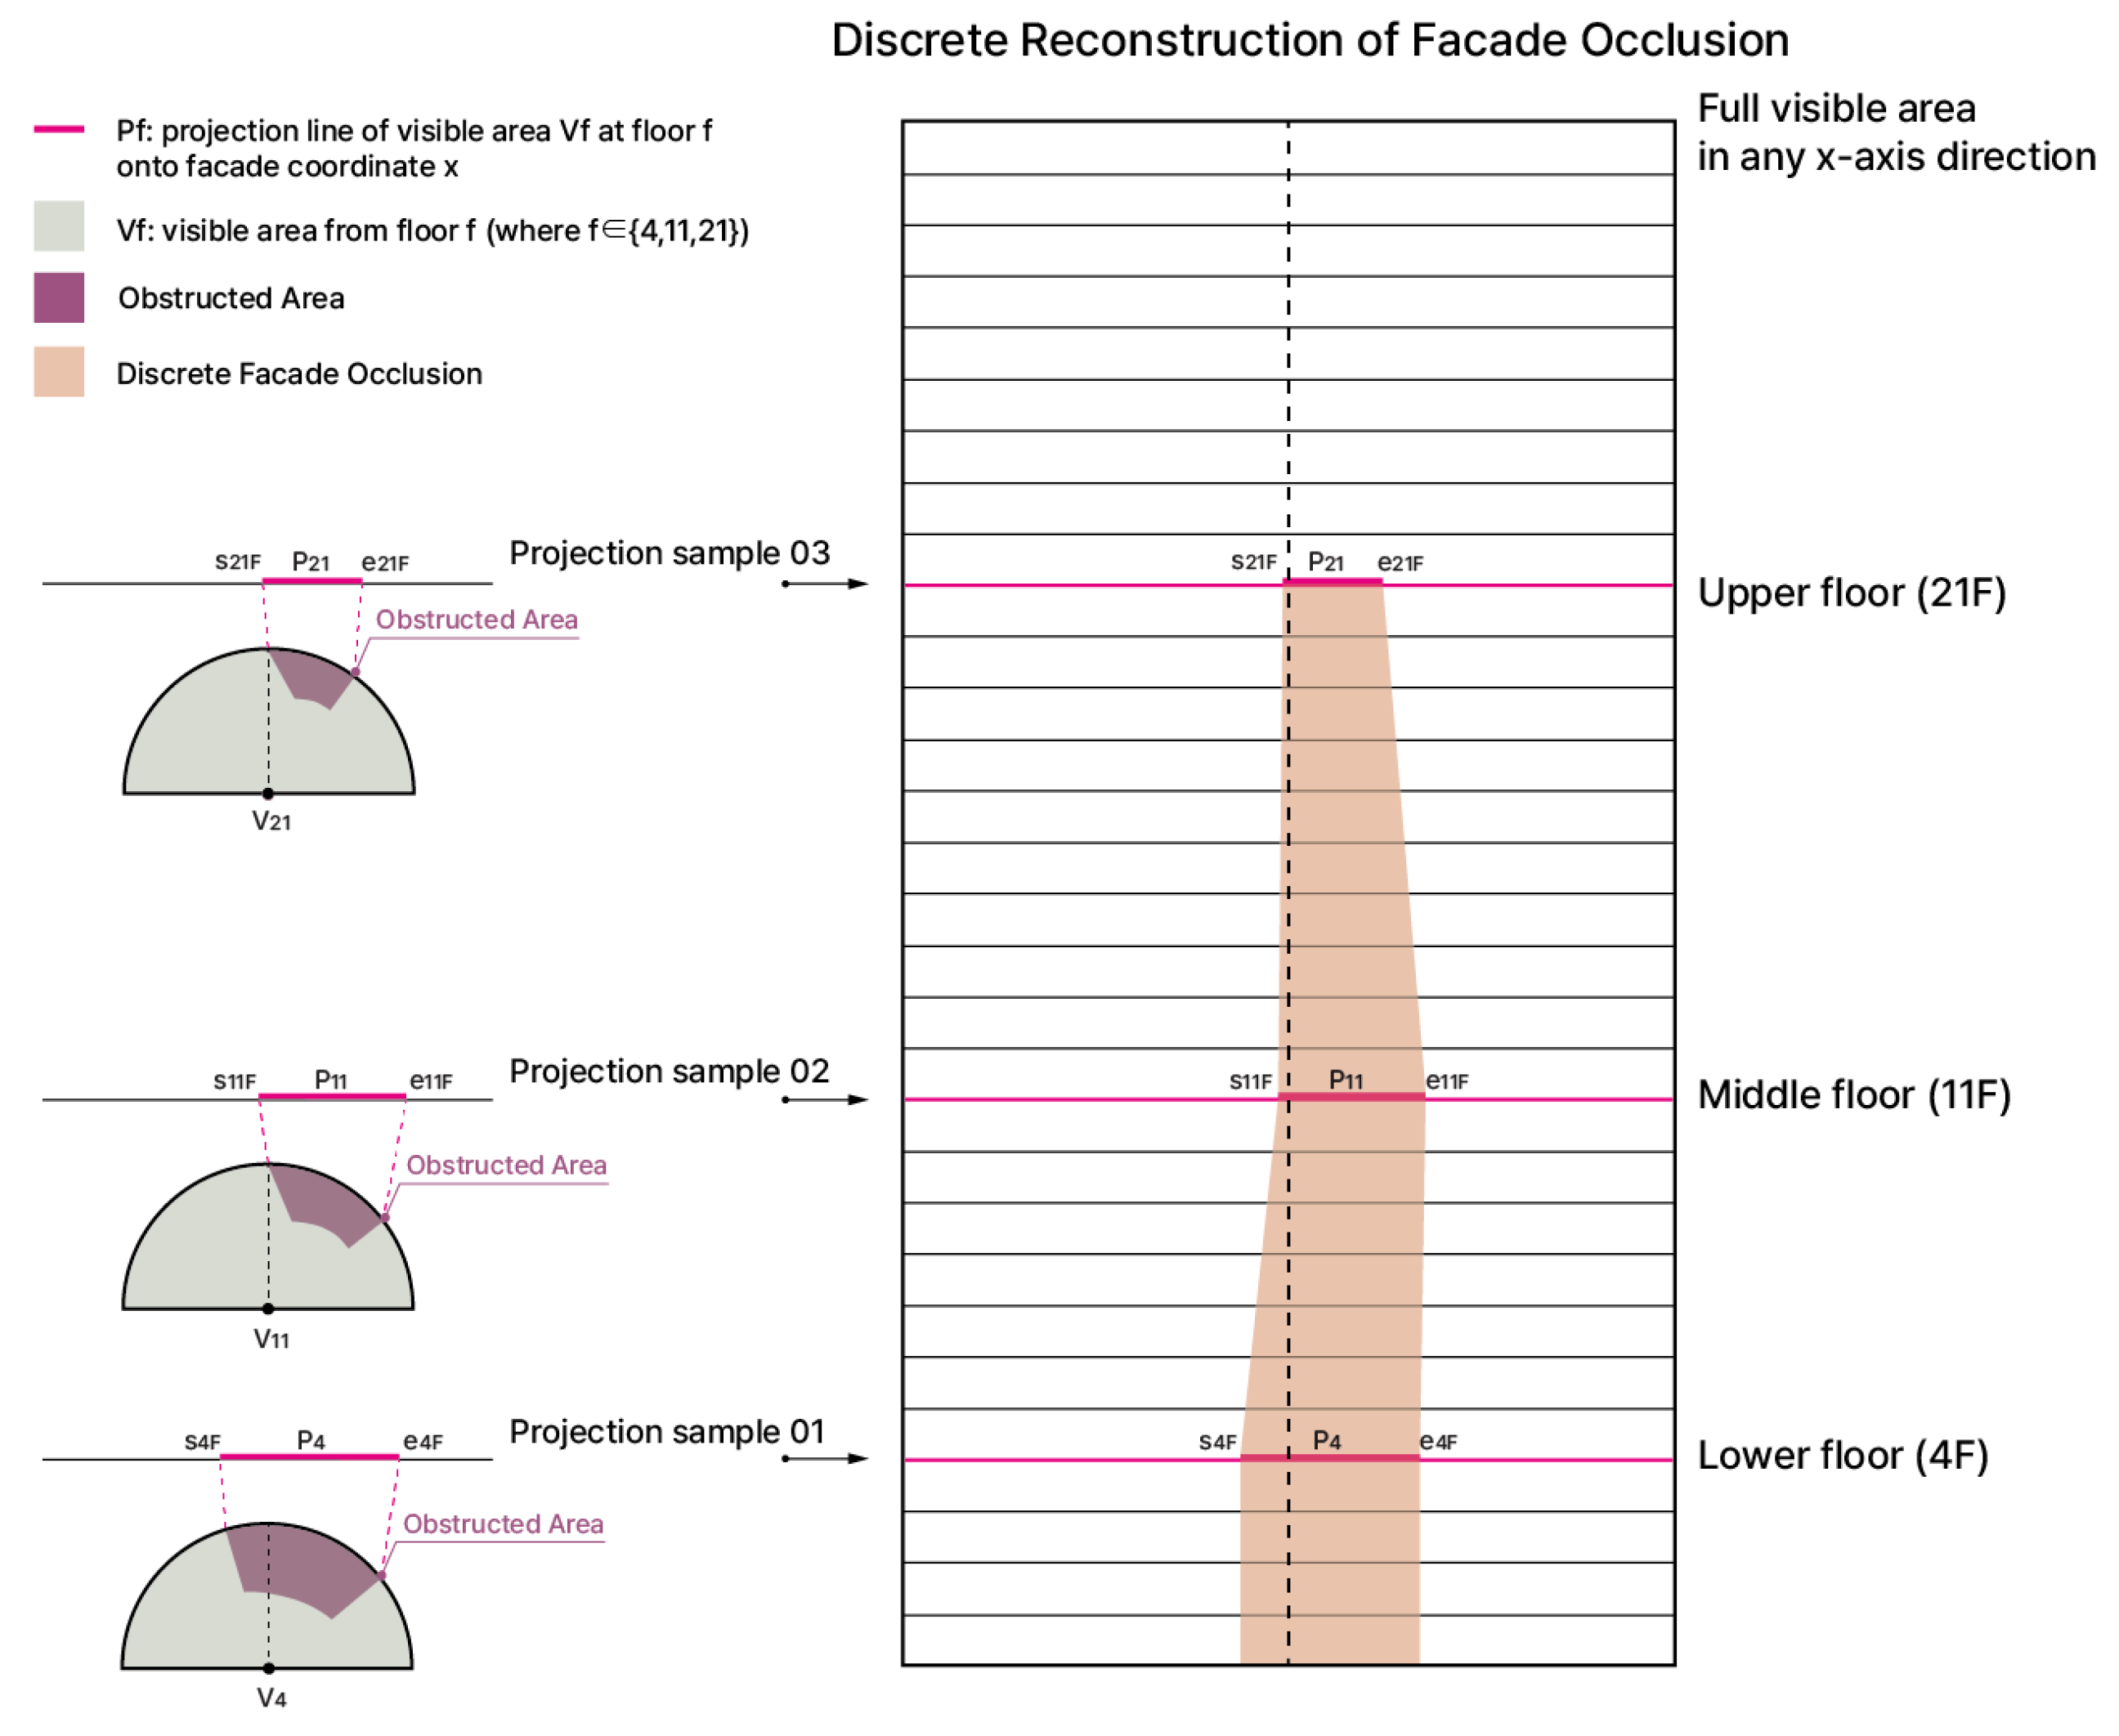
The visual environment is estimated through a sampling process based on floor levels (Figure 4). Floors are selected to ensure meaningful vertical variation among living rooms and to represent the lower, middle, and upper zones of the residential buildings. Accordingly, the 4th, 11th, and 21st floors are selected as representative samples. In particular, the 4th floor is chosen as the low-floor sample instead of the 1st to reduce the interference caused by visual interaction with external pedestrians. Living rooms located in the same vertical column (4F, 11F, 21F) are defined as unit directional samplers, which serve as proxies for the visual characteristics of the entire building facade.
For each sampled living room, a 2D isovist projection is generated in top view, assuming a horizontal viewing angle of 180 degrees. Within this field of view, the actual obstructed areas are excluded, and the remaining visible area is calculated. The visual openness ratio (VOR) of each room is then defined as the ratio of unobstructed area to the full semicircular viewing area. The VOR values from all sample rooms are aggregated and averaged to represent the overall visual environment of the complex.
To reconstruct a discrete facade occlusion pattern, the visibility results from each sampled floor are orthogonally projected onto a vertical axis, creating linear representations of occlusion locations (Figure 5). These correspond to the facade obstructions identified in traditional facade occlusion analysis. The linear projections from the three floor-level samplers in each residential building are visualized and connected to reconstruct the vertical distribution of visual occlusion. Through this method, the original facade occlusion diagram is indirectly reproduced in a simplified and computationally efficient way.
The improved VOR evaluation method enables quantitative assessment of the visual experience from the resident’s perspective (Table 6). By using meaningful representative samples, the method reduces computational complexity while still covering a large number of living rooms. Furthermore, based on the representative floors, future strategies for floor-specific optimization can be systematically developed. Lastly, the reconstructed facade occlusion patterns allow for direct comparisons with existing studies, enabling a consistent and interpretable evaluation of visual openness across different housing complex types.

2.4.3. Standards for Ensuring Privacy on Lower Floors

According to a residential environment survey conducted on 109 households within 17 residential buildings (each 12 to 15 stories high) in an apartment complex in Seoul, 70.3% of lower-floor residents expressed dissatisfaction with sunlight conditions, while 60.5% of upper-floor residents reported satisfaction. In terms of privacy, 81.3% of lower-floor residents reported discomfort, compared to only 46.6% of upper-floor residents. On the other hand, for other environmental factors such as noise and daylighting (in general), there was no significant difference in response ratios between the two groups [20].
These findings indicate that negative perceptions of the lower-floor residential environment are largely due to physical factors such as insufficient sunlight and lack of privacy. While many previous studies have proposed design-based differentiation strategies for first-floor units to address lower-floor issues, such approaches often fail to consider second and third floors, which are also adjacent to outdoor pedestrian spaces and thus similarly affected. Therefore, this study aims to identify and define the scope of lower-floor units that fail to meet daylighting standards, and propose design improvements by comprehensively addressing the physical conditions that lead to privacy violations.
The privacy evaluation criteria for assessing low-floor pedestrian environments are structured through the following procedure. In this study, privacy is defined as the degree of visual intrusion caused by the gaze of outsiders or residents of adjacent buildings directed at a specific building opening. Accordingly, the target of privacy evaluation is the openings located on the lower floors of residential buildings, while the observers are pedestrians within the surrounding public spaces.
The pedestrians’ viewpoints were established based on key intersections of pedestrian pathways within the apartment complex. These intersections are critical locations where visual contact with residential units occurs, as they represent the main nodes of pedestrian movement and observation within the complex. In this context, a typical scenario is constructed in which a pedestrian walks from one intersection to another while facing the lower-floor living room windows of a residential block, allowing for a realistic assessment of the visual privacy conditions on the lower levels.
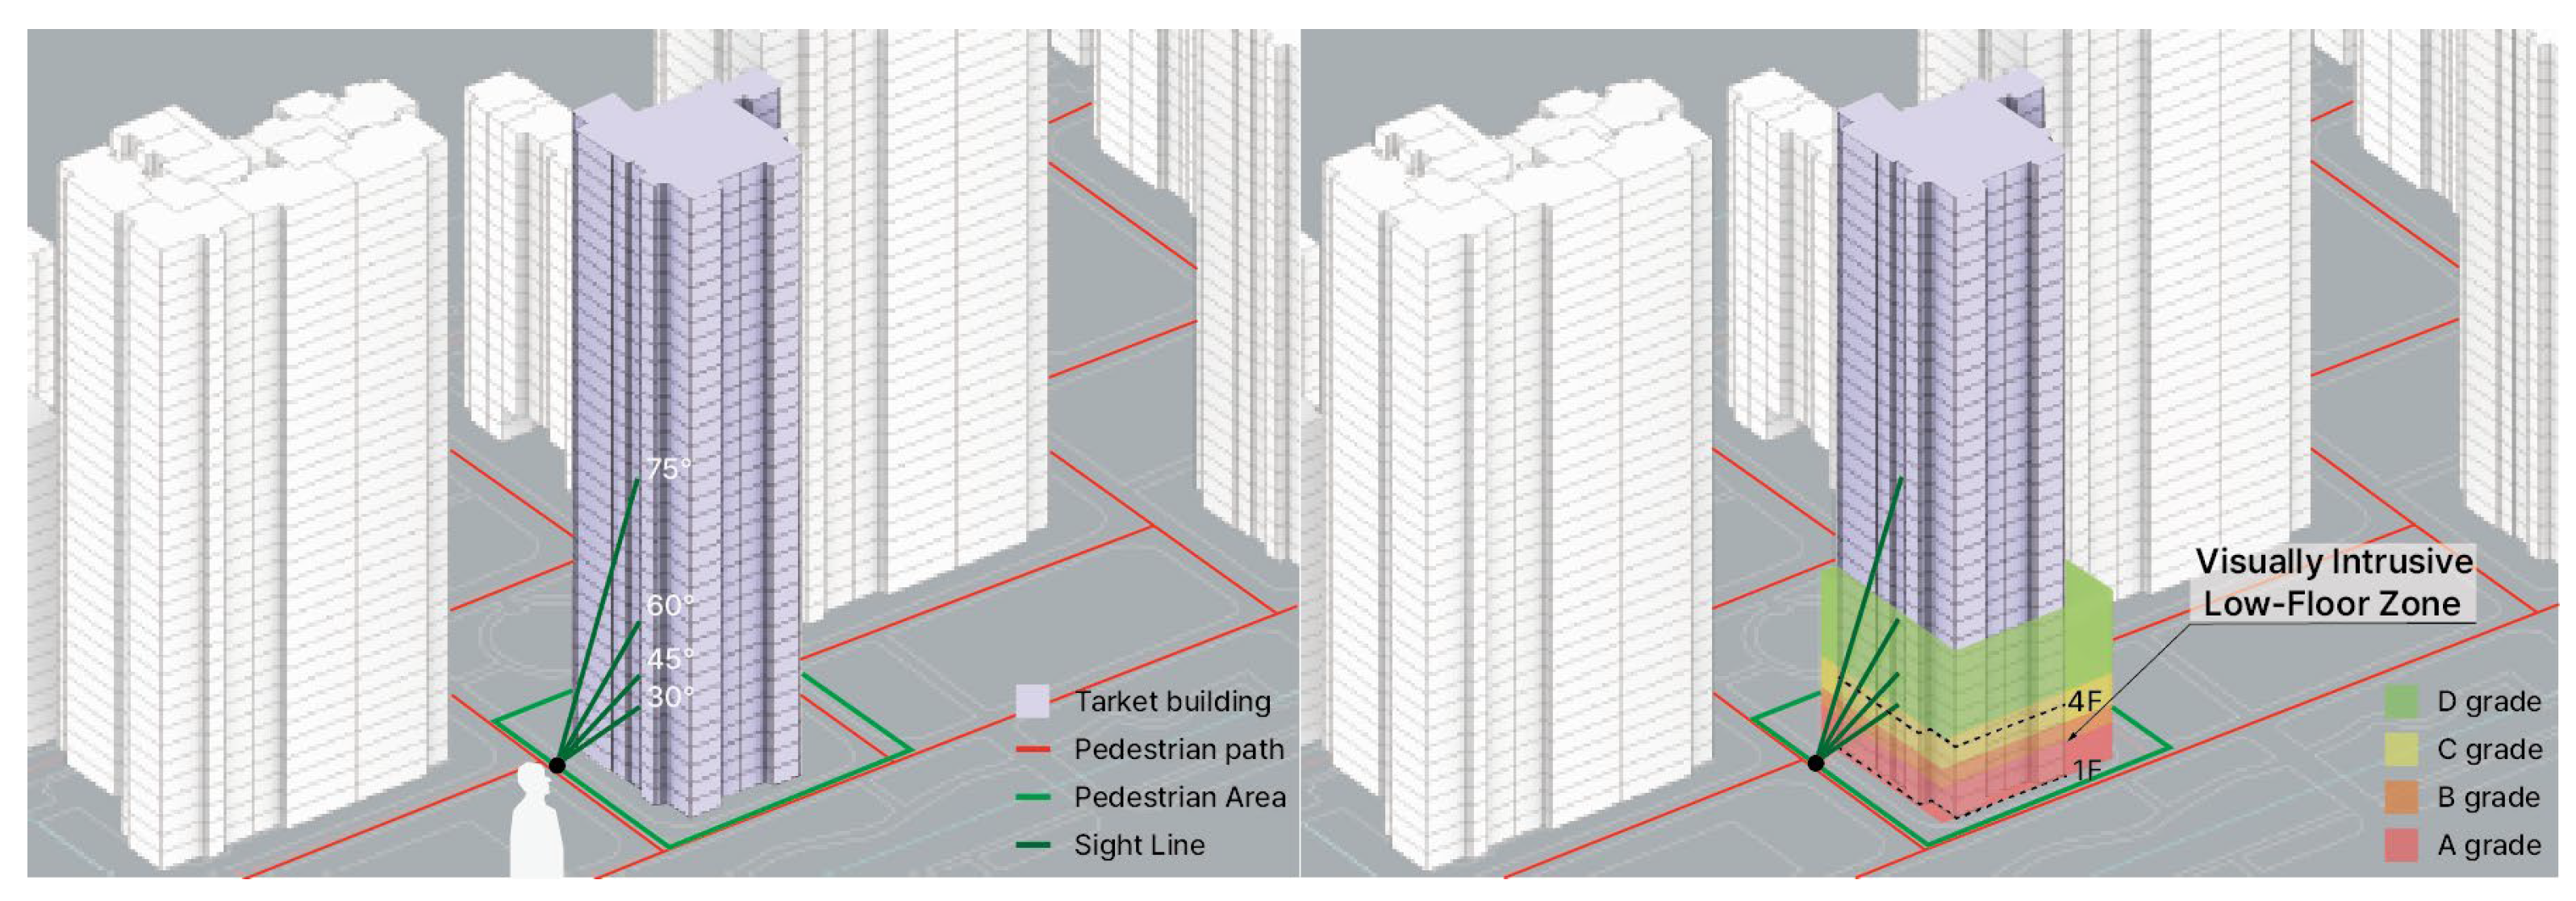
The horizontal viewing angle of the pedestrian was set at 120 degrees, reflecting the general range of human peripheral vision. For the vertical viewing angle, this study refers to the vertical view classification scale presented by Shin et al. (2004) [20]. As shown in Table 7, this scale categorizes visual accessibility into five grades based on upward viewing angles from pedestrian eye level (1.5 m). Grades A to C, corresponding to vertical sight angles between 30 and 60 degrees, were adopted for this study as they reflect the typical range of a pedestrian’s upward gaze. Within this range, lower angles (closer to Grade A) represent more intrusive viewing conditions for privacy, while higher angles (approaching Grade C and beyond) indicate reduced visual intrusion.
Meanwhile, the study by Zheng et al. (2021) [21], which proposed a quantitative visual privacy indicator known as the Potential Visual Exposure Index (PVEI), clearly identified the 1st to 3rd floors as a visually vulnerable zone. In particular, the floor-by-floor PVEI graph indicates that visual intrusion from the pedestrian perspective (PVEI_Ground) decreases rapidly as the floor level increases. Assuming the 1st floor has a relative PVEI of 100%, the value drops to approximately 85% on the 2nd floor and about 72% on the 3rd floor, followed by a sharp decline to approximately 55% on the 4th floor. These findings clearly demonstrate that floors 1 through 3 are significantly more susceptible to visual intrusion from ground-level pedestrians (Table 8). In addition, the PVEI values drop below 50% from the 5th floor and above, indicating the onset of a stable visual privacy zone.
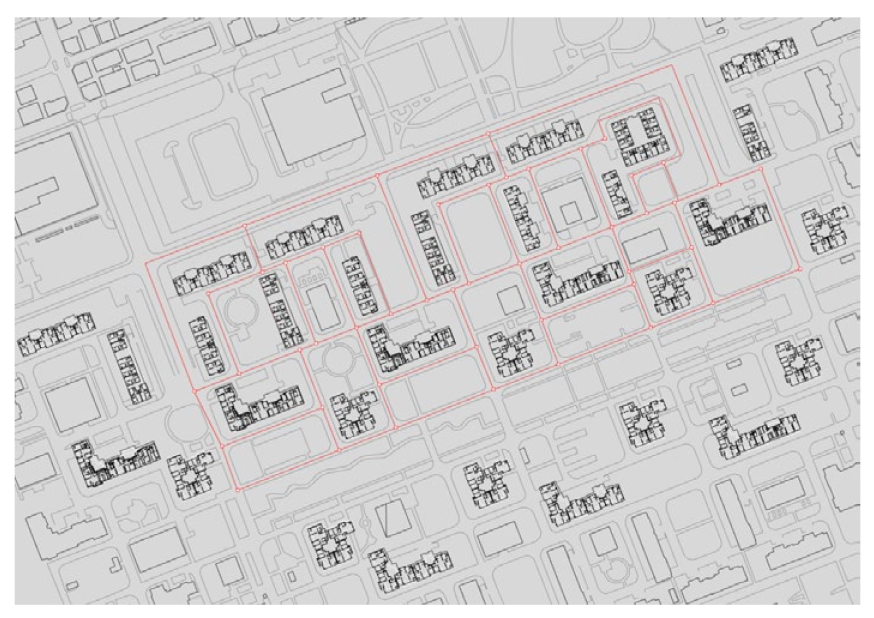
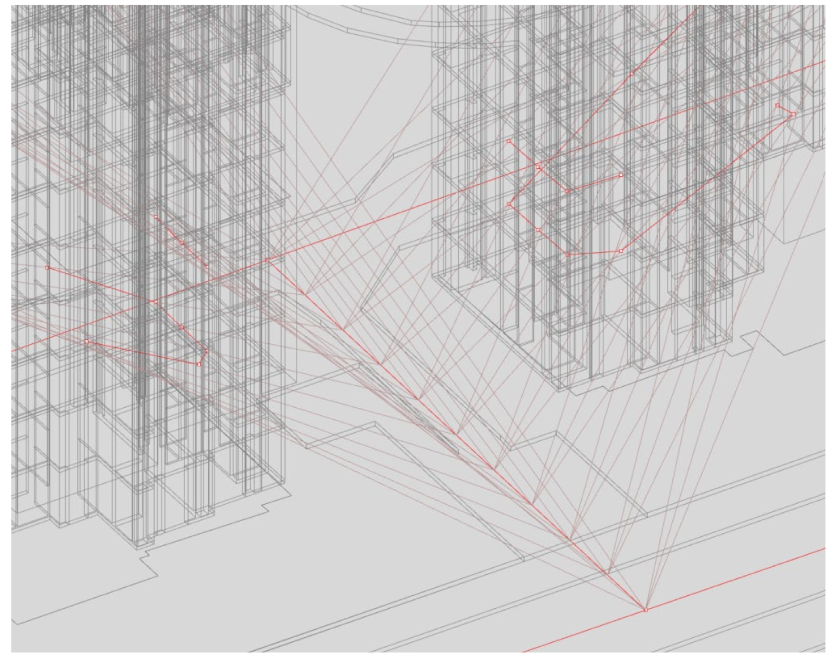
Based on this observation, the present study defines floors 1 through 4—excluding the stabilized upper levels—as the privacy-vulnerable zone. Following the predefined observation scenario, the analysis aims to determine whether the observer’s vertical viewing angle intersects this vulnerable zone during movement. Specifically, as pedestrians travel between two intersections, they project their line of sight at vertical angles ranging from 0° to 60° toward the lower floors of a residential building. If this A–C grade vertical view angle range intersects with any openings within the 1st to 4th floors, the corresponding segment of the pedestrian path is classified as a privacy-vulnerable zone (Figure 6).
To quantitatively represent pedestrian movement, the segment between two intersections was evenly divided into 10 intervals, assuming uniform walking speed and 10 observation frames. The observer’s position was sequentially assigned to each of these division points and used as a viewpoint to simulate movement step by step (Figure 7). From each viewpoint, the vertical viewing angle and intersection points with building surfaces were mapped toward the low-floor space (defined as the 1st to 3rd floors) of adjacent residential buildings.
Through this method, specific points of visual intrusion caused by the pedestrian’s continuous movement were identified. The detailed procedure is summarized in Table 9. This analysis serves as a foundational reference for developing design guidelines aimed at improving low-floor residential privacy and planning adjacent open spaces in high-density urban environments.

2.5. Site Analysis

2.5.1. Sunlight Analysis of the Study Site

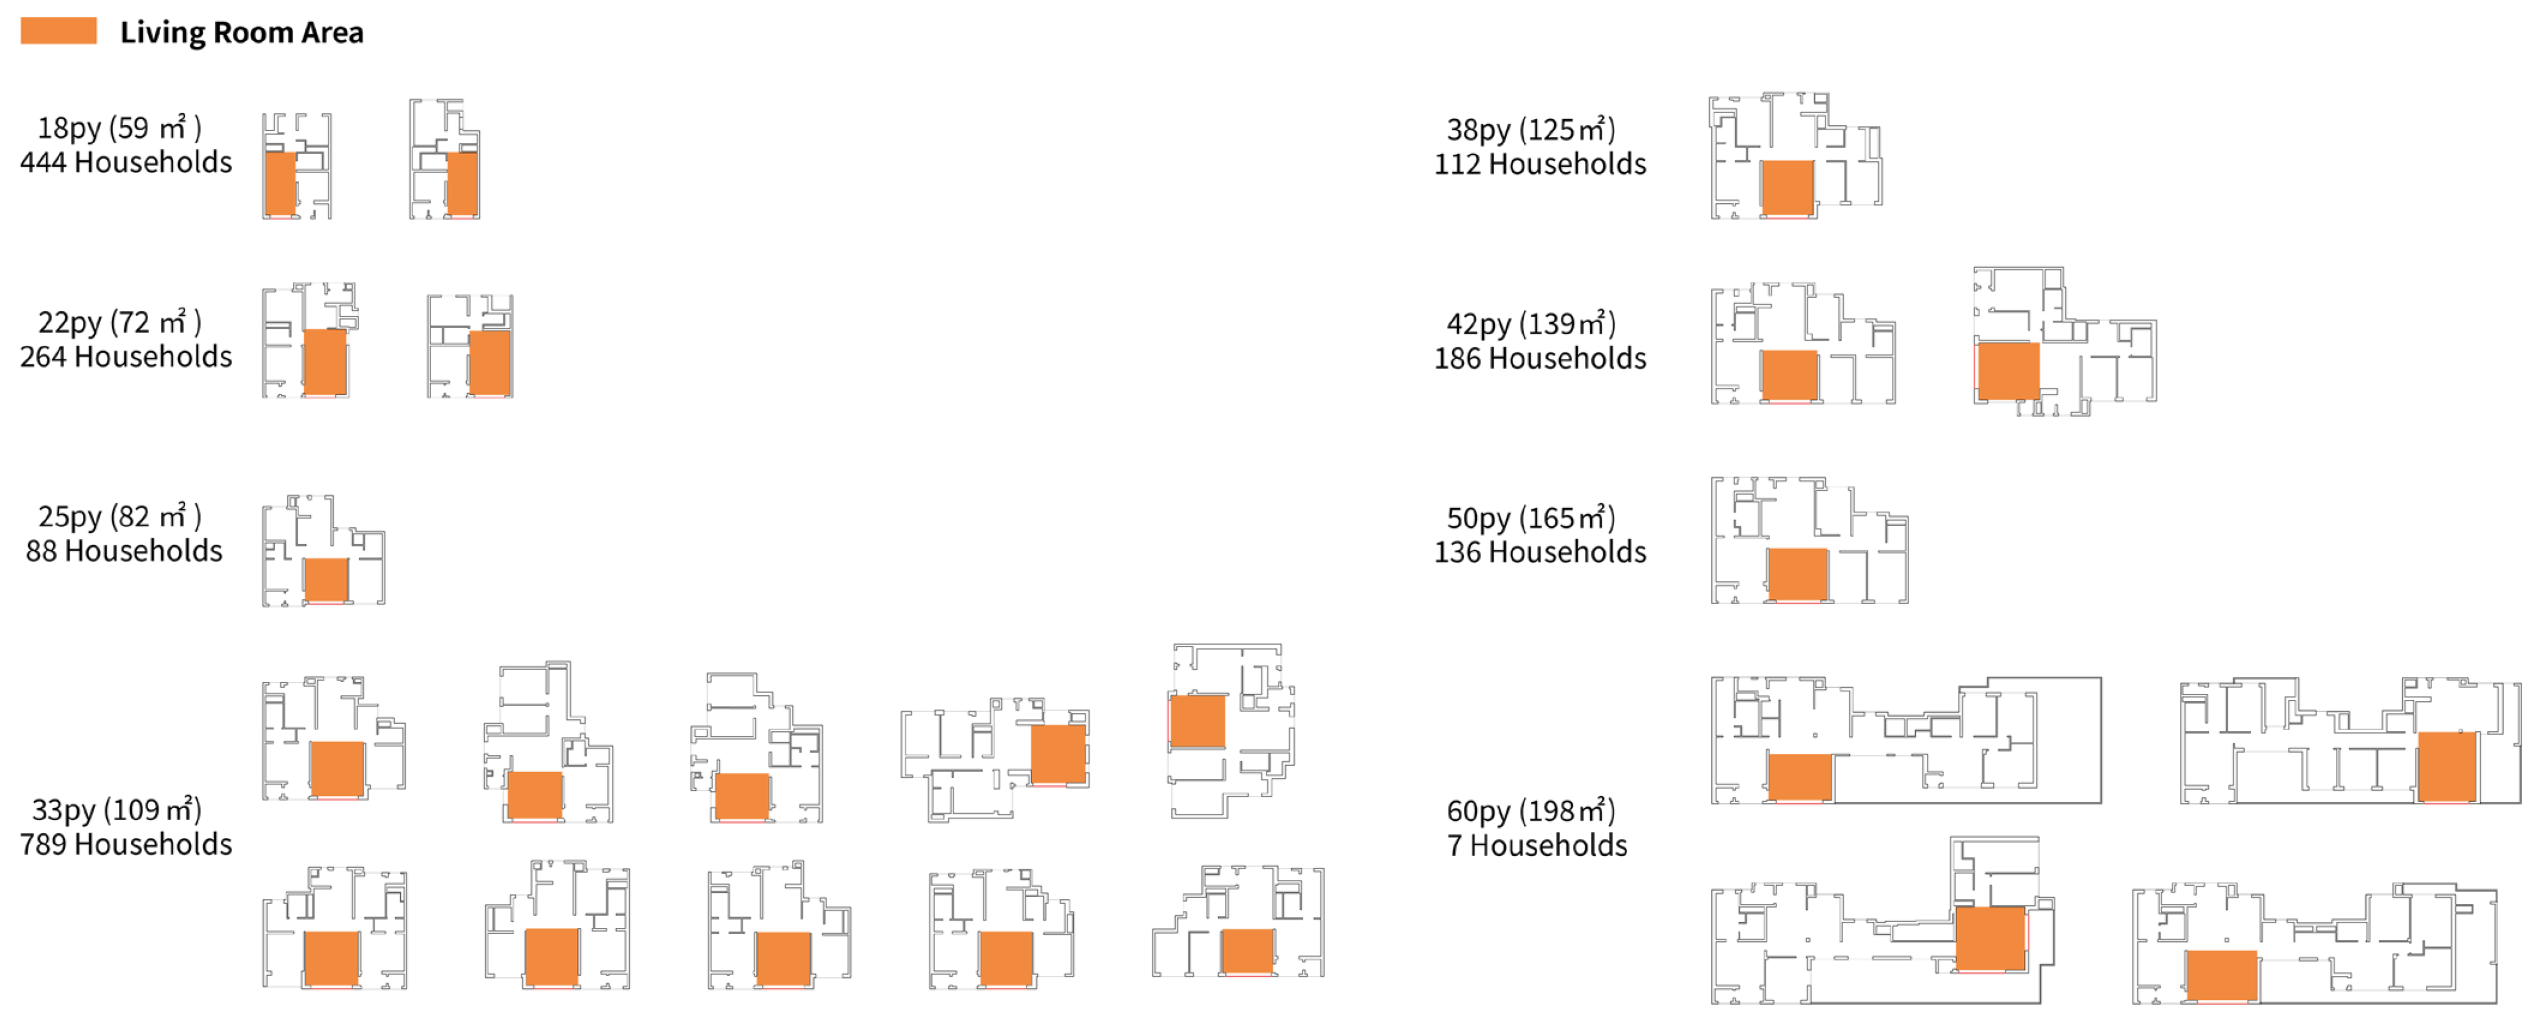
To accurately calculate sunlight exposure time, this study utilized the simulation features of Ladybug 1.2.0. Climate data were based on the EPW file corresponding to Seoul’s geographic coordinates (37°34′ N, 126°57′ E), allowing for the analysis of the relative solar trajectory and sun exposure patterns of the study site. Ladybug was used to compute daylight sun vectors and derive both the duration and spatial extent of potential solar access across the entire site. For solar radiation simulation, the GenCumulativeSky module from Radiance 1.2.0. was employed [22,23]. This module generates an hourly sky matrix based on weather files and enables the calculation of annual solar radiation on building facades. Similar computational approaches have been validated in recent optimization studies for residential complexes [8,24]. Sunlight exposure was calculated based on living room windows. The floor plan types of analyzed units are summarized in Table 10. Living rooms in the study are primarily oriented toward the south or southwest. In cases where the living room is open to two directions, both facades were included in the analysis.
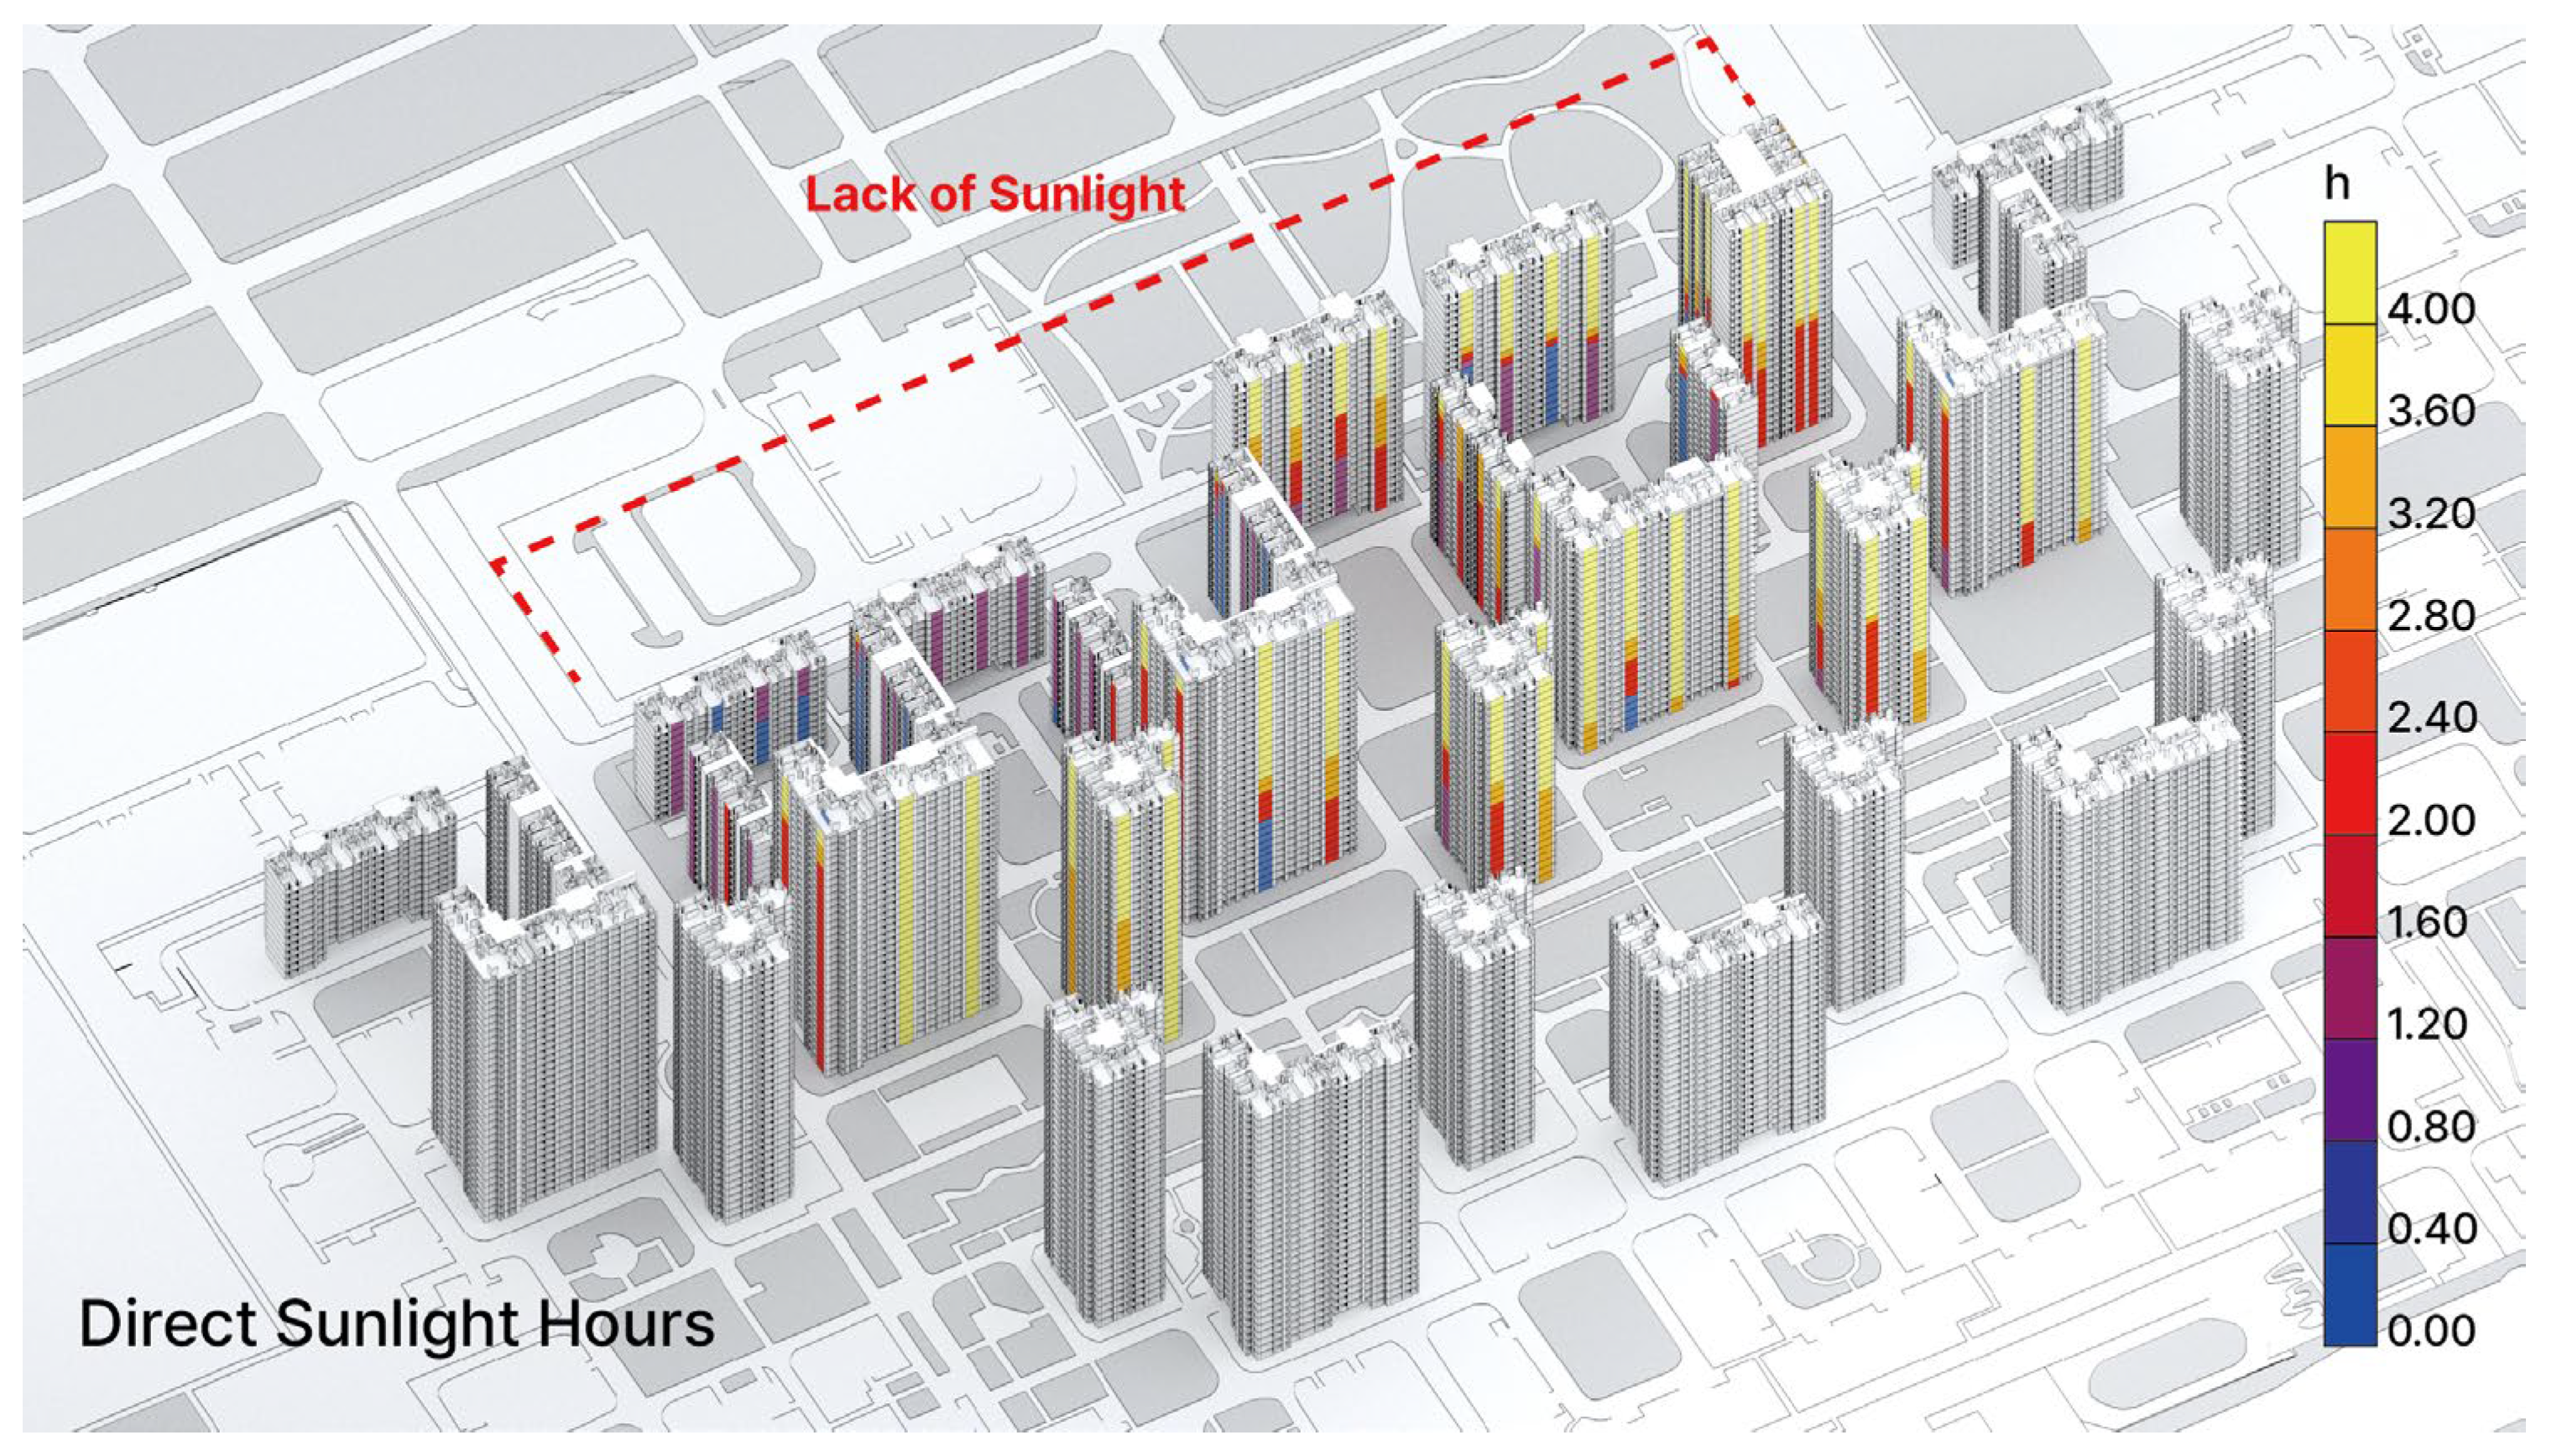
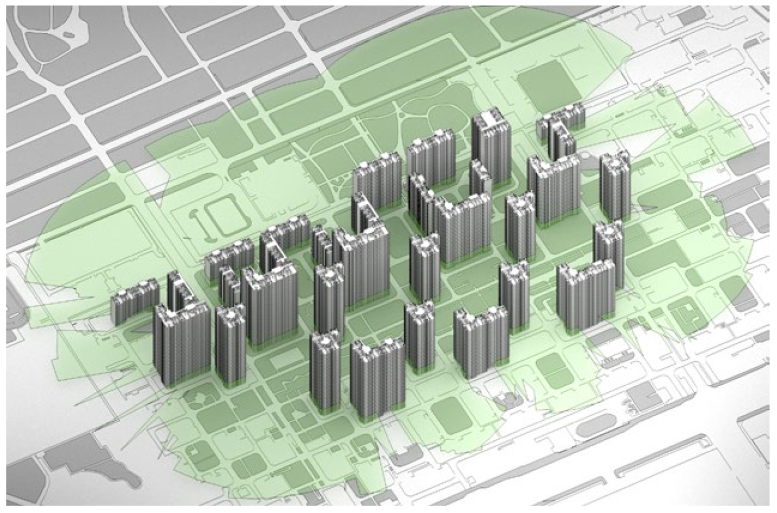
Based on the analysis of Sub-Complex 3 of Helio City in Songpa-gu, it was found that, on the winter solstice (22 December), only 64.31% of the 2026 residential units received at least two hours of continuous sunlight in their living rooms throughout the day (Table 11, Figure 8). The duration of sunlight exposure per unit ranged from 0 to a maximum of 7 h, and the distribution by time intervals was as follows:
-
Units receiving less than 1 h of sunlight: 253 units (12.5%)
-
1 to 2 h: 464 units (22.9%)/2 to 3 h: 441 units (21.8%)
-
3 to 4 h: 227 units (11.2%)/More than 4 h: 640 units (31.6%)
These findings highlight the limitations of the current block layout strategy, which fails to ensure legal compliance for sunlight access across all units. In particular, structurally disadvantaged conditions exist for lower-floor units or those located deep within the complex, making sufficient solar access difficult.
Accordingly, this underscores the need to move beyond uniform setback-based layouts and toward site planning strategies that incorporate solar altitude and radiation characteristics. Such strategies would enable the derivation of optimized planning schemes through a more integrated and performance-based approach, one that takes into account not only traditional urban planning indicators—such as building coverage ratio (BCR), floor area ratio (FAR), number of units, building height, building typology, and inter-building distance—but also solar performance criteria.

2.5.2. View Analysis of the Study Site

The visual openness ratio, newly proposed in this study, was applied to evaluate the view quality of Sub-Complex 3 of Helio City. The results are summarized in Table 12. Representative floors were selected for analysis as follows: the 4th floor for lower levels, the 11th floor for mid-levels, and the 21st floor for upper levels. These floors were chosen to capture meaningful vertical differences in view quality from the perspective of actual residents. Specifically, the 4th floor was selected to represent the lower floors, excluding the 1st to 3rd floors, which are more vulnerable to privacy intrusion and limited sunlight exposure due to proximity to pedestrian pathways. The 11th and 21st floors were selected as representative levels for mid and upper floors, respectively, based on the overall floor distribution of buildings within Sub-Complex 3. According to the results in Table 12, the visual openness ratios were as follows: Lower floor (4F): 36.50%/Mid floor (11F): 36.92%/Upper floor (21F): 45.02%.
To contextualize these findings, a Visual Openness Ratio of 100% would represent an unobstructed 180-degree view, such as waterfront units with no adjacent buildings. Based on comparative analysis with similar residential complexes and general architectural guidelines, VOR above 60% is generally considered satisfactory, 40–60% as acceptable, and below 40% as needing improvement. The average VOR across all three levels in Helio City Complex 3 is 39.48%, which falls in the category requiring improvement.
These findings indicate that upper-floor units have relatively better access to unobstructed views compared to lower and mid-level units. However, the small difference in visual openness between the lower and mid-levels suggests that view-oriented design strategies—such as view corridors and building placement—have not been adequately applied to enhance view quality for these floors.
Therefore, this study highlights the necessity for a revised view corridor design and residential block layout strategies that take into account the visual openness of lower and mid-level units. Furthermore, it suggests the need for typological and morphological optimization of residential towers to improve vertical view conditions across individual units.

2.5.3. Privacy Analysis of Lower Floors at the Study Site

An analysis was conducted on the privacy conditions between pedestrians and lower-floor units in Sub-Complex 3 of Helio City, Songpa-gu. The results are presented in Figure 9 and Table 13. The scope of analysis was limited to pedestrian path segments where residential buildings are adjacent on both sides, thereby creating potential for visual interference. The results revealed that 16 out of 18 residential buildings exhibited privacy conflicts between pedestrians and lower-floor units. In particular, privacy concerns were most prominent along the main pedestrian corridor passing through Buildings 311 to 315, and the rear pedestrian zones between Buildings 301–302 and 303–304. This indicates that spaces where the short facades of buildings face each other at corners, with pedestrian paths in between, are especially vulnerable to privacy intrusion.
Based on these findings, the study identifies the need to reorganize the layout and form of residential buildings in Sub-Complex 3 to minimize exposure at privacy-sensitive locations. Where layout or massing adjustments are insufficient, an effective alternative may be to convert certain lower-floor units into public or non-residential facilities, thereby reducing direct visual interference from external pedestrian traffic. Such a strategy could serve as an integrated design solution that simultaneously enhances privacy protection and improves the pedestrian environment at the lower levels of high-density residential complexes.

3. Design Optimization Strategy

3.1. Structure and Overview of the Optimization Algorithm

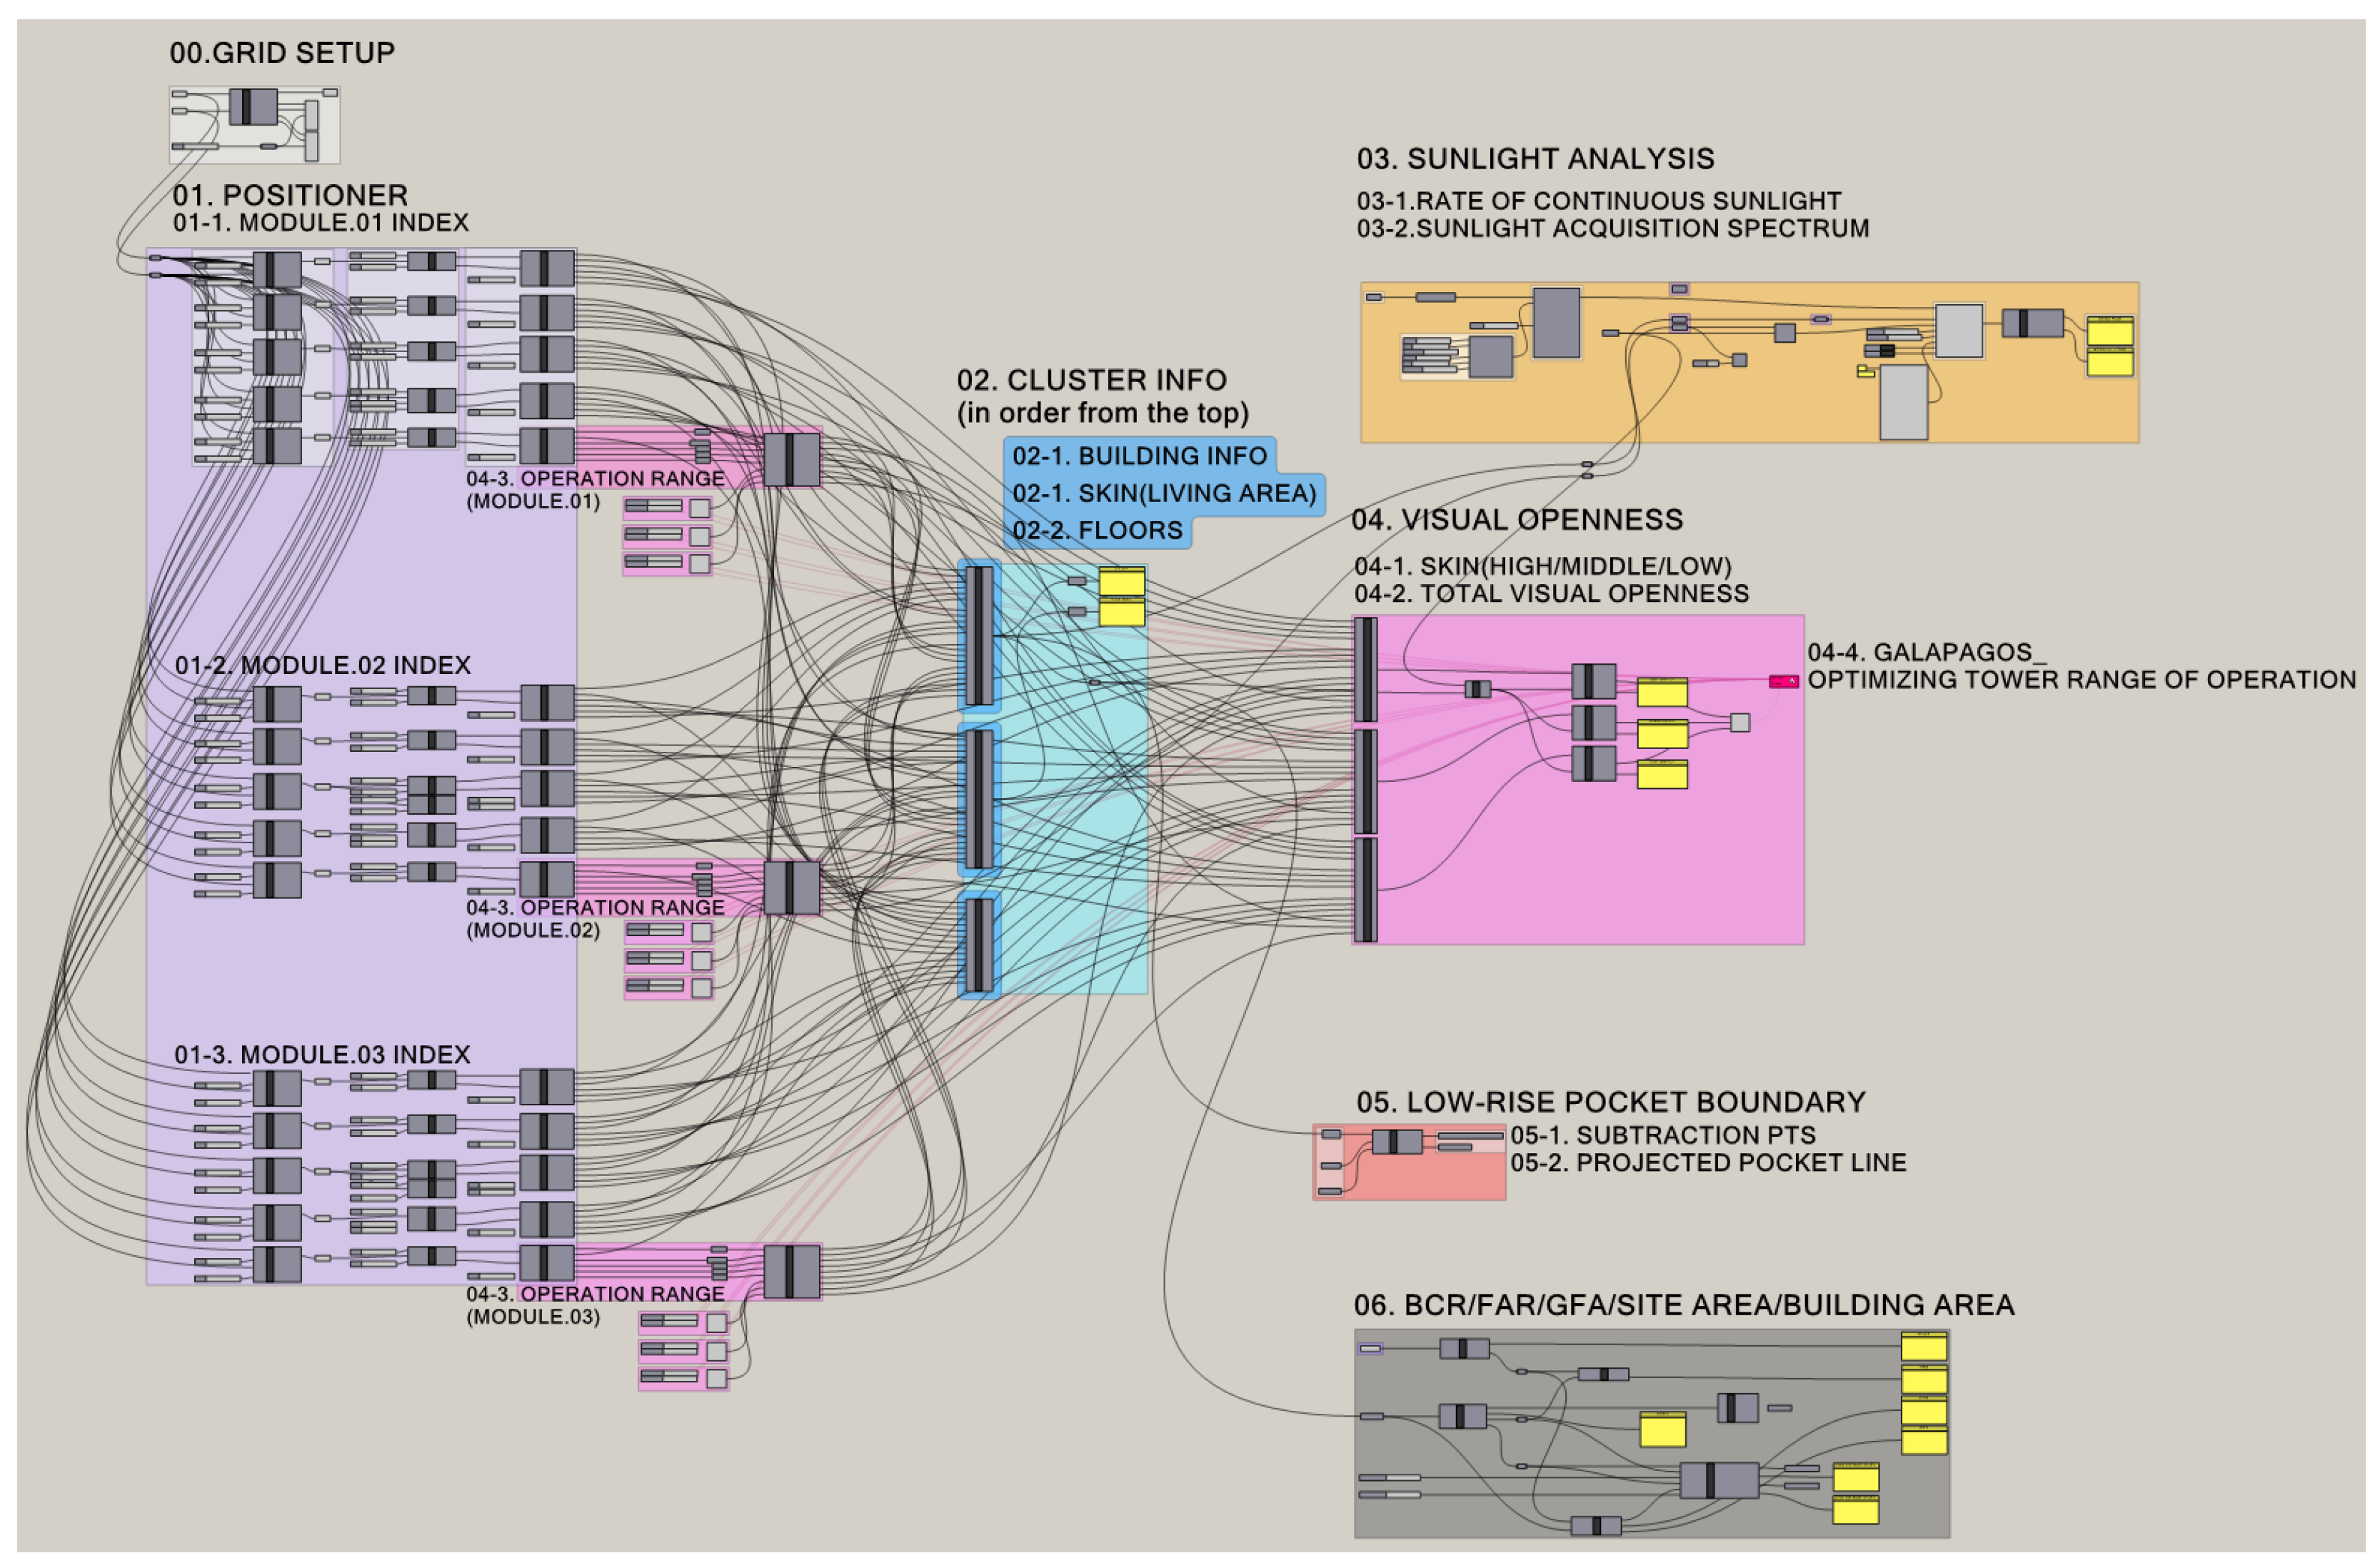
As illustrated in Figure 10, this study developed a multi-objective optimization algorithm that integrates three key performance factors: sunlight access, view quality, and privacy protection. The algorithm sequentially incorporates essential environmental performance factors in multi-family housing design. This approach enables the generation of optimized design alternatives. The following outlines the overall structure of the algorithm and explains the steps involved:
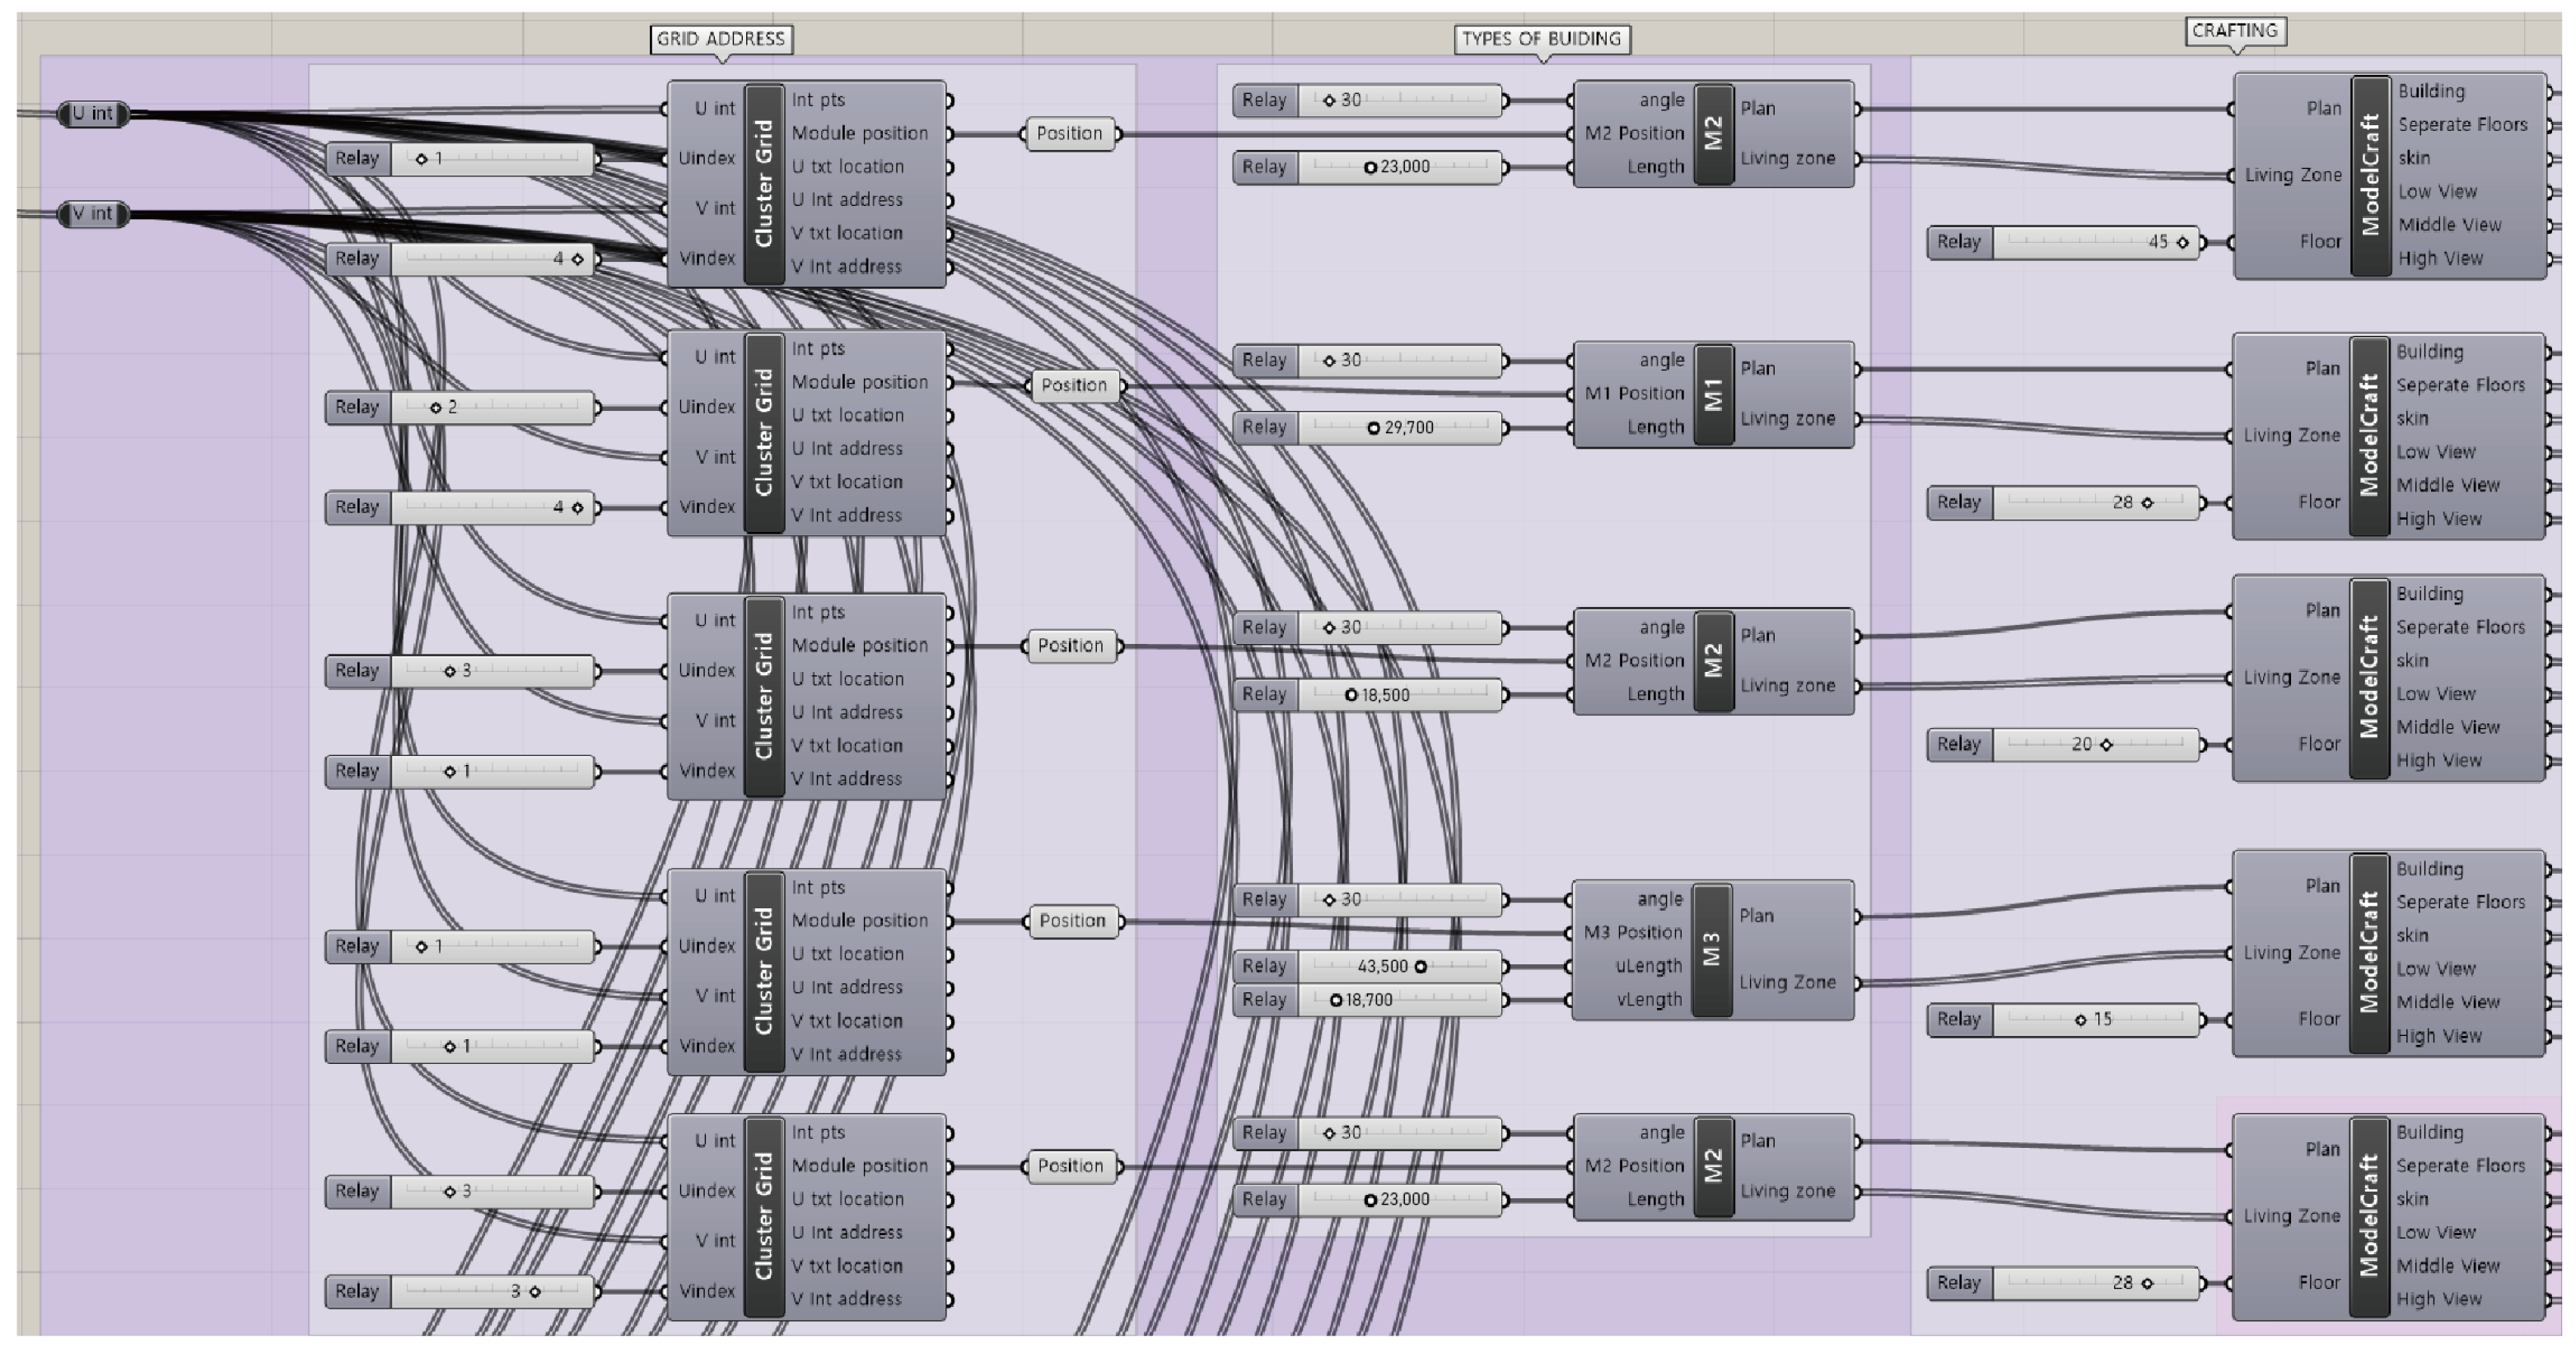
Step 1 involves the generation of a base grid and modular apartment specifications based on the inter-building distances, building types, and dimensions of the existing Sub-Complex 3 of Helio City. According to these specifications, modular apartment units are placed within a virtual environment, and information on their location, form, and attributes is stored in a database referred to as CLUSTER INFO. This data serves as the foundation for subsequent analyses of sunlight, views, and privacy. A sunlight simulation using Ladybug is then conducted to assess the solar performance of each module. Based on the simulation results, a ruleset is generated to ensure compliance with a minimum daylight threshold. Among the various layout alternatives that apply this ruleset, the one with the highest daylight performance is selected. In this process, compliance with legal urban planning parameters—such as building coverage ratio (BCR) and floor area ratio (FAR)—is also evaluated.
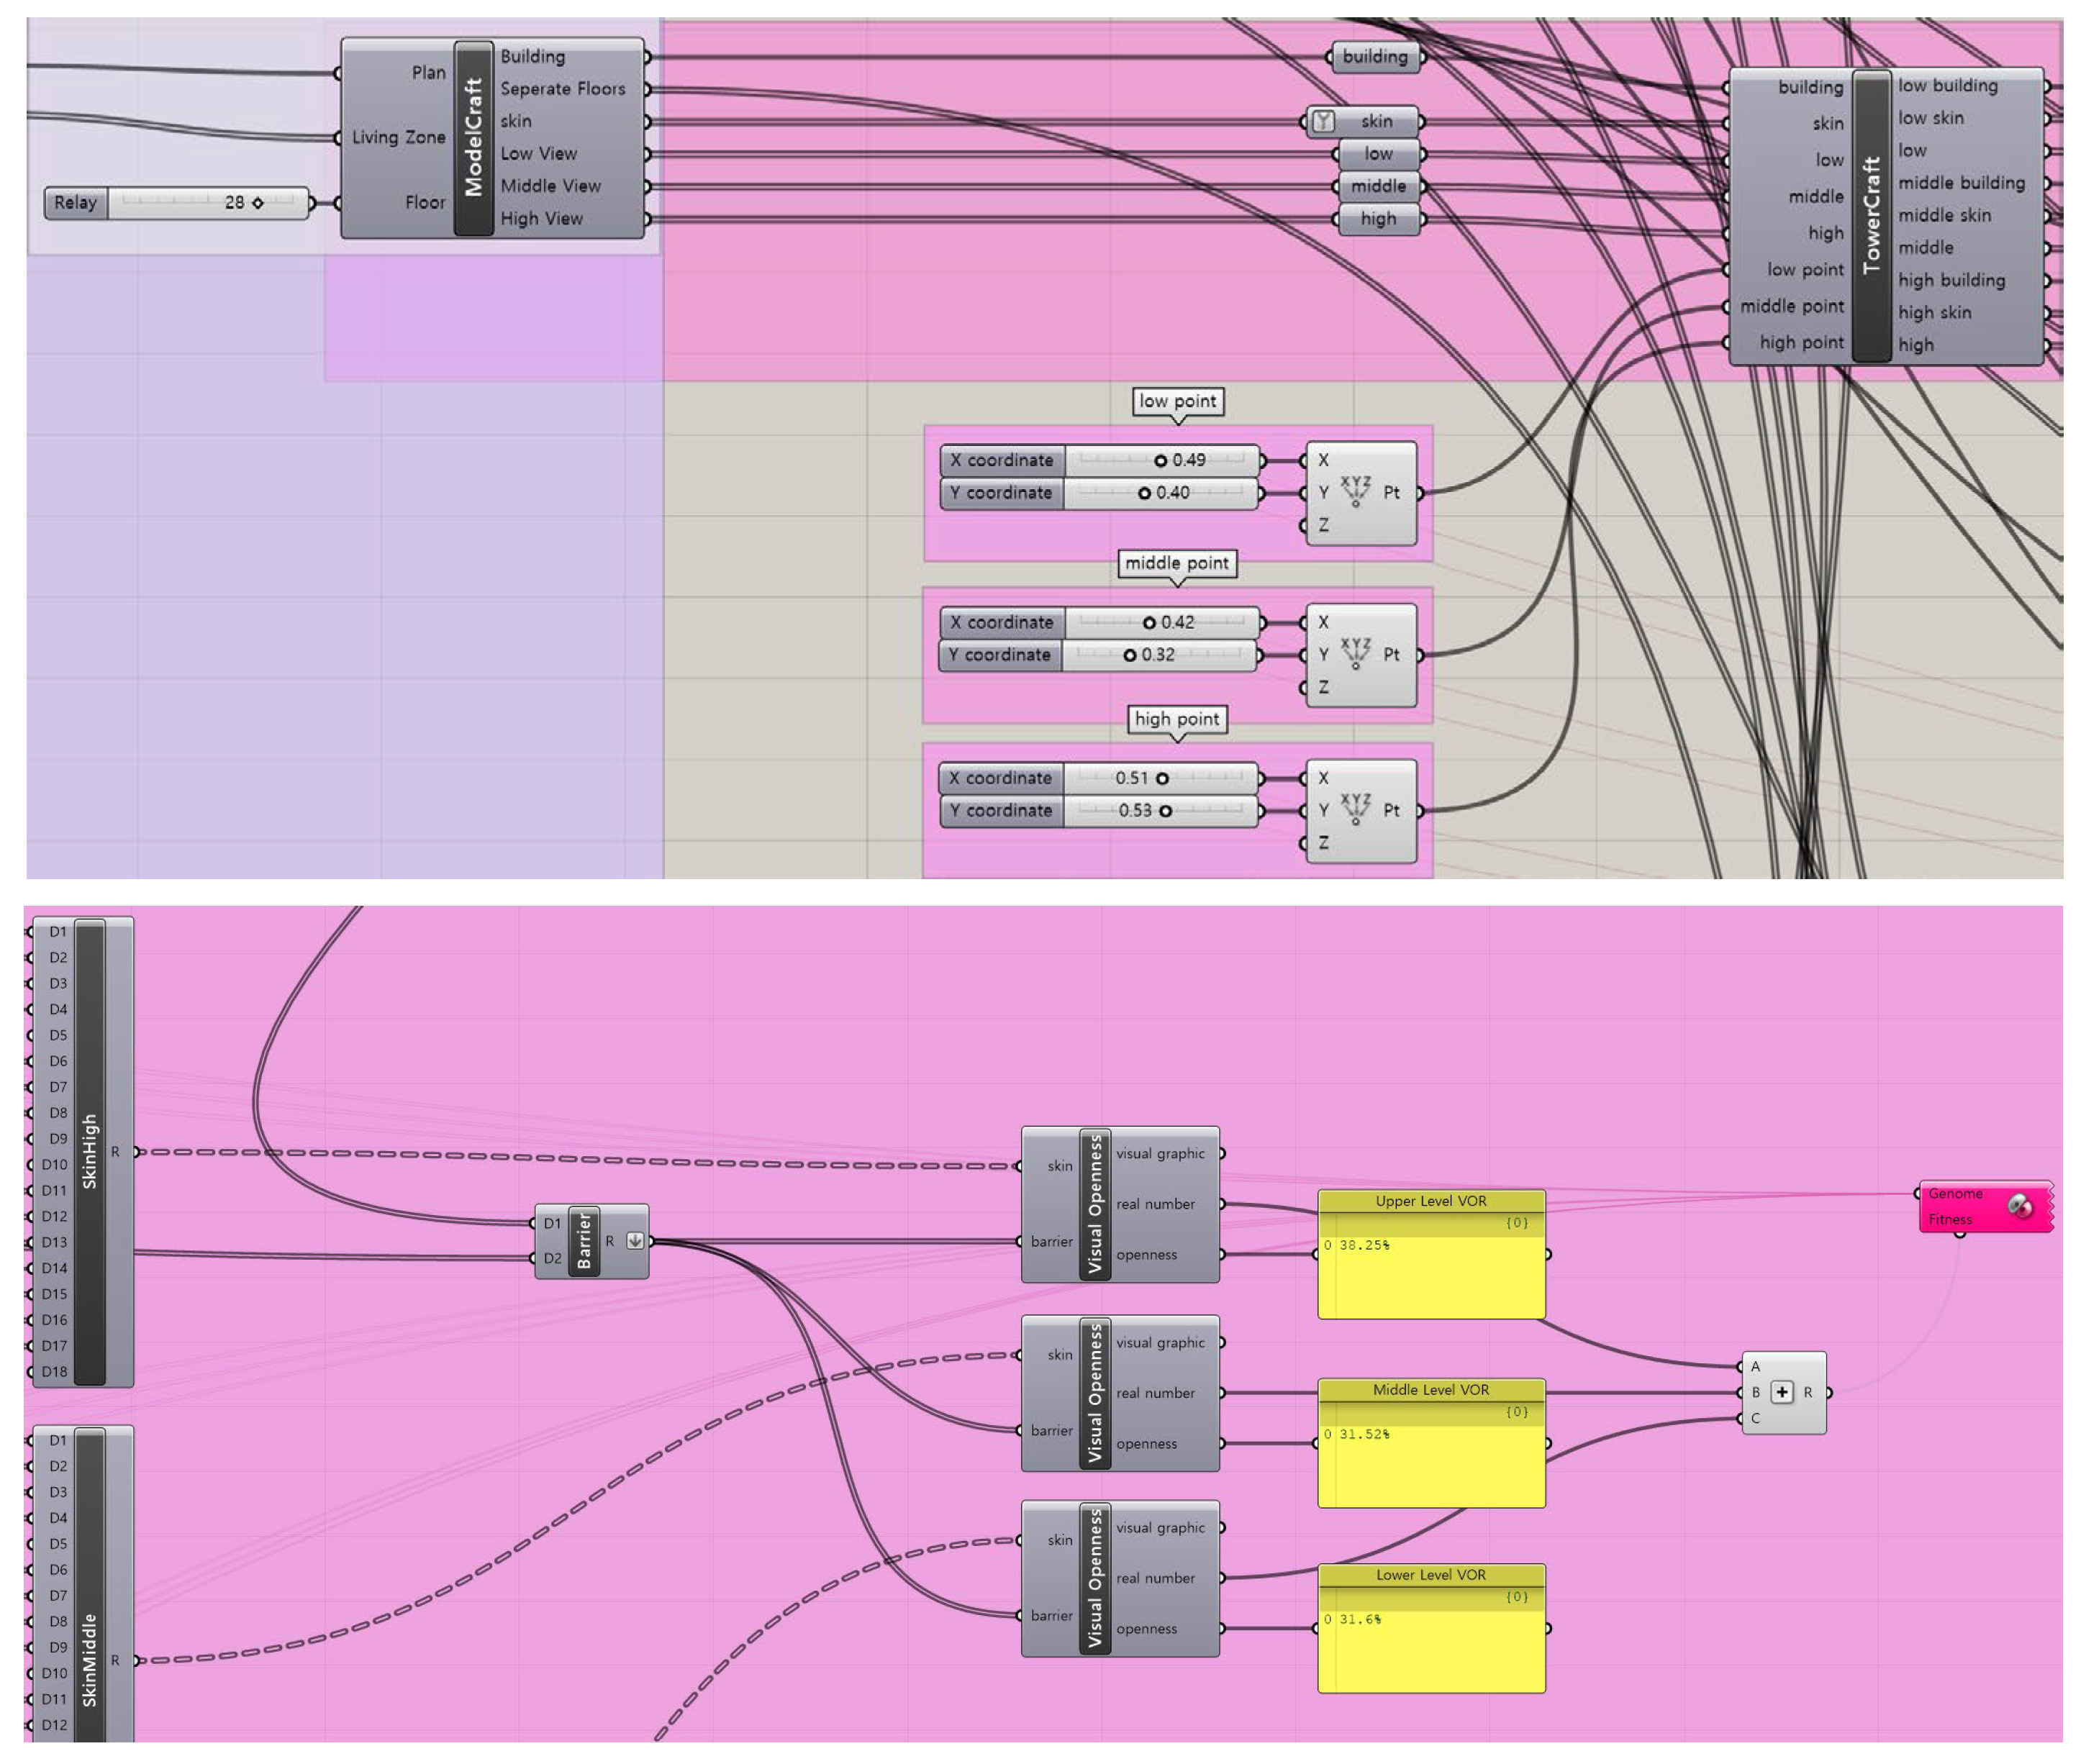
Step 2 focuses on optimizing view quality. Based on the best-performing daylight layout obtained from Step 1, a Galapagos-based genetic algorithm is applied. The floor-level distribution range of tower-type modules is set as an input parameter, and the visual openness ratio is used as the output variable in the optimization process. This step results in the derivation of an optimal tower configuration that maximizes visual openness, and the outcome is reflected in the previously selected layout to produce a semi-optimized alternative.
Step 3 addresses privacy optimization. In this step, pedestrian circulation flows are reconstructed within the semi-optimized layout to identify locations where visual interference between pedestrians and lower-floor residential units occurs. Using a lower-floor pocket space algorithm, the vertical visual intrusion zones are mapped, and affected areas are reprogrammed as public pocket spaces rather than residential zones. This spatial adjustment effectively mitigates privacy violations, resulting in a final optimized layout (Optimized Alternative) that holistically integrates sunlight, view, and privacy considerations.

3.2. Layout Optimization for Sunlight Access

3.2.1. Layout Criteria Definition

In this study, a regular grid system with 33-m intervals was established by reflecting the building module dimensions and inter-building spacing conditions of the existing Sub-Complex 3 in Jamsil Helio City. As illustrated in Figure 11, the layout grid consists of 13 rows and 5 columns, forming a total of 65 placement points within the defined boundary of Sub-Complex 3. The center of each residential block is aligned to these placement points. By adopting this quantified and systematic grid structure, the study ensured both layout efficiency and the feasibility of repeatable optimization analysis.
The length and width of residential buildings are not merely formal dimensions; they have a direct impact on the calculation of the number of housing units, as well as on floor area ratio (FAR) and building coverage ratio (BCR). Therefore, the establishment of module specifications constitutes a critical precondition for layout optimization.
To this end, a standardized set of representative module dimensions was defined by simplifying actual building dimensions in Sub-Complex 3 of Helio City, taking into account the living room window widths, spacing between units, and adjacent placement conditions across three typologies: tower-type, slab-type, and hybrid-type buildings. Based on the average width of living room windows (3300 mm), the minimum building lengths were defined as 8000 mm for tower-type buildings, 9600 mm for slab-type buildings, 9300 mm for hybrid-type buildings. The minimum widths were set as 8000 mm for tower-type, 11,600 mm for slab-type, 12,300 mm for hybrid-type buildings (see Figure 12). However, using only these minimum dimensions would not allow for achieving the target number of housing units within Sub-Complex 3. Therefore, the building sizes were algorithmically adjusted in subsequent stages to reflect the required unit count, as illustrated in Figure 13.
To place the standardized residential modules onto the grid, this study established a rule set based on the condition of achieving 100% continuous sunlight compliance. Among the building types, the hybrid type, which combines characteristics of both tower and slab forms, was not used as a base module. Instead, tower-type units (with living rooms oriented to the southwest) and slab-type units (with living rooms facing south) were separately defined as primary building types. As a fundamental condition for ensuring sunlight access, no residential block was allowed to be placed on the grid directly in front of another, minimizing inter-building shadow interference.
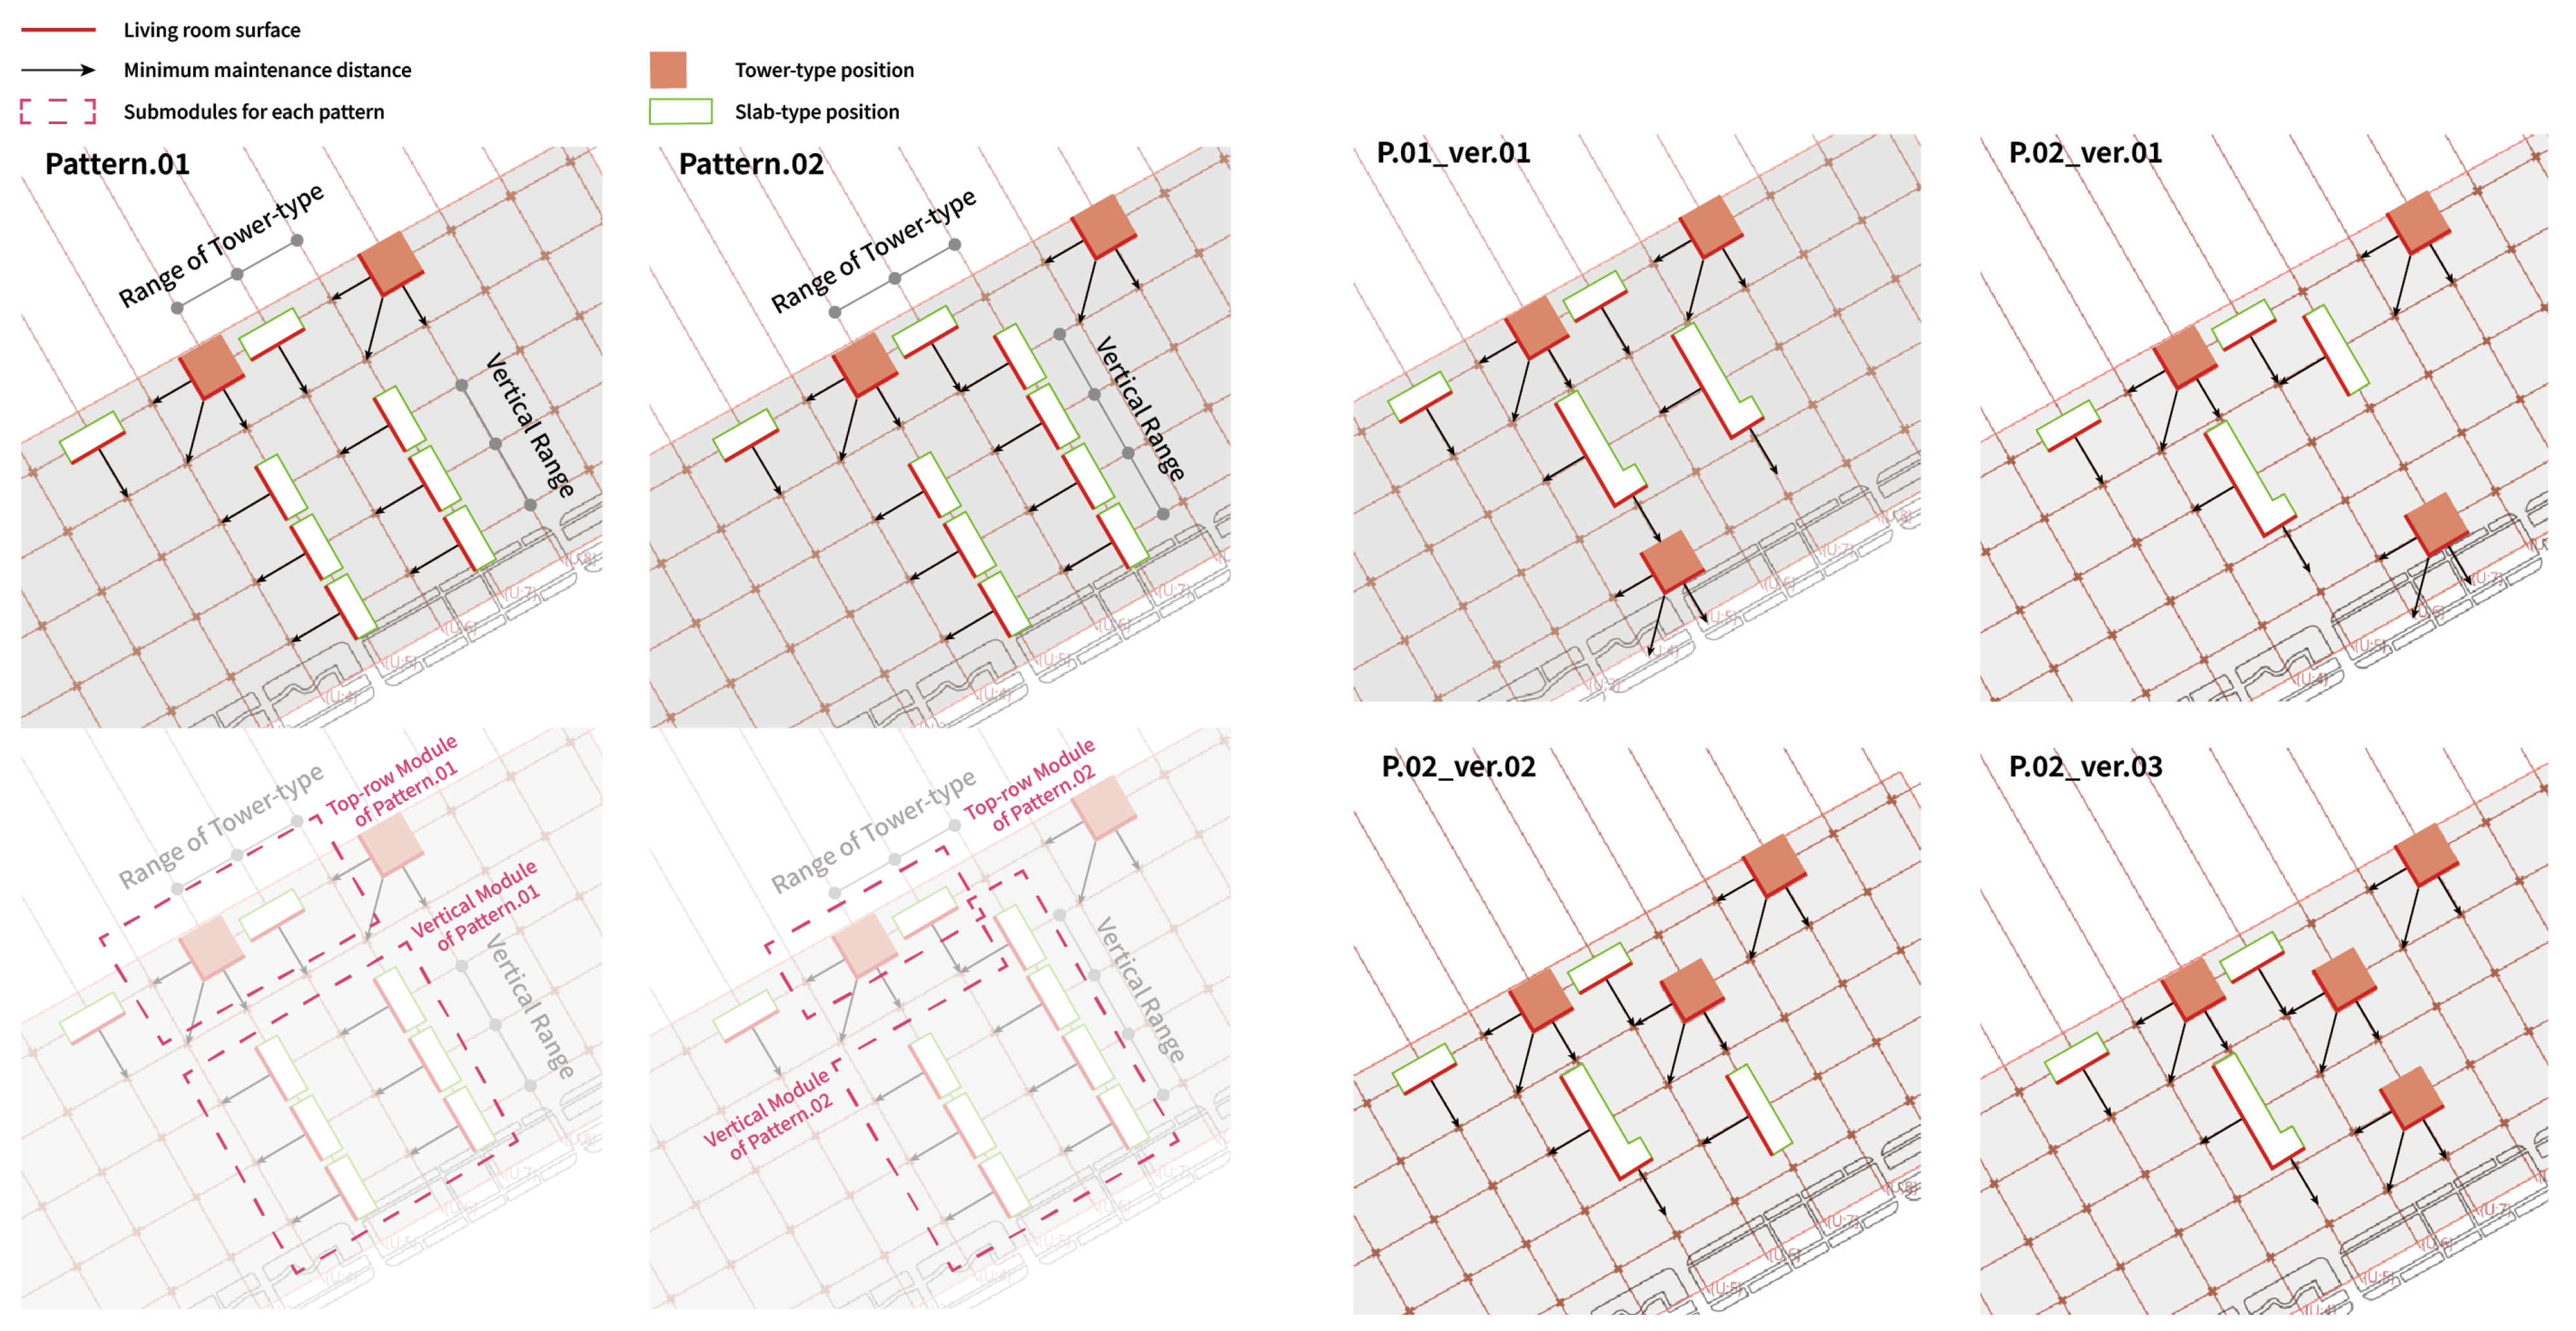
To improve layout efficiency, buildings were arranged sequentially from the top row (Row 1) to the bottom row (Row 5) in a south-facing orientation. Tower-type buildings were restricted to the bottom-left of the grid, and slab-type buildings to the bottom-right, thereby limiting mutual interference between view and sunlight conditions. In particular, tower-type buildings were always positioned to the left of slab-type buildings, to further reduce inter-type conflicts. The resulting combinatorial building placement pattern was designed to allow expansion up to three columns, from which two base patterns were developed:
-
Pattern.01: a tightly packed configuration with no gaps between adjacent units
-
Pattern.02: a spaced configuration with one grid cell gap between adjacent units
Subsequently, combinations of Pattern.01 and Pattern.02 were applied to all grid cells except the central two columns from Rows 2 to 5, where slab-type buildings were preferentially arranged. In the bottom row, selected slab units were either lengthened, converted to hybrid type, or removed to fine-tune performance under sunlight conditions. As a result of this rule-based variation, four layout modules (Module Alt. 01–04) were derived. By repetitively placing each module across the entire grid, four final layout alternatives (Alternatives A–D) were generated (Figure 14).

3.2.2. Layout Optimization

The area in which Sub-Complex 3 of Helio City is located is designated as a Type 3 General Residential Zone, where the legal maximum floor area ratio (FAR) is 300%. This study aimed to optimize building layout under three conditions: (1) Maximize the percentage of units securing two continuous hours of sunlight on the winter solstice, (2) Maintain FAR below 300%, and (3) Achieve a total unit count equal to or greater than the existing 2026 units in Sub-Complex 3. A total of four layout alternatives (Alterations 1–4) were developed based on these criteria. The layout configurations and performance summaries are presented in Figure 15 and Table 14.
Alternative 1 (Alt 1) is based on Pattern.01, consisting of 17 buildings. It achieved a continuous sunlight access rate of 91.8%. The FAR was 288.17%, meeting the legal limit, and the total number of units was 2075, which is 49 more units than the existing complex. The Building Coverage Ratio (BCR) was 25.05%, an 8% increase compared to the original. Alternative 2 (Alt 2) applies Pattern.02 ver.01, with 15 buildings. It achieved a sunlight access rate of 93.1%, and an FAR of 298.43%, remaining within regulatory limits. The total number of units was 2061 (35 units more than the original), and the BCR was 24.44%, reflecting a 7% increase. Alternative 3 (Alt 3) is based on Pattern.02 ver.02, also with 15 buildings. It recorded the highest sunlight access rate at 98.05%, with an FAR of 299.46%. The number of units was identical to Alt 2 (2061 units), and the BCR was 23.5%, showing a 6.5% increase. Alternative 4 (Alt 4) applies Pattern.02 ver.03, consisting of 15 buildings. It achieved the highest sunlight access rate at 99.03%, while maintaining an FAR of 288.96%. The number of units reached 2076 (an increase of 50 units), and the BCR was the lowest among all alternatives at 21.1%.
In summary, all four alternatives satisfied the legal FAR and sunlight access criteria, while also achieving an increase in total housing units. Among them, Alt 4 is evaluated as the most balanced solution, achieving near-complete sunlight compliance, while maintaining favorable unit count and the lowest building coverage ratio. Based on this evaluation, Alternative 4 was selected as the final layout to be applied in the next stage of the multi-objective optimization process.

3.3. View Optimization Through Adjusted Building Form

3.3.1. Definition of Core Modulation Range

An analysis of visual openness based on Alternative 4 revealed that the tower-type buildings located at the center of each module are positioned at points where lines of sight most frequently intersect, and thus cause the greatest obstruction to the views of surrounding residential blocks. As a first step toward improving the view environment, this study focused on reconfiguring the form of the tower-type buildings by defining the dimensions and modulation range of the structural core, which serves as the basis for building form variation.
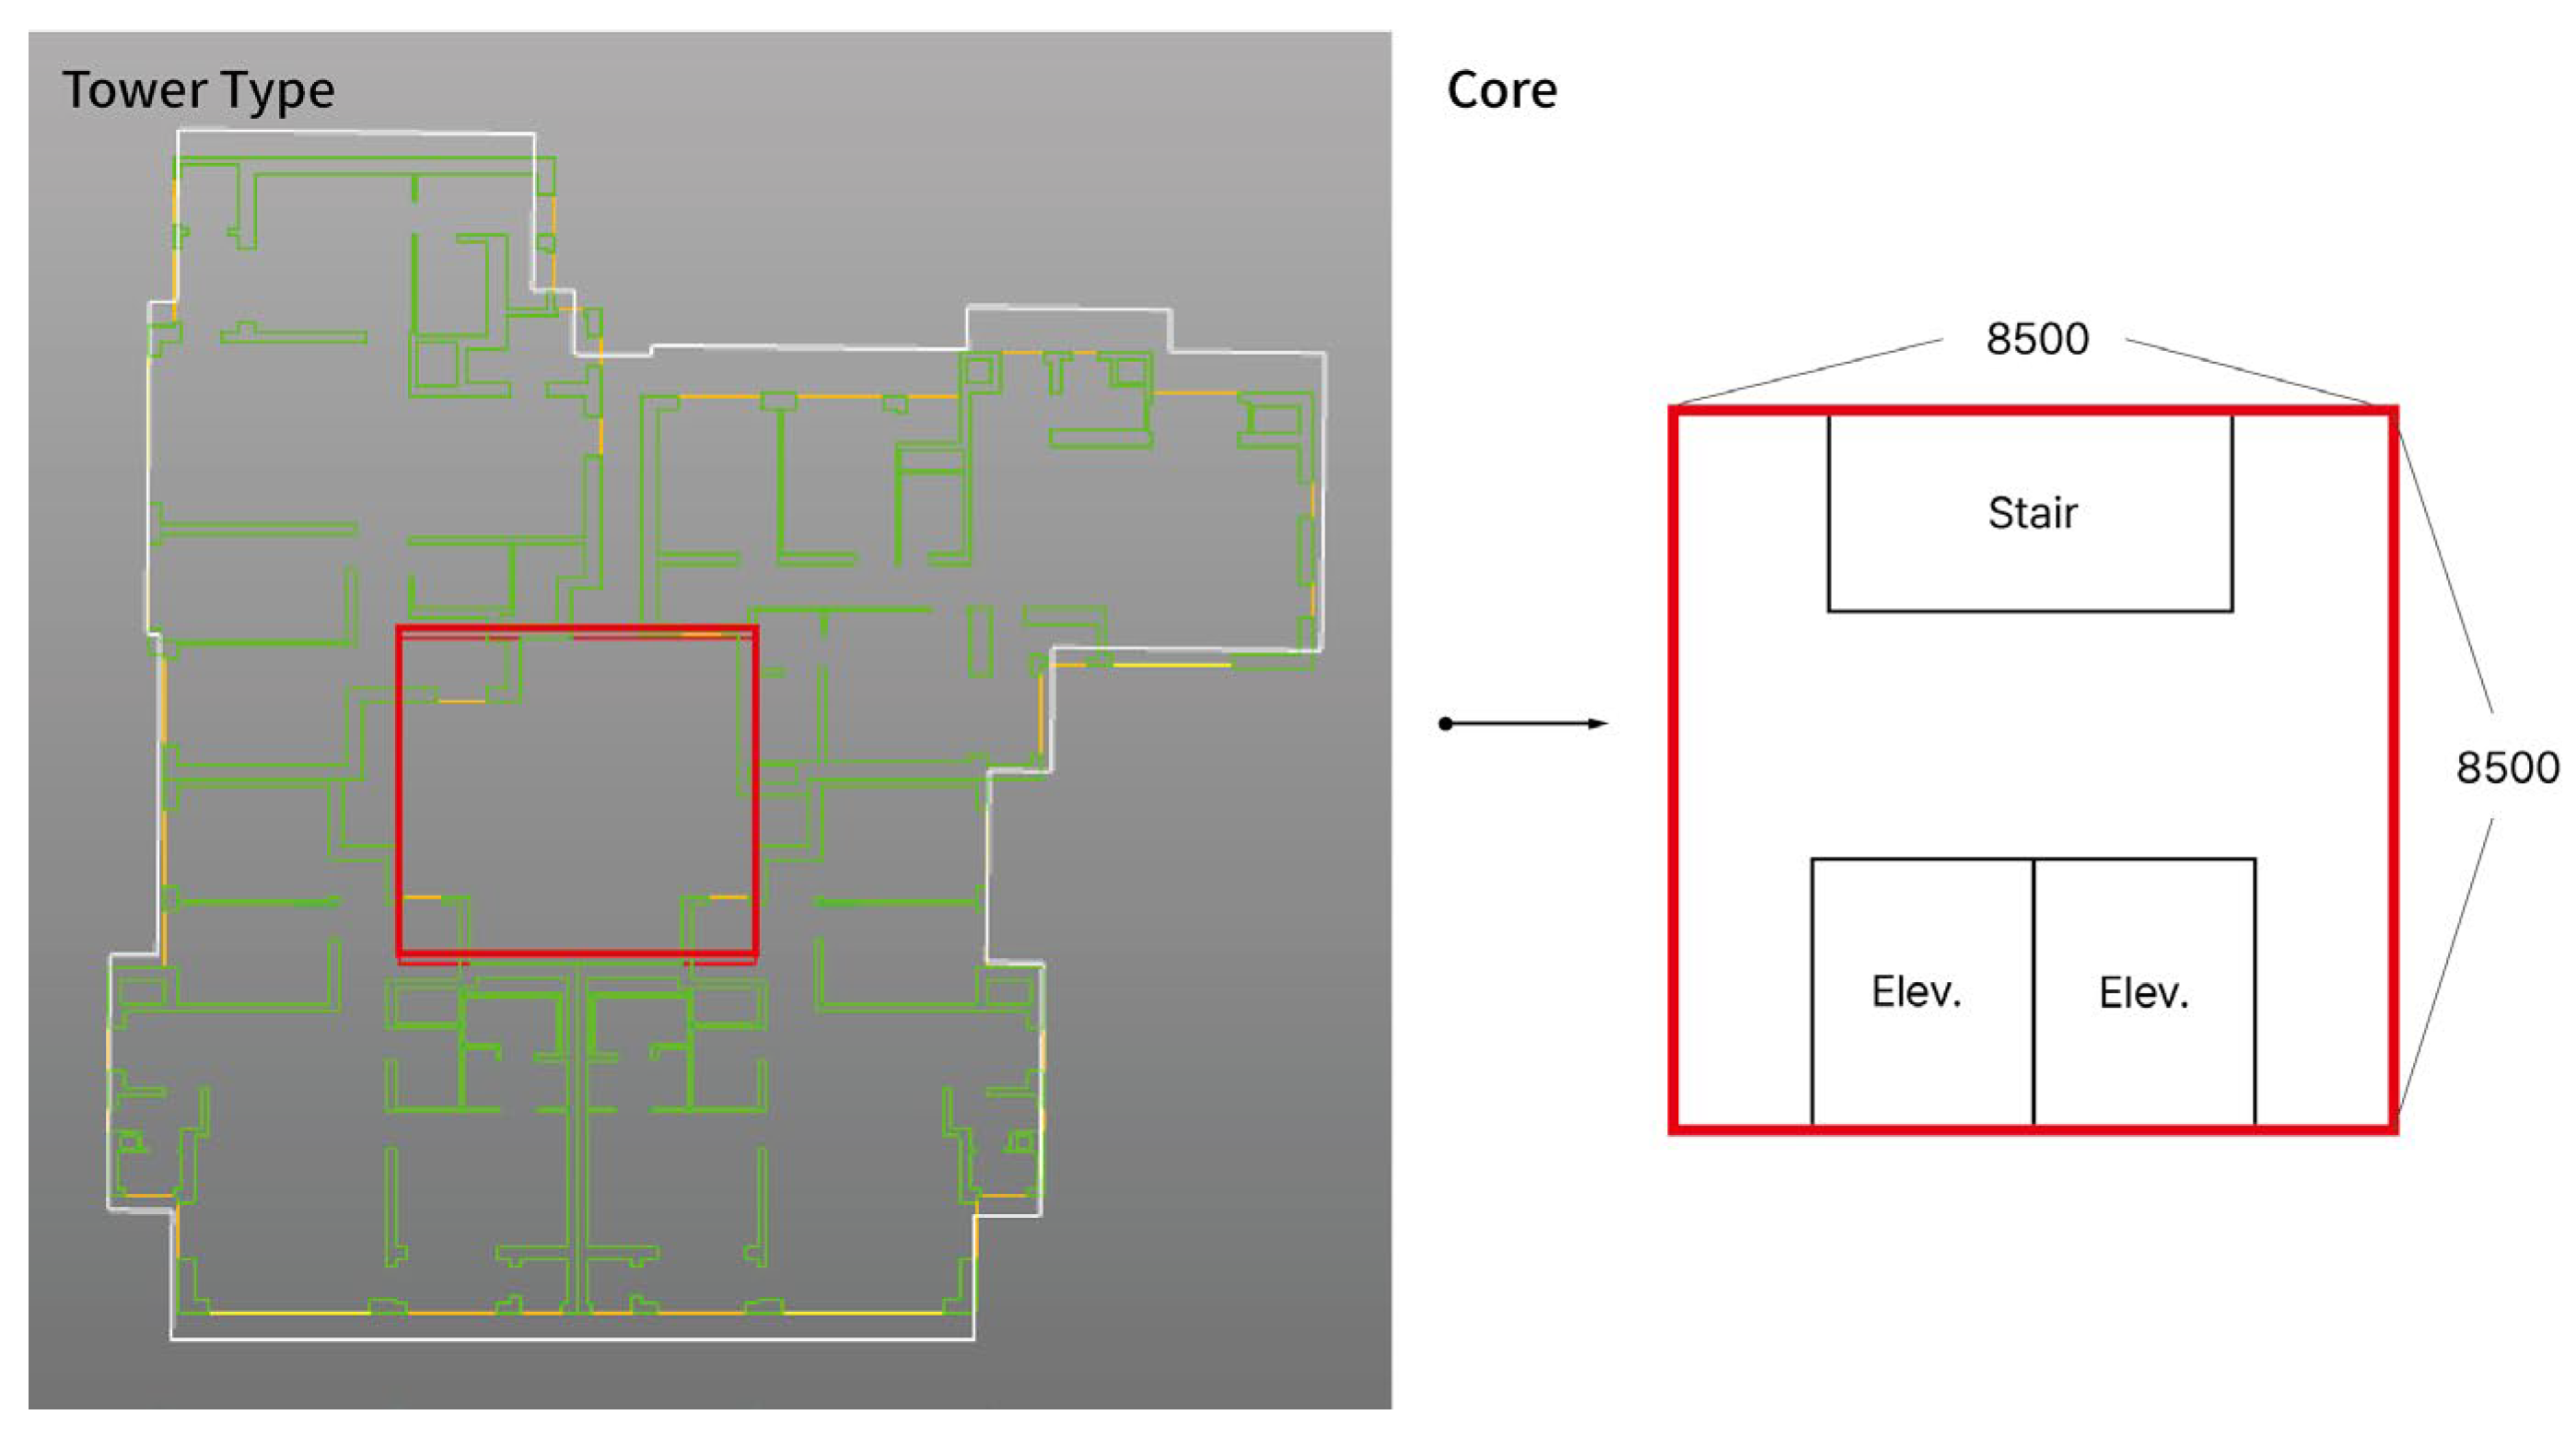
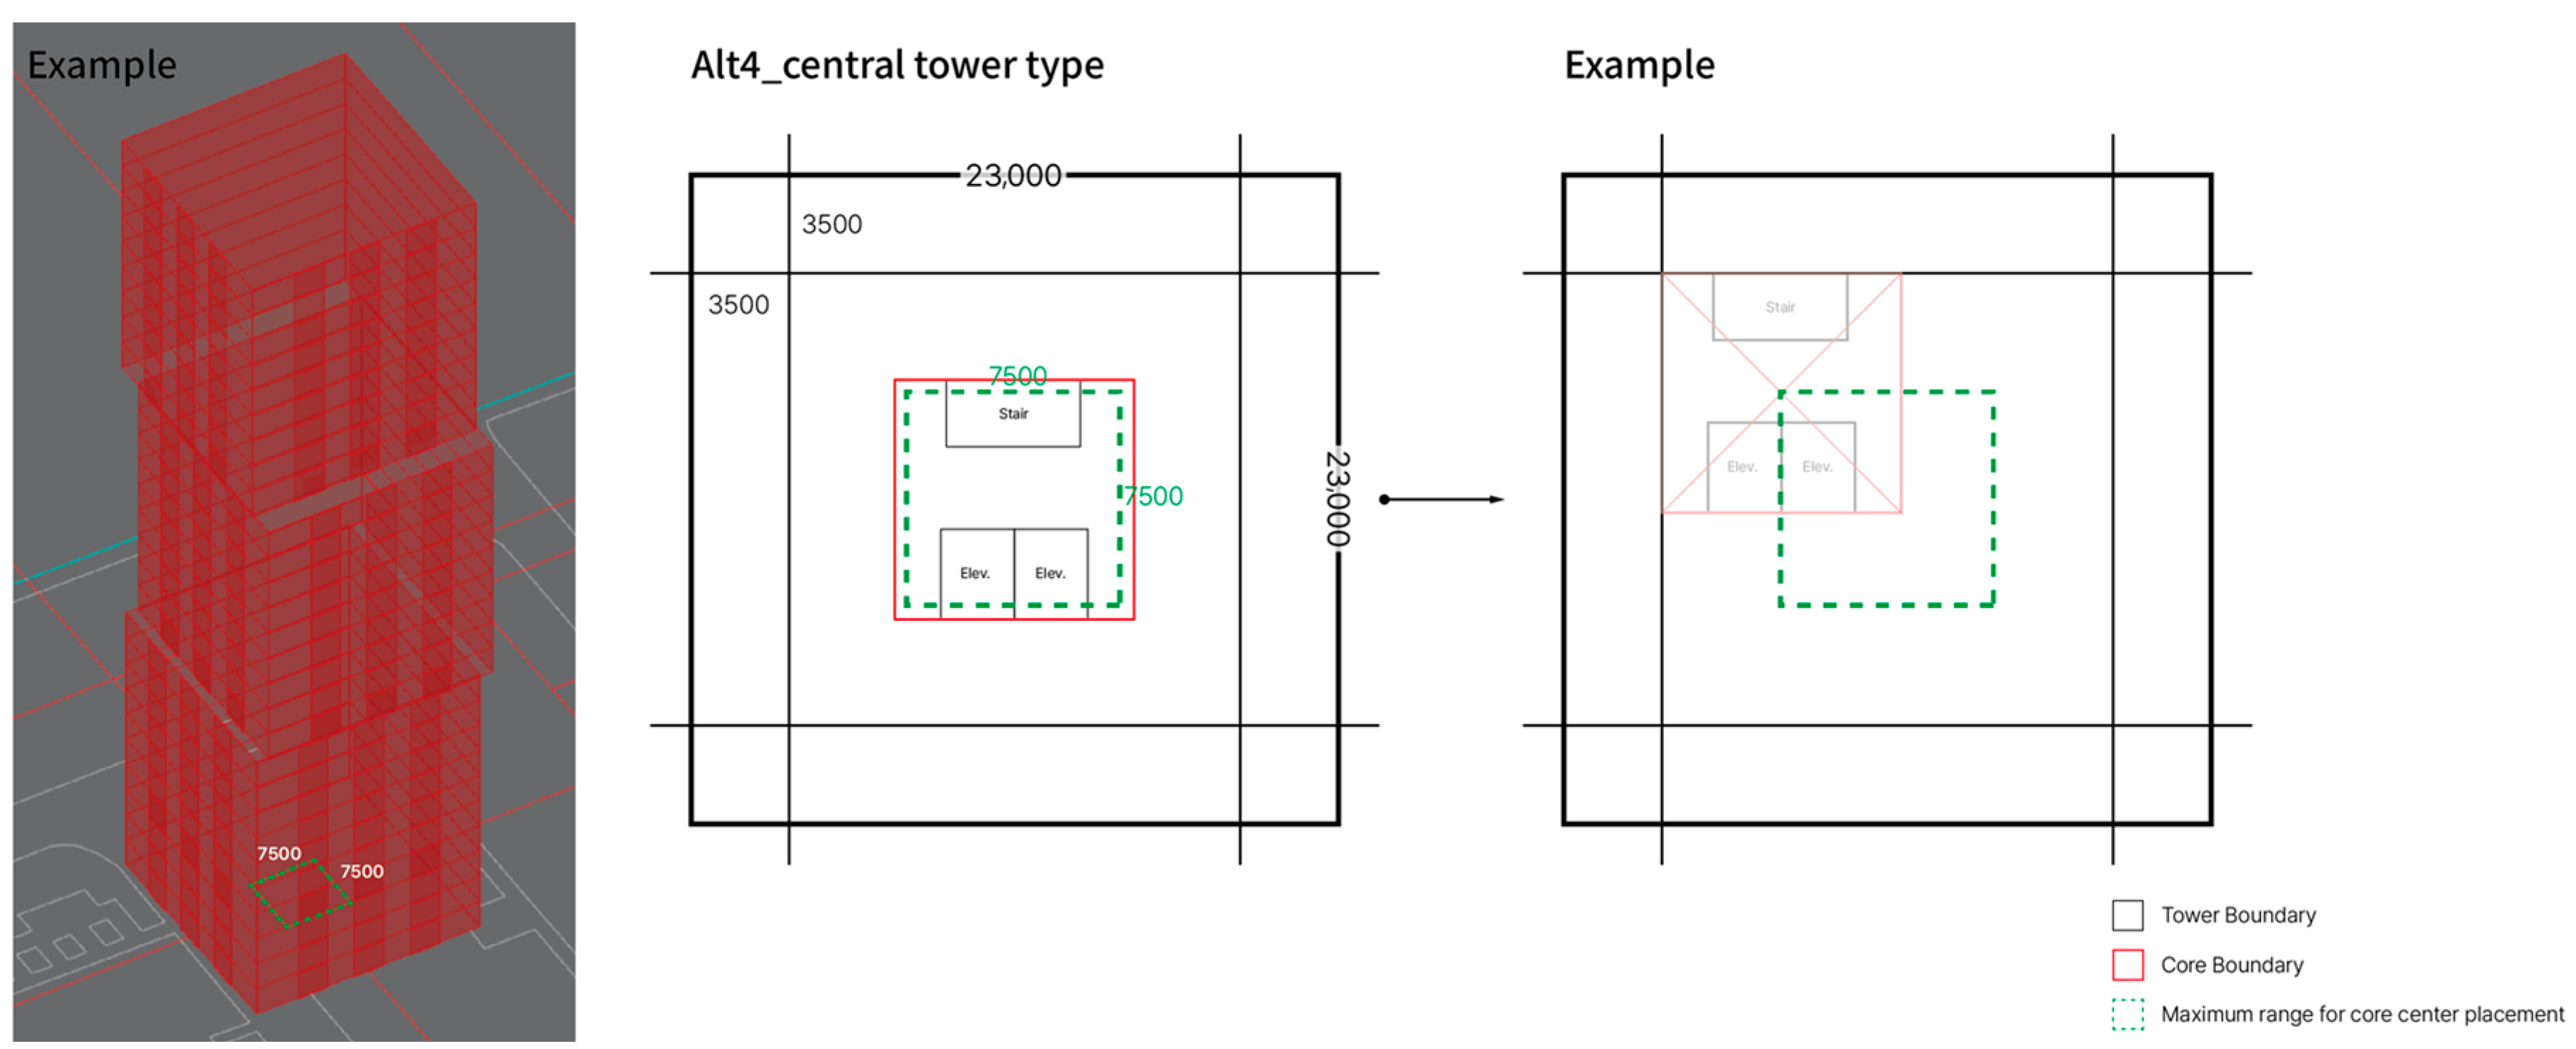
The core, which serves as the vertical circulation shaft connecting the lower and upper floors, also functions as the structural anchor of the building. The dimensions of the core were standardized based on existing tower-type buildings in Helio City. Each core was defined as an 8500 mm × 8500 mm square, accommodating two elevators and an emergency stairwell (see Figure 16).
The central tower-type residential buildings in Alternative 4 were designed with dimensions of 23,000 mm × 23,000 mm, based on the required total number of housing units. The core’s allowable movement range was defined by establishing a setback zone. This zone offsets 3500 mm inward from each outer edge, corresponding to a typical room’s minimum width. As a result, the center point of the core can move only within a 7500 mm × 7500 mm square area, defined by the offset boundaries within the 23,000 mm square footprint (Figure 17). This area constitutes the modulation range of the core, and the algorithm used to implement this concept is illustrated in Figure 18.
It should be noted that the core modulation strategy would require careful structural engineering validation. The offset core positions may necessitate additional shear walls and moment frames to maintain structural integrity, potentially increasing construction costs by 15–20%. However, recent advances in performance-based structural design and high-strength concrete make such configurations technically feasible, as demonstrated in several contemporary towers in Seoul such as the Lotte World Tower’s offset core system.

3.3.2. Tower Form Optimization

Based on the previously defined core modulation range for view optimization, a form optimization process was conducted on three tower-type residential buildings exhibiting the highest levels of visual overlap. Using the Galapagos algorithm, optimization was performed separately for the lower, middle, and upper floors of each tower.
The results revealed the following patterns: In Module 1, the lower floor’s core shifted more significantly along the x-axis than the y-axis compared to its original position. The middle floor showed minimal deviation from the initial location, while the upper floor exhibited substantial movement along the x-axis, with little to no change along the y-axis. In Module 2, the lower floor remained close to its original location, while the middle floor had negligible x-axis movement but significant displacement along the y-axis. The upper floor also showed dominant movement along the y-axis. In Module 3, the lower floor’s core was fixed along the x-axis but moved along the y-axis. The middle floor experienced displacement in both x and y directions, while the upper floor showed minimal deviation from the pre-optimization position (Figure 19).
These findings indicate that the optimal core position for maximizing visual openness varies by floor level, with notably different movement patterns between the x- and y-axes in middle and upper floors. This confirms that fine-tuned vertical adjustments to the form of tower-type buildings, according to floor-specific visual characteristics, can effectively improve the view environment.
The aggregated visual openness results for the three central tower-type residential buildings in Semi-Optimized Alternative 4, refined through Galapagos-based optimization, are as follows: Lower floor: 61.22%/Middle floor: 61.02%/Upper floor: 76.70%.
The total average visual openness across the three floors was calculated to be 66.31% (see Table 15).

3.4. Privacy-Optimized Circulation Design and Lower-Level Refinement

3.4.1. Outdoor Circulation Hierarchy in Residential Complexes

As Semi-Optimized Alternative 4 features a significantly different building layout and configuration compared to the original Helio City Sub-Complex 3, it was necessary to establish a new circulation system for analyzing lower-level pedestrian environments and privacy conditions.
Given that the residential blocks were arranged according to a grid system, this study adopted the grid structure as the basis for defining the circulation hierarchy.
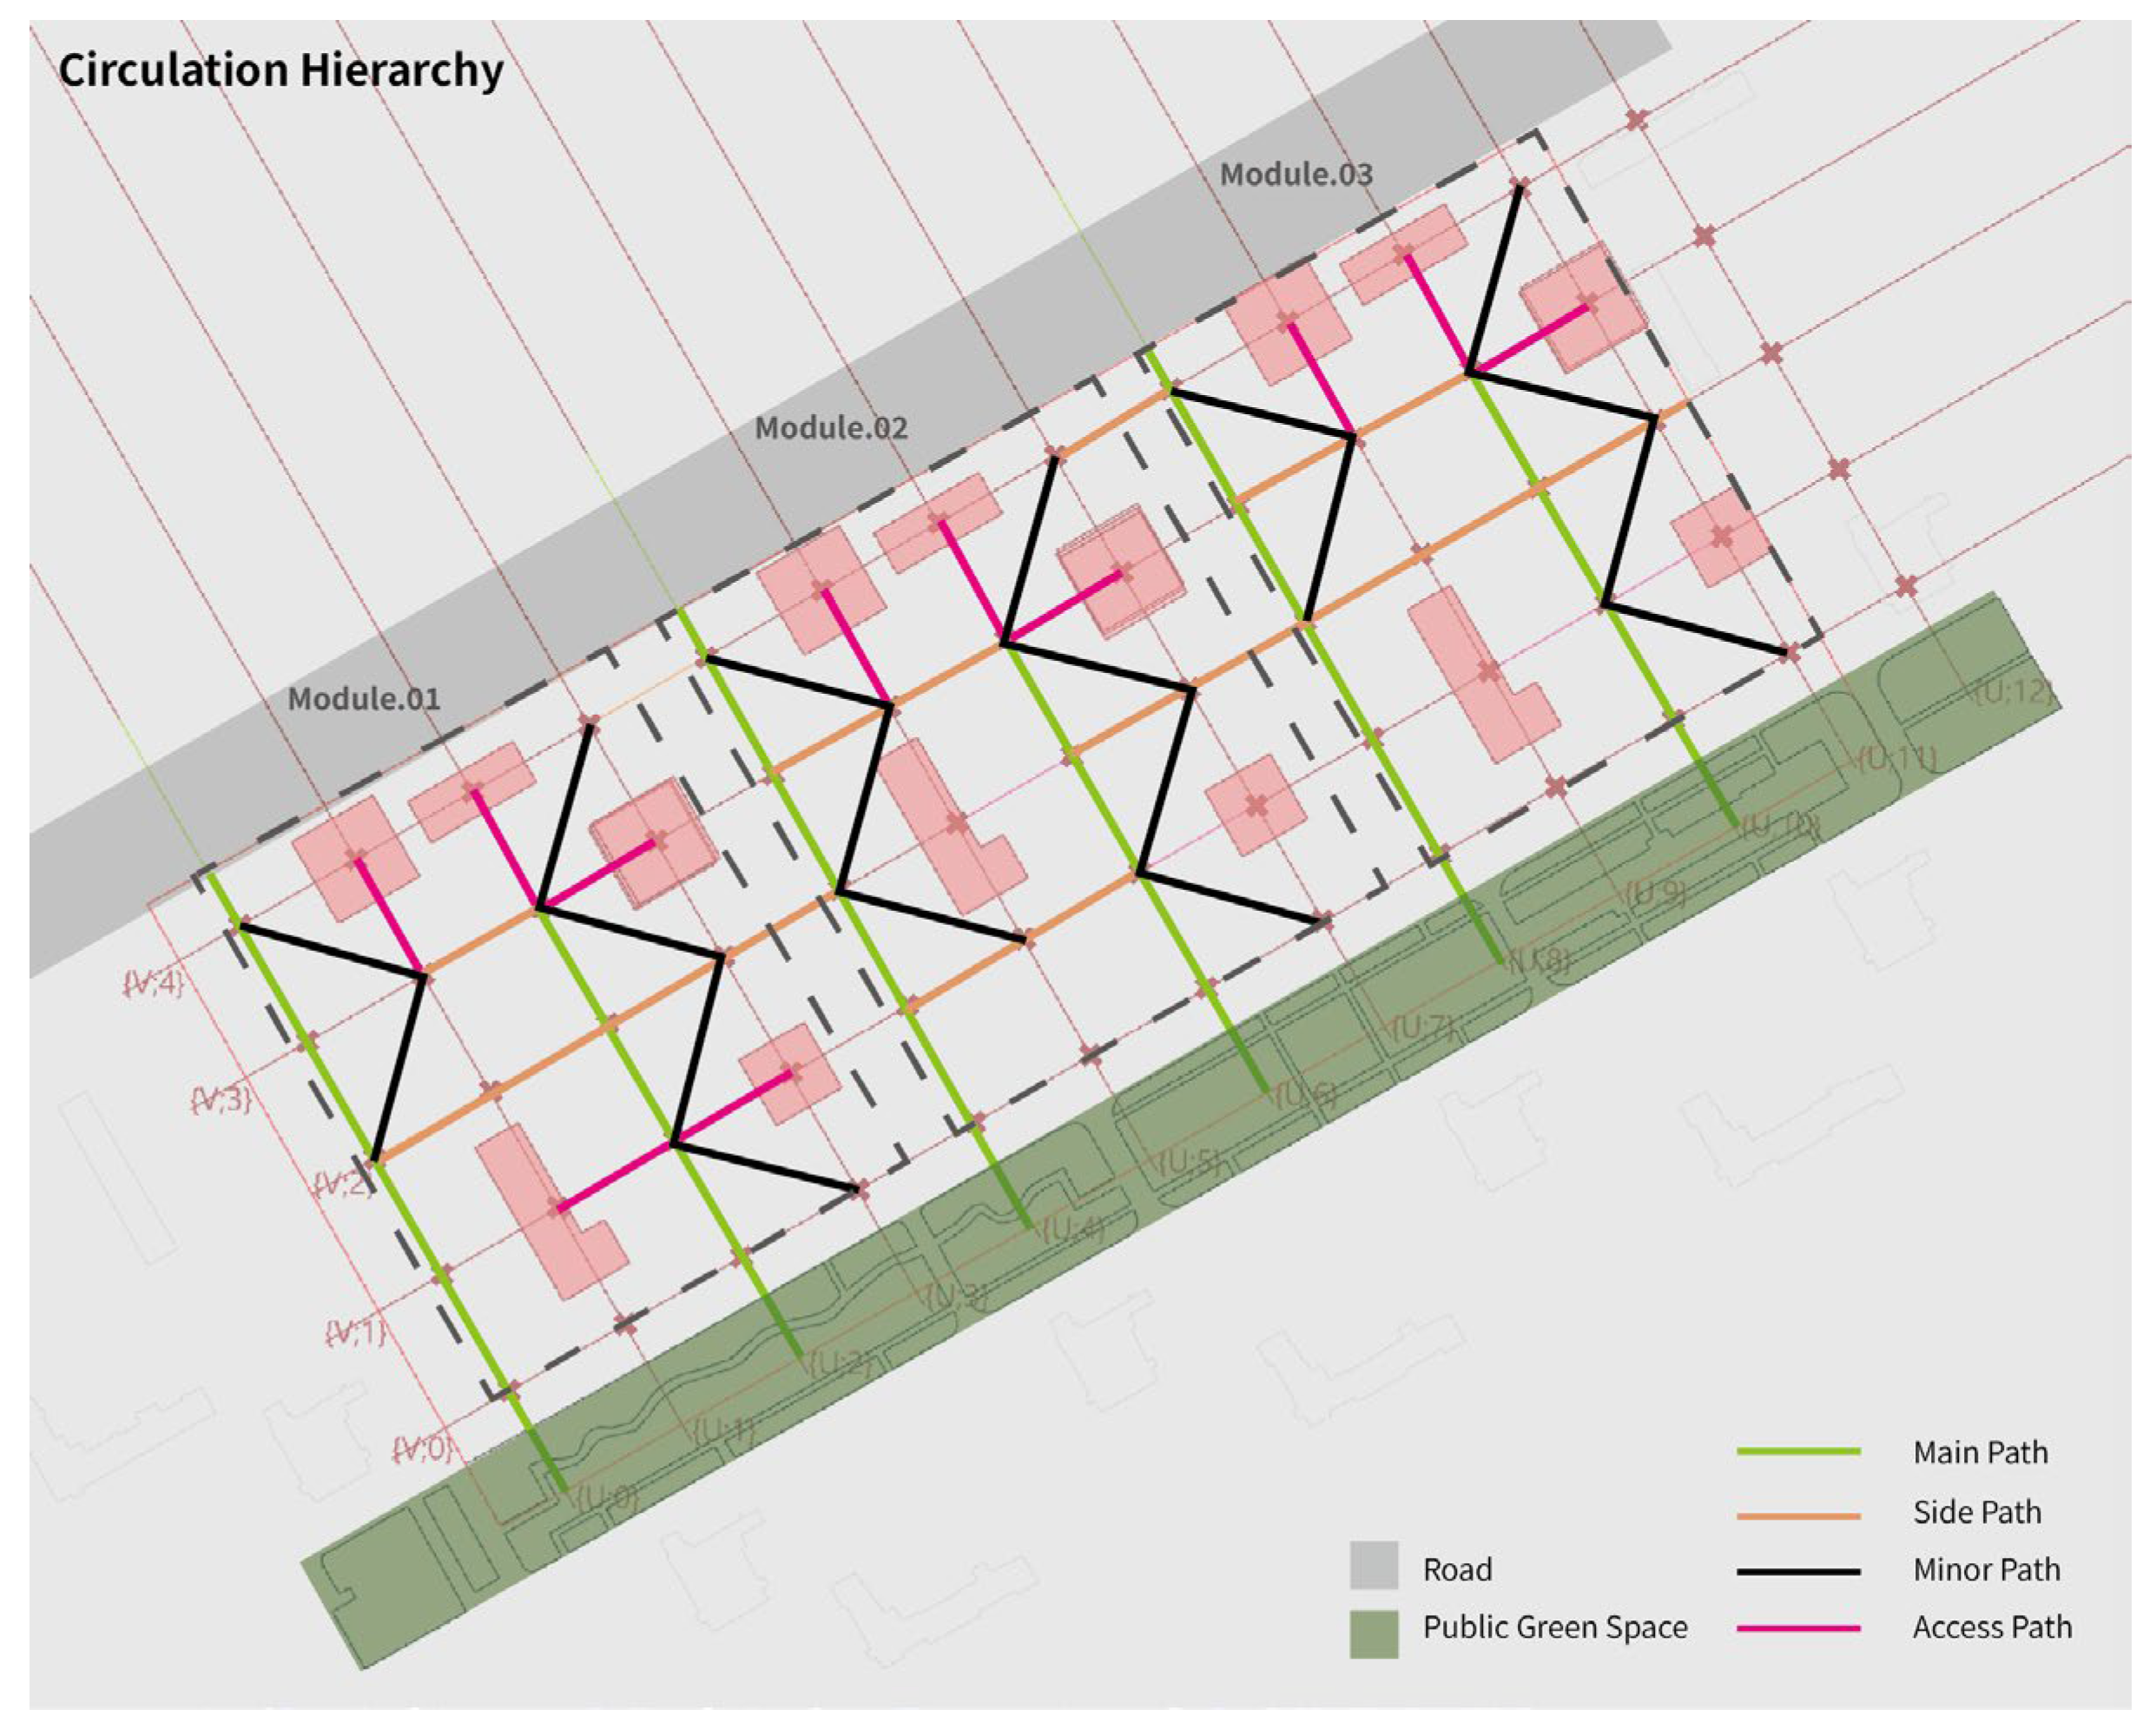
First, the primary circulation axis connecting external roads to the central green space within each module was defined as the Main Path. Next, the Side Path was established as a horizontal route running along the perimeter of each module. Both the Main Path and Side Path were designated as mixed-use corridors, accessible to both vehicles and pedestrians. Secondary circulation routes connecting the Main and Side Paths were defined as Minor Paths. These are pedestrian-only routes where vehicular access is restricted, and they represent the zones most vulnerable to privacy intrusion at the lower levels.
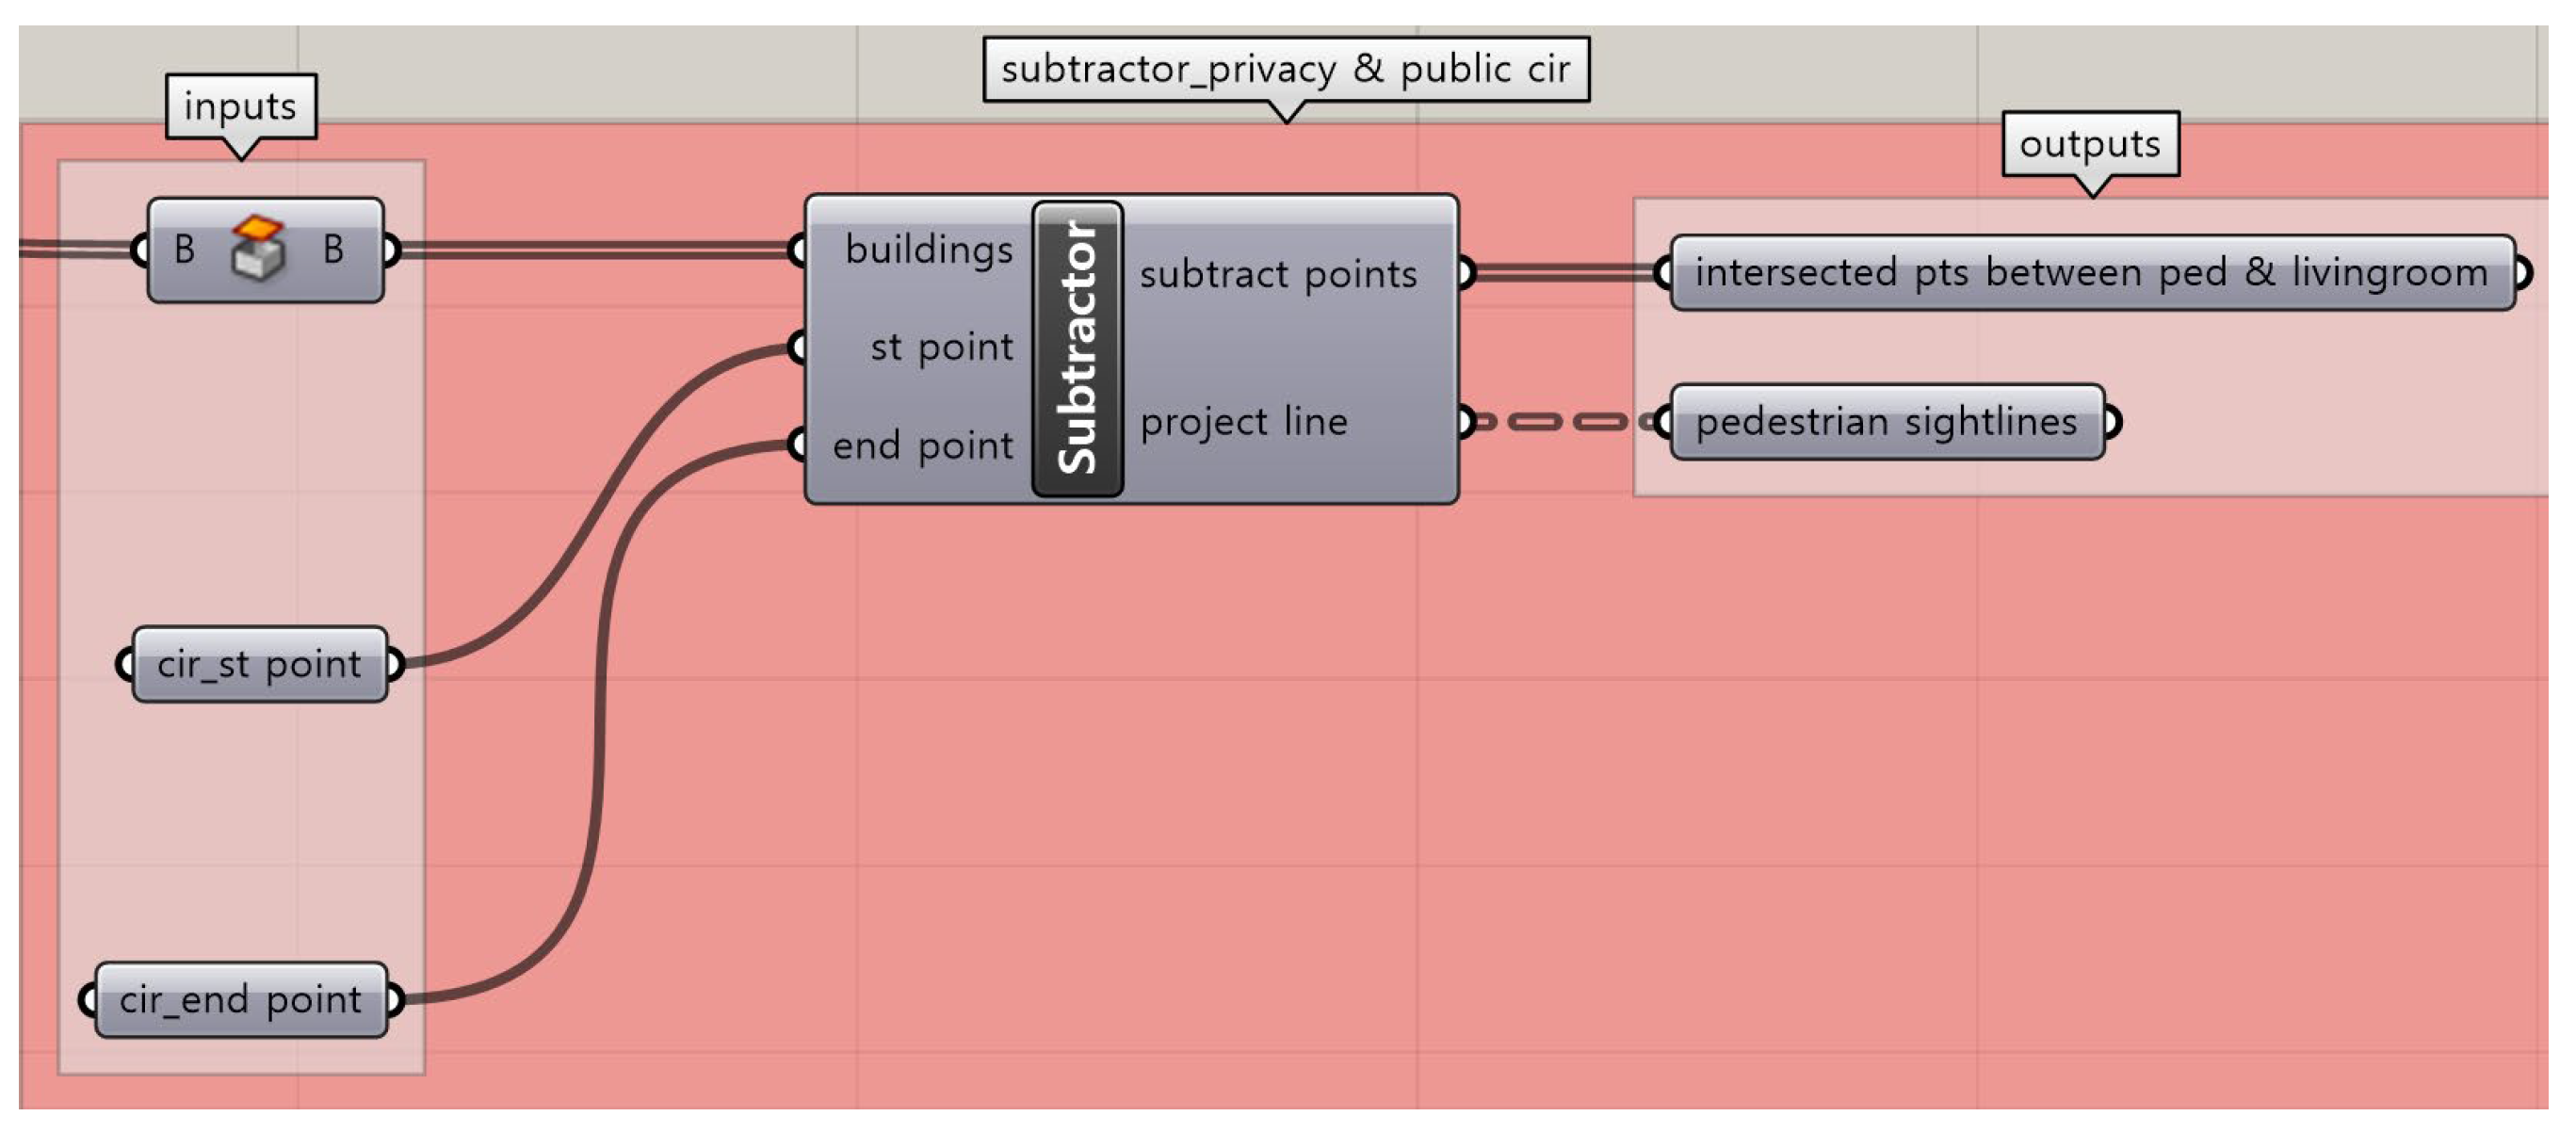
Finally, Access Paths were defined as the pedestrian-only connections from each circulation route to individual residential buildings. These are typically used exclusively by residents of the corresponding buildings (see Figure 20). The algorithmic structure implemented based on this circulation hierarchy is illustrated in Figure 21.

3.4.2. Optimization of Lower-Level Public Space

While Semi-Optimized Alternative 4 successfully achieved a 99.03% continuous sunlight access rate and improved visual openness to enhance the overall view environment, it lacked sufficient consideration of pedestrian-level conditions and associated privacy issues on the lower floors. To address this gap, the present study aimed to improve the pedestrian experience and privacy protection at the lower level by visualizing pedestrian sightlines at key path segmentation points within the circulation system (Figure 22).
Analysis of the pedestrian sightlines visualized in Figure 22 revealed specific lower-floor zones exposed to privacy intrusion. Among the 15 residential buildings, 13 were found to have lower-level spaces directly visible within pedestrian sightlines. These exposed areas were identified as being more suitable for public use rather than residential occupancy. By reconfiguring these lower-floor spaces into public pocket spaces, the design can simultaneously achieve two key objectives: (1) improvement of the pedestrian environment, and (2) protection of resident privacy. Additionally, this reallocation has the potential to resolve sunlight access issues for certain lower-floor units that previously failed to meet the continuous sunlight criteria.
The final optimized layout, Optimized Alt 4, is presented in Figure 23. In this scheme, the total number of residential units is 2056, reflecting an adjustment from the original 2076 units due to the conversion of 20 lower-floor units into public spaces. The floor area ratio (FAR) is 278.80%, and the building coverage ratio (BCR) is 21.10%, both remaining within legal limits. Most notably, the layout achieves a 100% continuous sunlight access rate, meaning that all residential units fully meet the sunlight requirements, representing an optimal outcome for environmental performance.

4. Design Optimization Comparison by Process

4.1. Comparison of Sunlight Environment Through Layout Optimization

Table 16 presents a comparison of the sunlight environment between the optimized layout (Alt 04) and the existing layout of Helio City Phase 3, highlighting the improvements achieved through layout optimization. Alt 04 reduced the number of residential buildings from 18 to 15, and increased the number of tower-type buildings from 4 to 9, while decreasing the proportion of hybrid-type buildings. This adjustment enhanced the efficiency of spacing between buildings, thereby maximizing the rate of continuous sunlight access. Although the floor area ratio (FAR) increased by approximately 33%, due to the higher building heights and corresponding increase in the number of residential units, it still remained within the legal limit of 300%, specifically at 278.80%.
Despite the reduction in the total number of buildings, the total floor area increased as each tower-type building accommodated more units per floor, resulting in a slight increase in the building coverage ratio (BCR) to 21.10%. Ultimately, Alt 04 achieved a layout in which almost all units secured more than two hours of continuous sunlight on the winter solstice, except for 20 lower-floor units, while fully satisfying both legal and environmental constraints. This result demonstrates that performance-based optimization is more effective than traditional distance-based placement strategies for ensuring sunlight access.

4.2. Comparison of View Environment Through Tower Form Optimization

Table 17 analyzes the effects of tower-type building form optimization on the visual openness, comparing the initial optimized layout (Alt 04) and the Semi-Optimized Alt 04 in which form optimization was applied. The analysis revealed that Semi-Optimized Alt 04 achieved an average visual openness approximately 1.5 to 1.6 times higher than that of Alt 04. In particular, the blind spots in the field of view that had occurred due to the centrally located tower-type buildings within each module were largely eliminated or reduced on both the lower and middle floors. On the upper floors, a 30.74% improvement in visual openness was observed compared to Alt 04, indicating a significant enhancement.
These findings suggest that meaningful improvements in view quality, which are difficult to achieve through layout changes alone, can be effectively realized through form-based optimization of tower-type residential buildings. For reference, the visual openness rates in the existing Helio City Phase 3 were 36.50% (lower floors), 36.92% (middle floors), and 45.02% (upper floors). Through layout optimization in Alt 04, these values were slightly improved by 6.58%, 6.66%, and 0.94%, respectively. Notably, for the upper floors, which already enjoyed a relatively favorable view environment, the improvement was marginal, indicating that layout adjustments alone are insufficient in such cases. In conclusion, this analysis demonstrates that enhancing visual openness is more effectively achieved through geometric modifications of the residential building forms—specifically, by aligning the orientation and visual field with the actual perspectives of residents—rather than merely increasing the distance or repositioning between buildings.
To assess the significance of the improved visual openness rates, a comparative analysis was conducted with the residential complex cases evaluated in the study by An et al. (2024), which applied a three-dimensional facade occlusion analysis method [19]. That study analyzed the average, maximum, minimum, and range (max–min) of facade occlusion ratios for three different types of residential complexes: slab-type, tower-type, and hybrid-type, with the following results (Table 18).
In slab-type complexes, the average facade occlusion ratio was 57%, with a maximum of 94.1%, a minimum of 21%, and a range of 73.1%, indicating generally high levels of visual obstruction. Tower-type complexes showed an average facade occlusion ratio of 60.4%, a maximum of 77.7%, a minimum of 34.6%, and a relatively narrow range of 43%, suggesting more uniform levels of occlusion. Hybrid-type complexes had an average of 60.3%, a maximum of 90.9%, a minimum of 27.1%, and a range of 63.8%.
To enable comparison, the results from the previous study were converted to visual openness rates by subtracting the facade occlusion ratio from 100%. When compared to the results of this study, several key patterns emerged. The pre-optimization average visual openness rate (39.48%) was comparable to or slightly lower than the previous averages for slab-type (43.0%), tower-type (39.6%), and hybrid-type (39.7%) complexes. However, the post-optimization average increased significantly to 66.31%, showing an improvement of over 23–27 percentage points across all types. This confirms that the optimization method applied in this study effectively enhanced visual openness across all typologies.
By floor level, the pre-optimization values—low-rise (36.50%), mid-rise (36.92%), and high-rise (45.02%)—all fell within the range of previous study values. After optimization, however, the low-rise (61.22%) and mid-rise (61.02%) levels were positioned near the upper bounds of the prior ranges, while the high-rise value (76.70%) approached the slab-type maximum (79.0%) and exceeded the maximums of both the tower-type (65.4%) and hybrid-type (72.9%) cases. This highlights the particularly substantial improvement in visual openness at the high-rise level.
When comparing the range between the highest and lowest values, the post-optimization high-rise value was either close to or exceeded the previous maximums for all types. The low- and mid-rise levels also surpassed the previous averages across all categories. Notably, the inter-floor variation increased from 8.52% before optimization to 15.68% afterward, indicating that the degree of improvement was relatively greater in high-rise units.
In summary, the optimization results presented in this study not only significantly improved the overall visual openness of the complex but also consistently exceeded the averages reported in previous cases and even surpassed the maximums in certain typologies. These findings suggest that the proposed analysis and optimization methodology holds strong potential for effectively enhancing visual openness in various types of high-density residential developments.

4.3. Comparison of Pedestrian Environment Through Lower-Floor Privacy Optimization

Table 19 summarizes the results of analyzing the effects of lower-floor privacy improvements on the overall pedestrian environment. In the final design scheme, Optimized Alt 04, the 20 lower-floor units that had failed to meet the continuous sunlight exposure requirement (at least 2 h) in Semi-Optimized Alt 04 were identified as vulnerable residences where visual interference between pedestrians and residents was likely to occur. These units were converted into public spaces, thereby simultaneously addressing both the insufficient daylight and privacy infringement issues on the lower floors.
As a result of this conversion, the overall continuous sunlight availability rate across the site was improved to 100%, and the slight reduction in density led to a minor decrease in floor area ratio (FAR). Although the total number of units was reduced by 20, resulting in 2056 units, this still exceeds the original Helio City Phase 3 total of 2026 units, indicating that the design remains within the target population range. This outcome demonstrates the effectiveness of the multi-objective optimization approach proposed in this study, in that it successfully minimizes privacy conflicts in the pedestrian environment while maintaining compliance with daylight performance standards across all units.

4.4. Comparison Between Existing Helio City Complex 3 and the Final Optimized Complex

Completed in 2018, Helio City is a large-scale apartment complex that features a central 1-km-long green park and employs varied building heights and forms to address daylight and view considerations to some extent. However, in practice, although the complex satisfies daylight regulations at a macro scale, disparities in sunlight and view conditions persist across different zones, buildings, and unit levels. In particular, Phase 3, located at the northern edge of the site and surrounded by other residential blocks, is structurally more vulnerable to insufficient sunlight, especially in lower-floor units exposed to permanent shadow zones.
To address this issue, the present study introduced a new building arrangement strategy to enhance the solar environment and adjusted the form of the central tower buildings to reduce visual obstruction, thereby improving view accessibility. Lastly, by restructuring pedestrian circulation paths, the design minimized visual interference between pedestrians and residents to enhance privacy in lower floors. The resulting final optimized residential model, which integrates all three environmental considerations—sunlight, view, and privacy—is compared with the existing Helio City Phase 3 across key physical and environmental indicators, as summarized in Table 20.
In the case of the existing Helio City Phase 3, more than 86 units failed to meet the legal daylight requirement of two consecutive hours of direct sunlight on the winter solstice. In contrast, the optimized residential model successfully ensured that all units satisfied the daylight requirement, improving the daylight performance from 64.31% to 100%, a 35.69 percentage point increase. Significant improvements were also observed in terms of view access. The average Visual Openness Ratio (VOR) for the low-, mid-, and high-rise levels in the existing complex was only 39.48%. However, in the optimized model, form adjustments to the central tower buildings reduced the obstructed visual area caused by adjacent blocks, resulting in an average VOR of 66.31%—a 26.83 percentage point improvement over the original design.
Additionally, 20 units previously subject to privacy interference due to visual overlap with pedestrian pathways were converted into public spaces, simultaneously improving pedestrian circulation and residential privacy. This spatial reallocation contributed to mitigating the environmental vulnerability of lower floors. Overall, the optimized residential model provided enhanced living conditions in terms of daylight access, view quality, and privacy, while also increasing the total number of units from 2026 to 2056, effectively accommodating 30 additional households.
The conversion of 20 ground-floor units to public pocket spaces carries both opportunities and challenges. While this reduces the total residential capacity slightly (from 2076 to 2056 units), it creates approximately 600 m2 of new community spaces that can accommodate amenities such as senior centers, childcare facilities, or retail spaces. This transformation could potentially increase property values for remaining units through enhanced privacy and improved pedestrian environments. However, economic feasibility would require detailed cost-benefit analysis considering lost residential revenue versus potential commercial income and increased property values. The social benefits include enhanced community interaction spaces and improved quality of life for elderly residents who prefer ground-floor access but value privacy.

5. Conclusions

5.1. Research Conclusion and Contribution

This study established a multi-objective optimization framework targeting three critical aspects of residential environments—daylight access, visual openness, and ground-level privacy—and applied it to Helio City Phase 3 in Jamsil. Through the sequential application of performance-specific algorithms tailored to each environmental component, the research quantitatively evaluated the improvement outcomes at each optimization stage.
Firstly, layout optimization yielded the most significant improvement in daylight performance. Specifically, increasing the proportion of high-rise tower-type buildings proved effective in maximizing continuous sunlight exposure. The optimized alternative, Alt 04, resulted in a 34.72 percentage point increase in daylight access compared to the existing layout, ensuring at least two hours of continuous sunlight for all units above the 4th floor.
In terms of view optimization, modifying the form of tower buildings based on residents’ eye-level perspectives produced greater improvements than layout changes alone. While layout modification led to an average improvement of 4.73% in the Visual Openness Ratio (VOR), form-based optimization achieved an increase of 26.83%, representing an additional enhancement of approximately 22.1 percentage points. These findings underscore the importance of precisely adjusting building massing to improve residents’ perceived spatial quality.
Regarding privacy optimization at lower levels, the study redefined the external circulation hierarchy and converted vulnerable ground-floor units into public spaces to mitigate line-of-sight conflicts between pedestrians and residents. As a result, privacy interference was resolved in 66 out of 86 previously affected units, while the remaining 20 units were repurposed as shared community spaces, effectively eliminating the issue.
In summary, this study confirms that beyond conventional layout modifications, strategies involving building form manipulation and strategic public space allocation are highly effective in enhancing residential environmental quality. Furthermore, the research demonstrates the feasibility of a sequential, non-interfering multi-objective design process, conceptualized as an inverted-triangle framework, which enables the independent yet integrated assessment of diverse performance criteria. This approach contributes a methodologically rigorous and quantifiable model for multi-objective design optimization in high-density residential planning.
The structural significance of the methodology proposed in this study lies in its modular and sequential framework, which distinguishes it from previous multi-objective optimization approaches. For instance, Zhang et al. (2025) employed an NSGA-III-based evolutionary algorithm to optimize Urban Air Mobility (UAM) route design by simultaneously considering three performance indicators: safety, efficiency, and cost [25]. Similarly, Di Loreto et al. (2025) developed a quantitative performance evaluation model using Support Vector Machines (SVM), based on 17 sustainability indicators, and proposed an integrated scoring system for inter-city comparisons [26]. In contrast, this study modularizes and separates each performance factor into distinct phases and visualizes the influence of one factor on another by quantifying their interrelationships. This enables a direct understanding of the trade-offs among objectives. Consequently, designers can interpret the results at each stage and make informed design decisions throughout the optimization process. For example, the impact of a building layout optimized for daylight access on view performance can be evaluated through changes in the Visual Openness Ratio (VOR), allowing the designer to selectively adopt layout alternatives accordingly.
Moreover, the proposed framework is inherently generalizable through the redefinition of performance targets and the reprioritization of objective relationships. Depending on local or policy-driven priorities, the performance variables can be extended or replaced with other environmental criteria such as thermal comfort, natural ventilation, or ecological connectivity. Quantitative simulation-based assessments can also be adapted to incorporate specific geographic and sociocultural contexts of various urban environments.
Furthermore, the modular framework can be integrated with parallel multi-objective optimization algorithms such as NSGA-III, allowing the system to evolve into a multi-criteria decision-making process that simultaneously considers more than three performance objectives. NSGA-III, in particular, offers a unique advantage by generating diverse solution sets without assigning hierarchical superiority among objectives, making it highly compatible with the modular logic of this study. Through such integration, the limitations of traditional sequential optimization—namely, the lack of a unified optimal solution—can be mitigated. Designers are thereby empowered to explore a range of Pareto-optimal alternatives at each stage, enabling an interactive and flexible design process grounded in intuitive decision-making.

5.2. Generalizability and Broader Applications

The multi-objective optimization framework developed in this study demonstrates significant potential for application beyond the specific context of Seoul’s high-density residential complexes. The modular and sequential structure allows for flexible adaptation to diverse urban contexts, regulatory environments, and cultural preferences. By adjusting performance targets and recalibrating optimization parameters, the framework can accommodate varying priorities across different geographical and socio-economic settings.
For international applications, the framework’s three core modules—sunlight optimization, view enhancement, and privacy protection—can be weighted differently according to regional priorities. In tropical climates, for instance, the sunlight module could be inverted to minimize solar heat gain while maximizing natural ventilation. In European contexts with strict energy efficiency requirements, the framework could integrate thermal performance as an additional optimization layer. Similarly, in North American suburban developments with lower densities, the privacy module could be adapted to address visual intrusion from street traffic rather than pedestrian pathways.
The framework’s scalability extends from individual building clusters to district-level master planning. At smaller scales, it can optimize courtyard housing or perimeter block configurations common in European cities. At larger scales, it can inform policy-making by quantifying the environmental trade-offs of different zoning regulations. For instance, cities considering increases in allowable floor area ratios could use this framework to predict and mitigate potential negative impacts on residential environmental quality.
Methodologically, the framework can be enhanced through integration with emerging technologies. Machine learning algorithms could replace or supplement genetic algorithms, potentially reducing computation time while improving solution quality. Building Information Modeling (BIM) integration would enable more detailed performance analysis, including structural and MEP (Mechanical, Electrical, Plumbing) system optimization. Real-time sensor data from existing buildings could calibrate simulation parameters, improving prediction accuracy for future developments.
The framework also offers valuable applications for urban regeneration projects. Many cities face the challenge of upgrading aging residential complexes without complete demolition. By applying this optimization framework to existing buildings, planners can identify targeted interventions—such as selective building removal, height adjustments, or facade modifications—that maximize environmental improvements while minimizing disruption to residents. The conversion of ground-floor units to public spaces, as demonstrated in this study, represents just one of many possible retrofit strategies.
Furthermore, the framework contributes to evidence-based policy development. By quantifying the relationship between regulatory parameters (setback requirements, height limits, coverage ratios) and environmental outcomes (sunlight access, visual openness, privacy), it provides policymakers with data-driven insights for updating building codes. This is particularly relevant as cities worldwide grapple with housing affordability crises that often necessitate higher densities without compromising livability.
In conclusion, while developed for Seoul’s specific context, this framework offers a transferable methodology for addressing universal challenges in high-density residential design. Its modular structure, parametric flexibility, and quantitative approach provide a foundation for creating more livable, sustainable, and equitable urban environments across diverse global contexts. Future collaborative research across different cities and climates will further refine and validate the framework’s broader applicability.

6. Limitations and Future Work

A critical limitation is the absence of post-occupancy evaluation (POE) data to validate the simulated improvements. While our optimization achieved 100% sunlight compliance and 66.31% visual openness computationally, actual resident satisfaction may differ due to subjective preferences, cultural factors, and behavioral patterns not captured in physical simulations. Future research should conduct longitudinal POE studies comparing pre- and post-optimization scenarios to validate the practical benefits of the proposed framework.
This study primarily focused on the quantitative, simulation-based analysis of physical performance indicators and therefore did not sufficiently incorporate subjective user satisfaction or social–behavioral dimensions. In particular, the performance criteria for daylight, view, and privacy were derived from expert-defined standards. Accordingly, future research should integrate qualitative data that reflects residents’ perceptions, satisfaction levels, and spatial experiences. A mixed-method approach—including surveys, interviews, and behavioral observations—is recommended to complement and contextualize the current findings.
The practical implementation of the proposed optimization framework faces several real-world constraints not fully addressed in this study. First, the core modulation strategy in tower buildings would require structural engineering validation and may incur 15–20% higher construction costs due to non-standard formwork and additional structural reinforcement. Second, regulatory approval for variable core positions may face challenges under current building codes. Third, the optimization process assumes greenfield development, whereas most urban projects involve complex stakeholder negotiations and existing site constraints. Fourth, considerations such as construction phasing, temporary resident relocation, and market conditions significantly impact feasibility. Future research should incorporate cost modeling, structural feasibility analysis, and stakeholder preference frameworks to enhance practical applicability.
Moreover, the proposed multi-objective optimization process treated each environmental factor as an independent single-objective function applied sequentially. As a result, trade-offs and relative weightings between competing performance metrics could not be internally balanced within the algorithmic structure. This limitation reflects the inherent constraints of the Galapagos genetic algorithm utilized in this study. Future research should consider employing advanced multi-objective optimization algorithms capable of concurrently evaluating multiple conflicting objectives, such as NSGA-II, SPEA2, or other Pareto-based evolutionary strategies.
Lastly, this study concentrated on static spatial parameters, including the placement of residential blocks, building geometries, and public space allocation. Consequently, it did not account for temporal dynamics in pedestrian activities or the changing use patterns of space throughout the day. In particular, variations in pedestrian flow and space utilization—especially in lower-level zones—were not fully captured. Future research could explore adaptive or time-responsive pocket spaces that respond to the evolving needs of both residents and visitors. The development of a spatio-temporal dynamic planning framework to support such strategies is proposed as a key direction for subsequent investigations.

Author Contributions

Conceptualization, H.-J.K.; Methodology, H.-J.K., M.-J.K. and Y.-B.J.; Computational Algorithm Implementation and Performance Evaluation, M.-J.K. and Y.-B.J.; Investigation, H.-J.K., M.-J.K. and Y.-B.J.; Writing and Editing, H.-J.K., M.-J.K. and Y.-B.J. All authors have read and agreed to the published version of the manuscript.

Funding

The present research was supported by the research fund of Dankook University in 2024.

Data Availability Statement

The data supporting the findings of this study are available from the corresponding author upon reasonable request.

Acknowledgments

All figures and tables are created by authors unless otherwise noted.

Conflicts of Interest

The Authors declare no conflict of interest.

References

  1. Kim, D. A Study on the Changes and Planning Characteristics of Apartment Buildings and Unit Housing Types: Focusing on Apartment Complexes Supplied in the Gwangju Area in the Early 2000s. Master’s Thesis, Chonnam National University, Gwangju, Republic of Korea, 2016. Available online: https://www.dbpia.co.kr/journal/detail?nodeId=T14052816 (accessed on 18 March 2025).
  2. Woo, S. A Comparative Study on Residential Complex Planning in the 1970s and 2000s: Focusing on Jamsil Complexes 1–4. Master’s Thesis, University of Seoul, Seoul, Republic of Korea, 2006. Available online: https://www.riss.kr/search/detail/DetailView.do?p_mat_type=be54d9b8bc7cdb09&control_no=76524fbd1576cb8cffe0bdc3ef48d419 (accessed on 18 March 2025).
  3. Lee, S. A Study on the Changes and Factors of Layout and Building Typology in Apartment Complexes in Busan. Master’s Thesis, Seoul National University, Seoul, Republic of Korea, 2019. Available online: https://www-dbpia-co-kr.libproxy.dankook.ac.kr/journal/detail?nodeId=T15399495 (accessed on 18 March 2025).
  4. Lee, J. A Study on the Daylight Condition of the Apartment Houses: Focused on the Comparative Analysis of the Daylight Condition Between the Plank Type and Tower Type Apartment Complex. J. Korea Acad.-Ind. Coop. Soc. 2007, 8, 121–129. Available online: https://koreascience.kr/article/JAKO200714539084409.page (accessed on 12 November 2024).
  5. Hwang, H.; Lee, J. The Estimation of Environmental Performance in Domestic Buildings by the Indicator of Sunshine and Openness: Focusing on Tower-Type Apartment Houses. J. Archit. Inst. Korea Plan. Des. 2005, 21, 319–326. Available online: https://www.kci.go.kr/kciportal/ci/sereArticleSearch/ciSereArtiView.kci?sereArticleSearchBean.artiId=ART000977469 (accessed on 12 November 2024).
  6. Mok, E.; Kang, B. A Study on the Planning of the Lower Part of the Apartment Building through Residents’ Preference Survey. In Proceedings of the Autumn Conference of the Architectural Institute of Korea; Architectural Institute of Korea: Seoul, Republic of Korea, 2016; Volume 36, pp. 197–202. Available online: https://www.auric.or.kr/user/rdoc/DocRdoc.aspx?returnVal=RD_R&dn=342800 (accessed on 12 November 2024).
  7. Wang, S.; Yi, Y.K.; Liu, N. Multi-objective optimization (MOO) for high-rise residential buildings’ layout centered on daylight, visual, and outdoor thermal metrics in China. Build. Environ. 2021, 205, 108263. [Google Scholar] [CrossRef]
  8. Xia, B.; Li, Z. Optimized Methods for Morphological Design of Mesoscale Cities Based on Performance Analysis: Taking the Residential Urban Blocks as Examples. Sustain. Cities Soc. 2021, 64, 102489. [Google Scholar] [CrossRef]
  9. Park, C. A Study on the Design of Dwellings-on-Ground in the Flat Housing Estate. J. Archit. Inst. Korea 1994, 10, 101–111. Available online: https://www.dbpia.co.kr/journal/articleDetail?nodeId=NODE00359542 (accessed on 22 November 2024).
  10. Kim, J.; Kim, K. A Comprehensive Plan of Jamsil District in 1974: Its Implications and Characteristics for Future Urban Planning. J. Urban Des. Inst. Korea 2010, 11, 51. Available online: https://www.dbpia.co.kr/journal/articleDetail?nodeId=NODE02170428 (accessed on 23 November 2024).
  11. Kim, H.-J.; Choi, W.-S.; Kim, J.-W. A Study on Parametric Design Tool for Residential Buildings Securing Valid Sunlight Hours on the Winter Solstice. J. Asian Archit. Build. Eng. 2022, 21, 1657–1676. [Google Scholar] [CrossRef]
  12. Building Act, Article 53; Ministry of Land, Infrastructure and Transport: Sejong City, Republic of Korea, 2024.
  13. Enforcement Decree of Building Act, Article 86; Ministry of Land, Infrastructure and Transport: Sejong City, Republic of Korea, 2024.
  14. Kim, H.-J.; Kim, K.-H. A Design Methodology for Street-Oriented Block Housing with Optimization of Natural Daylight. J. Archit. Inst. Korea Plan. Des. 2015, 31, 319. Available online: https://www.dbpia.co.kr/journal/articleDetail?nodeId=NODE06298908 (accessed on 3 December 2024).
  15. Seo, J.; Lee, J. An Analysis of Right to Have Sunshine and View of Flat-Type and Tower-Type Apartment. In Proceedings of the Annual Conference of the Architectural Institute of Korea; Architectural Institute of Korea: Seoul, Republic of Korea, 2019; Volume 39, pp. 790–791. Available online: https://www-dbpia-co-kr.libproxy.dankook.ac.kr/journal/articleDetail?nodeId=NODE09290160 (accessed on 22 October 2024).
  16. Seo, J.; Kim, S.; Lee, J. A Quantitative Analysis on Right to Have Sunshine and View of Flat-Type and Tower-Type Apartments. J. Archit. Inst. Korea 2020, 36, 109–114. Available online: https://www-dbpia-co-kr.libproxy.dankook.ac.kr/journal/articleDetail?nodeId=NODE09382196 (accessed on 10 November 2024).
  17. Jung, J.; Kim, S. A Study on the Analysis Technique and Evaluation Method of the View from Inner Side of Apartment Housing at the Planning Stage of Layout. J. Archit. Inst. Korea Plan. Des. 2010, 26, 261–270. Available online: https://www-dbpia-co-kr.libproxy.dankook.ac.kr/journal/articleDetail?nodeId=NODE01541251 (accessed on 5 January 2025).
  18. Oh, S.; Kim, Y. A Study on the Correlation between View and Planning Factors in Apartment Housing. J. Archit. Inst. Korea Plan. Des. 2013, 29, 225–234. Available online: https://www-dbpia-co-kr.libproxy.dankook.ac.kr/journal/articleDetail?nodeId=NODE02120945 (accessed on 3 January 2025).
  19. An, S.; Lee, C.; Lim, J.H. A Study on Comparative Analysis of Residential Complex Openness through Automated Analysis of Enclosure Ratios: Focusing on Types of Large Apartment Complexes in Seoul. J. Urban Des. Inst. Korea 2024, 25, 5–24. Available online: https://www-dbpia-co-kr.libproxy.dankook.ac.kr/journal/articleDetail?nodeId=NODE11958875 (accessed on 25 October 2024). [CrossRef]
  20. Shin, K.; Kim, M.; Song, K. Developing a Method to Evaluate View Levels of Apartment Buildings. J. Archit. Inst. Korea Plan. Des. 2004, 24, 1095–1098. Available online: https://www-dbpia-co-kr.libproxy.dankook.ac.kr/journal/articleDetail?nodeId=NODE00773794 (accessed on 12 November 2024).
  21. Zheng, H.; Wu, B.; Wei, H.; Yan, J.; Zhu, J. A Quantitative Method for Evaluation of Visual Privacy in Residential Environments. Buildings 2021, 11, 272. [Google Scholar] [CrossRef]
  22. Robinson, D.; Stone, A. Solar radiation modelling in the urban context. Sol. Energy 2004, 77, 295–309. [Google Scholar] [CrossRef]
  23. McNeil, A.; Lee, E.S. A validation of the Radiance three-phase simulation method for modelling annual daylight performance of optically complex fenestration systems. J. Build. Perform. Simul. 2012, 6, 24–37. [Google Scholar] [CrossRef]
  24. Hu, Z.; Zhang, L.; Shen, Q.; Chen, X.; Wang, W.; Li, K. An Integrated Framework for Residential Layout Designs: Combining Parametric Modeling, Neural Networks, and Multi-Objective Optimization for Outdoor Activity Space Optimization. Alex. Eng. J. 2023, 80, 202–216. [Google Scholar] [CrossRef]
  25. Zhang, Z.; Zheng, Y.; Li, C.; Jiang, B.; Li, Y. Designing an Urban Air Mobility Corridor Network: A Multi-Objective Optimization Approach Using U-NSGA-III. Aerospace 2025, 12, 229. [Google Scholar] [CrossRef]
  26. Di Loreto, S.; Sangiorgio, V.; Bagagli, M.; Montelpare, S. Multi-criteria approach for the energy and environmental impact evaluation in urban districts in the central Mediterranean area. Sustain. Cities Soc. 2025, 120, 106179. [Google Scholar] [CrossRef]
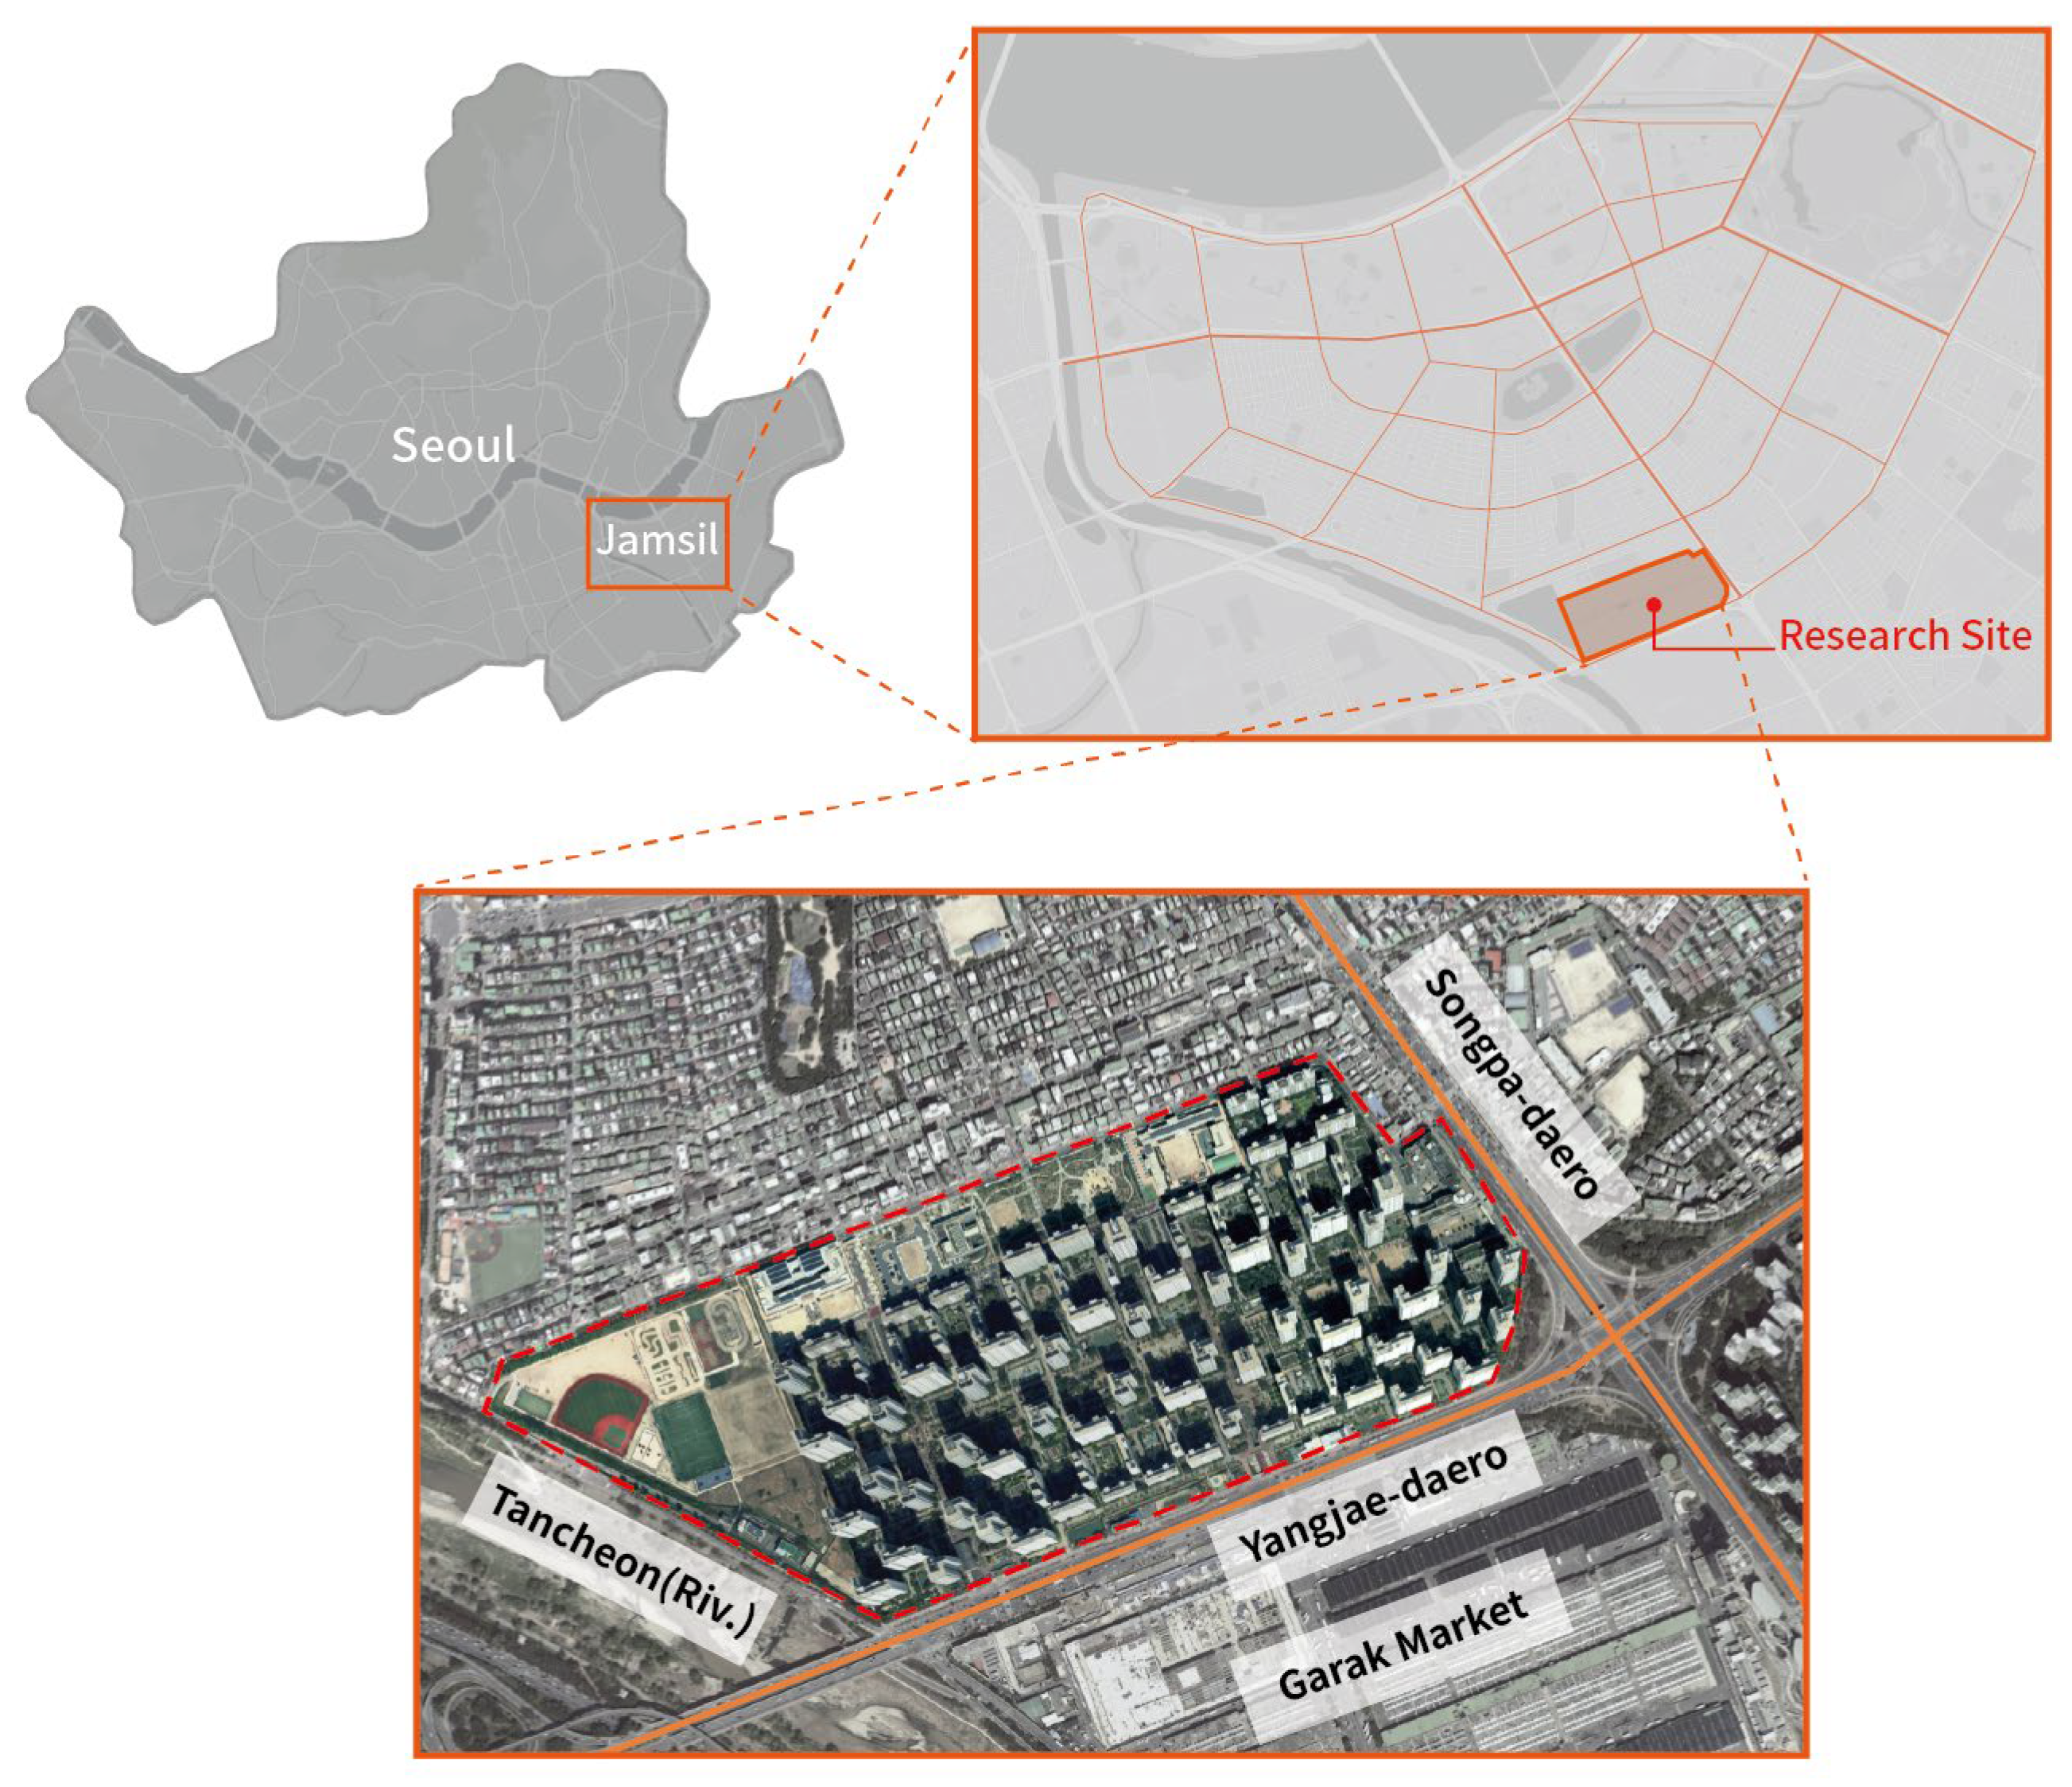
Figure 1. Location and enlarged map of Research Site in Seoul.
Sustainability 17 07490 g001
Figure 2. Surrounding environment and complex layout of Helio City.
Sustainability 17 07490 g002
Figure 3. The composition of Helio City Complex 3.
Sustainability 17 07490 g003
Figure 4. Directional sampler configuration.
Sustainability 17 07490 g004
Figure 5. Illustration of discrete facade occlusion reconstruction.
Sustainability 17 07490 g005
Figure 6. Criteria for determining privacy-vulnerable zones.
Sustainability 17 07490 g006
Figure 7. Sequential frames of observer movement (10 frames).
Sustainability 17 07490 g007
Figure 8. Visualization of the site’s sunlight environment on winter Solstice.
Sustainability 17 07490 g008
Figure 9. Visualization of the site’s low-rise environment.
Sustainability 17 07490 g009
Figure 10. Overall algorithm structure.
Sustainability 17 07490 g010
Figure 11. Grid setup.
Sustainability 17 07490 g011
Figure 12. Standards for module.
Sustainability 17 07490 g012
Figure 13. Algorithm for module crafting.
Sustainability 17 07490 g013
Figure 14. Placement rule set.
Sustainability 17 07490 g014
Figure 15. Specifications for sunlight condition of Alt01–04.
Sustainability 17 07490 g015
Figure 16. Core specifications.
Sustainability 17 07490 g016
Figure 17. Range of tower type apartment.
Sustainability 17 07490 g017
Figure 18. Optimization algorithm of visual openness.
Sustainability 17 07490 g018
Figure 19. Analysis of vertical deformation patterns by reference floor.
Sustainability 17 07490 g019
Figure 20. Circulation Hierarchy in Outdoor Spaces.
Sustainability 17 07490 g020
Figure 21. Algorithm of Forming Low-Rise Public Pocket Space.
Sustainability 17 07490 g021
Figure 22. Privacy-Infringed Zones in the Lower Floors.
Sustainability 17 07490 g022
Figure 23. Pocket space irreplacable by public areas.
Sustainability 17 07490 g023
Table 1. Review of previous studies on multi-objective optimization and living conditions.
ResearcherResearch TopicsSubjects of Analysis
Mok Eui Kyun, Kang Boo Seong (2016) [6]Exploring the Spatial Potential of Lower-Floor Areas through a Survey of Low-Rise Housing ResidentsLower-Floor Residential Spaces
ShanShan Wang a, Yun Kyu Yi b, NianXiong Liu (2021) [7]A Case Study on Multi-Objective Environmental Improvement Strategies in High-Rise Residential ComplexesHigh-Rise Residential Buildings
Bing Xia a, Zhihao Li (2021) [8]Optimization of Residential Modules Based on the Environmental Impact of Urban Block ConfigurationsResidential Block Configurations
Park Chan Kyu (1994) [9]Analyzing the Relationship between Residential Floor Level and Occupant SatisfactionEnvironmental Conditions of Lower-Level Residences
Table 2. The overview of the entire Helio City complex and district Complex 3.
Helio City in GeneralHelio City Complex 3
Sunlight Compliance Rate (%) 64.31%
Building Height10–35F13–35F
Number of households95102026
Site area346,570.50 m266,841.31 m2
Gross floor area (GFA)1,563,335.17 m2170,814.45 m2
Floor area ratio (FAR)285.98%255.5%
Building coverage ratio (BCR)19.42%17.09%
Table 3. Viewpoint and target view.
Criteria for Selecting ViewpointsTarget Views and Privacy-Infringed Areas
Viewpoint: Visual experience from the living room
(The most actively used space within the residential unit)
Target Views: External landscapes
Obstructive Elements: Adjacent buildings
Field of View for View Evaluation: 180° horizontal angle
(Assuming the resident is observing the external landscape from the living room)
Visual Obstruction Threshold: 450 m
(Objects beyond 450 m are considered outside the middle-depth perception range)
Table 4. Open rate evaluation indicators.
IndicatorsCalculation
Facade-Based CriteriaFacade Area (A)
A = H × D
    -
H = Height of the building
    -
D = Straight-line length of the building wall (along the viewing direction)
Facade Obstruction IndexFacade Obstruction Index
Facade Obstruction Index = ΣA/L
    -
ΣA = Sum of the projected facade areas in the view direction
    -
L = Longest dimension of the residential complex (site length)
Facade Building Coverage RatioFacade Building Coverage Ratio
Facade BCR = Σ(Deq × H)/Site Area
    -
Deq = Equivalent diameter of each residential block
    -
H = Height of each residential block
    -
Site Area = Total area of the site
View Obstruction RatioView Obstruction Ratio
View Obstruction Ratio = (Projected Facade Area/Total View Area) × 100
    -
Projected Facade Area = Visible facade area from the viewpoint
    -
Total View Area = Available view area from the same viewpoint
Table 5. Representative sampling and discrete facade occlusion.
IndicatorsDefinitionDescription
Representative Sampling by FloorVf: visible area from floor f
(where f ∈ {4,11,21})
Directional Sampler S = {V4, V11, V21}
(A column of units at the same stack position)
The average openness of a sampler S:
VORS = 1/3 [VOR4F + VOR11F + VOR21F]
Lower Floor (4F):
Minimize eye-level interference with pedestrians (instead of 1F)
Middle Floor (11F):
Represent middle zone visibility
Upper Floor (21F):
Represent middle zone visibility
Discrete Reconstruction of Facade Occlusion PatternsPf: projection line of visible area Vf at floor f onto facade coordinate x
S = {s4F, s11F, s21F}: Start points of Pf
E = {e4F, e11F, e21F}: End points of Pf
Discrete Facade Occlusion:
DFOx = Polygon((x, s4F), (x, s11F), (x, s21F), (x, e21F), (x, e11F), (x, e4F))
Process01. Projection:
Project each floor’s visible area result vertically onto a single facade line
Process02. Alignment:
Connect the projected obstruction points across 4F, 11F, and 21F
Process03. Patterning:
Reconstruct a continuous facade obstruction pattern from discrete samples
Table 6. Criteria for refined visual openness ratio.
IndicatorsCalculation
Visual Openness Ratio (VOR)B/A × 100
A: Total horizontal semicircular field of view area within a 450-m radius × number of living rooms per selected floor
B: Sum of visible area (excluding obstructed areas) for each living room on the selected floor
Table 7. Viewpoint and vertical grades.
ViewpointVertical Vision Grades
Viewpoint: Pedestrian pathway intersections
(Based on pedestrian circulation within the apartment complex)

Maximum Horizontal Field of View: 120°
(Reflecting the typical human visual field)
DegreeGrade
30A
30–45B
45–60C
60–75D
75-E
Table 8. PVEI of previous study.
FloorRelative PVEI (%)Decrease Compared to 1st Floor
1F100%0%
2Fapproximately 85%−15%
3Fapproximately 72%−28%
4Fapproximately 55%−45%
5Fapproximately 42% −58%
6Fapproximately 30%−70%
Table 9. Pedestrian circulation and the privacy boundary between pedestrian and lower floors.
Pedestrian Circulation & Privacy Range
Circulation Within the ComplexPrivacy Zones
(Intersection of Views & Buildings)
Continuous Positional Change
(10 frames)
Sustainability 17 07490 i001Sustainability 17 07490 i002Sustainability 17 07490 i003
Table 10. Unit layouts comprising Complex 3.
Housing Types and Living Room Layouts
Sustainability 17 07490 i004
Table 11. Status of securing the amount of sunlight received by the complex.
Sunlight Hours Analysis Results
Building Identification Number301302303304305306307308309310311312313314315316317318
0−1 h (254)2600266821051340011152000
1−2 h (464)224825232516135951535201620831713
2−3 h (441)002247624232141916555564332203
3−4 h (227)0016440227101048194272945
≥4 h (640)00374310716000076469256514877
Table 12. Site’s view environment by floor.
Results of Visual Openness Analysis
Lower Floor (4F)_36.50%Middle Floor (11F)_36.92%High Floor (21F)_45.02%
Sustainability 17 07490 i005Sustainability 17 07490 i006Sustainability 17 07490 i007
Table 13. Vulnerable Points of Low-Rise Privacy.
Analysis Results
Building Identification Number 301302303304305306307308309310311312313314315316317318
Number of Vulnerable Sides 121101212211220122
Table 14. Comparison of alteration specifications.
Complex IndexRates of Continuous Sunlight (%)
(Up to 2 h)
FAR (%)BCR (%)HouseholdsPatterns
Alt.0191.80%288.17%25.05%2075P.01_ver.01
Alt.0293.10%298.43%24.44%2061P.02_ver.01
Alt.0398.05%299.46%23.50%2061P.02_ver.02
Alt.0499.03%288.96%21.10%2076P.02_ver.03
Table 15. Semi-optimized Alt04.
Visual Openness
Lower Floor (4F)_61.22%Middle Floor (11F)_61.02%High Floor (21F)_76.70%
Sustainability 17 07490 i008Sustainability 17 07490 i009Sustainability 17 07490 i010
Table 16. Comparison between Helio city complex 3 & Alt04.
Helio City Complex 3ALT 04
Sustainability 17 07490 i011
Complex IndexRates of Continuous Sunlight (%)
(at least 2 h)
FAR (%)BCR (%)Households
Helio city complex 364.31%255.55%17.09%2026
Alt.0499.03%288.96%21.10%2076
Table 17. Comparison between Alt04 and Semi-Optimized Alt04.
ALT 04Semi-Optimized Alt04
Sustainability 17 07490 i012
Complex IndexVisual Openness Ratio
Helio city complex 3Lower Floor (4F)_36.50%Middle Floor (11F)_36.92%High Floor (21F)_45.02%
Alt.04Lower Floor (4F)_43.08%Middle Floor (11F)_43.58%High Floor (21F)_45.96%
Semi-Optimized Alt04Lower Floor (4F)_61.22%Middle Floor (11F)_61.02%High Floor (21F)_76.70%
Table 18. Openness comparison of previous study and Semi-Optimized Alt 04.
TypeAverage Openness Rate (%)Max Openness Rate (%)Min Openness Rate (%)Max − Min (%)
Slab-Type43%79%5.9%73.1%
Tower-Type39.6%65.4%22.3%43.1%
Hybrid-Type39.7%72.9%9.1%63.8%
Helio city complex 339.48%45.02%36.5%8.52%
Semi-Optimized Alt0466.3176.7%61.02%15.68%
Table 19. Comparison between Semi-Optimized Alt04 & Optimized Alt04.
Semi-Optimized Alt04Optimized Alt04
Sustainability 17 07490 i013
Complex IndexRates of Continuous Sunlight (%)
(up to 2 h)
FAR (%)BCR (%)HouseholdsHouseholds
not satisfied with both sunlight and privacy
Semi-Optimized Alt0499.03%288.96%21.10%207620
Optimized Alt04100%278.80%21.10%20560
Table 20. Comparison between Helio city complex 3 & Optimized Alt04.
Helio City Complex 3Optimized Alt04
Sustainability 17 07490 i014
Complex IndexRates of Continuous Sunlight (%)
(at least 2 h)
Visual Openness RatioFAR (%)BCR (%)HouseholdsHouseholds
not satisfied with both sunlight and privacy
Helio city complex 364.31%Lower Floor (4F)_36.50%Middle Floor (11F)_36.92%High Floor (21F)_45.02%255.55%17.09%2026Up to 86
Optimized Alt04100%Lower Floor (4F)_61.22%Middle Floor (11F)_61.02%High Floor (21F)_76.70%278.80%21.10%20560
Disclaimer/Publisher’s Note: The statements, opinions and data contained in all publications are solely those of the individual author(s) and contributor(s) and not of MDPI and/or the editor(s). MDPI and/or the editor(s) disclaim responsibility for any injury to people or property resulting from any ideas, methods, instructions or products referred to in the content.