Article

The Tourist Carrying Capacity as a Basis for Sustainable Management of Ecotourism Activities: Case Study of the Southern Mexican Caribbean

by
Jorge Manuel Tello Chan
1,
Kennedy Obombo Magio
2,3,* and
Eloy Gayosso Soto
1
1
Tecnológico Nacional de México/IT de Chetumal, Av. Insurgentes 330, Chetumal 77013, Mexico
2
Secretaría de Ciencia, Humanidades, Tecnología e Innovación (SECIHTI), Av. Insurgentes Sur No. 1582, Crédito Constructor, Alcaldía Benito Juárez, Mexico City 03940, Mexico
3
Tecnológico Nacional de México/IT de Cancún, Av. Rodrigo Gómez (Kabah) Km. 3, Centro, Cancún 77515, Mexico
*
Author to whom correspondence should be addressed.
Sustainability 2025, 17(16), 7492; https://doi.org/10.3390/su17167492
Submission received: 22 May 2025 / Revised: 23 July 2025 / Accepted: 13 August 2025 / Published: 19 August 2025

Abstract

In the Mexican Caribbean, the demand for tourism services led to the expansion of the hotel industry from the coast inland. This caused rural and urban communities in the region to become involved in tourism activities, initiating the formulation of an international model of sustainable development with a focus on cultural tourism. Considering the tourism potential that the study area can offer to nearby rural communities, as well as the limited number of studies aimed at estimating tourism carrying capacity (see examples of TCC for environmental management units in communal land areas like Baja California, Mexico and the Huagapo cave in Peru), the present research aims at estimating the tourism carrying capacity in the southern region of the Mexican Caribbean. A mixed methodological approach was adopted for the present study entailing a detailed description of flora and fauna in the study area using natural resource mapping tools, social diagnosis of the communities in the study area using the Participatory Action Research (PAR) technique in the communities of Caobas and San José de la Montaña and the estimation of tourism carrying capacity (TCC), Physical Carrying Capacity (PCC), Real Carrying Capacity (RCC), and Effective Carrying Capacity (ECC) using information gathered through fieldwork and bibliographic review. It was found that the area can support a tourism carrying capacity of 538.33 visits per day. In this initial assessment, it was estimated that the implementation of an ecotourism project in a rural community would not alter its environmental conditions. The estimated indicators provide appropriate tools for designing and planning long-term sustainable tourism proposals. Moreover, they integrate environmental, economic, and social aspects in a balanced manner, generating tangible and lasting benefits.

1. Introduction

The rapid growth of the global population has caused significant pressure on territorial space, natural resources, and coastal areas in Latin America and the Caribbean [1]. In response, public policy instruments have been developed to regulate, organize, and manage land use, helping to prevent and mitigate the environmental impacts resulting from various socio-economic activities (exploitation, pollution, fragmentation, tourism, among others) [2]. Notably, tourism—defined by the World Tourism Organization as the activity that recognizes the present and future economic, social, and environmental repercussions in order to meet the needs of visitors, the industry, the environment, and host communities [3]. This activity has contributed to the degradation of numerous tourist destinations worldwide due to the uncontrolled actions of visitors, leading to negative consequences for natural resources [4]. Mexico ranks sixth in tourist arrivals and fifteenth in foreign exchange earnings from international tourism [5]. Internationally, the Mexican Caribbean is among the top tourist destinations, generating USD 14.2798 billion in 2018 and USD 15.0927 billion in 2019 [6]. It is considered one of the five regions with the highest marine biodiversity in the world, home to approximately 500 fish species and part of the Mesoamerican Reef System, which represents 12% of the world’s coral reef coverage [7]. By 2023, the region received 21 million visitors, 62.56% of whom were international and 37.44% domestic, with a hotel occupancy rate of 76.4%, supported by infrastructure comprising 1415 hotels and 131,022 rooms [8].
The demand for tourism services has driven the hotel industry to expand inland from the coast. As a result, rural and urban communities of the Mexican Caribbean have become more involved in tourism, initiating the formulation of an international model of sustainable development with a cultural tourism approach [9]. In urban areas and tourist regions in the northern Mexican Caribbean—such as Cancún, Puerto Morelos, Playa del Carmen, and Tulum—the population exceeds ~1.2 million people, where existing resources and ecosystems have been altered or degraded by unregulated urban development [10]. This trend is spreading to the central-southern zone of the region, including protected natural areas [7,11].
Tourism activity has sparked interest among rural communities in developing ecotourism and adventure tourism, taking advantage of the natural attractions of their surroundings [12,13]. Ceballos [14] defines these activities as traveling to or visiting undisturbed natural areas to enjoy, appreciate, and study natural attractions; promoting conservation; low environmental and cultural impact; and encouraging active and socio-economically beneficial involvement for host communities. These activities also imply responsible action by tourists and the tourism industry, requiring minimal use of non-renewable resources and relying on comprehensive planning for sustainable ecotourism projects [14,15].
Tourism carrying capacity (TCC) is a useful tool for planning natural areas, as it helps determine the maximum number of visitors that a site can accommodate for tourism activities while providing valuable information to decision-makers to avoid negative impacts on natural resources [16,17,18,19]. Currently, there is no specific definition, methodology, or unified framework for TCC. It has evolved from a unidimensional concept to a comprehensive one, where the physical dimension is integrated with social, environmental, economic, and political aspects [4,20,21]. Ibañez-Pérez [15] and Huaroc-Ponce et al. [21] have estimated the tourism carrying capacity for environmental management units in communal lands in Baja California, Mexico, and for the sustainable management of the Huagapo cave in Peru, using the methodology proposed by Cifuentes [16,22]. Considering the tourism potential that the study area offers to neighboring rural communities and the immense pressure to use their natural and cultural resources to meet their needs, this research conducts a social and environmental mapping of the study area with the aim of estimating the tourism carrying capacity using Cifuentes’ methodology [16,22] in the southern region of the Mexican Caribbean. This will help determine the maximum number of visitors allowed in the area, enabling the development of a sustainable ecotourism project and helping to reduce potential conflicts in rural communities. As demonstrated by Ibañez-Pérez [15], most communities do not take into consideration important tourism and visitor management tools like carrying capacity when they are planning and developing their culture- and nature-based tourism activities.

2. Literature Review

Tourist Carrying Capacity in the Context of Ecotourism and Sustainable Tourism Management

Ecotourism is often promoted as a sustainable alternative to mass tourism, focused on conservation, local community involvement, and minimal environmental impact. However, without proper management and a solid understanding of tourist carrying capacity, ecotourism can have negative consequences such as habitat degradation, overcrowding, and the displacement of local populations [23]. Applying TCC is central to the sustainable management of ecotourism, ensuring that tourism activities do not exceed the natural and social limits of an area. This concept in its dimensions (Environmental Carrying Capacity [24], Social Carrying Capacity [25] and Economic Carrying Capacity [26]) is key to maintaining the long-term viability of ecotourism, as it helps balance visitor demand and the preservation of ecological and cultural integrity.
However, understanding TCC (measuring and applying it effectively in the management of ecotourism) has been difficult in many contexts because of its dynamic nature, meaning it fluctuates based on a variety of factors such as ecological recovery, technological advancements, visitor behavior, and infrastructure development. It is crucial that ecotourism management policies incorporate all aspects of TCC to ensure a balanced approach.
To effectively apply TCC in the management of ecotourism, it is necessary to measure and assess it. Several methodologies have been proposed and applied in various ecotourism contexts to measure and assess TCC, including 1. Environmental Impact Assessment (EIA), which helps identify the thresholds beyond which the environment can no longer tolerate tourism activities. These assessments evaluate the ecological impacts of tourism and help set limits for visitor numbers [24]. 2. Visitor Management Systems (VMSs), which involve monitoring visitor flows, collecting data on visitation patterns, and analyzing the impact of tourists on both the environment and local communities. The systems enable ecotourism managers to adapt their strategies to changing conditions [27]. 3. Indicators of carrying capacity, such as vegetation degradation, wildlife disturbance, littering, water pollution, and crowding, which are used to evaluate the environmental and social carrying capacities. These indicators provide a quantitative basis for setting limits on the number of visitors [28]. Finally, 4. participatory approaches, which involve local communities, tour operators, and other stakeholders in the process of assessing carrying capacity, ensuring that local knowledge and perspectives are incorporated. This collaborative approach enhances the legitimacy and effectiveness of TCC management strategies [29].
Although TCC has been considered as an effective sustainable management tool for ecotourism, especially in rural communities, there are several challenges associated with its implementation. First, effective monitoring and assessment of carrying capacity require extensive data collection and analysis, which can be resource-intensive. Many ecotourism destinations, particularly in developing countries and rural areas, lack the financial and technical resources to carry out comprehensive studies [30]. Secondly, the dynamic nature of TCC is problematic, as it is not a static concept and changes over time based on factors like environmental recovery, tourism infrastructure improvements, and changing visitor behavior. Managing these fluctuations can be difficult, requiring constant adaptation of strategies [31]. Thirdly, balancing the interests of various stakeholders (e.g., local communities, tour operators, conservationists, and governments) can be challenging during TCC implementation. Each group may have different priorities and perceptions of what constitutes “sustainable” tourism [32]. Finally, overemphasis on visitor numbers has proven to be less effective. While visitor numbers are a crucial element of TCC, focusing solely on limiting the number of visitors can overlook other factors such as the quality of the visitor experience, the economic benefits to local communities, and the need for visitor education and behavioral change [33].
While challenges exist in accurately measuring and applying TCC, various tools and case studies show that with the right strategies and stakeholder involvement, ecotourism can be a powerful force for sustainability. For example, the Galápagos National Park (Galápagos Islands in Ecuador) has been at the forefront of TCC management. Strict visitor caps, along with zoning and seasonal closures, have been implemented to prevent ecosystem degradation and preserve the unique biodiversity of the islands. Research has shown that visitor numbers in the park are directly linked to changes in species behavior and ecosystem health [34]. Another example is the Great Barrier Reef in Australia, one of the world’s most ecologically sensitive areas, which uses zoning regulations, combined with visitor education programs, to manage the number of tourists who engage in diving and snorkeling activities. Studies highlight how monitoring visitor behavior can contribute to preserving the reef’s health, as well as enhancing the visitor experience [35]. Finally, the case of Masai Mara National Reserve in Kenya stands out; known for its rich biodiversity and annual migration of wildebeest, the park uses TCC to regulate the influx of tourists during the migration season. Through ticketing systems, park management can control the number of visitors, ensuring that the ecosystem is not overtaxed and local communities benefit from tourism [36].
As many communities seek to adopt ecotourism, several future directions for TCC management can be identified; for example, there is a need for more research on how TCC can be adapted to new and emerging tourism trends, such as virtual tourism and tourism in areas affected by climate change, which poses significant threats to many ecotourism sites, particularly coastal and alpine areas [37]. Future TCC models should incorporate climate resilience and adaptive management strategies to account for changing environmental conditions. Additionally, advances in data collection technologies, such as remote sensing, Geographic Information Systems (GISs), and real-time monitoring tools, can enhance the accuracy of TCC assessments and allow for better visitor management and environmental monitoring [38]. Finally, education and environmental awareness present numerous opportunities for improving how TCC is implemented. Educating tourists about the importance of sustainable travel and their role in maintaining TCC is essential. Visitors who understand the impact of their actions are more likely to respect environmental and social limits, leading to a more harmonious interaction between tourism and the local environment [39].

3. Materials and Methods

A mixed methodological approach was adopted for the present study entailing a detailed description of flora and fauna in the study area using natural resource mapping tools; a social diagnosis of the communities in the study area using the Participatory Action Research (PAR) technique in the communities of Caobas and San José de la Montaña; and the estimation of tourism carrying capacity (TCC), Physical Carrying Capacity (PCC), Real Carrying Capacity (RCC), and Effective Carrying Capacity (ECC) using information gathered through fieldwork and bibliographic review; see Figure 1 below. The study was carried out between January 2023 and December 2024.

3.1. Study Area

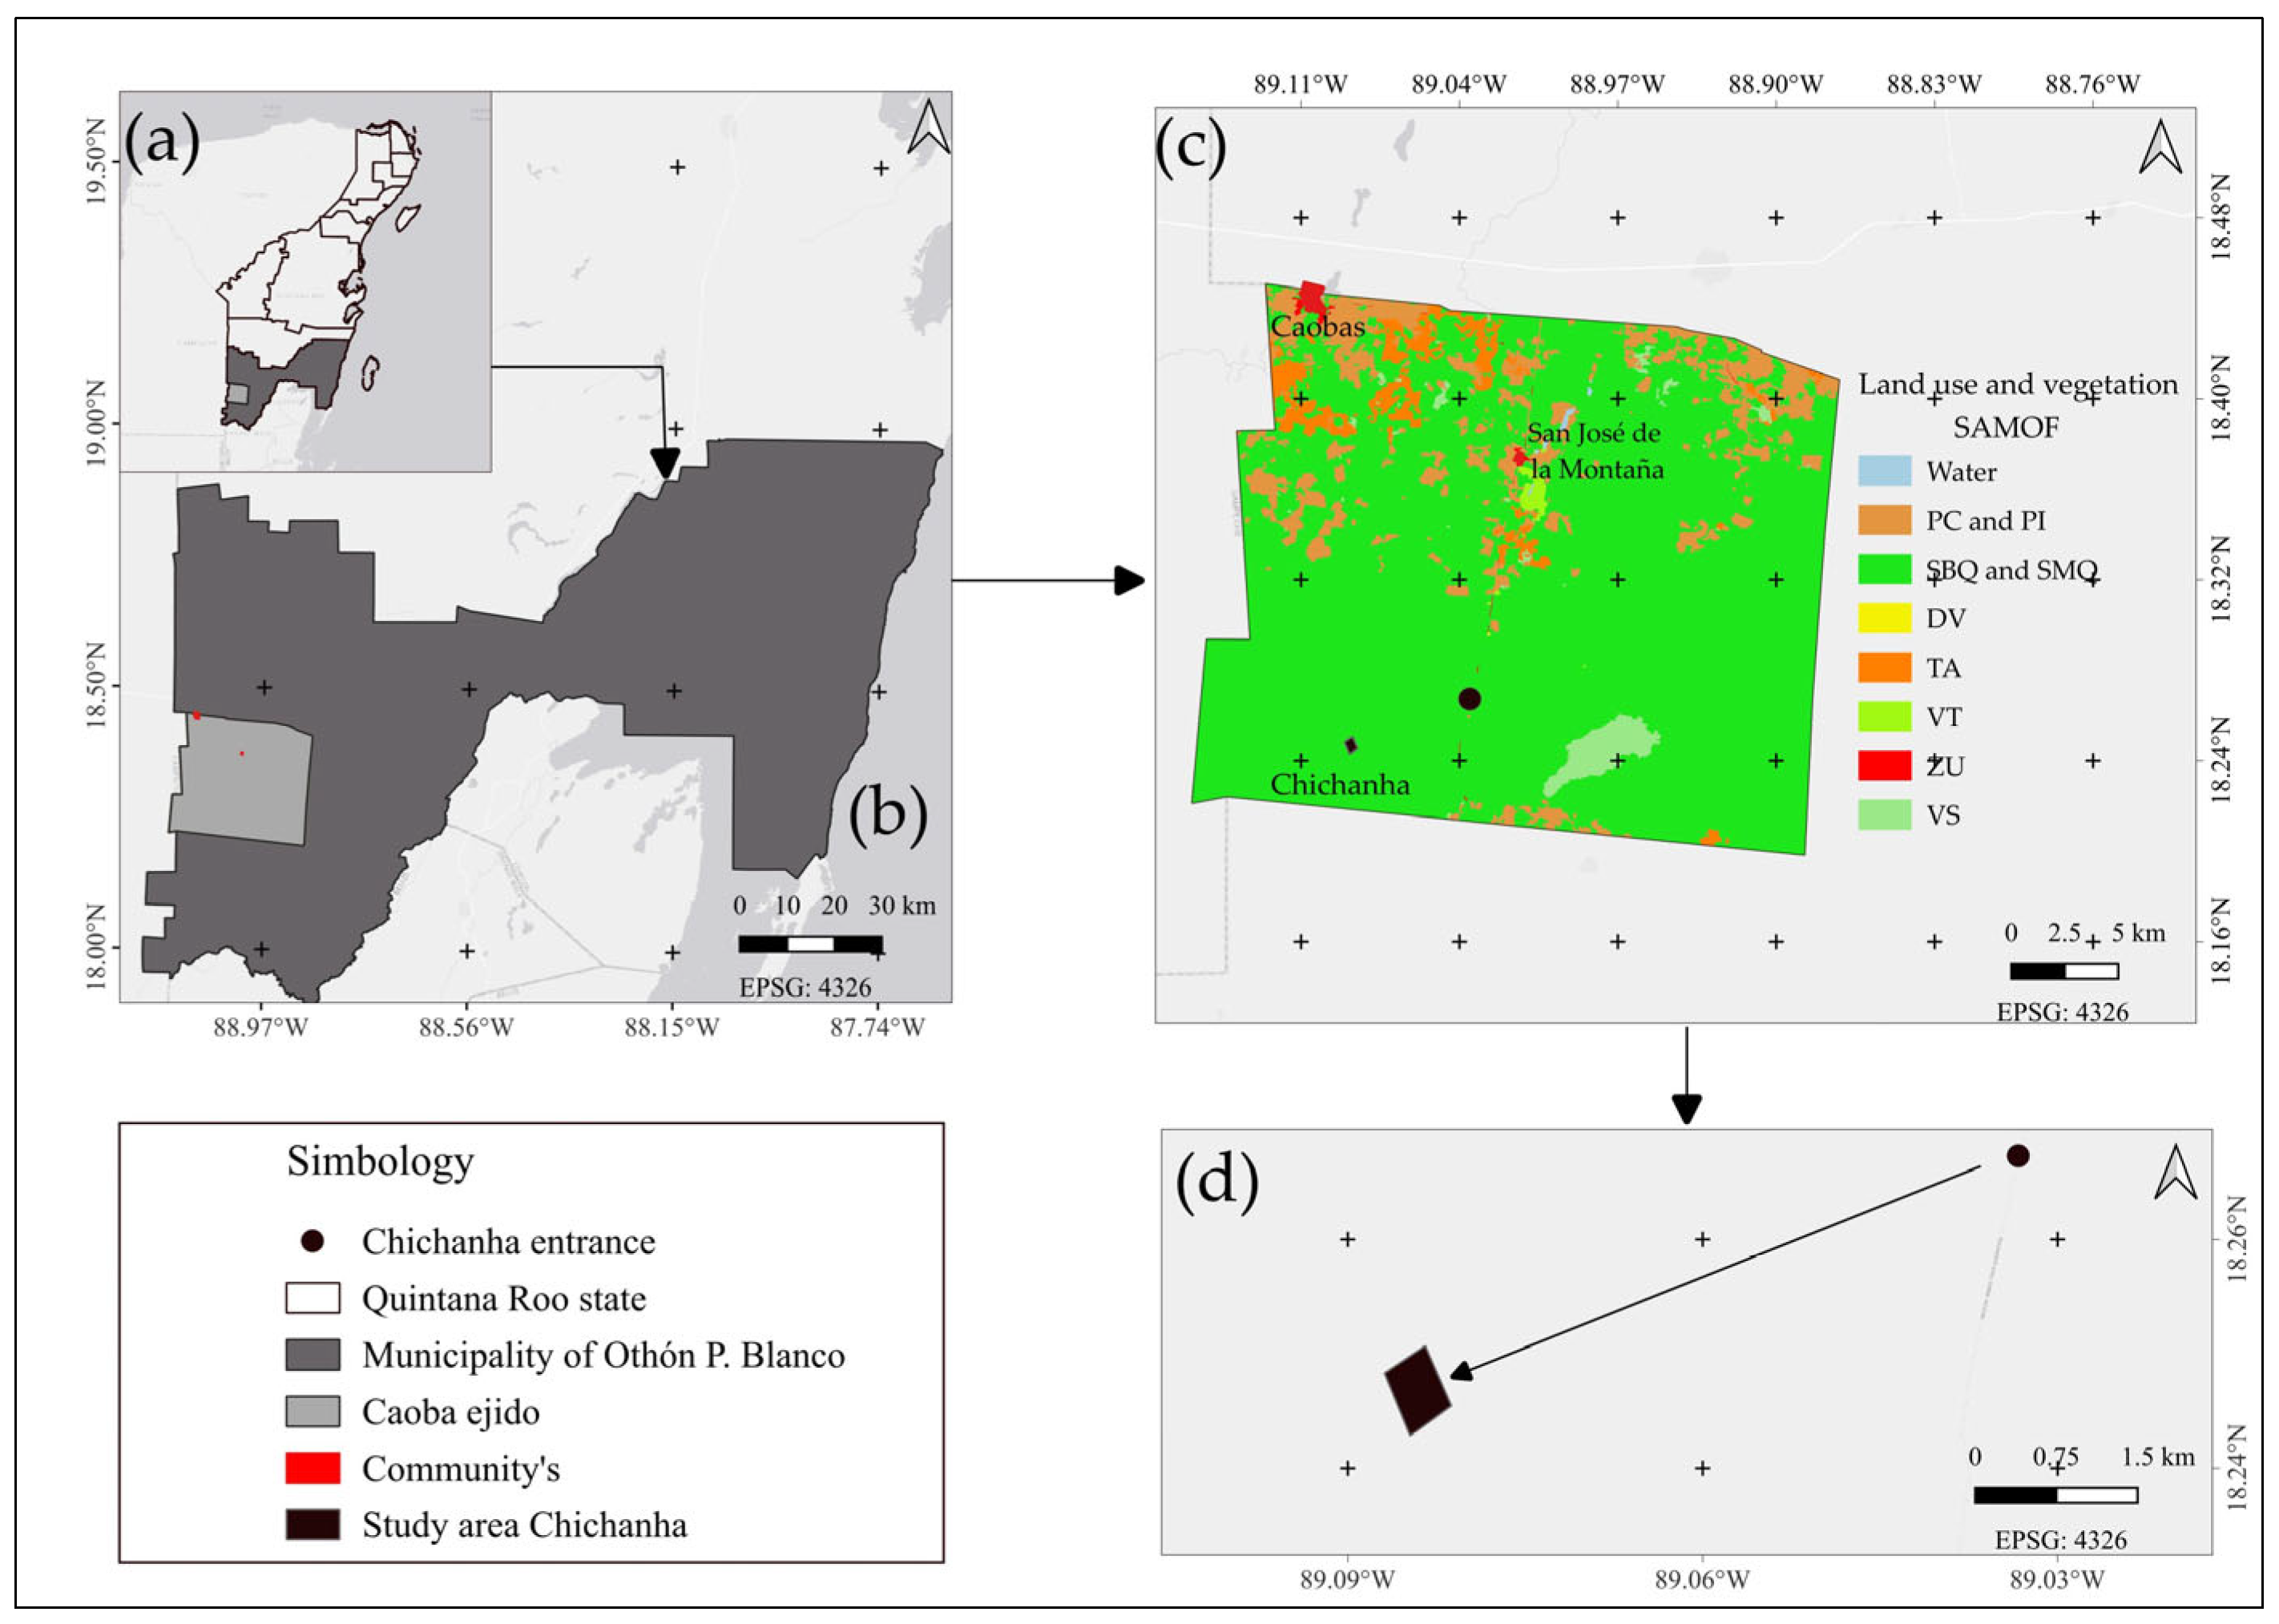
The ejido Caoba is located in the municipality of Othón P. Blanco, in the southern part of the state of Quintana Roo, at longitude 89.16° W and latitude 18.21° N. The ejido was established in 1940 and covers an area of approximately 67,637.35 hectares, comprising around 323 ejidatarios and 169 settlers, according to the National Agrarian Registry [40] (Figure 2a). It includes two settlements: the community of Caobas and its annex, San José de la Montaña. The community of Caobas has a population of approximately 1507 inhabitants, while San José de la Montaña has about 205 inhabitants, according to the National Institute of Statistics and Geography [41] (Figure 2c). The proposed study area is called Chichanha (Figure 2d), located to the south of the ejido communities (Figure 2c), covering an area of approximately 29 hectares and extending 7.82 km from the access point to the study area.
The dominant climate is classified as Aw2(i), warm sub-humid. The average annual temperature is approximately 26 °C, and the annual precipitation is around 1200 mm. Although there are no rivers in the area, the ejido contains permanent bodies of water, such as Laguna Om, Laguna del Sibal, Laguna Reforma, and Laguna San José [42,43].

3.2. Description of Flora and Fauna in the Study Area

A site visit was conducted in the study area, during which aerial surveys were carried out using a remotely piloted aircraft system (RPAS and/or drone), specifically a DJI Mavic 2 Zoom equipped with six batteries. Flights were planned at altitudes of 60 m and 120 m, remaining below the permissible limit established by NOM-107-SCT3-2019 [44]. This facilitated the rapid identification and positioning of sampling units.
Community members were trained in the operation and handling of the RPAS, as well as in the identification and data collection of flora and fauna. To estimate optimal sampling intensity, the approach proposed by [45,46] was implemented,
f = n / N × 100 ,
where f = sampling intensity, n = number of sample units, and N = total number of population units.
This method allows for the establishment of guideline parameters for sampling intensity ranging from 0.1% to 1%; if the intensity exceeds 1%, the number of sites is considered optimal [45,46]. For data collection, six circular sampling units were established: 500 m2 for the arboreal stratum, 100 m2 for the shrub stratum, and 5 m2 for the herbaceous stratum, arranged in a nested design [47]. Sampling began by identifying the north and proceeding clockwise within each sample unit. Equation (1) was then applied as follows:
f = 3000   m 2 / 290,000   m 2 × 100
f = 1.03 % .
With the proposed sampling units, a sampling intensity of 1.03% was obtained, which is considered optimal for data collection.
For fauna, the natural resource mapping tool proposed by Expósito [48] was applied. This method consists of creating a shared conceptualized visualization of the various elements and uses of space, with a focus on natural resources such as the distribution and/or location of fauna [48]. A conceptual map was developed based on wildlife sightings recorded over a 30-year period. Additionally, in each flora sampling unit, the common names of observed fauna species were recorded. The identification of flora and fauna relied on the knowledge and experience of local inhabitants involved in the research, as well as specialized field guides, including those by Manzanilla and Péfaur [49]; Arellano-Rodríguez et al. [50]; Pennington and Sarukhán [51]; Gallina-Tessaro and López-González [52]; and Aranda-Sánchez [53], among others. Furthermore, online databases recommended by CONABIO were consulted, such as SNIB [54], CICY [55] and Tropicos.org [56].

3.3. Social Mapping and Diagnosis of the Communities in the Study Area

Cury and Arias-Astray [57] state that social mapping and diagnosis allow for an understanding of the population’s composition, as well as various aspects and quantifiable parameters derived from the methodological instruments used. The methodologies applied in this study were adjusted according to the scope, technical constraints, and available resources. To determine the population density of the ejido, a representative sample was obtained using a 95% confidence level and a 5% margin of error [58], as follows:
n = N × Z α 2 × p × q / d 2 × N 1 + Z α 2 × p × q ,
where n = required sample size, N = total population size, Z = confidence level (Z-score), p = expected proportion (probability of success), q = 1 − p (probability of failure), and d = margin of error (maximum admissible error in proportion terms).
The sample size was estimated based on the data published in the 2020 Population and Housing Census [41]. The locality of Caobas has a population of approximately 1507 inhabitants, and San José de la Montaña approximately 205 inhabitants, yielding a total population (N) of around 1712 people. Equation (2) was applied using these values:
n = 1712 × 1.96 2 × 0.5 × 0.5 / 0.05 2 × 1712 1 + 1.96 2 × 0.5 × 0.5
n = 314 .
The estimated sample size for both localities was 314 individuals. Taking into account a margin of error, 450 residents were surveyed, of which 414 responses were valid. The survey tool was applied using the Participatory Action Research (PAR) technique in the communities of Caobas and San José de la Montaña, both of which have influence over the study area [59,60]. Workshops were conducted with community members to train them in data collection, handling, and recording processes.

3.4. Estimation of Tourism Carrying Capacity (TCC)

This tool was applied to an area of interest identified for conservation. Therefore, values and factors proposed by Cifuentes [22] for protected natural areas were employed and adjusted accordingly. According to Cifuentes [16,22], TCC is a tool that helps determine the number of visitors that can enter a specific area over a limited period of time without compromising its integrity or resilience [18,19]. To calculate TCC, it is necessary to gather information through fieldwork and bibliographic review. This data is then used to consecutively estimate the Physical Carrying Capacity (PCC), Real Carrying Capacity (RCC), and Effective Carrying Capacity (ECC) [16,61]. The methodology was adapted and applied specifically for this study.
PCC represents the maximum number of visits that can be made to a specific site within a defined period of time. It was calculated as follows:
P C C = ( v / a ) × S × t ,
where v/a is the visitors per occupied area in square meters (m2); S is the surface area available to the public in m2; and t is the time required to complete the visit in hours. Basic criteria for the study area: It is an open area with free movement. The surface area available to the public is 2000 m2. The trail is 2 km long. It is open eight hours a day. Three hours are needed to complete the route. Each person occupies 1 m2 of space. Each group will consist of four people. A distance of 100 m2 is required between groups.
RCC is the maximum number of visits determined based on the Physical Carrying Capacity, adjusted by correction factors according to the characteristics of the area. It is estimated as follows:
R C C = C C F × 100 F C 1 / 100 × 100 F C 2 / 100 × 100 F C n / 100 .
Each area to be evaluated will have different correction factors, depending on the characteristics of the study site. The correction factor (Fc) is estimated as follows:
F c = M l / M t × 100 ,
where Fc is the correction factor; Ml is the limiting magnitude of the variable; and Mt is the total magnitude of the variable.
ECC (Effective Carrying Capacity) is the maximum number of visitors that an area can accommodate, considering its management and organizational capacity. For this, the relationship between the existing and optimal amounts of infrastructure, equipment, and personnel was taken into account. These variables were evaluated using a scale from 0 to 4 [22]. The assessment of each variable followed the methodology proposed by Ibañez-Pérez [15] (Table 1).
Once the MC has been assessed and categorized, the ECC can be calculated as follows:
E C C = R C C × ( M C / 100 ) ,
where RCC is the Real Carrying Capacity and MC is the minimum percentage of management capacity.
MC is calculated as follows:
M C I n f r a s t r u c t u r e + E q u i p m e n t + P e r s o n n e l / 3 × 100 .
MC is defined by Cifuentes [22] as the sum of the conditions that must be met to fulfill the objectives and functions of the project. Cifuentes [22] proposes a baseline MC of 15%. The variables were adjusted for the purposes of this research.

4. Results

4.1. Characterization of Flora and Fauna

4.1.1. Flora

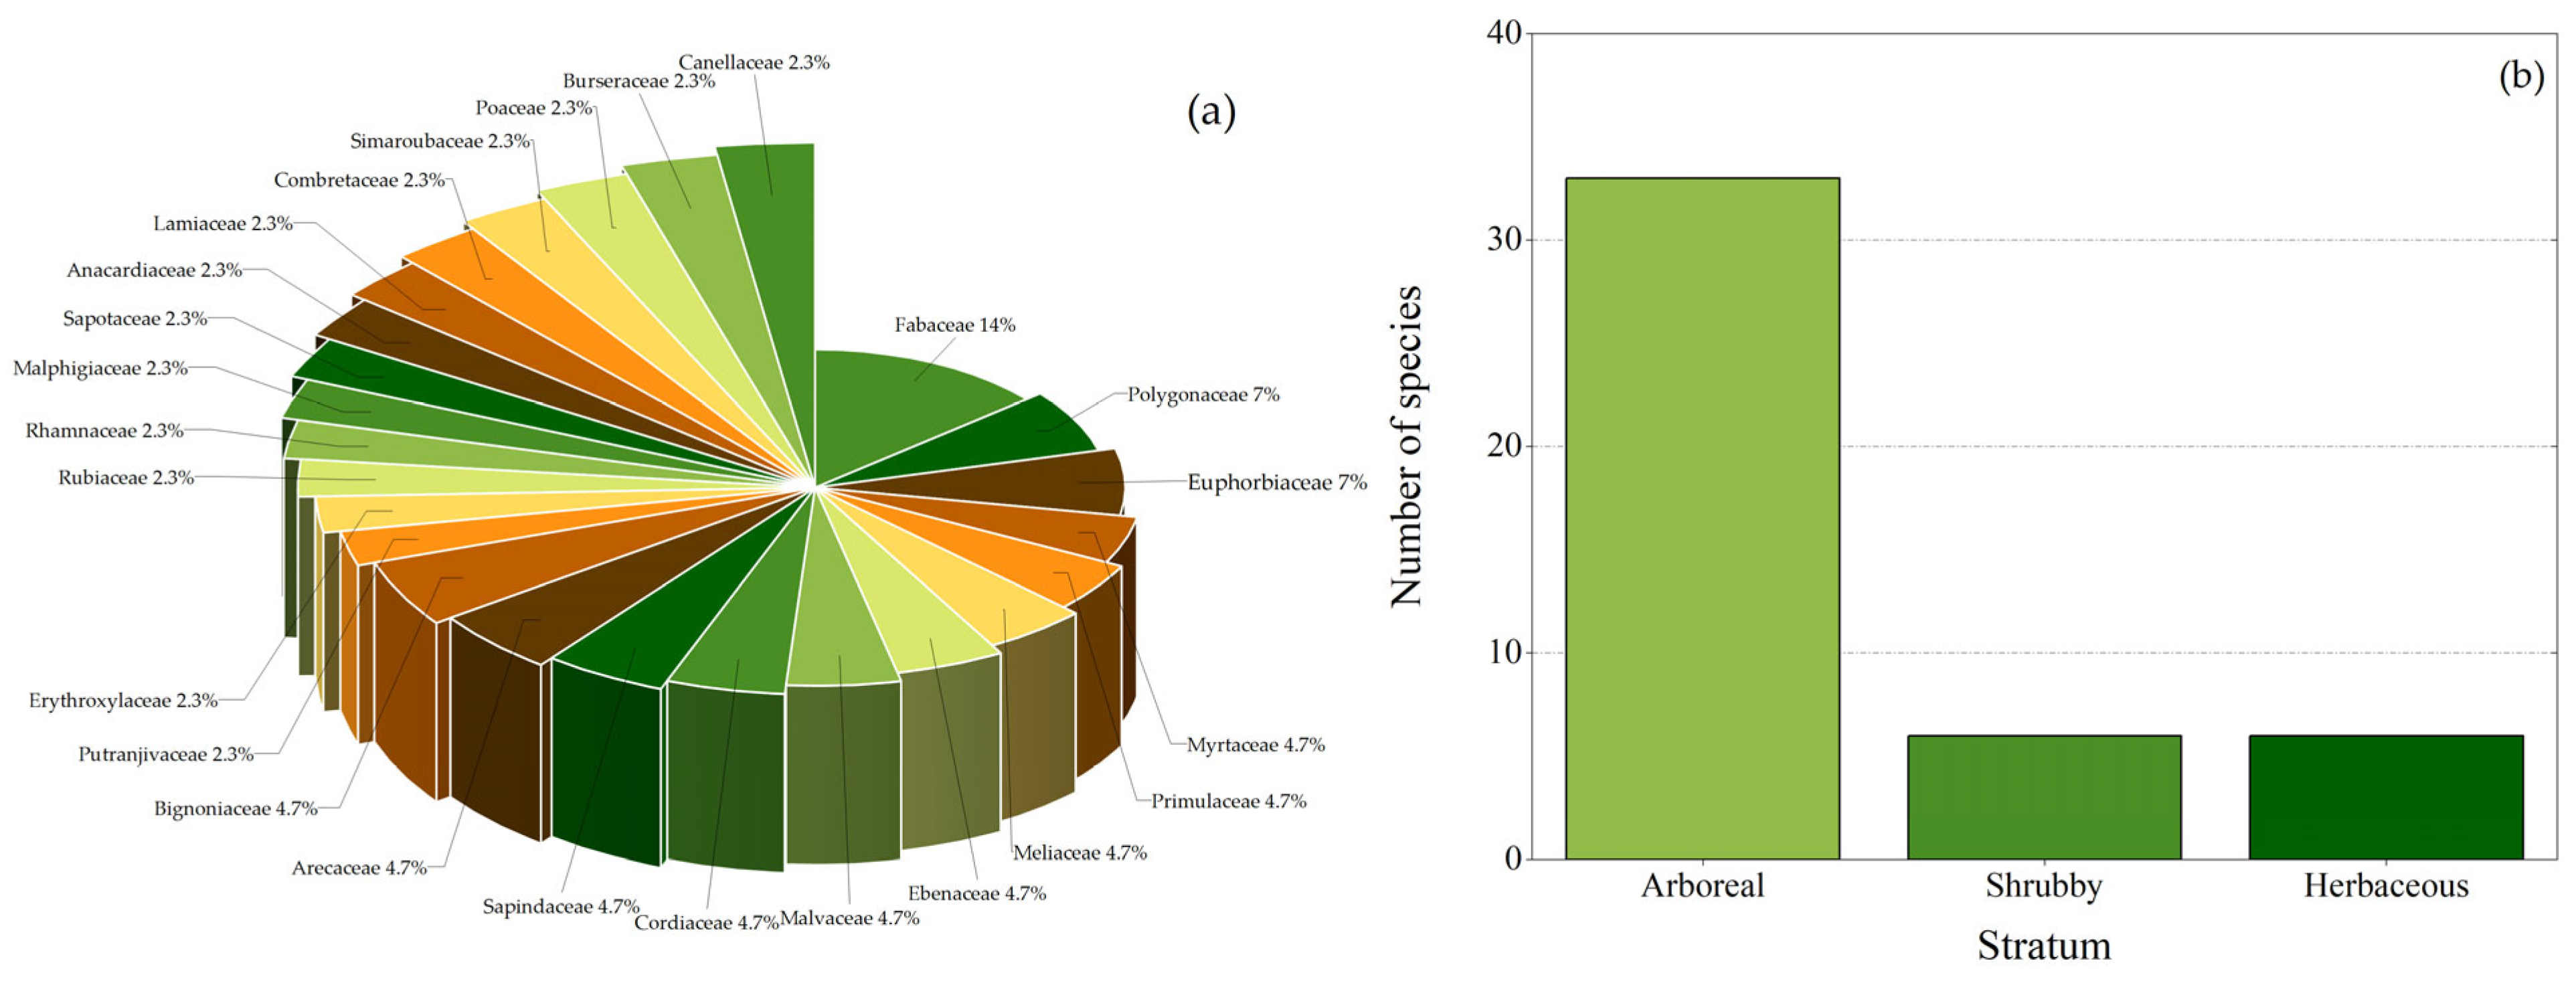
A total of 41 species were recorded, distributed across 25 families (Figure 3a). The most representative family was Fabaceae, with six species, accounting for 14% of all recorded families. The arboreal stratum exhibited the highest species richness with thirty-three species, while the remaining two strata recorded six species (Figure 3b; Table S1, Supplementary Material).

4.1.2. Fauna

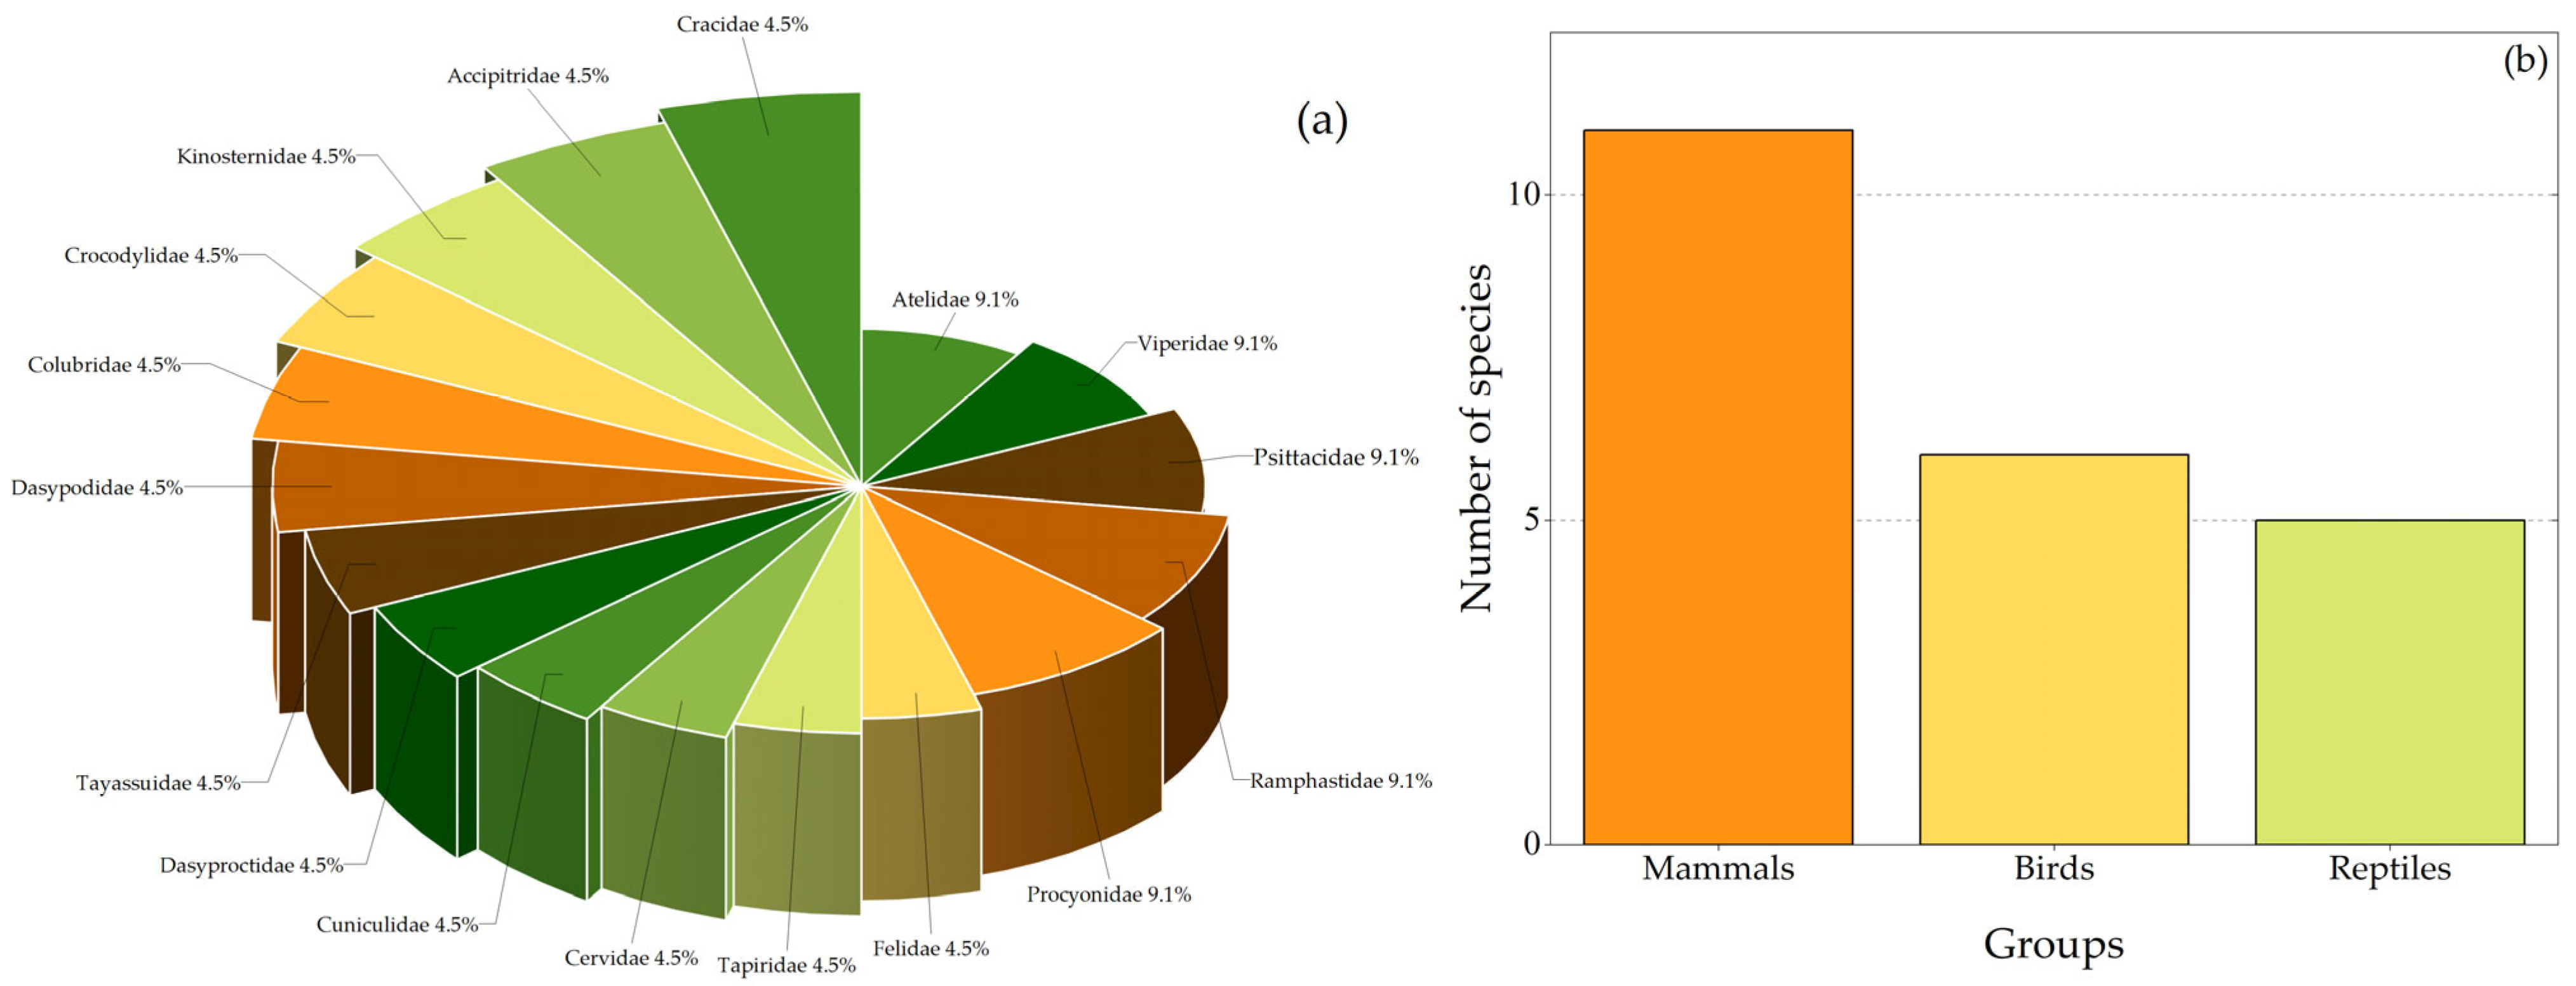
A total of 21 fauna species were recorded, distributed across 17 families (Figure 4a). Five families (Atelidae, Viperidae, Psittacidae, Ramphastidae, and Procyonidae) were the most representative, accounting for 45% of the total recorded list. The mammal group exhibited the highest species richness with 11 species. The remaining groups recorded six species for birds and five for reptiles, respectively (Figure 4b; Table S2, Supplementary Material).
The characterization of flora and fauna is essential for assessing the current state of the natural and cultural environment, helping to identify threats to the implementation of sustainable practices. It allows for the detection of negative impacts caused by human activities on the environment, as well as threats that endanger the long-term viability of projects. Currently, the vegetation in the Mexican Caribbean comprises a mosaic of forests with structural patterns of species richness and biodiversity, exhibiting varying levels of conservation and degrees of disturbance (hurricanes, droughts, fires, logging, and others). This has led to some stages of forest development being targeted for management and use [62,63]. These actions have resulted in much of the region’s vegetation differing from its original form. According to Flores-Guido and Espejel-Carbajal [64], the primary vegetation described in the region in the mid-20th century has largely disappeared, replaced by vegetation in various stages of secondary succession.
The study area is located south of the rural communities, and the entire surface of Ejido Caoba is affected by some form of extractive activity carried out by local residents, impacting existing natural resources. Despite these disturbances, a total of 41 plant species distributed across 25 families and 21 fauna species across 17 families were recorded—results comparable to those reported by Aguirre-Cortés et al. [65] for Ejido Manuel Ávila Camacho (46 species in 22 families), Ejido Río Escondido (40 species in 20 families), and Ejido Veracruz (27 species in 15 families), all engaged in forest resource use in Quintana Roo. These findings suggest that the study area is in a good state of conservation and presents favorable conditions for the development of ecotourism activities. Regarding fauna, residents of both communities are aware of the presence of various species within their territory; however, they lack knowledge about their proper management and environmental protection status [66]. García-Trujillo et al. [66] note that most forest ejidos in the Mexican Caribbean have voluntarily established and maintained conservation areas for their natural resources. These actions have been implemented since 2002, following the 1996 reform of the General Law of Ecological Balance and Environmental Protection (LGEEPA), which introduced legal recognition for community-based conservation areas proposed by ejidos and rural communities [67].
Knowledge of the existing flora and fauna in the study area enables the design of appropriate mitigation and adaptation strategies to minimize negative impacts and maximize benefits for the local communities and their environment. It also offers an opportunity to identify environmental and cultural assets, as well as community skills and resources that can be leveraged for sustainable development. Furthermore, it encourages the participation and inclusion of communities, authorities, and experts in decision-making, thereby strengthening local capacities for job creation and economic development through their natural surroundings.

4.2. Social Mapping and Diagnosis in the Study Area

The surveys conducted revealed that in both communities, 50.2% of the population are women. Additionally, 35% of the residents are between 18 and 28 years old, and 34% were born in the state. Only 3.1% hold a university degree, while 15.2% have no formal education. The dominant economic activity in the communities is agriculture, accounting for 37.7%. A total of 81.9% of the residents are resettlers. Migration toward the northern part of the state represents 36.2%, and 35.3% of respondents perceive an economic improvement linked to tourism-related activities. Consequently, 88.2% of those surveyed consider sustainable ecotourism to be a viable practice in the study area (Table S3, Supplementary Material).
Morett-Sánchez and Cosío-Ruiz [68] note that more than half of Mexico’s land is owned by ejidos and agrarian communities, encompassing a wide variety of ecosystems (forests, shrublands, water bodies, etc.) under social ownership. Of the approximately 32,000 ejidos and communities, about 5.6 million ejidatarios, communal landholders, settlers, and right holders supply both domestic and international markets with a range of products, raw materials, construction materials, and increasingly, low- and medium-impact tourism services [68]. Despite the abundance of natural resources, community members often have limited knowledge in the planning, management, and execution of sustainable ecotourism projects. In the study area, this limitation is influenced by various factors, including educational levels—only 3.1% have university education, while 36.2% have completed only secondary education—and the predominance of agriculture as the main economic activity (37.7%). Additionally, 36.2% of the population has migrated north within Quintana Roo, and 28% to other states across Mexico. Interest in engaging in tourism activities stems from the perception that it could lead to better job opportunities and economic improvement, as experienced in northern Quintana Roo. Additionally, 35.3% of residents believe that increased tourism would benefit local livelihoods, and 88.2% consider sustainable ecotourism a viable activity for the ejido. This interest is further underscored by the fact that 45.2% of respondents report an average monthly income of only MXN 2000, while only 1.7% earn more than MXN 6000, highlighting the need to create opportunities comparable to those in the more developed northern Caribbean region.
According to Puente-Santos et al. [69], the diversification of the tourism sector in Mexico and the Mexican Caribbean has gone beyond coastal dynamics as homogeneous destinations and now responds to market interests and the physical and sociocultural characteristics of emerging tourist spaces. The arrival of the Maya Train has driven sustainable tourism promotion efforts by public and private institutions, particularly targeting rural communities in ejido zones [70,71,72,73]. Consequently, the natural and cultural diversity of these communities is becoming an area of interest for tourists and visitors seeking recreational, educational, immersive, and relaxation activities in direct contact with the surrounding natural environment [69].

4.3. Tourism Carrying Capacity for Ecotourism Activities in the Study Area

4.3.1. PCC

The maximum number of estimated visits for a defined period in the study area, applying Equation (3), is as follows:
P C C = 4 / 1 × 2000   m 2 × 2.5
P C C = 20,000 .
Considering a desired number of visits and the variables used for the TCC, a PCC of 20,000 visits/day was obtained. Each visitor is expected to visit the site 2.5 times per day.

4.3.2. RCC

Using Equation (5), correction factors were estimated as follows:
CF1: Social factor with a 96.15 value.
CF2: Erosion factor with a 120 value.
CF3: Accessibility factor with a 112.5 value.
CF4: Precipitation factor with a 32.87 value.
CF5: Flooding factor with a 50 value.
Based on the above, the RCC was calculated using the results obtained from the PCC and the corresponding correction factors. Equation (4) was applied as follows:
R C C = 20,000 × ( 100 96.15 / 100 ) × 100 120 / 100 × 100 112.5 / 100 × ( 100 32.87 / 100 ) × ( 100 50 / 100 )
R C C = 6.46   v i s i t o r s / d a y .
The RCC for the access area is 6.46 visitors per day, representing the maximum number of visits allowed according to the area’s physical characteristics and the space available for the proposed activities.

4.3.3. ECC

The ECC represents the maximum number of visitors that a given area can accommodate. For its estimation, the criteria of infrastructure, equipment, and personnel were considered (Equation (7)). The assessment and scoring of each criterion followed the parameters outlined in Table 1. Each evaluated variable received the following scores: infrastructure—80%, equipment—80%, and personnel—90%. Based on these values, the MC was estimated using Equation (7).
M C = 80 + 80 + 90 / 3 × 100
M C = ( 250 / 3 ) × 100
M C = 83.333 × 100 = 8333.33 .
The MC reached 83.33%, categorizing it as satisfactory (Table 1). Once the MC was estimated, the ECC was calculated using Equation (6).
E C C = 6.46 × ( 8333.33 / 100 )
E C C = 538.33   v i s i t s / d a y .
The maximum number of estimated visits for the available area within the study zone is 538.33 visits per day.
The study area has historically been used for timber harvesting and gum extraction since the early 1900s, later incorporating cattle ranching, beekeeping, and agriculture as secondary economic activities [43]. The arrival of high-impact projects in southern Mexico, such as the Maya Train, has spurred interest in developing ecotourism projects to attract regional tourism to ejido communities with preserved landscapes and rich biodiversity [72,74]. According to UN-Habitat [73], by 2030, the Maya Train is expected to generate 715,000 new jobs in municipalities with train stations, 150,000 jobs in the rural economy linked to the train, and 80,000 construction-related jobs. Additionally, it is estimated that 46 out of every 100 employed individuals will belong to Indigenous communities, representing a 38% increase compared to the Indigenous population employed in 2015 [73]. ONU-Habitat [73] also indicates that economic growth without the project would be 0.84% (MXN 1.5 trillion), while with its implementation, it is projected to rise to 1.59% (MXN 2.1 trillion).
Based on the above, the TCC was estimated. According to Ritchie and Crouch [75], TCC makes it possible to understand the ecological and social limits of area use through study and management by establishing socio-ecological indicators of use and impact for optimal planning and management of natural resources. Using the methodology proposed by Cifuentes [22], the study area was found to have a management capacity of 83.33%, which corresponds to an effective tourism carrying capacity (ECC) of 538.33 visitors per day, considering the area’s physical characteristics, flora and fauna, and the estimated management capacity. This figure is similar to those reported by SECTUR [71], which estimated a TCC of 783 visitors per day for the beaches of Puerto Morelos, 333 visitors per day for the Tulum archeological zone, 249 simultaneous visitors per day for the Dzibilchaltún archeological site in Mérida, and 437 daily visitors for the Ek Balam archeological zone. The correct application of these estimated indicators requires an integrated and interdisciplinary perspective to ensure their long-term effectiveness and sustainability [71].
While tourism carrying capacity (TCC) is a strategic tool that aids in planning a geographic area without causing drastic environmental impacts, it aligns with the observations of López-Bonilla and López-Bonilla [70], Puente-Santos et al. [69], Ibañez-Pérez [15] and Matos-Márquez and Pérez-Colmenares [4], who argue that the tool alone does not guarantee the preservation and conservation of a given area, nor does it resolve the immediate, widespread, or long-term negative impacts already present as a result of tourism activity. However, TCC remains a valuable instrument for the management, planning, and conservation of tourism and its activities in a sustainable manner, whether within or outside of protected natural areas [15,70].

5. Conclusions

The expansion of tourism and its activities into natural resources located away from the coast is leading to the inclusion of rural ejido communities in the provision of tourism services, as they view it as an economic alternative that will improve the living conditions of the population. In this first approach, the estimation of tourism carrying capacity (TCC) for the implementation of a sustainable ecotourism project in a rural community ensures that this economic activity does not alter or degrade environmental conditions. Its implementation for the development of ecotourism activities benefiting ejido communities is a viable strategy that would help promote the sustainable use of their resources in a controlled manner, regardless of the various activities carried out in the ejido. The estimated indicators provide appropriate tools for designing and planning the long-term preservation of tourism proposals. In addition, they integrate environmental, economic, and social aspects in a balanced way, generating tangible and lasting benefits. By continuing to promote these initiatives and overcoming the remaining challenges, it will be possible to move toward a more sustainable and just future for the rural communities of the Mexican Caribbean. The following recommendations are useful: (1) Conduct market studies to assess tourist preferences and needs. (2) Establish a permanent monitoring system for each estimated indicator to evaluate significant changes in the study area. (3) Clearly define the roles of all stakeholders, including the corresponding authorities. (4) Develop mechanisms that ensure the economic benefits generated reach the residents of the involved communities. (5) Provide continuous and permanent training and awareness on natural resources and their management, cultural education, group management, first aid, and others. (6) Consider external funding sources through agreements to improve infrastructure, equipment, and signage throughout the study area. There is also an opportunity for future research on this topic; it is important to estimate the tourism carrying capacity for specific sites in the region, especially those areas that are increasingly experiencing high numbers of tourism visitation.

Supplementary Materials

The following supporting information can be downloaded at https://www.mdpi.com/article/10.3390/su17167492/s1; Table S1: Flora species recorded by stratum in the study area; Table S2: Fauna species recorded by group in the study area; Table S3: Socio-economic profile of the study communities.

Author Contributions

Conceptualization, J.M.T.C., K.O.M. and E.G.S.; methodology, J.M.T.C., K.O.M. and E.G.S.; formal analysis, J.M.T.C., K.O.M. and E.G.S.; investigation, J.M.T.C., K.O.M. and E.G.S.; writing—original draft preparation, J.M.T.C., K.O.M. and E.G.S.; writing—review and editing, J.M.T.C., K.O.M. and E.G.S.; visualization, J.M.T.C., K.O.M. and E.G.S. All authors have read and agreed to the published version of the manuscript.

Funding

This research was funded by CONHACYT (The Mexican National Council for Science and Technology, now renamed as SECIHTI–Ministry of Cience, Humanities, Technology and Innovation) through grant number 1114563 to the first author.

Institutional Review Board Statement

The study was reviewed and approved by the Graduate Committee (Claustro Doctoral), which serves as the Ethics Committee of Tecnológico Nacional de México/Instituto Tecnológico de Cancún, based on the university guidelines for graduate studies.

Informed Consent Statement

Informed consent was obtained from all subjects involved in the study.

Data Availability Statement

Data is contained within the article and Supplementary Materials. Further inquiries can be directed to the corresponding author.

Conflicts of Interest

The authors declare that there are no conflicts of interest that may affect third parties in relation to the publication of this article.

References

  1. Barragán, J.M.; de Andrés, M. Expansión Urbana En Las Áreas Litorales de América Latina y Caribe. Rev. Geogr. Norte Gd. 2016, 64, 129–149. [Google Scholar] [CrossRef]
  2. Bazant-Fabre, O.; Bonilla-Moheno, M.; Martínez, M.L.; Lithgow, D.; Muñoz-Piña, C. Land Planning and Protected Areas in the Coastal Zone of Mexico: Do Spatial Policies Promote Fragmented Governance? Land Use Policy 2022, 121, 106325. [Google Scholar] [CrossRef]
  3. UNWT. ONU Turismo y el Sistema de las Naciones Unidas|ONU Turismo. Available online: https://www.unwto.org/es/onu-turismo-sistema-naciones-unidas (accessed on 7 December 2024).
  4. Matos-Márquez, L.A.; Pérez-Colmenares, S.V. Revisión sobre capacidad de carga turística y la prevención de problemas ambientales en destinos emergentes. Tur. Soc. 2018, 24, 77–100. [Google Scholar] [CrossRef]
  5. DATATUR. Datatur3—RankingOMT. Available online: https://datatur.sectur.gob.mx/SitePages/RankingOMT.aspx (accessed on 7 December 2024).
  6. SEDETUR. Indicadores Turísticos Enero—Diciembre 2019. Available online: https://sedeturqroo.gob.mx/ARCHIVOS/indicadores/Indicador-Tur-Dic-2019.pdf (accessed on 7 December 2024).
  7. Guimarais, M.; Zúñiga-Ríos, A.; Cruz-Ramírez, C.J.; Chávez, V.; Odériz, I.; van Tussenbroek, B.I.; Silva, R. The Conservational State of Coastal Ecosystems on the Mexican Caribbean Coast: Environmental Guidelines for Their Management. Sustainability 2021, 13, 2738. [Google Scholar] [CrossRef]
  8. SEDETUR. Secretaría de Turismo|Transparenciafocalizada.qroo.gob.mx. Available online: https://transparenciafocalizada.qroo.gob.mx/sedetur (accessed on 7 December 2024).
  9. de Esteban-Curiel, J.; Antonovica, A. El ecoturismo como modelo internacional de desarrollo sostenible del turismo cultural. Teor. Prax. 2010, 8, 43–53. [Google Scholar] [CrossRef]
  10. Cador-McCoy, C.E.; Sosa-Ferreira, A.P.; Sosa-Ferreira, A.P. Causas y efectos de un destino no sustentable: Caso playas públicas de Cancún, Quintana Roo. Periplo Sustentable 2016, 31, 1–16. Available online: https://www.scielo.org.mx/scielo.php?script=sci_arttext&pid=S1870-90362016000200006 (accessed on 7 December 2024).
  11. Gayosso-Soto, E.; Cohuo, S.; Sánchez-Sánchez, J.A.; Macario-González, L.; Villegas-Sánchez, C.A.; Medina-Quej, A.; Tello-Chan, J.M.; Cutz-Pool, L.Q.; Castro-Pérez, J.M. The Environmental Legal Framework of Mexican Caribbean Dunes: A Retrospective Case Study of Vegetation and Coastal Dune Loss in the Sian Ka’an Biosphere Reserve. Land 2024, 13, 1533. [Google Scholar] [CrossRef]
  12. García, C.M.; Casallas, J.F.R.; Riveros, O.C.V.; Valderrama, A.M. Turismo sostenible: Una conceptualización de su viabilidad para el municipio de Ibagué, desde un estado del arte pertinente. PASOS Rev. Tur. Patrim. Cult. 2017, 15, 21–34. [Google Scholar]
  13. Ganzo-Olivares, J.; Quintal-García, N.A.; Sánchez-Méndez, L.G.; Tamayo-Garza, J.F.; Vega-Cadena, U.J. Turismo Rural: Estrategia de Desarrollo Para las Comunidades de la Ribera del Río Hondo Quintana Roo, México. EBSCOhost. Available online: https://openurl.ebsco.com/contentitem/gcd:134728298?sid=ebsco:plink:crawler&id=ebsco:gcd:134728298 (accessed on 7 December 2024).
  14. Ceballos-Lascuráin, H. Tourism, Ecotourism, and Protected Areas: The State of Nature-Based Tourism Around the World and Guidelines for Its Development. Available online: https://iucn.org/resources/publication/tourism-ecotourism-and-protected-areas-state-nature-based-tourism-around (accessed on 7 December 2024).
  15. Ibañez-Pérez, R. Capacidad de carga turística como base para el manejo sustentable de actividades ecoturísticas en Unidades de Manejo Ambiental (UMA) de Baja California Sur (BCS). Periplo Sustentable 2016, 30, 37–76. Available online: https://www.scielo.org.mx/scielo.php?pid=S1870-90362016000100037&script=sci_abstract&tlng=pt (accessed on 7 December 2024).
  16. Cifuentes, M.; Mesquita, C.A.B.; Méndez, J.; Morales, M.; Aguilar, N.; Cancino, D.; Gallo, M.; Jolón, M.; Ramírez, C.; Ribeiro, N. Capacidad de Carga Turística de Las Áreas de Uso Público del Monumento Nacional Guayabo, Costa Rica. 1999. Available online: https://www.semanticscholar.org/paper/Capacidad-de-Carga-Turística-de-las-Áreas-de-Uso-Arias-Mesquita/f2c1b3b15cd0ade5fcee75d9596af8d78e9eb6cc (accessed on 7 December 2024).
  17. Morales-Betancourt, D. Capacidad de Carga Física y Real Para Atractivos Turístico Priorizados y Vías de Acceso en el Casco Urbano de Puerto Nariño, Amazonas (Physical and Real Carrying Capacity for Priority Tourism Attractions and Access Routes at the Urban Area of Puert O Nariño, Amazonas). 2015. Available online: https://papers.ssrn.com/sol3/papers.cfm?abstract_id=2646716 (accessed on 7 December 2024).
  18. Fernández, M.F.; Lazovski, O. La capacidad de carga de un municipio turístico a través de la estimación del tamaño “real” de la población: Dificultades y propuestas. Int. J. Sci. Manag. Tour. 2018, 4, 93–108. [Google Scholar]
  19. Montalvo-Vargas, R.; Castillo-Ramiro, J.J. Estimación de la capacidad de carga turística en agua selva (Tabasco—México): Base para la planificación y el desarrollo regional. Estud. Perspect. Tur. 2018, 27, 295–315. [Google Scholar]
  20. Alvarado-Sànchez, M.; Miranda-Álvarez, P.; Mora-Aparicio, K. La capacidad de carga turistica como herramienta de planificación en una iniciativa de turismos rural comunitario: Caso de La Posada Rural La Amistad, Isla de Chira, Golfo de Nicoya Costa Rica. Doc. Geogr. 2018, 2, 121–143. [Google Scholar] [CrossRef]
  21. Huaroc-Ponce, E.J.; Raqui-Ramirez, C.E.; Jurado-Taipe, R.S.; Huaroc-Ponce, N.M. Capacidad de carga Turística, base para el manejo sustentable: Gruta de Huagapo. Puriq 2021, 3, 34–46. [Google Scholar] [CrossRef]
  22. Cifuentes, M. Determinación de Capacidad de Carga Turística en Áreas Protegidas. Costa Rica. 1992. Available online: https://www.ucm.es/data/cont/media/www/pag-51898/1992_METODOLOGÍA%20CIFUENTES.pdf (accessed on 21 November 2024).
  23. Sobhani, P.; Esmaeilzadeh, H.; Sadeghi, S.M.M.; Marcu, M.V. Estimation of ecotourism carrying capacity for sustainable development of protected areas in Iran. Int. J. Environ. Res. Public Health 2022, 19, 1059. [Google Scholar] [CrossRef] [PubMed]
  24. Long, C.; Lu, S.; Chang, J.; Zhu, J.; Chen, L. Tourism environmental carrying capacity review, hotspot, issue, and prospect. Int. J. Environ. Res. Public Health 2022, 19, 16663. [Google Scholar] [CrossRef] [PubMed]
  25. Tokarchuk, O.; Gabriele, R.; Maurer, O. Estimating tourism social carrying capacity. Ann. Tour. Res. 2021, 86, 102971. [Google Scholar] [CrossRef]
  26. Garau, G.; Carboni, D.; Karim El Meligi, A. Economic and environmental impact of the tourism carrying capacity: A local-based approach. J. Hosp. Tour. Res. 2022, 46, 1257–1273. [Google Scholar] [CrossRef]
  27. Zelenka, J.; Kacetl, J. Visitor management in protected areas. Czech J. Tour. 2013, 2, 5–18. [Google Scholar] [CrossRef]
  28. Sharma, R. Evaluating total carrying capacity of tourism using impact indicators. Glob. J. Environ. Sci. Manag. 2016, 2, 187. [Google Scholar]
  29. Skiniti, G.; Lilli, M.; Skarakis, N.; Tournaki, S.; Nikolaidis, N.; Tsoutsos, T. A holistic approach for tourism carrying capacity estimation in sensitive ecological areas. Environ. Dev. Sustain. 2024, 26, 31971–31995. [Google Scholar] [CrossRef]
  30. Butler, R. Tourism area life cycle. Contemp. Tour. Rev. 2014, 1, 183–226. [Google Scholar]
  31. Hall, C.M. Tourism: Conceptualisations, disciplinarity, institutions and issues. In The Wiley Blackwell Companion to Tourism; John Wiley and Sons: Hoboken, NJ, USA, 2024; pp. 1–13. [Google Scholar]
  32. Yfantidou, G.; Matarazzo, M. The future of sustainable tourism in developing countries. Sustain. Dev. 2017, 25, 459–466. [Google Scholar] [CrossRef]
  33. Butler, R.W. Tourism carrying capacity research: A perspective article. Tour. Rev. 2020, 75, 207–211. [Google Scholar] [CrossRef]
  34. Pizzitutti, F.; Walsh, S.J.; Rindfuss, R.R.; Gunter, R.; Quiroga, D.; Tippett, R.; Mena, C.F. Scenario planning for tourism management: A participatory and system dynamics model applied to the Galapagos Islands of Ecuador. J. Sustain. Tour. 2017, 25, 1117–1137. [Google Scholar] [CrossRef]
  35. Driml, S.; Common, M. Ecological economics criteria for sustainable tourism: Application to the great barrier reef and wet tropics world heritage areas, Australia. J. Sustain. Tour. 1996, 4, 3–16. [Google Scholar] [CrossRef]
  36. Holland, K.K.; Larson, L.R.; Powell, R.B.; Holland, W.H.; Allen, L.; Nabaala, M.; Tome, S.; Seno, S.; Nampushi, J. Impacts of tourism on support for conservation, local livelihoods, and community resilience around Maasai Mara National Reserve, Kenya. J. Sustain. Tour. 2022, 30, 2526–2548. [Google Scholar] [CrossRef]
  37. Sulis, A.; Carboni, A.; Manca, G.; Yezza, O.; Serreli, S. Impacts of climate change on the tourist-carrying capacity at La Playa beach (Sardinia, IT). Estuar. Coast. Shelf Sci. 2023, 284, 108284. [Google Scholar] [CrossRef]
  38. Makhadmeh, A.; Al-Badarneh, M.; Rawashdeh, A.; Al-Shorman, A. Evaluating the carrying capacity at the archaeological site of Jerash (Gerasa) using mathematical GIS modeling. Egypt. J. Remote Sens. Space Sci. 2020, 23, 159–165. [Google Scholar] [CrossRef]
  39. Chougule, B. Environmental carrying capacity and ecotourism development. Int. J. Econ. Issues 2011, 4, 45–54. [Google Scholar]
  40. RAN-PHINA. Registro Agrario Nacional—PHINA—Padrón e Historial de Núcleos Agrarios. Available online: https://phina.ran.gob.mx/index.php (accessed on 7 December 2024).
  41. INEGI. Censo de Población y Vivienda 2020. Available online: https://www.inegi.org.mx/programas/ccpv/2020/ (accessed on 21 November 2024).
  42. Castillo-Ojeda, S.G. El Ejido y la Organización Política en Caobas, Quintana Roo. Bachelor’s Thesis, Universidad de Quintana Roo, Chetumal, Mexico, 2005. Available online: https://risisbi.uqroo.mx/handle/20.500.12249/3085 (accessed on 7 September 2024).
  43. González-Abraham, A.; Schmook, B.; Calmé, S. Distribución espacio-temporal de las actividades extractivas en los bosques del ejido Caoba, Quintana Roo. Investig. Geogr. 2007, 62, 70–86. Available online: https://www.scielo.org.mx/scielo.php?script=sci_arttext&pid=S0188-46112007000100005 (accessed on 21 November 2024). [CrossRef]
  44. NOM-107-SCT3-2019; Que Establece Los Requerimientos Para Operar Un Sistema de Aeronave Pi-Lotada a Distancia (RPAS) En El Espacio Aéreo Mexicano. DOF NORMA Oficial Mexicana: Ciudad de México, Mexico, 2019. Available online: https://www.dof.gob.mx/normasOficiales/8006/sct11_C/sct11_C.html (accessed on 1 September 2024).
  45. Reuter, M.; Schulz, C.; Marrufo, C. Manual Técnico Forestal-GTZ; GTZ-SEMARNAP: Chetumal, Mexico, 1998; Volume 1, Available online: https://www.scribd.com/document/399352478/Manual-Tecnico-Forestal-GTZ (accessed on 7 September 2024).
  46. Rivas-Torres, D. Evaluación de los Recursos Forestales. 2006. Available online: https://openknowledge.fao.org/items/1c0b62a7-4d27-42b2-8537-8b0a52cd9920 (accessed on 7 September 2024).
  47. Sánchez-Pérez, L.C. Plan de manejo para propiciar el aprovechamiento forestal sustentable de la Selva Mediana Subperennifolia del Ejido X-Hazil y Anexos, Felipe Carrillo Puerto, Quintana Roo. Master’s Thesis, Unversidad de Quintana Roo, Chetumal, Mexico, 2014. Available online: https://risisbi.uqroo.mx/handle/20.500.12249/147 (accessed on 7 September 2024).
  48. Expósito, M.; Diagnóstico Rural Participativo. Una Guía Práctica|FAO. 2003. Available online: https://books.google.com.mx/books?id=ntxx0AEACAAJ (accessed on 7 September 2024).
  49. Manzanilla, J.; Péfaur, J.E. Consideraciones sobre métodos y técnicas de campo para el estudio de anfibios y reptiles. Rev. Ecol. Lat. Am. 2000, 7, 14–17. [Google Scholar]
  50. Arellano-Rodríguez, J.A.; Flores, J.S.; Tun, J.; Cruz-Bojórquez, M.M. Nomenclatura, Forma de Vida, Uso, Manejo y Distribución de las Especies Vegetales de la Península de Yucatán; Etnoflora yucatanense; Fascicle 20; Universidad Autónoma de Yucatán, Facultad de Medicina Veterinaria y Zootecnia: Mérida, Mexico, 2003; ISBN 978-970-698-038-0. Available online: https://www.researchgate.net/publication/303517248_Nomenclatura_forma_de_vida_uso_manejo_y_distribucion_de_las_especies_vegetales_de_la_Peninsula_de_Yucatan (accessed on 21 November 2024).
  51. Pennington, T.D.; Sarukhán, J. Arboles Tropicales de México: Manual para la Identificación de las Principales Especies; UNAM: Mexico City, Mexico, 2005; ISBN 978-970-32-1643-7. [Google Scholar]
  52. Gallina-Tessaro, S.; López-González, C. Manual de Técnicas Para el Estudio de la Fauna Silvestre; Instituto de Ecología, A.C.: Xalapa, Mexico, 2011; Volume 1, ISBN 978-607-7740-98-8. [Google Scholar]
  53. Aranda-Sánchez, J.M. Manual Para el Rastreo de Mamíferos Silvestres de México. Available online: https://www.biodiversitylibrary.org/item/197385 (accessed on 9 October 2024).
  54. SNIB-CONABIO. Sistema Nacional de Información Sobre Biodiversidad (SNIB) de México. Available online: https://www.snib.mx/ (accessed on 9 October 2024).
  55. CICY. Flora: Península de Yucatán. Available online: https://www.cicy.mx/sitios/flora%20digital/bibliografia.html (accessed on 9 October 2024).
  56. Tropicos. Tropicos—Home. Available online: https://www.tropicos.org/home (accessed on 9 October 2024).
  57. Cury, S.P.; Arias-Astray, A. Hacia una definición actual del concepto de «diagnóstico social». Breve revisión bibliográfica de su evolución. Alternativas. Cuad. Trab. Soc. 2016, 23, 9–24. [Google Scholar] [CrossRef]
  58. Torres, M.; Salazar, F.G.; Paz, K. Métodos de Recolección de Datos Para una Investigación. 2006. Available online: http://148.202.167.116:8080/xmlui/handle/123456789/2817 (accessed on 9 October 2024).
  59. Balcazar, F.E. Investigación acción participativa (iap): Aspectos conceptuales y dificultades de implementación. Fundam. Humanidades 2003, 4, 59–77. [Google Scholar]
  60. Zapata, F.; Rondán, V. Investigacion Accion Participativa IAP Zapata y Rondan—La investigación—Acción Participativa; Serie Manuales y Herramientas para la Adaptación; Agencia de los Estados Unidos para el desarrollo Internacional (USAID); Instituto de Montaña: Lima, Peru, 2016. [Google Scholar]
  61. García-Hernández, M.; de la CAlle-VaqueroVaquero, M. Capacidad de carga en grandes recursos turístico-culturales. An. Geogr. Univ. Complut. 2012, 32, 253–274. [Google Scholar] [CrossRef]
  62. Martínez-Ramos, M.; García-Orth, X. Sucesión ecológica y restauración de las selvas húmedas. Bot. Sci. 2007, 80S, 69–84. [Google Scholar] [CrossRef]
  63. Navarro-Martínez, A.; Durán-García, R.; Méndez-González, M. El impacto del huracán Dean sobre la estructura y composición arbórea de un bosque manejado en Quintana roo, México. Madera Bosques 2012, 18, 57–76. [Google Scholar] [CrossRef]
  64. Flores-Guido, J.S.; Espejel-Carbajal, M.I. Tipos de Vegetación de la Península de Yucatán; Etnoflora yucatanense Fascículo; Universidad Autónoma de Yucatán: Mérida, Mexico, 1994; ISBN 978-968-6843-44-6. [Google Scholar]
  65. Aguirre-Cortés, E.; Escalona-Segura, G.; Macario-Mendoza, P.A.; León-Cortés, J.L.; Sánchez-Pérez, L.C.; Schmook, B. Aprovechamiento forestal y diversidad arbórea en seis ejidos de Quintana Roo. Rev. Mex. Cienc. For. 2020, 11, 79–96. [Google Scholar] [CrossRef]
  66. García-Trujillo, Z.H.M.K.; Torres-Pérez, J.A.; Avitia-Deras, A.; Cázares-Moran, M.A.; Abrego-Valenzuela, A.P. El Manejo Forestal Como Eje de Desarrollo Del Ejido Felipe Carrillo Puerto, Quintana Roo. LATAM Rev. Latinoam. Cienc. Soc. Humanid. 2023, 4, 2089–2098. [Google Scholar] [CrossRef]
  67. Peña-Azcona, I.; Ortega-Argueta, A.; García-Barrios, R.; Elizondo, C.; Peña-Azcona, I.; Ortega-Argueta, A.; García-Barrios, R.; Elizondo, C. Áreas de conservación voluntaria en México: Alcances y desafíos. Rev. Cienc. Ambient. 2022, 56, 120–145. Available online: https://www.redalyc.org/journal/6650/665073102007/html/ (accessed on 6 December 2024). [CrossRef]
  68. Morett-Sánchez, J.C.; Cosío-Ruiz, C. Outlook of Ejidos and Agrarian Communities in México. Agric. Soc. Desarro. 2017, 14, 125–152. [Google Scholar]
  69. Puente-Santos, E.D.; Pérez-Ramírez, C.A.; Solís-Barrón, C.I. Capacidad De Carga En Senderos Turísticos Del Centro De Cultura Para La Conservación Piedra Herrada, México. Quivera Rev. Estud. Territ. 2011, 13, 93–114. [Google Scholar]
  70. López-Bonilla, J.M.; López-Bonilla, L.M. La capacidad de carga turística: Revisión crítica de un instrumento de medida de sostenibilidad. Periplo Sustentable 2008, 15, 123–150. [Google Scholar] [CrossRef]
  71. SECTUR. Estudio Sobre la Capacidad de Carga Turística en las Localidades Donde se Ubicarán las Estaciones del Tren Maya; SECTUR: Ciudad de México, Mexico, 2019. Available online: http://sistemas.sectur.gob.mx/dgots/09-estudio-cct-localidades-tren-maya.pdf (accessed on 6 December 2024).
  72. Gasca-Zamora, J.; Torres, F.; Rojas Martínez, A.; Martínez, E.; Jouault, S.; Morales, F.; Almeida Poot, M.; Almanza, A.; Perez Akaki, P. Tren Maya. Impactos Territoriales y Escenarios de Cambio en la Península de Yucatán; Universidad Nacional Autónoma de México: Ciudad de México, Mexico, 2024; ISBN 978-607-30-9283-8. [Google Scholar]
  73. ONU-Habitat. ONU-Habitat Analiza el Impacto del Tren Maya. Available online: https://www.onu-habitat.org/index.php/onu-habitat-analiza-el-impacto-del-tren-maya (accessed on 6 December 2024).
  74. Ken-Rodríguez, C.A.; Monroy-Aguilar, S.; González-Fonseca, F.I. Comunidades de Quintana Roo y el Tren Maya: Las transformaciones territoriales y su aprovechamiento. Rev. Estud. Reg. Nueva Época 2023, 1, 116–145. [Google Scholar] [CrossRef]
  75. Ritchie, J.; Crouch, G. The Competitive Destination: A Sustainable Tourism Perspective; Tourism Management; CABI: Wallingford, UK, 2000; Volume 21, pp. 1–7. [Google Scholar] [CrossRef]
Figure 1. Flowchart of the methodology.
Sustainability 17 07492 g001
Figure 2. Geographic location of the state of Quintana Roo (a), project area of influence within the municipality of Othón P. Blanco (b), inside the Ejido Caoba (c), in the study area of Chichanha (d). Communities: Caobas and San José de la Montaña. The colored areas correspond to land use classifications defined by the Sistema de Monitoreo Forestal Satelital (SAMOF). The abbreviations refer to cultivated grassland (PC), induced grassland (PI), lowland tropical forest (selva baja, SBQ), medium-height sub-evergreen forest (selva mediana subperennifolia, SMQ), areas without apparent vegetation (DV), agricultural land (TA), tule vegetation (VT), savanna vegetation (VS), and urban area (ZU). The data can be accessed at https://snmf.cnf.gob.mx/cobertura-del-suelo/ (accessed on 26 November 2024).
Sustainability 17 07492 g002
Figure 3. Percentage of families (a) and number of species recorded by stratum (b) in the study area.
Sustainability 17 07492 g003
Figure 4. Percentage of families (a) and number of species recorded by fauna groups (b) in the study area.
Sustainability 17 07492 g004
Table 1. Assessment and scoring of management capacity criteria.
%ValueRating
≤350Unsatisfactory
36–501Slightly satisfactory
51–752Moderately satisfactory
76–893Satisfactory
≥904Highly satisfactory
Disclaimer/Publisher’s Note: The statements, opinions and data contained in all publications are solely those of the individual author(s) and contributor(s) and not of MDPI and/or the editor(s). MDPI and/or the editor(s) disclaim responsibility for any injury to people or property resulting from any ideas, methods, instructions or products referred to in the content.