Abstract
Addressing the need to optimize human settlement quality in arid and semi-arid regions under rapid urbanization, this study innovatively constructs an evaluation framework integrating greenness, thermal conditions, impervious surfaces, water bodies, and air transparency. Focusing on 12 prefecture-level cities in Inner Mongolia, Northern China, it systematically reveals the spatial differentiation characteristics and driving mechanisms of human settlement quality. Findings indicate the following: (1) Regional human settlement quality exhibits a spindle-shaped structure dominated by the medium grade (Excellent: 18.13%, High: 23.34%, Medium: 46.48%, Low: 12.04%), with Ulanqab City having the highest proportion of Excellent areas (25.26%) and Ordos City the lowest proportion of Low-grade areas (6.20%), reflecting a critical transition period for regional quality enhancement. (2) Spatial patterns show pronounced east-west gradients and functional differentiation: western arid zones display significant blue-green space advantages but face high-temperature stress and rigid water constraints, eastern humid zones benefit from superior ecological foundations with weaker heat island effects, the core Hetao Plain experiences strong heat island effects due to high impervious surface density, while industrial cities confront prominent air pollution pressures. Consequently, implementing differentiated strategies—strengthening ecological protection/restoration in High/Low-grade zones and optimizing regulation to drive upgrades in Medium-grade zones—is essential for achieving three sustainable pathways: compact development, blue-green space optimization, and industrial upgrading, providing vital decision-making support for enhancing human settlement quality and promoting sustainable development in ecologically fragile cities across northern China.
1. Introduction
As the fundamental carrier for human survival and development, the human settlement environment serves not only as the physical space underpinning residents’ daily lives and health but also as a critical nexus linking urban ecosystem services with socio-economic sustainable development [1,2]. Against the backdrop of global urbanization, accelerating urban growth has triggered unprecedented complex spatial transformations, intrinsically linked to the scale and pace of urban expansion [3,4]. United Nations data indicates that by 2050, the global urbanization rate will exceed 68%, with developing countries accounting for over 90% of urban population growth [5]. This rapid urban expansion has precipitated a series of severe challenges.
Amidst accelerated urban growth, compound issues including intensified urban heat island effects, atmospheric pollution dispersion, traffic congestion, and energy overload have become increasingly prominent [6,7]. Disorderly urban expansion drives a continuous sprawl of built-up areas, significantly increasing the proportion of impervious surfaces. This directly undermines urban ecosystems’ carbon sequestration capacity, climate regulation functions, and biodiversity maintenance [8]. Furthermore, through the transmission mechanism of deteriorating human settlement quality, it creates systemic bottlenecks constraining social equity, economic efficiency, and public health [9,10]. Notably, such unplanned expansion exponentially increases the frequency of extreme heat events [11], posing significant public health risks—particularly in ecologically fragile arid and semi-arid regions where urban heatwaves constitute a major livelihood challenge [12]. This reality starkly contrasts with the United Nations Sustainable Development Goals (SDGs 2030) vision of building safe, inclusive, and resilient sustainable cities, underscoring the urgency of research on optimizing human settlement environments amid rapid urbanization [13,14].
Under the dual pressures of urban spatial restructuring and accelerated growth, regulating three-dimensional spatial forms and configuring functional elements have emerged as key pathways for enhancing human settlement quality [15]. As urban spatial morphology evolves during growth, its regulation and functional configuration exert increasingly significant impacts on habitability. Studies demonstrate that optimizing green space systems can reduce urban heat island intensity by 5–8 °C, while the spatial heterogeneity of urban internal structure directly influences human comfort indices [16,17]. Current human settlement evaluation systems primarily fall into two categories [18]: micro-scale assessments of resident satisfaction and macro-scale quantitative evaluations employing comprehensive indicator systems encompassing urban structure, environment, and socio-economic factors [19]. Linear weighting models represent one of the most prevalent evaluation methods [20,21], with remote sensing and Geographic Information System (GIS) technologies being widely applied. However, the spatial complexity and element diversity introduced by urban growth make the scientific determination of indicator weights a major challenge in model application [22].
In this context, arid and semi-arid regions—characterized by fragile ecological foundations and acute human–land conflicts—have become paradigmatic for human settlement research [23,24]. Inner Mongolia Autonomous Region, a core area of China’s northern ecological security barrier, exhibits highly representative natural and socio-economic features [25]: spanning 2400 km east–west with annual precipitation decreasing in a gradient from east to west, forming an ecological transition zone encompassing humid, semi-arid, and arid regions [26,27]. Urban spatial distribution follows an “east-sparse, west-dense” pattern, with the Hetao Plain and southern foothills of the Yin Mountains concentrating over 60% of the population and economic activities, while western desert areas face dual pressures of water scarcity and ecological degradation [28]. In recent years, Inner Mongolia’s urbanization rate has grown at an annual average of 1.5%, exhibiting rapid urban expansion. However, extensive development patterns have resulted in impervious surface ratios far exceeding international livable city thresholds, leading to simultaneous increases in heat island intensity and ecological deficit risks [29,30].
Urban growth presents a double-edged sword, driving economic and social development while imposing substantial pressure on human settlements. Against this backdrop, in-depth investigation into the changing patterns of human settlement environments during urban growth is crucial for achieving sustainable urban development. This study selects 12 prefecture-level cities in Inner Mongolia as representative research areas to construct a comprehensive human settlement evaluation model. It aims to systematically assess the interrelationships between thermal environmental effects, spatial accessibility, and public service equity triggered by urban growth during regional urbanization, revealing their impacts on human settlement quality. The core objectives are twofold: (1) to analyze regional disparities in human settlement quality during urban growth across Inner Mongolia, uncovering environmental characteristics of different cities; and (2) to propose context-specific urban planning and development strategies adapted to urban growth for Inner Mongolia and similar arid/semi-arid regions, promoting their sustainable development. The findings will provide scientific foundations for formulating practical urban planning and construction strategies during urban growth, offering significant guidance for advancing the sustainable development of urban human settlement environments.
2. Materials and Methods
2.1. Overview of the Study Area
Inner Mongolia Autonomous Region is located in the northern border of China (37° N–54° N, 97° E–127° E), bordering Mongolia and Russia to the north and eight provincial-level administrative regions within China to the south [31]. It extends approximately 2400 km from east to west in a straight line, making it an important ecological security barrier in northern China. The total area of the region is 1.183 million square kilometers, and it currently governs 12 leagues and cities. This study takes the main urban districts of each league and city as typical research areas, including Hohhot (Saihan District, Huimin District, Xincheng District, Yiquan District), Baotou (Donghe District, Qing Shan District, Kundulun District, Jiuyuan District), Ordos (Dongsheng District; note: data from Kangbashi New District is not included in this study), Tongliao (Kherlen District), Chifeng (Songshan District, Hongshan District), Hinggan League (Ulanhot), Hulun Buir (Hailar District), Ulanqab (Jining District), Bayannur (Linhe District), Wuhai (Haibowan District), Xilingol League (Xilinhot), and Alxa League (Alxa Left Banner), as shown in Figure 1. The study area is primarily characterized by plateau topography, with an average elevation of about 1000 m and a typical temperate continental climate. Due to longitudinal zonality, annual precipitation shows significant spatial heterogeneity (100–500 mm), decreasing progressively from east to west, forming a gradient pattern of humid, semi-arid, and arid areas [32]. The regional differentiation of ecosystems is evident: the eastern part is dominated by forest–grassland–cropland composite systems, the central region is covered by large areas of typical grassland ecosystems, and the western region is primarily composed of desert ecosystems [33]. Urban spatial distribution follows an “east sparse, west dense” pattern, with the population concentrated mainly in the Hetao Plain and the southern foot of the Yin Mountains [34]. By the end of 2022, the region had a permanent population of 24.012 million and a Gross Regional Product (GRP) of 2.339 trillion yuan [30].
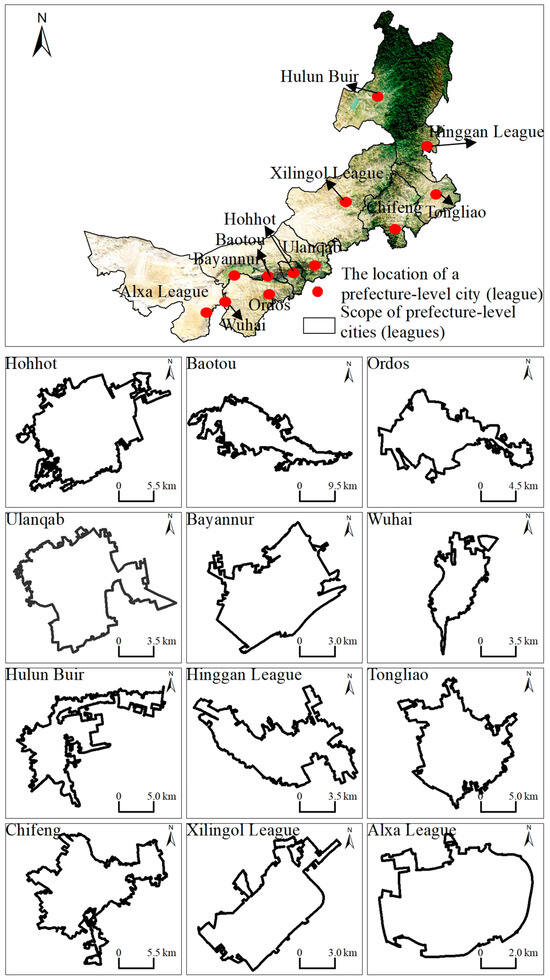
Figure 1.
Distribution of built-up areas of 12 prefecture-level cities in Inner Mongolia.
2.2. Data Collection and Processing
The data used in this study mainly includes remote sensing data, basic geographic information, socio-economic data, and other auxiliary data (Table 1). The remote sensing data primarily come from Landsat 8 OLI, GF1/2, DMSP/OLS, NPP/VIIRS, and others. The basic geographic information data include administrative boundaries, urban distribution, and road networks. Socio-economic data includes urban population, urbanization rate, and the output values of the secondary and tertiary industries. Auxiliary data includes administrative divisions, urban roads (main roads, secondary roads, and branch roads), POI (point of interest) information, housing patches, and urban permanent population data. The administrative divisions data is sourced from the National Basic Geographic Information Center, while road and POI data is downloaded from OpenStreetMap (OSM). The urban permanent population data is obtained from the Inner Mongolia Autonomous Region Statistical Yearbook. Verification data is sourced from high-resolution image data downloaded from the Google Earth Engine (GEE) platform (download level 18, with a spatial resolution of approximately 0.5 m; temporal coverage for 2022).

Table 1.
Data sources and description.
2.3. Methods
2.3.1. Definition of Urban Built-Up Area
The urban built-up area refers to the region within the administrative boundaries of a city where buildings, public facilities, and urban roads are relatively concentrated. In this study, the built-up area is defined based on the urban built-up area boundary information extracted from Landsat-8 OLI data. The outer boundary of the built-up area is typically rural, which, in remote sensing imagery, corresponds to large areas of farmland, forests, and other regions. Within the built-up area, the land is usually occupied by clustered urban buildings, public infrastructure, and other urban facilities.
2.3.2. Remote Sensing Classification for Refinement of Internal Structure of Urban Built-Up Areas
Urban Land Cover Information Extraction: In this study, a method combining Linear Spectral Mixing Analysis (LSMA) and the V-I-S model framework was used to systematically extract urban land cover information. The specific process is as follows: First, the 2020 Landsat-8 OLI image underwent Minimum Noise Fraction (MNF) transformation for noise reduction and dimensionality reduction. Based on the V-I-S model framework, four endmembers were selected: high/low albedo impermeable surface, vegetation, and bare soil. The constrained least squares method was applied to solve the mixed pixel decomposition model and retrieve the spatial distribution of component abundance. The LSDI (low albedo and soil difference index) was then used to separate impermeable surfaces from bare soil, and the Modified Normalized Difference Water Index (MNDWI) was used to extract water body information. Finally, a dynamic threshold decision tree classification method was employed to generate four land cover products: impermeable surfaces, vegetation, bare soil, and water bodies.
Urban Green Space and Park Information Extraction: This study employed multi-source remote sensing collaborative interpretation technology to systematically construct an urban green space spatial database for Inner Mongolia. The technical process includes three major modules: data acquisition and processing, information extraction, and accuracy validation. Based on the classification principles of hierarchical scales, Landsat-8 OLI images (cloud-free period from July to September) and OpenStreetMap road network data were integrated. After radiometric correction, Gram–Schmidt fusion, and Albers projection transformation, a 15 m resolution multispectral dataset was generated. Sub-meter-level image human–computer interactive interpretation was used to correct the built-up area boundaries. The MNF transformation was applied for noise reduction, and the V-I-S endmember selection was performed to construct four endmembers: high/low albedo impermeable surface, vegetation, and bare soil. The constrained linear spectral mixing model (LSMA) was used to retrieve component abundances. The LSDI index was applied to separate the spectral characteristics of impermeable surfaces and bare soil, and the MNDWI index was used to extract water body information. Finally, a dynamic threshold decision tree was used to generate four land cover products: impermeable surfaces, vegetation, bare soil, and water bodies.
2.3.3. Remote Sensing Inversion of Surface Temperature
This study localized and improved the parameters of the urban surface temperature retrieval model based on the single-window algorithm. The advantage of the single-window algorithm for surface temperature retrieval lies in the requirement for only two atmospheric parameters (atmospheric transmittance and average atmospheric temperature), while balancing both reliability and operability. Compared to traditional model methods, the improved surface temperature retrieval model, based on real-time meteorological data of air temperature, achieves higher retrieval accuracy. The surface temperature retrieval calculation formula is as follows:
In the formula, and are constants, where = −67.355351 and = 0.458606; and are intermediate parameters; is the satellite-derived brightness temperature (K); is the average atmospheric temperature (K); is the atmospheric transmittance; and is the surface emissivity. The surface emissivity is calculated using the NDVI threshold method to determine the surface emissivity based on vegetation coverage.
where is the vegetation cover, calculated as follows:
In the formula, is the Normalized Difference Vegetation Index, is the value for areas completely covered by bare soil or lacking vegetation, and represents the value of pixels completely covered by vegetation, i.e., the value for pure vegetation pixels.
The average atmospheric temperature and atmospheric transmittance are calculated using meteorological data. The average atmospheric temperature is determined by the temperature distribution of the atmospheric profile and the atmospheric conditions. The calculation formula is as follows:
In the formula, is the average atmospheric temperature, and is the near-surface atmospheric temperature (K).
To obtain atmospheric transmittance, it is first necessary to calculate the atmospheric water vapor content. The calculation method is as follows:
In the formula, represents the atmospheric water vapor content; and refer to the 19th and 2nd bands of MODIS data, respectively; and represent the atmospheric transmittance calculated based on atmospheric water vapor content and the atmospheric transmittance correction term, respectively.
For brightness temperature, Landsat OLI data uses DN (Digital Number) values to represent the intensity of radiation energy received by the satellite sensor. To retrieve the surface temperature, the radiative intensity values must first be converted into the corresponding brightness temperature:
In the formula, represents the brightness temperature of the thermal infrared band of Landsat OLI data; and are constant coefficients; and is the thermal radiance value. For Landsat OLI data, the constants are = 774.89 and = 1321.08.
2.3.4. Methods for Evaluating the Quality of Urban Habitat
Based on the coupling technology of remote sensing and geographic information systems, this study constructs a comprehensive evaluation framework for urban residential environment quality. Firstly, for core modules such as urban greenery environment indicators, urban heat environment indicators, urban greyscape environment indicators, and urban water body environment indicators, remote-sensing parameters such as the normalized vegetation index, vegetation coverage, and surface temperature retrieval, as well as the proportion of blue-green space, are used for spatial representation (Table 2). After rasterizing each indicator layer, multi-dimensional environmental evaluation results are generated through geographic weighted overlay analysis. Given the differences in dimensions and measurement units of multi-source heterogeneous data, this study employs range normalization to standardize the indicators.
Table 2.
Factor index system for comprehensive evaluation of urban habitat quality in prefecture-level cities.
This study uses principal component analysis (PCA) to assign weights to the indicator system. This method transforms the original variables into linearly uncorrelated principal components through orthogonal transformation, effectively integrating quantitative data features and system hierarchical structure characteristics. The process involves three key steps: first, calculating the eigenvalues and contribution rates based on the correlation coefficient matrix; then, extracting principal component loadings through variance-maximizing rotation; and finally, determining indicator weights based on the component score coefficient matrix. During the weight synthesis phase, methods such as weighted average and extreme value balancing are generally used. After comparative analysis, this study employs the weighted summation method for analyzing and evaluating urban residential environment quality, expressed as follows:
In the formula, P represents the Integrated Fertility Index (urban residential environment quality index); is the membership degree of the i-th evaluation indicator; and is the combined weight of the i-th evaluation indicator. The classification is determined based on the comprehensive index of residential environment quality for each evaluation unit. The residential environment quality evaluation system is divided into four levels: Excellent (≥0.8134), High (0.7626–0.8134), Medium (0.6835–0.7626), and Low (<0.6835).
3. Results
3.1. Characterization of the Internal Structure of Prefecture-Level Cities
The land cover structure of the urban built-up areas in the 12 prefecture-level cities of Inner Mongolia exhibits significant spatial heterogeneity (Figure 2). Of the total built-up area of 1256.7 km2 in the region, impermeable surfaces account for 67.0% (842.6 km2), while green space occupies 29.3% (368.5 km2). Together, these two categories represent more than 96.3%, reflecting the typical characteristics of urbanization, where high-intensity land hardening coexists with limited ecological baseline protection. Water bodies (1.9%, 23.8 km2), bare soil (1.6%, 20.6 km2), and other land types (0.2%, 2.2 km2) account for less than 4% of the total area. Spatial differentiation analysis indicates that impermeable surfaces follow a “core-edge” gradient pattern. The core urban areas of the Hetao Plain (Chifeng 75.53%, Bayannur 73.78%, Hohhot 71.43%) form high-value clusters with hardening intensity exceeding the regional average (67.0% ± 5.2%), while the industrial and mining cities of Baotou (69.76%) and Ordos (69.12%) form the next highest gradient. In contrast, Ulanqab (56.60%) with ecological conservation policies and the desert-dominated Alxa League (50.52%) form low-value cores. The spatial pattern of the green space system shows a zonal structure. In the western arid region, Alxa League (42.52%) and Ulanqab (39.64%), benefiting from desert oasis restoration projects, form high-value cores, while the eastern humid transitional belt, including Hulun Buir (36.18%) and Tongliao (33.92%), maintains green space coverage between 30% and 35%. Chifeng (21.55%) has a green space coverage lower than the regional average of 34%, raising concerns about the potential risk of carbon sink function decline. Water body distribution shows a dispersed pattern, with nodes such as Tongliao (4.32%) and Ordos (3.15%) exceeding the 2% water body benchmark for arid areas, closely related to over-extraction of groundwater and artificial water body construction. In contrast, Alxa League (0.87%) and Bayannur (0.92%), constrained by an annual average precipitation of less than 200 mm, have less than 1% water bodies, highlighting the rigid constraints of water resource carrying capacity on urban ecosystems.
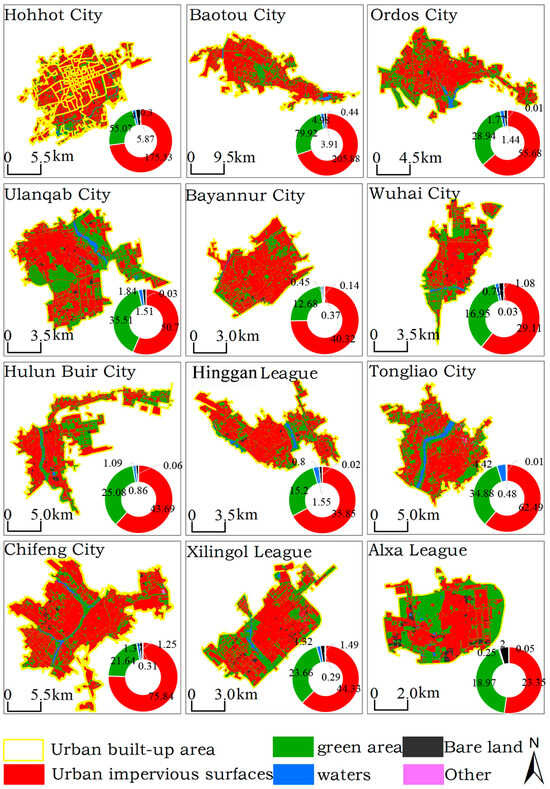
Figure 2.
Land cover structure of urban built-up areas in 12 prefecture-level cities in Inner Mongolia.
Research based on the coupling perspective of blue-green space reveals significant spatial differentiation in the ecological baseline of urban built-up areas in Inner Mongolia (Figure 3). The average proportion of blue-green space in the region is 31.19%, with the western arid region’s Alxa League (43.07%) and Ulanqab City (41.69%) at the northern foot of the Yin Mountains forming a high-value dual core. Their ecological baseline advantages are closely related to desert oasis restoration projects and the mountain ecological barrier effect. In contrast, the core urban areas of the Hetao Plain exhibit a clear low-value clustering pattern. The proportions of blue-green space in Baotou (28.77%), Hohhot (24.55%), Bayannur (24.34%), and Chifeng (22.91%) are all below 30%, reflecting the ecological space compression effect caused by high-intensity urbanization. The blue-green space proportions in the remaining prefecture-level cities range from 30% to 40%. Furthermore, blue-green space in the urban built-up areas of each city shows a “peripheral enrichment—central scarcity” distribution pattern, with the proportion of blue-green space in the core built-up area (25.3% ± 4.1%) being lower than in the peripheral transition zone (38.7% ± 5.6%). This characteristic is particularly prominent in industrial and mining cities such as Baotou and Ordos.
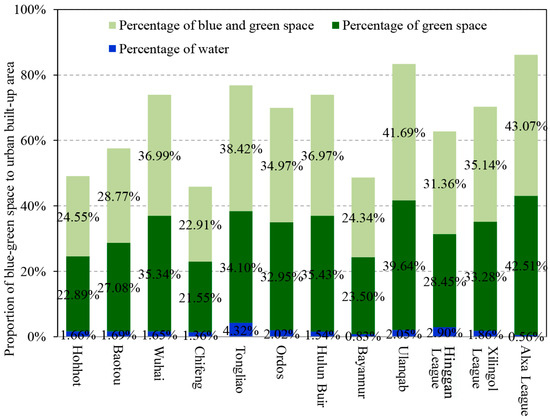
Figure 3.
Blue-green space ratio of urban built-up areas in 12 prefecture-level cities in Inner Mongolia.
Spatial analysis based on high-resolution remote sensing data reveals significant spatial heterogeneity in the distribution of urban park and green space resources in Inner Mongolia (Figure 4). The total area of urban park green spaces in the region is 74.14 km2, and its spatial distribution follows a “core aggregation—peripheral dispersion” gradient pattern. From the perspective of total resource allocation, Baotou (20.00 km2), Ulanqab (14.05 km2), and Hohhot (13.99 km2) form the core aggregation area, accounting for 64.8% of the total, while the ecologically fragile Alxa League (3.25 km2) accounts for only 4.4%. Structural analysis shows that in Ulanqab, park green spaces make up 50.20% of the total urban green space area, forming a “park-dominated” ecological spatial structure. Cities like Wuhai (35.70%) and Hohhot (28.83%) display a “composite-function” characteristic. In contrast, the low proportions in Hinggan League (6.33%) and Chifeng (5.55%) indicate a severe imbalance in the service functions of their green space systems.
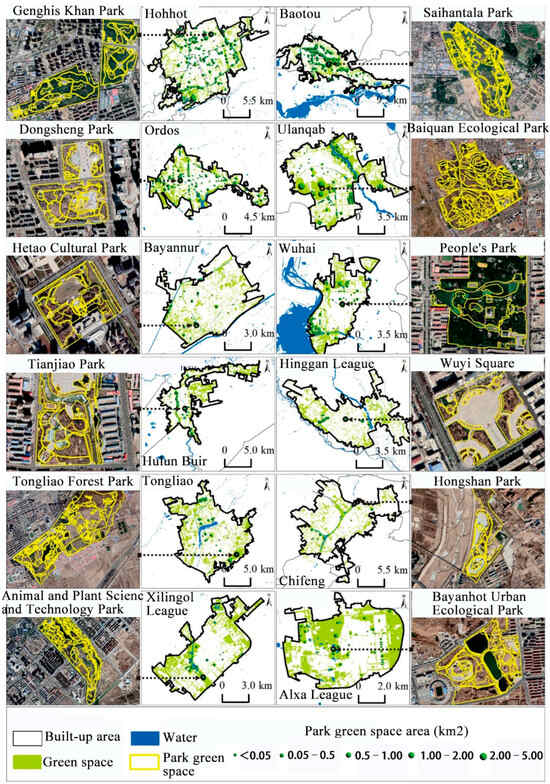
Figure 4.
Spatial Distribution Patterns of Urban Green Space and Park Green Space in 12 Prefecture-Level Cities of Inner Mongolia.
3.2. Analysis of Urban Environmental Factors in Prefecture-Level Cities
This study, based on multi-source remote sensing data fusion technology, integrates Landsat-8 thermal infrared bands, aerosol optical thickness products, and traffic network data to construct a comprehensive urban residential environment quality evaluation system that incorporates both natural elements and artificial environmental features. The study focuses on the spatiotemporal differentiation patterns of key environmental factors, including the urban heat island effect, the air quality index characterized by PM2.5 concentrations, and traffic accessibility. Using the single-window algorithm, the surface temperature of 12 prefecture-level cities in Inner Mongolia for August 2020 was retrieved. The results show that the thermal environment in the study area exhibits significant spatial heterogeneity (Figure 5). The Hohhot–Baotou–Ordos urban agglomeration displays a high-intensity urban heat island effect, with surface temperatures in the built-up areas generally exceeding 35 °C, and extreme high temperatures reaching over 45 °C in industrial clusters, highlighting the severe thermal stress in industrial cities. In the eastern ecological barrier zone (Hulun Buir-Hinggan League), the forest–grassland composite ecosystem regulates the temperature, with core urban areas maintaining stable temperatures between 20 °C and 25 °C, and temperatures in the grassland regions even drop below 15 °C, creating a significant thermal gradient. The western arid region, Alxa League, exhibits a unique “bimodal” thermal pattern, with a high-temperature core in the built-up areas (>40 °C) and surrounding desert regions experiencing extreme temperatures over 50 °C, creating a thermal coupling effect. This pattern reveals the decisive impact of surface characteristics on the energy balance of the land surface. Furthermore, urban park green spaces, through vegetation transpiration and canopy shading effects, can reduce surface temperatures by 5–8 °C compared to the surrounding impervious areas, confirming that optimizing the scale and structure of green spaces is a key strategy for mitigating urban heat islands.
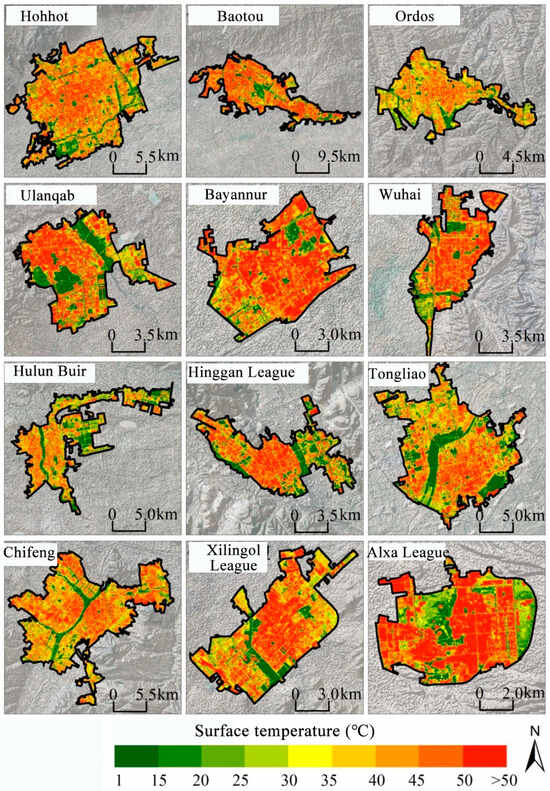
Figure 5.
Surface temperature of built-up areas in 12 prefecture-level cities in Inner Mongolia in August 2020.
This study selects PM2.5 as an indicator of air quality, and the spatial distribution of PM2.5 concentrations in the urban built-up areas of Inner Mongolia’s prefecture-level cities in 2020 is shown in Figure 6. The results indicate a significant spatial gradient of PM2.5 pollution in the study area: industrial and mining cities have an annual average concentration exceeding the 50 μg/m3 threshold, with Wuhai (55–65 μg/m3) and Baotou (45–60 μg/m3) showing high-value areas that are linearly concentrated along industrial parks. Agricultural cities in the Hetao Plain, such as Bayannur (46–51 μg/m3) and Tongliao (41–56 μg/m3), have annual average concentrations exceeding the 40 μg/m3 threshold. In stark contrast, Xilingol League, regulated by the grassland ecosystem, maintains a stable annual average concentration between 19 and 21 μg/m3, which is considered a clean level and is 62.3–68.4% lower than that of industrial cities, highlighting the suppressive effect of ecological barriers on air pollution.
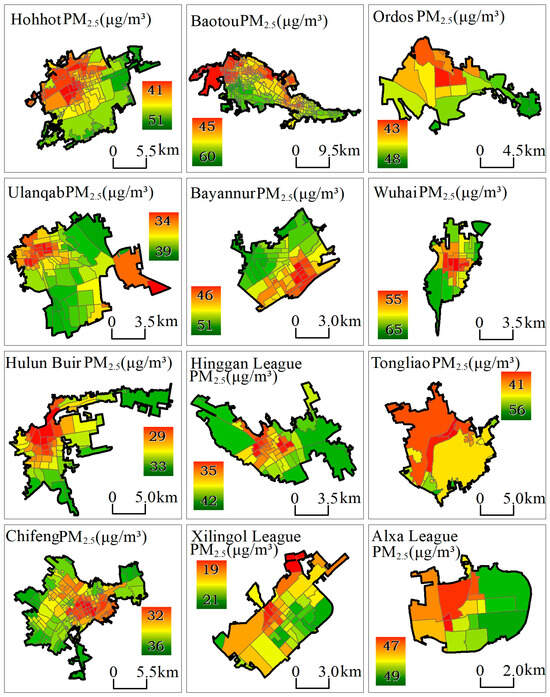
Figure 6.
Spatial distribution of average PM2.5 concentrations in 12 prefecture-level cities in Inner Mongolia in 2001–2020.
This study, based on high-resolution remote sensing imagery interpretation and traffic network vector data fusion, systematically reveals the spatial differentiation patterns of traffic network density and its driving mechanisms in the prefecture-level cities of Inner Mongolia (Figure 7). The results indicate that the proportion of traffic land use follows a gradient pattern of “high in industrial and mining cities—low in ecological barrier areas.” Ordos, as a national energy and chemical industry base, has a traffic land use proportion of 16.04%, highlighting the driving effect of heavy industry logistics demand on transportation infrastructure. The urban agglomeration in the Hetao Plain (Hohhot 15.06%, Chifeng 14.89%, Ulanqab 14.96%) and the eastern agricultural regions (Tongliao 14.44%, Hinggan League 14.64%) form a secondary high-gradient group, with a traffic network pattern characterized by a “central radial—peripheral grid” composite structure. In contrast, Alxa League, constrained by desert terrain and low population density, has a traffic land use proportion of only 7.82%, forming an island-like distribution pattern.
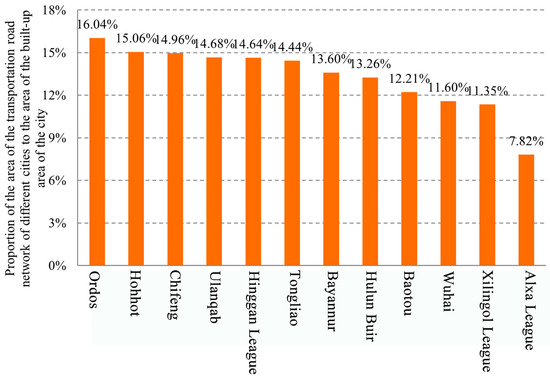
Figure 7.
Proportion of transportation road network area to built-up area in 12 prefecture-level cities in Inner Mongolia in 2020.
3.3. Comprehensive Evaluation of the Quality of Urban Habitat in Prefecture-Level Cities
The integrated residential environment quality evaluation model constructed in this study, based on multi-source data fusion, indicates that the suitability of urban built-up areas for residential environments in Inner Mongolia exhibits significant gradient differentiation (Figure 8). Overall, it presents a spatial pattern of “ecology-dominated excellence, industrial and mining-intensive lag.” Specifically, the area proportions of high, medium, and low residential environment quality levels in the region are 18.13%, 23.34%, 46.48%, and 12.04%, respectively, forming a “large middle, small ends” spindle-shaped structure. This reflects that the region’s residential environment development is at a key transformative stage for improving quality and efficiency. In terms of the distribution of high-quality areas, Ulanqab ranks first with 25.26% of its area in the excellent category, followed by Hinggan League (24.23%), Tongliao (22.73%), and Hulun Buir (22.23%). These regions, with an excellent area proportion exceeding 20%, form a concentrated belt of high-quality residential environments. The remaining leagues and cities have excellent area proportions ranging between 15% and 20%, with a relatively balanced spatial distribution. Low-quality areas show a marked spatial polarization, with Wuhai (17.25%) and Bayannur (17.16%) forming a low-value dual core. Baotou (15.05%), Alxa League (14.91%), Hulun Buir (11.65%), Hinggan League (11.39%), Hohhot (11.34%), and Xilingol League (11.13%) all have low-quality area proportions exceeding 10%, forming a contiguous low-quality area around the Hetao Plain. Ordos, however, has the lowest proportion of low-quality areas at only 6.20%, making it a prominent highlight in the region’s efforts to optimize residential environment quality.
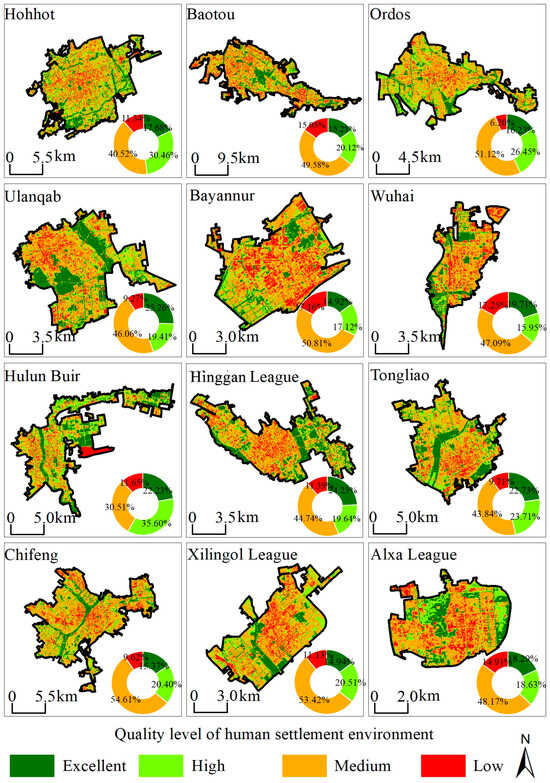
Figure 8.
Distribution of Habitat Quality Levels in Built-up Areas of 12 Prefecture-Level Cities in Inner Mongolia.
4. Discussion
This study reveals significant spatial heterogeneity in urban human settlement quality across Inner Mongolia Autonomous Region, with Ulanqab City exhibiting the highest proportion of high-quality areas (38.7%) within its built-up zone. This spatial differentiation reflects the coupled interactions within the urban ecological–economic–social systems characteristic of arid regions. From an urban structural perspective, Ulanqab excels in green space provision, featuring high green coverage and a blue-green space proportion of 41.69%, establishing a solid ecological foundation (Supplementary Table S2) [35]. Abundant green space regulates the microclimate through photosynthesis and evapotranspiration, mitigating the urban heat island effect, enhancing air humidity, purifying air, and ultimately improving residents’ living environment with fresher air and more comfortable temperatures [36]. Regarding park allocation, parks constitute 50.20% of Ulanqab’s total green space, signifying highly accessible recreational spaces and ecosystem services for residents [37], such as walking, exercise, and nature engagement, significantly enhancing quality of life [38]. Analyzing transportation, Ulanqab’s road network density ranks in the second-highest tier, with transport land use accounting for 14.96% [39]. This well-developed network improves travel convenience, strengthens inter-district connectivity [39], promotes efficient resource flow and allocation, fosters balanced urban development, and further optimizes settlement quality [40]. Ulanqab’s success provides a replicable “ecological priority” planning blueprint for arid/semi-arid cities; its high green coverage, optimized park service radii, and balanced transport network configuration offer direct lessons for urban renewal, new district development, community green space planning, park service area delineation, and public transit optimization in cities with similar ecological baselines, tangibly enhancing daily environmental quality and convenience.
Ordos City has the lowest proportion of low-grade settlement areas (6.20%), indicating superior land–surface environmental conditions resulting from multiple synergistic factors. In urban development planning, Ordos emphasizes harmonizing ecological protection with construction, potentially involving rational zoning of industrial, commercial, and residential areas from the outset to minimize pollution and disturbance [41,42]. Economically, despite an industrial base, Ordos actively promotes industrial transformation and upgrading, increasing investment in high-tech and service sectors while reducing reliance on high-pollution, high-energy-consumption industries, effectively safeguarding air quality [43,44]; for instance, its acceptable PM2.5 concentration creates a healthier living environment [45]. Ecologically, Ordos enhanced protection and development of urban green spaces and water bodies [46]; although its blue-green space proportion is not the highest, a focus on ecological restoration and greening has increased ecosystem stability and service functionality [47]. Transport-wise, Ordos leads in transport land-use proportion (14.96%), with its core area road network density reaching 8.6 km/km2 [47]; this efficient system reduces exhaust emissions and noise pollution from congestion, improves urban operational efficiency, and indirectly enhances settlement quality [47]. Ordos exemplifies the effectiveness of “industry-city integration” and “low-impact development” principles; its experience demonstrates that strictly delineating functional zones, reserving ecological space, promoting green industrial transitions, and building efficient, intensive transport infrastructure are key pathways for resource-based cities to achieve high-quality, sustainable human settlements, meaning community planning must ensure residential areas are distanced from pollution sources and have access to convenient green mobility and ample community-level green space.
Regional analysis reveals distinct human settlement characteristics and constraints: High-density cities in the Hetao Plain (Hohhot, Baotou, Bayannur, Chifeng) exhibit significant coupling between high impervious surface density (60–70%) and strong heat island effects (average temperature > 38 °C), necessitating strategies like “infill greening” (leaving space for green development), rooftop greening, vertical greening to reduce hardened surfaces, alongside constructing continuous ecological and ventilation corridors to alleviate thermal stress [40]; industrial/mining cities (Baotou, Wuhai) are critical areas due to excessive PM2.5 levels (>40 μg/m3), requiring optimized industrial layouts and ecological buffer forests to block pollution dispersion; western arid cities (Alxa League) face dual pressures of water scarcity (water body proportion < 1%) and extreme heat (>40 °C), demanding strict limits on water-intensive landscapes, promotion of drought-tolerant vegetation and compact urban forms, and reinforcement of desert fringe ecological barriers; eastern ecologically advantaged cities (Hulunbuir, Hinggan League) maintain low heat island and pollution advantages but require proactive measures like establishing ecological protection redlines to prevent urban encroachment on sensitive spaces [42]; consequently, core conservation areas and sensitive zones must be strictly protected by statutory ecological redlines, prioritized for avoidance in urban growth boundary delineation, and community projects require ecological impact assessments to prevent occupation of critical ecological space [42].
Regarding regional applicability, the evaluation framework demonstrates high transferability within arid/semi-arid regions, particularly for areas characterized by “ecological fragility and accelerated urbanization” (e.g., Central Asian steppe cities, western North American Great Plains cities), where the blue-green space and thermal stress coupling analysis directly informs ecological planning; however, transfer to humid or high-altitude cold regions requires indicator weight adjustments: for humid cities (e.g., Southern China coastal cities), increase water-related indicator weights due to flood risk as a key constraint [45], while plateau cities require specific indicators like altitude and ultraviolet radiation to reflect hypoxic impacts on comfort [45]. Considering city type differences, the model adapts well to comprehensive cities but requires supplementary indicators for specialized cities: resource-based cities need strengthened soil heavy metal pollution monitoring, and tourist cities should incorporate landscape aesthetic evaluation indicators [47]; transfer challenges include disparities in regional remote sensing data availability, difficulties in standardizing ecological baseline data, and biases in assessment dimensions arising from socio-cultural differences.
The remote sensing-based comprehensive evaluation framework developed, integrating multi-source data to assess core dimensions (greenness, heat, impervious surfaces, water bodies, air transparency), effectively reveals spatial differentiation of human settlement quality in northern China’s prefecture-level cities. However, limitations exist: while covering key physical and natural dimensions, the framework inadequately reflects human activity intensity and socioeconomic factors; crucial elements like population density, accessibility to public services (schools, hospitals, cultural facilities), and resident perception/satisfaction data are absent, factors vital for understanding livability and well-being and indispensable for a holistic view of “human settlement quality.” Similarly, decisive policy factors (e.g., ecological redline delineation/enforcement, urban planning regulations, industrial policy orientation) are challenging to quantify and integrate due to reliance on physically derived remote sensing indicators. Therefore, future research must prioritize further multi-source data integration, particularly fusing remote sensing with socioeconomic surveys and policy text analysis, to construct a multi-dimensional coupled evaluation model encompassing the “Natural Environment—Human Activity—Policy Response” nexus.
5. Conclusions
This study proposes a comprehensive human settlement quality evaluation model, utilizing multi-source data to investigate the spatial structure of urban built-up areas, key settlement quality factors, and environmental suitability. It aims to provide a thorough analysis of regional urban development characteristics and human settlement conditions, offering a scientific basis for sustainable urban development. The main conclusions are as follows:
- (1)
- In 2020, the total area of urban built-up land across the 12 prefecture-level cities in Inner Mongolia was 1257.67 km2, with impervious surfaces constituting the largest proportion (842.58 km2). Spatially, impervious surface coverage exhibited a “core-periphery” zonal pattern: the core Hetao Plain urban agglomeration (Hohhot, Baotou, Bayannur) had densities exceeding 60%, forming high-density hardened surface clusters. In contrast, the eastern humid transition zone (Hulunbuir, Tongliao) and western desert oasis cities (Alxa League) showed impervious surface proportions below 50%. Furthermore, the western arid zone (Alxa League, Ulanqab) exhibited blue-green space proportions exceeding 40%, forming high-value cores supported by the desert oasis ecological base.
- (2)
- Land surface temperatures in the western arid zone (Alxa League, Ordos) exceeded 40 °C, with high-temperature cores coupled with the desert substrate creating significant thermal stress. The eastern humid zone (Hulunbuir, Hinggan League) maintained average temperatures below 35 °C, where vegetation cover and water distribution effectively mitigated heat island intensity. Industrial-mining cities (Baotou, Wuhai) had PM2.5 concentrations exceeding 40 μg/m3, while ecologically dominant cities (Ulanqab, Hulunbuir) maintained levels below 30 μg/m3. Additionally, transportation network density showed a differentiation pattern of “higher in industrial-commercial cities, lower in ecological cities,” with Ordos City reaching 8.6 km/km2, significantly higher than peripheral cities like Alxa League (7.82%).
- (3)
- The area classified as “Excellent” human settlement quality across the 12 cities totaled 227.76 km2. The “Medium” grade constituted the largest proportion (46.48%). Ulanqab City had the highest share of “Excellent” areas (25.26%), while Wuhai City had the highest share of “Low” grade areas (17.25%). Ordos City had the lowest proportion of “Low” grade areas (6.20%), indicating a superior land–surface environment.
The human settlement quality evaluation framework (assessing Greenness, Thermal conditions, Impervious surfaces, Water bodies, and Air transparency) and the resulting quality grades (Excellent, High, Medium, Low) provide a precise spatial diagnostic tool and decision-making basis for urban planning and management. The spindle-shaped grade structure (Medium-grade dominating at 46.48%) reveals that the region’s human settlements are in a critical transition period focused on quality enhancement and efficiency gains. This evaluation framework, combined with the revealed spatial differentiation patterns, offers robust scientific support for arid and semi-arid region cities to implement three key sustainable pathways: compact development, blue-green space optimization, and industrial upgrading.
Supplementary Materials
The following supporting information can be downloaded at: https://www.mdpi.com/article/10.3390/su17167473/s1, Table S1. Statistics on the area of parks and green Spaces in 12 prefecture-level cities of Inner Mongolia; Table S2. Different indicators of the 12 leagues and cities in Inner Mongolia.
Author Contributions
Conceptualization, F.G. and J.L.; methodology, F.G.; software, L.J.; validation, F.G., J.L., and G.C.; formal analysis, F.G.; investigation, C.W.; resources, Y.W.; data curation, F.G.; writing—original draft preparation, F.G.; writing—review and editing, H.C.; visualization, F.M.; supervision, J.L.; project administration, F.G.; funding acquisition, J.L. All authors have read and agreed to the published version of the manuscript.
Funding
This research was funded by Research on Key Technologies for Enhancing Urban Spatial Quality Based on Population Big Data Changes, grant number NMGZCS-G-F-240154-1; Key technology and application of ecological quality diagnosis and integrated management of “Beautiful Inner Mongolia”, grant number 2019GG010; The Science and Technology Innovation Project of Inner Mongolia Autonomous Region Department of Natural Resources “Application Research on Land Spatial Resilience Pattern and Implementation Path in the Yellow River Basin of Inner Mongolia”; Natural Science Foundation of Inner Mongolia Autonomous Region, grant number 2024MS03048; First-class Discipline Research Special Project, grant number YLXKZX-NSD-033; and Student Science and Technology Innovation Project for the Inner Mongolia Normal University, grant number 2025XSKC17.
Institutional Review Board Statement
Not applicable.
Informed Consent Statement
Not applicable.
Data Availability Statement
The dataset is available upon request from the authors. The raw data supporting the conclusions of this article will be made available by the authors upon request.
Conflicts of Interest
The authors declare no conflicts of interest.
References
- Grimm, N.B.; Faeth, S.H.; Golubiewski, N.E.; Redman, C.L.; Wu, J.; Bai, X.; Briggs, J.M. Global Change and the Ecology of Cities. Science 2008, 319, 756–760. [Google Scholar] [CrossRef]
- Kong, F.; Sun, S.; Lei, T. Understanding China’s Urban Rainstorm Waterlogging and Its Potential Governance. Water 2021, 13, 891. [Google Scholar] [CrossRef]
- Liu, M.; Wei, H.; Dong, X.; Wang, X.-C.; Zhao, B.; Zhang, Y. Integrating land use, ecosystem service, and human well-being: A systematic review. Sustainability 2022, 14, 6926. [Google Scholar] [CrossRef]
- Rodriguez, R.S.; Ürge-Vorsatz, D.; Barau, A.S. Sustainable Development Goals and climate change adaptation in cities. Nat. Clim. Change 2018, 8, 181–183. [Google Scholar] [CrossRef]
- dos Santos, D.M.; Libonati, R.; Garcia, B.N.; Geirinhas, J.L.; Salvi, B.B.; e Silva, E.L.; Rodrigues, J.A.; Peres, L.F.; Russo, A.; Gracie, R.; et al. Twenty-first-century demographic and social inequalities of heat-related deaths in Brazilian urban areas. PLoS ONE 2024, 19, e0295766. [Google Scholar] [CrossRef]
- National Development and Reform Commission. Evaluation Index System and Implementation Plan for Building a Beautiful China; National Development and Reform Commission: Beijing, China, 2022. (In Chinese) [Google Scholar]
- Papamichael, I.; Voukkali, I.; Stylianou, M.; Naddeo, V.; Ksibi, M.; Zarra, T.; Zorpas, A.A. Sustainable production and consumption. Euro-Mediterr. J. Environ. Integr. 2024, 9, 2003–2008. [Google Scholar] [CrossRef]
- Xie, T.; Zhang, Y.; Song, X. Research on the spatiotemporal evolution and influencing factors of common prosperity in China. Environ. Dev. Sustain. 2024, 26, 1851–1877. [Google Scholar] [CrossRef]
- Yin, Z.; Kuang, W.; Bao, Y.; Dou, Y.; Chi, W.; Ochege, F.U.; Pan, T. Evaluating the Dynamic Changes of Urban Land and Its Fractional Covers in Africa from 2000–2020 Using Time Series of Remotely Sensed Images on the Big Data Platform. Remote Sens. 2021, 13, 4288. [Google Scholar] [CrossRef]
- Bogenschutz, P.; Eldred, C.; Caldwell, P. Horizontal Resolution Sensitivity of the Simple Convection-Permitting E3SM Atmosphere Model in a Doubly Periodic Configuration. J. Adv. Model. Earth Syst. 2023, 15, e2022MS003466. [Google Scholar] [CrossRef]
- Wang, Y.Y. Temporal and Spatial Evolution Patterns and Influencing Factors of Urban Heat Island and Air Quality in China; East China Normal University: Shanghai, China, 2018. (In Chinese) [Google Scholar]
- Lee, C.; Kim, K.; Lee, H. GIS based optimal impervious surface map generation using various spatial data for urban nonpoint source management. J. Environ. Manag. 2018, 206, 587–601. [Google Scholar] [CrossRef]
- Wang, J.L.; Wang, H. Analysis of the new edition of classification standard of urban green space. Chin. Gard. 2019, 35, 98–101. (In Chinese) [Google Scholar]
- Fang, C.L.; Yang, J.Y.; Kuang, W.H. Basic Schemes and Suggestions of Multi-planning Integration in Progress of Xiongan New Area Planning. J. Chin. Acad. Sci. 2017, 32, 1192–1198. (In Chinese) [Google Scholar]
- Kuang, W.H.; Chi, W.F.; Lu, D.S.; Dou, Y.Y. A comparative analysis of megacity expansions in China and the US: Patterns, rates and driving forces. Landsc. Urban Plan. 2014, 132, 121–135. [Google Scholar] [CrossRef]
- Wang, L. The role and significance of “sponge city” construction in alleviating the waterlogging in Hengshui City. Water Conserv. Plan. Des. 2022, 2, 4–7+18. (In Chinese) [Google Scholar]
- Mai, L.T.T.; Chau, N.L.H.; Thao, D.P.; Anh, H. Evaluation of factors influencing the quality of life of residents living close to Northwest Solid Waste Treatment Complex Cu Chi districts, Ho Chi Minh City. IOP Conf. Ser. Earth Environ. Sci. 2024, 1349, 012023. [Google Scholar] [CrossRef]
- Chen, J.; Chen, J.; Liao, A.; Cao, X.; Chen, L.; Chen, X.; He, C.; Han, G.; Peng, S.; Lu, M.; et al. Global land cover mapping at 30 m resolution: A POK-based operational approach. ISPRS J. Photogramm. Remote Sens. 2015, 103, 7–27. [Google Scholar] [CrossRef]
- Pauleit, S.; Ennos, R.; Golding, Y. Modeling the environmental impacts of urban land use and land cover change—A study in Merseyside, UK. Landsc. Urban Plan. 2005, 71, 295–310. [Google Scholar] [CrossRef]
- Johnson, M.P. Environmental impacts of urban sprawl: A survey of the literature and proposed research agenda. Environ. Plan. A 2001, 33, 717–735. [Google Scholar] [CrossRef]
- Fang, C.L.; Fang, J.W. How to improve the overall planning system of urban and rural environmental protection. Environ. Prot. 2012, 6, 65–68. (In Chinese) [Google Scholar]
- Chi, W.F.; Kuang, W.H.; Dang, X.H.; Pan, T.; Liu, Z.J. Analysis of temporal and spatial change characteristics of land cover structure in prefecture level cities of Inner Mongolia Based on Remote Sensing. Remote Sens. Technol. Appl. 2019, 34, 33–45. (In Chinese) [Google Scholar]
- Chen, W.; Huang, H.; Dong, J.; Zhang, Y.; Tian, Y.; Yang, Z. Social functional mapping of urban green space using remote sensing and social sensing data. ISPRS J. Photogramm. Remote Sens. 2018, 146, 436–452. [Google Scholar] [CrossRef]
- Zhang, K. Accessibility analysis of urban parks based on GIS: A case study on the main urban area of Xuzhou. Guizhou Sci. 2018, 36, 60–64. (In Chinese) [Google Scholar]
- Zhuang, Y.; Xue, D.Q.; Kuang, W.H.; Chi, W.F.; Pan, T. Study on spatial and temporal characteristics of land cover hierarchy of hubao’e urban agglomeration in semi-arid area of China. Remote Sens. Technol. Appl. 2019, 34, 197–206. (In Chinese) [Google Scholar]
- Qing, S.; Bao, Y.H.; A, R.N. Inversion of surface temperature in Hohhot and its response to land use/cover types. Infrared 2017, 38, 36–42+48. (In Chinese) [Google Scholar]
- Ren, Z.Y.; Wu, Y.F. Temporal and spatial change of land use in suburb of farming pastoral ecotone in northern China-a case study of Baotou City. Resour. Environ. Arid Area 2004, 2, 63–67. (In Chinese) [Google Scholar]
- Zalewska, K. The Methodology for Assessing the 15 Minute Age-Friendly Walkability (AFW) of Urban Public Spaces. Sustainability 2024, 16, 6406. [Google Scholar] [CrossRef]
- Xing, L.L.; Liu, Z.Q. Characteristics and differences of imbalance between green space rate and per capita public green space area in urban built-up areas in China. Planners 2015, 31, 108–113. (In Chinese) [Google Scholar]
- Statistics Bureau of Inner Mongolia Autonomous Region. Statistical Yearbook of Inner Mongolia Autonomous Region; China Statistics Press: Beijing, China, 2019. (In Chinese) [Google Scholar]
- Zhang, Z.X.; Wang, X.; Zhao, X.L.; Liu, B.; Yi, L.; Zuo, L.; Wen, Q.; Liu, F.; Xu, J.; Hu, S. A 2010 update of National Land Use/Cover Database of China at 1:100000 scale using medium spatial resolution satellite images. Remote Sens. Environ. 2014, 149, 142–154. [Google Scholar] [CrossRef]
- Zhan, D.; Zhang, Q.; Yu, Z.J. City Health Examination Evaluation and Subjective Well-Being in Resource-Based Cities in China. J. Urban Plan. Dev. 2023, 149, 5023036.1–5023036.11. [Google Scholar] [CrossRef]
- Lu, D.; Moran, E.; Hetrick, S. Detection of impervious surface change with multitemporal Landsat images in an urban–rural frontier. ISPRS J. Photogramm. Remote Sens. 2011, 66, 298–306. [Google Scholar] [CrossRef] [PubMed]
- Tao, Q.X.; Tao, H.X.; Zhang, L.P. Study on applying linear mixing spectral model in vegetation classification using hyperspectral remote sensing. Site Investig. Sci. Technol. 2004, 1, 21–24. (In Chinese) [Google Scholar]
- Wu, C.S. Normalized Spectral Mixture Analysis for Monitoring Urban Composition Using ETM + Imagery. Remote Sens. Environ. 2004, 93, 480–492. [Google Scholar] [CrossRef]
- Seo, J.; Yoon, S.; Kim, J.; Kwon, K. Regional Youth Population Prediction Using LSTM. Sustainability 2025, 17, 6905. [Google Scholar] [CrossRef]
- Feng, S.S.; Fan, F.L. Spatiotemporal changes of landscape pattern using impervious surface in Guangdong-Hong Kong-Macao Greater Bay Area, China. Chin. J. Appl. Ecol. 2018, 29, 2907–2914. [Google Scholar]
- Zhang, C.; Chen, Y.; Lu, D. Mapping the land-cover distribution in arid and semiarid urban landscapes with Landsat Thematic Mapper imagery. Int. J. Remote Sens. 2015, 36, 4483–4500. [Google Scholar] [CrossRef]
- Pan, T.; Lu, D.; Zhang, C.; Chen, X.; Shao, H.; Kuang, W.; Chi, W.; Liu, Z.; Du, G.; Cao, L. Urban Land-Cover Dynamics in Arid China Based on High-Resolution Urban Land Mapping Products. Remote Sens. 2017, 9, 730. [Google Scholar] [CrossRef]
- Chang, Q.; Jie, S.; Shan, Y.X. Assessing the Beautiful China Initiative from an environmental perspective: Indicators, goals, and provincial performance. Environ. Sci. Pollut. Res. 2023, 30, 84412–84424. [Google Scholar] [CrossRef]
- Stehman, V. Sampling designs for accuracy assessment of land cover. Int. J. Remote Sens. 2009, 30, 5243–5272. [Google Scholar] [CrossRef]
- CPC Central Committee, State Council. National New Urbanization Plan (2014–2020); Xinhua News Agency: Beijing, China, 2014. (In Chinese) [Google Scholar]
- GB/T50563-2010; Evaluation standard for Urban Landscaping. Ministry of Housing and Urban Rural Development: Beijing, China,, 2010. (In Chinese)
- Ministry of Housing and Urban Rural Development of the People’s Republic of China. China Urban Construction Statistical Yearbook (2016); China Planning Press: Beijing, China, 2017. (In Chinese) [Google Scholar]
- Zhang, S.; Song, W. Research on Evaluation Method of Urban Human Settlement Environment Quality Based on Back Propagation Neural Network. Int. J. Adv. Comput. Sci. Appl. 2023, 14, 473–483. [Google Scholar] [CrossRef]
- Liu, Z.Q.; Liu, Y.; Wang, J.D. Study on the space-time matching of green space rate of built-up areas and per capita green space area growth of parks in China. Ecol. Econ. 2016, 6, 189–195. (In Chinese) [Google Scholar]
- Zheng, Y.L.; Li, Z.Y.; Yang, X. Study on the development path of urban-rural integration development unit under the concept of Park City—Taking Chengdu as an example. Urban Rural Plan. 2019, 1, 73–78. (In Chinese) [Google Scholar]
Disclaimer/Publisher’s Note: The statements, opinions and data contained in all publications are solely those of the individual author(s) and contributor(s) and not of MDPI and/or the editor(s). MDPI and/or the editor(s) disclaim responsibility for any injury to people or property resulting from any ideas, methods, instructions or products referred to in the content. |
© 2025 by the authors. Licensee MDPI, Basel, Switzerland. This article is an open access article distributed under the terms and conditions of the Creative Commons Attribution (CC BY) license (https://creativecommons.org/licenses/by/4.0/).