Article

Phosphorus Mobilization from Lake Sediments Driven by Silver Carp Fecal Inputs: A Microcosm Study

1
Hubei Key Laboratory of Pollution Damage Assessment and Environmental Health Risk Prevention and Control, Hubei Academy of Environmental Sciences, Wuhan 430072, China
2
State Key Laboratory of Lake and Watershed Science for Water Security, Institute of Hydrobiology, Chinese Academy of Sciences, Donghu South Road #7, Wuhan 430072, China
3
Wuhan Municipal Construction Group Co., Ltd., Wuhan 430023, China
*
Author to whom correspondence should be addressed.
Sustainability 2025, 17(16), 7468; https://doi.org/10.3390/su17167468
Submission received: 7 July 2025 / Revised: 5 August 2025 / Accepted: 14 August 2025 / Published: 18 August 2025

Abstract

Harmful cyanobacterial blooms pose significant threats to lake ecosystems, and the stocking of filter-feeding fish has often been used for their control. However, filter-feeding fish like silver carp excrete feces that not only retain viable cyanobacterial cells but also increase nutrient loading to the sediment. Furthermore, the quantity and frequency of fecal input vary depending on the biomass of algae and fish and the stocking strategy. In this study, a two-by-two factorial microcosm experiment was carried out to investigate the effects of silver carp feces on P release in shallow lakes. Results showed that fecal input quantity was the key determinant of P release. The peak flux reached 8.82 mg m−2 d−1 in high input treatments, compared to 1.01 mg m−2 d−1 in low input treatments. Phased-input exacerbated these effects compared to single-input. The dominant mechanisms of sediment P release varied with input levels. Microbial reduction was strongly associated with P release at low fecal input, while high-input scenarios showed concurrent hypoxia, an increase in sediment pH (from 7.28 to 7.46), and competition for adsorption sites by dissolved organic matter (DOM up to 38.57 mg L−1). These results indicate that stocking of filter-feeding fish for cyanobacterial bloom control substantially altered P flux dynamics, with high input treatments exhibiting fluxes from −6.02 to 8.82 mg m−2 d−1 compared to −0.007 to 0.33 mg m−2 d−1 in controls, depending on the patterns of fecal input. For the prevention and control of cyanobacterial blooms and to ensure the sustainability of lakes, the stocking of filter-feeding fish should be carried out before the outbreak of blooms to avoid the impact of large amounts of fish feces input on P release and water quality during the blooms.

1. Introduction

In recent years, intensified human impacts and environmental changes have exacerbated the excessive accumulation of nutrients such as nitrogen (N) and phosphorus (P), causing frequent cyanobacterial blooms in many lakes and reservoirs [1]. Cyanobacterial blooms not only degrade the ecological integrity of the lake but also pose serious threats to water quality, aquatic organisms, and the livelihoods of surrounding communities [2].
To effectively control cyanobacterial blooms, nontraditional biomanipulation has been developed, which primarily focuses on introducing filter-feeding fish to consume phytoplankton directly. Stocking of silver carp (Hypophthalmichthys molitrix) and bighead carp (Aristichthys nobilis) has been used successfully in many lakes for algal control [3]. However, rather than suppressing algal growth, the metabolic processes of filter-feeding fish may also enhance the growth and photosynthetic activity of algae [4]. Moreover, 53% of N and 51% of P from fish feces are excreted back into water after ingestion, where they are converted to bioavailable fractions due to biological activities [5]. This process contributes to internal nutrient loading, which may further deteriorate water quality.
Fish feces exhibit a relatively high sedimentation rate, leading to their accumulation on the sediment surface [6]. The organism matters (OM) contained in fish feces can alter sediment redox conditions and change the composition of dissolved organic matter (DOM), thereby affecting the adsorption and release of various inorganic P fractions in sediment [7,8]. The decomposition dynamics of OM depend not only on its intrinsic quality but also on the specific stages of the decomposition process [9]. The total input quantity and frequency of fish feces deposition vary with factors such as silver carp stocking density, growth stage, and seasonal changes [10,11]. While these temporal variations are well documented, their impacts on sediment P fractions and the adsorption–desorption process remain poorly understood, particularly regarding how input quantity versus frequency may differentially regulate P release. This knowledge gap limits our ability to optimize fish stocking strategies for bloom control while minimizing sediment P release.
As P is a limiting factor in most shallow lakes [12], this research focused on the effects of different silver carp fecal input patterns on P release in shallow lakes. We conducted a microcosm experiment with the following objectives: (1) to elucidate the influence of silver carp feces on the dynamic process of P release within the system and the underlying mechanisms; (2) to provide a scientific basis for optimizing silver carp stocking strategies and improving their management.

2. Materials and Methods

2.1. Collection of Fish Feces

Silver carp were fed with Microcystic colonies collected from a fish pond at the Guanqiao Station of the Institute of Hydrobiology, Chinese Academy of Sciences (Wuhan, China) using a 63 µm pore size plankton net. Microscopic examination confirmed that Cyanophyta dominated the algal suspension, with Microcystis colonies accounting for over 80% of the total biomass. After transporting back to the laboratory, the suspension was filtered through a 300 µm sieve to remove debris and rinsed 3–4 times with aerated tap water [13]. The purified algal suspension was subsequently cultured at 25 °C under 3000 lux illumination intensity using 10-fold BG11 medium with a 12 h light: 12 h dark photoperiod.
Silver carp was purchased from Yongchuan Fishery and had an average body length of 7–9 cm and a weight of 10.23 ± 0.65 g. The fish were starved for 48 h before being fed with the stationary-phase algae 2–3 times per day until sufficient fish feces were collected. The collected feces were separated by sedimentation and stored at −80 °C for further experiments.

2.2. Experimental Setup

As shown in Figure 1, water and sediment samples were collected from East Lake in Wuhan, China. For processing, water samples were filtered through a 63 µm plankton net to remove plankton and large suspended particles, while sediment samples were passed through a 1 mm mesh sieve to eliminate benthic organisms and larger particles and then homogenized thoroughly. In the water, the total phosphorus (TP) and soluble reactive phosphorus (SRP) concentrations were 0.09 mg L−1 and 0.02 mg L−1, respectively. The sediment contained TP (TPsed) and organic matter (OM) at 0.08 mg g−1 and 70.53 mg g−1, respectively. The experiment was conducted in a laboratory setting using 15 acrylic containers (diameter: 10 cm, height: 20 cm) with three replicates per treatment for 30 days. To simulate the accumulation and decomposition process of feces on the sediment surface, four experimental systems were constructed based on a specific thickness of feces–sediment combinations: S1 (0.1 cm feces + 4.9 cm sediment, single addition), S5 (0.5 cm feces + 4.5 cm sediment, single addition), M1 (0.1 cm feces + 4.9 cm sediment, phased addition), and M5 (0.5 cm feces + 4.5 cm sediment, phased addition), with a control group containing only 5 cm of sediment. In the phased treatments (M1 and M5), feces were added in three equal portions, with additional feces introduced on day 10 and day 20. The 0.1 cm and 0.5 cm fecal layers corresponded to approximately 9.0 g and 45.1 g of feces, equivalent to the total fecal production of three silver carp (combined mass 37.88 g) after consuming 200 µg L−1 and 1000 µg L−1 cyanobacteria for 30 days. After the sediment and feces were added, 12 cm of overlying water was added via siphoning.

2.3. Sampling and Analysis

The experiment was performed in an incubator set at 25 °C with a 12 h light: 12 h dark photoperiod. The experiment lasted 30 days, with physicochemical parameters of the overlying water measured and sampled on days 0, 10, 20, and 30. Parameters such as pH, conductivity (Cond.), dissolved oxygen (DO), and oxidation-reduction potential (ORP) of the overlying water were measured in situ using a HQ40d water quality meter (Hach, Loveland, CO, USA) at 3–5 cm above the sediment–water interface (SWI).
Water samples (100 mL) were collected with a pipette. TP, total dissolved phosphorus (TDP), and SRP were determined via the molybdate blue colorimetric assay, with TP and TDP being digested by persulfate prior to the analysis [14]. After sampling, in situ water was added to restore the original water level.
Sediment sampling was conducted on day 30, and the upper 0–3 cm layer was collected. P fractions were operationally defined according to sequencing extraction into labile P (loosely sorbed P), redox-sensitive P (Fe-P), metal oxide-bound P (Al-P), organically bound P (OP), Ca-bound P (Ca-P), and refractory/residual P (Res-P) [15]. TPsed was quantified via the alkali fusion method. The pH of the sediment (pHsed) was determined potentiometrically using a pH meter after equilibrating the sediment sample with deionized water at a 1:2.5 ratio [16]. The OM content of the sediment was assessed by the weight loss-on-ignition method [17]. Alkaline phosphatase activity (APA) was assayed using an alkaline phosphatase test kit (Nanjing Jiancheng Bioengineering Institute, Nanjing, China). DOM was extracted from the freeze-dried sediment using a 1 mol L−1 KCl solution at 1:10 (m/v) and determined using a Vario Cube total organic carbon analyzer (Elementar Analysensysteme GmbH, Langenselbold, Germany) [18]. The UV-vis absorption spectra of DOM extracts were acquired using a spectrophotometer (L5S, INESA, Shanghai, China). The specific ultraviolet absorbance at 254 nm (SUVA254) and the absorbance ratio at 250 nm to that at 365 nm (E2:E3) of sedimentary DOM were calculated as detailed in Text S1.

2.4. High-Throughput Sequencing

Bacterial diversity and community structure were determined by the high-throughput sequencing analysis of the 16S rRNA gene. The polymerase chain reaction amplification targeted the V3-V4 hypervariable regions using 338F (5′-ACTCCTACGGGAGGCAGCAG-3′) and 806R (5′-GGACTACHVGGGTWTCTAAT-3′) primers. The amplification and sequencing were performed by Major Bio-pharm Technology Co., Ltd. (Shanghai, China).

2.5. Data Analyses

2.5.1. P Diffusion Flux on SWI

The P release flux was calculated following Huang et al. [19]:
F = V C n C 0 + j = 2 N V n ( C j 1 C a ( j 1 ) ) S × t
where F is the amount of P released in the experimental period (mg m−2 day−1); V is the volume of the overlying water (L); Cn is the P concentration of overlying water at the Nth time (mg L−1); C0 is the initial P concentration in overlying water (mg L−1); Vn is the volume of the collected overlying water each time (L); N is the time of sampling; C(j−1) is the P concentration of overlying water after sampling at the jth time (mg L−1); Ca(j−1) is the P concentration of overlying water after adding water at the jth time (mg L−1); A is the cross-sectional area of the sediment (m2); and t is the experimental time (day).

2.5.2. Statistical Analyses

Data visualization was performed using OriginPro 2024 (OriginLab Corp., Northampton, MA, USA) and ArcGIS 10.8 (ERIS, 2020). Statistical analyses were conducted in SPSS 25.0 (IBM Corp., Armonk, NY, USA). One-way analysis of variance (ANOVA) was used to assess differences among treatment groups, followed by Tukey’s HSD and Friedman tests. Spearman correlation analysis was employed because: (1) the environmental parameter data violated normality assumptions (Shapiro–Wilk test, p < 0.05), and (2) it is more robust for evaluating monotonic relationships in non-parametric data. Statistical significance was evaluated at three thresholds: p < 0.05, p < 0.01, and p < 0.001. Analysis of the sequencing data was performed using the free online platform of Majorbio Cloud Platform (www.majorbio.com).

3. Results

3.1. Changes of the Overlying Water Properties

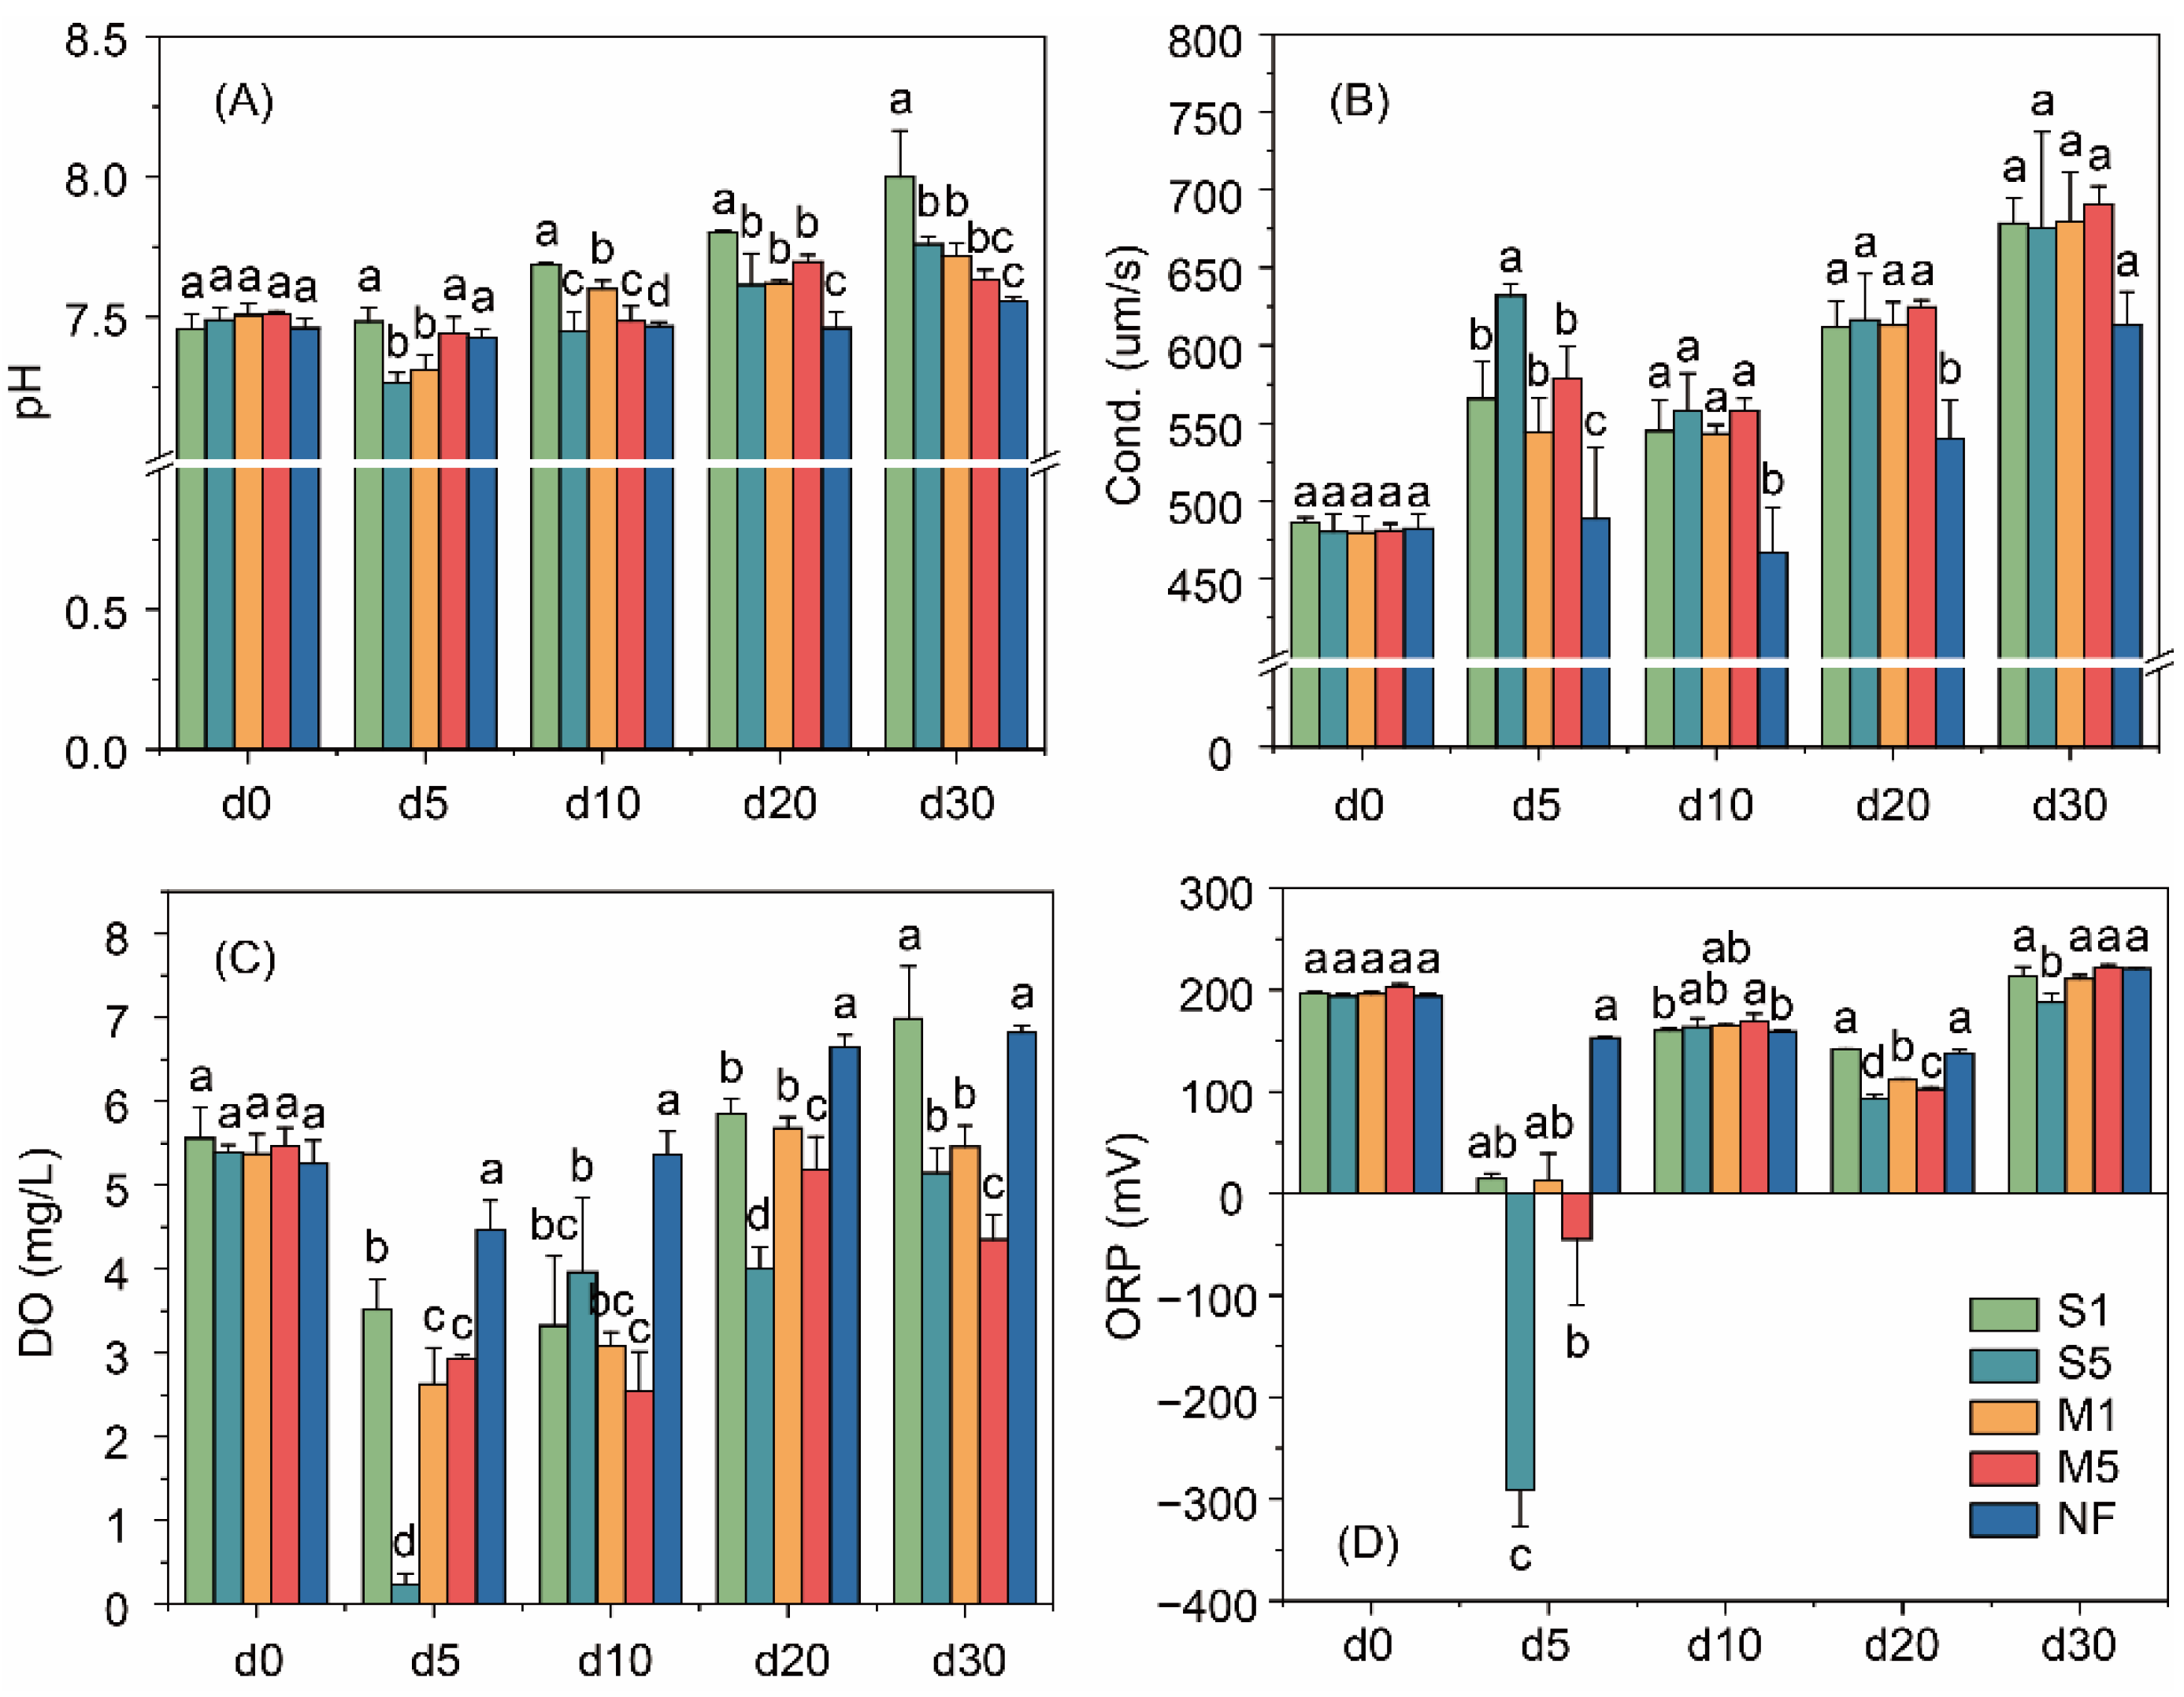
Dynamic changes in physicochemical parameters in the overlying water in different treatments during the experiment are shown in Figure 2. The water properties in S5 had the most pronounced effects, with increased pH, considerable Cond. fluctuations and sharp declines in DO and ORP on day 5. Phased-input treatments (M1 and M5) induce moderate but more stable impacts, while S1 had minimal effects, aligning with the NF group in the later stage (Table S1).
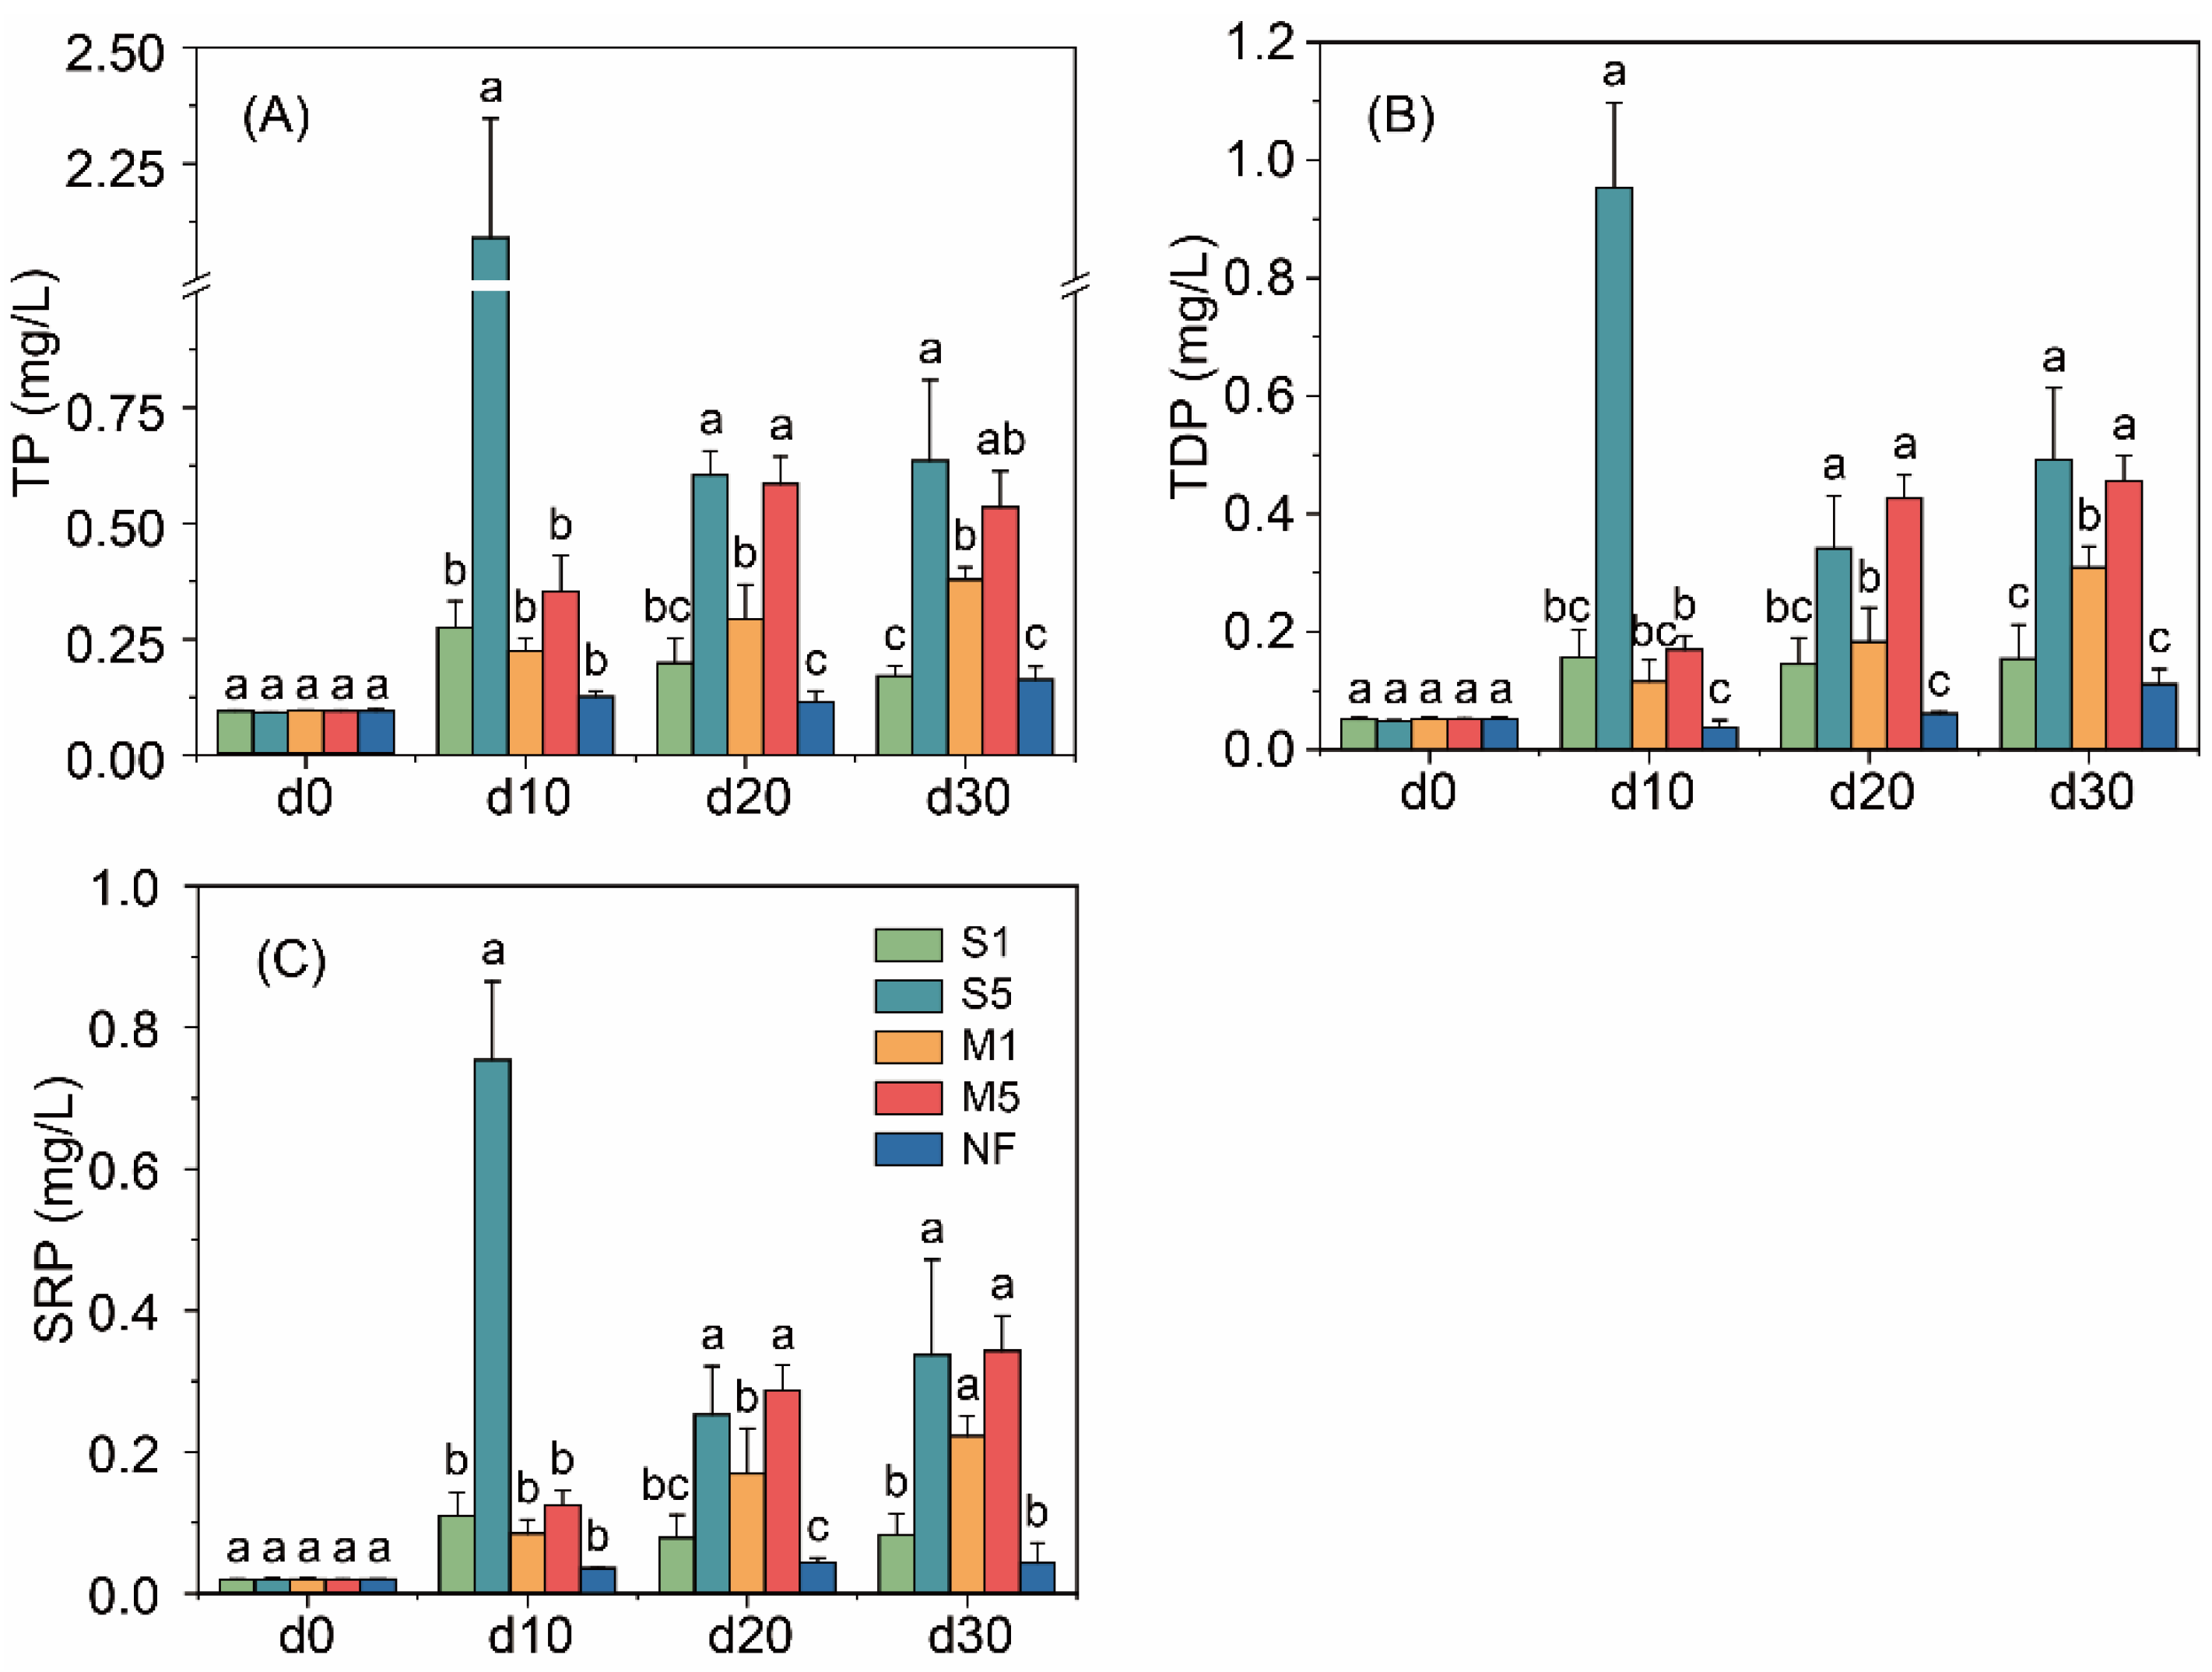
The effects of different treatments on the three P fractions in the overlying water over time are presented in Figure 3. The most pronounced impact was observed in S5, with TP, TDP, and SRP peaking at 2.09 mg L−1, 0.95 mg L−1, and 0.75 mg L−1, respectively, on day 10, and exceeding the levels in S1 significantly (p < 0.001). This effect persisted throughout the experiment. In contrast, similar trends in M5 and M1 only became evident after day 10. When comparing different input frequencies, significant differences in P fractions between S5 and M5 were observed only during the first 10 days, with S5 maintaining higher P levels till the end of the experiment. However, in the later stages, P fractions in M1 were significantly higher than those in S1 (p < 0.05). By day 30, as decomposition progressed, TDP accounted for 77–90% of TP in all feces-amended treatments.

3.2. Changes of the Sediment Properties

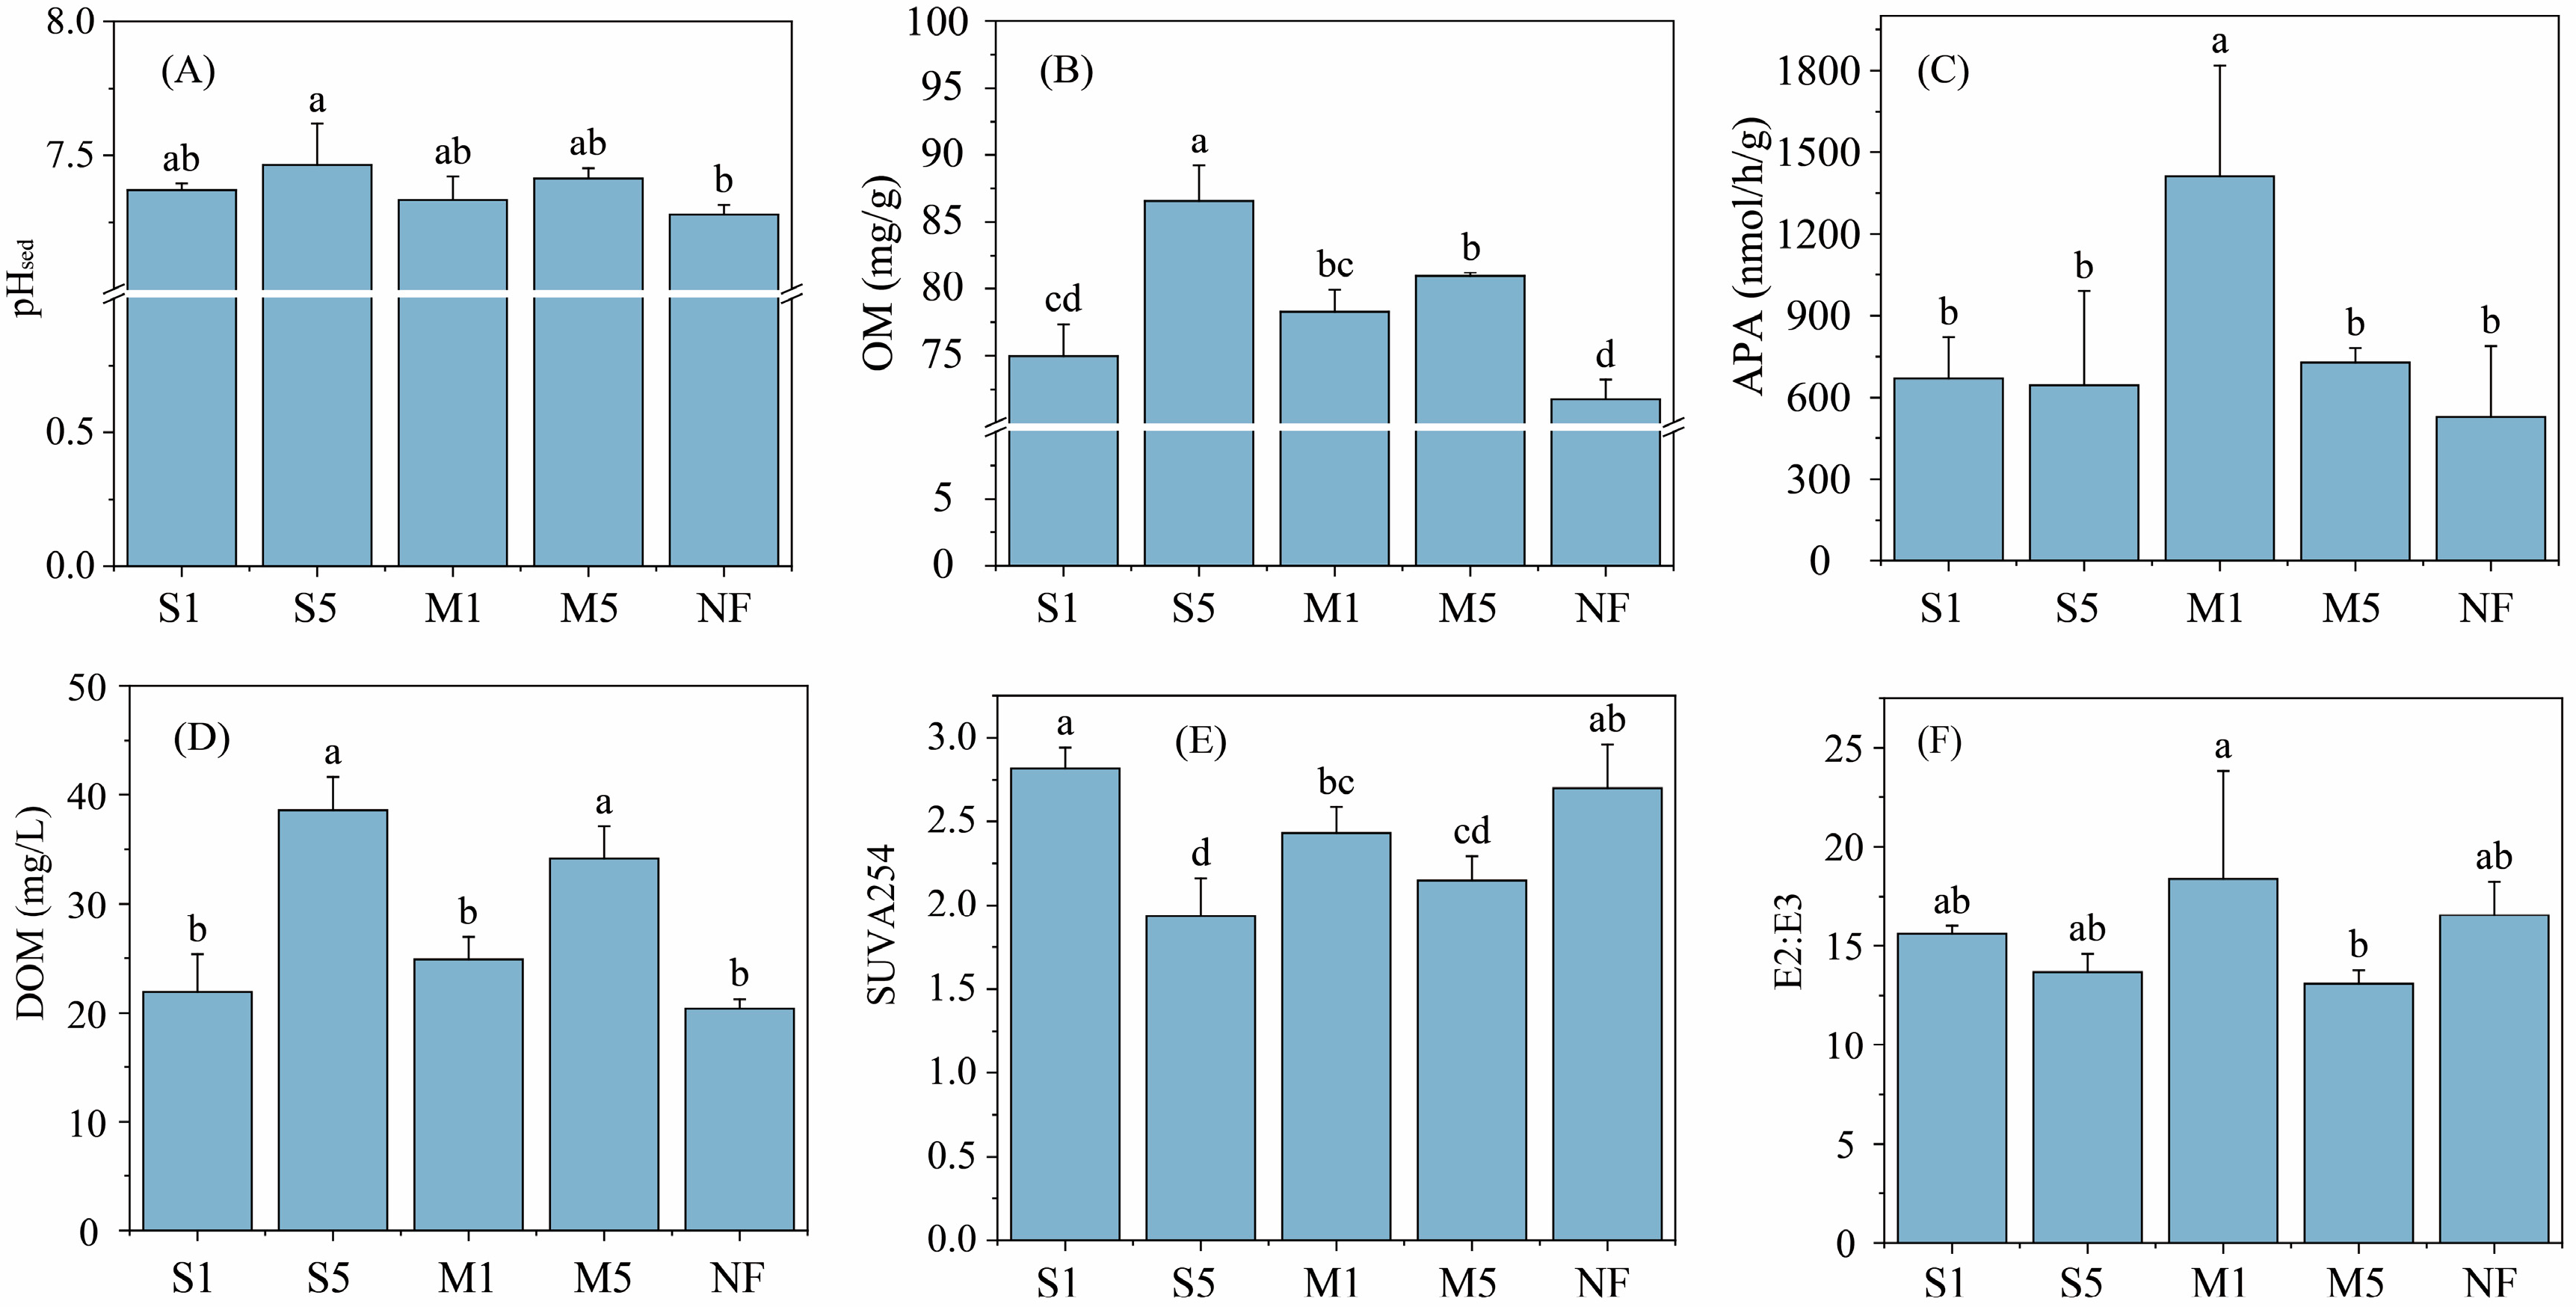
The physicochemical properties of sediments in the different treatments are shown in Figure 3. The pHsed ranged from 7.28 to 7.46, with no significant differences among feces-amended groups. However, pHsed in S5 was significantly higher than in the NF group (p < 0.05). OM content was highest in S5 (86.56 mg g−1), followed by M5 (80.94 mg g−1) and M1 (78.27 mg g−1), while no significant differences were observed between S1 and NF. APA was significantly higher in M1 (p < 0.05), reaching 1410.95 nmol h−1 g−1, whereas no significant differences were detected among S1, S5, M5, and NF (p > 0.05). DOM content was higher in the high-input quantity groups (S5: 38.57 mg L−1, M5: 34.16 mg L−1), significantly exceeding than in M1, S1, and NF (S5: p < 0.001, M5: p < 0.05). The optical properties of DOM were studied by SUVA254 (Figure 4E) and E2:E3 (Figure 4F). SUVA254 is typically positively correlated with the aromatic compound content in organic matter, indicating lower biodegradability, leading to an inverse relationship with OM decomposition potential [20]. In contrast, the E2:E3 ratio is negatively correlated with the molecular weight of DOM, with lower values indicating larger molecular weights [21]. Single feces input significantly affected SUVA254, with S1 showing higher values than S5 (p < 0.001), while phased inputs primarily influenced E2:E3, with M1 exhibiting higher values than M5 (p < 0.05).
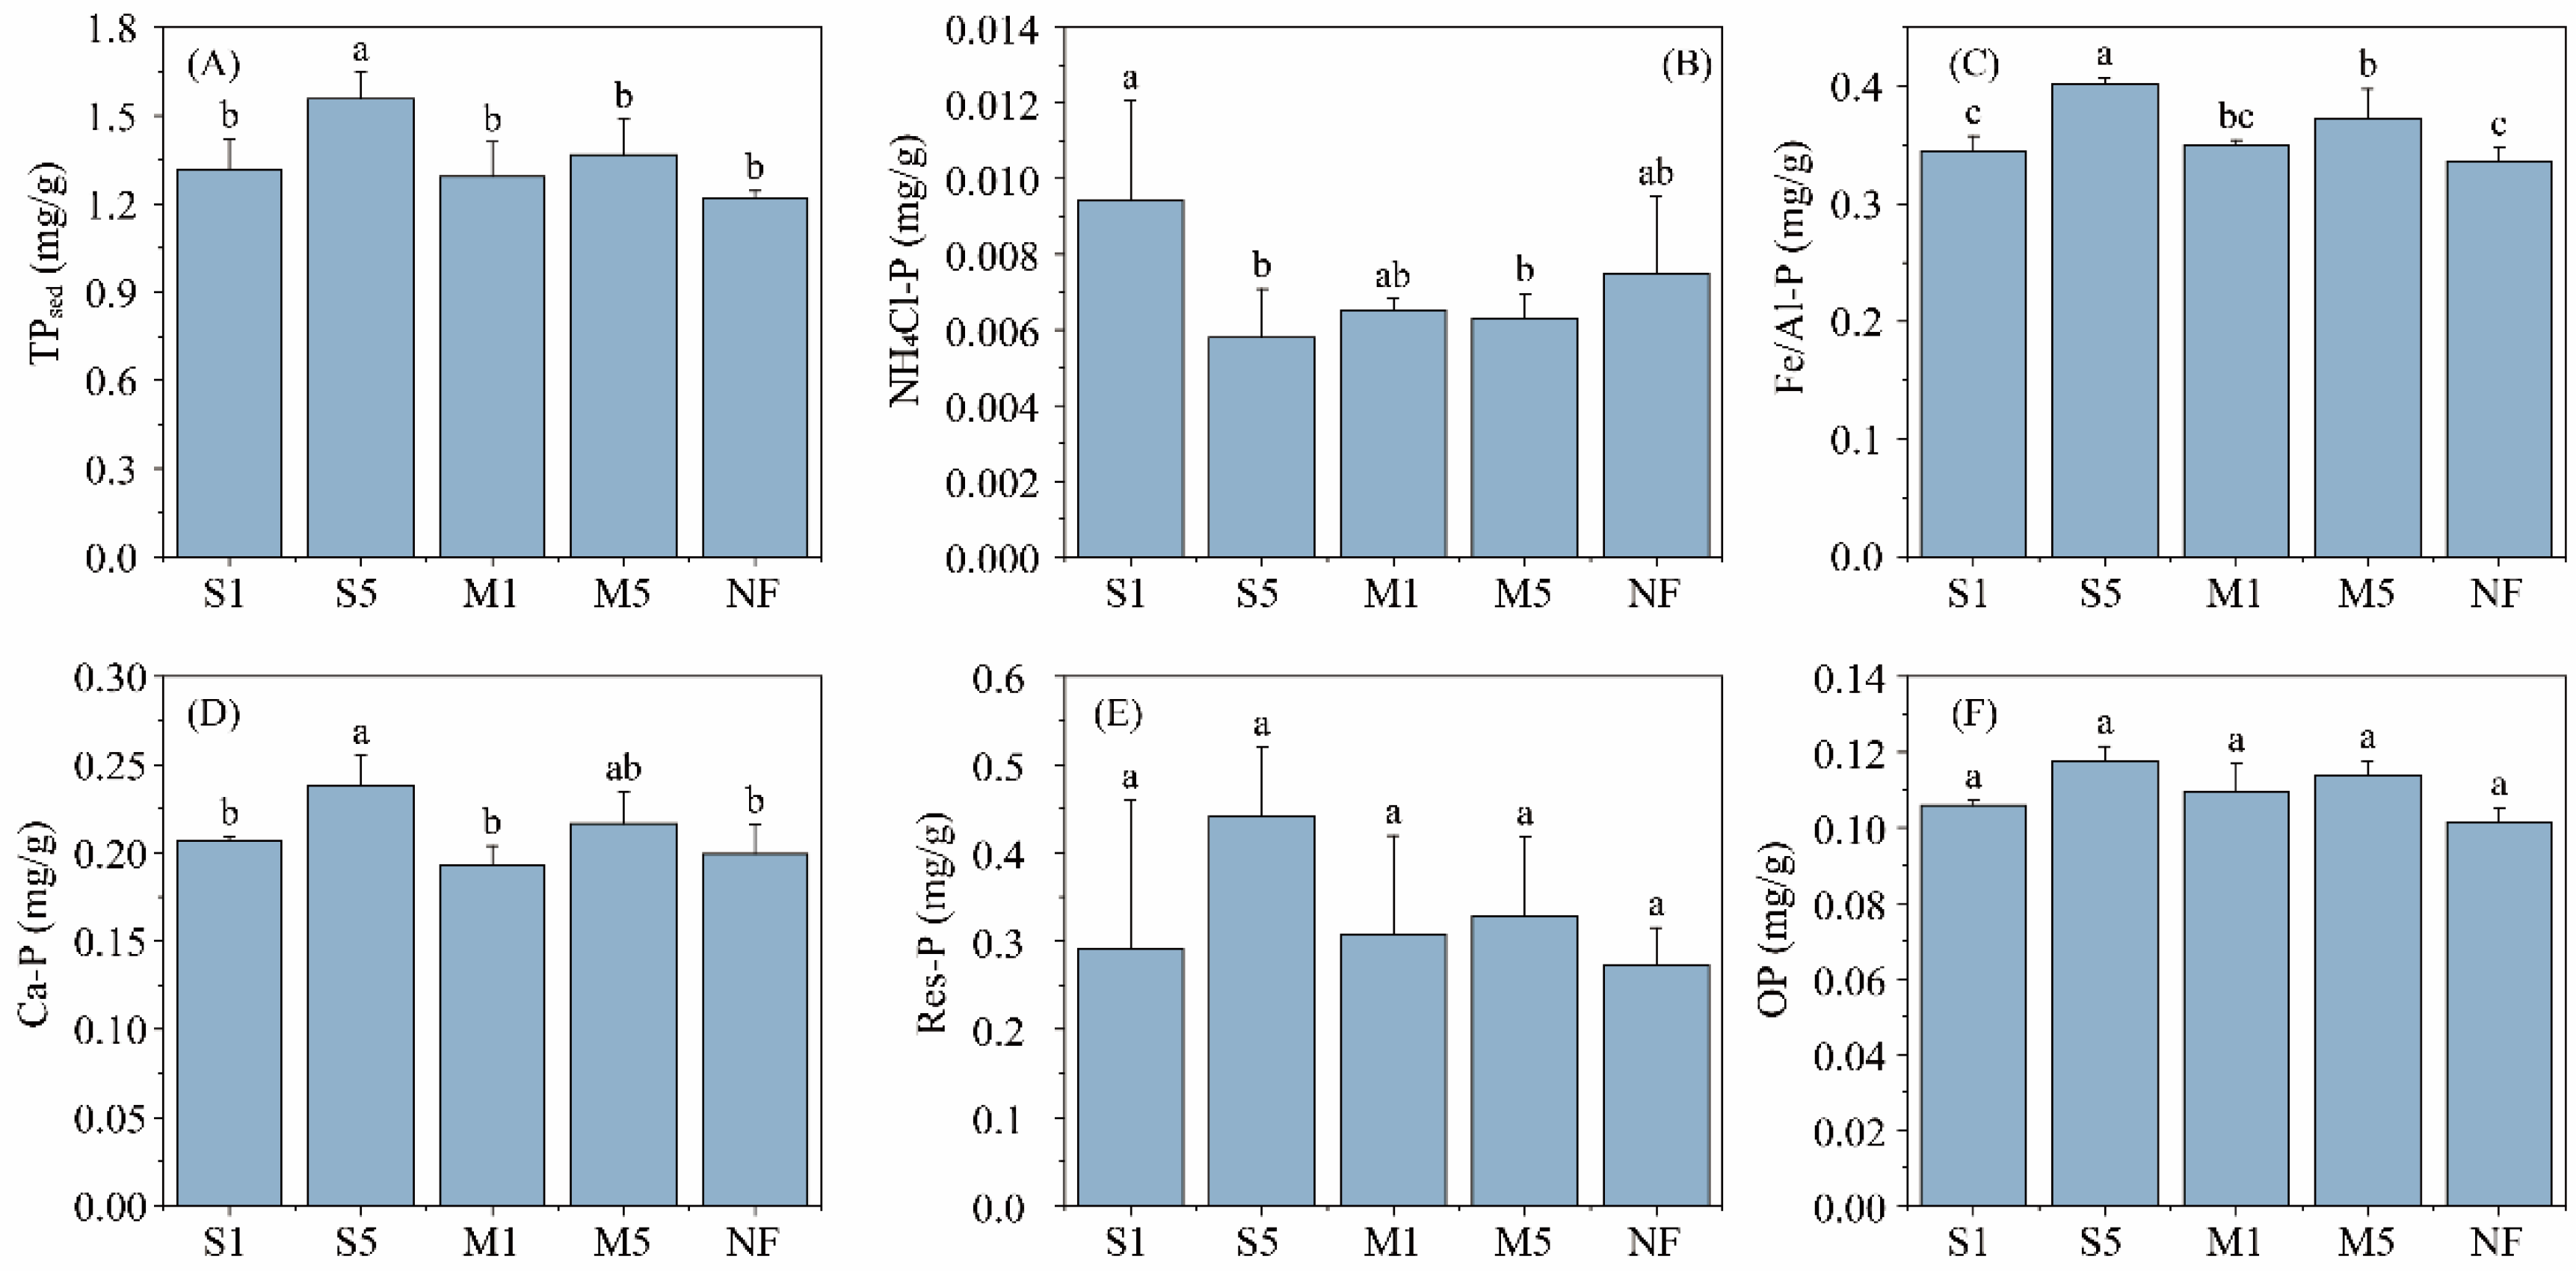
For the sediment P fractions (Figure 5), TPsed, Fe/Al-P, and Ca-P contents were significantly higher in S5 (p < 0.05), followed by M5 (p < 0.05), while Res-P and OP showed no significant differences among treatments (p > 0.05). Inorganic P remained the dominant P fraction in the sediments across all treatments.

3.3. Sediment Bacterial Communities

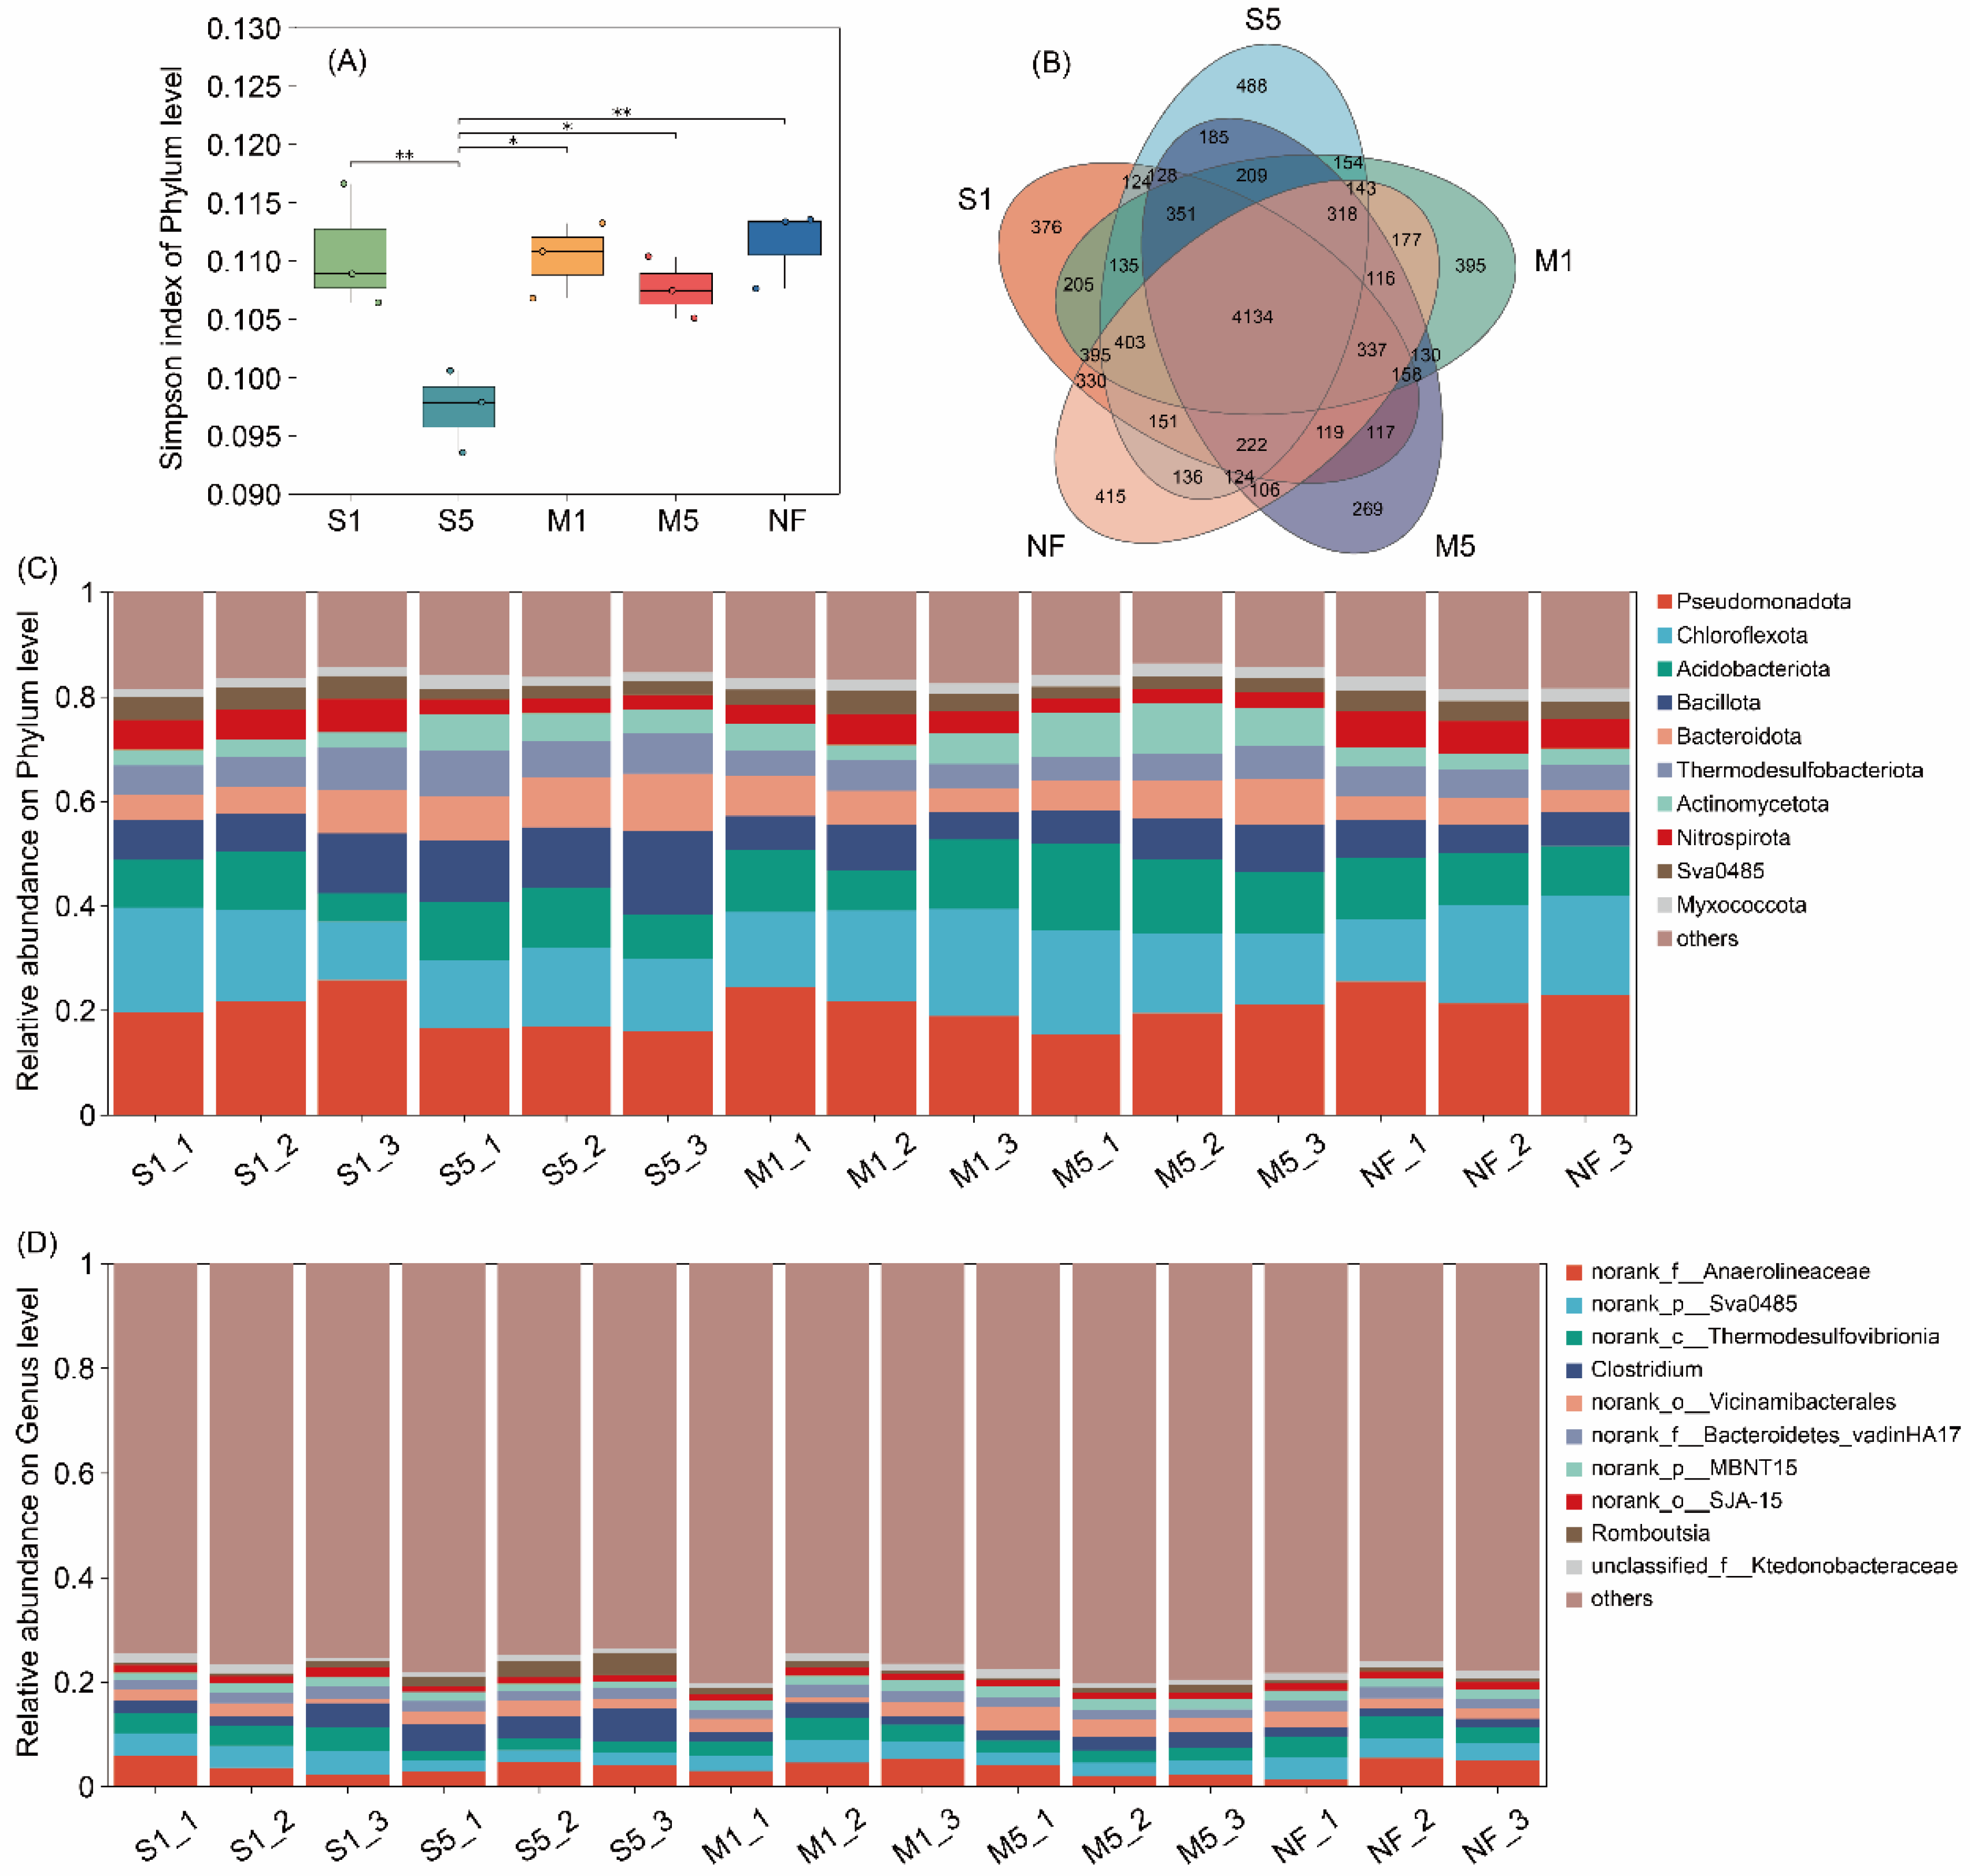
Differences in the bacterial communities among treatments based on 16S rRNA sequencing analysis are presented in Figure 6. The Simpson index was significantly lower in S5 compared to the other treatments (p < 0.05). The Venn diagram visually represents the distribution of shared and unique microbial taxa among groups, with different colors representing distinct treatments. The numbers of unique OTUs in the sediment bacterial communities of S1, S5, M1, M5 and NF were 376, 488, 395, 269, and 415, respectively, with 4134 OTUs shared across all groups. Notably, S5 exhibited the highest number of unique OTUs.
The sequencing platform identified a total of 68 bacterial phyla in the sediment samples. To simplify the analysis, taxa ranked 11th or lower in species richness across all samples were categorized as “others”. The relative abundance of the top 10 bacterial phyla in all sediment samples is presented in Figure 6C. The five dominant phyla were Pseudomonadota, Chloroflexota, Acidobacteriota, Bacillota, and Bacteroidota, with relative abundances ranging from 16.50% to 23.18%, 13.92% to 17.43%, 8.59% to 14.18%, 6.37% to 13.15%, and 4.61% to 9.60%, respectively.
The taxonomic composition of the top 10 most abundant genera in sediment bacterial communities is shown in Figure 6D. The five dominant genera were Anaerolineaceae sp., Sva0485 sp., Thermodesulfvibrionia sp., Clostridium sp., and Vicinamibacterales sp., exhibiting the highest relative abundances across treatments. Their average relative abundances, ranked from highest to lowest, were M1 (4.24%), S1 (3.88%), NF (3.93%), S5 (3.79%), and M5 (2.83%). Anaerolineaceae sp., Sva0485 sp., and Thermodesulfvibrionia sp. were more abundant in the low-feces-input treatments (S1 and M1), whereas Vicinamibacterales sp. and Clostridium sp. were more abundant in the high-feces-input treatments (S5 and M5). The “others” category accounted for more than 73.62% of the total relative abundance.
Results from principal coordinate analysis (PCoA) indicate that the first and second principal components account for 43.3% and 38.8% of the total variance, respectively (Figure 7A). The distribution of points represents the overall compositional differences among treatments. Permutational multivariate analysis of variance (PERMANOVA) was used to assess the significance of bacterial community differences among groups. The results showed that both fecal input frequency (R2 = 0.3, p = 0.006) and quantity (R2 = 0.26, p = 0.002) significantly influenced bacterial community composition, with the effect of input quantity being more pronounced.
To further assess the contribution of environmental factors to sediment bacterial communities, a detrended correspondence analysis (DCA) was performed. The results indicated that the maximum length of gradient (LOG) of the first axis was 1.33, which is less than 3, suggesting that redundancy analysis (RDA) based on a unimodal model was appropriate. As shown in Figure 7B, the first two RDA axes collectively explained 69.8% of the total variation in sediment bacterial communities. DOM was identified as the most influential physicochemical factor driving bacterial community composition (R2 = 0.886, p = 0.001). Additionally, OM, pHsed, Fe/Al-P, and TDP in overlying water also contributed to varying degrees.

3.4. P Release Flux from the Sediment

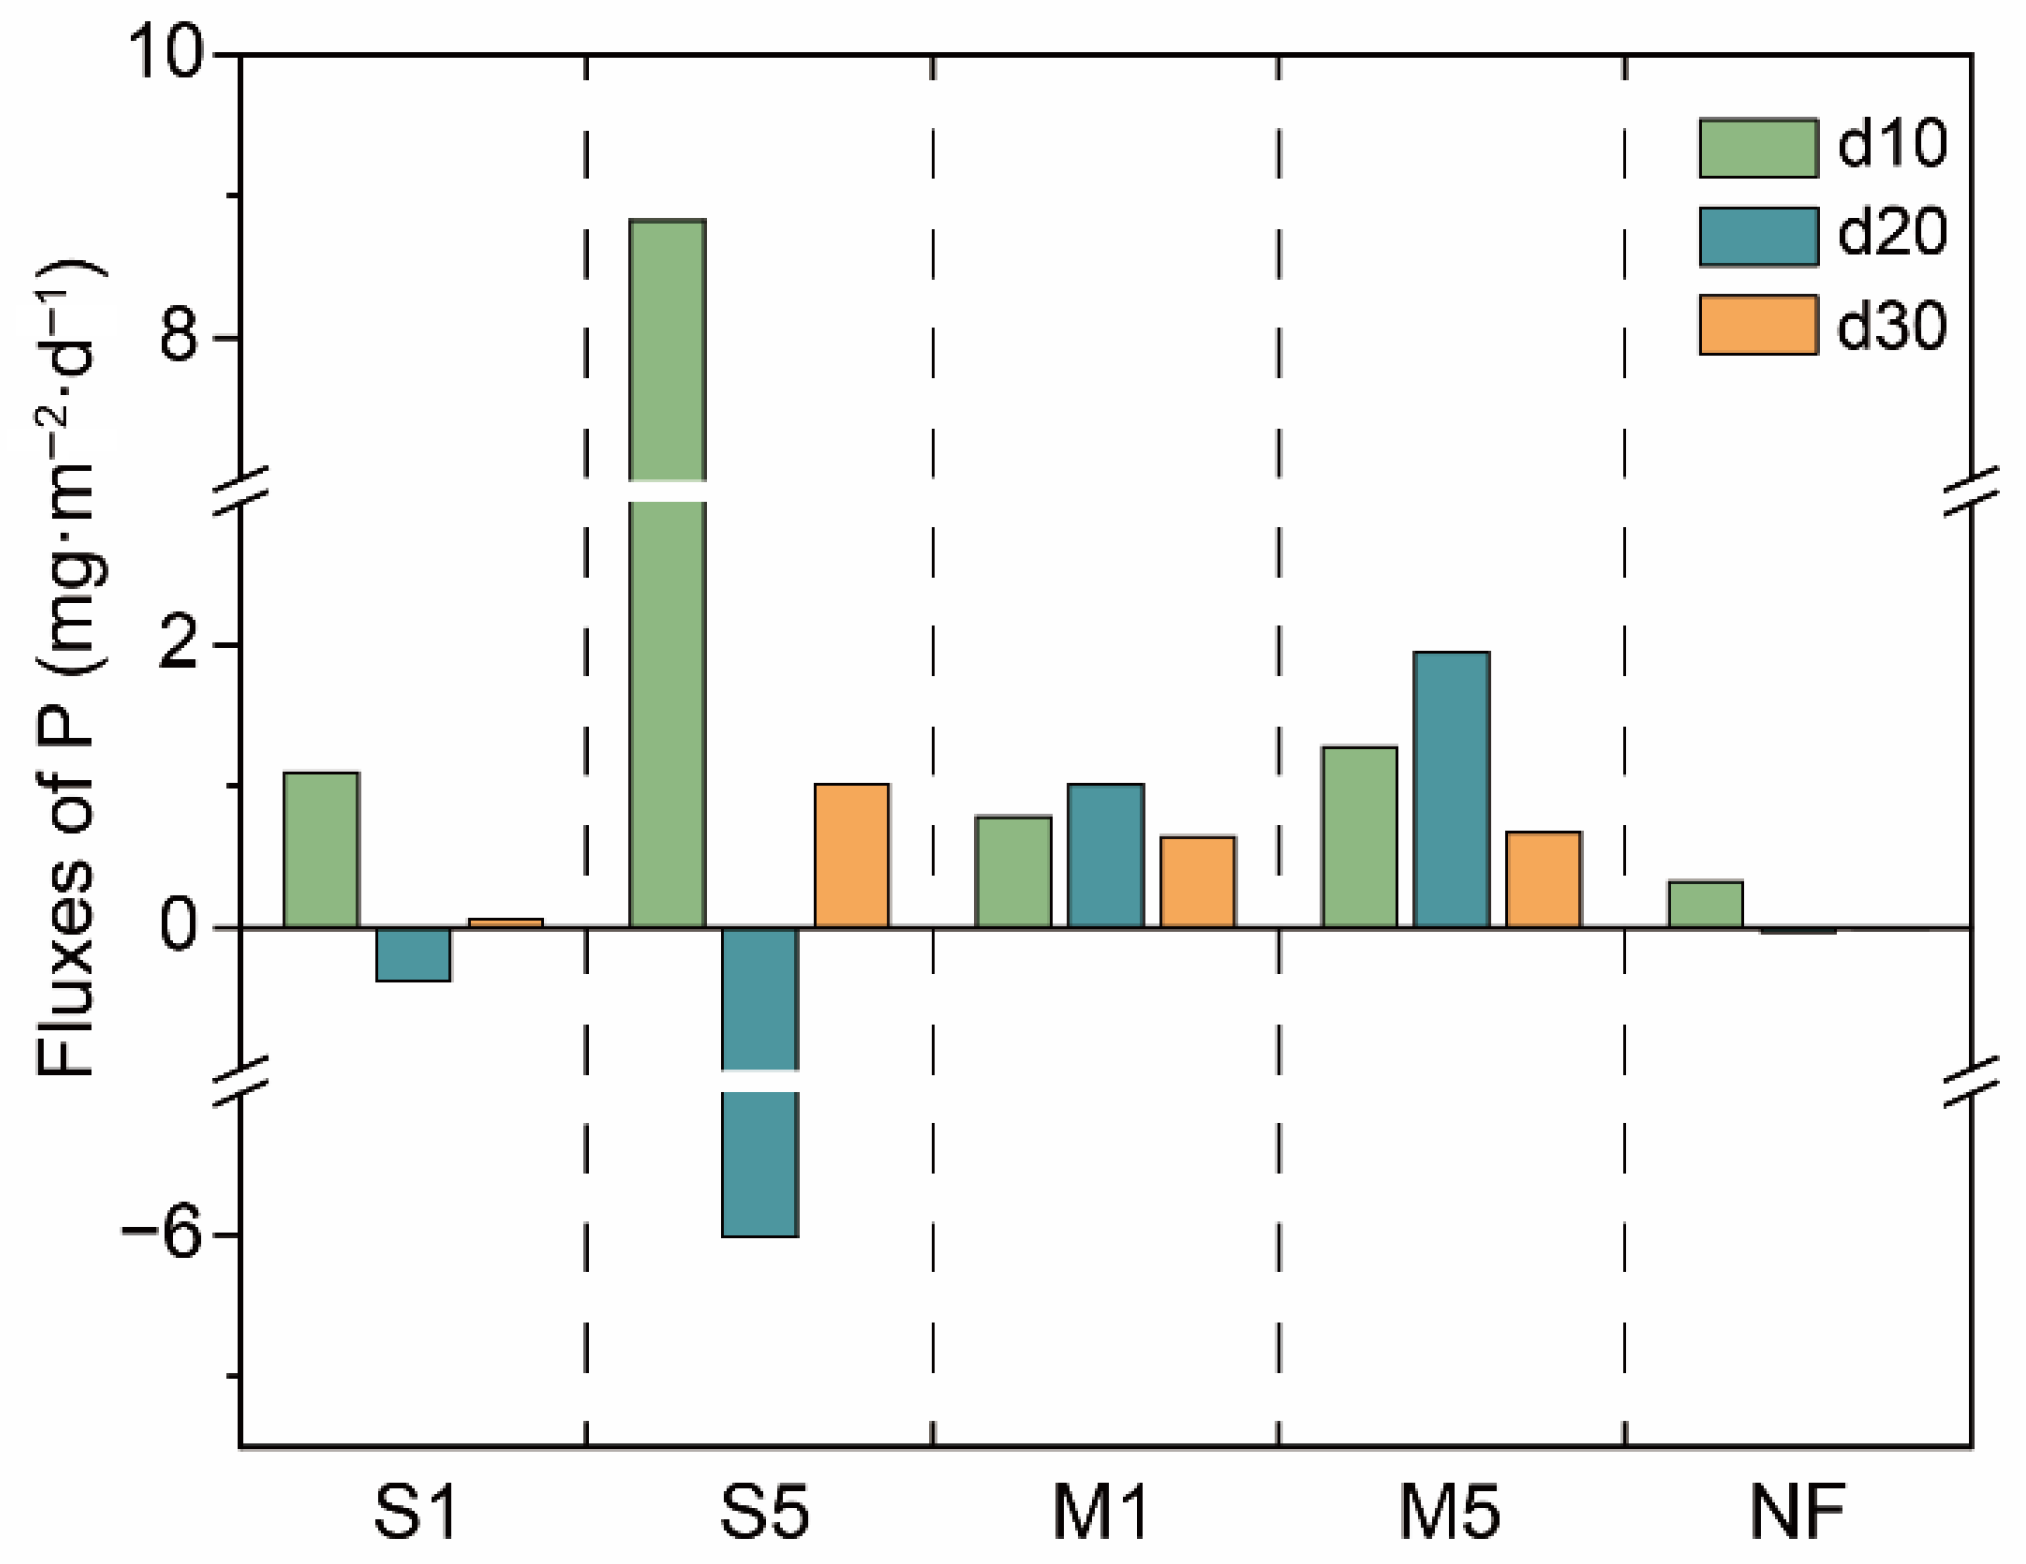
The variation in P release flux across different treatments throughout the experiment is presented in Figure 8. P release flux exhibits clear dependencies on the input pattern. In the single-input treatments (S1 and S5), P flux peaked on day 10, reaching 1.10 mg m−2 d−1 and 8.82 mg m−2 d−1, respectively. By day 20, the flux shifted to negative values, and by day 30, it turned to positive again but remained lower than the peak observed on day 10. Notably, the high-load single-input treatment (S5) exhibited greater flux variation. In contrast, the phased-input treatments (M1 and M5) displayed a more gradual release rate and prolonged P release effect, peaking at day 20 before declining. Similarly, M5 exhibited greater flux variation than M1 but remained less variable than S5.
The correlation coefficients and significance levels between sediment P release flux and various environmental factors are presented in Figure S1. The results indicate a significantly negative correlation between P flux and DO in water (p < 0.001), while significant positive correlations were observed with DOM content and pHsed in sediment (p < 0.001).

4. Discussion

4.1. Effects of Fecal Input on Overlying Water

Fecal input significantly altered the physicochemical environment of the overlying water, exerting a sustained impact on redox conditions and buffering capacity, particularly in high-input treatments. Fecal decomposition consumes oxygen and releases ammonia, potentially elevating pH levels [22]. Additionally, the input of fecal decomposition products supplied abundant organic matter to sediment microorganisms, stimulating microbial activity such as respiration, resulting in significant declines in DO and ORP. Higher fecal input levels intensified oxygen consumption, with ORP dropping to negative values in S5 and M5 by day 5. In the early and middle stages of decomposition, increased Cond. reflects the gradual accumulation of organic and inorganic electrolytes. These conductivity and pH fluctuations could potentially create a series of cumulative stresses affecting the aquatic community [23]. Variations of DO, ORP, and pH all suggest that decomposition in the single-input treatments was more intense within the first five days. Although decomposition in S5 slowed in the later stages, the influence on the physicochemical properties of overlying water remained.
The input of silver carp feces had a negative impact on the P fractions in the overlying water, particularly for TDP and SRP. In all treatments, TP exceeded the threshold (0.08–0.12 mg L−1) associated with the shift from a clear-water state to a turbid state [24]. This P enrichment may be closely related to the unique P metabolism of silver carp, as its excreted P contributes significantly to PO4-P availability, a highly bioavailable form that can be rapidly utilized by phytoplankton to promote their growth [25].
The fecal input quantity played a decisive role in influencing P fractions in the overlying water, with high-input treatments exerting greater negative effects than low-input treatments. Input frequency was characterized by a strong short-term stimulatory effect in single-input treatments, whereas phased input resulted in more prolonged impacts. Previous studies have also demonstrated that P release from fish feces occurs rapidly [10], though they did not consider the effects of continuous input. In the later stages, bacterial proliferation reduced phosphate concentrations, leading to a declining trend in P fractions in the single-input groups. Comparative analysis showed no significant differences in P fractions between S1 and NF throughout the experiment, suggesting that noticeable changes in overlying water P fractions only occur when fecal input surpasses a critical threshold.

4.2. Effects of Fecal Input on Sediment Properties and P Fractions

In S5, pHsed and OM were significantly elevated, likely due to the presence of mineral residues and high organic content in feces [26]. The elevation in pHsed might reduce P adsorption by iron (hydr)oxides, as OH and PO43− compete for adsorption sites; this process could consequently facilitate the release of NaOH-P into pore water [27], contributing to the elevated total P release observed in the S5 group. Sediment APA in M1 was significantly higher than in other treatments, likely due to the stimulation of microbial growth [28]. Given that M1 had the lowest per-input fecal quantity, P released through decomposition was insufficient to fully support microbial growth, leading to increased microbial secretion of APA to facilitate organic P mineralization. This might explain why P flux remained positive throughout the experiment in M1 [29].
Research has shown that fish feces exhibit a strong potential for DOM release [30], influencing both the net sinking flux of particulate organic carbon and contributing to the sediment DOM pool [31]. The decomposition of fish feces leads to a sustained release of highly soluble DOM during the initial stages [32]. However, no significant difference in sediment DOM was observed between S5 and M5, suggesting that continuous input may offset the rapid release, ensuring a prolonged nutrient supply for microbial proliferation. Furthermore, carboxyl functional groups in DOM can interact with hydroxyl groups on metal mineral surfaces through ligand exchange, occupying adsorption sites and inhibiting P immobilization, thereby facilitating P release from the sediment [33].
The lower SUVA254 values observed in S5 and M5 may be attributed to the higher fecal input, which contained a higher portion of biodegradable organic matter. The decomposition of this organic matter consumed oxygen and released CO2 and organic acids, leading to decreased DO and pH levels in overlying water, consistent with the observed trends in S5 and M5. Significant differences in E2:E3 were only detected in phased-input treatments, whereas no such differences were observed in single-input treatments. This suggests that continuous fecal input led to the accumulation of undecomposed macromolecular organic matter in sediment. Additionally, the increase in low-molecular-weight DOM provided a continuous supply of electron donors for the reduction in iron, manganese, and sulfate, thereby promoting P desorption in M1 sediment [34]. Consequently, the combined effects of anaerobic condition, increased sediment pHsed, and DOM competition for adsorption sites contributed to the higher P flux in S5 and M5 [35]. These findings align with the correlation analysis, which revealed a negative correlation between P flux and DO, and a positive correlation with sediment pHsed and DOM content. Furthermore, under equal fecal input loads, these factors exerted stronger effects in the higher single-input treatments, resulting in higher P flux.
During the feces decomposition, significant changes occurred in the P fractions of surface sediments. By the end of the experiment, NH4Cl-P content in S1 and all P fractions in S5 were significantly higher than those in other treatments. This may be attributed to the mid-experiment diffusion of SRP from the overlying water into sediment, where the anoxic conditions in the surface sediment facilitated the precipitation and accumulation of P.

4.3. Effects on Sediment Microbial Communities

The decomposition of feces significantly altered bacterial diversity and distribution in sediments. In S5, the sediment bacterial community exhibited a significantly lower Simpson index yet the highest number of unique OTUs, indicating greater diversity and a distinct microbial composition. This may be attributed to the abrupt influx of excessive nutrient resources, which facilitated the survival and proliferation of various species, reshaping the dominance of specific functional bacteria and ultimately intensifying sediment nutrient release. At the genus level, the “others” category accounted for over 73.62% of the relative abundance, suggesting a highly diverse bacterial community with numerous low-abundance taxa, reflecting a heterogeneous distribution among different bacterial groups.
From the perspective of dominant bacterial phyla in the sediment, Pseudomonadota (formerly Proteobacteria) encompasses diverse metabolic strategies [36], with most members being facultative or obligate anaerobes and heterotrophs. This phylum also contains the highest number of known phosphate-solubilizing bacterial genera, including well-documented representatives such as Pseudomonas and Rhizobium [37,38]. Bacillota (formerly Firmicutes) predominantly follows a chemoheterotrophic metabolism, with certain species, such as Brevibacillus laterosporus, demonstrating strong phosphate-solubilizing capacity [37]. Bacteroidota comprises obligate anaerobic rod-shaped bacteria with chemo-organotrophic metabolism, capable of degrading complex organic molecules into simple sugars. Overall, the composition and functional traits of these dominant bacterial phyla suggest that the sediment environment is eutrophic and anaerobic, with microbial communities primarily exhibiting phosphate-solubilizing capacities. Furthermore, among the top 10 most abundant bacterial phyla, Cyanobacteria were notably scarce, with a relative abundance of less than 0.01%. This indicates that although cyanobacteria present in feces may retain some potential for revival, they fail to establish a competitive advantage within the sediment microbial community.
From the perspective of dominant bacterial genera in sediments, fecal input and decomposition induced hypoxic conditions in the sediment surface. This promoted the proliferation of Anaerolineaceae sp., a strictly anaerobic bacterium within the phylum Chloroflexota, known for its role in hydrocarbon degradation [39]. The relatively high abundance of MBNT1 sp. suggests its function as a scavenger, facilitating the complete mineralization of low-molecular-weight organic compounds derived from microbial degradation of complex polymeric substrates [40]. This highlights the critical function of bacteria in the fecal decomposition. Additionally, the enrichment of phosphate-solubilizing bacteria such as Vicinamibacterales sp. coincided with elevated P fluxes, suggesting their potential contribution to P release from sediments [41], particularly in the high-input treatments (S5 and M5). The prevalence of Clostridium sp., a strict anaerobe, further indicates that sediments in the high-input groups were largely anaerobic and eutrophic.

4.4. Mechanism of Sediment P Release

The characteristics of P release from sediments indicate that single-input treatments induce a strong but short-term stimulatory effect, whereas phased-input treatments result in prolonged and sustained P release. In S1 and S5, P release flux peaked on day 10. However, due to P release from fecal decomposition and its upward diffusion, SRP in the overlying water became supersaturated, triggering the back-diffusion of P into the sediment. This led to a negative P release flux observed on day 20. The negative feedback effect was more pronounced in S5, whereas in S1, the system had nearly reached adsorption equilibrium by day 30. This difference is likely attributed to factors such as pHsed and DOM, which exerted a stronger role in P release in S5, as previously discussed.
In the phased-input mode, sediment P release flux in both M1 and M5 remained positive across all three measurements. Given that the fecal input amounts were equal on day 0, day 10, and day 20, the decline in P release flux after peaking on day 20 may be attributed to microbial proliferation in the sediment stimulated by P supply from the overlying water. Additionally, the higher APA in M1, the greater NH4Cl-P in S1, and the abundance of low-molecular-weight DOM in both treatments likely facilitated sediment P release, maintaining a positive flux. Compared to previous studies, where sediment P release peaked around day 40 following the deposition of naturally decayed algae, all four fecal input treatments in this study exhibited peak P release flux as early as day 10 or day 20 [42]. This suggests that silver carp accelerate sediment P release by consuming cyanobacteria and converting them into feces, thereby expediting the nutrient cycling process.
From the perspective of the differences in microbial community structure among treatments, the dominant growth of phosphate-solubilizing bacteria in the high fecal input groups led to a higher total P diffusion compared to the low fecal input groups. Sva0485 sp. and Thermodesulfvibrionia sp. are two sulfate-reducing bacteria with relatively high abundance, indicating that microbial iron reduction plays a crucial role in P release from sediments [43]. Iron reduction primarily occurs through two pathways: (1) Sulfide-mediated chemical iron reduction (SCIR). Under hypoxia conditions, sulfide (S2−) produced by sulfate reduction reduces iron oxides to ferrous iron (Fe2+), forming insoluble iron-sulfide precipitates (2FeOOH + 3H2S + 4H+ = 2FeS + S0 + 4H2O), thereby facilitating P release from sediments [44,45]. (2) Microbial iron reduction (MIR). In DOM-rich sediments, sulfate serves as the primary electron acceptor, while sulfide drives the chemical cycling of reactive iron oxides. The SUVA254 and E2:E3 results indicate that S1 and M1 contain abundant low-molecular-weight organic matter, providing a key electron donor for sulfate reduction. In contrast, DOM in S5 and M5 consists of larger molecules. Consequently, Sva0485 sp. and Thermodesulfvibrionia sp. were more abundant in S1 and M1 but less so in S5 and M5. Despite sulfate reduction facilitating P release, the observed P flux was higher in high-input treatments than in the low-input groups. This suggests that microbial reduction may be the dominant mechanism in sediments with low fecal input and low DOM content, whereas it likely plays a supplementary role in S5 and M5.

4.5. Implications for Management

Our findings indicate that fecal input quantity is the primary driver of the negative effects of P release in shallow lakes, while phased input can exacerbate the effects of low single-input. Therefore, when implementing biomanipulation, silver carp should be introduced before the cyanobacterial blooms. If blooms have already occurred, stocking density should be carefully regulated to avoid the strong negative effects of a high amount of fecal input. Additionally, co-culturing silver carp with species that utilize organic detritus from fish excretion (e.g., Plagiogathops micrloepis Bleeker) or benthic organisms (e.g., Hyriopsis cumingii) can provide multiple ecological benefits [46]. This approach not only synergistically facilitates control of algae but also effectively reduces N and P accumulation in both water and sediments. Furthermore, it enhances ecosystem stability and improves nutrient cycling efficiency, ultimately contributing to the establishment of a highly efficient and eco-friendly polyculture model [47].
For lakes where silver carp have already been stocked, a “pulsed harvesting” strategy can be adopted. This approach involves removing adult fish to reduce fecal input per unit time while introducing juveniles to maintain plankton population control. Research suggests that fish-based regulation of potentially harmful blooms, such as those caused by red tide-associated or toxin-producing species, can be effective. However, fish feces may accumulate toxins, potentially posing toxicological risks to other planktonic and benthic organisms that consume them [48]. To mitigate P release flux under high fecal input conditions, submerged macrophytes could be introduced to cover sediment surfaces, while targeted areas could undergo artificial aeration or in situ P inactivation treatments [49].

5. Conclusions

Our 30-day microcosm experiment demonstrated that the input quantity and frequency of silver carp fecal excretion from cyanobacterial consumption significantly influenced P release dynamics in shallow eutrophic lakes. Fecal quantity was the key driver of P release effects, with high input treatments producing peak P fluxes of 8.82 mg m−2 d−1 compared to 1.10 mg m−2 d−1 in low-input groups. Phased inputs extend release duration, while a single input only produces a short-term pulse. At lower fecal input levels, microbial reduction processes primarily facilitated P desorption in sediments. However, at higher fecal inputs, the dominant mechanisms shifted to the combined effects of anaerobic conditions, increased pHsed, and competitive adsorption by DOM.

Supplementary Materials

The following supporting information can be downloaded at: https://www.mdpi.com/article/10.3390/su17167468/s1, Figure S1: Correlation of phosphorus release fluxes with physicochemical indicators in overlying water and sediment. * indicates the significance of the correlation coefficient. * p < 0.05, ** p < 0.01, *** p < 0.001. Table S1: Differences among treatments during the experiment based on Two-way ANOVA analysis; Text S1: The UV–vis absorption spectra of DOM extracts were measured by Equations (S1)–(S4).

Author Contributions

Conceptualization, H.C. and J.J.; Methodology, S.L. and X.C. (Xin Chen); Investigation, S.L., X.C. (Xin Chen), H.C., J.J. and S.H.; Resources, J.J., X.L. and X.C. (Xiaofei Chen); Writing—original draft, S.L. and X.C. (Xin Chen); Writing—review & editing, X.C. (Xin Chen) and C.W.; Visualization, S.L.; Supervision, H.C., X.L., S.H., X.C. (Xiaofei Chen) and C.W.; Project administration, C.W.; Funding acquisition, X.C. (Xiaofei Chen). All authors have read and agreed to the published version of the manuscript.

Funding

This research was funded by the Local Cooperation Project of China Academy of Engineering (grant number HB2023B05) and the Ecological and Environmental Protection Research Project of Hubei Province (grant number 2022HB07).

Conflicts of Interest

Author Shenghua Hu and Huaqiang Chen were employed by Wuhan Bridge Engineering Co., Ltd. The remaining authors declare that the research was conducted in the absence of any commercial or financial relationships that could be construed as a potential conflict of interest.

References

  1. Huisman, J.; Codd, G.A.; Paerl, H.W.; Ibelings, B.W.; Verspagen, J.M.H.; Visser, P.M. Cyanobacterial blooms. Nat. Rev. Microbiol. 2018, 16, 471–483. [Google Scholar] [CrossRef]
  2. Massey, I.Y.; Al Osman, M.; Yang, F. An overview on cyanobacterial blooms and toxins production: Their occurrence and influencing factors. Toxin Rev. 2022, 41, 326–346. [Google Scholar] [CrossRef]
  3. Yi, C.; Guo, L.; Ni, L.; Yin, C.; Wan, J.; Yuan, C. Biomanipulation in mesocosms using silver carp in two Chinese lakes with distinct trophic states. Aquaculture 2016, 452, 233–238. [Google Scholar] [CrossRef]
  4. Jančula, D.; Míkovcová, M.; Adámek, Z.; Maršálek, B. Changes in the photosynthetic activity of Microcystis colonies after gut passage through Nile tilapia (Oreochromis niloticus) and silver carp (Hypophthalmichthys molitrix). Aquac. Res. 2008, 39, 311–314. [Google Scholar] [CrossRef]
  5. Wang, J.; Beusen, A.H.W.; Liu, X.; Bouwman, A.F. Aquaculture Production is a Large, Spatially Concentrated Source of Nutrients in Chinese Freshwater and Coastal Seas. Environ. Sci. Technol. 2020, 54, 1464–1474. [Google Scholar] [CrossRef]
  6. Saba, G.K.; Burd, A.B.; Dunne, J.P.; Hernández-León, S.; Martin, A.H.; Rose, K.A.; Salisbury, J.; Steinberg, D.K.; Trueman, C.N.; Wilson, R.W.; et al. Toward a better understanding of fish-based contribution to ocean carbon flux. Limnol. Oceanogr. 2021, 66, 1639–1664. [Google Scholar] [CrossRef]
  7. Li, H.; Song, C.-L.; Cao, X.-Y.; Zhou, Y.-Y. The phosphorus release pathways and their mechanisms driven by organic carbon and nitrogen in sediments of eutrophic shallow lakes. Sci. Total Environ. 2016, 572, 280–288. [Google Scholar] [CrossRef] [PubMed]
  8. Long, Y.; Hu, X.; Jiang, J.; Hu, J.; Zhu, C.; Zhou, S. Phosphorus sorption—Desorption behaviors in the sediments cultured with Hydrilla verticillata and Scripus triqueter as revealed by phosphorus fraction and dissolved organic matter. Chemosphere 2021, 271, 129549. [Google Scholar] [CrossRef]
  9. Kristensen, E. Organic matter diagenesis at the oxic/anoxic interface in coastal marine sediments, with emphasis on the role of burrowing animals. Hydrobiologia 2000, 426, 1–24. [Google Scholar] [CrossRef]
  10. Kibria, G.; Nugegoda, D.; Fairclough, R.; Lam, P. The nutrient content and the release of nutrients from fish food and faeces. Hydrobiologia 1997, 357, 165–171. [Google Scholar] [CrossRef]
  11. Montanhini Neto, R.; Ostrensky, A. Nutrient load estimation in the waste of Nile tilapia Oreochromis niloticus (L.) reared in cages in tropical climate conditions. Aquac. Res. 2015, 46, 1309–1322. [Google Scholar] [CrossRef]
  12. Conley, D.J.; Paerl, H.W.; Howarth, R.W.; Boesch, D.F.; Seitzinger, S.P.; Havens, K.E.; Lancelot, C.; Likens, G.E. Controlling Eutrophication: Nitrogen and Phosphorus. Science 2009, 323, 1014–1015. [Google Scholar] [CrossRef]
  13. Zhou, P.; Wang, Y.; Geng, Y.; Zhu, Y.; Wu, Y.; Wu, X.; Li, G. Changes of vertical distribution of Microcystis colonies driven by short-term rainfall: Disappearance and reformation of surface bloom. J. Environ. Manag. 2024, 369, 122295. [Google Scholar] [CrossRef]
  14. Murphy, J.; Riley, J.P. A modified single solution method for the determination of phosphate in natural waters. Anal. Chim. Acta 1962, 27, 31–36. [Google Scholar] [CrossRef]
  15. Ribeiro, D.C.; Martins, G.; Nogueira, R.; Cruz, J.V.; Brito, A.G. Phosphorus fractionation in volcanic lake sediments (Azores—Portugal). Chemosphere 2008, 70, 1256–1263. [Google Scholar] [CrossRef]
  16. Jiang, Z.; Liu, S.; Cui, L.; He, J.; Fang, Y.; Premarathne, C.; Li, L.; Wu, Y.; Huang, X.; Kumar, M. Sand supplementation favors tropical seagrass Thalassia hemprichii in eutrophic bay: Implications for seagrass restoration and management. BMC Plant Biol. 2022, 22, 296. [Google Scholar] [CrossRef]
  17. Dean, W.E. Determination of carbonate and organic-matter in calcareous sediments and sedimentary-rocks by loss on ignition comparison with other methods. J. Sediment. Petrol. 1974, 44, 242–248. [Google Scholar] [CrossRef]
  18. Jiang, J.; Zhu, Y.; He, Z.; Bing, X.; Wang, K.; Ma, H.; Liu, F.; Ding, J.; Wei, J. Multiple spectral comparison of dissolved organic matter in the drainage basin of a reservoir in Northeast China: Implication for the interaction among organic matter, iron, and phosphorus. Heliyon 2023, 9, e14797. [Google Scholar] [CrossRef] [PubMed]
  19. Huang, W.; Cao, X.; Huang, D.; Liu, W.; Liu, X.; Zhang, J. Phosphorus characteristics and microbial community in the sediment-water-algal system during algal growth. Environ. Sci. Pollut. Res. 2019, 26, 31414–31421. [Google Scholar] [CrossRef] [PubMed]
  20. Weishaar, J.L.; Aiken, G.R.; Bergamaschi, B.A.; Fram, M.S.; Fujii, R.; Mopper, K. Evaluation of Specific Ultraviolet Absorbance as an Indicator of the Chemical Composition and Reactivity of Dissolved Organic Carbon. Environ. Sci. Technol. 2003, 37, 4702–4708. [Google Scholar] [CrossRef] [PubMed]
  21. Helms, J.R.; Stubbins, A.; Ritchie, J.D.; Minor, E.C.; Kieber, D.J.; Mopper, K.W. Absorption spectral slopes and slope ratios as indicators of molecular weight, source, and photobleaching of chromophoric dissolved organic matter. Limnol. Oceanogr. 2008, 53, 955–969. [Google Scholar] [CrossRef]
  22. Li, F.; Feng, J.; Zhou, X.; Xu, C.; Haissam Jijakli, M.; Zhang, W.; Fang, F. Impact of rice-fish/shrimp co-culture on the N2O emission and NH3 volatilization in intensive aquaculture ponds. Sci. Total Environ. 2019, 655, 284–291. [Google Scholar] [CrossRef]
  23. Alvariño, L.; Castañeda, L.; Panduro, G.; da Silva Acioly, T.M.; Viana, D.C.; Iannacone, J. Use of multispecies (Nannochloropsis oceanica, Artemia franciscana, and Arbacia nigra) approach to assess the quality of marine water from Callao Bay, Peru. Sci. Rep. 2025, 15, 1189. [Google Scholar] [CrossRef]
  24. Wang, H.J.; Wang, H.Z.; Liang, X.M.; Wu, S.K. Total phosphorus thresholds for regime shifts are nearly equal in subtropical and temperate shallow lakes with moderate depths and areas. Freshw. Biol. 2014, 59, 1659–1671. [Google Scholar] [CrossRef]
  25. Ruan, Y. Phosphorus excretion of three species of fish and its role in the recycling of phosphorus in freshwater microcosms. Acta Hydrobiol. Sin. 2005, 29, 55–60. [Google Scholar] [CrossRef]
  26. Zhang, M.; Wu, Y.; Qi, L.; Xu, M.; Yang, C.; Wang, X. Impact of the migration behavior of mesopelagic fishes on the compositions of dissolved and particulate organic carbon on the northern slope of the South China Sea. Deep Sea Res. Part II Top. Stud. Oceanogr. 2019, 167, 46–54. [Google Scholar] [CrossRef]
  27. Boers, P.C.M. The influence of pH on phosphate release from lake-sediments. Water Res. 1991, 25, 309–311. [Google Scholar] [CrossRef]
  28. Santos-Beneit, F. The Pho regulon: A huge regulatory network in bacteria. Front. Microbiol. 2015, 6, 402. [Google Scholar] [CrossRef] [PubMed]
  29. Kuenzler, E.J.; Perras, J.P. Phosphatases of marine algae. Biol. Bull. 1965, 128, 271–284. [Google Scholar] [CrossRef]
  30. Robison, B.H.; Bailey, T.G. Sinking rates and dissolution of midwater fish fecal matter. Mar. Biol. 1981, 65, 135–142. [Google Scholar] [CrossRef]
  31. Nowicki, M.; Devries, T.; Siegel, D.A. Quantifying the Carbon Export and Sequestration Pathways of the Ocean’s Biological Carbon Pump. Glob. Biogeochem. Cycles 2022, 36, e2021GB007083. [Google Scholar] [CrossRef]
  32. Zhu, Z.-Y.; Fang, F.-T.; Hossen, S.; Zhao, Y.; Chen, Z.-Z.; Zeng, C.; Zhou, M. Impact of wild fish faeces to deep sea dissolved organic carbon as revealed by laboratory incubations. Deep Sea Res. Part I Oceanogr. Res. Pap. 2023, 200, 104148. [Google Scholar] [CrossRef]
  33. Deng, Y.; Weng, L.; Li, Y.; Ma, J.; Chen, Y. Understanding major NOM properties controlling its interactions with phosphorus and arsenic at goethite-water interface. Water Res. 2019, 157, 372–380. [Google Scholar] [CrossRef]
  34. Yao, Y.; Li, D.; Chen, Y.; Han, X.; Wang, G.; Han, R. High-resolution characteristics and mechanisms of endogenous phosphorus migration and transformation impacted by algal blooms decomposition. Sci. Total Environ. 2022, 820, 152907. [Google Scholar] [CrossRef]
  35. Gomez, E.; Durillon, C.; Rofes, G.; Picot, B. Phosphate adsorption and release from sediments of brackish lagoons: pH, O2 and loading influence. Water Res. 1999, 33, 2437–2447. [Google Scholar] [CrossRef]
  36. Wang, Q.; Yu, J.; Li, X.; Zhang, Y.; Zhang, J.; Wang, J.; Mu, J.; Yu, X.; Hui, R. Seasonal and anthropogenic influences on bacterioplankton communities: Ecological impacts in the coastal waters of Qinhuangdao, Northern China. Front. Microbiol. 2024, 15, 1431548. [Google Scholar] [CrossRef] [PubMed]
  37. Wu, G.-F.; Zhou, X.-P. Characterization of phosphorus-releasing bacteria in a small eutrophic shallow lake, Eastern China. Water Res. 2005, 39, 4623–4632. [Google Scholar] [CrossRef]
  38. Chung, H.; Park, M.; Madhaiyan, M.; Seshadri, S.; Song, J.; Cho, H.; Sa, T. Isolation and characterization of phosphate solubilizing bacteria from the rhizosphere of crop plants of Korea. Soil Biol. Biochem. 2005, 37, 1970–1974. [Google Scholar] [CrossRef]
  39. Liang, B.; Wang, L.-Y.; Mbadinga, S.M.; Liu, J.-F.; Yang, S.-Z.; Gu, J.-D.; Mu, B.-Z. Anaerolineaceae and Methanosaeta turned to be the dominant microorganisms in alkanes-dependent methanogenic culture after long-term of incubation. AMB Express 2015, 5, 37. [Google Scholar] [CrossRef]
  40. Begmatov, S.; Beletsky, A.V.; Dedysh, S.N.; Mardanov, A.V.; Ravin, N.V. Genome analysis of the candidate phylum MBNT15 bacterium from a boreal peatland predicted its respiratory versatility and dissimilatory iron metabolism. Front. Microbiol. 2022, 13, 951761. [Google Scholar] [CrossRef]
  41. Wu, X.; Rensing, C.; Han, D.; Xiao, K.-Q.; Dai, Y.; Tang, Z.; Liesack, W.; Peng, J.; Cui, Z.; Zhang, F.; et al. Genome-Resolved Metagenomics Reveals Distinct Phosphorus Acquisition Strategies between Soil Microbiomes. mSystems 2022, 7, e01107-21. [Google Scholar] [CrossRef] [PubMed]
  42. Chen, Y.; Li, D.; Liu, S.; Zhang, Y.; Yan, X.; Song, X.; Li, Z.; Li, B.; Shan, S.; Zhu, Y.; et al. Long-term effects of dead algal deposition on sediment surfaces: Behavior of endogenous phosphorus release in sediments. Water Res. 2025, 268, 122742. [Google Scholar] [CrossRef]
  43. Vuillemin, A.; Horn, F.; Friese, A.; Winkel, M.; Alawi, M.; Wagner, D.; Henny, C.; Orsi, W.D.; Crowe, S.A.; Kallmeyer, J. Metabolic potential of microbial communities from ferruginous sediments. Environ. Microbiol. 2018, 20, 4297–4313. [Google Scholar] [CrossRef]
  44. Lehtoranta, J.; Ekholm, P.; Pitkänen, H. Coastal Eutrophication Thresholds: A Matter of Sediment Microbial Processes. AMBIO J. Hum. Environ. 2009, 38, 303–308. [Google Scholar] [CrossRef]
  45. Yao, Y.; Li, D.; Chen, Y.; Liu, H.; Wang, G.; Han, R. High-resolution distribution of internal phosphorus release by the influence of harmful algal blooms (HABs) in Lake Taihu. Environ. Res. 2021, 201, 111525. [Google Scholar] [CrossRef]
  46. Chen, L.; Gao, Y.; Zhang, Y.; Zhu, Y.; Kong, M.; Xu, X.; Wang, Y.; Huang, T. Effects of Plagiogathops micrloepis Bleeker, Hypophthalmichthys molitrix and Aristichthys nobilis polyculture on water environment and nitrogen migration and transformation. China Environ. Sci. 2019, 39, 1181–1188. [Google Scholar]
  47. Guo, Y.; Gao, Y.; Zhang, Y.; Sun, L.; He, D.; Wu, D. Effect of Xenocypris microlepis on feces and microcystis activity from microcystis-dietary silver carp and bighead carp. China Environ. Sci. 2016, 36, 3784–3792. [Google Scholar]
  48. Saba, G.K.; Steinberg, D.K. Abundance, Composition and Sinking Rates of Fish Fecal Pellets in the Santa Barbara Channel. Sci. Rep. 2012, 2, 716. [Google Scholar] [CrossRef] [PubMed]
  49. Zeller, M.A.; Alperin, M.J. The efficacy of Phoslock® in reducing internal phosphate loading varies with bottom water oxygenation. Water Res. X 2021, 11, 100095. [Google Scholar] [CrossRef]
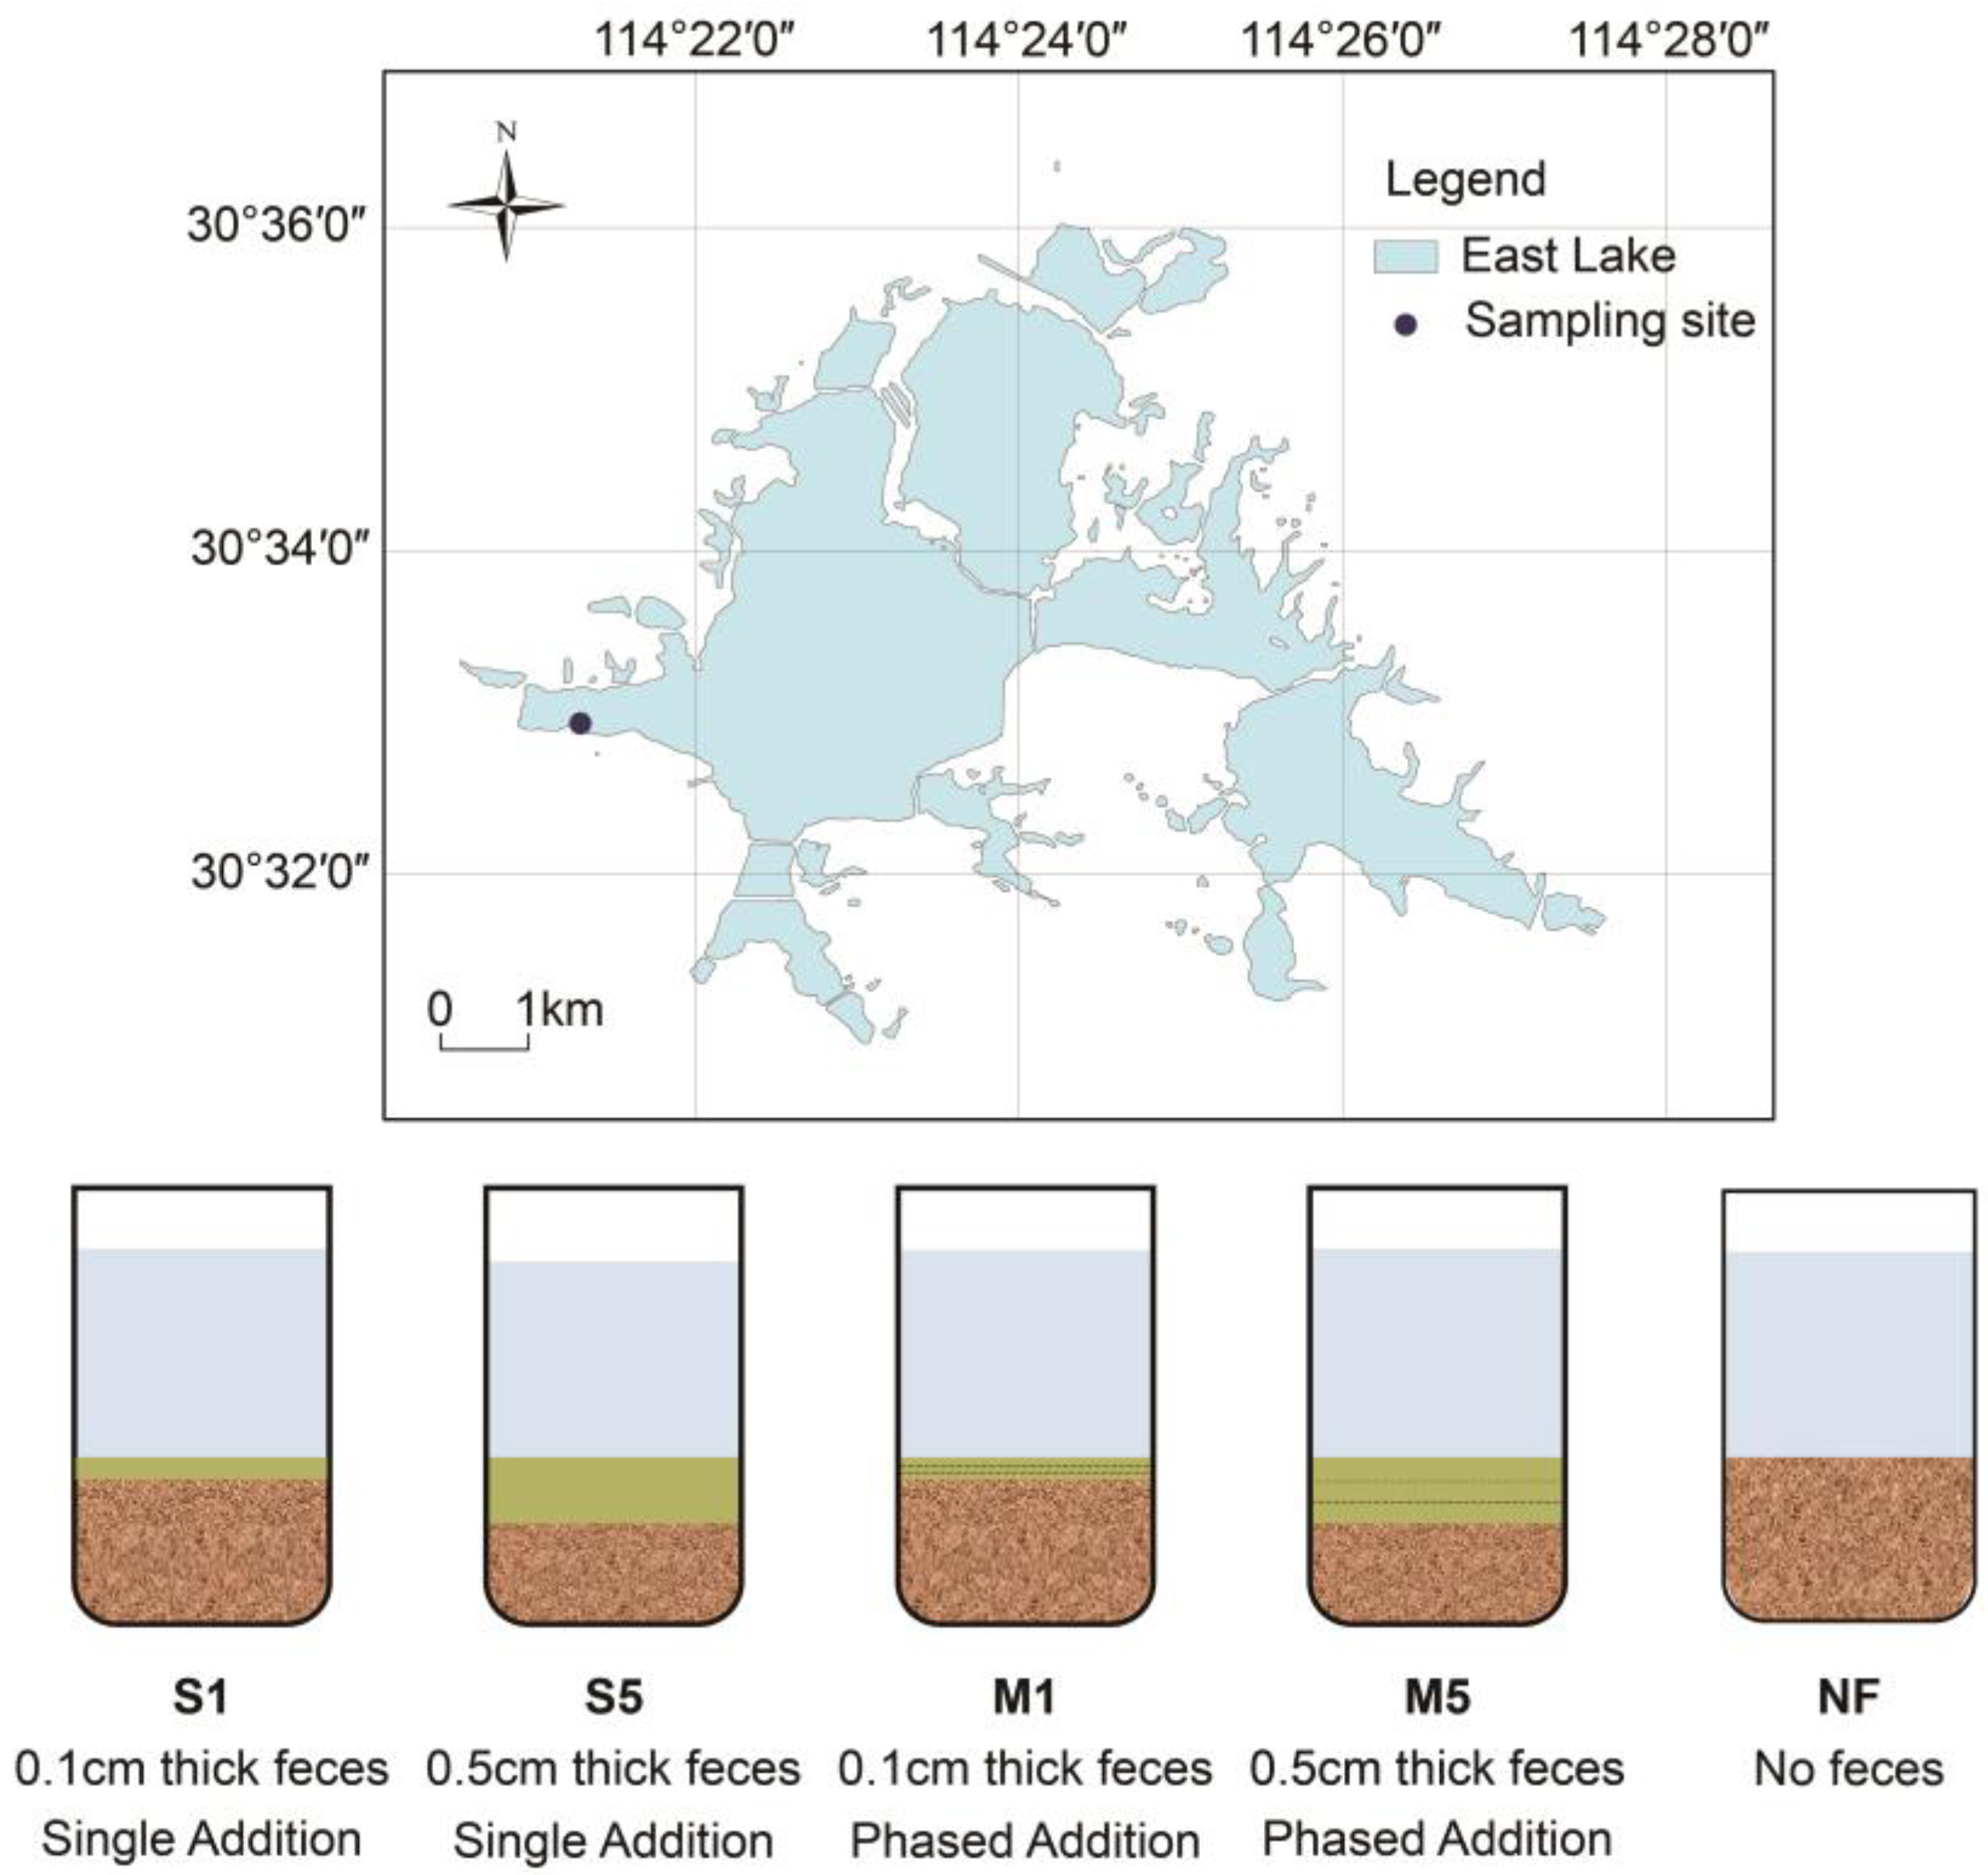
Figure 1. Schematic diagram of sampling sites and the simulation experiment.
Sustainability 17 07468 g001
Figure 2. Changes of (A) pH, (B) Cond., (C) DO, and (D) ORP in overlying water during the experiment (Different lowercase letters above the bars indicate significant differences among treatments).
Sustainability 17 07468 g002
Figure 3. Changes of (A) TP, (B) TDP, and (C) SRP in overlying water during the experiment (Different lowercase letters above the bars indicate significant differences among treatments).
Sustainability 17 07468 g003
Figure 4. Physicochemical properties of sediments in different groups ((A): pHsed; (B): OM; (C): APA (Alkaline Phosphatase Activity); (D): DOM (Dissolved Organic Matter); (E): SUVA254; (F): E2:E3. Different lowercase letters above the bars indicate significant differences among treatments.
Sustainability 17 07468 g004
Figure 5. P fractions of sediments in different groups ((A): TPsed; (B): NH4Cl-P; (C): Fe/Al-P; (D): Ca-P; (E): Res-P; (F): OP. Different lowercase letters above the bars indicate significant differences among treatments).
Sustainability 17 07468 g005
Figure 6. Characterization parameters of sediment bacterial community in different treatment groups ((A): Simpson; (B): Venn diagram; (C): the relative abundance in phylum level; (D): the relative abundance in genus level. * indicates the significance of the correlation coefficient. * p < 0.05, ** p < 0.01).
Sustainability 17 07468 g006
Figure 7. (A) PCoA and (B) RDA of sediment bacterial OTUs in different treatments.
Sustainability 17 07468 g007
Figure 8. Fluxes of P across SWI in different treatments.
Sustainability 17 07468 g008
Disclaimer/Publisher’s Note: The statements, opinions and data contained in all publications are solely those of the individual author(s) and contributor(s) and not of MDPI and/or the editor(s). MDPI and/or the editor(s) disclaim responsibility for any injury to people or property resulting from any ideas, methods, instructions or products referred to in the content.