Abstract
In the context of the Carbon Generalized System of Preferences (CGSP), this paper develops a three-tier reverse supply chain model comprising the government, recyclers, and consumers. Differential game analysis is employed to investigate the evolutionary dynamics of consumers’ perceived recycling value and to examine how government recycling efforts and recyclers’ point rewards levels influence this perception. Furthermore, the study explores the dynamic trajectory of consumers’ perceived recycling value across three decision-making models—collaborative-driven, government-driven, and market-driven—and evaluates its impact on supply chain efficiency. The research shows that (1) enhanced recycling efforts by both the government and recyclers significantly improve consumers’ perceived recycling value, thereby promoting the recycling of waste electrical and electronic equipment, with the most pronounced improvement observed under the collaborative-driven strategy; (2) in the government-driven model, the government’s subsidy rate affects recyclers’ decisions regarding point-based incentives but does not influence the government’s own recycling effort; (3) the evolutionary trajectories of consumers’ perceived recycling value and system efficiency differ among the models, with the highest levels achieved under the collaborative-driven model, followed by the government-driven model, and the lowest under the market-driven model. This study fully accounts for the dynamic nature of consumers’ perceived recycling value, offering theoretical and practical guidelines for effective WEEE recycling.
1. Introduction
Rapid technological advancements have accelerated the rate at which electrical and electronic products are updated and replaced, resulting in a significant increase in the volume of discarded waste. The United Nations projects that global annual electronic waste will reach 74 million tons by 2030 and escalate to 120 million tons by 2050 [1]. Although these discarded products contain valuable materials, they also include toxic substances such as lead, cadmium, mercury, and chromium. Research indicates that improper disposal of waste electrical and electronic equipment (WEEE) can release these hazardous substances, potentially causing severe health issues, including birth defects [2], impaired neurological development [3], reduced learning capacity [4], DNA damage [5], and cancer [6]. Electronic waste is characterized by the dual attributes of high environmental risk and significant resource value, and its recycling and disposal involve complex technical processes as well as the coordination of multiple stakeholder interests; consequently, exploring effective recycling strategies for discarded electrical and electronic appliances is of critical global importance.
Under climate change pressures, many nations have enacted regulations [7,8]. In 2024, China issued the “Action Plan for Promoting Large-Scale Equipment Upgrades and Consumer Goods Replacement” [9] to efficiently recycle obsolete equipment. It is worth noting that the waste electrical and electronic equipment (WEEE) recycling industry is facing numerous challenges due to factors such as the global economic slowdown, high costs of electronic waste disposal [10], and the volatility and uncertainty of the value of recovered materials [11]. Furthermore, non-standard recycling channels circumvent the costs associated with environmentally compliant processing, allowing them to purchase waste from consumers at higher prices. This practice compresses the profit margins of formal recycling enterprises while simultaneously leading to significant environmental pollution and health risks [12]. The formulation and enforcement of mandatory laws and regulations by governmental bodies have consistently been identified as the primary internal driving force for manufacturing enterprises, significantly incentivizing companies to engage in electronic waste recycling [13,14]. Therefore, government subsidies (e.g., the California Electronic Waste Recycling Program [CEW] in the United States) provide economic incentives for recycling enterprises and are crucial for bridging cost gaps and enhancing recycling rates.
To mitigate carbon emissions and curb ecological degradation, the government has developed and implemented a series of mandatory carbon reduction measures for enterprises. In contrast, to influence individual consumer behavior, it has primarily employed “soft measures,” such as promotional guidance and subsidy incentives. Mung kung et al. [15] argue that residential consumption underpins corporate production and energy consumption, and that environmental degradation primarily originates from consumer behaviors and the corresponding demands. The Personal Carbon Trading Mechanism (PCT) [16] advocates for market-based incentives to encourage residents to participate in governmental carbon reduction programs; however, its compulsory application could lead to challenges such as inequitable distribution and difficulties in supervision and enforcement [17]. In comparison, the Carbon Goodwill System of Preferences (CGSP), which employs positive incentives to stimulate voluntary participation in carbon reduction efforts, has proven more effective in mobilizing widespread societal engagement. As an incentive mechanism, carbon credits quantify the value of both public and corporate carbon reduction activities, leveraging commercial and policy incentives to support the attainment of the “dual carbon” goals [18]. This mechanism allows consumers to accumulate carbon credits in their accounts and later redeem them for monetary rewards, material benefits, or discounts, thereby enhancing consumer engagement through economic incentives and increasing their willingness to recycle used electronic products [19].
An essential component of the supply chain, consumers’ perceptions of the value of recycled products directly influence their recycling behavior. For instance, Xu Minli [20] contends that under the “Internet+” recycling model, factors such as functional, informational, procedural, platform, and brand values all affect consumers’ willingness to recycle. Furthermore, consumers’ value perceptions not only shape individual recycling behaviors but also determine the dynamics of the overall recycling market. Hai A. T [21] further suggests that positive emotional experiences, such as a sense of pride associated with recycling, may enhance consumers’ participation. Collectively, these studies indicate that consumers’ perceptions of recycling value significantly impact their recycling decisions and behaviors. However, the existing literature predominantly adopts a static perspective when analyzing consumer perceptions, with few investigations exploring the dynamic effects of these perceptions across the entire recycling process.
This study examines the recycling of Waste Electrical and Electronic Equipment (WEEE), which presents more pronounced challenges compared to other reverse supply chains due to the complexity of recycling technologies [22], the intensity of policy dependencies [23], and the diverse dimensions of value perception [24]. Building on this foundation, the paper delves into an in-depth discussion of three key issues related to WEEE recycling:
- (1)
- How do governmental recycling efforts and recyclers’ reward point subsidy levels influence consumers’ perceived recycling value under different decision-making models?
- (2)
- What are the evolutionary characteristics of consumers’ perceived recycling value across the various decision-making frameworks?
- (3)
- How should recyclers formulate their strategies under scenarios with and without government subsidies?
2. Literature Review
2.1. Carbon Generalized System of Preferences
Carbon Generalized System of Preferences (CGSP) is a market-driven incentive that motivates green, low-carbon decisions aligning with public interests [25]. It promotes voluntary participation, tracks behavior, quantifies emissions, and applies targeted incentives to steer society toward sustainable, low-carbon development [26]. Tan et al. [27] incorporated factors such as participation risks, feedback, social norms, implementation costs, institutional and technological environments, and low-carbon awareness into the Technology Acceptance Model (TAM), revealing that most factors exert their influence through perceived usefulness. Lin and Yang [28] showed that positive low-carbon attitudes and high social trust increase CGSP adoption. Furthermore, as a new carbon reduction mechanism, the study of the dynamic effects of CGSP is of great significance: Ding et al. [29] and Guo et al. [30] used dynamic evolutionary game models to study CGSP effects on public behaviors and government tax policies, though they overlooked enterprise impacts and recycling behaviors, respectively. In addition, several scholars have employed the Stackelberg game model to examine supply chain optimization strategies between governmental agencies and enterprises regarding carbon reduction [31], subsidy allocation [32], and collaborative mechanisms [33] within environmental policy frameworks. Chen et al. [34] further applied the model to evaluate the impacts of various subsidy policies. Sun et al. [35] developed a dynamic cooperation mechanism and examined optimal collaborative emission reduction strategies within supply chains. Similarly, Ji et al. [36] demonstrated that a joint emission reduction strategy is more profitable for all stakeholders in the supply chain. The CGSP incentivizes enterprises to enhance their investments through targeted subsidies [27] while simultaneously shaping consumer value perceptions via both monetary and non-monetary incentive mechanisms [37,38]. This approach is distinctly different from other environmental policies. Furthermore, most of the literature on environmental policies only considers the game among enterprises and regards government decisions as exogenous variables. However, government decisions often interact with corporate recycling decisions [39]. Accordingly, this paper assumes that the government functions as a strategic actor in the decision-making process and examines how government subsidies influence the points reward inputs of recyclers within the context of the Carbon Generalized System of Preferences.
2.2. Customer Perceived Value
Customer Perceived Value (CPV) is a fundamental concept in marketing and consumer behavior research. It refers to the judgments and preferences formed by customers after evaluating the benefits and costs associated with products or services [40,41]. Consumer value perception encompasses not only evaluations of a product or service’s functional value but also multiple dimensions, including emotional, social, and procedural aspects [42]. Tan et al. [27] argue that customer perceived value refers to the customer’s perceptual preferences and evaluations of product usage outcomes based on certain product attributes, the performance of these attributes, and the extent to which they facilitate or hinder the achievement of the customer’s goals and intentions within a specific context. Empirical research has examined customer perceived value from various perspectives, including perceptual dimensions [43,44,45], behavioral factors [46,47], and other influencing factors [48]. Furthermore, within the supply chain domain, several studies examine the impact of consumers’ recycling value perceptions on the strategic choices of supply chain members, including pricing decisions [49], supply chain efficiency [50], and market competition [51]. As research has advanced, some scholars have recognized the uncertainty inherent in consumers’ value perception [52,53]. However, there has been insufficient exploration of its dynamic characteristics over time. Furthermore, some studies have shown that government publicity and the recycling efforts of recyclers can affect consumers’ value perception [54,55,56], but none of these have taken into account the time dimension. In fact, consumer value perception does not exist statically [57]. Chen et al. [58] investigated the impact of consumers’ evolving green perceptions on production strategies. In a similar vein, we posit that consumer value perceptions are dynamic; however, our focus lies in examining how changes in consumer recycling value perceptions affect supply chain performance within the context of CGSP.
2.3. Recycling of WEEE
Entering the 21st century, increased global awareness of environmental protection, along with the implementation of pertinent laws and regulations, has shifted research on electronic and electrical product recycling toward a more standardized and systematic approach. In 2004, the European Union enacted the Waste Electrical and Electronic Equipment (WEEE) and Restriction of Hazardous Substances (RoHS) directives, which aimed to standardize the recycling and reuse of electronic and electrical products [59]. Recently, advances in internet technology sparked the innovative “Internet+Recycling” model. Li and Wu [60] developed a dual-channel reverse supply chain that incorporates consumer preferences to optimize recycling and remanufacturing, balancing economic benefits and environmental sustainability. Wei et al. [61] employed a Stackelberg game framework to examine cooperative strategies between dual recycling channels within the supply chain. They further introduced a revenue-sharing contract model to analyze profit distribution. The study revealed that a well-formulated revenue-sharing contract not only fosters collaboration between recyclers and e-retailers in the recycling of electronic products but also maximizes the overall profitability of the supply chain. Xie et al. [62] investigated cooperation strategies between enterprises and e-commerce platforms by constructing an evolutionary game model under the frameworks of government subsidy and tax policies. Hu et al. [63] employed a three-party evolutionary game model to examine how, under environmental regulations, the state and local governments’ regulations affect the WEEE industry and its dynamic interactions. Existing research mainly uses evolutionary game theory for recycling supply chain dynamics, while this study applies a differential game model with time factors to analyze the dynamic interactions between the government and recyclers under CGSP.
A review of the existing literature reveals that although numerous studies have examined consumer value perception and the recycling of electronic and electrical products, few have incorporated the temporal factor, specifically the adjustments in supply chain members’ strategies over time. In reality, consumers’ perceptions of recycling value evolve as time progresses; therefore, this paper adopts a dynamic perspective to investigate the impacts of government recycling efforts and the subsidy levels offered by recyclers on consumers’ recycling value perception within the context of a carbon-inclusive subsidy policy. It employs a differential game to analyze the evolution process of consumer recycling value perception and further examines how these time-varying perceptions influence the decision-making and efficiency of the electronic and electrical product recycling supply chain system.
3. Model Description
3.1. Problem Description
Consider a three-tier reverse supply chain comprising the government, recyclers, and consumers. Operating within the context of CGSP policy promotion and circular economy development, consumers are presumed to recognize the inherent recycling value of products. Recyclers collect idle electronic products from these informed consumers, offering “green account” points as subsidies. Concurrently, the government evaluates the provision of cost-sharing subsidies to recyclers, in accordance with policy directives, to encourage the collection of waste electrical and electronic equipment. These governmental investments in promoting and supporting the recycling of waste electronic products foster a societal culture of widespread recycling and enhance public engagement. Moreover, the point-based subsidies provided by recyclers further reinforce consumers’ perception of the recycling value of idle electronic products. Owing to its pivotal role in the overall recycling and environmental protection economic framework, the government is designated as the dominant player in the government–enterprise recycling Stackelberg differential game process. Figure 1 illustrates the structure of the supply chain.
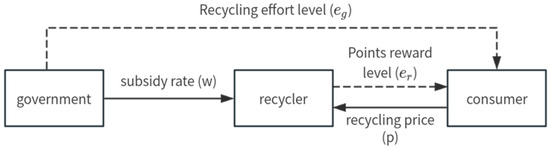
Figure 1.
Supply chain structure.
3.2. Model Building
Assumption 1.
It is assumed that consumers possess a perception of recycling value, meaning that they may regard recycling behavior as valuable either because it offers economic incentives or because it contributes to environmental protection [64]. This paper posits that the recycling value consumers attribute to electronic products fundamentally influences their recycling behavior. To sum up, referring to W, Zhang [65], Zhou & Ye [66], and Li, H., & Tan, D [67], we formulate the differential function that captures the dynamic process underlying consumers’ perception of recycled value:
Among these, represents consumers’ perceived recycling value at time t, denotes all governmental promotional and supportive efforts regarding recycling at time t (collectively referred to as the government’s recycling efforts), indicates the extent to which recyclers reward consumers’ recycling behavior with “green account” points at time t (hereafter defined as the points reward level), and represents consumers’ initial perceived recycling value. This paper examines the long-term dynamics of consumer perceptions regarding government and recycler recycling practices, highlighting a gradual alignment with policy intensity over time. Instantaneous changes are interpreted as asymptotic predictions rather than immediate responses. Therefore, this simplification does not compromise the core final conclusions. Additionally, based on relevant literature [40], we assume that the recycling value perceived by consumers is a comprehensive reflection of various external factors and does not solely depend on the actual efforts made by the government and recyclers. We define the difference between consumers’ perceived efforts and the actual efforts of the government and recyclers as the recycling effort transmission coefficient and the points reward transmission coefficient , respectively; represents the natural decay rate of consumers’ recycling value perception.
Assumption 2.
The government’s recycling cost and the subsidy cost of recyclers are positively correlated with their level of investment in recycling efforts and the level of points rewards [39]. Based on the cost functions formulated in references [68,69,70], the cost input is modeled as a convex function of the input quantity. At time t, let and denote the government’s recycling costs and the recycling enterprises’ points reward costs, respectively, with (, ≥ 0) representing an additional cost parameter. Moreover, and denote the input cost coefficients for the points reward level for recyclers and the recycling effort level for the government, respectively.
Assumption 3.
Consumers’ recycling behavior is influenced by both their perceived recycling value and the prevailing recycling prices. An increased perception of recycling value tends to stimulate consumer participation, while higher recycling prices also serve to encourage greater involvement in recycling activities. Since this paper focuses primarily on the interplay between subsidies, recycling efforts, and recycling value perception, recycling price will be treated as an exogenous variable. Recognizing that both recycling value perception and recycling prices exhibit dynamic changes—and that recycling volume inherently possesses dynamic characteristics—we adopt the framework presented in De Giovanni, P [71] to define the recycling function at time t as follows:
The sensitivity coefficient for perceived recycling value is denoted by , with , while α > 0 represents the sensitivity coefficient for the recycling price. However, in practice, significant variations in consumers’ age, information acquisition channels, geographic regions, and consumption habits result in differing sensitivities to the perceived value of recycling. This phenomenon is further examined in Section 6.
Assumption 4.
Social welfare is defined as the aggregate of the profits generated by participants from recycling idle electronic products, the consumer surplus, and the benefits arising from environmental improvements. Consumer surplus is defined as the difference between the maximum price that consumers are willing to pay for a product and the actual price they pay [58]:
To evaluate the environmental benefits of recycling waste electronic products, we employ the total residual value of the recycled products as a proxy for environmental improvement [72]. This approach assumes that each recycled electronic product possesses an identical residual value:
Let E(t) denote the total residual value of products that can be recovered and utilized during the recycling process. The equation above illustrates that the environmental improvements achieved through the recycling of electronic products are quantified by their positive externalities [50]. As discussed, these environmental benefits are reflected in an increase in E(t), and a higher recycling volume, D(t), correspondingly elevates the value of E(t). In summary, the social welfare function can be expressed as follows:
Assumption 5.
Both the government and recyclers are assumed to share the same positive discount rate, denoted by , and each seeks to maximize its own economic benefits over an infinite time horizon. To encourage active recycling of waste electronic products, the government provides subsidies partially covering the cost of points-based rewards for recyclers, with a subsidy rate denoted by w (where w ∈ (0, 1)), meaning that only a fraction of the recycling costs is subsidized. Although the government traditionally integrates societal and environmental benefits to maximize overall social welfare, in this study, it is treated as a strategic player in the game, focusing instead on maximizing its own utility when deciding on subsidization strategies. In the recycling process, the government, as the leader, determines both the recycling effort input and the proportion of points-based reward cost subsidies allocated to recyclers at each time step. Recyclers, acting as followers, decide on their own recycling effort input at each time step. Assuming that recyclers’ profits are given by the difference between the residual value of recycled products and the recycling price—where the revenue from recycling is defined as the product’s residual value minus the recycling price—it is further assumed that this revenue is positive and denoted by
. Therefore, the differential game model between the government and recyclers can be formulated as follows:
In this study, the notation “G” represents the government, while “R” denotes the recyclers. Three decision-making models are considered: the centralized decision-making model, the market-driven model, and the government-driven model, indicated by the superscripts “C”, “DN”, and “DS”, respectively. Under the centralized framework, the government and recyclers collaborate as a community of shared interests to maximize overall benefits; in the market-driven and government-driven frameworks, the government and recyclers make decisions independently, with each party seeking to optimize its own benefits.
4. Model Solutions and Comparative Analysis
This section constructs three decision-making models. In the collaboration-driven model, the government and recyclers jointly formulate decision-making objectives and strategies while coordinating their participation in the recycling process. Additionally, based on variations in government leadership, two types of models are established: the first is the market autonomous-driven model, in which the government provides no subsidies to recyclers and recycling activities are entirely regulated by spontaneous market mechanisms; the second is the government-guided driven model, where the government offers targeted subsidies to incentivize recycling actions, thereby facilitating the effective functioning of the market recycling system. Considering the unique role of the government, we assume that the government and recyclers engage in a Stackelberg leader-follower game, with the government acting as the leader by first determining its own recycling efforts and subsidy rate, and the recyclers subsequently setting their level of point rewards based on the government’s decisions. Table 1 presents a comprehensive list of the parameters, variables, and their corresponding definitions.

Table 1.
Parameters, variables, and definitions in the study.
4.1. Collaboration-Driven Model (C)
Under a collaboration-driven structure, both the government and recyclers aim to maximize overall benefits. For instance, Nanjing, China, employs a “government–enterprise cooperation” model by integrating leading companies from the recycling industry. This approach combines governmental promotion with market-oriented operations to achieve efficient recycling of paper resources. Figure 2 illustrates the decision-making sequence between the government and recyclers under this collaborative strategy.
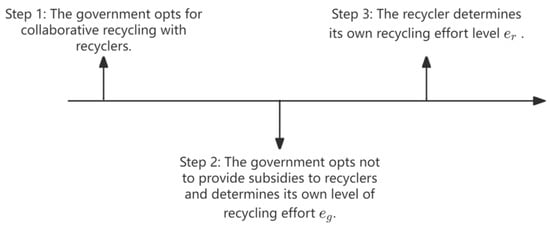
Figure 2.
Decision sequence under scenario C.
In Model C, the government and recyclers collaboratively determine recycling efforts and reward credit levels to maximize the overall profit function, as follows:
In deriving the overall optimal strategy, the Hamilton–Jacobi–Bellman (HJB) equation and differential game theory are introduced to analyze the decision-making behavior of supply chain members, which depends on both time and the current state. Let V(R) denote the overall profit function; by applying optimal control theory, the corresponding HJB equation is derived as follows:
In accordance with optimal control theory, the first derivative of the Hamilton–Jacobi–Bellman (HJB) equation with respect to the decision variable is computed and subsequently set to zero. The resulting condition is presented in Lemma 1.
Lemma 1.
Under Model C,
- 1.
- The points reward levels for recyclers, as well as the government’s recycling efforts levels, are delineated as follows:The overall optimal value function is represented as follows:
- 2.
- The best trajectory for consumers’ perception of recycled value is represented as follows:
- 3.
- When Model C reaches steady-state conditions, consumer surplus, environmental benefits, and social welfare are defined, respectively, as follows:
Proof of Lemma 1.
A sufficient condition for a steady-state Markov equilibrium is represented as follows:
There exists a unique, absolutely continuous solution G: [0,∞)→R+, and there exists a continuous, differentiable, bounded differential function V(R) such that for all R ≥ 0, the Hamilton–Jacobi–Bellman (HJB) equation is satisfied:
The Hessian matrix of Equation (19) is , so it is easy to see that the Hessian is negative definite. Solve for the first-order partial derivatives of and and set them equal to zero to obtain We substitute these into the above equation, as follows:
We can simplify the above formula and observe the linear structure of the game as follows:
Thus, we propose that the linear value functions in Model C are . To hold the equation in Equation (21), we solve the coefficient terms for θ and set the constant term equal to zero; thus, we obtain a set of and as follows:
By substituting into and , we derive the optimal strategy set for the respective recycling efforts of enterprises and governments as follows:
The time path at equilibrium for the state variable of the consumer’s recycling value perception in Model C, which is denoted by , and the steady state of consumer’s recycling value perception, which is denoted by , is obtained by inserting formula (24) into (1) and setting :
Then, by solving the first-order linear ordinary differential equation, the instantaneous function of consumer recycling value perception can be derived as follows:
Applying a similar approach, Lemma 2 and 3 can be proved. □
Lemma 1 demonstrates that under a collaboration-driven model, the government’s recycling effort and the recycler’s reward points initiatives exhibit analogous structures; specifically, when the transmission coefficients and cost coefficients for both entities are equal (i.e., and ), their recycling effort levels and reward point allocations are identical. Moreover, irrespective of whether the effort is exerted by the government or the recycler, an increase in the consumer’s sensitivity to perceived recycling value leads to enhanced effort levels. In contrast, higher cost coefficients correspond with reduced levels of both recycling effort and reward point incentives.
Proposition 1.
Under a centralized decision-making framework, the decision variables associated with each key parameter exhibit relative stability, as illustrated in Table 2.
Table 2.
Comparative static analysis of key parameters of the strategy under Model C.
Proposition 1 indicates that the recycling efforts of both governments and recyclers are not associated with price fluctuations but are instead determined by the residual value of recycled materials. The residual value is defined as the potential worth of a product or material after it undergoes the recycling process. Given its direct connection to resource efficiency and environmental impact, this value is a critical factor for both recyclers and government entities when devising recycling strategies. In centralized decision-making frameworks, governments and recyclers emphasize the overall profitability of the entire supply chain and may even accept a reduction in their individual profits to ensure collective success. This phenomenon is evident in practice; for instance, the German government has enacted legislation that mandates producers to take responsibility for the recycling of packaging materials and has introduced the “Green Dot” system. Although these measures increase costs for producers, they effectively reduce packaging waste and promote enhanced social welfare.
4.2. Market-Driven Model (DN)
Under DN, both the government and recyclers independently determine their respective levels of recycling effort, with the government not providing any subsidies to the recyclers. The decision sequence under the DN strategy is illustrated in Figure 3.
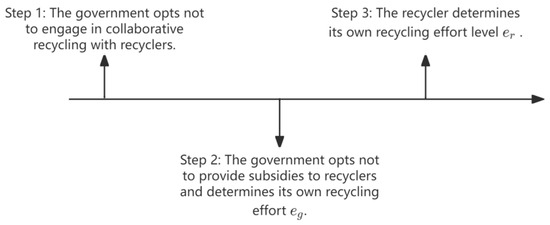
Figure 3.
Decision sequence under model DN.
At this point, the profit functions for both the government and the recyclers are as follows:
Based on optimal control theory, the corresponding Hamilton–Jacobi–Bellman (HJB) equations for both the government and recyclers can now be derived:
Lemma 2.
Under Model DN,
- 1.
- The points reward levels for recyclers, as well as the government’s recycling efforts levels, are delineated as follows:The overall optimal value function is as follows:
- 2.
- The best trajectory for consumers’ perception of recycled value is given as follows:
- 3.
- When Model DN reaches steady-state conditions, consumer surplus, environmental benefits, and social welfare are defined, respectively, as follows:
Lemma 2 demonstrates that, in Model DN, the government does not allocate cost subsidies to recycling firms in the form of bonus points. When both the transmission and cost coefficients are identical for the government and recycling firms, the government’s investment in recycling efforts surpasses the recycling firms’ expenditure on bonus point rewards, with both investment levels being influenced by the recycling price. Specifically, as the recycling price increases, the government intensifies its recycling efforts, whereas the recycling firms reduce their bonus point rewards. This inverse relationship arises because an elevated recycling price diminishes the profit margins of recycling firms, compelling them to curtail bonus point rewards to safeguard their economic interests. Concurrently, a higher recycling price stimulates greater consumer participation in the recovery of waste electronic products. For the government, the resultant benefits emanate from enhanced consumer surplus and improved environmental outcomes; namely, an increase in the recycling price not only augments consumer surplus but also boosts the volume of recycled products, thereby facilitating superior environmental performance. Consequently, since the additional benefits far exceed the costs associated with increased recycling efforts, the government is incentivized to further amplify its investment in these efforts.
Proposition 2.
Under the market-driven framework, the decision variables associated with each key parameter exhibit relative stability, as illustrated in Table 3.
Table 3.
Comparative static analysis of key parameters of the strategy under Model DN.
It is evident from Proposition 2 that the residual value positively influences the decision-making processes of both the government and recyclers, whereas the price exerts a positive effect on the government but a negative one on recyclers. As a recoverable resource, the residual value enhances profitability for both stakeholders, thereby motivating them to increase their investments in recycling efforts. Conversely, an increase in recycling prices reduces recyclers’ profit margins, prompting them to lower cost inputs to sustain profitability. Furthermore, diminished investments in consumer reward programs by recyclers can adversely affect consumers’ perceived value of recycling; without adequate incentives, consumers may feel that their recycling efforts are insufficiently acknowledged or compensated, ultimately dampening their enthusiasm for participation. Consequently, it is imperative for the government to implement policies that encourage recyclers to augment their investments and engagement in recycling activities.
4.3. Government-Driven Model (DS)
Under the DS Model, both the government and recyclers independently determine their recycling effort levels. The government opts to provide subsidies to recyclers as an incentive to boost recycling activities, with the subsidy rate being . The decision sequence under the DS strategy is illustrated in Figure 4.
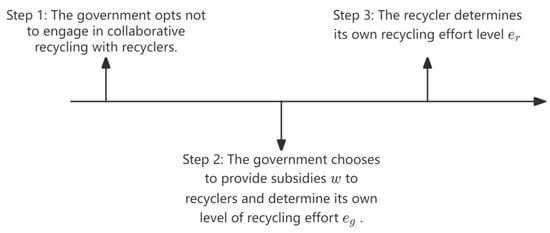
Figure 4.
Decision sequence under model DS.
At this point, the profit functions for both the government and the recyclers are as follows:
At this stage, the corresponding Hamilton–Jacobi–Bellman (HJB) equations for both the government and the recyclers are presented as follows:
Lemma 3.
Under Model DS,
- 1.
- The points reward levels for recyclers, as well as the government’s recycling efforts levels, are delineated as follows:The overall optimal value function is defined as follows:
- 2.
- The best trajectory for consumers’ perception of recycled value is defined as follows:
- 3.
- When Model DS reaches steady-state conditions, consumer surplus, environmental benefits, and social welfare are defined, respectively, as follows:
Lemma 3 indicates that in Model DS, the government provides cost subsidies to recyclers. When the government’s and recyclers’ transmission coefficients and cost coefficients are equal, due to , the recyclers’ input level in terms of reward points exceeds the government’s recycling effort input. Both parties’ investment levels are related to the recycling price. Under these conditions, both the government’s recycling effort and the recyclers’ reward points increase as the recycling price rises, and the government’s subsidies also increase accordingly. As the recycling price grows, the cost subsidy provided by the government in the form of reward points to recyclers also increases, thereby intensifying their motivation to recycle waste products. Essentially, the subsidy offered by the government provides recyclers with stronger economic incentives, encouraging them to enhance their recycling efforts.
Proposition 3.
Under the government-driven framework, the decision variables associated with each key parameter exhibit relative stability, as illustrated in Table 4.
Table 4.
Comparative static analysis of key parameters of the strategy under Model DS.
From Proposition 3, it is evident that when the government provides subsidies to recyclers, the subsidy rate is determined solely by the residual value of the recycled product and its recycling price. Specifically, the subsidy rate increases with higher recycling prices and decreases with lower residual values. This phenomenon arises because, within the DS Model, recyclers experience a reduction in point reward levels as recycling prices increase, prompting the government to escalate its subsidy efforts in order to stimulate recycling activities. In this context, both the residual value and the recycling price exert a significant influence on the decision-making processes of the government and recyclers. The introduction of government subsidies enhances the recyclers’ income and economic returns, motivating them to invest further in raising their point reward levels. Moreover, due to the government’s unique role, offering subsidies creates a demonstration effect that establishes industry benchmarks and attracts additional enterprises and investors into the recycling sector. Collectively, these factors contribute to economies of scale and promote the sustainable development of the entire industry.
4.4. Comparative Analysis
By comparing the equilibrium solutions of the government and recyclers in the three aforementioned models (the profit analysis can be found in Section 5), the following conclusions can be drawn:
Proposition 4.
- 1.
- Comparison of the point reward levels for recyclers: ; comparison of Government Recycling Effort levels: .
- 2.
- Comparison of consumers’ steady-state perception of recycling value: ; comparison of consumer surplus: ; comparison of environmental benefits: .
Proof of Proposition 4.
By taking the differences between the variables in the three models, we obtain the following:
The following can be obtained:
The following can be obtained:
The following can be obtained:
The following can be obtained:
The following can be obtained: □
Corollary 1.
In all three models analyzed, both the governmental recycling effort and the recyclers’ point reward levels attained their highest values under the centralized structure model. In this framework, decision-makers do not focus solely on individual interests; rather, they prioritize overall system benefits. This shift in perspective fosters enhanced mutual cooperation and coordination, prompting both parties to contribute greater effort to maximize system efficiency. As a result, both consumer surplus and environmental benefits are optimized.
Corollary 2.
In the three models, the government must undertake a greater investment in recycling efforts under Model C to ensure the efficient recovery and management of resources. In contrast, under Models DN and DS, the government’s investment in recycling efforts is relatively lower, as in these models, the government, considering the maximization of its own benefits and the issue of sharing responsibilities, reduces its own level of effort. Nevertheless, the government still needs to maintain a certain degree of recycling effort to ensure the proper functioning of the entire system. However, the government can incentivize recyclers to increase their recycling efforts through the provision of subsidies. By offering recyclers additional financial incentives, the government encourages them to engage more actively in recycling activities, thereby enhancing the overall recycling volume and environmental benefits.
Corollary 3.
In Models DS and DN, the government’s recycling efforts remain unchanged; however, the introduction of subsidies incentivizes recyclers to increase their investment in points rewards. A comparison of the three recycling models reveals that recyclers invest the most in points rewards under the collaborative drive model, followed by the Model in which the government provides corresponding subsidies. This is because, in the collaborative drive model, recyclers consider the benefits of the entire supply chain rather than merely their own interests when determining their investment in points rewards. In contrast, in the government-driven Model—even with the provision of appropriate subsidy policies—the lack of coordination may result in a double marginal effect, whereby recyclers retain a certain profit margin when investing in points rewards to ensure the maximization of their own interests.
5. Numerical Analysis
This section employs numerical analysis to validate the previous conclusions and further refers to references [58,73]. The assignment of the relevant parameters in this section is as follows:
5.1. Analysis of the Trajectory of Consumers’ Perceived Recycling Value
By keeping the other parameters constant and assigning the initial recycling value perception values as and , the time evolution trajectories of consumer recycling value perception under the three models are obtained:
Figure 5 shows that when the initial values differ, the evolution trajectories of perceived recycling value also differ. When the initial value is high, the trajectory decays over time; when the initial value is low, the trajectory increases over time. However, both converge at the same point. This indicates that the initial value only affects the rate at which perceived recycling value increases or decreases under different decision modes, and it does not influence the magnitude of the steady-state perceived recycling value, which is instead dependent on the decision mode. This conclusion is similar to that reported in YAO et al. [73]. Moreover, the figure reveals that under the same parameter settings, the steady-state perceived recycling value is the lowest in the market-driven (DN) model, higher in the government-driven (DS) model, and highest in the collaboration-driven (C) model. Yang et al. [68] also hold a similar view. This occurs because in the market-driven model, without government subsidies, recyclers tend to focus on their own interests by reducing their investment in point-based rewards [74], which in turn leads to a decline in perceived recycling value. In contrast, the collaboration-driven model achieves the highest steady-state value, since both the government and recyclers invest the most, greatly enhancing consumers’ perceived recycling value.
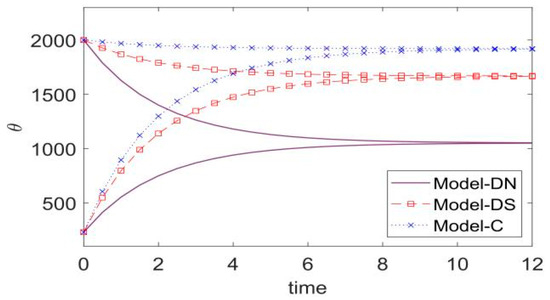
Figure 5.
The perceived time trajectory of consumer recovery value under the three models.
5.2. Impact of Recycling Residual Value (B) and Price (p) on Government Subsidy Rate
It can be observed in Figure 6 that while the residual value B remains relatively stable, an increase in the recycling price p leads to a corresponding rise in the government subsidy rate w. In the field of electronic waste recycling, informal channels often secure recycling volumes by increasing purchase prices [75]. Consequently, when competition and other factors lead to an increase in the market price of used electronic products, recyclers incur higher costs to acquire the same quantity of goods. Chi X et al. [76] conducted a comprehensive investigation of both formal and informal electronic waste recycling facilities, as well as national pilot projects in China. Their study revealed that the high costs associated with electronic waste collection and the implementation of environmentally sound treatment processes hinder the formal recycling sector from competing effectively with its informal counterpart in terms of recycling prices. To maintain the enthusiasm of recyclers and ensure the smoothness of the formal channels for recycling waste materials, the government generally provides higher subsidies [61], thereby increasing the government subsidy rate w. Wang et al. [77] confirmed that economic incentives play a significant role in promoting recycling.
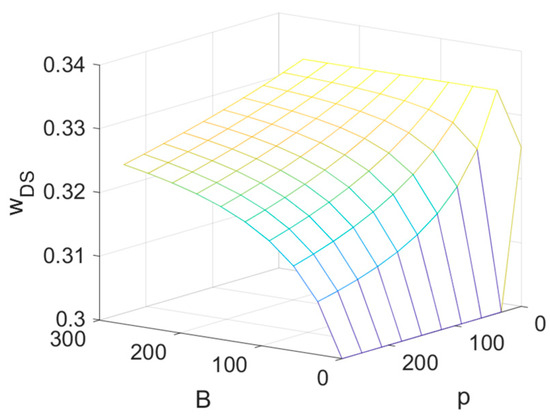
Figure 6.
Analysis of the impact of p and B on the subsidy rate.
5.3. Impact of the Recycling Perception Coefficient () and Recycling Price (p) on Recycling Effort Levels
As illustrated in Figure 7a, with the increase in the recycling value perception coefficient, the level of point-based rewards for recyclers also rises. However, the distinction lies in the fact that in the absence of government subsidies, the level of point-based rewards decreases as the price increases; whereas, with government subsidies, the level of point-based rewards increases along with the price. The reason is that when the government does not provide subsidies, an increase in the recycling price inevitably leads to a reduction in the recyclers’ revenue. Under the DN and DS models, recyclers aim to maximize their own profits, and therefore, they must reduce their investment in point-based rewards to ensure their own returns. This clearly demonstrates that government subsidies directly affect the decision-making of recyclers. When the government provides subsidies to recyclers, these financial supports reduce the input costs associated with recycling operations. As rational market actors, enterprises compare the benefits and costs of recycling management when making decisions [74,78]. Meanwhile, enterprises’ involvement in recycling initiatives serves to enhance their public image. Li et al. [79] demonstrate that a strong corporate reputation is positively correlated with tangible benefits. In the context of cost reduction and revenue enhancement, rational enterprises are thus incentivized to engage in recycling activities.
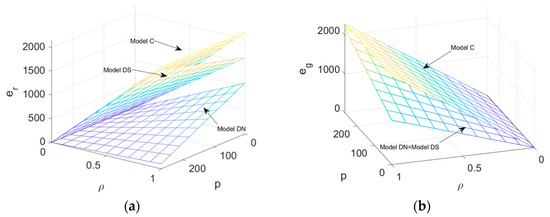
Figure 7.
(a,b) The influence of p and on recycling efforts.
As shown in (b), whether the government provides subsidies to recyclers or not does not impact their own recycling efforts. As recycling prices rise, government efforts increase because higher prices boost recycling volume D(t), enhancing environmental benefits and utility. Higher recycling prices boost consumer trading, prompting the government to enhance recycling efforts—through expanding outlets, tighter monitoring, and public education—to maximize profits and prevent chaos. Thus, rising recycling prices drive increased government action. Moreover, under the collaborative driving model, the government and recyclers aim to maximize overall interests. When making decisions, they take into account the overall benefits, such as joint profits and environmental benefits, as well as the costs incurred by both parties. Therefore, they will invest more effort [80]. Under decentralized decision-making frameworks, government entities typically focus exclusively on maximizing their own utility, thereby disregarding the interests of recyclers. Meanwhile, these rational, self-interested recyclers tend to exhibit free-rider behavior. Consequently, the input boundary is defined more conservatively [81].
5.4. Impact of the Recycling Perception Coefficient () and Recycling Price (p) on Equilibrium Solution
As illustrated in Figure 8a–d, recycling prices and consumer value perceptions substantially influence recycling volume, environmental benefits, consumer surplus, and social welfare. The variable p, functioning as a rigid economic incentive, directly increases the opportunity cost compensation required for consumers engaged in recycling, thereby stimulating the supply of recyclable waste. A higher sensitivity coefficient for consumer recycling value perception heightens consumers’ perceived recycling value, thereby reinforcing their recognition of recycling’s environmental and circular benefits and reducing psychological barriers to participation [77]. These factors work synergistically to elevate recycling willingness and expand the overall recycling scale. Moreover, since adjustments in recycling prices yield rapid and highly deterministic effects, all variables exhibit increased sensitivity to changes in p. Chang et al. [82] also empirically confirmed that recycling prices boost recycling. Finally, a comparison across the three models reveals that government subsidies can markedly enhance the values of all measured variables. Such subsidy policies enable recyclers to achieve profitability without reducing recycling prices, thereby preserving a high consumer surplus and mitigating potential welfare crowding-out issues observed in the DN model.
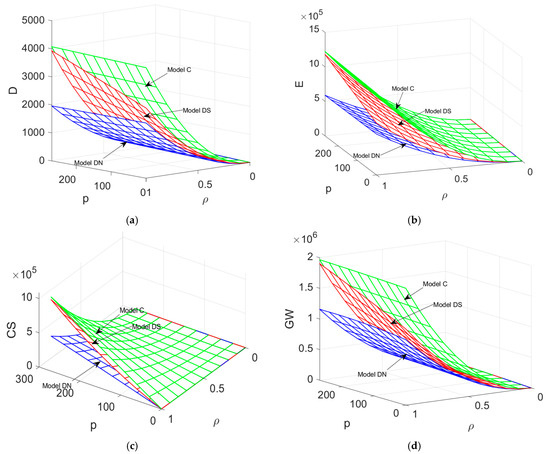
Figure 8.
(a–d) Influence of p and ρ on steady-state equilibrium variables.
5.5. Analysis of Changes in Consumer Value Perception and Profit over Time
Figure 9 illustrates that the trajectories of consumer recycling value perception, government profits, recycler profits, and total supply chain profits all increase over time and eventually stabilize. Initially, under the DN model, government and recycler profits exceed those of the DS model. However, once steady state is achieved, profits for the government and recyclers in the DS model surpass those in the DN model. This phenomenon arises because a low initial consumer recycling value perception results in returns that are insufficient to cover the associated costs. Over time, as consumer recycling value perception improves, the volume of recycling increases, and returns eventually exceed costs, yielding an overall upward trend in profit. Furthermore, upon reaching stability, both the government and recycling sectors exhibit higher profits under the subsidy model compared to the non-subsidy model.
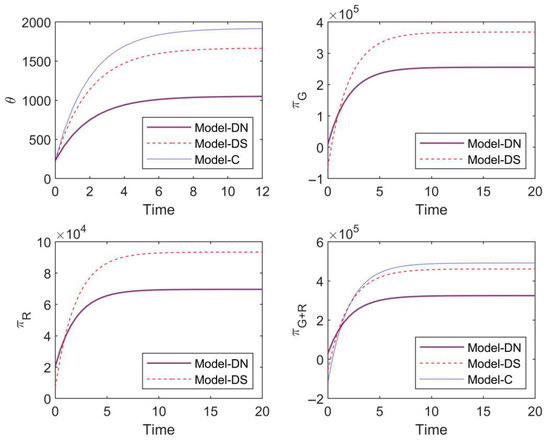
Figure 9.
Trajectories of θ and profit over time.
In addition, the total profits of the supply chain are compared across three distinct decision models. The collaboration-driven model yields the highest total profit, followed by the government-driven model with subsidies, while the market-driven case without subsidies results in the lowest total profit. This is consistent with the conclusion of Chen et al. [58] that “joint strategies are better in dynamic green perception”, which confirms the universality of “the positive amplification effect of government-enterprise collaboration on consumers’ dynamic cognition”. Moreover, the profit curve in the collaborative-driven model exhibits the steepest slope, indicating that the congruent goal of maximizing overall benefits among supply chain members significantly enhances performance. This alignment ensures greater transparency and completeness of supply chain information, thereby facilitating faster decision-making. These findings underscore the advantage of government–enterprise collaboration in enhancing the overall profitability of the supply chain.
6. Discussion
6.1. Impact of Consumer Heterogeneity on Equilibrium Variables
Considering the heterogeneity in consumers’ sensitivity to the perceived value of recycling, we categorize them into two groups: highly sensitive and low sensitive. Let m represent the proportion of highly sensitive consumers, with the remaining (1–m) constituting the low-sensitive group. Following the value acquisition methods outlined in [68,83], we assume the sensitivity coefficients to be = 0.7 for the highly sensitive group and = 0.2 for the low-sensitive group. The subsequent analysis examines the impact of the proportion of highly sensitive consumers on the profits of recyclers and governmental agencies.
Figure 10 shows that recyclers and government profits both increase as the proportion of highly sensitive people rises. Market-driven recycling relies on consumers’ internal value perception, so shifts in highly sensitive groups significantly affect recycling volume and profit. In contrast, government-driven recycling uses strong external incentives, reducing the impact of internal sensitivity—supporting the notion that external incentives can partially substitute for internal factors [84]. The government’s primary aim is to maximize social welfare. Subsidies boost recyclers’ investments, creating a synergistic effect that increases recycling more steeply with rising m than the market-driven model alone, especially at higher m levels.
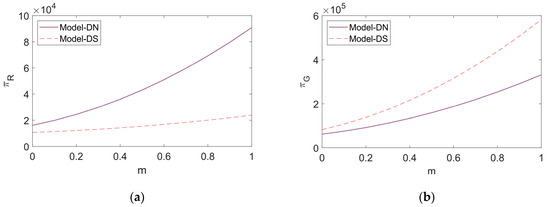
Figure 10.
(a,b) Impact of consumer heterogeneity on recycling profits for recyclers and governments.
6.2. Profit Analysis Under Different Modes
Figure 5 illustrates the total profits realized under three distinct recycling models. In the collaborative-driven model, both the government and recyclers engage in recycling activities with the shared objective of maximizing overall benefits, thereby achieving the highest total profit. In the government-driven model, the government subsidizes a portion of the recyclers’ investment in incentive points to motivate active participation, which effectively increases recycling volumes and significantly enhances profits.
Notably, compared to the market-driven recycling model, the total profit generated by the government-driven model closely approximates that of the collaborative model, thereby illustrating a Pareto improvement in overall profitability. However, challenges such as information asymmetry and conflicting interests often hinder effective collaboration between government entities and enterprises. In the market-driven recycling model, rational market participants primarily focus on maximizing individual profits, which can lead to free-riding behavior and impede the maximization of collective benefits [81].
The solution does not lie in dismissing collaboration altogether but rather in establishing a pragmatic collaborative governance framework that more closely approximates ideal conditions. Such a framework should be robust and adaptable, achievable through avenues such as technological and mechanism innovations [72,85].
6.3. Analysis of China’s CGSP Policy Implementation
By 2025, 27 provinces across the nation are expected to prioritize CGSP benefits, issuing policy documents that address government, enterprise, and public levels. The government encourages enterprise participation through fiscal appropriations and cost-sharing, while local initiatives quantify recycling and emission reduction behaviors and deploy mechanisms such as “carbon accounts” to facilitate reward redemption and stimulate public engagement.
Nonetheless, significant differences persist between central and local policies. Central policies emphasize macro-level strategies; however, implementation challenges remain due to regional disparities—particularly between the eastern and western regions [86]. In contrast, local policies focus on micro-level execution. For instance, Shanghai and Shanxi have piloted personal carbon accounts, yet these localized practices often lack cross-regional mutual recognition mechanisms. Furthermore, policy acceptance exhibits heterogeneous characteristics due to regional and subject-specific variations [87].
Consequently, future carbon-inclusive benefit policies should adopt a collaborative framework of “central standardization plus local innovation” and leverage digital tools to lower participation thresholds, thereby addressing heterogeneous acceptance challenges.
7. Conclusions
Within the context of Carbon Generalized System of Preferences policies, this paper examines consumers’ perceived value of recycling alongside government and recycler subsidy strategies to establish a dynamic reverse supply chain system that integrates governmental bodies, recycling enterprises, and consumers. By employing differential game theory, the study derives the optimal decisions for supply chain members, quantifies recycling value perception, and determines the optimal value function. Moreover, it rigorously analyzes how the dynamics of consumers’ recycling perception influence the decisions and profits of supply chain entities under various decision-making frameworks. The principal conclusions are as follows:
This paper analyzes the evolution of consumers’ perceived recycling value under three decision models and its impact on the recycling decisions of the government/recyclers. By comparing the evolution of consumers’ perceived recycling value and its effect on system efficiency across three different decision models—namely, the collaborative-driven model, the government-driven model, and the market-driven model—it is found that under the collaborative-driven model, both consumers’ perceived recycling value and system efficiency are maximized. In this model, the objectives of the supply chain participants are aligned, collectively enhancing the overall profitability of the supply chain.
Secondly, we examine the impact of government subsidies on the strategies employed by recoverers. Recoverers are mandated to collect idle electronic products from consumers, who perceive these products to have recycling value, and to provide them with “green account” point rewards. The level of point rewards investment by recoverers is influenced by the availability of government subsidies. When such subsidies are provided, recoverers are incentivized to increase their investment in point rewards, leading to higher profits for both recoverers and the government compared to scenarios without subsidies. This occurs because government support motivates recoverers to enhance their point reward investments, thereby increasing recycling volumes and enhancing overall environmental benefits.
Third, government subsidies play a crucial role in enhancing system efficiency. The collaboration between governmental agencies and enterprises in recycling operations is therefore essential. Appropriately designed governmental incentive policies can fully mobilize the enthusiasm of recyclers, thereby optimizing the benefits of recycling. Furthermore, by formulating targeted policies and offering various forms of subsidies, governments can encourage a broader range of enterprises to actively participate in recycling initiatives, ultimately promoting resource sustainability, environmental protection, and the accelerated development of the recycling industry.
This study’s differential game model of government–enterprise collaborative recycling, incorporating consumers’ dynamic recycling value perception, offers a new analytical framework for understanding multi-agent interactions under CGSP policies. Its theoretical insights and practical recommendations can extend to other reverse supply chains featuring government–enterprise collaboration (or potential for it), significant consumer value perception dimensions, or the need to stimulate multi-dimensional value perception for target recyclables (e.g., specific plastic packaging). However, applicability diminishes in reverse supply chains relying on mandatory deposit systems or pure commercial drivers, where consumer value perception dynamics are insignificant.
In summary, the results of this study not only expand the literature on carbon-inclusive supply chain policies but also provide robust theoretical support for enhancing the management of waste electronic and electrical equipment. Our study has some limitations. For example, this paper assumes government–recycler information symmetry, yet in reality, asymmetry is common, and perception evolution involves more complex psychological and social factors. Moreover, the model includes only one recycler, neglecting market competition dynamics. Consequently, the model fits best where strong information-sharing and dominant formal recyclers exist; extensions are needed for complex scenarios (intense competition, high uncertainty) or sectors with weak consumer perception. Future research may include investigating competitive strategies among multiple agents under conditions of information asymmetry, as well as examining the influence of coordination contracts on recycling practices. Moreover, exploring the temporal lag between policy implementation and subsequent shifts in consumer perception represents a promising avenue for further research.
Author Contributions
Software, X.M.; Investigation, X.M.; Writing—original draft, X.M.; Supervision, K.Z.; Methodology, T.L. All authors have read and agreed to the published version of the manuscript.
Funding
Key Research Projects of the Shanxi Provincial Federation of Social Sciences Associations: “Research on high-quality development countermeasures of green logistics industry in Shanxi Province” (SSKLZDKT2022086) and Postgraduate Science and Technology Project Establishment of North University of China: “Research on Government–-Enterprise Collaborative Recycling Strategies: An Examination of Consumer Value Perception in the Context of Carbon Generalized System of Preferences” (20242043).
Institutional Review Board Statement
Not applicable.
Informed Consent Statement
Not applicable.
Data Availability Statement
The original contributions presented in this study are included in the article. Further inquiries can be directed to the corresponding author(s).
Conflicts of Interest
The authors declare no conflicts of interest.
References
- Fawole, A.A.; Orikpete, O.F.; Ehiobu, N.N.; Ewim, D.R.E. Climate change implications of electronic waste: Strategies for sustainable management. Bull. Natl. Res. Centre 2023, 47, 147. [Google Scholar] [CrossRef]
- Zhang, Y.; Xu, X.; Chen, A.; Davuljigari, C.B.; Zheng, X.; Kim, S.S.; Dietrich, K.N.; Ho, S.-M.; Reponen, T.; Huo, X. Maternal urinary cadmium levels during pregnancy associated with risk of sex-dependent birth outcomes from an e-waste pollution site in China. Reprod. Toxicol. 2018, 75, 49–55. [Google Scholar] [CrossRef]
- Huo, X.; Wu, Y.; Xu, L.; Zeng, X.; Qin, Q.; Xu, X. Maternal urinary metabolites of pahs and its association with adverse birth outcomes in an intensive e-waste recycling area. Environ. Pollution 2019, 245, 453–461. [Google Scholar] [CrossRef]
- Soetrisno, F.N.; Delgado-Saborit, J.M. Chronic exposure to heavy metals from informal e-waste recycling plants and children’s attention, executive function and academic performance. Sci. Total Environ. 2020, 717, 137099.1–137099.12. [Google Scholar] [CrossRef] [PubMed]
- Alabi, O.A.; Bakare, A.A.; Xu, X.; Li, B.; Zhang, Y.; Huo, X. Comparative evaluation of environmental contamination and dna damage induced by electronic-waste in Nigeria and China. Sci. Total Environ. 2012, 423, 62–72. [Google Scholar] [CrossRef] [PubMed]
- Davis, J.-M.; Garb, Y. A strong spatial association between e-waste burn sites and childhood lymphoma in the west bank, palestine. Int. J. Cancer 2019, 144, 470–475. [Google Scholar] [CrossRef]
- Yadav, D.; Singh, R.; Kumar, A.; Sarkar, B. Reduction of Pollution through Sustainable and Flexible Production by Controlling By-Products. J. Environ. Inform. 2022, 40, 106. [Google Scholar] [CrossRef]
- European Parliament and Council. Directive on Waste Electrical and Electronic Equipment (WEEE). 2003. Available online: https://wenku.baidu.com/view/b57e75c458f5f61fb736669d.html (accessed on 14 July 2025).
- State Council. “Action Plan for Promoting Large-Scale Equipment Upgrades and the Exchange of Old for New Consumer Goods”. 2024. Available online: https://www.gov.cn/zhengce/content/202403/content_6939232.htm (accessed on 14 July 2025).
- Nithya, R.; Sivasankari, C.; Thirunavukkarasu, A. Electronic waste generation, regulation and metal recovery: A review. Environ. Chem. Lett. 2021, 19, 1347–1368. [Google Scholar] [CrossRef]
- Li, J.; Li, H.; Jiao, J.; Xu, Y. Which policy can effectively alleviate the impact of raw material price fluctuations on battery recycling? Environ. Impact Assess. Rev. 2025, 115, 107996. [Google Scholar] [CrossRef]
- Jiao, J.; Shuai, Y.; Li, J. Incentive effects of subsidy policies on Chinese municipal solid waste recycling considering price competition: Subsidies for residents or recyclers? Environ. Dev. Sustain. 2024, 26, 27529–27551. [Google Scholar] [CrossRef]
- Wang, F.; Yu, L.; Wu, A. Forecasting the electronic waste quantity with a decomposition-ensemble approach. Waste Manag. 2021, 120, 828–838. [Google Scholar] [CrossRef]
- Castro, F.D.; Júnior, A.B.B.; Bassin, J.P.; Tenório, J.; Cutaia, L.; Vaccari, M.; Espinosa, D. E-waste policies and implementation: A global perspective. In Waste Management and Resource Recycling in The Developing World; Elsevier: Amsterdam, The Netherlands, 2023; pp. 271–307. [Google Scholar] [CrossRef]
- Mungkung, R.; Gheewala, S.H.; Kanyarushoki, C.; Hospido, A.; van der Werf, H.; Poovarodom, N.; Feijoo, G. Product carbon footprinting in Thailand: A step towards sustainable consumption and production? Environ. Dev. 2012, 3, 100–108. [Google Scholar] [CrossRef]
- Fawcett, T. Personal carbon trading: A policy ahead of its time? Energy Policy 2010, 38, 6868–6876. [Google Scholar] [CrossRef]
- Fawcett, T.; Parag, Y. An introduction to personal carbon trading. Clim. Policy 2010, 10, 329–338. [Google Scholar] [CrossRef]
- Tan, Y.; Ge, J.; Gao, W.; Ying, X.; Wang, S.; Zhao, X. Residents’ willingness to engage in carbon generalized system of preferences-A personality insight study based on the extended theory of planned behavior. J. Environ. Manag. 2024, 361, 121224. [Google Scholar] [CrossRef]
- Mi, L.; Xu, T.; Sun, Y.; Zhao, J.; Lv, T.; Gan, X.; Shang, K.; Qiao, L. Playing ant forest to promote online green behavior: A new perspective on uses and gratifications-sciencedirect. J. Environ. Manag. 2021, 278, 111544. [Google Scholar] [CrossRef] [PubMed]
- Mingli, X.U.; Caixia, C.A.; Hhuiyun, J.I.N. Development and Empirical Test of Customer Perceived Value Scale Under the “Internet +” Recovery Mode. Sci. Technol. Manag. Res. 2021, 41, 169–175. [Google Scholar]
- Ta, A.H.; Aarikka-Stenroos, L.; Litovuo, L. Customer experience in circular economy: Experiential dimensions among consumers of reused and recycled clothes. Sustainability 2022, 14, 509. [Google Scholar] [CrossRef]
- Jain, M.; Kumar, D.; Chaudhary, J.; Kumar, S.; Sharma, S.; Verma, A.S. Review on E-waste management and its impact on the environment and society. Waste Manag. Bull. 2023, 1, 34–44. [Google Scholar] [CrossRef]
- Nadarajan, P.; Vafaei-Zadeh, A.; Hanifah, H.; Thurasamay, R. Sustaining the environment through e-waste recycling: An extended valence theory perspective. Aslib. J. Inf. Manag. 2024, 76, 1059–1087. [Google Scholar] [CrossRef]
- Shittu, O.S.; Williams, I.D.; Shaw, P.J. Global E-waste management: Can WEEE make a difference? A review of e-waste trends, legislation, contemporary issues and future challenges. Waste Manag. 2021, 120, 549–563. [Google Scholar] [CrossRef] [PubMed]
- Liuqingqing, Y.A.G.; Chengcheng, S.O.G. Research on Government-led Carbon Inclusion Model under Policy Design Perspective. Chin. Public Adm. 2024, 1, 18–27. [Google Scholar] [CrossRef]
- Zhang, Y.H.; Feng, T.T. How does the design of personal carbon trading system affect willingness to participate under carbon neutrality goal?-evidence from a choice experiment. Environ. Sci. Pollut. Res. Int. 2022, 29, 81970–81992. [Google Scholar] [CrossRef]
- Tan, X.; Wang, X.; Zaidi, S.H.A. What drives public vvillingness to participate in the voluntary personal carbon-trading scheme? A case study of guangzhou pilot, China. Ecol. Econ. 2019, 165, 106389. [Google Scholar] [CrossRef]
- Lin, B.; Yang, M. Choosing the right policy: Factors influencing the preferences of consumption-side personal carbon reduction policies. J. Environ. Manag. 2023, 326 Pt B, 116706. [Google Scholar] [CrossRef]
- Ding, R.; Wang, X.; Liu, Y.; Zhao, J.; Gu, C. Evolutionary games with environmental feedbacks under an external incentive mechanism. SSRN Electron. J. 2023, 169, 113318. [Google Scholar] [CrossRef]
- Daoyan, G.U.; Xuejian, W.A.G.; Shaohui, Z.O. Bidirectional Preferential Tax Strategies of Chinese Government in the Carbon Inclusion System. Manag. Mod. 2024, 44, 180–190. [Google Scholar] [CrossRef]
- Zhang, L.L.; Ma, S.; Shafiee, S.; Cai, X. Optimizing Joint Sustainable Supply Chain Decision-making under Emission Tax: A Stackelberg Game Model. In Proceedings of the 2022 IEEE International Conference on Industrial Engineering and Engineering Management (IEEM), Kuala Lumpur, Malaysia, 7 December 2022; IEEE: Piscataway, NJ, USA, 2022; pp. 0853–0858. [Google Scholar]
- Zhang, K.; Xu, Y. Blockchain-driven dual-channel green supply chain game model considering government subsidies. Int. J. Emerg. Trends Soc. Sci. 2024, 16, 13–21. [Google Scholar] [CrossRef]
- Hong, X.; Xu, L.; Du, P.; Wang, W. Joint advertising, pricing and collection decisions in a closed-loop supply chain. Int. J. Prod. Economics. 2015, 167, 12–22. [Google Scholar] [CrossRef]
- Chen, X.; Li, J.; Tang, D.; Zhao, Z.; Boamah, V. Stackelberg game analysis of government subsidy policy in green product market. Environment. Dev. Sustain. 2024, 26, 13273–13302. [Google Scholar] [CrossRef]
- Sun, H.; Wang, K.; Du, X. Cooperative emission reduction behaviour of supply chain enterprises under cap-and-trade and government subsidies. Environment. Dev. Sustain. 2025, 27, 2549–2579. [Google Scholar] [CrossRef]
- Ji, J.; Zhang, Z.; Yang, L. Carbon emission reduction decisions in the retail-/dual-channel supply chain with consumers’ preference. J. Clean. Prod. 2017, 141, 852–867. [Google Scholar] [CrossRef]
- Chen, R.; Xu, S.; Du, Y.; Wu, Y.; Zhao, S.; Tu, R.; Wu, C. Carbon Generalized System of Preferences (CGSP) programs: Key design dimensions and attitudes of potential participants. Case Stud. Transp. Policy 2024, 16, 101205. [Google Scholar] [CrossRef]
- Chen, F.; Chen, Q.; Hou, J.; Li, S. Effects of China’s carbon generalized system of preferences on low-carbon action: A synthetic control analysis based on text mining. Energy Econ. 2023, 124, 106867. [Google Scholar] [CrossRef]
- Zhang, H.; Yu, H.; Li, C. Incentive contract design and optimization of government subsidies policy in the closed-loop supply chain. Chin. J. Manag. Sci. 2016, 24, 71–78. [Google Scholar] [CrossRef]
- Zeithaml, V.A. Consumer perceptions of price, quality, and value: A means-end model and synthesis of evidence. J. Mark. 1988, 52, 2–22. [Google Scholar] [CrossRef]
- Hoseason, J. Pricing: Making profitable decisions. J. Revenue Pricing Manag. 2003, 2, 175–177. [Google Scholar] [CrossRef]
- He, S.U. Research on the mechanism of “network interactive experience chain” based on the perspective of consumer perception. J. Commer. Econ. 2016, 16, 64–66. [Google Scholar]
- Martinho, G.; Pires, A.; Portela, G.; Fonseca, M. Factors affecting consumers’ choices concerning sustainable packaging during product purchase and recycling. Resour. Conserv. Recycl. 2015, 103, 58–68. [Google Scholar] [CrossRef]
- Koenig-Lewis, N.; Palmer, A.; Dermody, J.; Urbye, A. Consumers’ evaluations of ecological packaging—Rational and emotional approaches. J. Environ. Psychol. 2014, 37, 94–105. [Google Scholar] [CrossRef]
- Aboelmaged, M. E-waste recycling behaviour: An integration of recycling habits into the theory of planned behaviour. J. Clean. Prod. 2021, 278, 124182. [Google Scholar] [CrossRef]
- Lizin, S.; Van Dael, M.; Van Passel, S. Battery pack recycling: Behaviour change interventions derived from an integrative theory of planned behaviour study. Resour. Conserv. Recycl. 2017, 122, 66–82. [Google Scholar] [CrossRef]
- Zhang, S.; Xia, Z.; Zhang, C.; Tian, X.; Xie, J. Green illusions in self-reporting? reassessing the intention-behavior gap in waste recycling behaviors. Waste Manag. 2023, 166, 171–180. [Google Scholar] [CrossRef]
- Abella, A.; Llorach-Massana, P.; Pereda-Baños, A.; Marco-Almagro, L.; Barreda-Ángeles, M.; Clèries, L. Perception of recycled plastics for improved consumer acceptance through self-reported and physiological measures. Sensors 2022, 22, 9226. [Google Scholar] [CrossRef]
- Liang, X.; Hu, X. Green supply chain pricing decision considering blockchain and product recycling. Comput. Integr. Manuf. Syst. 2023, 29, 3851. [Google Scholar] [CrossRef]
- Huang, W.; Nguyen, J.; Tseng, C.L.; Chen, W.; Kirshner, S.N. Pride or guilt? Impacts of consumers’ socially influenced recycling behaviors on closed-loop supply chains. Manuf. Serv. Oper. Manag. 2024, 26, 2067–2084. [Google Scholar] [CrossRef]
- Liu, X.; Du, W.; Olasehinde, T.; Fan, Y. Balancing competition and sustainability: Strategic supply chain configurations in response to consumer low-carbon preferences. Sustain. Futures 2025, 9, 100411. [Google Scholar] [CrossRef]
- Huang, X.; Zhang, D. Service product design and consumer refund policies. Mark. Sci. 2020, 39, 366–381. [Google Scholar] [CrossRef]
- Cheng, Y.; Wang, J. Decision-Making in Remanufacturing Supply Chains: Game Theory Analysis of Recycling Models and Consumer Value Perception. Sustainability 2024, 16, 10476. [Google Scholar] [CrossRef]
- Jia, Y.; Cheng, S.; Shi, R. Decision-making behavior of rural residents’ domestic waste classification in Northwestern of China—Analysis based on environmental responsibility and pollution perception. J. Clean. Prod. 2021, 326, 129374. [Google Scholar] [CrossRef]
- He, H.L.; Li, M.K. A tripartite game analysis on reverse logistics of express packaging under restricted control policies. Ind. Eng. Manag. 2021, 26, 157–164. [Google Scholar] [CrossRef]
- Yajuan, J.I.; Xinqi, Z.H. Influence of environmental cognition and perceived benefits on the deviation between consumers’ willingness and behavior to participate in the classified recovery of express packaging. Resour. Sci. 2022, 44, 2060–2073. [Google Scholar] [CrossRef]
- Baker, J.; Grewal, D.; Parasuraman, A. The influence of store environment on quality inferences and store image. J. Acad. Mark. Sci. 1994, 22, 328–339. [Google Scholar] [CrossRef]
- Chen, S.; Su, J.; Wu, Y.; Zhou, F. Optimal production and subsidy rate considering dynamic consumer green perception under different government subsidy orientations. Comput. Ind. Eng. 2022, 168, 108073. [Google Scholar] [CrossRef]
- Jun, Y.A.G.; Elliott, R.O.E.T.J.R.; Jiadong, T.O.G. Environmental Regulation and Firm Exports: Evidence from the WEEE and RoHS Directives in the EU. Econ. Sci. 2023, 89, 104–125. [Google Scholar]
- Li, P.; Wu, D. A multi-echelon network design in a dual-channel reverse supply chain considering consumer preference. Int. J. Environ. Res. Public Health 2021, 18, 4760. [Google Scholar] [CrossRef]
- Wei, H.; Wang, X.; Yang, T. A Dual-Channel Cooperative Strategy between Recyclers and E-Tailers for the Offline and Online Recycling of Waste Electronics. Sustainability 2024, 16, 1443. [Google Scholar] [CrossRef]
- Xie, B.; An, K.; Cheng, Y. Dynamic Research on Three-Player Evolutionary Game in Waste Product Recycling Supply Chain System. Systems 2022, 10, 185. [Google Scholar] [CrossRef]
- Hu, Z.; Ma, J.; Zhong, Y.; Zhang, J.; Song, Y. Multi-agent behavior strategies of weee recycling considering public participation under environmental regulation: A perspective of dual governance. J. Clean. Prod. 2024, 484, 144327. [Google Scholar] [CrossRef]
- Yu, S.; Lee, J. The effects of consumers’ perceived values on intention to purchase upcycled products. Sustainability 2019, 11, 1034. [Google Scholar] [CrossRef]
- Zhang, W.; Zhao, S.; Wan, X. Industrial digital transformation strategies based on differential games. Appl. Math. Model. 2021, 98, 90–108. [Google Scholar] [CrossRef]
- Zhou, Y.; Ye, X. Differential game model of joint emission reduction strategies and contract design in a dual-channel supply chain. J. Clean. Prod. 2018, 190, 592–607. [Google Scholar] [CrossRef]
- Li, H.; Tan, D. How to control waste incineration pollution? cost-sharing or penalty mechanism—Based on two differential game models. Decis. Anal. 2024, 21, 91–109. [Google Scholar] [CrossRef]
- Yang, J.; Long, R.; Chen, H.; Sun, Q. A comparative analysis of express packaging waste recycling models based on the differential game theory. Resour. Conserv. Recycl. 2021, 168, 105449. [Google Scholar] [CrossRef]
- Zhao, L.; Song, Y.; Yin, J. Cooperation among strategic emerging industries, traditional industries and the government based on differential game. Xitong Gongcheng Lilun Yu Shijian/Syst. Eng. Theory Pract. 2017, 37, 642–663. [Google Scholar] [CrossRef]
- Zhang, J.; Gou, Q.; Liang, L.; Huang, Z. Supply chain coordination through cooperative advertising with reference price effect. Omega 2013, 41, 345–353. [Google Scholar] [CrossRef]
- Giovanni, P.D. Environmental collaboration in a closed-loop supply chain with a reverse revenue sharing contract. Ann. Oper. Res. 2014, 220, 135–157. [Google Scholar] [CrossRef]
- Bian, J.; Zhao, X. Tax or subsidy? an analysis of environmental policies in supply chains with retail competition. Eur. J. Oper. Res. 2020, 283, 901–914. [Google Scholar] [CrossRef]
- Yao, F.; Xiao, H.; Gao, Y.; Gao, H. Research on Differential Game of Supply Chain Considering Consumer Preferences and Member Behaviors under Carbon Allowance Trading Policy. Chin. J. Manag. Sci. 2024, 32, 231–241. [Google Scholar] [CrossRef]
- Cheng, X.; Long, R.; Chen, H.; Yang, J. Does social interaction have an impact on residents’ sustainable lifestyle decisions? A multi-agent stimulation based on regret and game theory. Appl. Energy 2019, 251, 113366. [Google Scholar] [CrossRef]
- He, W.; Li, G.; Ma, X.; Wang, H.; Huang, J.; Xu, M.; Huang, C. WEEE recovery strategies and the WEEE treatment status in China. J. Hazard. Mater. 2006, 136, 502–512. [Google Scholar] [CrossRef]
- Chi, X.; Streicher-Porte, M.; Wang, M.Y.; Reuter, M.A. Informal electronic waste recycling: A sector review with special focus on China. Waste Manag. 2011, 31, 731–742. [Google Scholar] [CrossRef]
- Wang, C.; Zhang, X.; Sun, Q. The influence of economic incentives on residents’ intention to participate in online recycling: An experimental study from China. Resour. Conserv. Recycl. 2021, 169, 105497. [Google Scholar] [CrossRef]
- Edwards, J.; Burn, S.; Crossin, E.; Othman, M. Life cycle costing of municipal food waste management systems: The effect of environmental externalities and transfer costs using local government case studies. Resour. Conserv. Recycl. 2018, 138, 118–129. [Google Scholar] [CrossRef]
- Li, Y.; Liu, B.; Huan, T.C. Renewal or not? Consumer response to a renewed corporate social responsibility strategy: Evidence from the coffee shop industry. Tour. Manag. 2019, 72, 170–179. [Google Scholar] [CrossRef]
- Wu, Q.; Wang, Y.; Cheng, T.C.; Sun, Y. Optimal decisions and coordination of a supply chain in the hybrid recycling mode with traceability and fairness concern. Int. J. Prod. Res. 2025, 63, 5292–5316. [Google Scholar] [CrossRef]
- Langenbach, B.P.; Berger, S.; Baumgartner, T.; Knoch, D. Cognitive resources moderate the relationship between pro-environmental attitudes and green behavior. Environ. Behav. 2020, 52, 979–995. [Google Scholar] [CrossRef]
- Chang, C.H.E.N.; Maolin, Y.A.N.; Weiwei, G.E.; Wenhua, S.; Xiang, Z.; Chengliang, W.; Yang, Z. Preference and Willingness to Pay for Waste Mobile Phone Recycling among College Students in Beijing: A Discrete Choice Experiment Study. J. Resour. Ecol. 2024, 15, 385–395. [Google Scholar] [CrossRef]
- Xu, S.; Han, C. Study on basin ecological compensation mechanism based on differential game theory. Chin. J. Manag. Sci. 2019, 27, 199–207. [Google Scholar] [CrossRef]
- Xu, L.; Yang, H.; Ling, M. Factors moderating the effect of financial incentives on household recycling: A motivation crowding perspective. Environ. Impact Assess. Rev. 2023, 100, 107078. [Google Scholar] [CrossRef]
- Saberi, S.; Kouhizadeh, M.; Sarkis, J.; Shen, L. Blockchain technology and its relationships to sustainable supply chain management. Int. J. Prod. Res. 2019, 57, 2117–2135. [Google Scholar] [CrossRef]
- Li, L.C. Central-local relations in the people’s Republic of China: Trends, processes and impacts for policy implementation. Public Adm. Dev. 2010, 30, 177–190. [Google Scholar] [CrossRef]
- Pagliacci, F.; Pavone, P.; Russo, M.; Giorgi, A. Regional structural heterogeneity: Evidence and policy implications for RIS3 in macro-regional strategies. Reg. Stud. 2020, 54, 765–775. [Google Scholar] [CrossRef]
Disclaimer/Publisher’s Note: The statements, opinions and data contained in all publications are solely those of the individual author(s) and contributor(s) and not of MDPI and/or the editor(s). MDPI and/or the editor(s) disclaim responsibility for any injury to people or property resulting from any ideas, methods, instructions or products referred to in the content. |
© 2025 by the authors. Licensee MDPI, Basel, Switzerland. This article is an open access article distributed under the terms and conditions of the Creative Commons Attribution (CC BY) license (https://creativecommons.org/licenses/by/4.0/).