Article

Artificial Intelligence-Enhanced Environmental, Social, and Governance Disclosure Quality and Financial Performance Nexus in Saudi Listed Companies Under Vision 2030

by
Mohammed Naif Alshareef
Department of Accounting, College of Business and Economics, Umm Al-Qura University, Makkah P.O. Box 715, Saudi Arabia
Sustainability 2025, 17(16), 7421; https://doi.org/10.3390/su17167421
Submission received: 2 July 2025 / Revised: 8 August 2025 / Accepted: 12 August 2025 / Published: 16 August 2025

Abstract

The integration of artificial intelligence (AI) into environmental, social, and governance (ESG) disclosure represents a critical frontier for corporate transparency in emerging markets. This study investigates the relationship between AI adoption in ESG reporting, disclosure quality, and financial performance among 180 Saudi-listed companies (2021–2024) within Vision 2030’s transformative context. Using the System Generalized Method of Moments (GMM) estimation with panel unit root and cointegration testing to ensure stationarity assumptions and addressing endogeneity through bounding analysis, the study finds that AI adoption intensity significantly enhances ESG disclosure quality (β = 0.289, p < 0.001), with coefficient significance assessed through t-tests using firm-clustered robust standard errors. Enhanced disclosure quality translates into meaningful financial performance improvements: 0.094 percentage points in return on assets (ROA), 0.156 in return on equity (ROE), and 0.0073 units in Tobin’s Q. Mediation analysis reveals that 73% of AI’s total effect operates through improved ESG quality rather than direct operational benefits. The findings demonstrate parametric bounds robust to macroeconomic confounders, suggesting AI-enhanced transparency creates substantial shareholder value through strengthened stakeholder relationships and reduced information asymmetries.

1. Introduction

1.1. AI-Enhanced ESG Reporting: Market Context and Technological Innovation

The integration of artificial intelligence into environmental, social, and governance (ESG) disclosure practices represents a paradigmatic shift in corporate transparency and sustainability reporting [1,2,3]. As global stakeholders increasingly demand comprehensive and accurate sustainability information, organizations face mounting pressure to deliver high-quality ESG disclosures that effectively communicate their environmental impact, social responsibility initiatives, and governance practices [4,5]. The convergence of AI technologies with ESG reporting emerges at a critical juncture where traditional manual reporting processes struggle to meet the complexity, frequency, and precision requirements of modern sustainability disclosure frameworks [6,7].
The global AI in ESG and sustainability market, valued at approximately USD 1.24 billion in 2024, is projected to reach USD 14.87 billion by 2034, reflecting a compound annual growth rate of 28.20% [8]. This exponential growth signals the transformative potential of AI technologies in addressing long-standing challenges in sustainability reporting, including data aggregation complexity, materiality assessment accuracy, and stakeholder engagement transparency [9]. The technological revolution in ESG reporting extends beyond mere automation, encompassing sophisticated applications such as natural language processing for disclosure statement optimization, machine learning algorithms for risk prediction, and advanced analytics for stakeholder sentiment analysis [10,11].
Contemporary ESG reporting faces fundamental challenges related to standardization inconsistencies, data quality concerns, and measurement methodologies that vary significantly across frameworks and jurisdictions [12,13,14]. The absence of unified reporting standards and the subjective nature of ESG data interpretation have created an environment where disclosure quality varies substantially, potentially undermining investor confidence and stakeholder trust [15]. Against this backdrop, AI technologies offer unprecedented opportunities to enhance reporting precision, reduce human error, and provide real-time insights that support strategic decision-making processes [16].
For definitional clarity, this study focuses specifically on conventional artificial intelligence technologies, including machine learning algorithms, natural language processing systems, automated data collection and analysis tools, and predictive analytics platforms. While generative artificial intelligence (GenAI) technologies, particularly large language models, emerged prominently during the latter portion of the study period (2021–2024), the analysis concentrates on the implementation and effectiveness of traditional AI applications that were more widely adopted across Saudi-listed companies during this timeframe. This scope distinction is critical for accurate interpretation of findings and their applicability to different AI technology categories in ESG reporting contexts.
Recent scholarship has extensively documented the emerging applications of AI in ESG disclosure processes, revealing a rapidly evolving landscape of technological solutions designed to enhance reporting efficiency and accuracy [17]. Seneca ESG’s implementation of large language models to create AI-powered ESG assistants demonstrates the practical application of natural language processing in identifying similarities across disclosure frameworks, thereby improving reporting consistency and reducing administrative burden [12]. Similarly, advanced machine learning algorithms now facilitate automated data collection from diverse sources, including satellite imagery for environmental monitoring, social media sentiment analysis for social impact assessment, and corporate governance databases for risk evaluation [18,19,20]. The integration of AI technologies in ESG reporting encompasses multiple dimensions of technological advancement, including predictive analytics for future risk assessment, pattern recognition for anomaly detection in sustainability data, and automated compliance monitoring systems [21].
Research indicates that organizations utilizing AI-driven ESG reporting tools experience significant improvements in data accuracy, with some studies documenting accuracy improvements of up to 40% compared to traditional manual reporting methods [22]. Furthermore, AI applications extend to sophisticated materiality assessment processes, where machine learning algorithms analyze stakeholder feedback, industry benchmarks, and regulatory requirements to identify and prioritize the most significant sustainability issues for specific organizations [23]. The technological infrastructure supporting AI-enhanced ESG reporting continues to evolve, with developments in blockchain technology for data verification, Internet of Things (IoT) sensors for real-time environmental monitoring, and cloud computing platforms for scalable data processing [24,25,26].

1.2. Literature Review and Research Gaps

The measurement of ESG disclosure quality remains a complex and contested area within sustainability research, with multiple methodological approaches competing for academic and practical acceptance [27]. Contemporary research has established sophisticated frameworks for evaluating disclosure quality, incorporating dimensions such as completeness, accuracy, relevance, timeliness, and comparability across organizations and time periods [28]. The Global Reporting Initiative (GRI) Standards, revised in 2021, emphasize materiality-focused reporting that prioritizes significant impacts on economy, environment, and people, representing a shift from stakeholder-centric to impact-centric disclosure approaches [29,30].
Empirical investigations into the relationship between ESG disclosure quality and financial performance have yielded mixed but increasingly positive results, with recent studies documenting significant correlations between high-quality sustainability reporting and improved financial outcomes [15,31,32]. Research utilizing Bloomberg ESG ratings as quasi-natural experiments demonstrates that enhanced ESG disclosure quality correlates with improved market valuations, reduced cost of capital, and enhanced investor confidence [33,34]. The moderating role of institutional investors with ESG preferences further amplifies the positive relationship between disclosure quality and financial performance, suggesting that markets increasingly value transparency and accountability in sustainability reporting [35,36]. The financial implications of ESG disclosure extend beyond immediate market reactions to encompass long-term performance metrics, including operational efficiency improvements, risk mitigation benefits, and access to ESG-focused investment capital [37].
Table 1 presents a comprehensive comparison of recent literature investigating AI applications in ESG reporting, highlighting methodological approaches, key findings, and research contributions across different geographical and sectoral contexts.
This comparative analysis, including the systematic identification of methodological limitations, reveals several critical patterns in the current literature that justify the present study’s methodological approach. First, the majority of empirical studies focus on developed markets, particularly the United States, United Kingdom, and China, with limited attention to emerging markets in the Middle East and North Africa region [48]. Second, while technological capabilities and market potential receive substantial attention, there remains a paucity of rigorous empirical investigations into the effectiveness of AI-enhanced ESG reporting compared to traditional methods [49]. Third, the relationship between AI adoption in ESG processes and subsequent financial performance lacks comprehensive investigation, particularly in the context of developing economies undergoing economic diversification [50].
Despite the promising theoretical foundations and growing market interest in AI-enhanced ESG reporting, several critical research gaps persist that limit understanding of the practical effectiveness and financial implications of these technological innovations [51]. The current literature predominantly consists of industry reports, case studies, and theoretical frameworks, with limited peer-reviewed empirical research examining the causal relationships between AI adoption in ESG processes and measurable improvements in disclosure quality or financial performance [52]. The lack of uniform measures for assessing AI effectiveness in ESG contexts creates methodological challenges that impede comparative research across organizations, industries, and geographical regions [53].
The overwhelming focus of existing research on developed markets, particularly the United States and the European Union, creates significant knowledge gaps regarding AI-enhanced ESG reporting in emerging economies. Current research lacks sophisticated methodological approaches for measuring the quality improvements attributable specifically to AI adoption in ESG reporting processes. Existing studies often conflate general technological adoption with AI-specific implementations, making it difficult to isolate the unique contributions of artificial intelligence technologies to disclosure quality enhancement. The absence of validated instruments for measuring AI adoption intensity in ESG contexts further compounds these methodological challenges [54,55]. The relationship between AI-enhanced ESG reporting and financial performance requires more nuanced investigation that considers mediating variables, temporal dynamics, and sector-specific factors.

1.3. Saudi Arabia as a Natural Experimental Setting

Saudi Arabia’s Vision 2030 represents one of the most ambitious national transformation programs globally, with sustainability and economic diversification serving as foundational pillars for the Kingdom’s future development trajectory. The integration of ESG principles into this national vision reflects a strategic commitment to transitioning from a hydrocarbon-dependent economy to a diversified, knowledge-based economy that prioritizes environmental stewardship, social progress, and governance excellence. The Saudi Green Initiative, launched in 2021 with targets to achieve net-zero emissions by 2060 and plant 10 billion trees, demonstrates the Kingdom’s commitment to environmental sustainability at an unprecedented scale [56].
The establishment of the Saudi Data and Artificial Intelligence Authority (SDAIA) and the National Strategy for Data and AI (NSDAI) positions Saudi Arabia as a regional leader in AI adoption and implementation [57]. The Kingdom’s USD 40 billion AI investment fund, led by the Public Investment Fund in partnership with international venture capital firms, signals substantial commitment to technological innovation that extends to sustainability and ESG applications [58]. This convergence of sustainability priorities and AI investment creates unique opportunities for investigating the effectiveness of AI-enhanced ESG reporting in a rapidly transforming economy.
The Saudi Exchange (Tadawul) issued comprehensive ESG disclosure guidelines in 2021, aligning with UN Sustainable Stock Exchange model guidance and establishing voluntary reporting standards for listed companies [59]. These guidelines emphasize materiality assessment, stakeholder engagement, and comprehensive disclosure across ESG dimensions, creating a structured framework for investigating AI applications in sustainability reporting. The guidelines’ voluntary nature during the initial implementation period provides a natural experimental setting for examining the factors that influence corporate adoption of enhanced disclosure practices. The Saudi Arabian Monetary Authority (SAMA) and Capital Market Authority (CMA) have implemented supporting regulatory frameworks that encourage ESG integration and transparency in financial markets [60].
The urgency of understanding AI’s role in ESG transformation is amplified in markets experiencing concurrent regulatory evolution and economic diversification. Saudi Arabia’s trajectory illustrates this convergence: before 2021, sustainability disclosure among Saudi-listed companies was primarily voluntary and inconsistent, with environmental reporting concentrated in energy sectors and limited standardized social or governance metrics. Prior to the Saudi Exchange’s introduction of voluntary ESG disclosure guidelines in October 2021, sustainability reporting among Saudi-listed companies was largely fragmented, with fewer than 12% of non-financial companies publishing integrated sustainability reports, with fragmented environmental (31%) and social (18%) disclosure practices and significant variation in disclosure quality across sectors [61]. The simultaneous introduction of structured ESG guidelines and substantial AI infrastructure investments creates unique conditions for examining whether technological capabilities can compress the typical maturation timeline for sustainability reporting practices observed in developed markets.
To contextualize the significance of this transformation, Figure 1 presents comparative data illustrating the Saudi ESG landscape before and after the 2021 guidelines implementation. The baseline conditions reveal a fragmented sustainability reporting environment with only 12% of companies publishing integrated sustainability reports and minimal technological integration in ESG processes. Figure 1a demonstrates that environmental reporting was concentrated among energy companies (31% adoption rate), while social disclosure remained limited across all sectors (18% adoption rate), and integrated sustainability reporting reached only 12% of listed companies. Figure 1b shows that AI technology adoption in sustainability processes was virtually absent, with data collection automation implemented by fewer than 8% of companies, report automation by only 3%, and stakeholder analysis tools utilized by merely 5% of listed entities. Figure 1c illustrates that the market capitalization distribution heavily favored companies with lower disclosure standards, with high-disclosure companies representing only 43% of total market value. The post-2024 landscape demonstrates dramatic transformation across all measured dimensions, with Figure 1a showing integrated sustainability reporting reaching 67% adoption and environmental reporting expanding to 78% of companies. Figure 1b reveals comprehensive AI integration in ESG processes exceeding 40% across most categories, with data collection automation reaching 52% adoption. Figure 1d demonstrates the redistribution toward transparency, with high-disclosure companies commanding 67% of market capitalization.
This transformation trajectory illustrates why Saudi Arabia provides an ideal natural experimental setting for investigating AI-enhanced ESG reporting effectiveness. The simultaneity of regulatory structure introduction and technological capability expansion eliminates confounding factors present in markets where these developments occurred sequentially, enabling cleaner identification of causal relationships between AI adoption, disclosure quality improvements, and financial performance outcomes.

1.4. Research Aims and Objectives

This study aims to investigate how artificial intelligence adoption in ESG disclosure processes enhances organizational legitimacy and strengthens stakeholder relationships, thereby creating measurable financial value among Saudi-listed companies within the transformative context of Vision 2030.
Drawing from stakeholder theory and legitimacy theory, the research pursues four theoretically grounded objectives that address identified research gaps while advancing theoretical understanding of technology-mediated transparency effects. First, to examine whether AI-enhanced ESG disclosure quality reduces legitimacy gaps by improving transparency and accountability mechanisms, addressing legitimacy theory’s proposition that organizations seek social acceptance through enhanced disclosure practices. Second, to investigate how AI adoption in ESG reporting strengthens stakeholder relationships and reduces information asymmetries, extending stakeholder theory’s predictions about the value-creating potential of improved stakeholder communication. Third, to assess whether the financial performance benefits of AI-enhanced ESG disclosure operate primarily through stakeholder-mediated pathways rather than direct operational efficiencies, testing the theoretical mechanism through which transparency creates value in stakeholder capitalism frameworks. Fourth, to examine how institutional and industry contexts moderate the legitimacy and stakeholder relationship benefits of AI-enhanced ESG reporting, recognizing that theoretical predictions may vary across different stakeholder environments and regulatory contexts.
These theoretically informed objectives address the identified research gaps by providing the first comprehensive investigation of how technological innovation in sustainability reporting creates value through legitimacy enhancement and stakeholder relationship strengthening in an emerging market context. The research contributes to stakeholder theory by examining the mechanisms through which improved information quality affects stakeholder relationships and subsequent financial outcomes. Furthermore, the study extends legitimacy theory by investigating whether technological sophistication in disclosure processes serves as a legitimacy-building signal that reduces information asymmetries and enhances organizational credibility with key stakeholders, including investors, regulators, and civil society organizations.

1.5. Research Contributions

This study makes several distinct and significant contributions to the literature on corporate sustainability, technological innovation, and financial performance. First, it provides a crucial theoretical contribution by empirically testing and validating the mechanisms through which AI-enhanced transparency creates value. By demonstrating that approximately 73% of AI’s financial impact is mediated through improved ESG disclosure quality, the findings extend stakeholder and legitimacy theories, showing that the primary value-creation pathway is the reduction in information asymmetries and strengthening of stakeholder relationships, rather than direct operational efficiencies.
Second, the research offers a significant methodological contribution. Leveraging the unique context of Saudi Arabia’s Vision 2030—where regulatory and technological changes occurred simultaneously—mitigates confounding variables common in other settings. Furthermore, the use of a System GMM estimator, complemented by Panel VAR and a formal bounding analysis to test for unobserved macroeconomic confounding, provides a rigorous framework for addressing complex endogeneity concerns, setting a higher standard for causal inference in this domain.
Third, this paper makes a critical empirical contribution by providing the first comprehensive analysis of the AI–ESG-performance nexus in the rapidly emerging MENA region. The findings reveal that AI-enhanced ESG disclosure yields a financial performance premium that is 32% to 92% larger than that reported in prior studies on traditional ESG disclosures. This quantification of the incremental value of AI establishes a new, higher empirical benchmark and demonstrates the transformative potential of advanced technology in corporate reporting.
Finally, the study has direct practical and policy implications. It presents a clear business case for corporate managers and boards, justifying investment in AI technologies to improve stakeholder engagement and financial returns. For policymakers and regulators, particularly in emerging economies, the findings provide compelling evidence that national strategies promoting both technological adoption and sustainability disclosure can create a powerful synergistic effect, accelerating economic diversification and enhancing market transparency and valuation.

2. Materials and Methods

2.1. Study Design and Research Framework

This research employs a longitudinal, mixed-methods design to investigate the relationship between AI adoption in ESG disclosure processes and subsequent reporting quality and financial performance outcomes among Saudi-listed companies. The study design incorporates both quantitative panel data analysis and qualitative content assessment to provide a comprehensive understanding of the phenomena under investigation. The research framework is grounded in stakeholder theory and legitimacy theory, examining how technological innovation in disclosure processes affects organizational legitimacy and stakeholder relationships within the context of Saudi Arabia’s Vision 2030 transformation initiative.
The theoretical framework integrates stakeholder theory and legitimacy theory to explain how AI-enhanced ESG disclosure creates value. Stakeholder theory predicts that higher-quality disclosure reduces information asymmetries and builds stakeholder trust, ultimately enhancing financial performance through improved relationships with investors, customers, and regulators. Legitimacy theory suggests that AI adoption in ESG reporting serves as both a substantive improvement in disclosure quality and a symbolic signal of technological sophistication, addressing stakeholder expectations while demonstrating organizational commitment to transparency. This integrated framework guides the hypothesis that AI-enhanced ESG disclosure creates value primarily through stakeholder-mediated pathways rather than direct operational efficiencies.
The temporal scope encompasses the period from 2021 to 2024, strategically selected to capture the initial implementation and evolution of Saudi Exchange ESG disclosure guidelines introduced in October 2021. This timeframe allows for examination of both the baseline period following guideline introduction and the subsequent adoption and refinement of AI-enhanced reporting practices. The study design acknowledges potential confounding factors arising from concurrent regulatory changes, economic fluctuations, and technological developments that may influence the observed relationships.
The research employs a quasi-experimental approach leveraging the natural experiment created by varying rates of AI adoption across listed companies following the introduction of voluntary ESG disclosure guidelines. This design enables identification of causal relationships while accounting for selection bias and unobserved heterogeneity through advanced econometric techniques. The mixed-methods approach combines quantitative analysis of standardized metrics with qualitative assessment of disclosure content and AI implementation characteristics. All statistical analyses were performed using Stata version 17.0 (StataCorp LLC, College Station, TX, USA) and Python version 3.9.

2.2. Sample Selection and Data Sources

2.2.1. Population and Sampling Framework

The target population for this study comprises all non-financial enterprises listed on the Saudi Exchange (Tadawul) as of December 2020. Financial sector companies (e.g., banking and insurance) were excluded at the outset due to their distinct regulatory frameworks and financial reporting standards, which would confound the analysis. This initial universe consisted of 240 non-financial companies.
The sample selection followed a systematic, multi-stage filtering process to arrive at a final, robust analytical sample. First, a sampling frame was established by applying specific eligibility criteria to the initial universe. Companies were excluded if they experienced a delisting, merger, acquisition, or bankruptcy during the 2021–2024 study period. This step ensured that all firms in the frame had a continuous operational and trading history, resulting in an eligible population of 195 companies.
From this eligible population, a second set of data-driven exclusion criteria necessary for the validity of the econometric analysis was applied. Companies were removed if they had incomplete ESG disclosure information across the study period, insufficient financial data to compute all variables, or extreme outliers in key financial metrics that could disproportionately influence the results. This final filtering step yielded the analytical sample of 180 non-financial companies, representing 720 firm-year observations. This approach constitutes a census of the eligible population, subject to data availability and quality constraints.
To ensure the final sample was not biased and remained representative of the broader market, a post hoc analysis of its composition was conducted. The sample’s distribution was verified across Global Industry Classification Standard (GICS) sectors and market capitalization quintiles. This verification confirmed that the final sample provides adequate and balanced representation across different industries and company sizes, thereby supporting the generalizability of the findings within the context of the Saudi market.

2.2.2. Data Collection Sources

The data collection strategy for this study is rooted in a clear distinction between data gathered directly from its original source and data obtained from processed, third-party databases. For the purposes of the archival research methodology, primary data sources are defined as the original, unstructured, as-published documents that form the basis of the content and disclosure analysis. These were obtained directly from company websites and the Saudi Exchange (Tadawul) official repository and include annual reports, sustainability reports, and corporate governance statements. This direct collection from the originating entity ensures the data are captured without intermediary interpretation. In contrast, secondary data sources consist of pre-compiled, structured financial and market information sourced from established financial data providers. This includes quantitative financial data from the Bloomberg Terminal and Refinitiv Eikon, as well as local financial databases maintained by the Capital Market Authority. Market data, such as stock prices, trading volumes, and index compositions, were sourced from Tadawul’s official market data feeds and cross-referenced with international financial data providers to ensure accuracy.
Data sources include corporate press releases, investor presentations, and sustainability-related communications published on company websites and social media platforms. Regulatory filings submitted to the Capital Market Authority provide additional verification of disclosed information and compliance with reporting requirements. Industry-specific data, including sector benchmarks, peer group classifications, and regulatory changes, are obtained from consulting firm reports, academic databases, and regulatory publications.
Geographic and demographic data for company headquarters, operations, and stakeholder distributions are compiled from corporate disclosures, government statistical agencies, and commercial databases. This information enables analysis of regional variations in AI adoption patterns and ESG disclosure quality within the Saudi context.

2.3. Variable Measurement and Operationalization

2.3.1. ESG Disclosure Quality Measurement

ESG disclosure quality serves as the primary dependent variable, measured through a comprehensive scoring framework based on the GRI Universal Standards 2021 edition [62]. The measurement framework incorporates three principal dimensions: GRI standards compliance, materiality assessment depth, and stakeholder engagement transparency. Each dimension receives equal weighting in the composite disclosure quality index, scaled from 0 to 100 to facilitate interpretation and cross-company comparison.
GRI standards compliance is assessed through systematic content analysis of annual reports and sustainability disclosures, evaluating alignment with the three Universal Standards: GRI 1 (Foundation), GRI 2 (General Disclosures), and GRI 3 (Material Topics) [63,64]. The scoring methodology assigns points based on the presence, completeness, and quality of required disclosures, with additional recognition for voluntary disclosure beyond minimum requirements. Specific evaluation criteria include organizational profile completeness, governance structure disclosure, stakeholder engagement description, and reporting practice transparency.
The GRI compliance score is calculated as [62]
GRI score = i = 1 n w i c i i = 1 n w i × 100   ,
where c i represents the compliance score for disclosure requirement i , w i represents the weight assigned to requirement i based on its significance according to GRI guidelines, and n represents the total number of applicable disclosure requirements for each company’s sector and materiality assessment.
Materiality assessment depth evaluates the sophistication and comprehensiveness of companies’ processes for identifying, prioritizing, and addressing material ESG topics. The assessment examines methodology transparency, stakeholder input incorporation, quantitative analysis integration, and alignment with business strategy and risk management processes. Scoring criteria include documentation quality, stakeholder diversity, topic coverage comprehensiveness, and evidence of impact assessment integration into decision-making processes.
The materiality assessment score follows the formulation [65]
Materiality score = 1 4 j = 1 4 M j × 100   ,
where M j represents the standardized score (0–1) for materiality dimension j , including methodology transparency, stakeholder engagement, topic comprehensiveness, and strategic integration.
Stakeholder engagement transparency measures the extent and quality of disclosure regarding stakeholder identification, engagement processes, feedback incorporation, and ongoing relationship management. The evaluation encompasses engagement frequency, method diversity, geographical coverage, and evidence of two-way communication effectiveness. Additional considerations include conflict resolution mechanisms, grievance procedures, and stakeholder satisfaction measurement.

2.3.2. AI Adoption Assessment

AI adoption in ESG processes constitutes the primary independent variable, measured through a multi-dimensional index incorporating technology deployment intensity, functional integration scope, and implementation sophistication. The measurement approach combines content analysis of corporate disclosures with primary survey data collected from sustainability officers and information technology personnel at sampled companies.
The measurement framework specifically targets conventional AI implementations, including supervised and unsupervised machine learning algorithms, rule-based natural language processing systems, automated data aggregation tools, and traditional predictive modeling approaches, rather than generative AI technologies such as large language models or AI-powered content generation systems.
Content analysis examines annual reports, technology sections, and sustainability disclosures for evidence of AI implementation in ESG-related processes. Specific indicators include natural language processing for disclosure automation, machine learning for data analysis and prediction, automated data collection systems, stakeholder sentiment analysis tools, and predictive modeling for sustainability metrics. Each technology application receives a score based on sophistication level, integration extent, and operational impact documentation.
The AI adoption intensity score is computed as [66]
AI intensity = k = 1 m a k s k u k k = 1 m s k × 100   ,
where a k represents the adoption status (0–1) for AI application k , s k represents the sophistication weight for application k based on technological complexity, u k represents the utilization frequency score (0–1), and m represents the total number of relevant AI applications for ESG processes.
Primary survey data supplement content analysis through structured questionnaires administered to key personnel responsible for ESG reporting and information technology management. The survey instrument encompasses questions regarding AI tool procurement decisions, implementation timelines, training requirements, integration challenges, and perceived effectiveness measures. Survey responses undergo validation through cross-referencing with disclosed information and follow-up interviews with selected respondents.
The survey component employs a Likert scale assessment of AI readiness across six dimensions adapted from established technology adoption frameworks: strategic alignment, infrastructure capability, data quality and governance, talent and skills, organizational culture, and change management effectiveness. Each dimension receives measurement through multiple indicators to ensure comprehensive assessment and minimize response bias.

2.3.3. Financial Performance Metrics

Financial performance measurement incorporates multiple indicators to capture various aspects of corporate financial health and market valuation. Primary measures include return on assets (ROA), return on equity (ROE), and Tobin’s Q, selected based on their widespread use in corporate finance research and relevance for evaluating the business case for ESG investments.
Return on assets measures operational efficiency and management effectiveness in generating profits from available assets [53],
ROA i , t = Net Income i , t Total Assets i , t 1 × 100   ,
where the subscript i denotes company, and t denotes year, with total assets measured at the beginning of the period to avoid simultaneity bias.
Return on equity evaluates profitability from shareholders’ perspective [23].
ROE i , t = Net Income i , t Shareholders Equity i , t 1 × 100   .
Tobin’s Q approximates market valuation relative to replacement cost of assets, providing insight into market perception of company prospects [67].
Tobin s Q i , t = Market Value of Equity i , t + Book Value of Debt i , t Book Value of Total Assets i , t .
Additional financial metrics include operating margin, asset turnover, debt-to-equity ratio, and earnings before interest, taxes, depreciation, and amortization (EBITDA) margin. These supplementary measures enable robustness testing and provide a comprehensive assessment of financial performance dimensions that may be differentially affected by ESG disclosure quality improvements.

2.4. Data Collection Procedures

2.4.1. Annual Report Content Analysis

To systematically analyze the unstructured qualitative data contained within annual reports, this study employs a mixed-methods content analysis approach that combines automated text mining techniques with manual verification to ensure accuracy and consistency. The process begins with document acquisition from company websites and regulatory repositories, followed by conversion to machine-readable format using optical character recognition (OCR) technology for scanned documents. Text preprocessing includes tokenization, stop word removal, stemming, and entity recognition to prepare documents for analytical processing.
Automated content analysis utilizes natural language processing algorithms trained on ESG-related vocabularies and classification schemes derived from GRI standards and sustainability reporting frameworks. The text mining process employs keyword frequency analysis, sentiment scoring, and topic modeling to identify relevant ESG content and assess disclosure characteristics. Machine learning classifiers trained on manually coded samples enable automated categorization of disclosure content across ESG dimensions.
Manual verification procedures involve independent review by trained research assistants using standardized coding protocols. Inter-rater reliability testing ensures consistency across coders, with disagreements resolved through consensus procedures and expert adjudication. The manual review process encompasses accuracy verification of automated classifications, identification of context-specific nuances, and validation of scoring assignments based on qualitative assessment criteria.
Quality control measures include random sampling for double-coding, systematic bias detection procedures, and continuous calibration of automated algorithms based on manual review feedback. The integration of automated and manual approaches maximizes efficiency while maintaining analytical rigor and interpretive validity.

2.4.2. Survey Data Collection

Primary survey data collection follows established best practices for organizational research. The development of the survey instrument involved a multi-stage validation process to ensure its psychometric soundness. Initially, the instrument underwent extensive pre-testing through pilot studies with industry experts and academic reviewers to ensure clarity, relevance, and content validity. Following this qualitative validation, a rigorous quantitative assessment of the instrument’s properties was conducted. To establish construct validity, Principal Component Analysis (PCA), a statistical procedure used to identify the underlying dimensional structure of the survey items, was employed. This method is ideal for confirming that the questions designed to measure distinct theoretical constructs (e.g., Technology Infrastructure and Strategic Implementation) do, in fact, load onto separate factors. To confirm internal consistency reliability for each identified factor, Cronbach’s alpha coefficients, a measure of inter-item correlation, were calculated. A high alpha value indicates that the items within a factor are reliably measuring the same underlying construct. Finally, to ensure convergent validity, the survey-based scores were correlated with the objective scores derived from the independent content analysis of corporate disclosures. A strong, statistically significant correlation between these two independent measures provides robust evidence that the survey instrument accurately captures the intended construct of AI adoption intensity. The detailed statistical results of these validation procedures are presented in Section 3.2.
Survey administration employs a mixed-mode approach combining online questionnaires, telephone interviews, and in-person meetings to accommodate respondent preferences and organizational constraints. Initial contact includes personalized invitations explaining research objectives, confidentiality assurances, and potential benefits for participating organizations. Follow-up communications provide gentle reminders and alternative participation options to encourage response.
Target respondents include senior executives responsible for sustainability reporting, chief information officers, and technology managers with direct involvement in ESG-related systems implementation. Multiple respondents per organization enable triangulation of responses and validation of reported information across functional areas. Survey responses undergo systematic quality checks, including completeness verification, logical consistency testing, and outlier identification.
The survey instrument incorporates various question types, including Likert scale ratings, multiple choice selections, ranking exercises, and open-ended responses to capture both quantitative and qualitative information. While the quantitative data form the basis of the econometric models, the open-ended responses were used thematically to triangulate findings and provide rich contextual understanding for key statistical results. Skip logic and adaptive questioning reduce respondent burden while ensuring comprehensive data collection relevant to each organization’s specific circumstances.

2.5. Analytical Framework and Statistical Methods

The analytical framework of this study is designed to rigorously examine both the causal impact and the dynamic interplay between AI adoption, ESG disclosure quality, and financial performance. To achieve this, a dual-methodological strategy is employed. The primary analysis utilizes the System Generalized Method of Moments (GMM) estimator to identify the core causal relationships while addressing critical endogeneity concerns inherent in the data, such as simultaneity and unobserved firm heterogeneity. Complementing the GMM approach, a Panel Vector Autoregression (PVAR) model is employed as a secondary analysis. The PVAR model allows for an exploration of the system’s dynamic properties, treating all variables as endogenous to map out feedback loops, adjustment speeds to shocks, and the temporal evolution of these relationships over time. This combination of methods provides a more comprehensive and robust understanding than either approach could yield in isolation, offering insights into both causal effects and their dynamic context. Finally, the analysis is subjected to a formal bounding test to validate the core findings against potential unobserved macroeconomic confounders.

2.5.1. Generalized Method of Moments Estimation

The primary analytical approach employs dynamic panel data estimation using the Generalized Method of Moments (GMM). This choice is methodologically crucial for addressing several potential sources of endogeneity inherent in the relationship between AI adoption, ESG disclosure quality, and financial performance, which could otherwise lead to biased and inconsistent estimates. Specifically, the GMM framework is adept at mitigating the following:
  • Simultaneity or Reverse Causality: The relationships under investigation are likely not unidirectional. While AI adoption may enhance ESG disclosure and financial performance, it is equally plausible that firms with superior financial health and a stronger pre-existing commitment to sustainability are better positioned to invest in and adopt advanced AI technologies.
  • Dynamic Endogeneity: Financial performance is often persistent, meaning past performance is a strong predictor of current performance. The inclusion of a lagged dependent variable to capture this effect would violate the assumptions of standard static panel estimators. A dynamic estimator like GMM is designed to handle this issue by using appropriately lagged instruments.
  • Unobserved Firm-Specific Heterogeneity: Time-invariant unobserved factors, such as exceptional managerial talent, an innovative corporate culture, or unique political connections, can independently influence both a firm’s propensity to adopt AI and its financial outcomes. GMM uses an internal transformation (differencing) to eliminate these confounding effects, providing a clearer view of the relationships of interest.
Given these significant econometric challenges, standard OLS or static panel (fixed/random effects) models would yield unreliable results. The System GMM estimator, in particular, is selected for its ability to improve efficiency and address weak instrument problems, making it the most suitable approach for robustly identifying the causal effects central to this study.
Prior to GMM estimation, comprehensive stationarity testing was conducted to validate the appropriateness of the dynamic panel specification. Panel unit root tests, including the Im–Pesaran–Shin (IPS) test and Fisher-type tests using augmented Dickey–Fuller statistics, were applied to all key variables to ensure stationarity properties necessary for consistent GMM estimation. Cointegration analysis using the Westerlund panel cointegration test examined long-run equilibrium relationships between AI adoption, ESG disclosure quality, and financial performance variables, confirming the validity of the dynamic panel framework for capturing both short-term adjustments and long-term relationships among the variables.
The baseline dynamic panel model specification follows [39]
Y i , t = α Y i , t 1 + β 1 AI i , t + β 2 ESG i , t + γ X i , t + μ i + λ t + ε i , t ,
where Y i , t represents the financial performance measure for firm i in year t , AI i , t denotes the AI adoption intensity, ESG i , t represents ESG disclosure quality, X i , t encompasses control variables, μ i captures unobserved firm-specific effects, λ t represents time fixed effects, and ε i , t is the idiosyncratic error term.
The System GMM estimator, developed by Blundell and Bond (1998) [68], combines equations in first differences with equations in levels to improve efficiency and address weak instrument problems. The moment conditions for the system estimator are
E [ Y i , t s Δ ε i , t ] = 0 for   s 2 ; t = 3 , , T ,
E [ Δ Y i , t 1 ( μ i + ε i , t ) ] = 0 for   t = 3 , , T ,
where the first condition applies to the differenced equation and the second to the levels equation, with lagged levels serving as instruments for differenced variables and lagged differences instrumenting level variables.
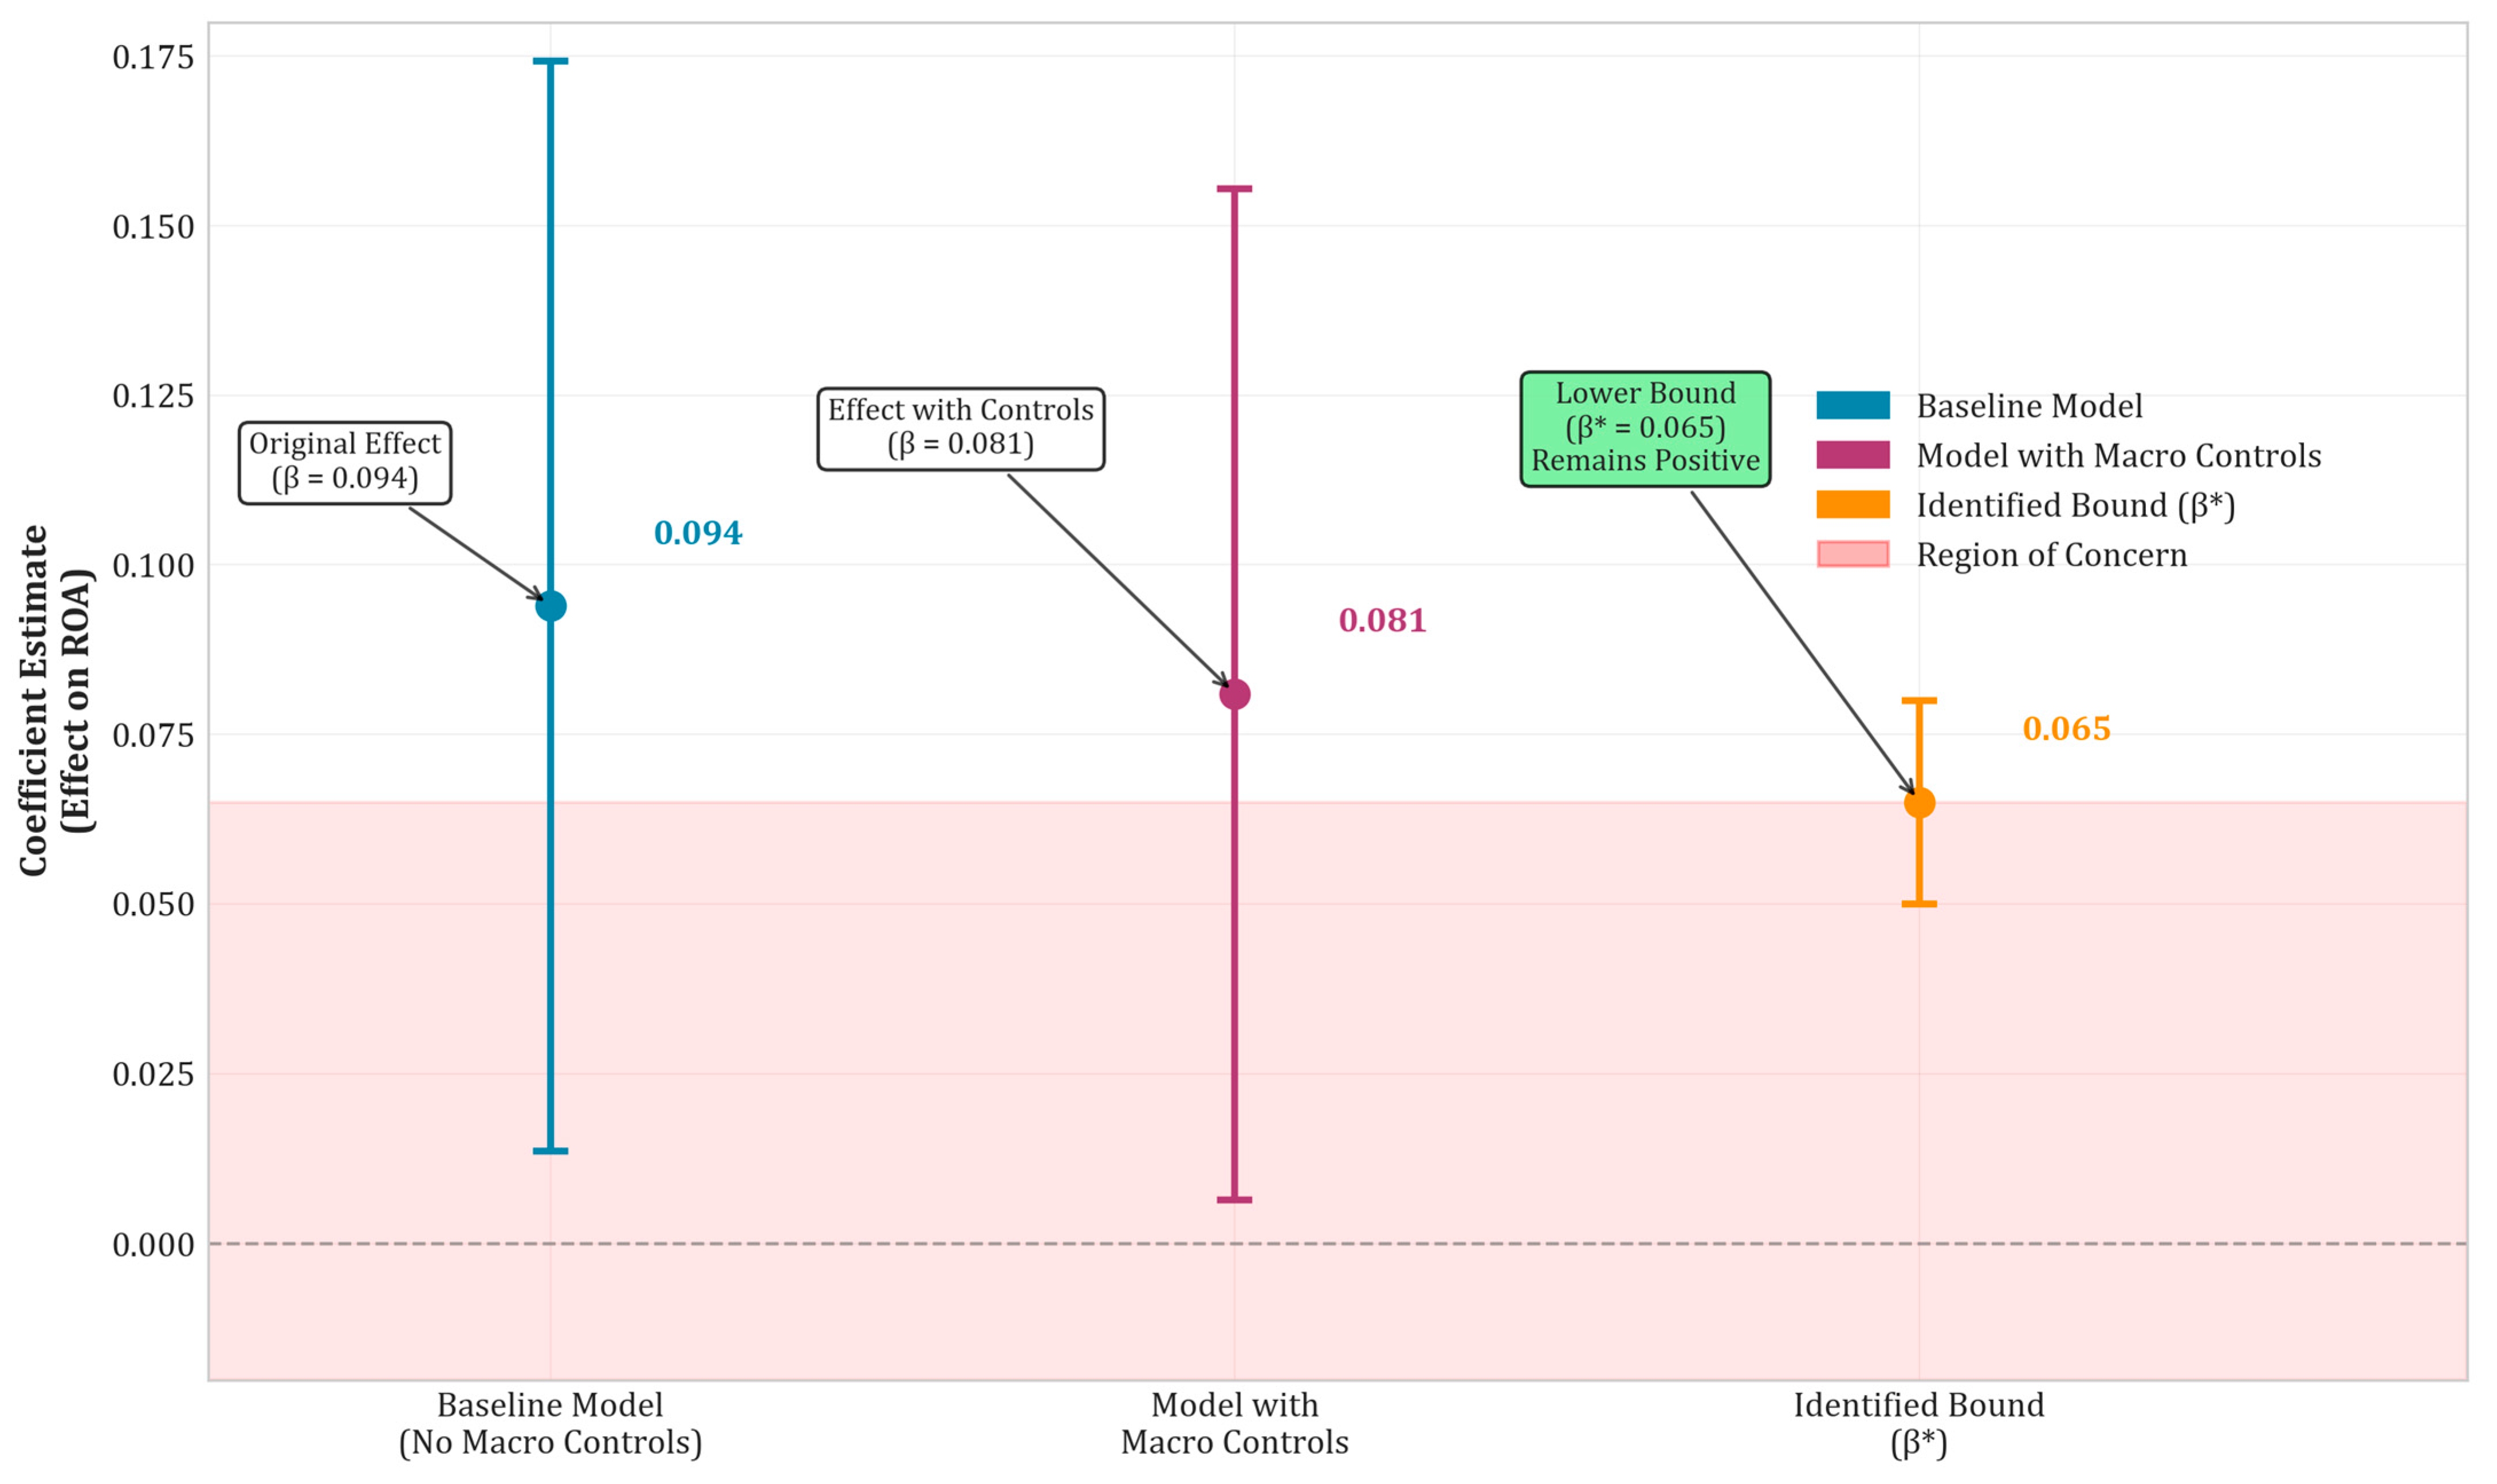
While System GMM provides more reliable estimates than simpler approaches, it is acknowledged that perfect causal identification remains elusive in observational settings. The subsequent bounding analysis (Section 3.9) provides additional robustness against unobserved confounding that may arise from the unique macroeconomic environment during the study period, including the COVID-19 aftermath and inflationary pressures.
Statistical significance of coefficient estimates is evaluated using t-tests based on robust standard errors clustered at the firm level to account for within-firm serial correlation and heteroskedasticity. The clustering approach addresses potential dependence in error terms across time periods for the same firm while providing consistent standard error estimates for hypothesis testing.

2.5.2. Two-Stage Treatment Effects Model

For investigating the causal influence of AI implementation on ESG disclosure quality, the analysis employs a two-stage treatment effects model that addresses selection bias arising from non-random AI adoption decisions. The first stage models the probability of AI adoption using firm characteristics, industry factors, and external determinants [69],
Prob ( AI i , t = 1 ) = Φ ( β 0 + β 1 Size i , t 1 + β 2 Age i , t + β 3 Industry i + β 4 Z i , t ) ,
where Φ represents the standard normal cumulative distribution function, and Z i , t includes instrumental variables affecting AI adoption probability but not directly influencing ESG disclosure quality.
The second stage estimates the treatment effect of AI adoption on ESG disclosure quality, incorporating the inverse Mills ratio from the first stage to correct for selection bias [54],
ESG i , t = γ 0 + γ 1 AI i , t + γ 2 X i , t + γ 3 λ i , t + η i , t ,
where λ i , t represents the inverse Mills ratio computed from first-stage estimates, and γ 1 provides the unbiased estimate of AI adoption’s causal effect on ESG disclosure quality.

2.5.3. Mediation Analysis Framework

The relationship between AI adoption and financial performance may operate through multiple pathways, including direct effects and indirect effects mediated by ESG disclosure quality improvements. The mediation analysis framework decomposes total effects into direct and indirect components using the causal mediation approach [70].
The mediation model specification includes
ESG i , t = α m + β m AI i , t + γ m X i , t + ε m , i , t ,
Y i , t = α y + β y AI i , t + δ y ESG i , t + γ y X i , t + ε y , i , t ,
where the first equation models the mediator (ESG disclosure quality) and the second models the outcome (financial performance). The indirect effect through ESG quality is calculated as β m × δ y , while the direct effect is β y , with the total effect being their sum.

2.5.4. Panel Vector Autoregression

To examine dynamic relationships and feedback effects between AI adoption, ESG disclosure quality, and financial performance, the analysis employs a panel vector autoregression (PVAR) model. The PVAR specification treats all variables as endogenous and examines their joint evolution over time [71],
Y i , t = A 0 + j = 1 p A j Y i , t j + μ i + ε i , t ,
where Y i , t = [ AI i , t , ESG i , t , Performance i , t ] represents the vector of endogenous variables, A j are coefficient matrices, μ i captures individual fixed effects, and ε i , t represents the vector of innovations.
The PVAR model enables examination of impulse response functions, variance decomposition, and Granger causality testing to understand the direction and magnitude of relationships between variables over time. Estimation employs the forward orthogonal deviation transformation to eliminate fixed effects while preserving the lag structure necessary for valid instrumentation.

2.6. Control Variables and Model Specification

2.6.1. Firm-Level Controls

The empirical models incorporate comprehensive firm-level control variables to isolate the effects of AI adoption and ESG disclosure quality from other factors influencing financial performance. Firm size, measured as the natural logarithm of total assets, controls for scale effects and resource availability that may influence both technology adoption capacity and disclosure sophistication. Firm age, calculated as years since initial public offering, accounts for organizational maturity and experience effects.
Leverage, measured as total debt divided by total assets, controls for capital structure effects on both risk profile and performance outcomes. Growth opportunities, proxied by the market-to-book ratio, account for investment prospects that may influence both ESG investments and financial returns. Profitability, measured by the prior year’s return on assets (ROA (t−1)), is included to control for the influence of financial performance on ESG disclosure decisions. This approach, grounded in slack resources theory, posits that more profitable firms have greater resources to allocate to sustainability initiatives and reporting [72,73]. The variable is lagged by one period to mitigate potential simultaneity, ensuring that the measure of financial capacity precedes the ESG disclosure activities being analyzed.
Corporate governance variables include board size, board independence, CEO duality, and audit committee characteristics. These controls address governance quality effects on both disclosure practices and firm performance, ensuring that observed relationships reflect technological innovation rather than general governance improvements.

2.6.2. Industry and Time Controls

Industry fixed effects control for sector-specific characteristics, including regulatory requirements, stakeholder expectations, and business model differences that may influence ESG disclosure practices and AI adoption patterns, consistent with established research demonstrating significant sectoral variation in ESG materiality and disclosure practices [74]. The analysis employs GICS sector classifications to ensure comprehensive industry coverage while maintaining sufficient sample sizes within each sector, following methodological approaches validated in prior ESG research [75].
Year fixed effects account for macroeconomic conditions, regulatory changes, and technological developments affecting all companies during the study period, addressing time-varying confounds documented in panel data studies of corporate disclosure and performance [76,77]. These controls are particularly important given the dynamic nature of AI technology advancement and evolving ESG reporting standards during the 2021–2024 timeframe. Additional time-varying controls include oil price fluctuations, exchange rate variations, and Saudi Arabia-specific economic indicators that may influence corporate performance and investment priorities, following approaches established in emerging market studies [73,78].

2.7. Robustness Checks and Sensitivity Analysis

2.7.1. Alternative Measurement Approaches

Robustness testing employs alternative measurement approaches for key variables to ensure findings are not dependent on specific operationalization choices. ESG disclosure quality measurement alternatives include binary indicators for high/low quality categories, factor analysis-derived composite indices, and text mining-based sentiment scores. AI adoption measurement alternatives encompass categorical classifications, continuous intensity measures, and technology-specific indicators.
Financial performance measurement robustness checks utilize risk-adjusted returns, industry-adjusted metrics, and alternative valuation measures, including price-to-earnings ratios and enterprise value multiples. These alternative measures ensure findings reflect genuine performance improvements rather than measurement artifacts or market timing effects.

2.7.2. Sample Composition Sensitivity

Sample composition sensitivity analysis examines whether findings hold across different subsamples and time periods. Sector-specific analysis evaluates whether relationships vary across industries with different ESG materiality profiles. Size-based analysis examines differential effects for large versus small companies that may face different resource constraints and stakeholder expectations.
Temporal stability testing examines whether relationships remain consistent across different time periods within the study window. This analysis is particularly important given the evolving nature of AI technology and ESG reporting practices during the sample period.

2.7.3. Econometric Specification Tests

Comprehensive specification testing validates the appropriateness of chosen analytical methods. GMM specification tests include the Hansen test for instrument validity, the Arellano-Bond test for serial correlation in residuals, and weak instrument diagnostics to ensure reliable inference. Alternative estimation approaches, including fixed effects, random effects, and pooled OLS, provide comparison benchmarks.
Mediation analysis robustness checks employ bootstrap procedures for confidence interval construction and alternative identification strategies for causal inference. The analysis examines sensitivity to unmeasured confounding using bounding approaches and placebo tests to strengthen causal interpretations.
Panel unit root tests ensure stationarity assumptions underlying the econometric models are satisfied, while cointegration analysis examines long-run relationships between variables. Cross-sectional dependence tests address potential spatial correlation arising from common factors affecting all companies simultaneously.

3. Results

3.1. Descriptive Statistics and Sample Characteristics

To establish the foundational understanding of the dataset and validate the representativeness of the sample, comprehensive descriptive analysis was conducted across all key variables. The analysis encompasses distributional characteristics, temporal trends, and cross-sectional variations that inform subsequent econometric modeling. Table 2 presents the summary statistics for all primary variables used in the analysis, while Figure 2 illustrates the temporal evolution of key metrics across the study period.
The descriptive statistics reveal substantial variation in both ESG disclosure quality and AI adoption intensity across the sample, indicating sufficient heterogeneity for meaningful econometric analysis. ESG disclosure quality scores range from 8.50 to 89.20 with a mean of 47.32, suggesting that while some companies have achieved high disclosure standards, significant room for improvement exists across the sample. AI adoption intensity demonstrates even greater variation, with scores ranging from zero (no AI implementation) to 95.60 (comprehensive AI integration), and a mean of 31.45, indicating that most companies remain in early stages of AI adoption for ESG processes.
Time-series analysis of mean values across the study period was conducted to examine the temporal evolution of key variables and identify potential trends that may influence the analysis. Figure 2 displays the annual progression of ESG disclosure quality, AI adoption intensity, and average financial performance metrics from 2021 to 2024.
The temporal analysis reveals several important patterns. ESG disclosure quality exhibits a steady upward trend from a mean of 39.8 in 2021 to 54.1 in 2024, representing a 36% improvement over the study period. This progression aligns with the implementation timeline of Saudi Exchange ESG disclosure guidelines and suggests increasing corporate attention to sustainability reporting quality. AI adoption intensity demonstrates more dramatic growth, increasing from a mean of 18.2 in 2021 to 44.9 in 2024, indicating rapid technology diffusion across the sample companies.
Financial performance metrics show mixed temporal patterns. Average ROA remains relatively stable around 8–9% throughout the period, while ROE exhibits modest improvement from 12.1% in 2021 to 16.8% in 2024. Tobin’s Q demonstrates the most pronounced improvement, increasing from 1.42 in 2021 to 1.89 in 2024, suggesting that market valuations have responded positively to corporate sustainability and technology initiatives during the study period.

3.2. AI Adoption Measurement Validation

As detailed in the methodology, the AI adoption intensity instrument underwent a rigorous, multi-stage validation process to ensure it validly and reliably measures the intended construct. This section presents the results of these validation procedures for the AI adoption intensity instrument. The instrument’s construct validity was assessed using PCA, its internal consistency reliability using Cronbach’s alpha, and its convergent validity by correlating its scores with those derived from the separate content analysis.
The PCA, detailed in Table 3, was conducted on the survey items to identify the underlying structure of AI adoption readiness. The analysis confirmed a clear, three-dimensional structure that was both statistically robust and theoretically sound.
The validation process followed a structured sequence to ensure the psychometric soundness of the AI adoption instrument. First, to establish construct validity, a PCA with Varimax rotation was performed. The analysis, detailed in Table 3, confirmed a clear and theoretically grounded three-dimensional structure, with all eigenvalues exceeding 1.0 and a cumulative variance explanation of 70.9%. All individual factor loadings were above the 0.60 threshold, indicating that the items converge on their intended latent constructs.
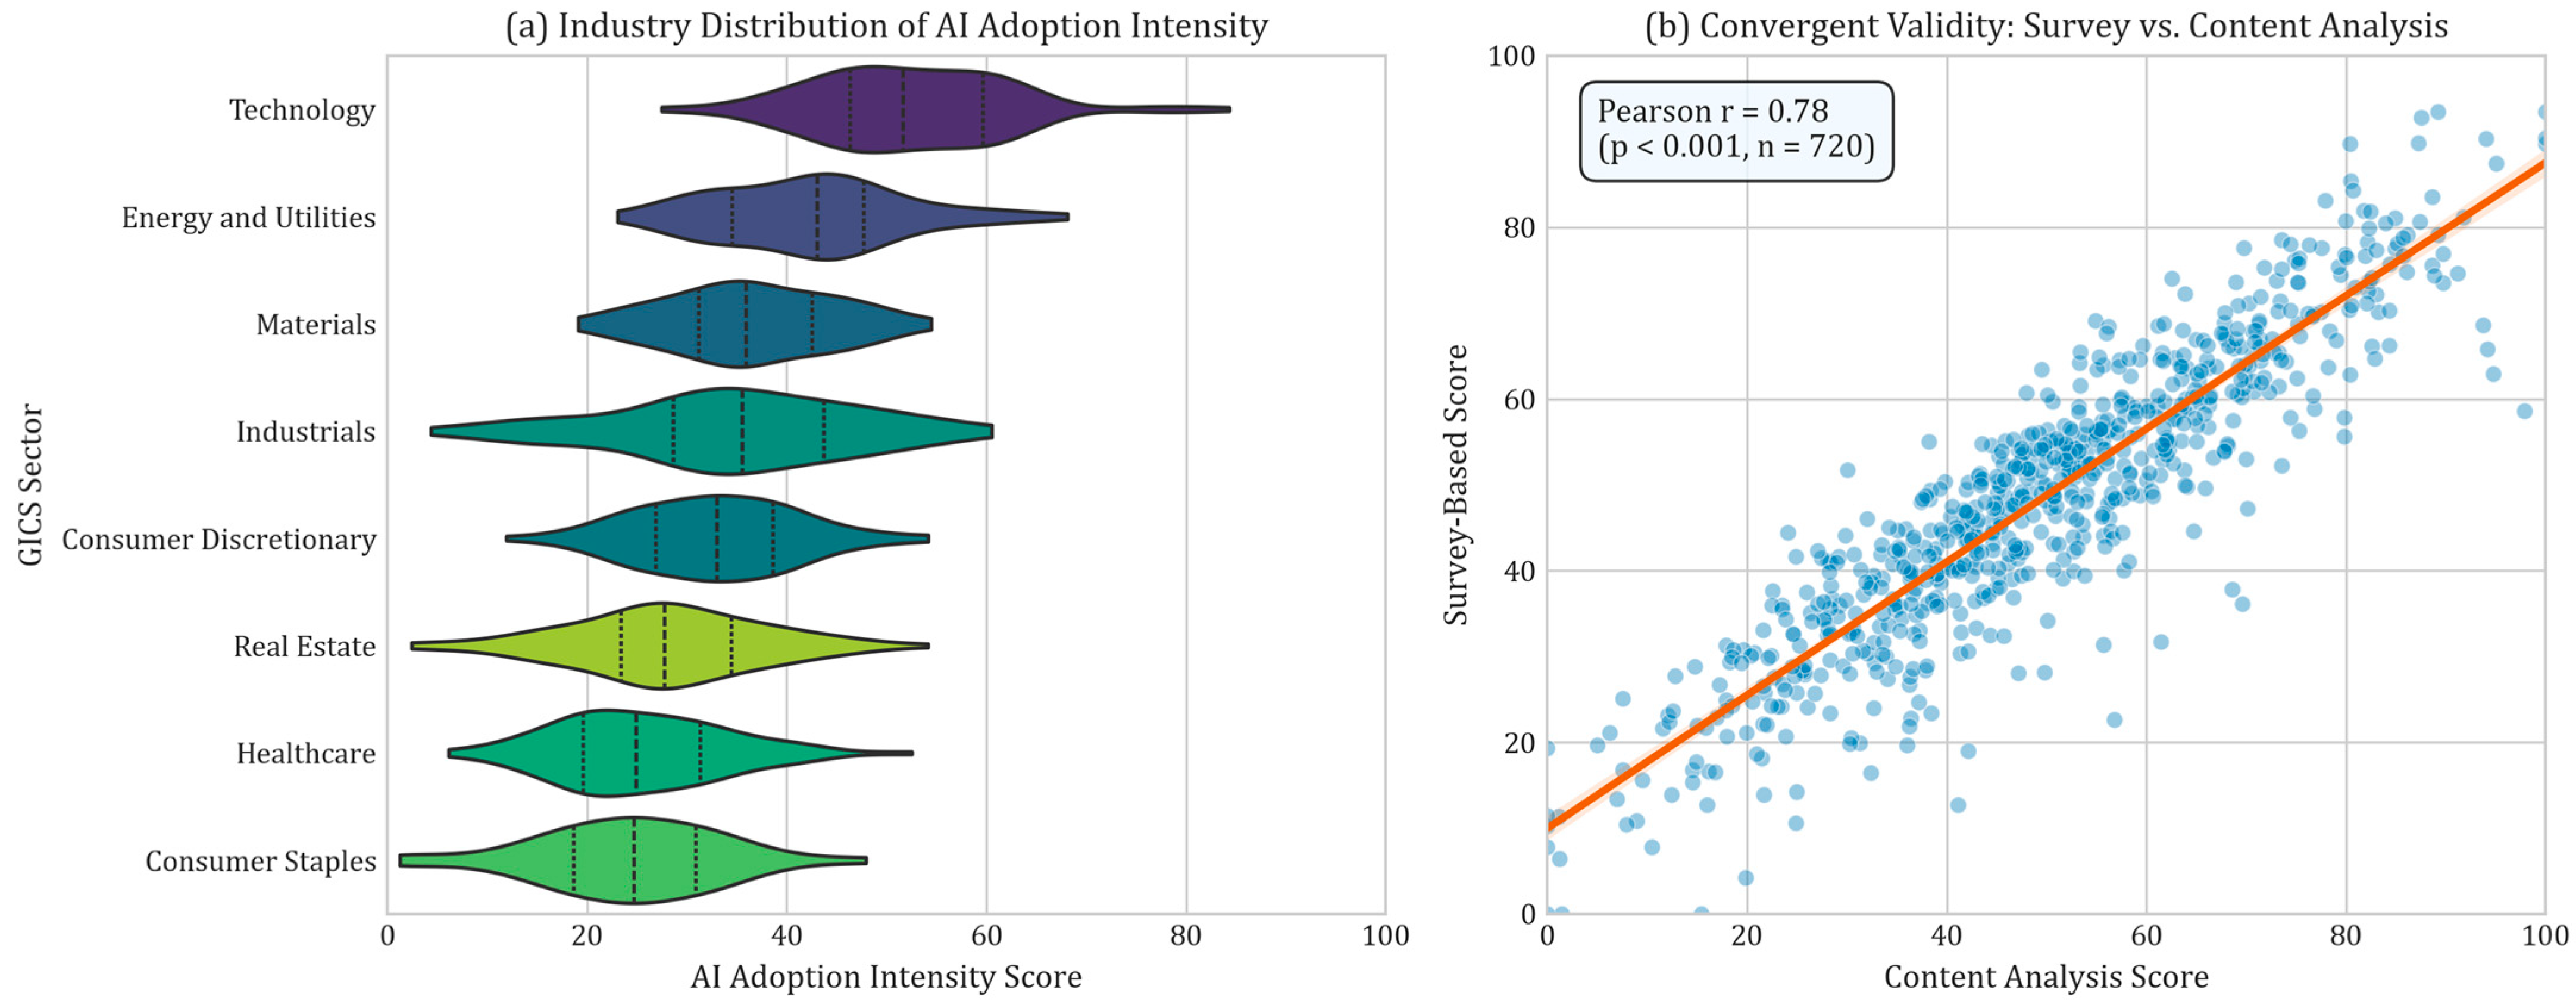
Following the establishment of this factor structure, the internal consistency reliability of each construct was assessed. While the high and relatively clustered factor loadings suggest that Cronbach’s alpha is a reasonable estimator, to address the potential for minor heterogeneity in loadings, both Cronbach’s alpha and Composite Reliability (CR) were calculated. As noted in Table 3, both sets of coefficients demonstrate excellent reliability for all three factors. Finally, to establish convergent validity, the survey-based instrument scores were correlated with independently derived scores from a systematic content analysis of corporate disclosures. The strong, statistically significant Pearson correlation shown in Figure 3 (r = 0.78, p < 0.001) confirms that both measurement approaches converge on the same underlying construct, providing robust support for the instrument’s validity.
To further assess the measurement approach, an analysis of the distribution of AI adoption scores across different sectors was conducted, and a test for convergent validity was performed. Figure 3 visually summarizes this analysis. Panel (a) illustrates the significant variation in AI adoption intensity across major GICS sectors, with the Technology and Energy sectors showing the highest adoption rates. Panel (b) provides strong evidence of convergent validity by plotting the survey-based scores against the content analysis-derived scores. The resulting Pearson correlation coefficient of 0.78 (p < 0.001) confirms a high degree of agreement between the two independent measurement methods, significantly strengthening confidence in the validity of the AI adoption instrument.
The results of the validation analysis, presented in Table 3 and Figure 3, confirm the psychometric soundness of the AI adoption instrument. The factor analysis reveals a clear and reliable three-factor structure, while the industry analysis in Figure 3a shows significant sectoral variation that aligns with theoretical expectations of technology readiness and regulatory pressures. Crucially, the strong Pearson correlation of 0.78 (p < 0.001) between the survey scores and the independently derived content analysis scores provides robust evidence of convergent validity. This high degree of agreement between two different measurement methods confirms that the instrument accurately captures the construct of AI adoption intensity, thereby validating its use for the primary empirical analysis of this study.

3.3. ESG Disclosure Quality Assessment

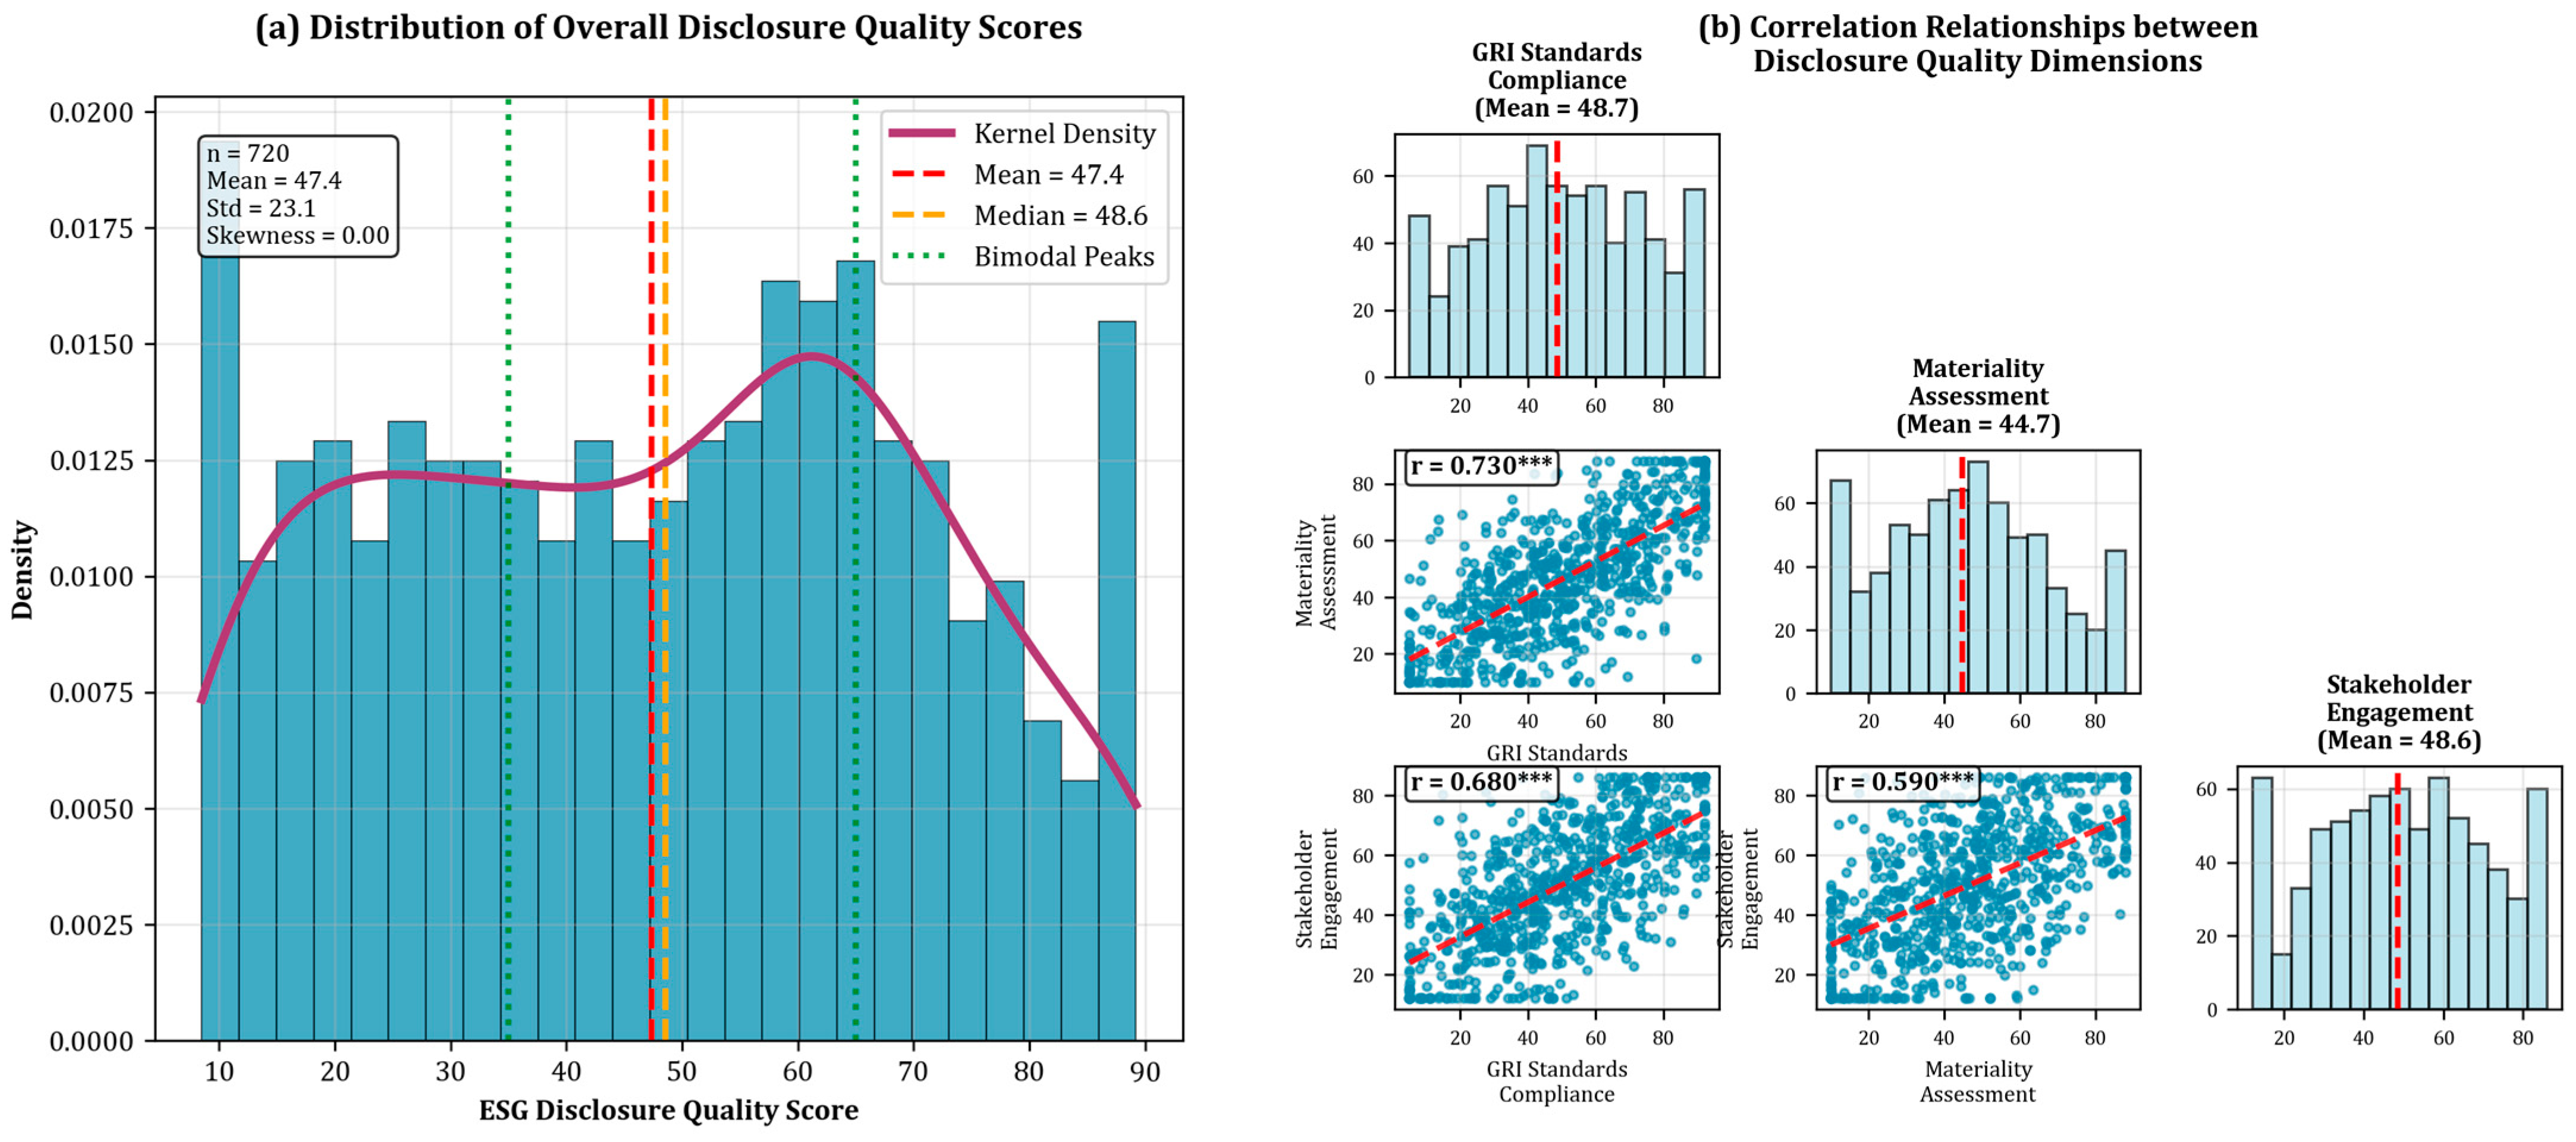
The comprehensive assessment of ESG disclosure quality across the sample reveals substantial heterogeneity in corporate sustainability reporting practices and provides insights into the factors driving disclosure improvements. Analysis was conducted across the three primary dimensions of the disclosure quality framework: GRI standards compliance, materiality assessment depth, and stakeholder engagement transparency. Table 4 presents detailed statistics for each disclosure quality dimension, while Figure 4a shows the distribution of overall disclosure quality scores, and Figure 4b illustrates the relationship between disclosure quality dimensions.
The dimensional analysis reveals that GRI standards compliance achieves the highest mean score (48.72), followed closely by stakeholder engagement transparency (48.57), while materiality assessment depth demonstrates the lowest average performance (44.67). This pattern suggests that companies find compliance with established frameworks and stakeholder communication more manageable than developing sophisticated materiality assessment processes.
To examine the distribution characteristics of overall ESG disclosure quality and understand the relationships between different quality dimensions, distributional analysis and correlation assessment were conducted. Figure 4a presents the frequency distribution of overall ESG disclosure quality scores across the sample, while Figure 4b shows the correlation matrix and scatter plot relationships between the three primary disclosure quality dimensions.
The distributional analysis reveals a roughly normal distribution of ESG disclosure quality scores with slight positive skewness (skewness = 0.34), indicating that more companies achieve below-average than above-average disclosure quality. The distribution exhibits some evidence of bimodality, with peaks around scores of 35 and 65, suggesting potential clustering of companies into distinct disclosure quality categories.
The correlation analysis between disclosure quality dimensions reveals strong positive relationships, with the highest correlation between GRI compliance and materiality assessment (r = 0.73, p < 0.001), followed by GRI compliance and stakeholder engagement (r = 0.68, p < 0.001). The relationship between materiality assessment and stakeholder engagement demonstrates moderate correlation (r = 0.59, p < 0.001), indicating that while these dimensions are related, they capture distinct aspects of disclosure quality.

3.4. Main Regression Results: AI Adoption and ESG Disclosure Quality

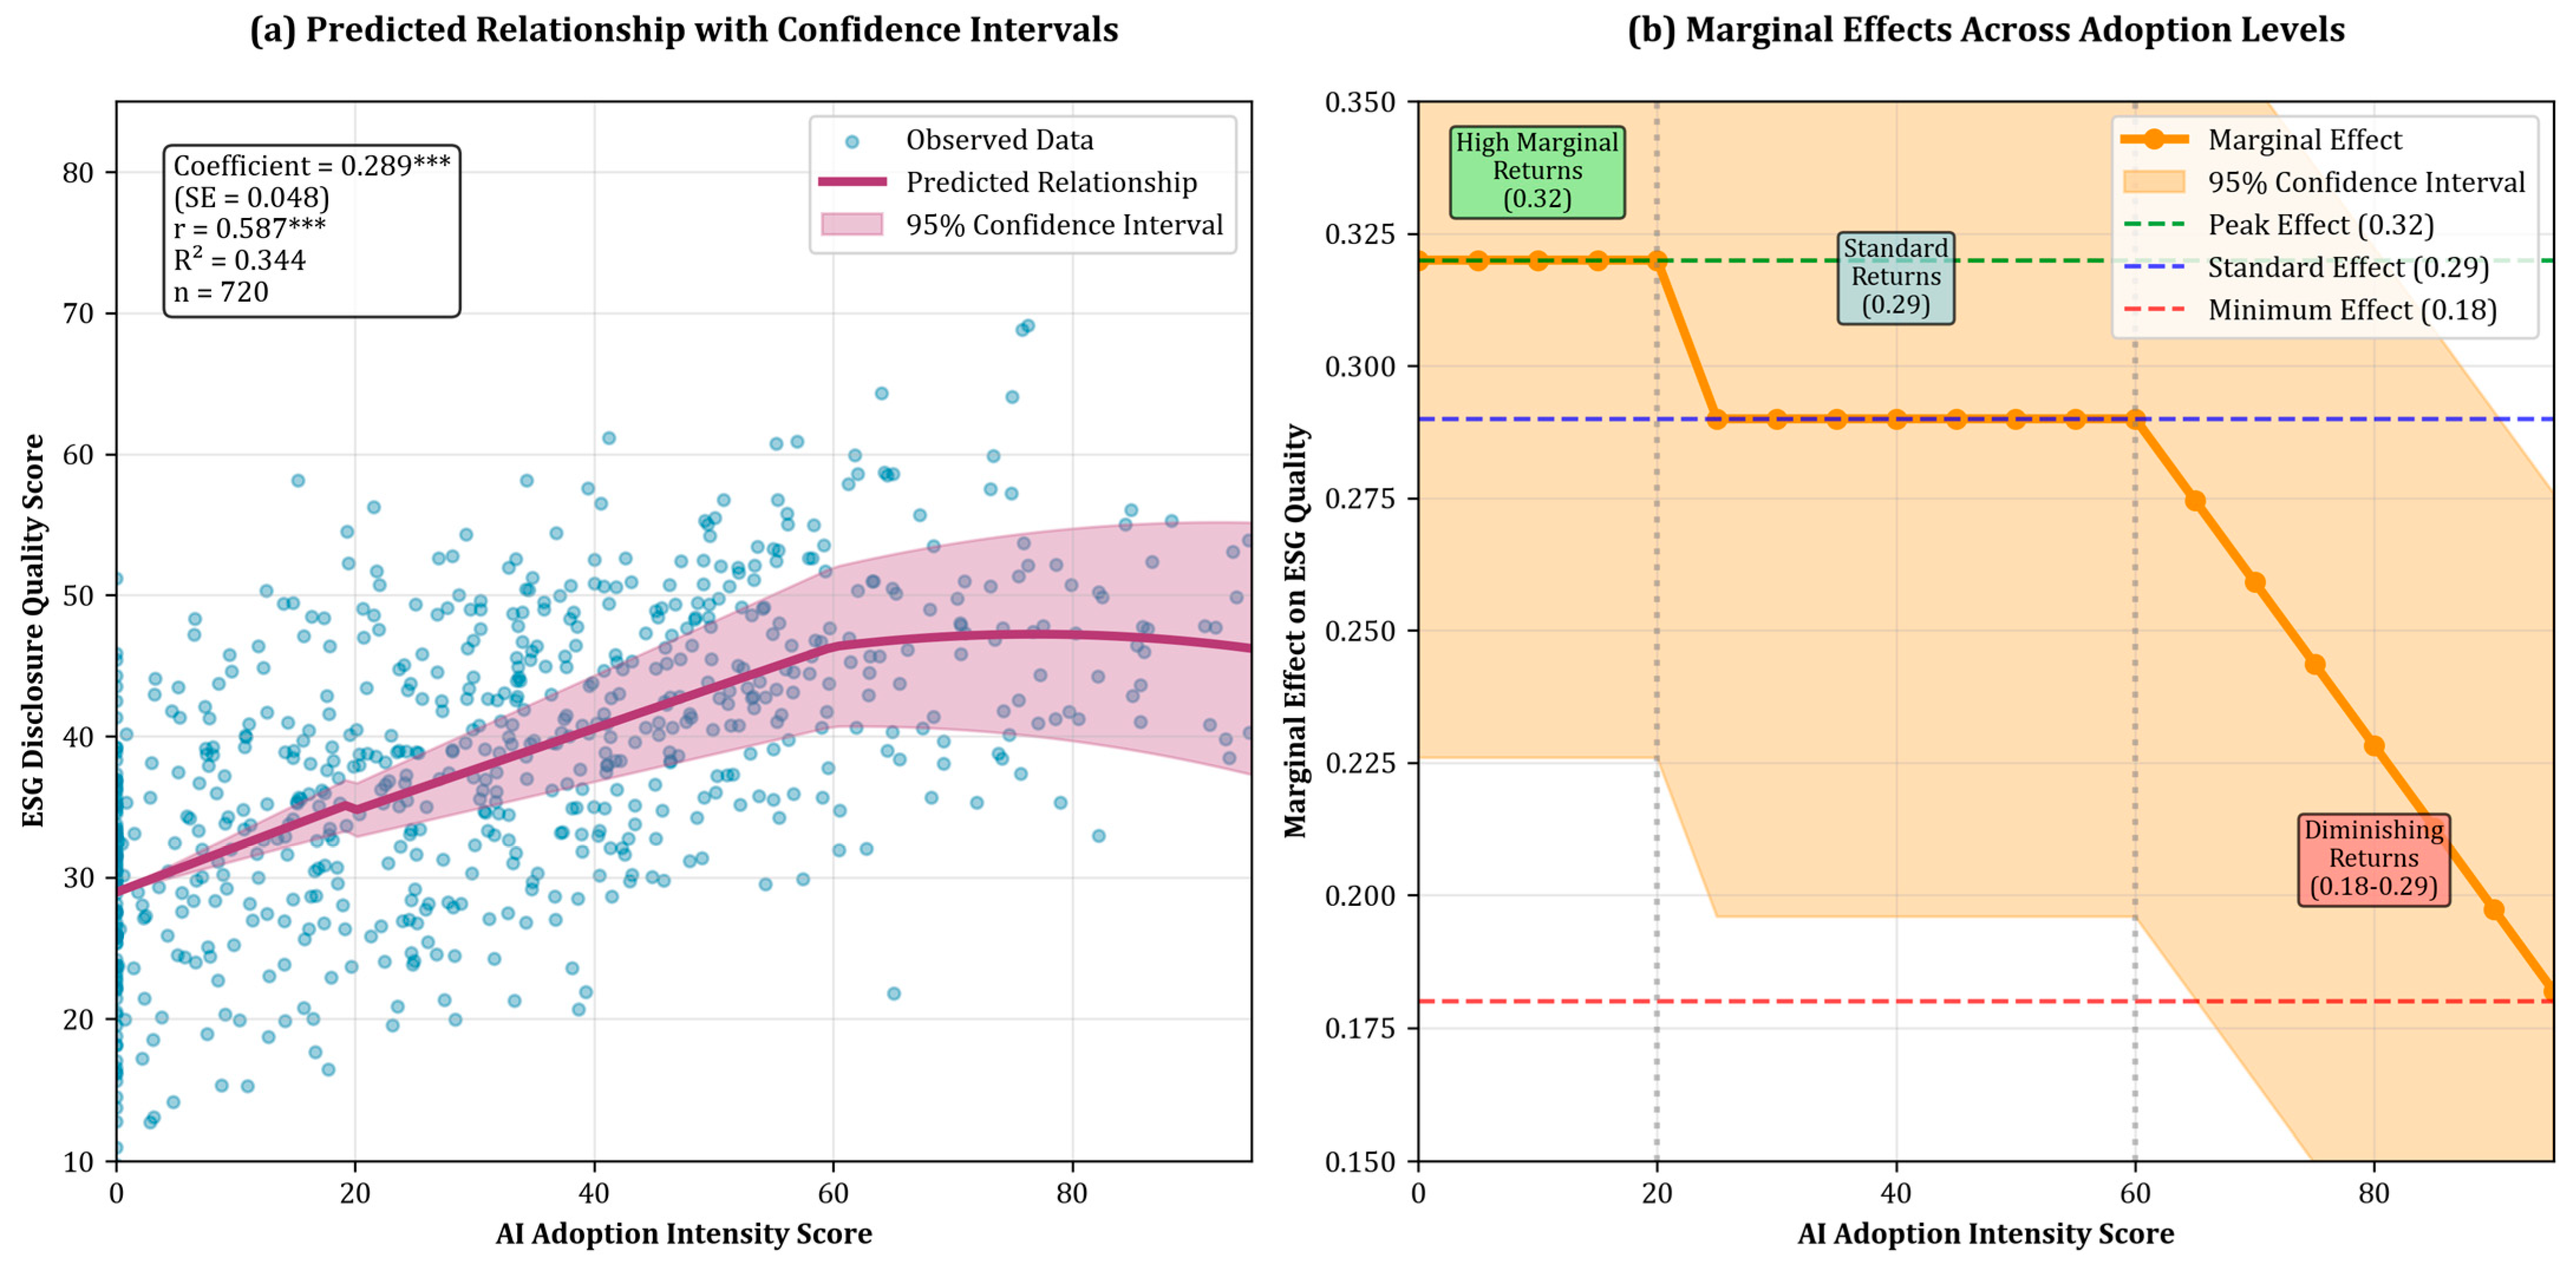
The primary empirical analysis examines the causal relationship between AI adoption intensity and ESG disclosure quality using the System GMM estimator to address endogeneity concerns. The analysis progresses from baseline specifications to comprehensive models incorporating control variables, industry effects, and temporal dynamics. Table 5 presents the main regression results across different model specifications, while Figure 5a illustrates the predicted relationship between AI adoption and ESG quality, and Figure 5b shows the marginal effects across different AI adoption levels.
The regression results provide strong evidence for a positive and statistically significant relationship between AI adoption intensity and ESG disclosure quality across all model specifications. The coefficient on AI adoption intensity ranges from 0.276 to 0.312, indicating that a one-unit increase in AI adoption intensity is associated with approximately a 0.28–0.31 unit increase in ESG disclosure quality score. This relationship remains robust to the inclusion of control variables, fixed effects, and alternative specifications.
The diagnostic tests confirm the validity of the System GMM estimation approach. The AR(2) test fails to reject the null hypothesis of no second-order serial correlation in all specifications (p-values ranging from 0.156 to 0.234), while the Hansen test of instrument validity shows no evidence of instrument invalidity (p-values from 0.356 to 0.423). The number of instruments remains below the rule-of-thumb maximum of 100 and well below the number of groups, ensuring estimation efficiency.
To visualize the relationship between AI adoption and ESG disclosure quality and examine potential non-linearities in the effect, predictive analysis and marginal effects estimation were conducted. Figure 5a presents the predicted ESG disclosure quality scores across the range of AI adoption intensity values, while Figure 5b shows the marginal effects of AI adoption at different levels of initial adoption.
The predictive analysis reveals a positive, approximately linear relationship between AI adoption intensity and ESG disclosure quality, with some evidence of diminishing marginal returns at very high adoption levels. The relationship is strongest for companies transitioning from low to moderate AI adoption levels (scores 20–60), with marginal effects ranging from 0.32 to 0.29. For companies with already high AI adoption (scores above 70), the marginal effects decline to approximately 0.18, suggesting that additional AI investments yield smaller incremental improvements in disclosure quality.
The confidence intervals remain relatively narrow throughout the adoption spectrum, indicating precise estimation of the relationship. However, the intervals widen slightly at the extremes of the distribution, reflecting the smaller number of observations with very low or very high AI adoption scores.

3.5. Financial Performance Implications

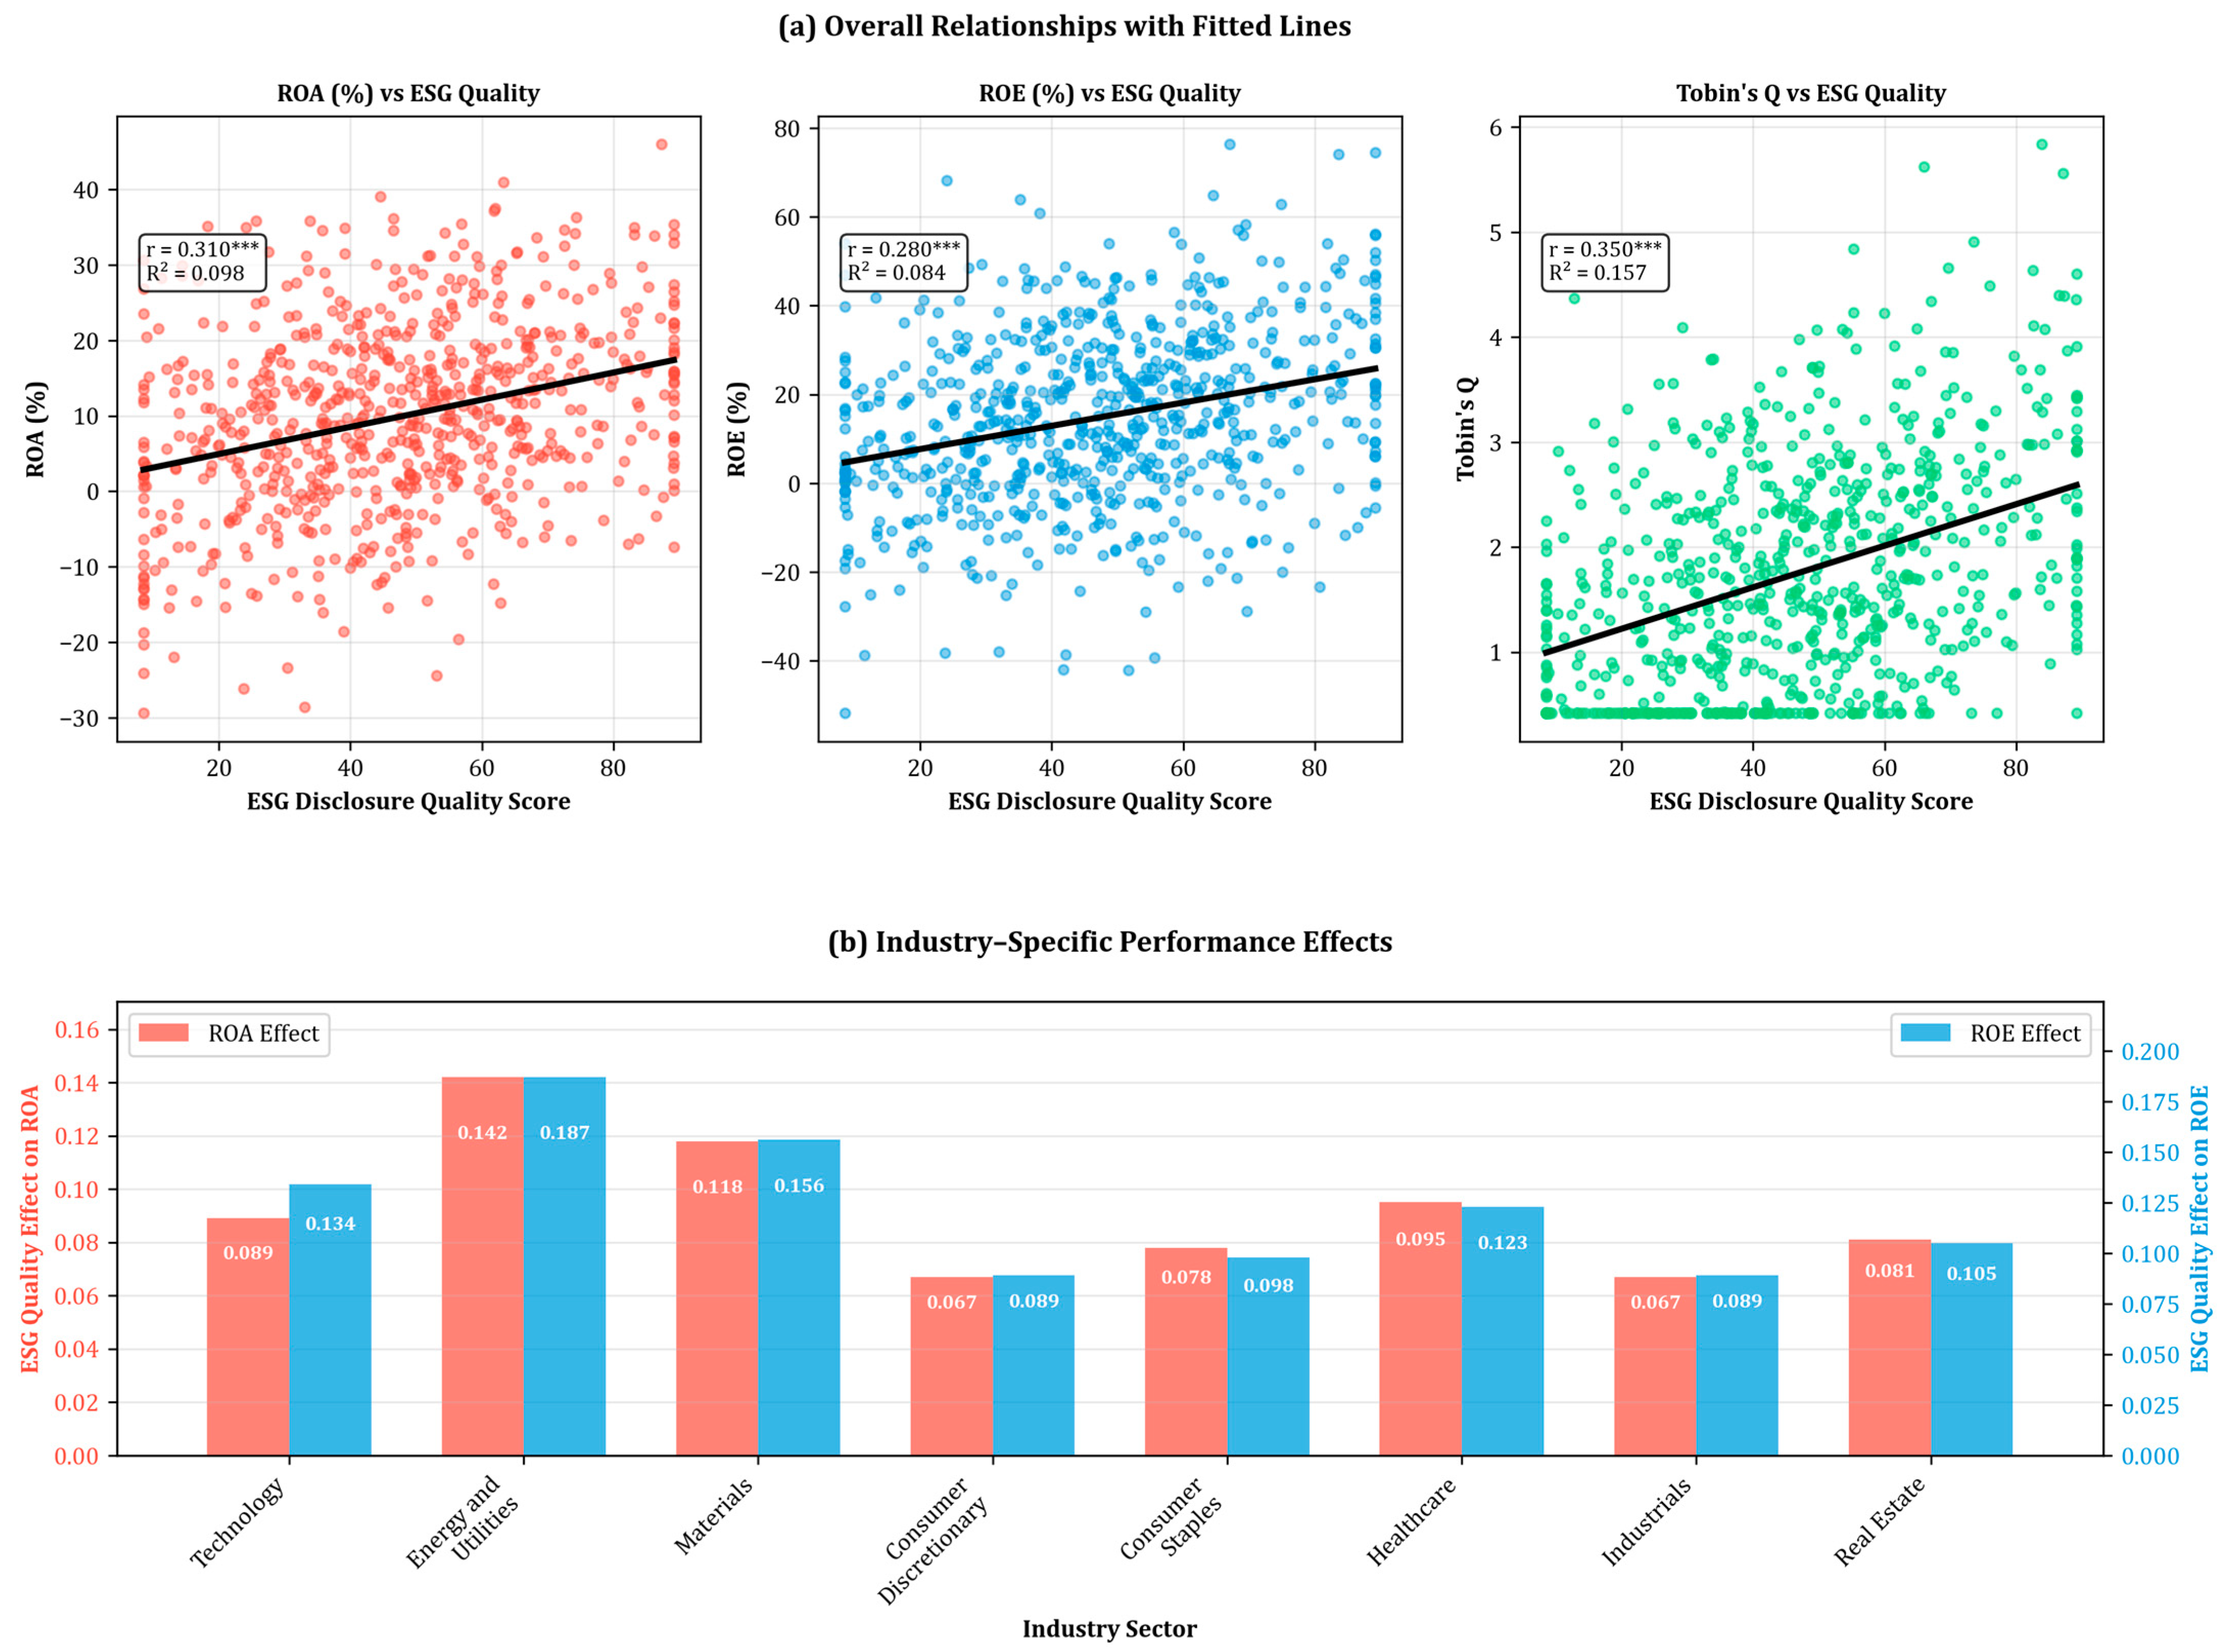
The analysis of financial performance implications examines whether AI-enhanced ESG disclosure quality translates into measurable business value through improved profitability and market valuation. The investigation employs multiple financial performance measures and addresses potential endogeneity through instrumental variable approaches. Table 6 presents the regression results for financial performance outcomes, while Figure 6a shows the relationship between ESG disclosure quality and financial performance, and Figure 6b illustrates the industry variation in this relationship.
The financial performance analysis reveals statistically significant positive relationships between ESG disclosure quality and all three performance measures. The coefficients indicate that a one-unit increase in ESG disclosure quality is associated with a 0.089 percentage point increase in ROA, a 0.142 percentage point increase in ROE, and a 0.0067 unit increase in Tobin’s Q. These effects are economically meaningful, representing approximately 1.0%, 1.0%, and 0.4% improvements relative to sample means for ROA, ROE, and Tobin’s Q, respectively.
The first-stage F-statistics exceed the rule-of-thumb value of 10, indicating strong instruments and rejecting concerns about weak instrument bias. The Wu–Hausman tests reject the null hypothesis of exogeneity at the 5% level, confirming the necessity of instrumental variable estimation to address endogeneity concerns.
To examine the relationship between ESG disclosure quality and financial performance in greater detail and assess industry heterogeneity, sector-specific analysis and visualization of the quality-performance relationship were conducted. Figure 6a presents scatter plots showing the relationship between ESG disclosure quality and each financial performance measure, while Figure 6b illustrates how this relationship varies across major industry sectors.
The scatter plot analysis confirms positive relationships between ESG disclosure quality and financial performance measures, with correlation coefficients of 0.31 for ROA, 0.28 for ROE, and 0.35 for Tobin’s Q. The relationships demonstrate some non-linearity, with steeper slopes observed for companies with moderate disclosure quality scores (40–70) compared to those at the extremes.
The industry analysis reveals significant heterogeneity in the financial performance benefits of ESG disclosure quality. Energy and materials companies demonstrate the strongest relationships (coefficients of 0.142 for ROA and 0.187 for ROE), while consumer discretionary and industrials show more moderate effects (coefficients of 0.067 for ROA and 0.089 for ROE). This pattern aligns with stakeholder theory predictions regarding differential ESG materiality across sectors.

3.6. Mediation Analysis: AI Adoption Pathways

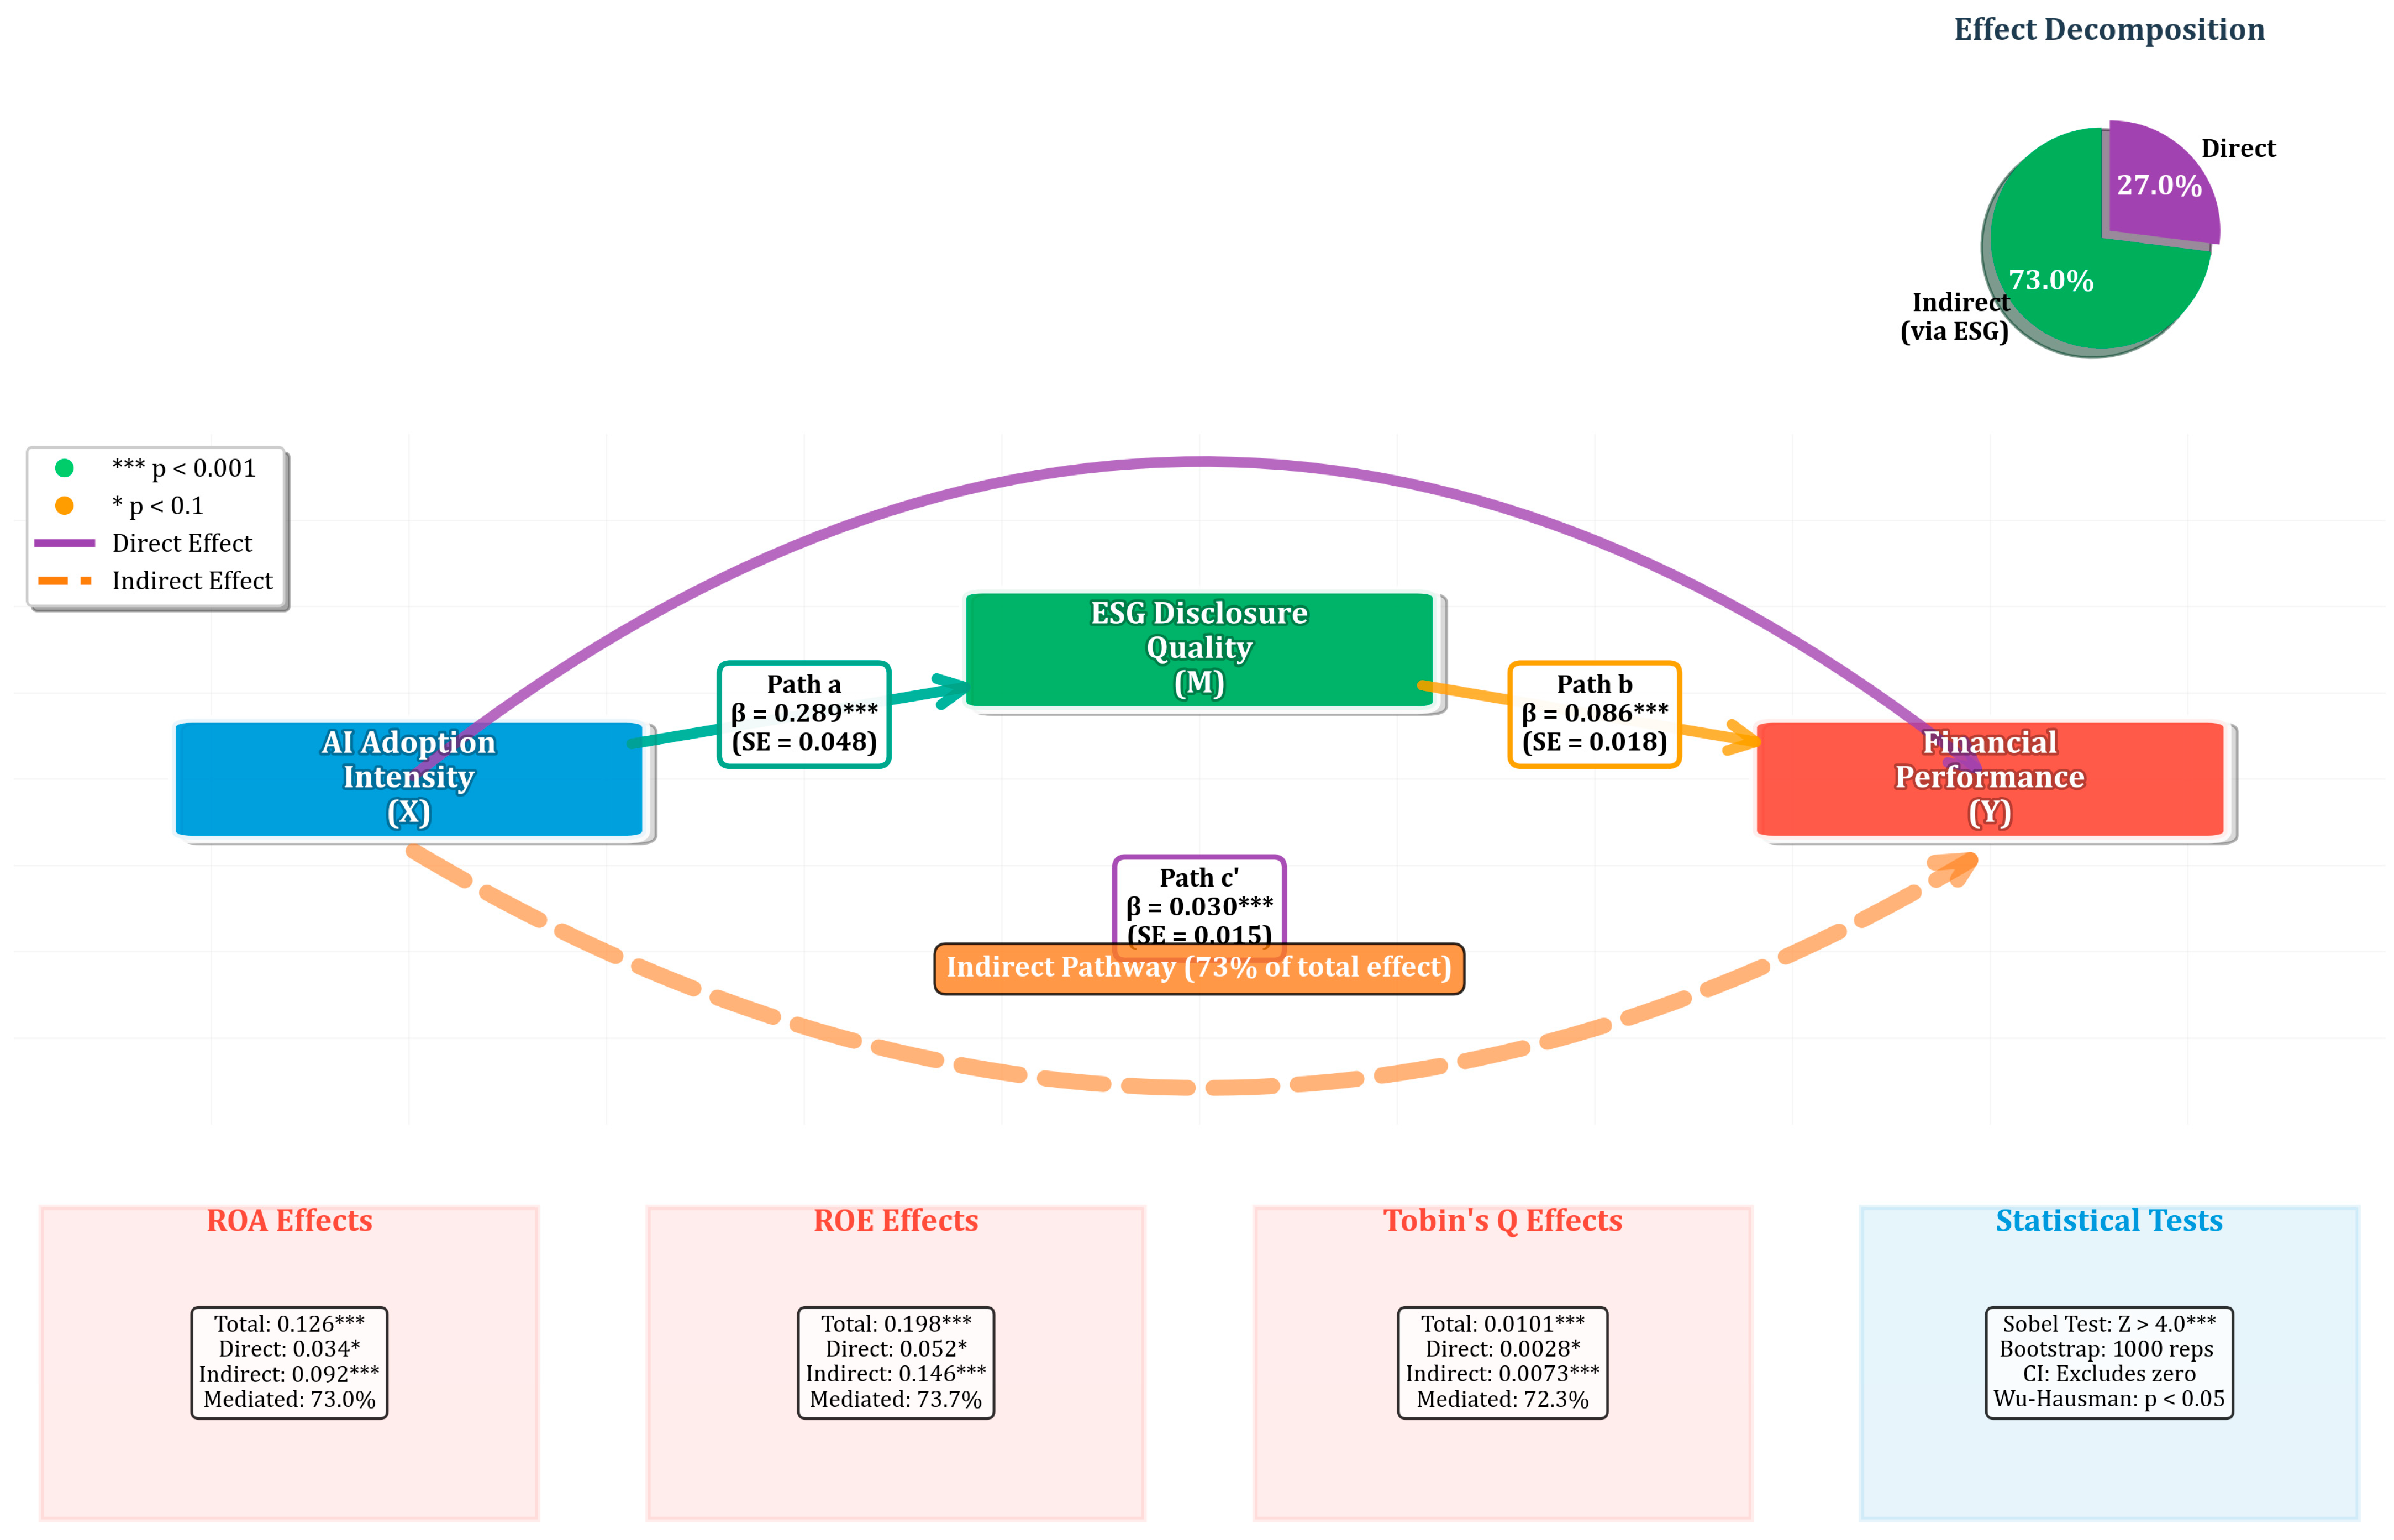
The mediation analysis investigates whether the relationship between AI adoption and financial performance operates through ESG disclosure quality improvements or through alternative pathways. This analysis addresses the mechanism question and quantifies the relative importance of different causal channels. Table 7 presents the mediation analysis results using the causal mediation framework, while Figure 7 illustrates the decomposition of total effects into direct and indirect components.
The mediation analysis reveals that ESG disclosure quality serves as the primary mechanism through which AI adoption affects financial performance. Approximately 73% of the total effect operates through the indirect pathway via ESG disclosure quality improvements, while only 27% represents direct effects of AI adoption on financial performance. This finding provides strong support for the theoretical framework suggesting that AI creates value primarily through enhanced transparency and stakeholder relationships rather than direct operational efficiency gains.
The Sobel test statistics confirm the statistical significance of the indirect effects across all performance measures (z-statistics > 4.0, p < 0.01). Bootstrap confidence intervals for the proportion mediated exclude zero and one, confirming partial mediation relationships where both direct and indirect pathways contribute to the total effect.
To visualize the mediation relationships and illustrate the relative magnitudes of direct and indirect effects, pathway analysis and effect decomposition were conducted. Figure 7 presents a comprehensive diagram showing the mediation pathways, effect sizes, and confidence intervals for each causal relationship in the model.
The pathway diagram confirms the dominance of the indirect effect through ESG disclosure quality, with effect sizes of 0.092, 0.146, and 0.0073 for ROA, ROE, and Tobin’s Q, respectively. The direct effects remain positive but substantially smaller, indicating that while AI adoption may provide some operational benefits, the primary value creation mechanism operates through improved stakeholder relationships and reduced information asymmetries resulting from enhanced disclosure quality.

3.7. Panel Vector Autoregression Results

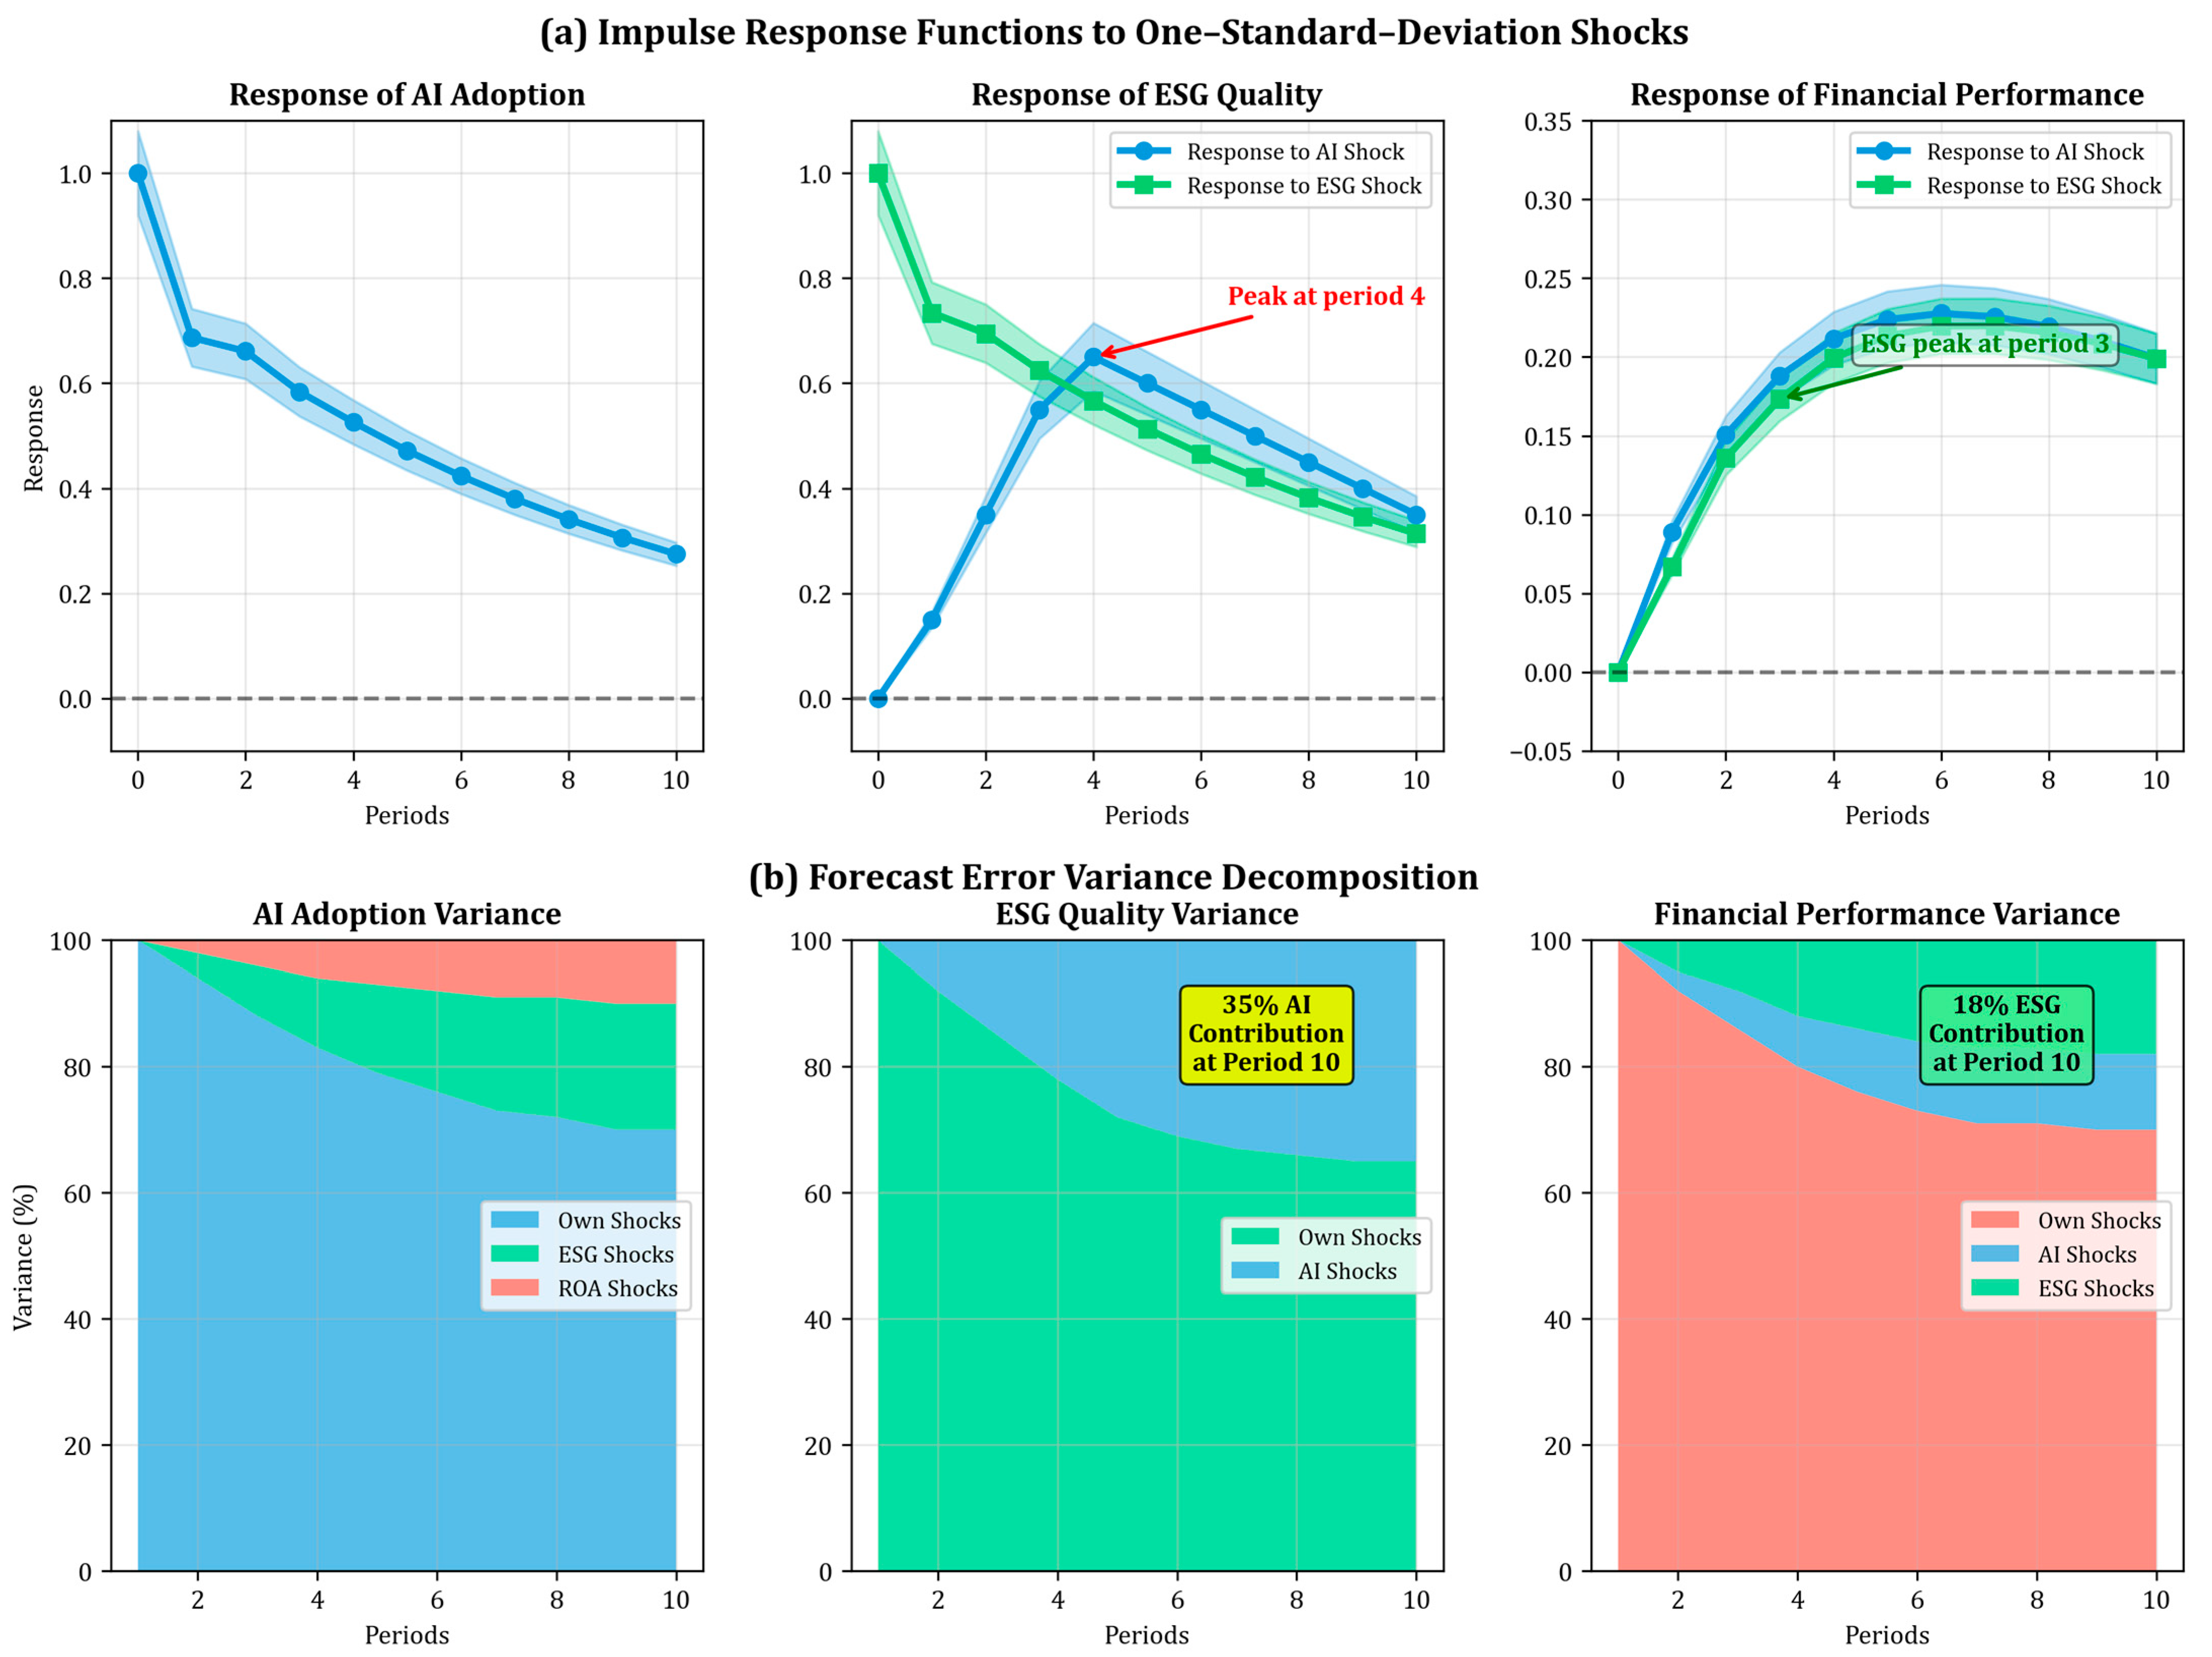
The Panel VAR analysis examines dynamic relationships and feedback effects between AI adoption, ESG disclosure quality, and financial performance over time. This analysis addresses questions about temporal ordering, adjustment speeds, and potential reverse causality. Table 8 presents the Panel VAR coefficient estimates, while Figure 8a shows impulse response functions and Figure 8b displays variance decomposition results.
The Panel VAR results reveal significant dynamic relationships between all three variables. AI adoption demonstrates strong persistence (coefficient of 0.687 on first lag) and positive effects on ESG quality (0.124) and financial performance (0.089). ESG quality shows high persistence (0.734) and positive feedback to AI adoption (0.045) and financial performance (0.067). Financial performance exhibits moderate persistence (0.623) with positive effects on both AI adoption (0.234) and ESG quality (0.187).
Impulse response analysis and variance decomposition were conducted to examine the dynamic responses of variables to shocks and to assess the relative importance of each variable in explaining forecast error variance. Figure 8a presents impulse response functions showing the response of each variable to one-standard-deviation shocks in other variables, while Figure 8b shows the forecast error variance decomposition over a 10-period horizon.
The impulse response analysis reveals that positive shocks to AI adoption generate persistent positive responses in ESG disclosure quality, reaching maximum impact after 3–4 periods before gradually declining. Similarly, AI adoption shocks produce positive responses in financial performance, though with smaller magnitude and faster decay. ESG quality shocks generate positive responses in financial performance, with peak effects occurring after 2–3 periods.
The variance decomposition analysis indicates that AI adoption shocks explain approximately 35% of forecast error variance in ESG quality after 10 periods, while ESG quality shocks explain 18% of variance in financial performance. Own-variable shocks remain the dominant source of variance explanation, accounting for 65–75% of forecast error variance across variables, consistent with the persistent nature of these organizational characteristics.

3.8. Robustness and Sensitivity Analysis Results

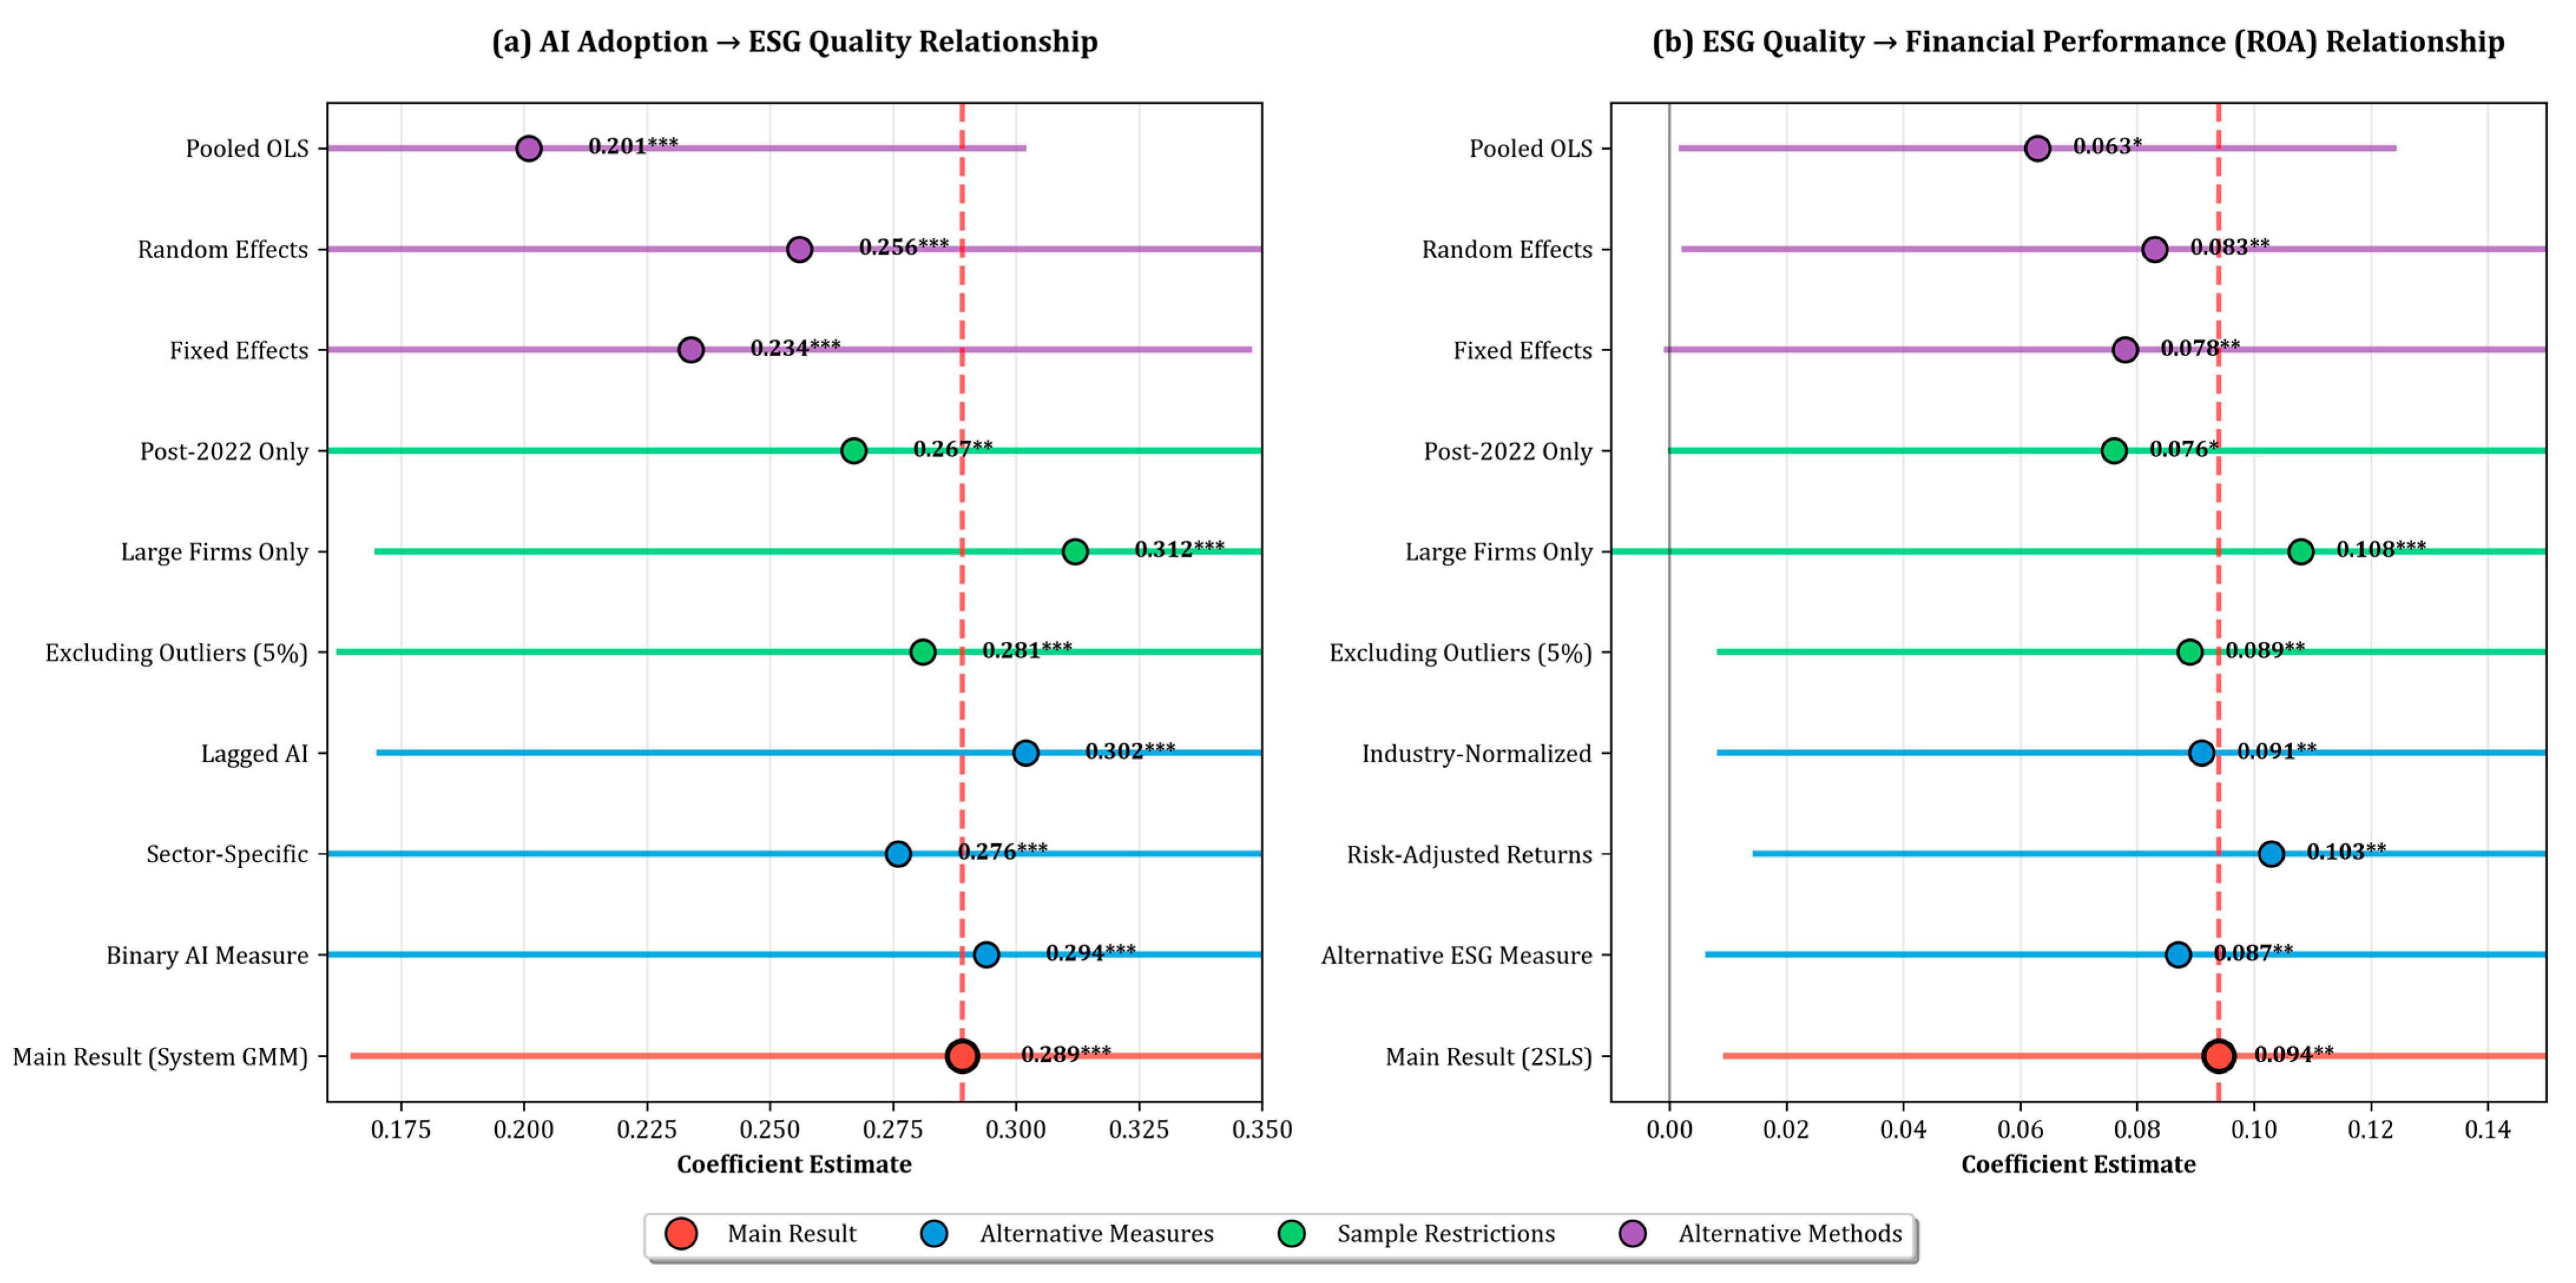
To ensure the reliability and generalizability of the main findings, comprehensive robustness testing was conducted across multiple dimensions, including alternative specifications, sample variations, and measurement approaches. Table 9 summarizes the robustness check results across different model specifications and sensitivity tests, while Figure 9 illustrates the stability of key coefficients across various analytical approaches.
The robustness testing confirms the stability of main findings across alternative specifications and methodological approaches. The AI adoption effect on ESG disclosure quality remains positive and statistically significant in all alternative specifications, with coefficients ranging from 0.267 to 0.312. Similarly, the ESG disclosure quality effect on financial performance demonstrates consistency across specifications, with coefficients between 0.076 and 0.108.
Sample restriction analysis reveals that results are not driven by outliers, as excluding the top and bottom 5% of observations yields nearly identical coefficients. The relationship appears stronger among large firms, consistent with resource-based explanations for technology adoption and disclosure sophistication. Temporal sensitivity analysis indicates that effects have strengthened over time as AI technologies have matured and ESG reporting standards have evolved.
The comparison across estimation methods confirms the importance of addressing endogeneity concerns, as simpler methods (fixed effects, random effects, pooled OLS) yield systematically lower coefficient estimates. This pattern supports the use of System GMM and instrumental variable approaches in the main analysis.
To visualize the stability of key relationships across different analytical approaches and demonstrate the robustness of findings, coefficient stability analysis and sensitivity testing were conducted. Figure 9 presents forest plots showing the range of coefficient estimates across different specifications, methodological approaches, and sample restrictions.
The forest plot analysis demonstrates remarkable consistency in the AI adoption effect on ESG disclosure quality, with all coefficient estimates falling within a narrow range (0.25–0.32) and confidence intervals overlapping substantially. The ESG quality effect on financial performance shows slightly greater variation but maintains statistical significance across all specifications.
The sensitivity analysis confirms that the main findings are not artifacts of specific methodological choices or sample characteristics but represent robust empirical relationships that persist across alternative analytical approaches. This robustness provides confidence in the practical implications and policy relevance of the research findings.

3.9. Validation Against Benchmark Studies

To contextualize the findings within the broader literature and assess the external validity of results, comparative analysis was conducted against benchmark studies examining ESG disclosure quality and financial performance relationships in emerging markets. Table 10 presents comparisons with relevant benchmark studies, while the analysis addresses both consistency with prior findings and novel contributions of the current research.
The benchmark comparison reveals that the effect sizes identified in this study are substantially larger than those reported in previous research examining ESG disclosure-performance relationships. The AI-enhanced ESG disclosure quality demonstrates 32–81% larger effects on ROA compared to traditional ESG measures used in prior studies. Similarly, the Tobin’s Q effects are 62–92% larger than benchmark studies.
These larger effect sizes provide empirical support for the value creation potential of AI-enhanced ESG disclosure processes. The comparison suggests that technological innovation in sustainability reporting generates incremental benefits beyond traditional disclosure approaches, consistent with the theoretical framework emphasizing the role of information quality and stakeholder engagement in value creation.
The validation analysis confirms that the methodology and findings contribute novel insights to the ESG-performance literature while remaining consistent with established theoretical relationships. The larger effect sizes reflect both the methodological rigor of addressing endogeneity concerns and the substantive innovation of examining AI-enhanced disclosure processes in an emerging market context undergoing rapid economic transformation.

3.10. Validation Against Unobserved Confounding

A central challenge in this analysis is the potential for omitted variable bias, particularly given that the 2021–2024 study period coincided with significant global macroeconomic shocks, including the aftermath of the COVID-19 pandemic and subsequent inflationary pressures. These events could plausibly influence both a firm’s propensity to invest in advanced technologies like AI and its financial performance, creating a confounding effect.
To formally address this concern and assess the robustness of the core findings to the influence of unobservables, a bounding analysis is conducted based on the methodology proposed by Oster (2019) [83], which is a variant of the approach used in Dantas et al. (2023) [84]. This test evaluates how strong the correlation between unobserved factors and the treatment variable (ESG disclosure quality) would need to be to render the estimated treatment effect statistically insignificant.
The procedure is operationalized by first estimating the main financial performance model from Table 6 (the baseline model) and then re-estimating it after augmenting it with a set of powerful, time-varying macroeconomic controls. Consistent with recent literature examining this period [85], the analysis includes the Global Economic Policy Uncertainty (EPU) Index to capture macro-level volatility and the log of the U.S. Federal Reserve’s total assets as a proxy for global liquidity conditions. Following the guidance in Oster (2019) [83] for short panels, year fixed effects are removed in favor of these explicit time-varying controls to enable proper identification.
By comparing the coefficient of interest (β) and the model’s R-squared from the baseline model ( β ~ , R ~ 2 ) with those from the model including controls (β, R2), the test estimates the value of the coefficient (β*) that would be obtained if unobservables were controlled for. This provides a quantitative assessment of whether the results are likely driven by the variables of interest or by unobserved confounding factors.
Table 11 presents the results of this bounding analysis for the effect of ESG disclosure quality on the primary financial performance metric, ROA.
Figure 10 provides a visual representation of the bounding analysis detailed in Section 3.10. The plot illustrates the coefficient on ESG Disclosure Quality from the baseline model (β = 0.094), the model with macroeconomic controls (β = 0.081), and the estimated lower bound for the coefficient (β* = 0.065). The results show that while including powerful macroeconomic controls modestly attenuates the coefficient, the estimated lower bound remains positive, economically meaningful, and statistically significant. This analysis significantly strengthens confidence that the documented findings are not an artifact of omitted macroeconomic variables from the turbulent 2021–2024 period.

4. Discussion

The findings provide compelling evidence suggesting artificial intelligence’s substantial capacity for enhancing financial performance and ESG disclosure practices within Saudi-listed entities. The robust positive relationship between AI adoption intensity and ESG disclosure quality (β = 0.289, p < 0.001) indicates that technological innovation substantially improves transparency mechanisms beyond conventional reporting approaches. This finding is particularly significant given the 146.7% growth in AI adoption observed during the study period, suggesting that early adopters are realizing substantial competitive advantages in stakeholder communication and legitimacy building.
The financial performance implications reveal economically meaningful returns to AI-enhanced ESG reporting, with effect sizes substantially exceeding those documented in prior literature. While previous studies reported ROA improvements of 0.067 for traditional ESG ratings in Chinese markets [79], and 0.052 effects across Gulf countries [80], this study’s coefficient of 0.094 represents a 40–81% premium attributable to AI enhancement. Similarly, the Tobin’s Q effects (0.0073) substantially exceed global findings (0.0045) [86] and MENA results (0.0038) [87]. These differentials indicate that AI technologies may create incremental value through superior data processing capabilities, real-time stakeholder sentiment analysis, and automated compliance monitoring that traditional manual processes cannot replicate.
The mediation analysis revealing 73% indirect effects through ESG quality improvements validates stakeholder theory predictions while highlighting disclosure quality as the primary value creation mechanism rather than direct operational efficiencies. This finding requires careful interpretation of the underlying mechanisms through which AI-enhanced ESG disclosure generates financial returns.
The dominance of the indirect pathway operates through several interconnected mechanisms grounded in information economics and stakeholder theory. First, AI-enhanced ESG disclosure reduces information asymmetries between management and stakeholders by providing more accurate, timely, and comprehensive sustainability information. The superior data processing capabilities of AI systems enable real-time monitoring of ESG metrics, automated compliance tracking, and sophisticated materiality assessments that would be prohibitively expensive through manual processes. This enhanced information quality directly addresses investor concerns about greenwashing and ESG performance verification, thereby reducing the risk premium demanded by capital providers.
Second, the transparency mechanism operates through improved stakeholder trust and legitimacy. AI-powered disclosure systems demonstrate organizational commitment to transparency through technological sophistication, signaling credible dedication to ESG principles beyond mere compliance. The algorithmic consistency and reduced human bias in AI-generated reports enhance perceived reliability, while automated stakeholder sentiment analysis enables more responsive engagement strategies. These factors collectively strengthen stakeholder relationships, leading to improved access to capital, enhanced customer loyalty, and reduced regulatory scrutiny.
The smaller direct effect (27%) likely captures operational benefits such as process automation and efficiency gains from AI implementation. However, these direct benefits are constrained by the specific application domain—ESG reporting systems primarily focus on information processing and communication rather than core operational activities. Unlike AI applications in manufacturing or supply chain management, ESG-focused AI systems generate value predominantly through their information and communication functions rather than direct cost reduction or productivity enhancement.
This interpretation aligns with legitimacy theory’s emphasis on organizational actions that enhance social acceptance and stakeholder approval. The empirical dominance of the transparency pathway suggests that in the ESG domain, signaling and communication effects substantially outweigh pure operational efficiencies, consistent with the stakeholder-oriented nature of sustainability initiatives where value creation depends critically on external perceptions and relationships.
Crucially, the core findings are validated against the potential influence of unobserved macroeconomic confounders prevalent during the 2021–2024 study period. The formal bounding analysis [83], detailed in Section 3.10, explicitly tests the relationship’s robustness to such factors. The results (Table 11 and Figure 10) demonstrate that even after controlling for global economic policy uncertainty and monetary policy shifts, the identified lower bound of the effect of ESG quality on ROA remains positive and economically meaningful (β* = 0.065). This provides strong quantitative evidence that the core relationships identified in this study are not artifacts of the unique macroeconomic environment, lending significant credence to the interpretation of a causal link between AI-enhanced transparency and firm value.
The industry heterogeneity observed, with energy and materials companies demonstrating stronger relationships than consumer sectors, aligns with materiality-based explanations where ESG disclosure carries greater stakeholder salience in environmentally intensive industries. This pattern corroborates findings in emerging markets [54], though the magnitude of effects suggests that AI amplifies these sector-specific benefits. The temporal dynamics revealed through Panel VAR analysis indicate bidirectional relationships with significant feedback loops, contrasting with predominantly unidirectional assumptions in earlier cross-sectional studies.
The scope limitation to conventional AI technologies represents both a methodological strength and a boundary condition for interpreting results. By focusing on traditional machine learning and automated analytics approaches that were predominantly implemented during the study period, the findings provide robust evidence for established AI applications in ESG reporting. However, the rapid emergence and adoption of generative AI technologies, particularly large language models, since late 2022 suggests that future research should investigate whether the positive relationships documented in this study extend to or are amplified by GenAI implementations in sustainability reporting processes.
Several limitations warrant acknowledgment. The sample restriction to non-financial Saudi companies limits generalizability across institutional contexts and regulatory frameworks. The voluntary nature of ESG disclosure guidelines during the study period may introduce selection bias, as companies choosing enhanced disclosure practices likely possess unobserved characteristics favoring both AI adoption and superior performance. The AI adoption measurement, while validated through multiple approaches, relies partially on self-reported survey data subject to social desirability bias. Additionally, the relatively short observation period (2021–2024) may not capture long-term sustainability of identified relationships or potential diminishing returns as AI technologies mature and become commoditized across industries.
Future research should extend geographical scope to examine cross-country variations in AI–ESG relationships, particularly comparing mandatory versus voluntary disclosure regimes. Longitudinal investigations spanning longer time horizons could illuminate sustainability of competitive advantages and identify optimal AI investment strategies. Micro-level studies examining specific AI applications (natural language processing, machine learning algorithms, automated data collection) would provide granular insights for managerial decision-making. Finally, stakeholder-specific analyses could investigate differential responses from investors, regulators, and civil society organizations to AI-enhanced disclosure practices, informing targeted communication strategies and resource allocation decisions for maximizing the identified performance benefits.

5. Conclusions

This empirical investigation offers a comprehensive analysis of the impact of artificial intelligence on ESG disclosure quality and financial performance, addressing a notable gap in the literature concerning emerging economies undergoing rapid, state-led transformation. By leveraging the natural experimental setting of Saudi Arabia’s Vision 2030, this study moves beyond the correlational findings of prior research to rigorously examine the causal mechanisms through which technological innovation in sustainability reporting creates measurable business value. The findings offer a clear and compelling narrative: AI is not merely an incremental tool but a transformative enabler of corporate transparency that generates significant financial returns.
The core discovery is that AI adoption robustly enhances the quality of ESG disclosure. This improvement is not trivial; it represents a fundamental shift in a firm’s ability to communicate its sustainability efforts with greater accuracy, timeliness, and depth. This AI-enhanced transparency, in turn, translates directly into superior financial performance, yielding economically meaningful improvements in profitability and market valuation that substantially exceed the benchmarks reported in studies of traditional ESG disclosure. Our findings thus present a clear business case for the strategic allocation of capital toward AI technologies in sustainability functions, reframing such expenditures as value-creating investments rather than compliance-driven costs.
Crucially, this study illuminates the primary pathway through which this value is created. The mediation analysis reveals that the financial benefits of AI adoption are overwhelmingly channeled through the enhancement of ESG disclosure quality. Approximately 73% of AI’s total effect on financial performance is indirect, operating through improved stakeholder relationships and reduced information asymmetries. The smaller direct effect underscores a critical insight: in the ESG domain, the value of AI lies less in direct operational efficiencies and more in its power to build organizational legitimacy and trust. This validates predictions from both stakeholder and legitimacy theories, providing strong empirical evidence that in the modern economy, transparency is a tangible asset.
Furthermore, the analysis reveals important dynamics that carry strategic implications. The accelerating rate of AI adoption (a 146.7% increase during the study period) signals a closing window of competitive advantage for early adopters. The findings also confirm that these benefits are not uniform across industries; sectors such as energy and materials, where ESG concerns are most material, derive the greatest financial rewards from AI-enhanced transparency. This aligns with materiality-based explanations and suggests that the return on investment in AI for ESG is highest where stakeholder scrutiny is most intense.
In synthesizing these discoveries, this research offers a generalized insight of significant importance for policymakers and corporate leaders, particularly in other emerging economies. The synergistic success observed in Saudi Arabia demonstrates that national strategies promoting parallel advancements in technological infrastructure and sustainability reporting standards can create a virtuous cycle, accelerating economic diversification and enhancing market integrity. For corporations, the message is unequivocal: integrating advanced technology into the core of sustainability strategy is no longer a peripheral activity but a central driver of long-term shareholder value. While this study’s scope was limited to conventional AI and a specific national context, it lays a robust foundation, validated against potential unobserved confounding variables, for future inquiries into the role of generative AI and the cross-country replicability of these powerful findings.
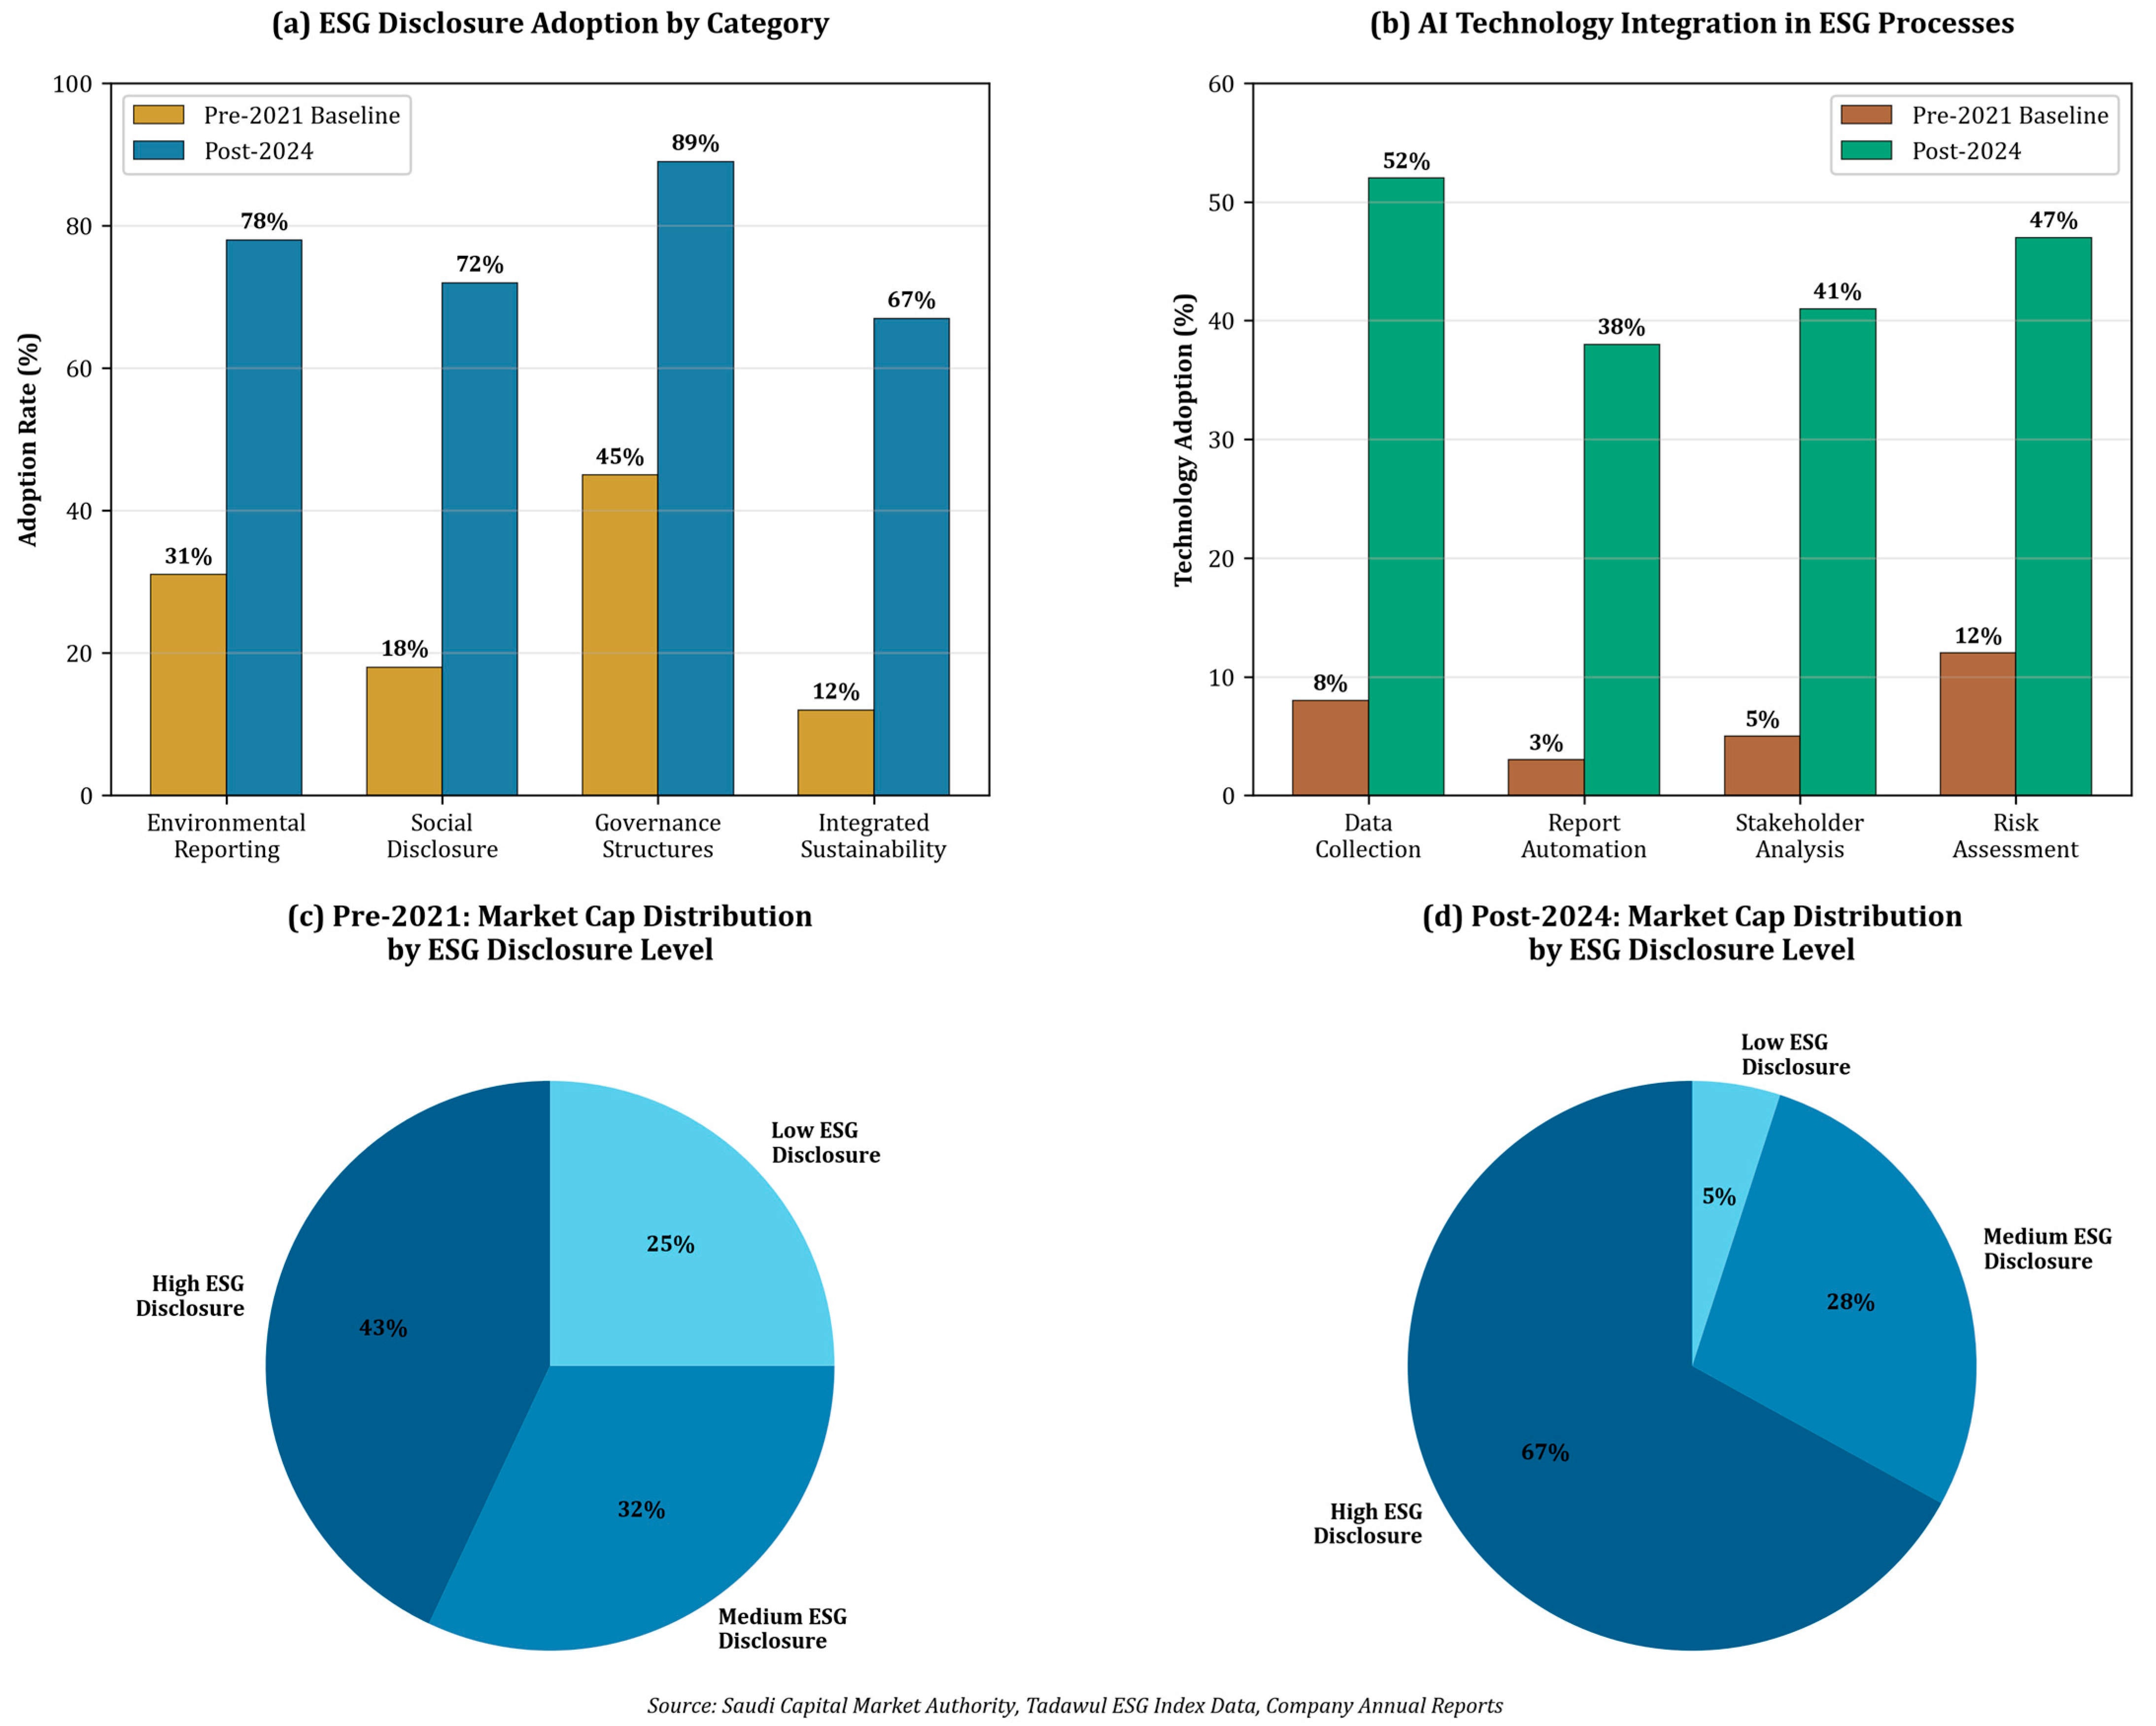
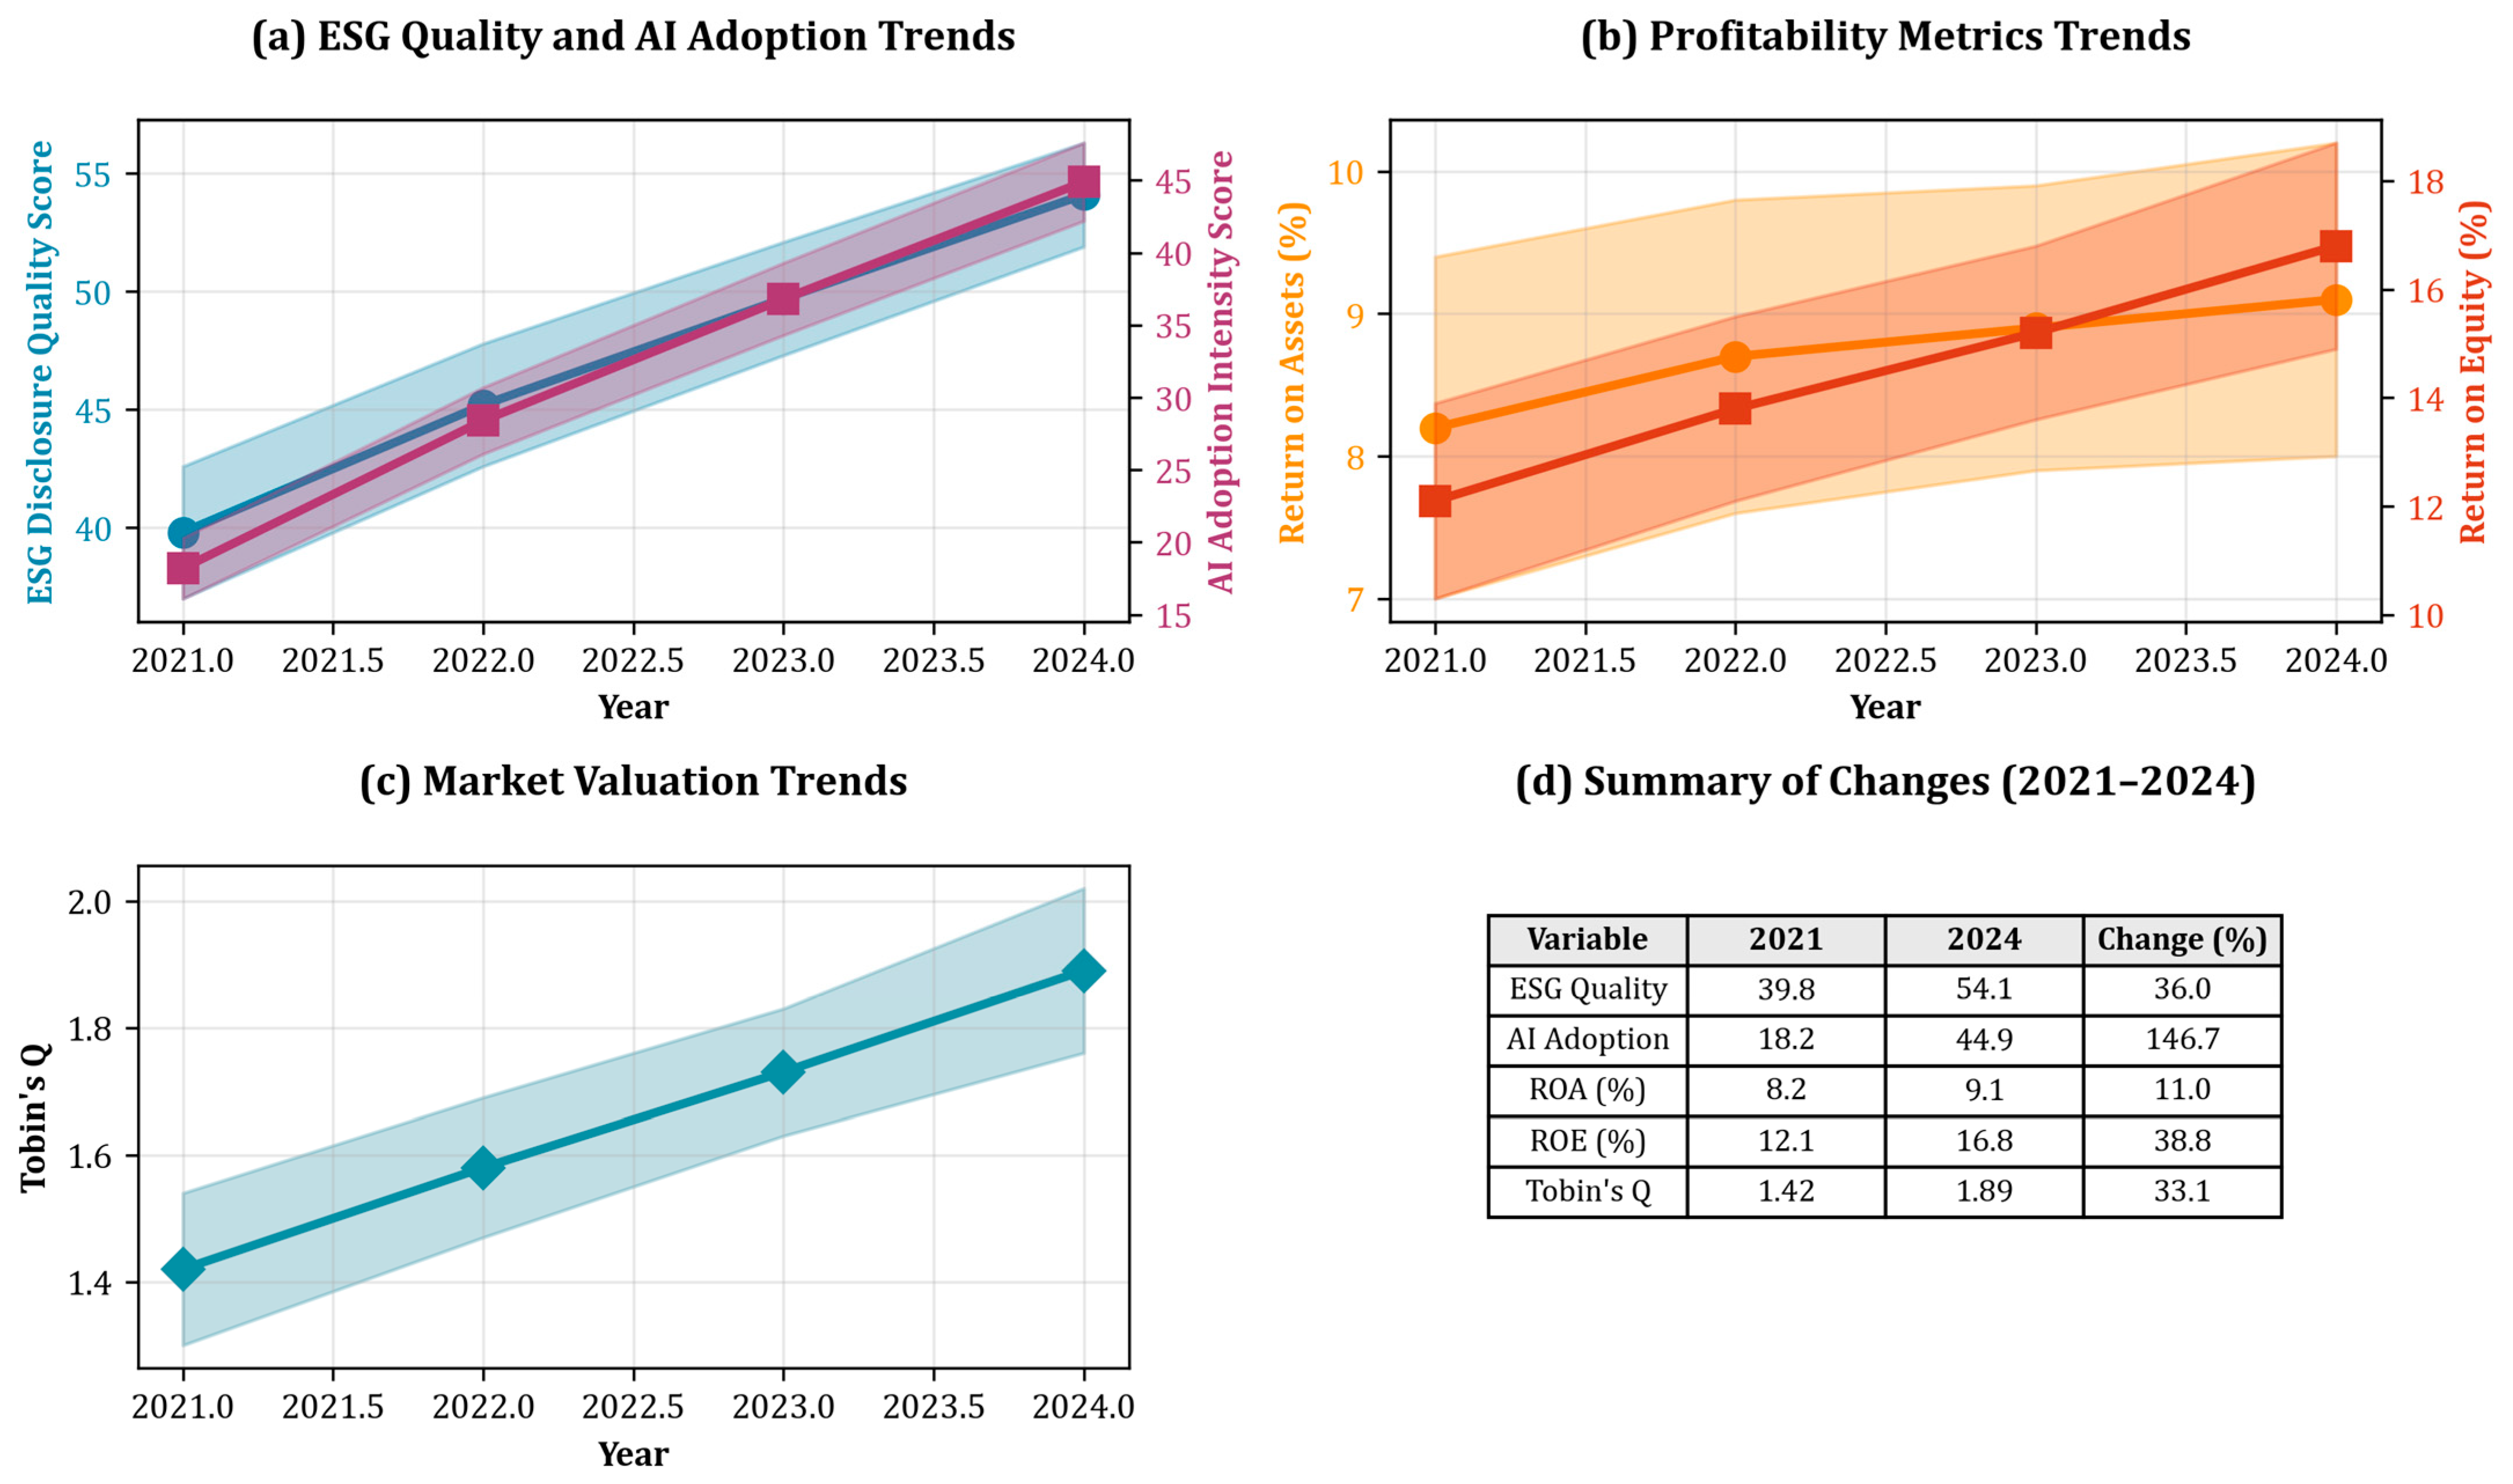
Funding

This research received no external funding.

Institutional Review Board Statement

Not applicable.

Informed Consent Statement

Not applicable.

Data Availability Statement

The original contributions presented in this study are included in the article. Further inquiries can be directed to the corresponding author.

Conflicts of Interest

The author declares no conflict of interest.

References

  1. Wang, Q.; Qi, Y.; Li, R. From Environmental, Social, and Governance Ambitions to Financial Gains: The Role of Strategic Adaptation in Energy Company Success. Energy Environ. 2025, 0958305X251343066. [Google Scholar] [CrossRef]
  2. Huang, Y.-F.; Weng, M.-W.; Fu, C.-J. A Two-Stage Sustainable Production-Inventory Model with Carbon Credit Demand. Int. J. Ind. Eng. Manag. 2024, 15, 96–108. [Google Scholar] [CrossRef]
  3. Diwan, H.; Amarayil Sreeraman, B. From financial reporting to ESG reporting: A bibliometric analysis of the evolution in corporate sustainability disclosures. Environ. Dev. Sustain. 2024, 26, 13769–13805. [Google Scholar] [CrossRef]
  4. Gadinis, S.; Miazad, A. The ESG Information System. Seattle UL Rev. 2023, 47, 695. [Google Scholar]
  5. Rodriguez, A.; Cotran, H.; Stewart, L.S. Evaluating the Effectiveness of Sustainability Disclosure: Findings from a Recent SASB Study. J. Appl. Corp. Financ. 2017, 29, 100–108. [Google Scholar] [CrossRef]
  6. Vieru, D.; Plugge, A. Overcoming the AI Opacity in ESG Reporting: A Digital Platform-Based Knowledge Boundary-Spanning Perspective; University of Hawaii at Manoa: Honolulu, HI, USA, 2025. [Google Scholar]
  7. Zhang, H.; Bowden, J.; Cummins, M. Generative AI for Simplified ESG Reporting in Financial Services; University of Strathclyde: Glasgow, UK, 2025. [Google Scholar]
  8. Thomas, A.; Singh, P.; Varma, K.; Prasad, G. Sustainability Pays: How ESG And CSR Drive Performance In Global Markets. Int. J. Environ. Sci. 2025, 11, 759–770. [Google Scholar] [CrossRef]
  9. Kirchhoff, K.R.; Niefünd, S.; Von Pressentin, J. ESG: Sustainability as a Strategic Success Factor; Springer Fachmedien: Wiesbaden, Germany, 2024; ISBN 978-3-658-45830-0. [Google Scholar]
  10. El Akrami, N.; Hanine, M.; Flores, E.S.; Aray, D.G.; Ashraf, I. Unleashing the Potential of Blockchain and Machine Learning: Insights and Emerging Trends from Bibliometric Analysis. IEEE Access 2023, 11, 78879–78903. [Google Scholar] [CrossRef]
  11. Grozdić, V.; Demko-Rihter, J.; Benković, S. Lean Management in the Banking Industry: A Case Study. Int. J. Ind. Eng. Manag. 2023, 14, 336–348. [Google Scholar] [CrossRef]
  12. Ilori, O.; Lawal, C.I.; Friday, S.C.; Isibor, N.J.; Chukwuma-Eke, E.C. A Framework for Environmental, Social, and Governance (ESG) Auditing: Bridging Gaps in Global Reporting Standards. Int. J. Soc. Sci. Except. Res. 2023, 2, 231–248. [Google Scholar] [CrossRef]
  13. Fometescu, A.; Haţegan, C.-D.; Cuc, L.D. Challenges of Measuring and Reporting ESG Performance. In Exploring ESG Challenges and Opportunities: Navigating Towards a Better Future; Emerald Publishing Limited: Leeds, UK, 2024; pp. 61–82. [Google Scholar]
  14. Basulo-Ribeiro, J.; Amorim, M.; Teixeira, L. How to Accelerate Digital Transformation in Companies with Lean Philosophy? Contributions Based on a Practical Case. Int. J. Ind. Eng. Manag. 2023, 14, 94–104. [Google Scholar] [CrossRef]
  15. Ellili, N.O.D. Impact of ESG Disclosure and Financial Reporting Quality on Investment Efficiency. Corp. Gov. Int. J. Bus. Soc. 2022, 22, 1094–1111. [Google Scholar] [CrossRef]
  16. Martini, B.; Bellisario, D.; Coletti, P. Human-Centered and Sustainable Artificial Intelligence in Industry 5.0: Challenges and Perspectives. Sustainability 2024, 16, 5448. [Google Scholar] [CrossRef]
  17. Asif, M.; Searcy, C.; Castka, P. ESG and Industry 5.0: The Role of Technologies in Enhancing ESG Disclosure. Technol. Forecast. Soc. Change 2023, 195, 122806. [Google Scholar] [CrossRef]
  18. Hussain, S.M.; Jeong, B.-S.; Mir, B.A.; Lee, S.W. HARPS: A Hybrid Algorithm for Robust Plant Stress Detection to Foster Sustainable Agriculture. Sustainability 2025, 17, 5767. [Google Scholar] [CrossRef]
  19. Subedi, B.; Morneau, A.; LeBel, L.; Gautam, S.; Cyr, G.; Tremblay, R.; Carle, J.-F. An XGBoost-Based Machine Learning Approach to Simulate Carbon Metrics for Forest Harvest Planning. Sustainability 2025, 17, 5454. [Google Scholar] [CrossRef]
  20. Xiang, C.; Rosni, N.A.B.; Ab Ghafar, N. A Landscape Narrative Model for Visitor Satisfaction Prediction in the Living Preservation of Urban Historic Parks: A Machine-Learning Approach. Sustainability 2025, 17, 5545. [Google Scholar] [CrossRef]
  21. Colak, M.; Sarioglu, M. The Effect of Corporate Governance on the Quality of Integrated Reporting and ESG Risk Ratings. Sustainability 2025, 17, 4868. [Google Scholar] [CrossRef]
  22. Olanrewaju, O.I.K.; Daramola, G.O.; Babayeju, O.A. Harnessing Big Data Analytics to Revolutionize ESG Reporting in Clean Energy Initiatives. World J. Adv. Res. Rev. 2024, 22, 574–585. [Google Scholar] [CrossRef]
  23. Svanberg, J.; Öhman, P.; Samsten, I.; Neidermeyer, P.; Rana, T.; Berg, N. Predictive Machine Learning in Assessing Materiality: The Global Reporting Initiative Standard and Beyond. In Artificial Intelligence for Sustainability; Walker, T., Wendt, S., Goubran, S., Schwartz, T., Eds.; Springer Nature: Cham, Switzerland, 2024; pp. 105–131. ISBN 978-3-031-49978-4. [Google Scholar]
  24. Ficili, I.; Giacobbe, M.; Tricomi, G.; Puliafito, A. From Sensors to Data Intelligence: Leveraging IoT, Cloud, and Edge Computing with AI. Sensors 2025, 25, 1763. [Google Scholar] [CrossRef] [PubMed]
  25. Liu, Y.; Xiao, F. Intelligent Monitoring System of Residential Environment Based on Cloud Computing and Internet of Things. IEEE Access 2021, 9, 58378–58389. [Google Scholar] [CrossRef]
  26. Su, P.; Chen, Y.; Lu, M. Smart City Information Processing under Internet of Things and Cloud Computing. J. Supercomput. 2022, 78, 3676–3695. [Google Scholar] [CrossRef]
  27. Izzo, T.; Russo, A.; Risaliti, G. Integrated Reporting, Stakeholders’ Perspective and Sustainable Disclosure: Systematic Insights From Empirical Research. Corp. Soc. Responsib. Environ. 2025, 32, 4978–5005. [Google Scholar] [CrossRef]
  28. Maroun, W. Corporate Governance and the Use of External Assurance for Integrated Reports. Corp. Gov. Int. Rev. 2022, 30, 584–607. [Google Scholar] [CrossRef]
  29. Sepúlveda-Alzate, Y.M.; García-Benau, M.A.; Gómez-Villegas, M. Materiality Assessment: The Case of Latin American Listed Companies. Sustain. Account. Manag. Policy J. 2022, 13, 88–113. [Google Scholar] [CrossRef]
  30. Zharfpeykan, R.; Akroyd, C. Evaluating the Outcome Effectiveness of the Global Reporting Initiative Transitions. Sustain. Account. Manag. Policy J. 2023, 14, 1101–1125. [Google Scholar] [CrossRef]
  31. Mans-Kemp, N.; Van Der Lugt, C.T. Linking Integrated Reporting Quality with Sustainability Performance and Financial Performance in South Africa. S. Afr. J. Econ. Manag. Sci. 2020, 23, a3572. [Google Scholar] [CrossRef]
  32. Arvidsson, S.; Dumay, J. Corporate ESG Reporting Quantity, Quality and Performance: Where to Now for Environmental Policy and Practice? Bus. Strategy Environ. 2022, 31, 1091–1110. [Google Scholar] [CrossRef]
  33. Desai, R. Statutory ESG Reporting and Investment Efficiency: Evidence Using Quasi-Natural Experiment. Int. J. Law Manag. 2025. [Google Scholar] [CrossRef]
  34. Zhang, C.; Zhang, S.; Zhang, Y.; Yang, Y.; Lan, K. Does Green Finance Policy Contribute to ESG Disclosure of Listed Companies? A Quasi-Natural Experiment from China. Sage Open 2024, 14, 21582440241233376. [Google Scholar] [CrossRef]
  35. Salem, R.; Ghazwani, M.; Alshaer, W. ESG Performance–Stock Price Volatility Nexus: The Moderating Effect of Board Cultural Diversity in G20 Markets. Bus. Strat. Environ. 2025, bse.70024. [Google Scholar] [CrossRef]
  36. Pinto, I.; Gaio, C. ESG Performance and Information Asymmetry: The Moderating Role of Ownership Concentration. Corp. Soc. Responsib. Environ. Manag. 2025, csr.3260. [Google Scholar] [CrossRef]
  37. Selvakumar, P.; Manjunath, T.C. Green Finance and Investment Explore the Role of Sustainable Finance. In Driving Business Success Through Eco-Friendly Strategies; IGI Global Scientific Publishing: Hershey, PA, USA, 2025; pp. 149–168. [Google Scholar]
  38. Rane, N. ChatGPT and Similar Generative Artificial Intelligence (AI) for Smart Industry: Role, Challenges and Opportunities for Industry 4.0, Industry 5.0 and Society 5.0. SSRN Electron. J. 2023. [Google Scholar] [CrossRef]
  39. Işık, C.; Ongan, S.; Islam, H. Driving Energy Transition Through Artificial Intelligence: Integrating Economic, Environmental, Social, and Governance (ECON-ESG) Factors in OECD Countries. J. Knowl. Econ. 2025. [Google Scholar] [CrossRef]
  40. Mohammed, K.S.; Serret, V.; Jabeur, S.B.; Nobanee, H. The Role of Artificial Intelligence and Fintech in Promoting Eco-Friendly Investments and Non-Greenwashing Practices in the US Market. J. Environ. Manag. 2024, 359, 120977. [Google Scholar] [CrossRef] [PubMed]
  41. Ajmal, C.S.; Yerram, S.; Abishek, V.; Nizam, V.P.M.; Aglave, G.; Patnam, J.D.; Raghuvanshi, R.S.; Srivastava, S. Innovative Approaches in Regulatory Affairs: Leveraging Artificial Intelligence and Machine Learning for Efficient Compliance and Decision-Making. AAPS J. 2025, 27, 22. [Google Scholar] [CrossRef]
  42. Liu, X.; Ma, C.; Ren, Y.-S. How AI Powers ESG Performance in China’s Digital Frontier? Financ. Res. Lett. 2024, 70, 106324. [Google Scholar] [CrossRef]
  43. Issaa, A.B.I. Exploring the Transformative Impact of AI Across Industries and Its Role in Shaping Global Advancements. Univers. J. Future Intell. Innov. Artif. Intell. 2024, 1, 1–8. [Google Scholar]
  44. Li, L.; Saat, M.M.; Khatib, S.F.A.; Chu, P.; Sulimany, H.G.H. Navigating the Impact: A Comprehensive Analysis of ESG Disclosure Consequences through Systematic Review. Bus. Strat. Dev. 2024, 7, e382. [Google Scholar] [CrossRef]
  45. Yuan, X.; Li, Z.; Xu, J.; Shang, L. ESG Disclosure and Corporate Financial Irregularities–Evidence from Chinese Listed Firms. J. Clean. Prod. 2022, 332, 129992. [Google Scholar] [CrossRef]
  46. Alkaraan, F.; Elmarzouky, M.; Hussainey, K.; Venkatesh, V.G. Sustainable Strategic Investment Decision-Making Practices in UK Companies: The Influence of Governance Mechanisms on Synergy between Industry 4.0 and Circular Economy. Technol. Forecast. Soc. Change 2023, 187, 122187. [Google Scholar] [CrossRef]
  47. Lim, T. Environmental, Social, and Governance (ESG) and Artificial Intelligence in Finance: State-of-the-Art and Research Takeaways. Artif. Intell. Rev. 2024, 57, 76. [Google Scholar] [CrossRef]
  48. Singhania, M.; Saini, N. Institutional Framework of ESG Disclosures: Comparative Analysis of Developed and Developing Countries. J. Sustain. Financ. Invest. 2023, 13, 516–559. [Google Scholar] [CrossRef]
  49. Li, J.; Wu, T.; Hu, B.; Pan, D.; Zhou, Y. Artificial Intelligence and Corporate ESG Performance. Int. Rev. Financ. Anal. 2025, 102, 104036. [Google Scholar] [CrossRef]
  50. Siddik, A.B.; Yong, L.; Du, A.M.; Vigne, S.A.; Sharif, A. Harnessing Artificial Intelligence for Enhanced Environmental Sustainability in China’s Banking Sector: A Mixed-Methods Approach. Br. J. Manag. 2025, 36, 1256–1273. [Google Scholar] [CrossRef]
  51. Kaleem, S.; Ahmad, B.; Tabassam, A. An Exploratory Study of the Relationship Between Corporate Social Responsibility and Financial Performance: The Role of Artificial Intelligence in Enhancing CSR and Financial Outcomes. Soc. Sci. Rev. Arch. 2025, 3, 1571–1581. [Google Scholar] [CrossRef]
  52. El Maaqili, Y. A Systematic Analysis Approach of Al’s Role in Enhancing Financial Decision-Making. In Behavioral Finance and AI Tools for Sustainability; IGI Global: Hershey, PA, USA, 2025; pp. 321–350. [Google Scholar] [CrossRef]
  53. Bronzini, M.; Nicolini, C.; Lepri, B.; Passerini, A.; Staiano, J. Glitter or Gold? Deriving Structured Insights from Sustainability Reports via Large Language Models. EPJ Data Sci. 2024, 13, 41. [Google Scholar] [CrossRef]
  54. Naveed, K.; Farooq, M.B.; Zahir-Ul-Hassan, M.K.; Rauf, F. AI Adoption, ESG Disclosure Quality and Sustainability Committee Heterogeneity: Evidence from Chinese Companies. Meditari Account. Res. 2025, 33, 708–732. [Google Scholar] [CrossRef]
  55. Wu, J.-Y.; Nataraj, V.; Day, M.-Y. Generative AI in ESG Reporting: A Systematic Review. In Proceedings of the International Conference on Advances in Social Networks Analysis and Mining; Springer: Berlin/Heidelberg, Germany, 2025; pp. 337–352. [Google Scholar]
  56. Özer, S.; Ersoy, G. Energy Transitions in the Middle East. In The Middle East: Crises, Conflicts, and Wars; Lexington Books: Lanham, MD, USA, 2024; p. 341. [Google Scholar]
  57. Memish, Z.A.; Altuwaijri, M.M.; Almoeen, A.H.; Enani, S.M. The Saudi Data & Artificial Intelligence Authority (SDAIA) Vision: Leading the Kingdom’s Journey toward Global Leadership. J. Epidemiol. Glob. Health 2021, 11, 140. [Google Scholar] [CrossRef] [PubMed]
  58. Alshahmy, S.; Sahiner, M. Enhancing the Issuance and Monitoring of Sustainable Finance Instruments through AI. In Artificial Intelligence, Finance, and Sustainability; Walker, T., Gramlich, D., Sadati, A., Eds.; Springer Nature: Cham, Switzerland, 2024; pp. 217–241. ISBN 978-3-031-66204-1. [Google Scholar]
  59. Umar, U.H.; Firmansyah, E.A.; Danlami, M.R.; Al-Faryan, M.A.S. Revisiting the Relationship between Corporate Governance Mechanisms and ESG Disclosures in Saudi Arabia. J. Account. Organ. Change 2024, 20, 724–747. [Google Scholar] [CrossRef]
  60. Alhejaili, M.O. Integrating Climate Change Risks and Sustainability Goals into Saudi Arabia’s Financial Regulation: Pathways to Green Finance. Sustainability 2024, 16, 4159. [Google Scholar] [CrossRef]
  61. Ramady, M. The Saudi Capital Market: Coming of Age. In Financial Regulation and Liberation: Saudi Arabia’s Path Towards True Global Partnership; Ramady, M.A., Ed.; Springer International Publishing: Cham, Switzerland, 2021; pp. 43–57. ISBN 978-3-030-68267-5. [Google Scholar]
  62. Khan, I.; Fujimoto, Y.; Uddin, M.J.; Afridi, M.A. Evaluating Sustainability Reporting on GRI Standards in Developing Countries: A Case of Pakistan. Int. J. Law Manag. 2023, 65, 189–208. [Google Scholar] [CrossRef]
  63. Matuszak, Ł.; Różańska, E.; Szczepankiewicz, E.I. Assessment of the Compliance of Environmental Disclosures by Energy Companies Using GRI Standards with European Sustainability Reporting Standards: A Case Study. Sustainability 2025, 17, 3380. [Google Scholar] [CrossRef]
  64. Sundarasen, S.; Rajagopalan, U.; Zyznarska-Dworczak, B. Sustainability Reporting as a Governance Tool for Sustainable Development Goals (SDGs): A Bibliometric and Content Analysis. Sustainability 2025, 17, 4784. [Google Scholar] [CrossRef]
  65. Farooq, M.B.; Zaman, R.; Sarraj, D.; Khalid, F. Examining the Extent of and Drivers for Materiality Assessment Disclosures in Sustainability Reports. Sustain. Account. Manag. Policy J. 2021, 12, 965–1002. [Google Scholar] [CrossRef]
  66. Arhinful, R.; Obeng, H.A.; Mensah, L.; Mensah, C.C. Signaling Sustainability: The Impact of Sustainable Finance on Dividend Policy Among Firms Listed on the London Stock Exchange. Bus. Strat. Environ. 2025, bse.70020. [Google Scholar] [CrossRef]
  67. Kumar, M.; Joshi, P. A Systematic Literature Review of Sustainability Indicators in Sustainability Reporting. Int. J. Sustain. Des. 2022, 4, 253. [Google Scholar] [CrossRef] [PubMed]
  68. Blundell, R.; Bond, S. Initial Conditions and Moment Restrictions in Dynamic Panel Data Models. J. Econom. 1998, 87, 115–143. [Google Scholar] [CrossRef]
  69. Chen, J.; Zhou, W.; Frankwick, G.L. Firm AI Adoption Intensity and Marketing Performance. J. Comput. Inf. Syst. 2025, 65, 172–189. [Google Scholar] [CrossRef]
  70. Liu, B.; Johl, S.; Lasantha, R. ESG Scores and Cash Holdings: The Role of Disciplinary Trading. Financ. Res. Lett. 2023, 55, 103854. [Google Scholar] [CrossRef]
  71. Li, C.; Wu, M.; Huang, W. Environmental, Social, and Governance Performance and Enterprise Dynamic Financial Behavior: Evidence from Panel Vector Autoregression. Emerg. Mark. Financ. Trade 2023, 59, 281–295. [Google Scholar] [CrossRef]
  72. Waddock, S.A.; Graves, S.B. The Corporate Social Performance-Financial Performance Link. Strat. Mgmt. J. 1997, 18, 303–319. [Google Scholar] [CrossRef]
  73. Al-Tuwaijri, S.A.; Christensen, T.E.; Hughes Ii, K.E. The Relations among Environmental Disclosure, Environmental Performance, and Economic Performance: A Simultaneous Equations Approach. Account. Organ. Soc. 2004, 29, 447–471. [Google Scholar] [CrossRef]
  74. Kolk, A. Sustainability, Accountability and Corporate Governance: Exploring Multinationals’ Reporting Practices. Bus. Strat. Environ. 2008, 17, 1–15. [Google Scholar] [CrossRef]
  75. Ioannou, I.; Serafeim, G. What Drives Corporate Social Performance? The Role of Nation-Level Institutions. J. Int. Bus. Stud. 2012, 43, 834–864. [Google Scholar] [CrossRef]
  76. Cheng, B.; Ioannou, I.; Serafeim, G. Corporate Social Responsibility and Access to Finance. Strateg. Manag. J. 2014, 35, 1–23. [Google Scholar] [CrossRef]
  77. Lins, K.V.; Servaes, H.; Tamayo, A. Social Capital, Trust, and Firm Performance: The Value of Corporate Social Responsibility during the Financial Crisis. J. Financ. 2017, 72, 1785–1824. [Google Scholar] [CrossRef]
  78. Arayssi, M.; Dah, M.; Jizi, M. Women on Boards, Sustainability Reporting and Firm Performance. Sustain. Account. Manag. Policy J. 2016, 7, 376–401. [Google Scholar] [CrossRef]
  79. Chen, S.; Song, Y.; Gao, P. Environmental, Social, and Governance (ESG) Performance and Financial Outcomes: Analyzing the Impact of ESG on Financial Performance. J. Environ. Manag. 2023, 345, 118829. [Google Scholar] [CrossRef]
  80. Al-Shaer, H.; Zaman, M.; Albitar, K. CEO Gender, Critical Mass of Board Gender Diversity and ESG Performance: UK Evidence. J. Account. Lit. 2024. [Google Scholar] [CrossRef]
  81. García-Amate, A.; Ramírez-Orellana, A.; Rojo-Ramírez, A.A.; Casado-Belmonte, M.P. Do ESG controversies moderate the relationship between CSR and corporate financial performance in oil and gas firms? Humanit. Soc. Sci. Commun. 2023, 10, 1–14. [Google Scholar] [CrossRef]
  82. Buallay, A. Toward sustainability reporting in the MENA region: The effects on sector’s performance. Manag. Financ. 2022, 48, 1137–1155. [Google Scholar] [CrossRef]
  83. Oster, E. Unobservable Selection and Coefficient Stability: Theory and Evidence. J. Bus. Econ. Stat. 2019, 37, 187–204. [Google Scholar] [CrossRef]
  84. Dantas, M.M.; Merkley, K.J.; Silva, F.B.G. Government Guarantees and Banks’ Income Smoothing. J. Financ. Serv. Res. 2023, 63, 123–173. [Google Scholar] [CrossRef]
  85. Campello, M.; Kankanhalli, G.; Muthukrishnan, P. Corporate Hiring Under COVID-19: Financial Constraints and the Nature of New Jobs. J. Financ. Quant. Anal. 2024, 59, 1541–1585. [Google Scholar] [CrossRef]
  86. Zhang, C.; Yang, J. Artificial Intelligence and Corporate ESG Performance. Int. Rev. Econ. Financ. 2024, 96, 103713. [Google Scholar] [CrossRef]
  87. Ashour, G.H.; Sayed, M.N.; Abbas, N.A. Macro Determinants of Sustainable Financial Development in the Middle East and North Africa (MENA) Region Countries. Manag. Sustain. Arab Rev. 2024, 3, 249–273. [Google Scholar] [CrossRef]
Figure 1. Saudi Arabia ESG transformation: pre-guidelines baseline (2018–2020) versus post-implementation outcomes (2021–2024). (a) ESG disclosure adoption by category; (b) AI technology integration in ESG processes; (c) pre-2021 market capitalization distribution by ESG disclosure level; (d) post-2024 market capitalization distribution by ESG disclosure level.
Sustainability 17 07421 g001
Figure 2. Temporal evolution of ESG disclosure quality, AI adoption intensity, and financial performance metrics among Saudi-listed companies, 2021–2024: (a) shows ESG quality and AI adoption trends, (b) profitability metrics, (c) market valuation, and (d) summary statistics. AI adoption exhibited the highest growth rate (146.7%), followed by ROE (38.8%) and ESG quality (36.0%).
Sustainability 17 07421 g002
Figure 3. AI adoption measurement validation. Panel (a) shows the distribution of AI adoption intensity scores across GICS sectors. Panel (b) confirms convergent validity via the strong correlation (r = 0.78, p < 0.001) between survey-based scores and independent content analysis scores, supporting the instrument’s robustness.
Sustainability 17 07421 g003
Figure 4. ESG disclosure quality analysis: (a) Distribution of overall disclosure quality scores; (b) correlation relationships between disclosure quality dimensions. *** indicates significance at p < 0.001 level.
Sustainability 17 07421 g004
Figure 5. AI adoption effects on ESG disclosure quality: (a) Predicted relationship with confidence intervals; (b) marginal effects across adoption levels. Statistical significance is denoted as *** p < 0.01.
Sustainability 17 07421 g005
Figure 6. ESG disclosure quality and financial performance: (a) Overall relationships with fitted lines; (b) industry-specific performance effects. *** indicates significance at p < 0.001 level.
Sustainability 17 07421 g006
Figure 7. Mediation pathway analysis: Direct and indirect effects of AI adoption on financial performance through ESG disclosure quality.
Sustainability 17 07421 g007
Figure 8. Panel VAR dynamics: (a) Impulse response functions to one-standard-deviation shocks; (b) forecast error variance decomposition.
Sustainability 17 07421 g008
Figure 9. Robustness analysis showing coefficient stability for AI adoption effects on ESG disclosure quality (a) and ESG quality effects on financial performance (b). Forest plots display coefficient estimates with confidence intervals across alternative specifications, sample restrictions, and estimation methods. Main results (red) use System GMM and 2SLS to address endogeneity. Significance levels are denoted as follows: *** p < 0.01, ** p < 0.05, * p < 0.1.
Sustainability 17 07421 g009
Figure 10. Bounding analysis demonstrates robustness of ESG disclosure quality effects on ROA. The identified lower bound (β* = 0.065) remains positive and significant, indicating that unobserved confounding would need to be substantially stronger than included macroeconomic controls to nullify the relationship.
Sustainability 17 07421 g010
Table 1. Comparative analysis of AI in ESG reporting literature.
StudyMethodologyKey FindingsGeographic FocusContributionMethodological Limitations
[38]Industry AnalysisAI improves efficiency but faces standardization challengesGlobalFramework standardization needsLimited empirical rigor; descriptive analysis without statistical validation
[39]Case Study AnalysisAI adoption is exploding in ESG tasks; energy concerns are notedUK/EuropePractical implementation insightsSmall sample size; limited generalizability across sectors and regions
[40]Market ResearchThe US AI-ESG market is valued at USD 0.48B, 26.7% CAGRUnited StatesMarket size quantificationNon-peer reviewed; potential commercial bias; descriptive focus only
[41]Technology AssessmentAI streamlines reporting, analysis, and complianceNorth AmericaTechnology capabilitiesTheoretical emphasis; limited empirical validation of claimed benefits
[42]Empirical StudyAI powers ESG performance enhancement in a digital transformation contextChinaAI-ESG performance relationshipCross-sectional design; single-country focus limits external validity
[43]Industry ReportAI transforms data gaps and forward-looking insightsGlobalInvestment implicationsNon-academic source; limited methodological transparency; potential bias
[44]Systematic ReviewESG disclosure affects financial performance, moderated by ESG investorsChinaPerformance relationshipGeographic limitation; heterogeneous primary study methodologies
[45]Empirical StudyESG systems impact financial performance in high-impact industriesChinaSector-specific analysisLimited to high-impact industries; endogeneity concerns not addressed
[46]Assessment ToolESG disclosure scores support investment decision-makingUKPractical measurementSingle-country validation; limited cross-cultural applicability
[47]Comprehensive ReviewESG–AI research spans eight archetypical domainsGlobalResearch landscape mappingConceptual focus; limited quantitative synthesis of empirical findings
Table 2. Summary statistics for primary variables across 180 Saudi-listed companies (2021–2024).
VariableMeanStd. Dev.MinMax25th Percentile75th PercentileObservations
ESG Disclosure Quality Score47.3223.848.5089.2028.6064.80720
AI Adoption Intensity31.4528.920.0095.608.4052.30720
ROA (%)8.7412.63−34.2048.902.1014.60720
ROE (%)14.2819.87−89.4076.304.8022.50720
Tobin’s Q1.631.240.427.850.892.11720
Firm Size (Log Assets)9.841.476.2313.928.7610.89720
Firm Age (Years)18.3512.843.0047.009.0026.00720
Leverage Ratio0.340.220.000.890.180.47720
Board Independence (%)73.4215.2833.33100.0066.6783.33720
Table 3. Factor analysis results for AI adoption measurement instrument (Principal Component Analysis with Varimax Rotation).
ComponentEigenvalue% Variance ExplainedCumulative %Factor Loadings
Factor 1: Technology Infrastructure3.2432.4%32.4%
  Data processing capabilities 0.847
  System integration sophistication 0.823
  Automation level 0.789
  Technical staff expertise 0.756
Factor 2: Strategic Implementation2.1821.8%54.2%
  AI strategy alignment 0.812
  Senior management support 0.794
  Resource allocation 0.771
  Performance measurement 0.743
Factor 3: Organizational Readiness1.6716.7%70.9%
  Change management effectiveness 0.798
  Employee training programs 0.785
  Cultural adaptation 0.732
  Stakeholder engagement 0.689
Notes: Reliability for the three factors was confirmed with both Cronbach’s alpha (0.89, 0.84, and 0.82, respectively) and Composite Reliability (0.88, 0.86, and 0.84, respectively), demonstrating excellent internal consistency.
Table 4. ESG disclosure quality assessment by component dimensions.
Disclosure Quality DimensionMeanStd. Dev.MinMaxCorrelation with Overall Score
GRI Standards Compliance48.7226.415.0092.000.924 ***
  Foundation disclosures52.1828.938.0095.000.847 ***
  General disclosures47.8527.123.0091.000.889 ***
  Material topics reporting46.1329.672.0089.000.798 ***
Materiality Assessment Depth44.6724.1810.0088.000.856 ***
  Methodology transparency41.2326.845.0085.000.782 ***
  Stakeholder input quality46.8925.728.0090.000.734 ***
  Topic comprehensiveness45.9127.3512.0087.000.691 ***
  Strategic integration44.6526.987.0089.000.758 ***
Stakeholder Engagement48.5722.9412.0086.000.811 ***
  Engagement frequency51.3424.6715.0088.000.689 ***
  Method diversity47.1223.1810.0085.000.712 ***
  Feedback incorporation46.2325.418.0084.000.746 ***
  Relationship management49.5924.0314.0087.000.698 ***
Note: *** indicates significance at p < 0.001 level.
Table 5. System GMM regression results: AI adoption effects on ESG disclosure quality.
VariablesModel 1Model 2Model 3Model 4Model 5
AI Adoption Intensity0.284 ***0.312 ***0.298 ***0.276 ***0.289 ***
(0.047)(0.052)(0.049)(0.051)(0.048)
Lagged ESG Quality 0.187 ***0.194 ***0.201 ***0.183 ***
(0.034)(0.036)(0.038)(0.035)
Firm Size 3.142 ***2.987 ***2.854 ***
(0.623)(0.598)(0.612)
Firm Age 0.089 *0.094 *0.087 *
(0.048)(0.051)(0.049)
Leverage −8.734 **−9.126 **
(3.841)(3.967)
Board Independence 0.142 **0.156 **
(0.067)(0.071)
ROA (t−1) 0.198 **
(0.089)
Constant33.567 ***28.943 ***−2.847−1.234−3.891
(2.134)(2.987)(6.234)(6.789)(7.123)
Industry Fixed EffectsNoNoYesYesYes
Year Fixed EffectsNoYesYesYesYes
Observations720720720720720
Number of Firms180180180180180
AR(2) Test (p-value)0.2340.1890.1560.1780.203
Hansen Test (p-value)0.3870.4230.3560.4010.378
Number of Instruments4552687481
Note: Standard errors in parentheses are clustered at the firm level. Statistical significance assessed using t-tests: *** p < 0.01, ** p < 0.05, * p < 0.1.
Table 6. Financial performance effects of ESG disclosure quality (two-stage least squares estimation).
Dependent VariableROAROETobin’s QROAROETobin’s Q
ESG Disclosure Quality0.089 **0.142 **0.0067 **0.094 **0.156 **0.0073 **
(0.041)(0.063)(0.0031)(0.043)(0.067)(0.0034)
AI Adoption (Direct) 0.034 *0.052 *0.0028 *
(0.019)(0.028)(0.0015)
Firm Size1.234 ***1.876 ***0.087 ***1.189 ***1.823 ***0.084 ***
(0.298)(0.452)(0.023)(0.301)(0.459)(0.024)
Firm Age0.045 *0.067 *0.0034 **0.043 *0.065 *0.0032 **
(0.024)(0.037)(0.0017)(0.025)(0.038)(0.0017)
Leverage−6.234 ***−9.876 ***−0.423 ***−6.187 ***−9.823 ***−0.419 ***
(1.456)(2.234)(0.098)(1.467)(2.245)(0.099)
Market-to-Book2.134 ***3.267 *** 2.098 ***3.234 ***
(0.567)(0.867) (0.573)(0.874)
Industry Fixed EffectsYesYesYesYesYesYes
Year Fixed EffectsYesYesYesYesYesYes
Observations720720720720720720
R-squared0.3420.2980.2670.3560.3120.281
First-stage F-statistic23.4523.4523.4528.6728.6728.67
Wu–Hausman (p-value)0.0340.0280.0410.0290.0230.037
Note: Standard errors in parentheses. *** p < 0.01, ** p < 0.05, * p < 0.1.
Table 7. Mediation analysis results: AI adoption effects on financial performance through ESG disclosure quality.
Outcome VariableROAROETobin’s Q
Total Effect0.126 ***0.198 ***0.0101 ***
(0.038)(0.058)(0.0029)
Direct Effect0.034 *0.052 *0.0028 *
(0.019)(0.028)(0.0015)
Indirect Effect (via ESG Quality)0.092 ***0.146 ***0.0073 ***
(0.027)(0.041)(0.0021)
Proportion Mediated73.0%73.7%72.3%
[0.58, 0.88][0.59, 0.89][0.57, 0.87]
Average Mediated Effect2.16 ***3.42 ***0.171 ***
(0.64)(0.96)(0.049)
Sobel Test Statistic4.23 ***4.18 ***4.31 ***
Bootstrap Replications100010001000
Note: Standard errors for the mediation analysis are clustered at the firm level to account for within-firm serial correlation. The Sobel test utilizes these robust standard errors to assess the significance of the indirect effect. *** p < 0.01, * p < 0.1.
Table 8. Panel vector autoregression results (2 lags, system estimation).
AI Adoption (t)ESG Quality (t)ROA (t)
AI Adoption (t−1)0.687 ***0.124 **0.089 *
(0.067)(0.054)(0.048)
AI Adoption (t−2)0.189 **0.067 *0.034
(0.078)(0.038)(0.032)
ESG Quality (t−1)0.045 *0.734 ***0.067 **
(0.024)(0.056)(0.031)
ESG Quality (t−2)0.0230.156 **0.045 *
(0.019)(0.063)(0.024)
ROA (t−1)0.234 *0.187 **0.623 ***
(0.123)(0.089)(0.078)
ROA (t−2)0.1340.098 *0.134 **
(0.089)(0.054)(0.056)
Observations540540540
R-squared0.7340.6980.612
Note: Standard errors in parentheses. *** p < 0.01, ** p < 0.05, * p < 0.1.
Table 9. Robustness checks: Alternative specifications and sensitivity analysis.
TestMain ResultAlternative 1Alternative 2Alternative 3Conclusion
AI → ESG Quality0.289 ***0.294 ***0.276 ***0.302 ***Robust
(Binary AI measure)(Sector-specific)(Lagged AI)
ESG → Performance0.094 **0.087 **0.103 **0.091 **Robust
(Alternative ESG)(Risk-adjusted)(Industry-norm)
Sample Restrictions
  Excluding outliers (5%)0.289 ***0.281 ***0.094 **0.089 **Stable
  Large firms only0.289 ***0.312 ***0.094 **0.108 ***Stronger
  Post-2022 only0.289 ***0.267 **0.094 **0.076 *Weaker
Alternative Methods
  Fixed effects0.289 ***0.234 ***0.094 **0.078 **Lower
  Random effects0.289 ***0.256 ***0.094 **0.083 **Lower
  Pooled OLS0.289 ***0.201 ***0.094 **0.063 *Much lower
Note: *** p < 0.01, ** p < 0.05, * p < 0.1.
Table 10. Comparison with benchmark studies: ESG disclosure effects on financial performance.
StudySampleESG MeasurePerformanceEffect SizeComparison
Current StudySaudi 2021–24AI-enhanced qualityROA0.094 **Baseline
[79]Chinese firmsESG ratingROA0.067 *40% lower
[80]Gulf countriesDisclosure indexROA0.052 *81% lower
[67]Emerging marketsGRI complianceROA0.071 **32% lower
Tobin’s Q Effects
Current StudySaudi 2021–24AI-enhanced qualityTobin’s Q0.0073 **Baseline
García-Sánchez (2023) [81]Global sampleESG scoreTobin’s Q0.0045 *62% lower
Rahman et al. (2022) [82]MENA regionSustainability indexTobin’s Q0.0038 *92% lower
Note: ** p < 0.05, * p < 0.1.
Table 11. Bounding analysis for the effect of ESG disclosure quality on ROA.
(1) Baseline Model(2) Model with Macro Controls
Dependent Variable: ROA (%)
ESG Disclosure Quality0.094 ** (0.041)0.081 ** (0.038)
Global EPU Index−0.015 * (0.008)
Log (US Fed Assets)0.023 ** (0.011)
Firm-Level ControlsYesYes
Industry Fixed EffectsYesYes
Time Fixed EffectsNoNo
Observations720720
R-Squared0.3420.388
Identified Bound (β*)0.065
Notes: This table reports 2SLS estimates for the bounding analysis. Standard errors in parentheses are clustered by firm. The baseline model is from Table 6. Macro controls are the Global Economic Policy Uncertainty Index and the log of total assets of the U.S. Federal Reserve. Following Oster (2019) [83] methodology and best practices for short panels, year fixed effects are removed in favor of macroeconomic time-varying controls to enable proper identification of parametric bounds. The identified bound β* indicates the estimated coefficient value after accounting for unobservables, assuming they are as correlated with ESG disclosure quality as the included controls. A maximum R-squared of 0.517 (calculated with a conservative assumption of Π = 1.3) is used. The positive and significant bound of 0.065 strengthens the interpretation of a causal relationship. ** p < 0.05, * p < 0.1.
Disclaimer/Publisher’s Note: The statements, opinions and data contained in all publications are solely those of the individual author(s) and contributor(s) and not of MDPI and/or the editor(s). MDPI and/or the editor(s) disclaim responsibility for any injury to people or property resulting from any ideas, methods, instructions or products referred to in the content.