Article

Global Sustainability Performance and Regional Disparities: A Machine Learning Approach Based on the 2025 SDG Index

by
Sadullah Çelik
1,2,
Ömer Faruk Öztürk
3,*,
Ulas Akkucuk
4 and
Mahmut Ünsal Şaşmaz
3
1
Department of Mathematics, Columbian College of Arts & Sciences, The George Washington University, Washington, DC 20052, USA
2
Department of International Trade and Finance, Nazilli Faculty of Economics and Administrative Sciences, Aydın Adnan Menderes University, Aydın 09000, Turkey
3
Department of Public Finance, Faculty of Economics and Administrative Sciences, Uşak University, Uşak 64000, Turkey
4
Department of Management, Faculty of Economics and Administrative Sciences, Bogaziçi University, Istanbul 34342, Turkey
*
Author to whom correspondence should be addressed.
Sustainability 2025, 17(16), 7411; https://doi.org/10.3390/su17167411
Submission received: 28 July 2025 / Revised: 8 August 2025 / Accepted: 11 August 2025 / Published: 15 August 2025

Abstract

Sustainability performance varies significantly across countries, yet global assessments overlook the underlying structural trends. This study bridges this gap using machine learning to uncover meaningful clustering in global sustainability outcomes based on the 2025 Sustainable Development Goals (SDG) Index. We applied K-Means clustering to group 166 countries into five standardized indicators: SDG score, spillover effects, regional score, population size, and recent progress. The five-cluster solution was confirmed by the Elbow and Silhouette procedures, with ANOVA and MANOVA tests subsequently indicating statistically significant cluster differences. For the validation and interpretation of the results, six supervised learning algorithms were employed. Random Forest, SVM, and ANN performed best in classification accuracy (97.7%) with perfect ROC-AUC scores (AUC = 1.0). Feature importance analysis showed that SDG and regional scores were most predictive of cluster membership, while population size was the least. This supervised–unsupervised hybrid approach offers a reproducible blueprint for cross-country benchmarking of sustainability. It also offers actionable insights for tailoring policy to groups of countries, whether high-income OECD nations, emerging markets, or resource-scarce countries. Our findings demonstrate that machine learning is a useful tool for revealing structural disparities in sustainability and informing cluster-specific policy interventions toward the 2030 Agenda.

1. Introduction

The United Nations Sustainable Development Goals (SDGs), adopted in 2015 as part of the 2030 Agenda for Sustainable Development, offer a framework well-known across the world for promoting social, environmental, and economic sustainability [1]. These 17 goals, from eradicating poverty to addressing climate change, are a vision of grandiose scale for inclusive global development. However, the extent to which countries have embraced and followed through on these goals is vastly uneven, leading to persistent regional disparities and uneven progress. In this respect, the 2025 SDG Index provides a thoroughly cross-national dataset measuring multiple forms of sustainability performance, including overall SDG scores, international spillover effects, regional integration, and progress along key indicators [2,3].
Here, this study aims to find latent patterns and performance trends across nations using unsupervised and supervised machine learning techniques on 2025 SDG Index data. Traditional statistical practice, while useful, is not very good at identifying advanced, nonlinear interactions and hidden clusters in high-dimensionality sustainability data. New technology advances in machine learning, i.e., clustering techniques, ensemble classifiers, and dimensionality reduction methods offer more versatile and robust alternatives for policy-servicing sustainability research [4,5].
The research revolves around six primary indicators from the 2025 SDG dataset: SDG Index Score, international spillovers score, regional score, region, population (2024), and progress on headline SDG Indicators. The study identifies stable groupings of nations based on their multidimensional sustainability profiles using K-Means clustering. The clusters are then statistically verified through analysis of variance (ANOVA) and multivariate analysis of variance (MANOVA) as strict evidence for their internal consistency and external distinction.
To further assess the explanatory power of individual characteristics in differentiating between clusters, a Random Forest classifier is applied. This allows for the identification of the most relevant variables governing membership in a cluster and enhancing the interpretability of the results. In addition, several supervised classification models, namely, Support Vector Machines (SVMs), Neural Networks (ANNs), and Decision Trees are trained and tested using ROC curve analysis to validate the predictive fitness and stability of the cluster structure. These collectively constitute a new data-driven approach for studying global sustainability dynamics and are part of a growing body of research applying machine learning to sustainability science [6,7].
Through this mixed-method analytical approach, the analysis contributes to the empirical ranking of sustainability performance and provides a scalable approach to future cross-country measurement. Lastly, the findings aim to inform international agencies, policymakers, and development institutions about directions toward progress and stagnation, to inform more focused and equitable sustainability policies.
This study contributes to the ongoing debate on global sustainability governance with a novel methodological approach with which to tackle long-term regional disparities. Previous research generally treats aggregated global or single-region data without systematically unraveling the component of disparities embedded in SDG performance data. By bringing statistical validation techniques together with machine learning algorithms, this study bridges that gap and presents a reproducible approach to identify latent regional and structural cleavages in SDG attainment. Second, our approach contributes to the theoretical account of sustainability governance as it shows how data analysis can reveal latent asymmetries and therefore inform more targeted and well-rounded policy intervention. Along the way, this study contributes to existing work in sustainability science by applying governance complexity and heterogeneity in operationalizing into empirically differentiated actionable clusters.
In this study, the performance of countries at the 2025 Sustainable Development Goals (SDGs) was evaluated by employing a multidimensional data analysis approach. The study initiated with a data preprocessing and exploratory analysis stage, followed by dimensionality reduction, clustering, and statistical tests. Supervised machine learning models were employed to test the distinctiveness of the emerged clusters; the results obtained were depicted through the classification of success measures and ROC curves. Thus, not only was the statistical significance of the clusters identified but their relevance to real-world classifiably was also revealed. This integrated approach allows for interpreting the prevailing sustainability scenario as well as for creating grounds for policy recommendations by revealing structural differences between country groups. The remaining sections of this article present the literature review, data and methods, findings, discussion, and conclusion.

2. Literature Review

The use of machine learning techniques in the performance assessments of the SDGs has been expanding exponentially over the past few years. These techniques, going beyond traditional statistical techniques, have made it possible to detect patterns in high-dimensional data, classify countries’ sustainability profiles, make predictive models, and perform more precise temporal or spatial analyses. To this end, some of the studies in the literature have analyzed sustainability performance according to various regions, periods, and methodological frameworks, revealing significant structural divergence and differences between countries. Table 1, provided below, gathers the pioneering studies in the literature and provides a comparative view in terms of methodological framework, data analysis techniques, and findings obtained.
Table 1 organizes the approach utilized in previous studies on the Sustainable Development Goals (SDGs), results obtained, and conclusions drawn by the approach. The objectives of the studies differ and range from the assessment of sustainability performance using both machine learning and statistical approaches, conducting cluster analysis among nations, revealing regional differences, and understanding the determinants of SDG attainment. Table 1 reflects the methodological pluralism and heuristic fertility of the literature in this field, alongside the growing importance of machine learning in SDG studies.
This literature review focuses on the increasing application of statistical and machine learning (ML) methods in the examination of sustainable development dynamics. Previous studies span from quantitative SDG performance measurement to regional inequality analysis, country-level classification models, and long-term predictions. These include algorithms such as K-Means clustering, Random Forest, and Artificial Neural Networks being brought forward among others as important processes in dealing with the high-dimensional nature of sustainability data [9,17,26].
However, despite such methodological strides, an increasing body of evidence, such as the recent work by Wang, He, and Fujita (2024) [29], highlights the power of regional policy contexts to shape sustainability trajectories. Their multi-period Difference-in-Difference examination of China’s Low-Carbon City policy reveals that environmental policy can powerfully deter foreign direct investment particularly in economically isolated areas like Western China. This accords with our overall argument that regional differences, institutional abilities, and policy compromises shape the role of SDG progress at the national level.
Still, most existing research remains bound in their capacity to measure these structural and contextual dynamics. This is the limitation our study aims to overcome by proposing a hybrid ML framework that does not only measure performance but also locates regionally embedded clusters of countries based on similar patterns of sustainability. In doing so, it contributes to both theory and practice by converting the concept of regional differentiation in SDG governance into an empirical one and by offering empirical instruments to verify it.
Methodological contributions our research makes include integrating unsupervised (clustering) and supervised (classification) machine learning algorithms on 2025 SDG Index data. Unlike previous methods that are founded on single-method analyses, our research utilizes the statistical validation methods (ANOVA/MANOVA) plus feature importance ranking, and ROC curve diagnostics, to provide the stability, interpretability, and predictive power of the discovered clusters.
Overall, this work contributes an empirically replicable, high-confidence analytical framework for cross-country sustainability assessment. More importantly, it provides a framework of guidelines for applying the SDG approach to regional strengths and challenges that can guide policy makers’ construction of more equitable and efficient sustainability interventions.

3. Data and Methodology

3.1. Data Source

This study used the 2025 Sustainable Development Goals (SDG) Index dataset that covers over 160 countries worldwide. The dataset, which was downloaded from SDG Index Official Portal (https://dashboards.sdgindex.org/downloads, access date 12 June 2025), provides a multidimensional view of national performance on the Sustainability Goals. The following six variables were selected as essential indicators for analysis [26]:
  • SDG Index Score: Overall national score reflecting progress towards the 17 SDGs.
  • International Spillovers Score (0–100): Degree to which a country’s actions influence sustainability in other countries.
  • Regional Score (0–100): Average sustainability performance of a country’s assigned macro-region.
  • Region: Geopolitical macro-region category.
  • Population (2024): Population size, included to account for the influence of population size.
  • Progress on Headline SDG Indicators (% points): Recent rate of national SDG indicator score change.
Variables were standardized and cleaned before analysis to ensure comparability and consistency across countries.
All Python scripts and the dataset used in this study are publicly available from the following GitHub repository: https://github.com/Sadullah4535/Global-Sustainability-Performance- (accessed on 3 June 2025). All computations were executed with Python version 3.13 to ensure reproducibility and compatibility. The open access repository allows researchers to replicate the results, apply the method to other datasets, or extend the current work.

3.2. Methodological Framework

This study utilized an eight-step hybrid methodological framework to understand sustainability performance at a global level and classify nations based on similar sustainability profiles. The process employed is a combination of both unsupervised and supervised machine learning, and the findings are both statistically credible and interpretable. The entire process of the framework is depicted as a circle in Figure 1.

3.2.1. Preprocessing

In the first step, preprocessing tasks were executed to obtain the dataset ready for modeling. All numerical variables were normalized to the range [0, 1] by applying min-max normalization to eliminate the effect of differences in scales on the models. The categorical “Region” variable was converted to numerical form by applying the label coding technique. This step is crucial for distance-sensitive algorithms (e.g., K-Means, PCA). The analysis dataset was completed by omitting missing observations.

3.2.2. Exploratory Analysis

Exploratory data analysis was carried out in the second step. A Pearson correlation matrix was created in this instance to evaluate linear relations between variables. Several risks of linear correlation were identified as well as variables exhibiting similar behavior using this analysis. The structure of correlations was most influential concerning dimensionality reduction and variable selection procedures.

3.2.3. Dimensionality Reduction

At the third step, Principal Component Analysis (PCA) was used to minimize the structure of high-dimensional data and pattern visualization. PCA is a statistical technique utilized in dimension reduction without losing the internal structure in multivariate datasets, essentially producing new components (principal components) that are linear combinations of the original variables and that explain the maximum variance in the data [30,31,32,33,34]. Based on this analysis, the primary elements that displayed the common variance between the variables were created and it was specifically seen that the first two elements were strong enough to capture a large percentage of the total variance in the dataset. The dimensionality reduction used not only led to a more salient visual presentation of the clustering patterns but also reduced the computational complexity of models to be employed in subsequent steps.

3.2.4. Clustering

In the fourth step, the K-Means method, one of the most widely used clustering algorithms, was employed to cluster nations according to their sustainability performance. The K-Means algorithm groups observations into pre-determined k cluster centers (centroids) and assigns each observation based on its Euclidean distance to the centroids and iteratively updates the assignments to minimize the inertia between clusters [35,36,37,38,39,40]. This algorithm starts with an arbitrary selection of k centers at the first step; then, each observation is assigned to the closest center to it, and the new center for each cluster is updated by taking the arithmetic mean of all observations in a particular cluster [41,42,43,44,45,46]. The steps are repeated until the centers remain fixed or until a predetermined convergence criterion is met.
The K-Means algorithm aims to minimize the total inertia of the square of the Euclidean distances between the cluster centers μ j and each observation x i . The objective function is as follows [39,41,42]:
argmin C j = 1 k x i ϵ C j x i μ j 2
Here, C j is the j -th cluster and μ j is the centroid of this cluster. The main objective of K-Means is to determine the clusters so that this Within-Cluster Sum of Squares (WCSS) value is minimized [39,41,42,47].
In this study, the K-Means algorithm was implemented using the Python programming language in the scikit-learn library. In the clustering process, five continuous variables of sustainability performance were scaled by min-max normalization, and then countries were clustered depending on their sustainability profiles with the use of these scaled values.
Two popular approaches were combined to find the optimum number of clusters. While, on the one hand, the Elbow method graphically examined the WCSS values calculated for different values of k   and pointed to the point where the curve had a break (elbow) as the optimal number of clusters [43,44,45,48,49,50], on the other hand, the Silhouette Score determined the quality of clustering by estimating the similarity of each observation to its own cluster compared to the distance to the next nearest other cluster [45]. Based on these two measures, the value k = 5, which gave the most consistent results, was selected as the final cluster number.
Alternative approaches that may be used include Hierarchical Clustering (Agglomerative Clustering), Density-Based Spatial Clustering of Applications with Noise (DBSCAN), and Gaussian Mixture Models (GMMs). These have the potential to provide more flexible solutions, especially in cases where the shape, density, or distribution of the clusters are not equal. However, with the normalized and index-based form of the dataset utilized within the research, the assumption of the shape of the clusters being spherical was suitable for K-Means. In addition, the interpretation simplicity of K-Means and its light computational load also functioned well within this choice. In particular, in multidimensional data structures for sustainability performance, the K-Means algorithm is an effective and practical analysis tool allowing policies to be split into target groups.

3.2.5. Cluster Validation

In the fifth step, it was verified whether the statistically derived clusters differed from each other. ANOVA tests were applied for univariate tests and MANOVA (Multivariate Analysis of Variance) for multivariate tests. While ANOVA tests verified differences between cluster means on each of the variables, MANOVA verified differences between all the variables combined between clusters. On both the test outputs, p-values were lower than the statistical significance level of 0.05, which means that the differences between the clusters were not random.

3.2.6. Interpretability

In step six, it was analyzed by which variables the clusters were separated. To this end, the Random Forest classifier was trained, and the importance levels of the variables (feature_importance) were determined. Due to this analysis, it was seen which sustainability indicators played a crucial role in the separation of the clusters. It was seen that particularly the core indicators like sdg_score, regional_score, and spillover_score had great power in distinguishing the clusters.

3.2.7. Model Testing

In the seventh step, several supervised machine learning algorithms were used to validate the distinguishability of the formed clusters from one another and their classification accuracy. For the same reason, Random Forest, Support Vector Machine (SVM), Decision Tree, XGBoost, and Multilayer Perceptron (MLP) classifiers were utilized, and the validation of the models was complemented by statistical evaluation metrics. The data were divided into 70% training and 30% test sets, and models were only tested against the test data. Four basic classification metrics were used to compare the models: accuracy, precision, recall, and F1 score.
Accuracy calculates the ratio of the total number of correct model predictions to all predictions. It is calculated as follows [51,52,53,54,55,56,57]:
A c c u r a c y = T P + T N T P + T N + F P + F N      
Here [58],
TP (True Positive): Number of instances identified correctly as positive;
TN (True Negative): Number of instances identified correctly as negative;
FP (False Positive): Number of instances incorrectly identified as positive;
FN (False Negative): Number of instances incorrectly identified as negative.
Accuracy is a robust metric that aggregates the overall model performance, especially in the case of no class imbalance. In this study, the Random Forest and XGBoost models were remarkable with accuracy levels of above 90%.
Precision is a measure of the number of examples the model labeled as positive and is shown using the following formula [58,59,60,61,62,63,64]:
P r e c i s i o n = T P T P + F P    
Accuracy informs us about the trustworthiness of the model, especially where there are false positives that are critical. Here, it is very critical to prevent countries from being classified into the wrong category.
Recall informs us about how well the model performs on predicting examples that are positive [58,59,63,65]:
R e c a l l = T P T P + F N      
High-recall models never miss target classes. This is especially important in situations involving rare observations or tiny clusters.
F1 score is the harmonic mean applied for balancing precision and recall [58,59,63,66,67]:
F 1 S c o r e = 2 × P r e c i s i o n × R e c a l l P r e c i s i o n + R e c a l l
The F1 measure is a better indication of the overall model accuracy in imbalanced datasets, because the measure of accuracy can be misleading if there is more data for certain classes. F1 scores were utilized in this work to show whether the model can distinguish all clusters as well as possible considering the balanced nature of the clusters. The Random Forest and XGBoost models revealed that there is good separability between clusters with high F1 scores and equal precision and recall values.
All these measurements were performed using the sklearn.metrics module of the Python platform and the macro-averaging method was used to keep in mind the multi-class nature (multi-class classification). The macro-average calculates the measure for each class separately so that a mean is calculated with the same weight amongst the classes. With this, the performance of less dense clusters was also considered in the evaluation.

3.2.8. Predictive Performance Evaluation

In the final step, ROC curves were plotted to provide a graphical representation of model performance and for assessing the confidence levels of the classification. ROC (Receiver Operating Characteristic) curves represent the success rates of the classification models at different threshold values on the sensitivity and specificity axes, whereas AUC (Area Under Curve) scores provided a measure that summarized the overall performance. The AUC measures of the top-performing models were well over 0.90 and it was observed that the clusters provided strong discrimination on the front of classification as well as statistical significance.
This combined methodological approach not only involved the design of data-driven cluster settings but also ensured the explainability and predictability of these configurations, hence enhancing the policy-making value addition of the study.

4. Empirical Results and Findings

4.1. Exploratory Analysis

To reveal the country variations in terms of performance according to the Sustainable Development Index (SDG), countries were ranked according to their SDG scores in 2025 and the high-scoring and poorly scoring countries were comparatively analyzed. To this end, the top 20 most notable countries in terms of sustainability were compared with the bottom 20 poorly performing countries, and the results are plotted in Figure 2.
Figure 2 clearly demonstrates divergence between strong and weak countries in sustainability, e.g., countries such as Finland, Sweden, and Denmark excel with high SDG scores, and countries such as South Sudan, the Central African Republic, and Chad face significant sustainable development challenges. As a result, global disparity in performance in sustainability has been revealed, and policy makers have been given the opportunity for prioritization.
This assessment is significant to understand how country and regional initiatives towards Sustainable Development Goals differ, as well as areas of needs assessment and efficient resource management. Further, this comparative analysis is the basis for further work towards monitoring and improving SDG performance.
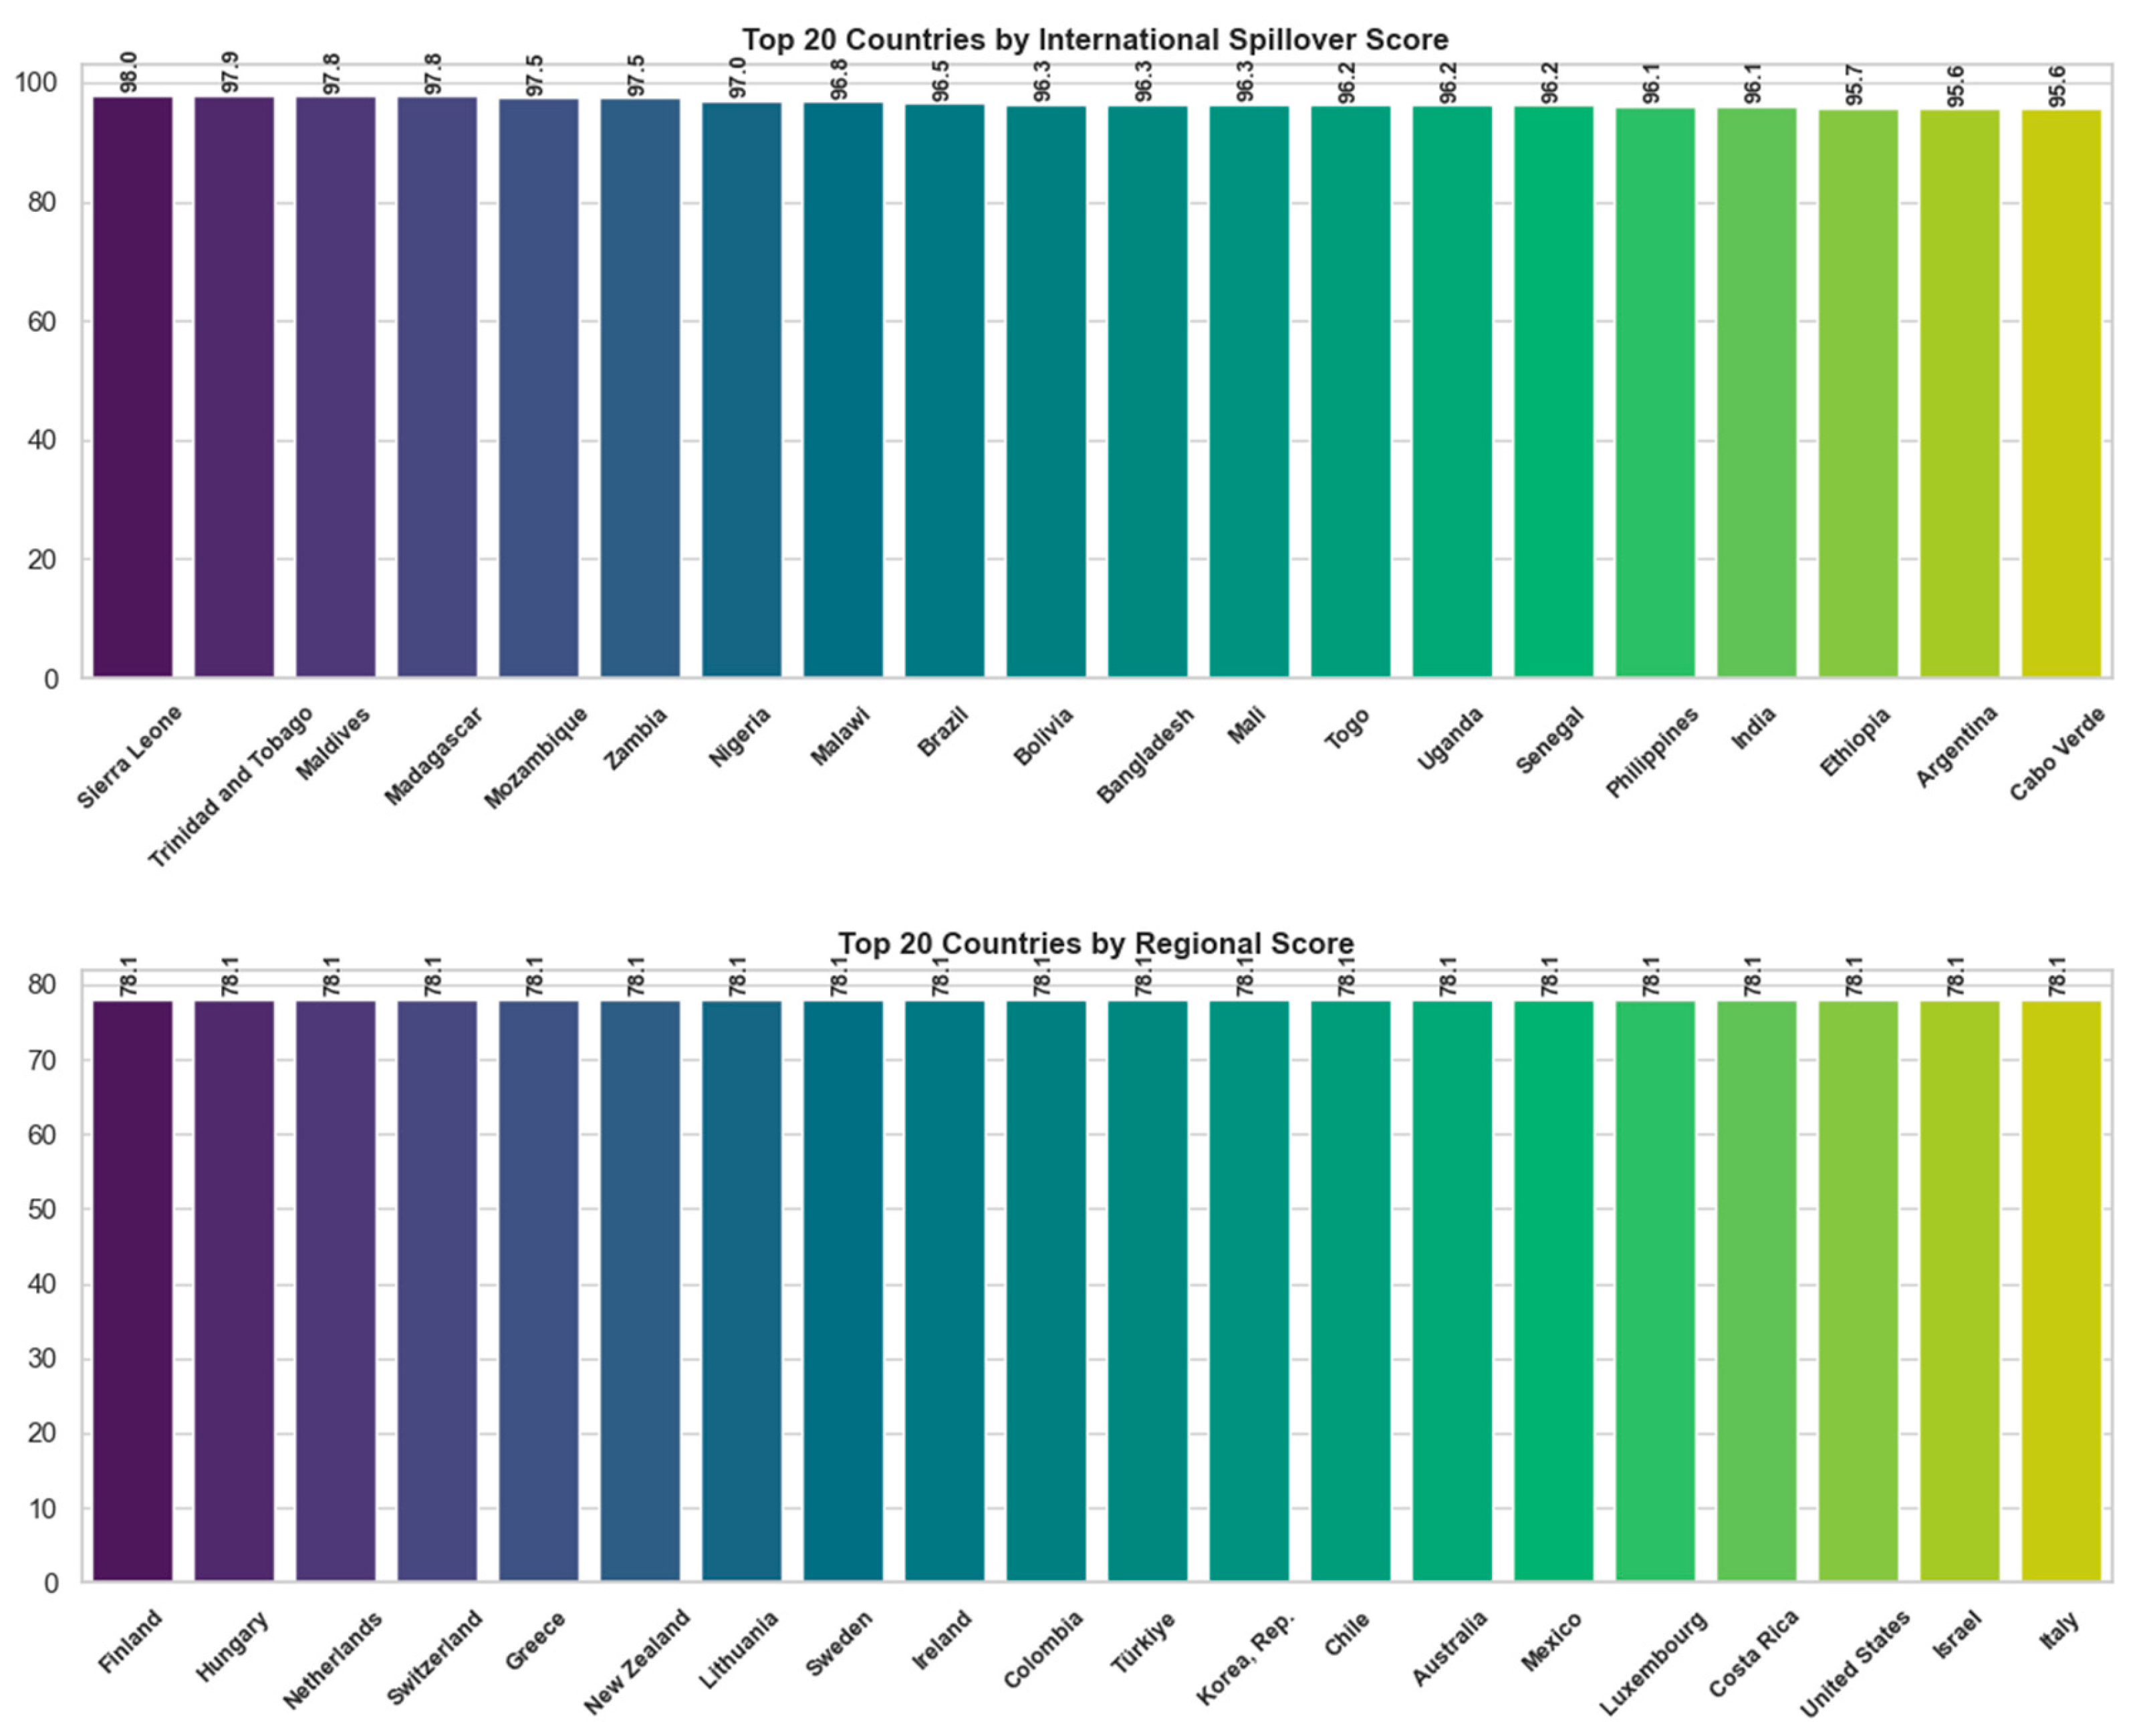
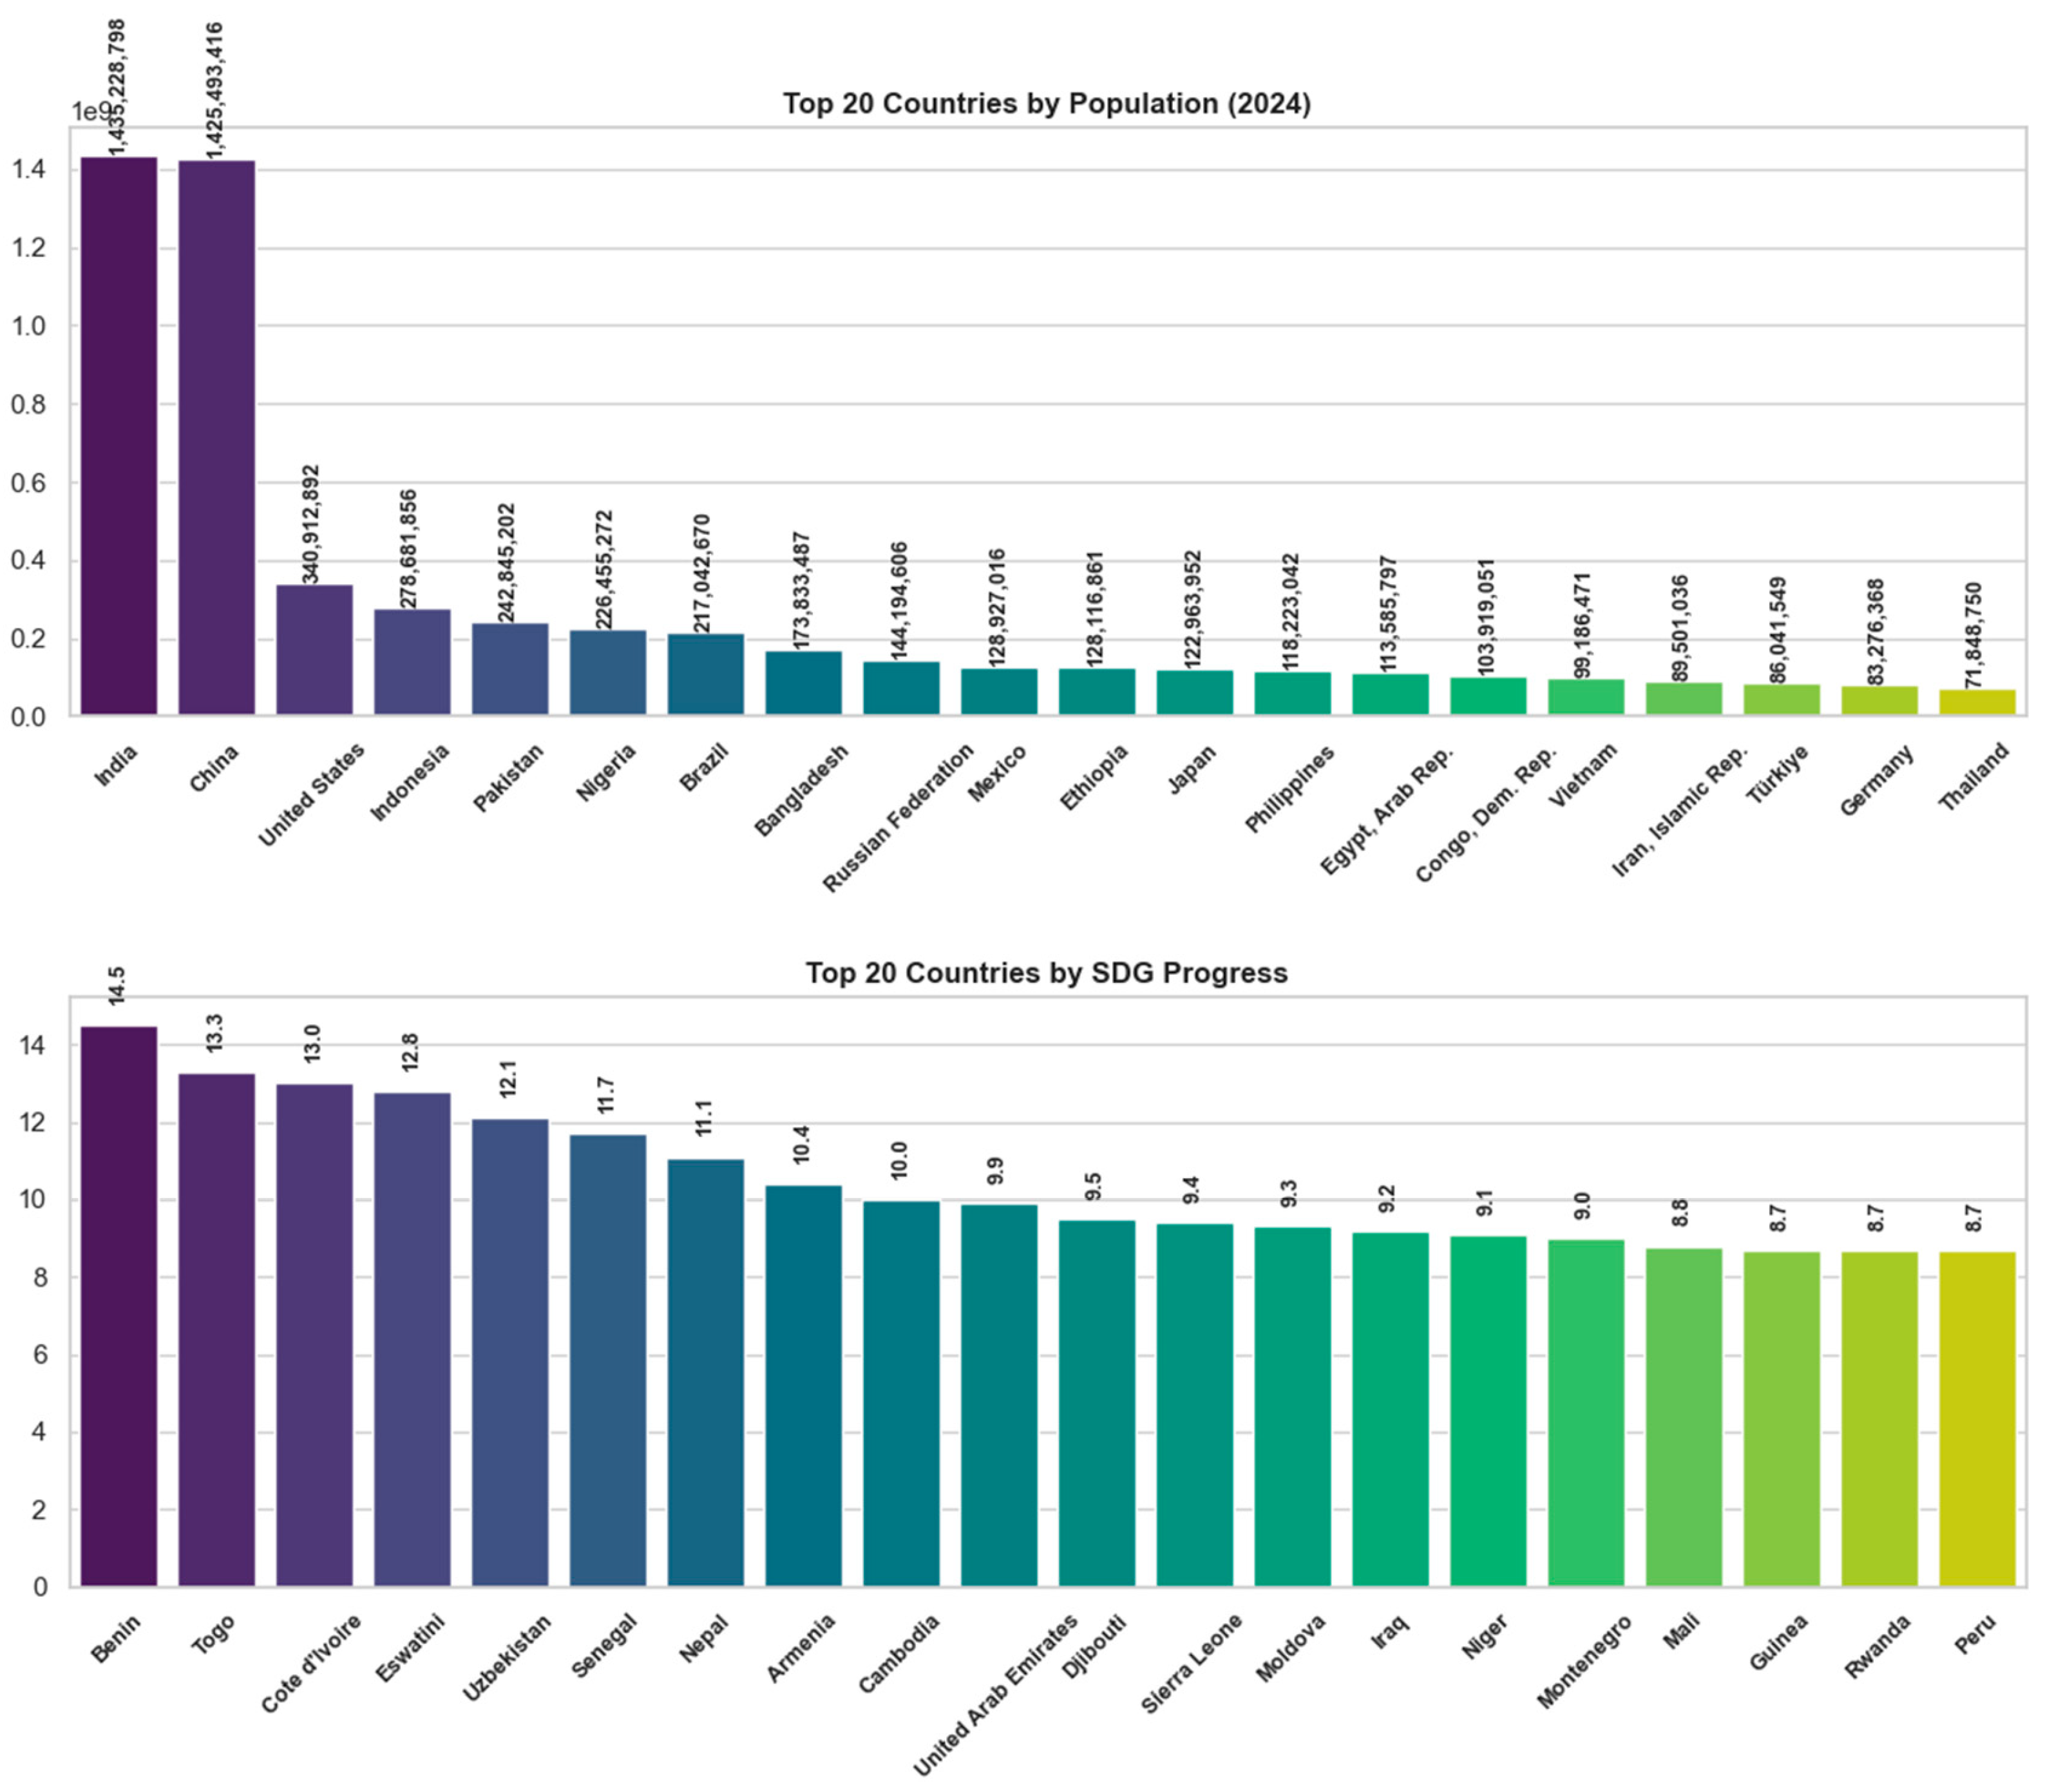
In addition to the Sustainable Development Index (SDG) score, some analyses were conducted at different dimensions to more deeply comprehend the countries’ sustainability performance. To this end, countries’ performances were comparatively assessed considering four basic variables: international externalities (spillover effects), regional score, population size, and SDG levels of progress. The outcome of the analyses is depicted in Figure 3.
The highest 20 countries by the International Externality Score are shown in the first panel of Figure 3. It measures the environmental, social, or economic impacts of a country’s consumption and economic activities on other countries. High-ranking countries such as Sierra Leone (98.0), Trinidad and Tobago (97.9), and Maldives (97.8) indicate high values that reflect structural relationships with strong externalities. A high value does not imply goodness, but instead bad global interactions and the need to reduce external effects.
The second panel shows countries with the regional score’s upper limit, 78.1. These countries include countries that are likely to belong to OECD and high-income country groups, namely Finland, Hungary, the Netherlands, Switzerland, and New Zealand. The closeness of the countries’ scores indicates the shortcoming of the regional method of the measurement or the homogeneity of countries’ performance at the regional level. This also indicates the need for setting more disaggregated regional benchmarks.
The third panel shows the 20 largest estimated populations in 2024. India (1.435 billion) and China (1.425 billion) lead the rankings, followed by the United States (341 million). While population numbers cannot be used directly to measure performance, it is a determining factor for the burden and responsibility for sustainable development. The fact that specific nations like Nigeria, Bangladesh, and Indonesia count among those included emphasizes the emergence of the Global South as a driving force in global sustainability.
The final panel shows the countries making the most gains (in percentage points) on the SDG headline indicators. The list, dominated by countries such as Benin (14.5), Togo (13.3), and Côte d’Ivoire (13.0), shows that low- and lower-middle-income African countries overall have progressed significantly. This suggests that policy interventions and international support mechanisms are effective. Nevertheless, sustaining these gains is a serious challenge, especially for fragile states.
The multidimensionality of sustainable development is demonstrated in the analysis presented in Figure 3 and supplemented by the more profound assessment through supplementary indicators beyond the general SDG score. Externalities, geospatial context, pressure and progress interactions signal that countries have very diverse initial conditions and strategies in their sustainable development paths. Hence, more holistic and context-specific strategies are needed in monitoring and policy-making processes.
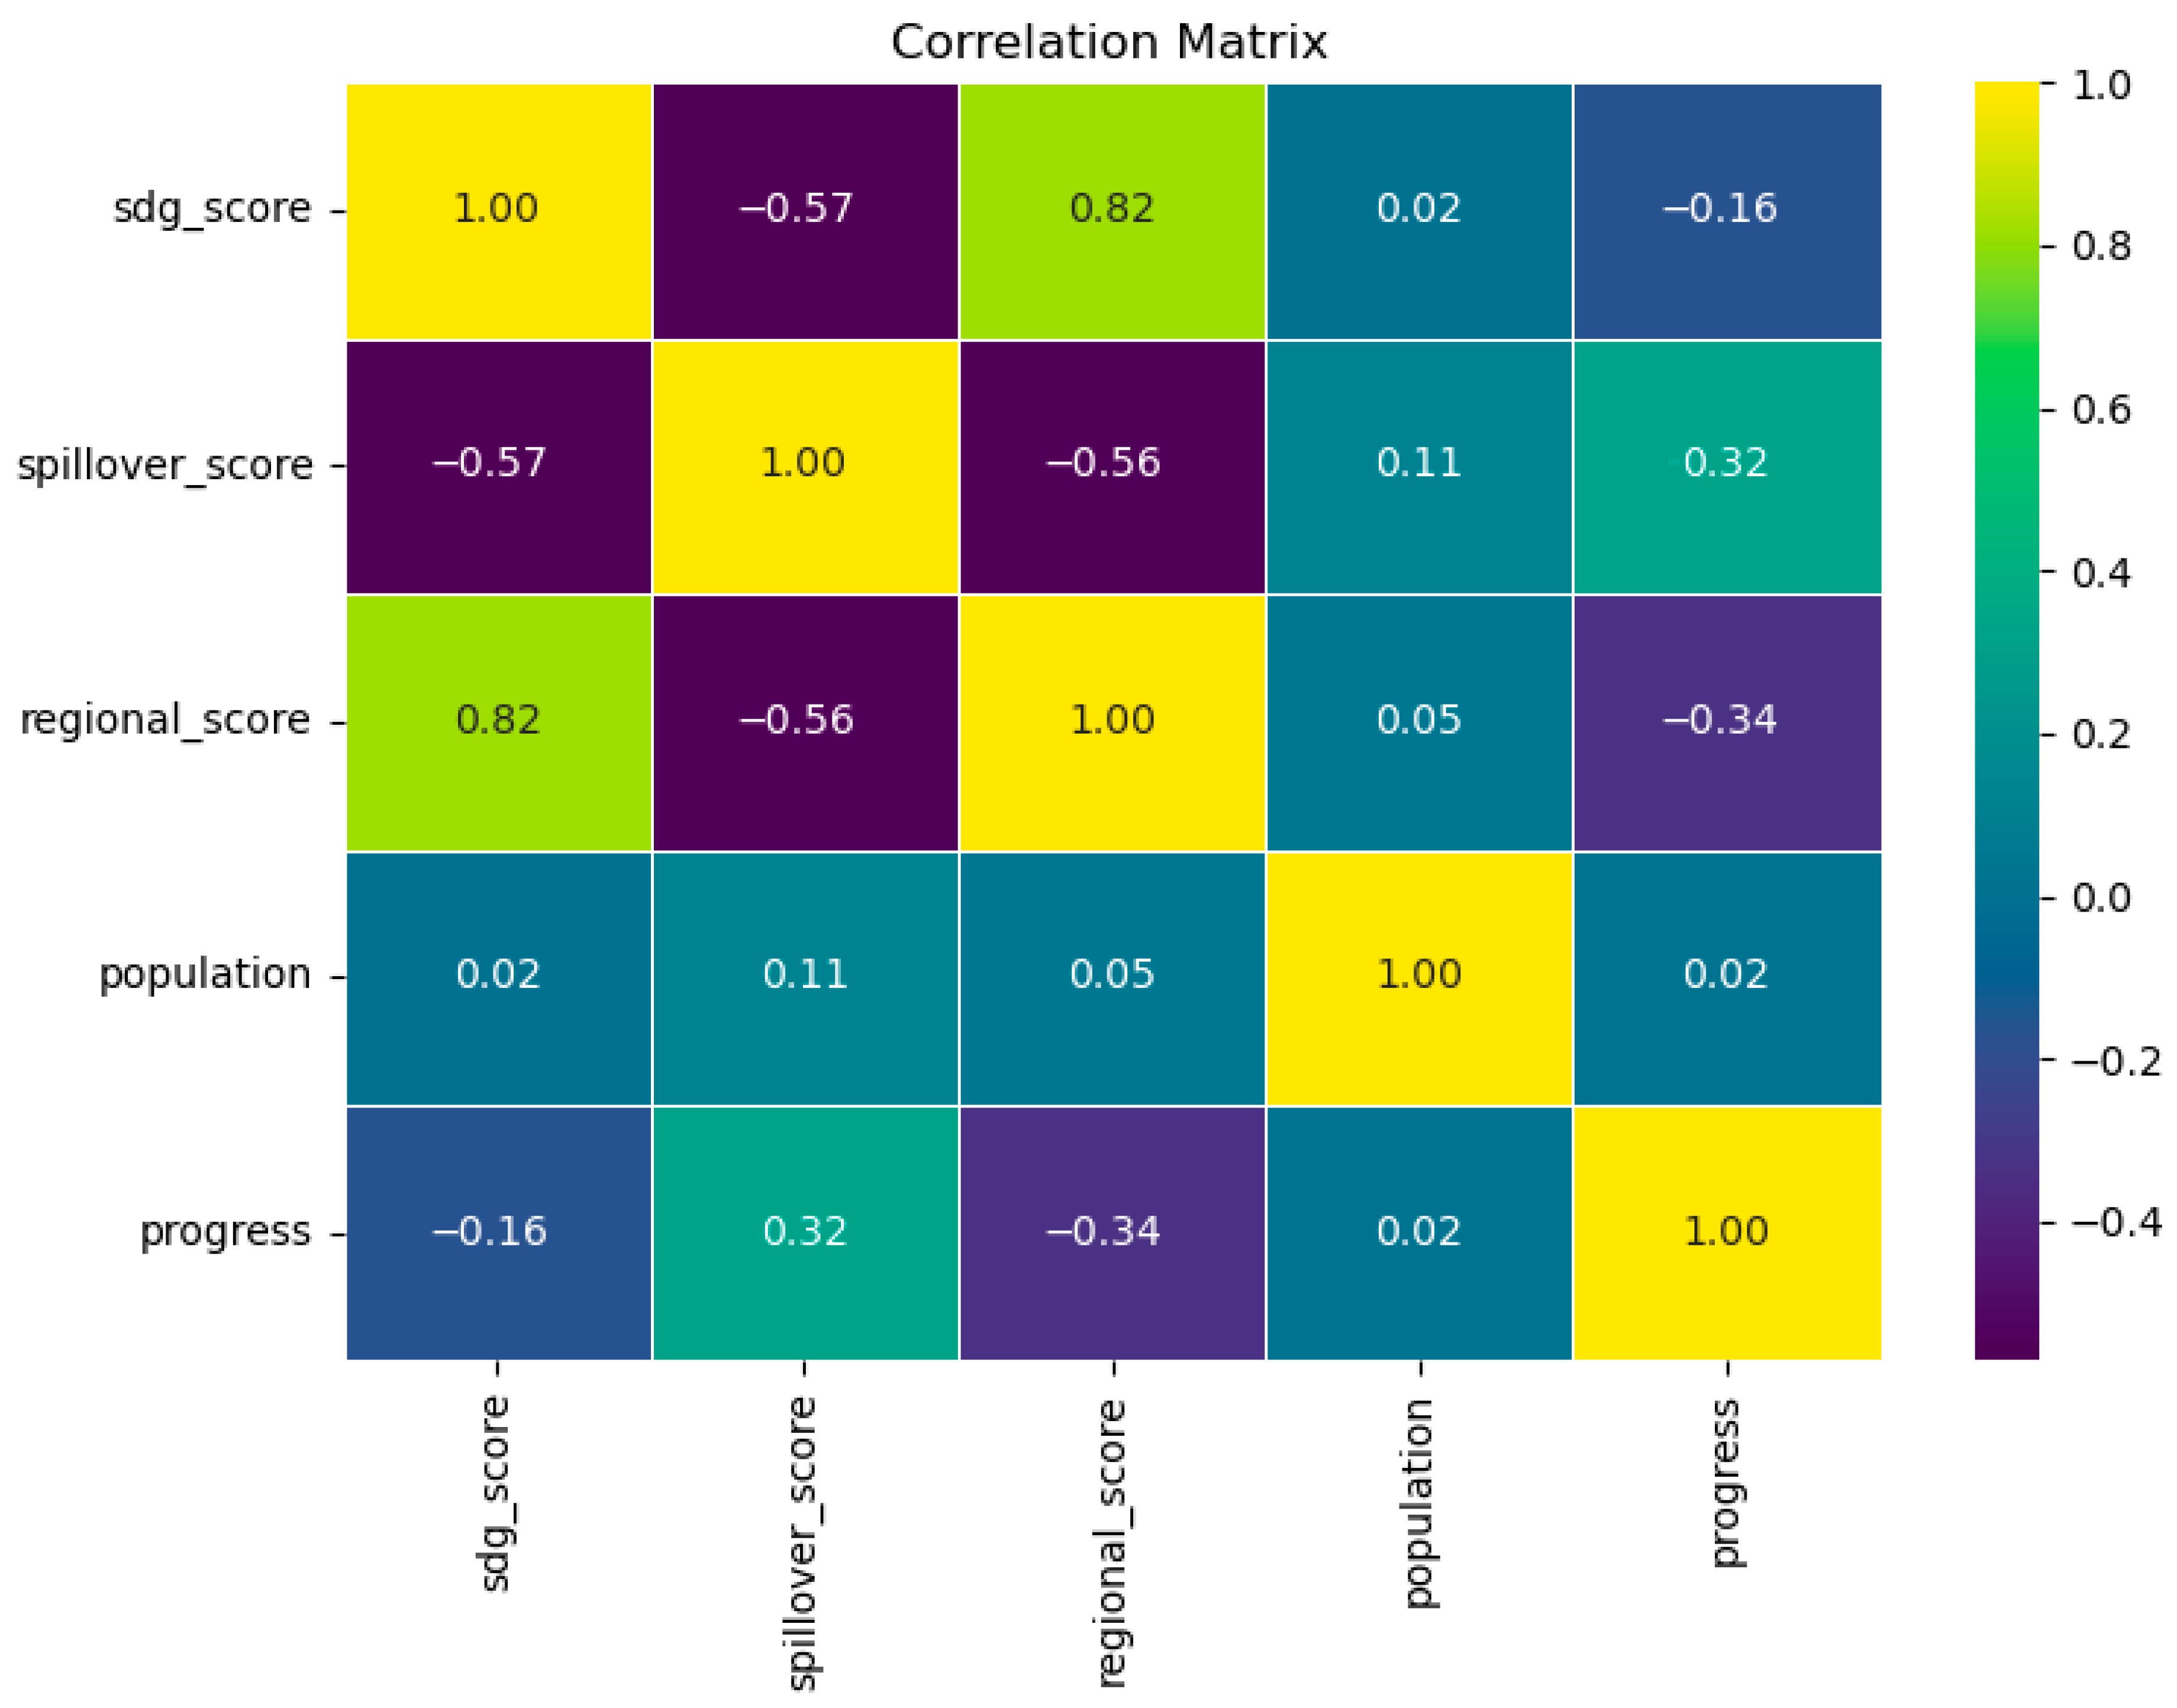
For examining correlations among the most important sustainability indicators, Pearson’s correlation analysis was performed applying the SDG Index score, international diffusion score, regional score, population and SDG progress rate variables. Figure 4 displays the resulting correlation matrix.
The correlation test reveals several significant and theoretically relevant relationships between the indicators of sustainability. Firstly, the SDG Index score and the regional score are highly positively correlated (r = 0.82), which means that the success of a country in terms of sustainability is strongly connected with the trajectories of development and cooperation frameworks within its regional surroundings. The outcome highlights the need for policy harmonization and coordination at the regional level in driving sustainable development outcomes.
Conversely, there exists a weak but inverse relationship (r = −0.57) between the SDG Index score and the international spillover score. In a counterintuitive manner at first glance, the result agrees with emerging literature proposing that high-performing countries in the SDG Index are inclined to outsource environmental and social costs through trade, consumption-based emissions, and extended global value chains. That is, while they achieve superb domestic sustainability performance, they can simultaneously participate in global unsustainability by exporting adverse impacts (e.g., high-carbon manufacture, depletion of resources) to developing countries. This highlights an important paradox of world sustainability and suggests the necessity for additional comprehensive global responsibility metrics that consider consumption-based footprints and environmental debt.
Interestingly, the variable for population does not correlate at all with significant sustainability indicators such as the SDG Index score (r = 0.02), regional score (r = 0.046), and progress score (r = 0.02). This finding, while seemingly opposite to some of the earlier studies highlighting population as an important determinant of sustainability impact (specifically through aggregate use of resources or emissions), refers to an important distinction: the comparison here is between normalized, per-country performance indicators and not against unadorned environmental impact.
In addition, the progress variable is also negatively correlated with the regional score (r = −0.34) and SDG score (r = −0.16), which suggests that recent advances in sustainability are occurring more rapidly in countries that initially scored lower, possibly an indicator of convergence effects or late-convergence catch-up processes by developing countries.
In general, these correlations promote the idea that sustainability performance is a multidimensional and internationally interconnected phenomenon. They underscore the need to measure both internal progress and externalized effects to create equitable and balanced sustainability evaluations.

4.2. Clustering Analysis

The use of K-Means clustering in this study is driven by its computational speed, scalability, and suitability for high-dimensional, normalized numeric datasets like the SDG Indicators used here. Compared to hierarchical clustering, which becomes computationally expensive as the size of the dataset increases, or DBSCAN, which is sensitive to parameter tuning and performs less well on clusters with different densities, K-Means is a more interpretable and stable solution for clustering countries on sustainability performance. The process is amenable to the goal of the study of globally comparable, mutually exclusive, and collectively exhaustive country groupings. For cluster validation, supervised machine learning algorithms Random Forest, SVM, and ANN were chosen due to their high generalization capacity, high accuracy in multi-class classification problems, and complementary algorithm philosophies ensemble learning, margin-based separation, and deep learning, respectively. These methods not only impart robustness against different data types but also allow for feature importance interpretability and high discriminatory power, which is validated by ROC and confusion matrix analyses.
For the current study, K-Means clustering analysis was applied to better understand the sustainability performance of countries and to segment them into clusters of similar characteristics. However, the determination of the number of clusters is a crucial step in terms of the explanatory power of the model as well as interpretability. Therefore, the Elbow method and Silhouette score were compared to select the number of clusters. The outcome of the analysis is shown in Table 2 and Figure 5.
The WCSS values in Table 2 show that the within-cluster variance decreases continuously with an increasing number of clusters, but the rate of decrease is remarkably slow after four and five clusters. Meanwhile, the Silhouette score is the maximum at k = 5, suggesting that the clusters at this value of k are well-separated and also internally consistent. Figure 5 shows both the elbow point of the WCSS graph and the corresponding silhouette coefficients, showing strong empirical evidence for the optimal number of clusters being five for this data.
The values listed in Table 2 suggest that the WCSS (within-cluster variance) is decreasing as the number of clusters increases; however, the rate of decrease slows down tremendously when four and five clusters are reached. On the other hand, with consideration of the Silhouette values, the highest average separation value of 0.4055 is obtained for five clusters. This means that the clusters are both internally cohesive and clearly differentiated from each other. It is therefore logical to choose the five-cluster model to cluster the nations meaningfully and equitably based on their sustainability performance. Furthermore, from the Elbow and Silhouette graphs in Figure 3, five clusters represent the best compromise both from economic variance and cluster separation. To this end, 5 was employed as the number of clusters in the analyses.
K-Means cluster analysis was utilized within the study to make the countries’ sustainability performance more understandable and to group them into homogeneous clusters. With this segmentation, the countries were categorized into important groups according to aspects such as SDG index scores, global impacts, regional scores, population and progress indicators. Ascertaining how many groups is a pivotal step both for model interpretability and distinguishing the groups from each other. According to the analysis, as can be seen in Figure 6, the five-group structure provides the optimal trade-off.
Figure 6 provides a visual validation of the five-cluster solution. It shows a 3D projection (via PCA) of the countries plotted and color-coded by their respective clusters. The country labels help us to pick out regional patterns and relationships more easily. For instance, developed economies like those in Cluster 2 can be clearly distinguished from fast-growing, large-population nations like China and India (Cluster 3), or from poorer Sub-Saharan ones (Cluster 1).
Principal Component Analysis (PCA) was performed to reduce the dimensionality of the original dataset and facilitate both visualization and clustering. Three principal components (PCs) were retained based on their ability to collectively explain 89.04% of the total variance in the dataset, ensuring minimal information loss. Specifically, the first component (PC1) explained 50.84%, the second (PC2) 20.49%, and the third (PC3) 17.71% of the variance.
The loadings of the PCA components revealed that
  • PC1 is heavily influenced by sdg_score and regional_score, and negatively by spillover_score, indicating a general sustainability gradient.
  • PC2 is almost entirely driven by the population variable, distinguishing countries by size.
  • PC3 strongly reflects the progress metric, capturing recent sustainability dynamics.
These components were then used to project countries into a 3D space for clearer visualization and to serve as input for K-Means clustering, ensuring the clusters are formed in a transformed feature space where variance is more meaningfully captured.
Figure 6 illustrates a 3D PCA projection of the country clusters and exhibits visual confirmation of the five-cluster structure. Country labels and color-coded cluster membership facilitate the revelation of regional patterns.
Cluster 0 (n = 56) includes emerging and developing economies from Eastern Europe (e.g., Belarus, Moldova, Serbia), Latin America (e.g., Argentina, Uruguay, Chile), and Asia (e.g., Indonesia, Kazakhstan, Malaysia, Vietnam, Thailand). They share medium sustainability performance but differ in terms of institutional strength, growth trends, and socioeconomic features, responsible for intra-cluster differentiation.
Cluster 1 (n = 33) consists predominantly of Sub-Saharan African nations such as Ghana, Tanzania, Mozambique, Chad, and Nigeria. They all share structural development obstacles, weaker institutional capacity, and ongoing underperformance in SDG attainment, though some have recent proof of enhancement.
Cluster 2 (n = 35) consists primarily of industrialized high-income countries in Europe, North America, Oceania, and East Asia, such as Sweden, Germany, Canada, Japan, and Australia. They are consistently performing well in most SDG indicators with robust systems of governance and green pledges.
Cluster 3 (n = 2) includes only China and India. Both are large-population, high-growth economies with unique sustainability pressures and challenges. With differing economic and political models aside, their common traits of rapid urbanization, energy demands, and climate vulnerability make them warrant separate classification.
Cluster 4 (n = 17) is a diverse cluster that comprises low-performing nations from various regions like Afghanistan, Haiti, Papua New Guinea, Kenya, and Venezuela. These nations typically face political instability, openness to global spillovers, or environmental vulnerability, limiting their capability for sustainability.
The five clusters clearly differentiate countries based on their sustainability performance and provide evidence-based ground for tailored policy frameworks. Cluster sizes (2–56 nations) reflect the diversity and uneven progress of world sustainable development. A Silhouette score of 0.4055 also supports the moderate-to-high internal consistency of the clustering model.
To evaluate the validity and discriminative power of the cluster results in detail, both univariate ANOVA and multivariate MANOVA tests were applied to the principal components employed for clustering. These statistical tests provide quantitative evidence of significant group differences beyond visual inspection or similarity measures by examining whether the clusters significantly differ depending on their feature distributions [68]. Such hypothesis tests are important to make sure that the resulting clusters are statistically distinct subgroups in the data, thus increasing the validity and interpretability of the cluster analysis method. The results of the ANOVA and MANOVA tests are presented in Table 3 and Table 4, respectively.
The univariate ANOVA tests in Table 3 show that it is statistically extremely significant that differences exist among the clusters for both principal components (PCA1 and PCA2) (p < 0.001). This is an indication that the components distinctly differentiate the clusters from each other. In addition, the results of multivariate MANOVA tests in Table 4 also confirm that there are significant differences among the clusters; all the test statistics (Wilks’ Lambda, Pillai’s Trace, Hotelling–Lawley Trace, and Roy’s Largest Root) are statistically significant (p ≈ 0.000). These findings confirm that the clusters are well separated from each other both when alone and when multiple dimensions are considered and fully attest to the fact that the clustering algorithm can successfully capture the underlying structural differences in the data.
To compare the basic characteristics of the five clusters obtained based on the sustainability indicators in the study, the mean values of the corresponding variables for each cluster were normalized through Min-Max normalization. Normalization enabled variables of different scales to be compared by scaling them to a common plane. Hence, the relative differences between the country’s profiles of sustainability performance were visually rendered more evident, and statistical comparison was possible. The findings achieved in this respect are depicted in Figure 7.
The normalized scores in Figure 7 show quantitative differences for the five clusters grouped based on countries’ sustainability indicators. The 0-to-1-scaled scores make it easy and comparable to standardize among clusters.
Cluster 0 (n = 56) exhibits moderate-to-high performance on all but one of the scales: sdg_score (0.605), regional_score (0.705), spillover_score (0.827), and progress (0.769). The population score is extremely low (0.009), which means they are mostly mid-sized or small countries with steady progression toward sustainability and comparatively low global influence.
Cluster 1 (n = 33), comprising most Sub-Saharan African nations, boasts the lowest normalized values for sdg_score (0.027), regional_score (0.000), and population (0.000) but the highest possible score in progress (1.000). These are nations with historically poor sustainability performance but significant recent progress, possibly owing to heightened development efforts or concentrated international support.
Cluster 2 (n = 35) consists of high-income countries with the most advanced scores on both sdg_score (1.000) and regional_score (1.000), but minimal progress (0.286) and low population (0.004). These findings suggest that while these countries are already at the leading edge of sustainability, their recent development progress is more incremental.
Cluster 3 (n = 2) includes China and India with very high population (1.000), spillover_score (0.965), and progress (0.825), and relatively moderate levels of sdg_score (0.590) and regional_score (0.659). These indicators reflect the complex sustainability dynamics of these large, rapidly growing economies, including global outreach and swift domestic change.
Cluster 4 (n = 17) possesses the lowest sdg_score (0.000), progress (0.000), and regional_score (0.291) values, together with the highest spillover_score (1.000) and lowest population (0.016) values. This shows that these politically unstable or vulnerable nations are disproportionately affected by externalities, say, global shocks or geopolitical instability.
Quantitative evidence supports the claim that the clusters are not only statistically distinct but also practically meaningful in terms of sustainability characteristics. Each cluster profile guides policy interventions, supporting the value of this clustering approach to policy-oriented decision-making for sustainable international development.
This research was conducted to examine whether the clusters, according to the countries’ sustainability performances, were significantly different from each other. That is, cluster-based descriptive statistics were calculated for determining whether there were significant differences among the centers (mean) and distributions (standard deviation) of the clusters, and one-way ANOVA tests were employed for every attribute.
Statistically significant cluster differences were found for all variables according to the results in Table 3 (p < 0.001 for all). The very high F-values, and especially the regional_score and population variables, indicate that these variables have a strong separating effect between the clusters. In addition, low-level sustainability indicators such as sdg_score and spillover_score also showed significant cluster differences. While there was significant variation in the progress variable, the variation was of a relatively moderate kind compared to the other variables.
These results suggest that the five clusters produced in the cluster analysis are not merely arbitrarily split groups in the case of the sustainability profiles of the countries; instead, they systematically and meaningfully differ from one another. That is, the clustering algorithm has been able to effectively split the countries into groups according to their distinct sustainability dynamics. This suggests that policy makers have to design differentiated strategies based on the different structure of each cluster.
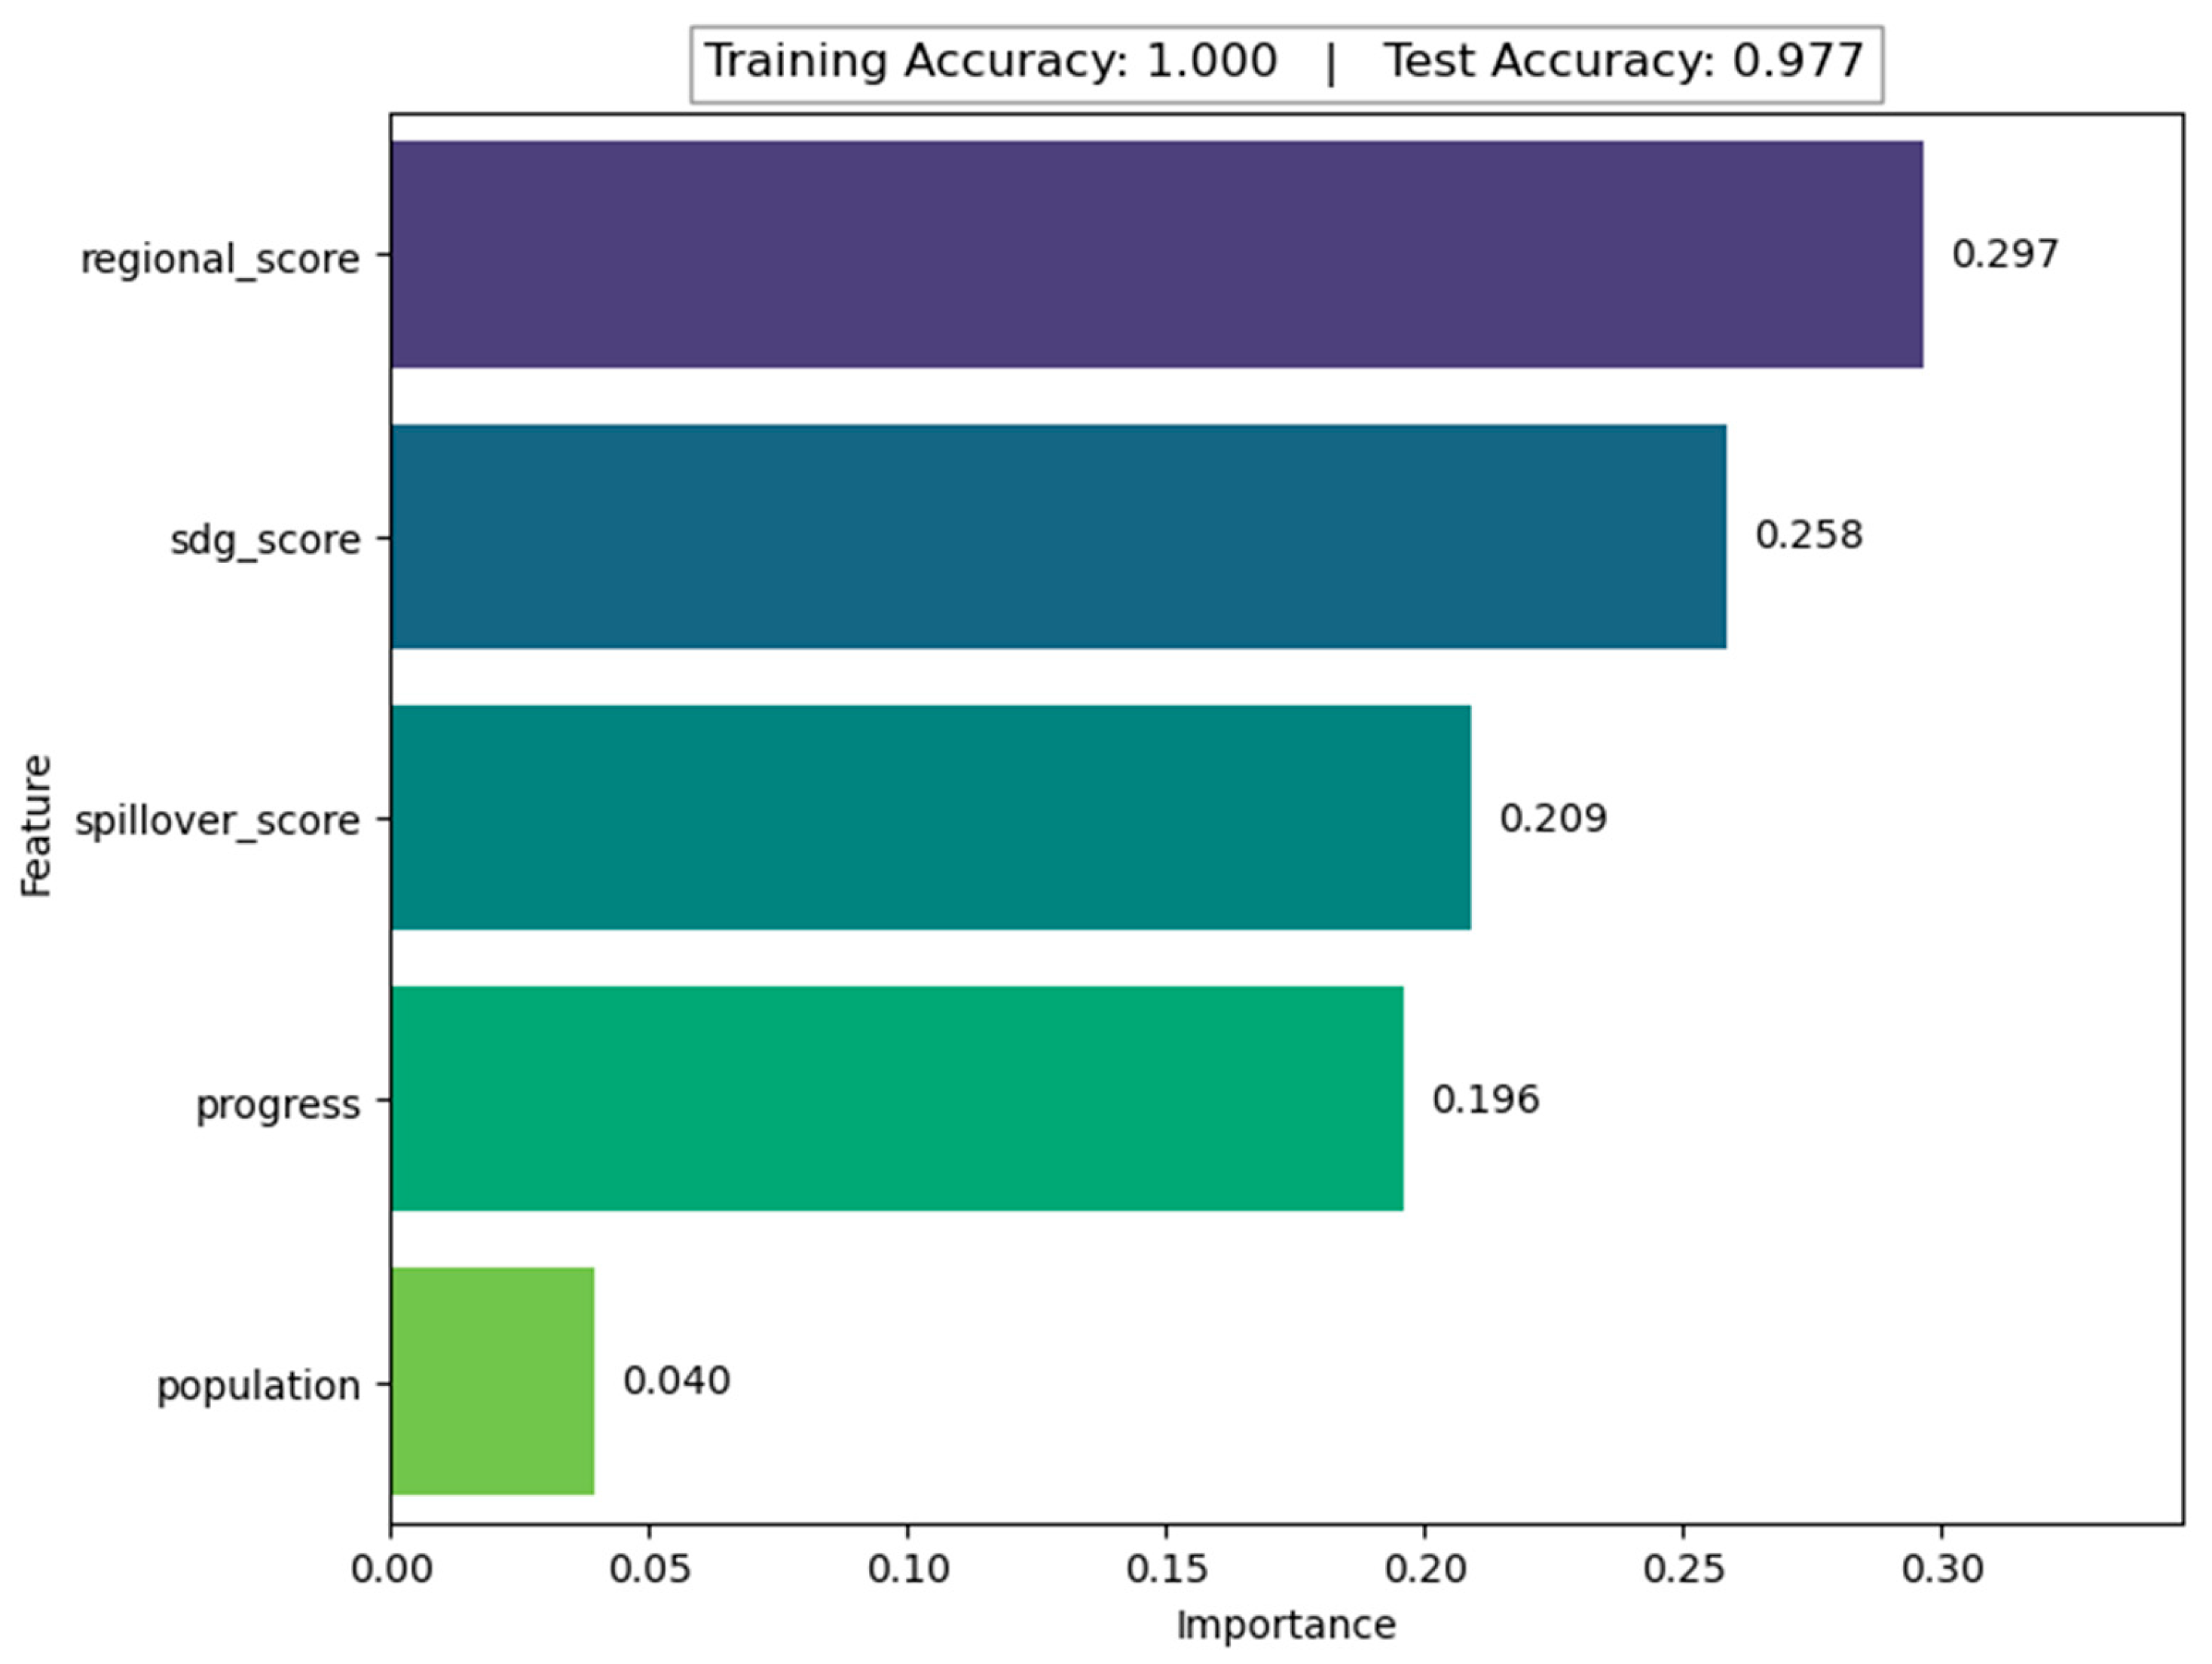
Using the Random Forest classifier in the analysis, the aim was to determine which variables sort the clusters apart from each other. Here, the model was trained with cluster labels, and the relative importance of each variable for sorting the clusters apart (feature importance) was calculated, and the variables on which the clustering was decided were calculated numerically. Thus, the most significant variables describing the cluster composition are statistically revealed. This facilitates differences in interpretation between clusters and clearly shows which variables distinguish the clusters most. Figure 8 displays the results of the Random Forest analysis.
The results in Figure 8 show that the regional_score, sdg_score, and spillover_score variables are the most effective features in the separation of clusters. While the progress variable also makes an important contribution, the relative contribution of the population variable is very low. This shows that the population is not highly determined in the formation of clusters, but other sustainable development indicators have more effective roles in clustering. This result has important policy and theoretical implications. The high ranking of regional_score and sdg_score suggests that sustainability performance is not only a domestic occurrence but also highly dependent on the regional local setting. This supports the existing literature emphasizing the spatial embeddedness of sustainability, where policy, institutions, and economic linkages of neighboring nations reinforce or suppress sustainable performance. Similarly, spillover_score highlight indicates that the global connectedness of nations, through trade, finance, migration, or environmental spillovers, plays a central role in shaping their SDG performance. These findings reinforce arguments in the sustainability governance literature for regional and transnational coordination mechanisms rather than, or in conjunction with, national approaches. In contrast, the comparatively lower importance of population implies that absolute size may not in fact predict sustainability outcomes, contradicting conventional assumptions that more populous nations always face greater sustainability challenges. Combined, the importance of the findings of features highlight context-sensitive, multi-scalar governance measures that synthesize both domestic policy and transnational implications.
The training accuracy of the model is 1.000 and its test accuracy is 0.977, which means that the classification model not only perfectly fits the training data but also achieves high success in the test data. That means the clusters are well separated from each other and the model is capable of separating the clusters appropriately. Therefore, it is strongly confirmed that both the clustering algorithm produces meaningful clusters and the features selected help in this differentiation.

4.3. Validating the Accuracy of Clusters with Machine Learning Algorithms

In this study, classification models of machine learning were used to examine the accuracy and separation ability of the clustering algorithm. The accurate estimation of cluster labels shows that the clusters obtained are valid and meaningful. In this context, five clusters obtained via K-Means were tried to be estimated through different classification algorithms. The analysis results are shown in Table 5.
When Table 5 is examined, it is seen that the Random Forest, SVM, and ANN models are the most accurate models (0.977). These models also show that they can classify clusters effectively with high macro-average precision, recall, and F1 score values (e.g., F1 score 0.984 for ANN). The XGBoost model, however, showed lower performance compared to the others (accuracy: 0.907; F1 score: 0.718). These results suggest that strong ensemble and margin-based classifiers such as Random Forest and SVM isolate clusters effectively. The ability to classify the obtained clusters and thus the validity of the results of the cluster analysis are thereby confirmed.
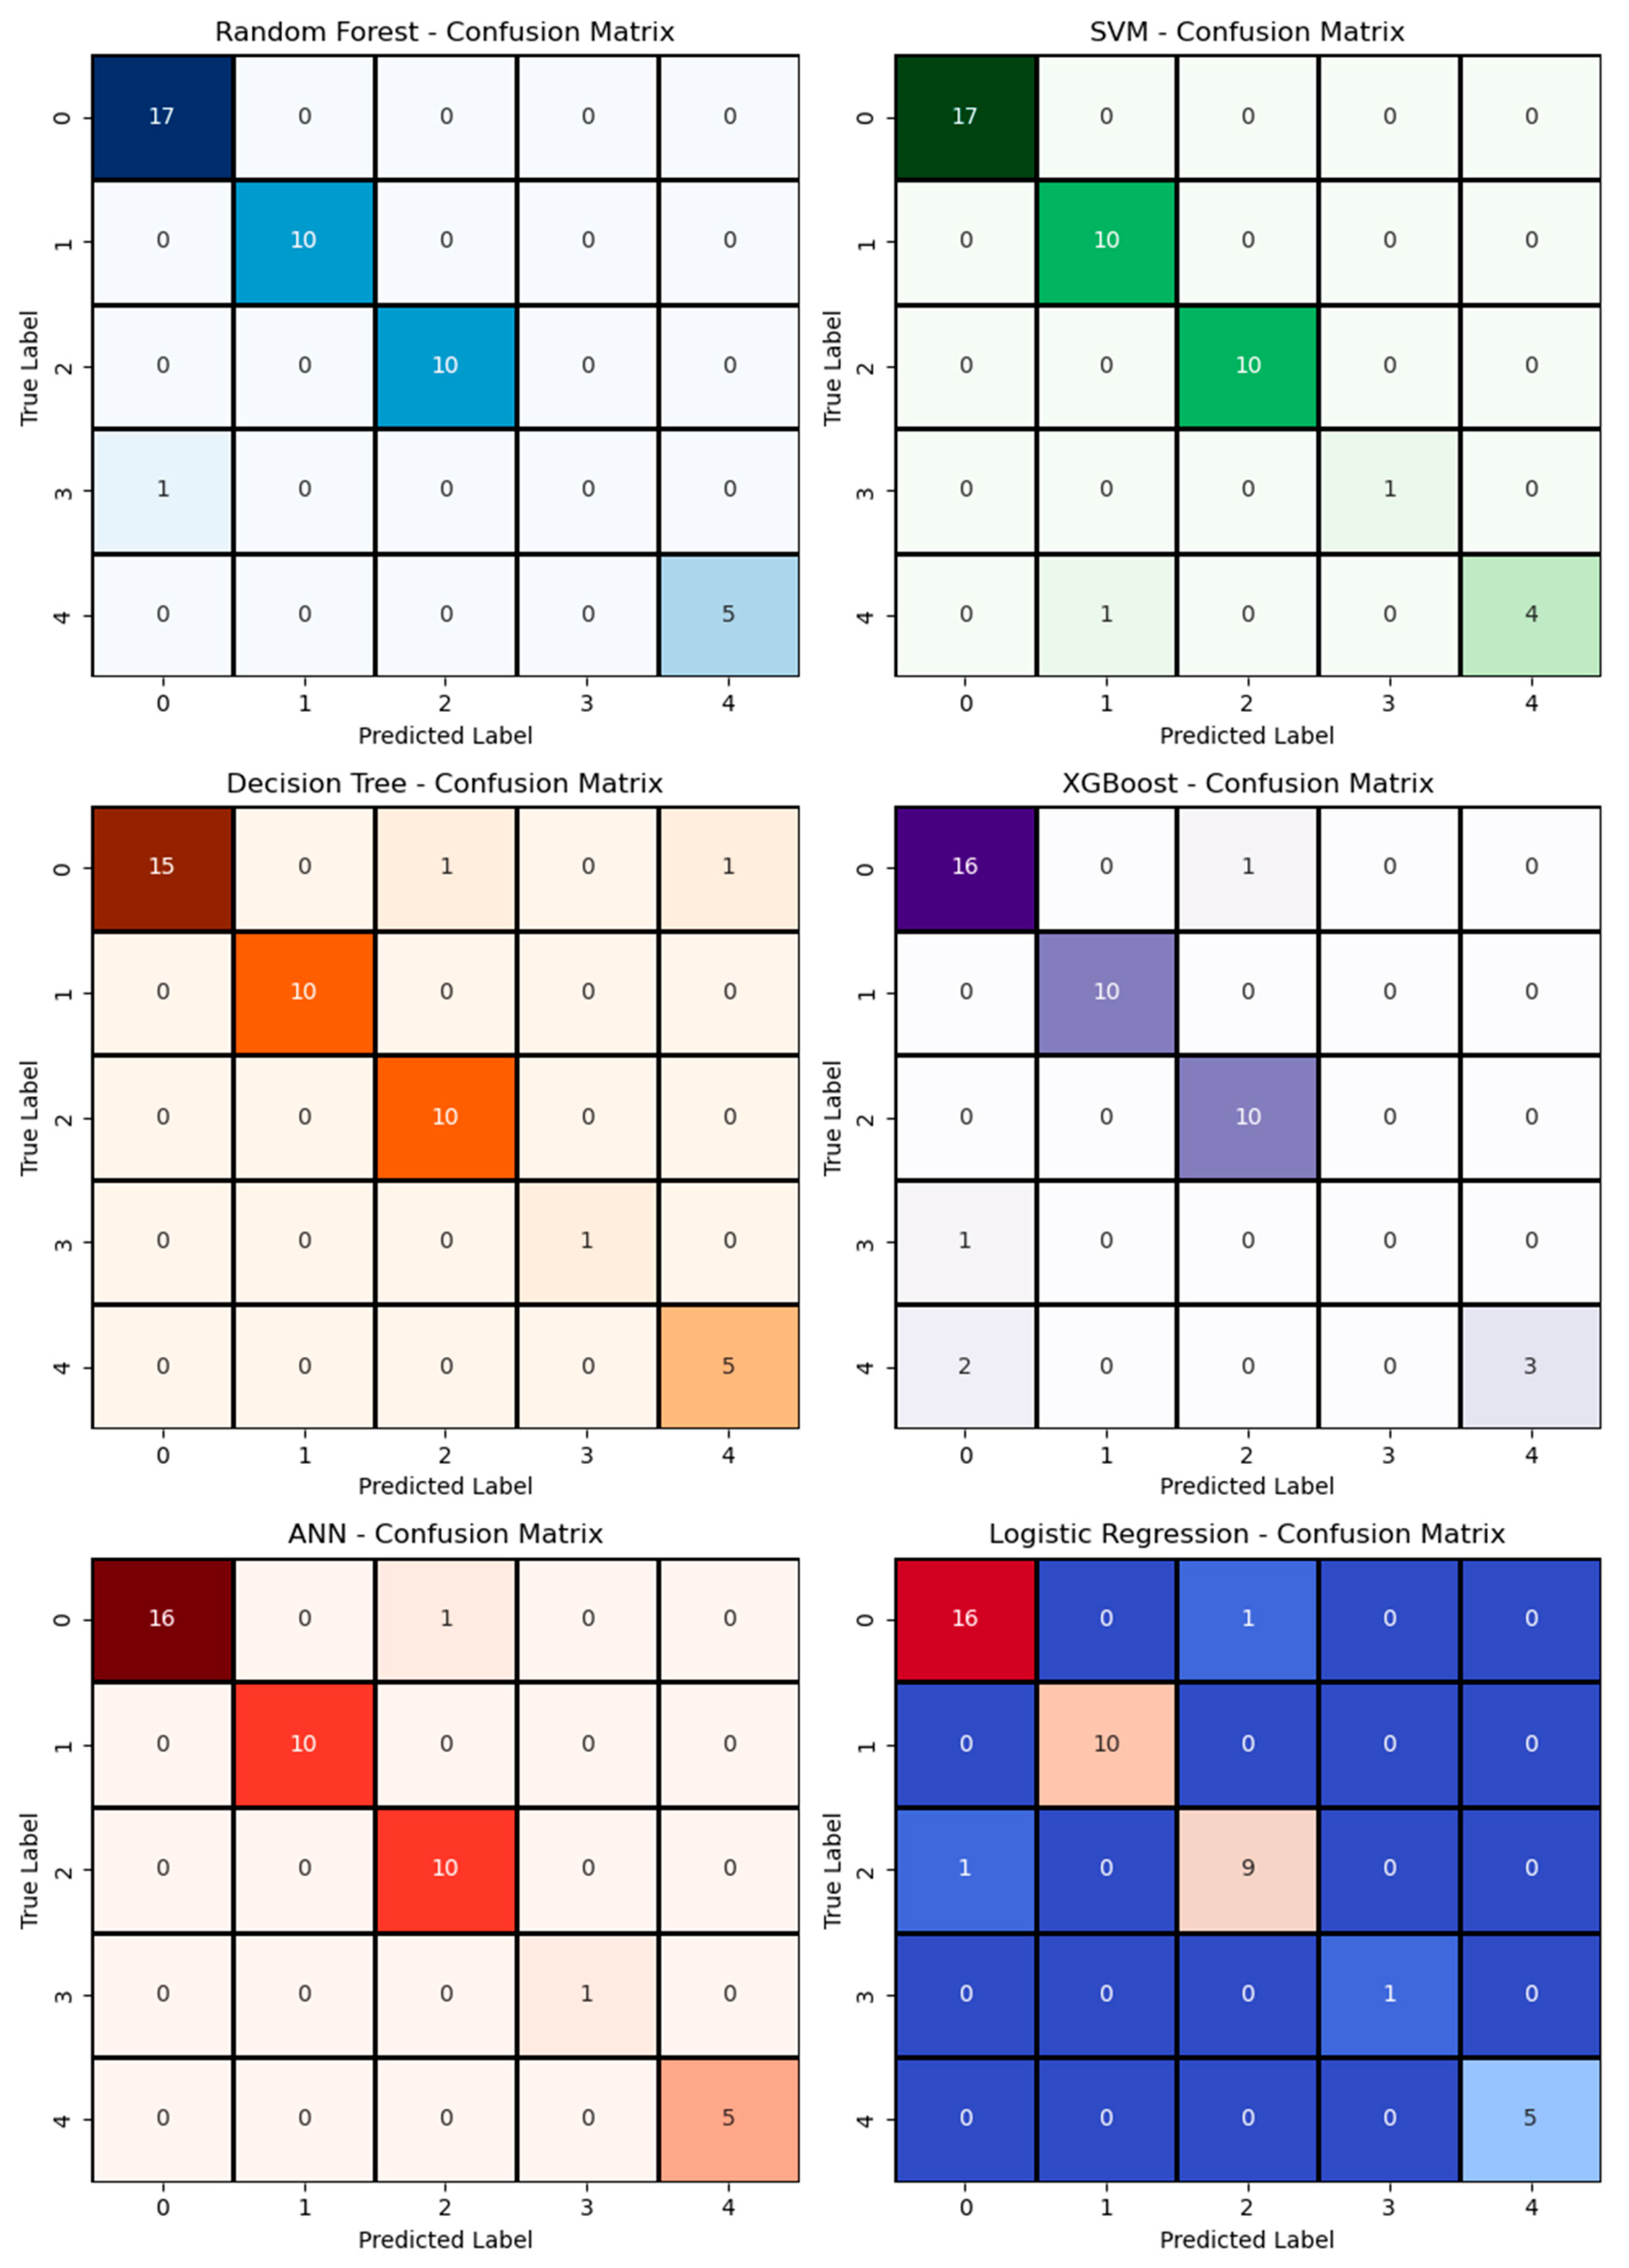
The outputs of the confusion matrices in Figure 9 show in detail the extent to which each machine learning algorithm can correctly classify the clusters obtained with K-Means. These matrices are essential to understand how successful the models are on a class-by-class basis and where they make more mistakes.
The Random Forest model was accurate in four clusters; it wrongly classified just one observation of the fourth class as the first one. In general, this model has the ability to distinguish highly well between classes and distinguish all clusters in a unique manner. This shows that Random Forest delivers consistent and balanced performance in classification.
The SVM model also developed a similarly high accuracy classification, mislabeling only one observation for the fifth class as the second class. The remaining observations were labeled correctly. This shows that SVM’s margin-based classification approach develops a good cluster separation and correctly determines decision boundaries between classes.
In the Decision Tree model, two instances of the first class were incorrectly labeled into other classes (one in the third, one in the fifth). Complete classification was performed in all other classes, however. Since the decision tree model is likely to overfit the data, some confusion is expected.
For the XGBoost model, one can say that the error rate is relatively higher. In particular, two fifth-class observations were misclassified as the first class. Furthermore, one fourth-class observation was misclassified as the first class. This instance shows that XGBoost cannot perform clear discrimination between some classes, and its discrimination power is decreased. Model complexity and parametric sensitivity can cause this kind of instability in small datasets.
The ANN model classified only one observation from the first class as the third class in error. The rest of the classes were accurately predicted. These results verify that the multilayered nature of the ANN is beneficial in learning intricate relationships among clusters and improves the performance of classification.
The same occurs with the Logistic Regression model. Two misclassifications were performed for the first three classes (one from the first to the third class; one from the third to the first class). All remaining classes were correctly separated. This is a sign that this model with linear decision boundaries is largely successful, but it may cause minimal confusion owing to proximity between classes.
By and large, confusion matrices show that Random Forest, SVM, and ANN models are able to establish more clear-cut distinctions between classes whereas Decision Tree, XGBoost, and Logistic Regression models make more errors in some classes. The high error rate of the XGBoost model particularly shows that such a model has to be calibrated very carefully in cases where class differentiation becomes difficult.
Accordingly, Table 5 and Figure 9 show the performance of the machine learning algorithms used in cluster definition and establish that the Random Forest, SVM, and ANN models especially provide precise and reliable prediction of clusters.

4.4. Visualization and Model Performance Assessment with ROC Curves

One of the most effective methods used to determine the accuracy of clustering outcomes is the analysis of the class-based discrimination performance of supervised algorithms with ROC curves. In doing so, not only are the overall accuracy ratios revealed but also how much each cluster (class) can be separated accurately by the model. In this regard, the ROC curves generated for every model are shown in Figure 10, and the AUC (Area Under the Curve) values computed for each class are marked directly on the plots.
The major advantage of ROC curves is that the models function not just with absolute accuracy but also with sensitivity and specificity as well, balanced for the classification. Through this, the extent of success in discriminating against clusters of similar characteristics or being on the boundary can be scrutinized in detail.
When Table 5 and Figure 10 are evaluated together, it is seen that the Random Forest, SVM, and Artificial Neural Network (ANN) models possess very high AUC values for all classes. SVM and ANN, especially, reached maximum discrimination with an AUC value of 1000 for all classes. This shows that these models have the capacity to distinguish all clusters with 100% sensitivity and specificity. The Random Forest model also scored an AUC value of 1000 for four classes, deviating slightly from the perfect performance with an AUC of 0.9977 for Class 0.
Although the Decision Tree model was generally high in performance, the AUC value for Class 4 dropped to 0.9000. This means that the tree is sometimes not enough to distinguish between this class and others. The XGBoost model was nonetheless able to obtain a 0.1905 AUC score for Class 3 alone, and the low score means that this class was not distinguishable from the other classes. Although XGBoost’s AUC was good in the other classes, this imbalance reduced the overall ROC AUC average of the model and undermined the inter-class stability. Similarly, the Logistic Regression model, in general, exhibited a powerful and well-balanced performance, with an AUC score of 0.9909 for Class 2 and 0.9796 for Class 0, yielding very successful results.
These findings underscore the importance of evaluating classification algorithms not only with overall accuracy metrics but also with ROC curves on a per-class basis. Because although some models have high accuracy percentages, their discrimination power becomes undermined in certain classes, which can question the model’s overall generalization ability. For example, although XGBoost’s overall accuracy is seemingly high, its reliability of application remains limited due to the failed discrimination in Class 3.
Therefore, the analysis performed on ROC curves shows that the ANN, SVM, and Random Forest models especially provide not only overall success but also well-balanced and reliable predictions in all classes. This analysis supports the structural separability of the clusters both from a statistical and model-based classification point of view; Figure 10 provides the visual representation of this overall comparison.

5. Conclusions and Discussion

This study provides a comprehensive analysis of international sustainability performance using the 2025 SDG Index dataset, backed by advanced machine learning techniques. The study contributes methodologically and policy-wise by integrating unsupervised clustering with supervised classification to identify, explain, and validate country-specific groupings of sustainability.
The K-Means cluster identified five clusters along with corresponding sustainability dynamics. Cluster 2, which mostly comprised high-income OECD countries, exhibited improved performance in SDG Index score and regional score but with limited recent improvements. Cluster 1, comprising mostly countries in Sub-Saharan Africa, exhibited low initial performance but also high rates of recent progress, emphasizing the need for targeted support and adaptive policy instruments. The unique positioning of China and India in their own cluster reflects the weight of their populations and development trajectory, thereby highlighting the need for differentiated strategies in big emerging economies.
Statistical cross-validation with ANOVA and MANOVA ensured the structural distinctness of such clusters. Additionally, Random Forest classification identified regional_score and sdg_score as the most discriminative features, and population had limited predictive power, casting doubt on the hypothesis that population is a measure of sustainability impact.
Supervised learning models like ANN, SVM, and Random Forest were found to have extremely high AUC and classification accuracy values, validating the feasibility of cluster separability. ROC curve analysis supported these results by highlighting models’ sensitivity and specificity in distinguishing between cluster memberships. Notably, the ANN and SVM models recorded perfect AUCs for most classes, making them good predictive instruments for future sustainability assessment.
The value of this study is twofold. At a methodological level, the hybrid analytical pipeline laid out in this paper offers an interpretable and replicable pathway for sustainability performance analysis. At a policy level, the clustering outcomes provide a helpful template for tailoring development strategies to locally relevant challenges and strengths. From this, each cluster points towards customized policy directions. For Cluster 2 (high-income/OECD nations), the focus should then shift away from traditional SDG achievement towards innovation-based sustainability and global leadership, i.e., climate adaptation funding for underperforming areas or green tech transfer investment. For Cluster 1 (predominantly Sub-Saharan Africa), development aid should be complemented through long-term institutional capacity building, infrastructure support at a basic level, as well as local SDG implementation, facilitating equity and resilience. Cluster 3, China and India, needs customized approaches respecting their size and complexity—urban sustainability planning, emissions management, and managing fast growth with efficiency. Cluster 0, the mid-performers, would benefit from policy harmonization, knowledge-sharing forums, and steps to ensure decreased volatility in performance. Finally, Cluster 4, consisting of small or politically exposed countries, requires global cooperation for spillover avoidance, targeted external support, and policy measures based on resilience, considering exposure to global externalities. Such differentiated strategies ensure the SDG agenda is tailored to national circumstances but remains consistent with international objectives.
However, this research also presents some limitations. Country-level aggregates potentially mask intra-national differences. Moreover, the analysis is cross-sectional and not longitudinal, looking only at data from a single year. Additional research would be able to extend this framework longitudinally and explore dynamic dynamics across sustainability clusters over time.
However, some key limitations need to be considered. First, the cross-sectional design of this analysis using the 2025 SDG Index alone cannot analyze dynamic trends in sustainability over time. Therefore, it cannot depict the temporal change in performance of countries or policy changes that can affect future developments. Second, even if the SDG Index is a useful composite index, it is compromised by methodological weaknesses like indicator selection biases, data availability shortfalls, and the subjective weight of weighting schemes. These can generate distortions in country rankings or cluster allocations. Third, because this study employs country-level aggregates, it can hide significant intra-national variation in sustainability performance, particularly in larger, diverse countries where subnational variation is considerable. Recognizing these constraints, future research can advance this model by employing a longitudinal approach, using time-series SDG data or adding subnational data if it exists. These additions would enhance the model’s explanatory value and utility for policy.
In short, this study demonstrates the power of machine learning for sustainability science to not just map global differences but also steer context-specific, evidence-based development paths. With the world sprinting towards the 2030 SDG target, such data-driven inputs will be pivotal in accelerating the world’s pace and leaving no one behind.

Author Contributions

Conceptualization, S.Ç., Ö.F.Ö., U.A. and M.Ü.Ş.; methodology, S.Ç., Ö.F.Ö., U.A. and M.Ü.Ş.; software, S.Ç. and U.A.; validation, S.Ç., Ö.F.Ö., U.A. and M.Ü.Ş.; formal analysis, S.Ç., Ö.F.Ö., U.A. and M.Ü.Ş.; investigation, S.Ç., Ö.F.Ö., U.A. and M.Ü.Ş.; resources, Ö.F.Ö., U.A. and M.Ü.Ş.; data curation, S.Ç., Ö.F.Ö., U.A. and M.Ü.Ş.; writing—original draft preparation, S.Ç., Ö.F.Ö., U.A. and M.Ü.Ş.; writing—review and editing, S.Ç., Ö.F.Ö., U.A. and M.Ü.Ş.; visualization, S.Ç., Ö.F.Ö., U.A. and M.Ü.Ş.; supervision, S.Ç., Ö.F.Ö., U.A. and M.Ü.Ş.; project administration, S.Ç., Ö.F.Ö., U.A. and M.Ü.Ş.; funding acquisition, Ö.F.Ö. and U.A. All authors have read and agreed to the published version of the manuscript.

Funding

This research received no external funding.

Conflicts of Interest

The authors declare no conflict of interest.

References

  1. Assembly, G. Resolution Adopted by the General Assembly on 1 September 2015. Available online: https://docs.un.org/en/A/RES/70/1 (accessed on 3 July 2025).
  2. Sachs, J.D.; Kroll, C.; Lafortune, G.; Fuller, G.; Woelm, F. Sustainable Development Report 2022; Cambridge University Press: Cambridge, UK, 2022. [Google Scholar]
  3. Sasmaz, M.U.; Sakar, E.; Yayla, Y.E.; Akkucuk, U. The Relationship between Renewable Energy and Human Development in OECD Countries: A Panel Data Analysis. Sustainability 2020, 12, 7450. [Google Scholar] [CrossRef]
  4. Di Vaio, A.; Palladino, R.; Hassan, R.; Escobar, O. Artificial Intelligence and Business Models in the Sustainable Development Goals Perspective: A Systematic Literature Review. J. Bus. Res. 2020, 121, 283–314. [Google Scholar] [CrossRef]
  5. Audretsch, D.B.; Belitski, M.; Caiazza, R.; Desai, S. The Role of Institutions in Latent and Emergent Entrepreneurship. Technol. Forecast. Soc. Change 2022, 174, 121263. [Google Scholar] [CrossRef]
  6. Awan, U.; Sroufe, R.; Bozan, K. Designing Value Chains for Industry 4.0 and a Circular Economy: A Review of the Literature. Sustainability 2022, 14, 7084. [Google Scholar] [CrossRef]
  7. Liu, Y.; Wen, X. Sustainability Assessment of Cities Using Multicriteria Decision-Making Combined with Deep Learning Methods. Sustain. Cities Soc. 2024, 111, 105571. [Google Scholar] [CrossRef]
  8. Diaz-Sarachaga, J.M.; Jato-Espino, D.; Castro-Fresno, D. Is the Sustainable Development Goals (SDG) Index an Adequate Framework to Measure the Progress of the 2030 Agenda? Sustain. Dev. 2018, 26, 663–671. [Google Scholar] [CrossRef]
  9. Mwitondi, K.S.; Munyakazi, I.; Gatsheni, B.N. A Robust Machine Learning Approach to SDG Data Segmentation. J. Big Data 2020, 7, 97. [Google Scholar] [CrossRef]
  10. De Neve, J.-E.; Sachs, J.D. The SDGs and Human Well-Being: A Global Analysis of Synergies, Trade-Offs, and Regional Differences. Sci. Rep. 2020, 10, 15113. [Google Scholar] [CrossRef]
  11. Bellantuono, L.; Monaco, A.; Tangaro, S.; Amoroso, N.; Aquaro, V.; Bellotti, R. An Equity-Oriented Rethink of Global Rankings with Complex Networks Mapping Development. Sci. Rep. 2020, 10, 18046. [Google Scholar] [CrossRef]
  12. Sciarra, C.; Chiarotti, G.; Ridolfi, L.; Laio, F. A Network Approach to Rank Countries Chasing Sustainable Development. Sci. Rep. 2021, 11, 15441. [Google Scholar] [CrossRef]
  13. Keys, P.W.; Barnes, E.A.; Carter, N.H. A Machine-Learning Approach to Human Footprint Index Estimation with Applications to Sustainable Development. Environ. Res. Lett. 2021, 16, 044061. [Google Scholar] [CrossRef]
  14. Souza, G.; Santos, J.; SantClair, G.; Gomide, J.; Santos, L. A Comparative Analysis of Countries’ Performance According to SDG Indicators Based on Machine Learning. In Anais do XVIII Encontro Nacional de Inteligência Artificial e Computacional (ENIAC 2021); Sociedade Brasileira de Computação: Porto Alegre, Brazil, 2021; pp. 141–152. [Google Scholar]
  15. García Villena, E.; Pascual Barrera, A.; Álvarez, R.M.; Dzul López, L.A.; Tutusaus Pifarré, K.; Vidal Mazón, J.L.; Miró Vera, Y.A.; Brie, S.; López Flores, M.A. Evaluation of the Sustainable Development Goals in the Diagnosis and Prediction of the Sustainability of Projects Aimed at Local Communities in Latin America and the Caribbean. Appl. Sci. 2022, 12, 11188. [Google Scholar] [CrossRef]
  16. Asadikia, A.; Rajabifard, A.; Kalantari, M. Region-Income-Based Prioritisation of Sustainable Development Goals by Gradient Boosting Machine. Sustain. Sci. 2022, 17, 1939–1957. [Google Scholar] [CrossRef]
  17. Vijayanand, D. From Data to Impact: Machine Learning Models for Sustainable Development Region Classification- Accelerating the Achievement of Sustainable Development Goals through Predictive Analytics. Int. J. Multidiscip. Res. 2023, 5, 1–12. [Google Scholar] [CrossRef]
  18. Wan, M.W.L.; Clark, J.N.; Small, E.A.; Mayoral, E.F.; Santos-Rodríguez, R. Monitoring Sustainable Global Development Along Shared Socioeconomic Pathways. arXiv 2023, arXiv:2312.04416. [Google Scholar] [CrossRef]
  19. Chang, S.; Abdelnour, Y.S.K.; Cardoso, I.M.C.; Kim, J.; Kim, S.T.; Oh, J.H. Assessing Regional Disparities in Human Development and Multidimensional Poverty: A Satellite Imagery and Machine Learning Approach. In Proceedings of the 2023 IEEE International Conference on Big Data (BigData), Sorrento, Italy, 15 December 2023; IEEE: New York, NY, USA, 2023; pp. 6113–6115. [Google Scholar]
  20. Yao, T.; Li, J. Environmental Sustainability Performance Assessment in Relation to Visibility in African Regions with Interpretable Machine Learning. J. Clean. Prod. 2023, 428, 139414. [Google Scholar] [CrossRef]
  21. Raj, R.; Arora, K.; Bagga, N.; Aggarwal, M. A Review of Machine Learning for Sustainable Development Goals. In 2024 7th International Conference on Contemporary Computing and Informatics (IC3I); IEEE: New York, NY, USA, 2024; pp. 50–54. [Google Scholar]
  22. Castelli, T.; Mocenni, C.; Dimitri, G.M. A Machine Learning Approach to Assess Sustainable Development Goals Food Performances: The Italian Case. PLoS ONE 2024, 19, e0296465. [Google Scholar] [CrossRef]
  23. Chenary, K.; Pirian Kalat, O.; Sharifi, A. Forecasting Sustainable Development Goals Scores by 2030 Using Machine Learning Models. Sustain. Dev. 2024, 32, 6520–6538. [Google Scholar] [CrossRef]
  24. Liu, Y.; Du, J.; Wang, Y.; Cui, X.; Dong, J.; Gu, P.; Hao, Y.; Xue, K.; Duan, H.; Xia, A.; et al. Overlooked Uneven Progress across Sustainable Development Goals at the Global Scale: Challenges and Opportunities. Innovation 2024, 5, 100573. [Google Scholar] [CrossRef]
  25. Zhang, J.; Skene, K.R.; Wang, S.; Ji, Q.; Zheng, H.; Zhou, C.; Tian, K.; Pradhan, P.; Meadows, M.E.; Fu, B. Beyond Borders: Assessing Global Sustainability through Interconnected Systems. Sustain. Dev. 2025, 33, 1909–1920. [Google Scholar] [CrossRef]
  26. García-Rodríguez, A.; Núñez, M.; Pérez, M.R.; Govezensky, T.; Barrio, R.A.; Gershenson, C.; Kaski, K.K.; Tagüeña, J. Sustainable Visions: Unsupervised Machine Learning Insights on Global Development Goals. PloS ONE 2025, 20, e0317412. [Google Scholar]
  27. Ma, F.; Wang, H.; Tzachor, A.; Hidalgo, C.A.; Schandl, H.; Zhang, Y.; Zhang, J.; Chen, W.-Q.; Zhao, Y.; Zhu, Y.-G.; et al. The Disparities and Development Trajectories of Nations in Achieving the Sustainable Development Goals. Nat. Commun. 2025, 16, 1107. [Google Scholar] [CrossRef]
  28. Jena, S.; Basel, S. Classifying Global Economies Based on Sustainable Development Goals: A Data-Driven Clustering Approach. Sustain. Dev. 2025, 33, 4543–4556. [Google Scholar] [CrossRef]
  29. Wang, Z.; He, B.; Fujita, T. Does Environmental Regulation Affect Inward Foreign Direct Investment? Evidence from China. Appl. Econ. Lett. 2024, 1–7. [Google Scholar] [CrossRef]
  30. Salem, N.; Hussein, S. Data Dimensional Reduction and Principal Components Analysis. Procedia Comput. Sci. 2019, 163, 292–299. [Google Scholar] [CrossRef]
  31. Gewers, F.L.; Ferreira, G.R.; De Arruda, H.F.; Silva, F.N.; Comin, C.H.; Amancio, D.R.; Costa, L.D.F. Principal Component Analysis. ACM Comput. Surv. 2022, 54, 1–34. [Google Scholar] [CrossRef]
  32. Salih Hasan, B.M.; Abdulazeez, A.M. A Review of Principal Component Analysis Algorithm for Dimensionality Reduction. J. Soft Comput. Data Min. 2021, 2, 20–30. [Google Scholar] [CrossRef]
  33. Ishwaran, H. Multivariate Statistics; Chapman and Hall/CRC: Boca Raton, FL, USA, 2025; ISBN 9781003493679. [Google Scholar]
  34. France, S.L.; Akkucuk, U. A Review, Framework, and R Toolkit for Exploring, Evaluating, and Comparing Visualization Methods. Vis. Comput. 2021, 37, 457–475. [Google Scholar] [CrossRef]
  35. MacQueen, J. Some Methods for Classification and Analysis of Multivariate Observations. In Berkeley Symposium on Mathematical Statistics and Probability, Proceedings of the 5th Berkeley Symposium on Mathematical Statistics and Probability, Berkely, CA, USA, 21 June–18 July 1965; Project Eucid: Durham, CA, USA, 1967; Volume 1, pp. 281–297. [Google Scholar]
  36. Rusdiana, L.; Hardita, V.C. Algoritma K-Means Dalam Pengelompokan Surat Keluar Pada Program Studi Teknik Informatika STMIK Palangkaraya. J. Saintekom 2023, 13, 55–66. [Google Scholar] [CrossRef]
  37. Paratama, M.A.Y.; Hidayah, A.R.; Avini, T. Clusterıng K-Means Untuk Analısıs Pola Persebaran Bencana Alam Dı Indonesıa. J. Inform. Dan Tekonologi Komput. (JITEK) 2023, 3, 108–114. [Google Scholar] [CrossRef]
  38. Lloyd, S. Least Squares Quantization in PCM. IEEE Trans. Inf. Theory 1982, 28, 129–137. [Google Scholar] [CrossRef]
  39. Patel, S.S.; Kumar, N.; Aswathy, J.; Vaddadi, S.K.; Akbar, S.A.; Panchariya, P.C. K-Means Algorithm: An Unsupervised Clustering Approach Using Various Similarity/Dissimilarity Measures. In Intelligent Sustainable Systems: Proceedings of ICISS 2021; Springer: Singapore, 2022; pp. 805–813. [Google Scholar]
  40. Çelik, S.; Cömertler, N. Investigation of Happiness of Countries with K-Means Clustering and Discriminant Analysis. J. Curr. Res. Bus. Econ. 2021, 11, 15–38. [Google Scholar] [CrossRef]
  41. Li, X.; Tan, H. K-Means Algorithm Based on Initial Cluster Center Optimization. In The International Conference on Cyber Security Intelligence and Analytics; Springer International Publishing: Cham, Switzerland, 2020; pp. 310–316. [Google Scholar]
  42. Gruzdeva, T.V.; Ushakov, A.V. K-Means Clustering via a Nonconvex Optimization Approach. In Proceedings of the International Conference on Mathematical Optimization Theory and Operations Research, Irkutsk, Russia, 5–10 July 2021; Springer International Publishing: Cham, Switzerland, 2021; pp. 462–476. [Google Scholar]
  43. Sagala, N.T.M.; Gunawan, A.A.S. Discovering the Optimal Number of Crime Cluster Using Elbow, Silhouette, Gap Statistics, and NbClust Methods. ComTech Comput. Math. Eng. Appl. 2022, 13, 1–10. [Google Scholar] [CrossRef]
  44. Wala, J.; Herman, H.; Umar, R.; Suwanti, S. Heart Disease Clustering Modeling Using a Combination of the K-Means Clustering Algorithm and the Elbow Method. Sci. J. Inform. 2024, 11, 903–914. [Google Scholar] [CrossRef]
  45. Rousseeuw, P.J. Silhouettes: A Graphical Aid to the Interpretation and Validation of Cluster Analysis. J. Comput. Appl. Math. 1987, 20, 53–65. [Google Scholar] [CrossRef]
  46. Çelik, S.; Doğanlı, B.; Şaşmaz, M.Ü.; Akkucuk, U. Accuracy Comparison of Machine Learning Algorithms on World Happiness Index Data. Mathematics 2025, 13, 1176. [Google Scholar] [CrossRef]
  47. Somarribas, J.; Loteanu, A. Using Micro-Processor Vector Instructions to Optimize Unsupervised Machine Learning K-Means Algorithm. In Proceedings of the 2020 IEEE 11th Latin American Symposium on Circuits & Systems (LASCAS), San Jose, Costa Rica, 25–28 February 2020; IEEE: New York, NY, USA, 2020; pp. 1–4. [Google Scholar]
  48. Maori, N.A.; Evanita, E. Metode Elbow Dalam Optimasi Jumlah Cluster Pada K-Means Clustering. Simetris J. Tek. Mesin Elektro Ilmu Komput. 2023, 14, 277–288. [Google Scholar] [CrossRef]
  49. Maulana, I.; Roestam, R. Optimizing KNN Algorithm Using Elbow Method for Predicting Voter Participation Using Fixed Voter List Data (DPT). J. Sos. Teknol. 2024, 4, 441–451. [Google Scholar] [CrossRef]
  50. Wicaksono, A.P.; Widjaja, S.; Nugroho, M.F.; Putri, C.P. Elbow and Silhouette Methods for K Value Analysis of Ticket Sales Grouping on K-Means. Sistemasi 2024, 13, 28. [Google Scholar] [CrossRef]
  51. Düntsch, I.; Gediga, G. Confusion Matrices and Rough Set Data Analysis. J. Phys. Conf. Ser. 2019, 1229, 012055. [Google Scholar] [CrossRef]
  52. Haghighi, S.; Jasemi, M.; Hessabi, S.; Zolanvari, A. PyCM: Multiclass Confusion Matrix Library in Python. J. Open Source Softw. 2018, 3, 729. [Google Scholar] [CrossRef]
  53. Михайличенкo, А.А. Analytical Review of Methods for Assessing the Quality of Classification Algorithms. Вестник Адыгейскoгo Гoсударственнoгo Университета Серия «Естественнo-Математические и Технические Науки» 2023, 4, 52–59. [Google Scholar] [CrossRef]
  54. Erbani, J.; Portier, P.-É.; Egyed-Zsigmond, E.; Nurbakova, D. Confusion Matrices: A Unified Theory. IEEE Access 2024, 12, 181372–181419. [Google Scholar] [CrossRef]
  55. Grimvall, G. Accuracy of models. Sci Model Simul 2008, 15, 41–57. [Google Scholar] [CrossRef]
  56. Airbus Can Synthetic Data Really Improve Algorithm Accuracy? Available online: https://www.intelligence-airbusds.com/newsroom/news/can-synthetic-data-really-improve-algorithm-accuracy/ (accessed on 12 April 2022).
  57. Maindola, M.; Al-Fatlawy, R.R.; Kumar, R.; Boob, N.S.; Sreeja, S.P.; Sirisha, N.; Srivastava, A. Utilizing Random Forests for High-Accuracy Classification in Medical Diagnostics. In 2024 7th International Conference on Contemporary Computing and Informatics (IC3I); IEEE: New York, NY, USA, 2024; pp. 1679–1685. [Google Scholar]
  58. Dong, W. Large-Scale Remote Sensing Image Target Recognition and Automatic Annotation. In Proceedings of the 2025 6th International Conference on Geology, Mapping and Remote Sensing (ICGMRS), Wuhan, Hubei, 25–27 April 2025. [Google Scholar]
  59. Bosch, N.; Paquette, L. Metrics for Discrete Student Models: Chance Levels, Comparisons, and Use Cases. J. Learn. Anal. 2018, 5, 86–104. [Google Scholar] [CrossRef]
  60. Lee, I.; Lee, K. The Internet of Things (IoT): Applications, Investments, and Challenges for Enterprises. Bus. Horiz. 2015, 58, 431–440. [Google Scholar] [CrossRef]
  61. Strauss, E.; Júnior, M.V.B.; Lobo Ferreira, W.L. A Importância De Utilizar Métricas Adequadas De Avaliação De Performance Em Modelos Preditivos De Machine Learning. Projectus 2023, 7, 52–62. [Google Scholar] [CrossRef]
  62. Sahoo, G.S.; Dass, S.; Prakash, F. The Synergy of Advanced Language Models, Sequential Skeleton Features, and GAN-Enhanced Data Augmentation for Unprecedented Precision. In Proceedings of the 2023 International Conference on System, Computation, Automation and Networking (ICSCAN), Puducherry, India, 17–18 November 2023; IEEE: New York, NY, USA, 2023; pp. 1–6. [Google Scholar]
  63. Cohen, L.; Mansour, Y.; Moran, S.; Shao, H. Probably Approximately Precision and Recall Learning. arXiv 2024, arXiv:2411.13029. [Google Scholar] [CrossRef]
  64. Lee, J. Analysis of Precision and Accuracy in a Simple Model of Machine Learning. J. Korean Phys. Soc. 2017, 71, 866–870. [Google Scholar] [CrossRef]
  65. Yacouby, R.; Axman, D. Probabilistic Extension of Precision, Recall, and F1 Score for More Thorough Evaluation of Classification Models. In Proceedings of the First Workshop on Evaluation and Comparison of NLP Systems, Online; Stroudsburg, PA, USA, 16 March 2020; pp. 79–91. [Google Scholar]
  66. Midha, M.; Jain, A.K.; Sharma, V.; Shubham; Kaur, G.; Banerjee, D. Enhanced Car Damage Classification: A Fusion of Deep Learning and Random Forest Methods. In Proceedings of the 2024 Asia Pacific Conference on Innovation in Technology (APCIT), Mysuru, India, 26–27 July 2024; IEEE: New York, NY, USA, 2024; pp. 1–6. [Google Scholar]
  67. Manuel Molina Un Intruso de Otro Mundo: F1-Score. Rev. Electrónica AnestesiaR 2024, 16, 1–16. [CrossRef]
  68. Çelik, S.; Gökdemir, T.; Çondur, F. Statistical Analysis of the World Happiness Index by Regions. Qual. Quant. 2025, 1–16. [Google Scholar] [CrossRef]
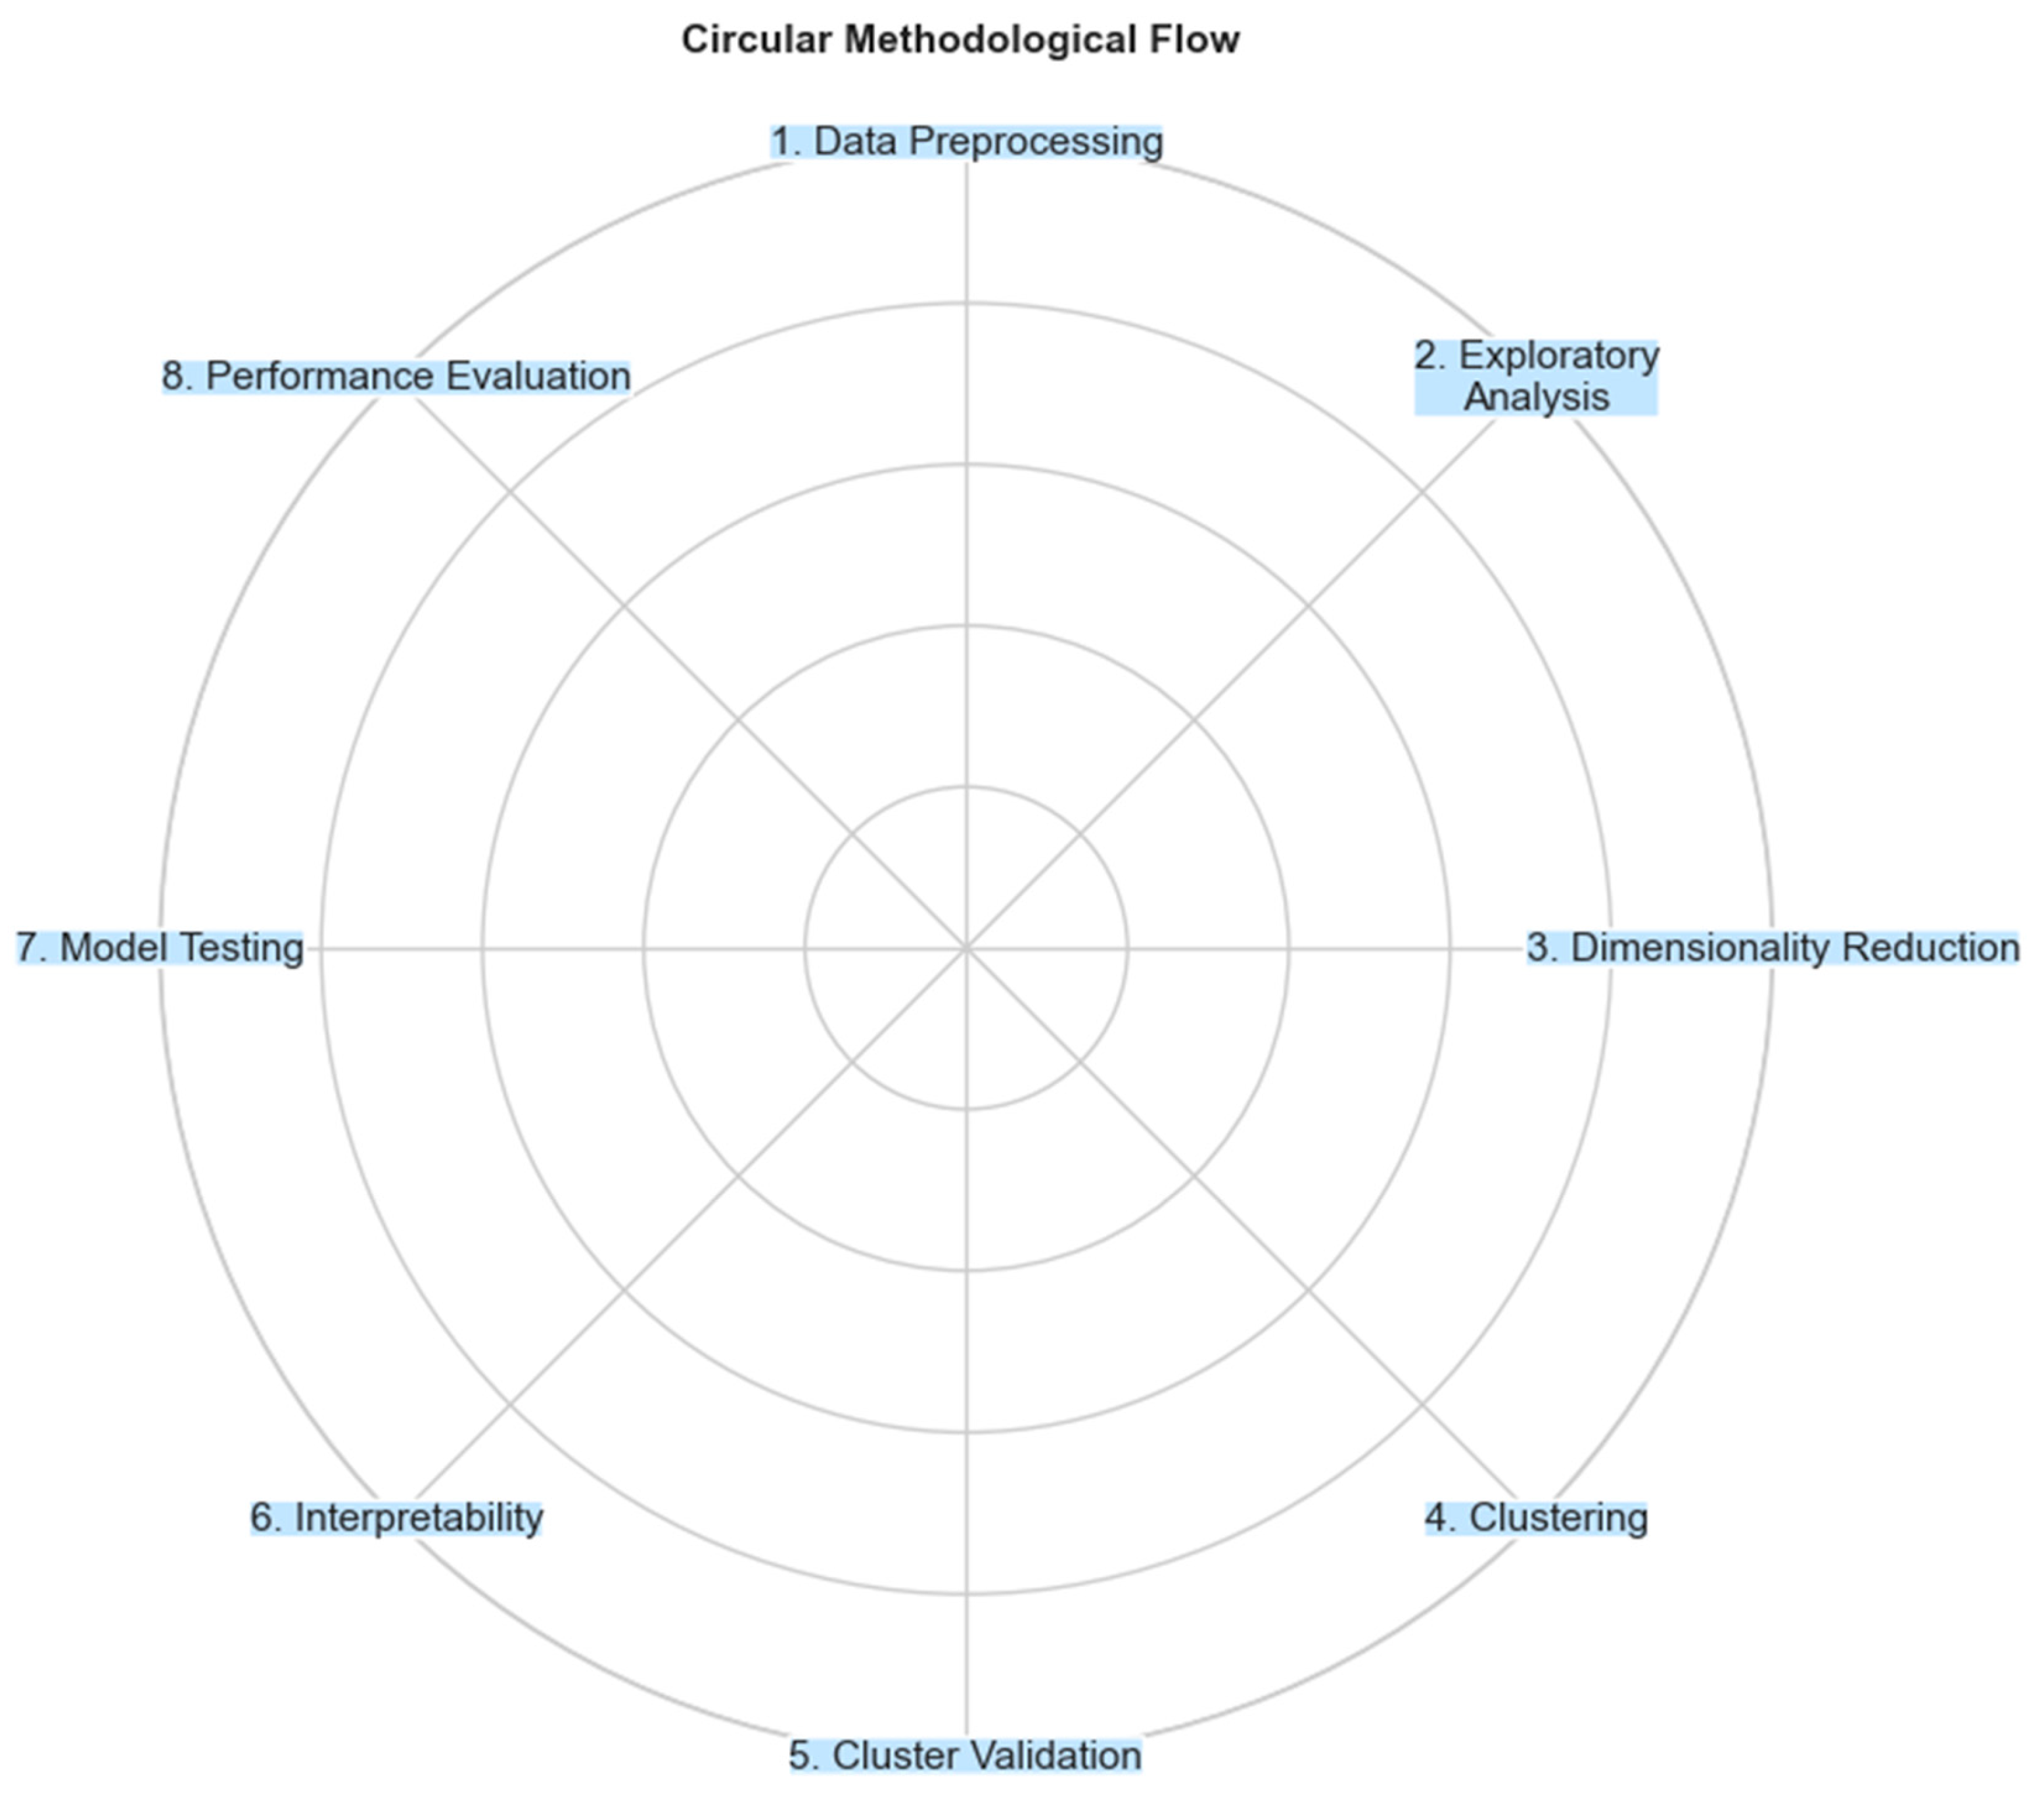
Figure 1. Circular methodological flow (with step numbers).
Sustainability 17 07411 g001
Figure 2. Top 20 and bottom 20 countries by 2025 SDG Score.
Sustainability 17 07411 g002
Figure 3. Top 20 countries by key Sustainable Development Indicators.
Sustainability 17 07411 g003aSustainability 17 07411 g003b
Figure 4. Correlation matrix.
Sustainability 17 07411 g004
Figure 5. Elbow method and Silhouette score plots used for determining the optimal number of clusters.
Sustainability 17 07411 g005
Figure 6. Three-dimensional visualization of K-Means cluster (k = 5) with country labels.
Sustainability 17 07411 g006
Figure 7. Normalized average feature scores per cluster (min-max scale).
Sustainability 17 07411 g007
Figure 8. Feature importance from Random Forest classifier.
Sustainability 17 07411 g008
Figure 9. Confusion matrix.
Sustainability 17 07411 g009
Figure 10. ROC curves.
Sustainability 17 07411 g010
Table 1. Overview of methodologies and key findings in recent SDG-related studies.
AuthorsInsightsMethodsFindings
Diaz-Sarachaga et al. (2018) [8]Focus on adequacy of SDG Index for 2030 AgendaSuitability analysis, regional SDG Index creation
  • SDG Index lacks data for 60% of indicators.
  • Regional SDG Indices needed for lower-performing goals.
Mwitondi et al. (2020) [9]Machine learning for SDG disparities in AfricaDSF, PCA, K-Means clustering
  • South Africa shows distinct data variations from other countries.
  • Identified triggers of SDG indicators through interdisciplinary modeling.
De Neve & Sachs (2020) [10]Links between SDGs and subjective well-beingCorrelations, OLS regressions, dominance analysis
  • Strong positive correlation between most SDGs and well-being.
  • SDG12 and SDG13 negatively correlate with well-being.
Bellantuono et al. (2020) [11]Complex network approach for global rankingsNetwork construction, community detection
  • Proposed complex network framework enhances global ranking insights.
  • Identifies communities for fairer country performance assessments.
Sciarra et al. (2021) [12]Network approach to rank countries on SDGsBipartite networks, centrality metrics
  • Countries’ SDG performances analyzed as a bipartite network.
  • Multivariable analyses reveal complex sustainable development paths.
Keys et al. (2021) [13]Machine learning-based human footprint indexml-HFI using satellite imagery
  • Introduced machine learning-based human footprint index for routine updates.
  • Identified countries progressing toward SDG15 with increasing human pressure.
Souza et al. (2021) [14]Clustering countries by SDG indicators over timePCA, K-Means clustering
  • Countries clustered based on SDG indicators using machine learning.
  • Cluster changes observed from 2016 to 2018.
García Villena et al. (2022) [15]Sustainability evaluation in Latin America projectsSupervised classifiers (SVM + SMOTE)
  • Developed AI methodology for project sustainability evaluation.
  • SVM + SMOTE achieved 92% accuracy in classification.
Asadikia et al. (2022) [16]Geography, income influence on SDG achievementGradient Boosting Machine (GBM)
  • Geographic location and income-level influence SDG achievement.
  • Different influential SDGs identified for various income regions.
Vijayanand (2023) [17]ML classification to predict regional sustainability differencesData prep, ML models (RF, KNN, SVM, etc.)
  • Models accurately predict regions based on sustainability scores.
  • Random Forest, KNN, Decision Tree, and SVM show high accuracy.
Wan et al. (2023) [18]Monitoring sustainable development via SSPsScoring algorithms, ML methods
  • Proposed methods to monitor sustainable development using SSPs.
  • Initial study shows promising results for monitoring approaches.
Chang et al. (2023) [19]Regional inequalities using satellite and MLCNN on satellite imagery
  • Challenges uniform development assumptions in nations.
  • Provides insights into targeted policy interventions.
Yao & Li (2023) [20]Environmental sustainability in African countriesExplainable ML, panel data models
  • Cameroon’s environmental sustainability performance is particularly poor.
  • Eritrea shows better performance and is not epidemic-threatened.
Raj et al. (2024) [21]ML contributions to SDGs, ethical challengesReview of ML applications and ethics
  • ML can significantly advance Sustainable Development Goals (SDGs).
  • Ethical considerations and data privacy are critical issues.
Castelli et al. (2024) [22]Italy’s SDG progress using clusteringUnsupervised clustering
  • Italy shows poor performance in SDG indicators.
  • Citizens express significant interest in sustainability in grocery shopping.
Chenary et al. (2024) [23]Forecasting SDG scores through 2030ARIMAX, Holt–Winters smoothing
  • Forecasted SDG scores for global regions by 2030.
  • OECD countries and Eastern Europe expected to achieve highest scores.
Liu et al. (2024) [24]SDG disparities, health risks, need for partnershipsProgress evenness index, quantitative analysis
  • Uneven SDG progress hinders sustainable development globally.
  • Regional collaborations can enhance global SDG achievements.
Zhang et al. (2025) [25]Sustainability index with spatial spillover analysisNew index construction, spatial framework
  • New sustainability index quantifies interdependencies and spillovers between countries.
  • Spatial analysis framework assesses impact on regional and global sustainability.
García-Rodríguez et al. (2025) [26]Unsupervised ML for SDG correlations across countriesUnsupervised ML, data-driven methodology
  • Strong correlations exist between certain Sustainable Development Goals (SDGs).
  • Progress influenced by geographical, cultural, and socioeconomic factors.
Ma et al. (2025) [27]SDG achievement paths via product space methodologyEconomic complexity, product space
  • Nations show distinct specialization in SDG indicators.
  • Certain indicators remain under-specialized in specific country groups.
Jena & Basel (2025) [28]Classification of countries by SDG performanceGray Relational Analysis, K-Means clustering
  • Four clusters identified based on SDG performance.
  • Cluster 3 shows strongest overall performance.
Table 2. WCSS and Silhouette score results for different numbers of clusters.
kWCSS (Inertia)Silhouette Score
2470.220.3309
3345.380.3773
4220.940.4031
5169.690.4055
6150.810.3385
7133.120.3407
8123.320.2737
9113.670.2620
10105.190.2523
Table 3. ANOVA results for PCA components.
FeatureF-Valuep-ValueSignificant (p < 0.05)
PCA145.6321.23 × 10−10Yes
PCA239.8713.45 × 10−9Yes
Table 4. MANOVA test statistics.
Test StatisticValueF-Valuep-ValueSignificant (p < 0.05)
Wilks’ Lambda0.24367.320.000Yes
Pillai’s Trace0.57370.890.000Yes
Hotelling–Lawley Trace1.04772.100.000Yes
Roy’s Largest Root0.82369.550.000Yes
Table 5. Classification performances of machine learning models.
ModelAccuracyPrecision (Macro Avg)Recall (Macro Avg)F1 Score (Macro Avg)ROC AUC (Macro)
Random Forest0.9770.7890.8000.7941.000
SVM0.9770.9820.9600.9681.000
Decision Tree0.9530.9480.9760.9600.974
XGBoost0.9070.7500.7080.7180.835
ANN0.9770.9820.9880.9841.000
Logistic Regression0.9530.9680.9680.9680.994
Disclaimer/Publisher’s Note: The statements, opinions and data contained in all publications are solely those of the individual author(s) and contributor(s) and not of MDPI and/or the editor(s). MDPI and/or the editor(s) disclaim responsibility for any injury to people or property resulting from any ideas, methods, instructions or products referred to in the content.