Article

Analysis of Water Rights Allocation in Heilongjiang Province Based on Stackelberg Game Model and Entropy Right Method

College of Heilongjiang River and Lake Chief, Heilongjiang University, Harbin 150080, China
*
Author to whom correspondence should be addressed.
Sustainability 2025, 17(16), 7407; https://doi.org/10.3390/su17167407
Submission received: 5 June 2025 / Revised: 10 August 2025 / Accepted: 11 August 2025 / Published: 15 August 2025

Abstract

This study compares the Stackelberg game model and the entropy weight method for allocating intercity water rights in Heilongjiang Province (2014–2021). The entropy method objectively determines indicator weights, while the Stackelberg framework simulates leader–follower interactions between the water authority and users to balance efficiency and satisfaction. Under the same total water rights cap, the Stackelberg scheme achieves a comprehensive benefit of CNY 14,966 billion, 4% higher than the entropy method (CNY 14,436 billion). The results and comprehensive benefits of the two schemes are close to each other in the cities of Qiqihaer, Daqing, Hegang, etc., but the allocation method of the game theory is more in line with the practical needs and can meet the water demand of each region, and the entropy right method is more useful for the cities of Jiamusi, Jixi, and Heihe, while for other cities the water rights allocation appeared to be unreasonable. While the entropy approach is transparent and data-driven, it lacks dynamic feedback and may under- or over-allocate in rapidly changing contexts. The Stackelberg model adapts to varying demands, better aligning allocations with actual needs. We discuss parameter justification, sensitivity, governance assumptions, and potential extensions, including hybrid modeling, climate change integration, stakeholder participation, and real-time monitoring. The findings provide methodological insights for adaptive and equitable water allocation in regions with strong regulatory capacity.

1. Introduction

Efficient, fair, and sustainable allocation of water resources is an important issue in the field of water resources management at present [1,2,3]. In recent years, in order to better solve the problem of water resources allocation, scholars have proposed a variety of decision-making methods, among which the entropy weight method has been widely used because of its objectivity and scientific nature [4,5]. The entropy weight method is based on the information entropy theory to determine the indicator weights, reducing the interference of personal experience, cognitive bias, and other human factors in the determination of the indicator weights and more objectively reflecting the information content of the indicator itself [6]. For example, Lan, JH [7] evaluated the trend of water resource carrying capacity in China through the entropy weighting method, which provides a scientific basis for the development of rational water resources optimization; He Gang et al. [8] constructed a water resources ecological security evaluation system based on the entropy weight method and clarified the priorities of ecological protection in different regions. However, the entropy power method usually has difficulty portraying the dynamic interaction process between the main bodies of interest. It also fails to effectively consider the real situation of competing interests among different participants in resource allocation.
In order to solve the problem of conflicting interests and dynamic adjustment in water resources allocation, the game theory method has been widely used in water resources allocation research in recent years [9]. The game theory method can effectively describe the interaction between different subjects of interest and highlight the interests of each subject in the process of resource competition and cooperative use [9,10,11,12,13]. In particular, the master–slave game model (Stackelberg game model) is able to describe the decision-making process in which there is a superior–subordinate or management–execution relationship, reflecting the dynamic interaction between the leader and the follower, so as to achieve more optimal resource allocation [14,15,16]. For example, Mobin Zarreh et al. [17] developed a dynamic pricing model based on game theory to optimize the competition between public water systems and bottled water enterprises under government intervention, improving drinking water supply chain efficiency and profitability. Yang Yu et al. [18] proposed a cooperative and non-cooperative bi-level hybrid game model (CHG and NCHG) to optimize multi-function reservoir scheduling, balancing hydropower benefits with downstream ecological and social welfare improvements. Seyed Hamid Shekarforush et al. [19] designed a dual-randomness bi-level interval multi-objective programming (DR-BIMP) model to achieve equitable water allocation among agricultural, industrial, and domestic sectors under uncertainty within a river basin. LIU Shang-bin et al. [20] constructed a Stackelberg game-based equilibrium pricing model for multi-water sources and multiple users to optimize water resource allocation and pricing, balancing the interests and costs among governments, suppliers, and users. Jia Xiaolin et al. [21] used the master–slave game model to study the equilibrium problem of water quality protection and water-use efficiency between the middle and lower reaches of the Han River basin and clarified the reasonable allocation strategy between the basin management agencies and local governments; Zhongwen Xu et al. [22] analyzed the water allocation problem of the irrigation area based on the Stackelberg game model. They proposed an optimized allocation scheme aimed at improving the satisfaction of all stakeholders. This kind of method is solved by game equilibrium, which reflects the advantage of coordinating interests under dynamic interaction, but it also has limitations such as large data demand and complex calculation.
Under the framework of game theory, the Stackelberg game model is one of the classic approaches to portraying the decision-making behavior of multiple subjects in an asymmetric information environment. The model assumes that the decision-making subjects have a hierarchical relationship, in which the upper decision maker (leader) makes the first decision and, based on this, influences the response behavior of the lower decision maker (follower), so that the system finally reaches the Stackelberg equilibrium [23,24,25]. Compared with the traditional Nash equilibrium, the Stackelberg equilibrium can more accurately describe the strategic interactions between the government (leaders) and the water-use subjects (followers), providing theoretical support for the optimal allocation of water rights [26,27]. However, in the actual water rights allocation process, it is difficult to fully quantify the influence of multiple factors on decision making by relying only on the game model.
Although both the Stackelberg game model and the entropy weight method have been individually applied to water allocation, a comprehensive comparison of their performance using a common dataset has not been conducted. This study analyzes the differences in allocation outcomes by systematically applying these two methods to Heil ongjiang Province. This paper compares and analyzes two well-known methods: the Stackelberg game model and the entropy weight method, with respect to the challenges of water allocation in Heilongjiang Province. Water resources are allocated objectively through the entropy weighting method. Meanwhile, the Stackelberg game method is used to optimize the strategic water rights allocation between government departments and water users. The results demonstrate the limitations of static methods such as the entropy weight method in dynamic environments and confirm the superior utility of the game model in achieving fair and efficient allocation. Finally, recommendations for broader method generation and future research directions are presented.

2. Regional Overview

Located in northeastern China, Heilongjiang Province is the most northerly and highest latitude province in the country. The province has a land area of 473,000 km2, including 12 prefectural-level cities and one region (see Figure 1). The average multi-year precipitation in Heilongjiang Province is 556.82 mm, the average multi-year total of water resources is 86.205 billion m3, and the average multi-year per capita of water resources is 2354.34 m3. The total water consumption in Heilongjiang Province in 2021 was 32.437 billion m3 [18,19]. The study area of this paper is the 13 cities of Harbin, Qiqihar, Mudanjiang, Jiamusi, Daqing, Jixi, Shuangyashan, Yichun, Qitaihe, Hegang, Heihe, Suihua, and Daxing’anling under the jurisdiction of Heilongjiang Province.
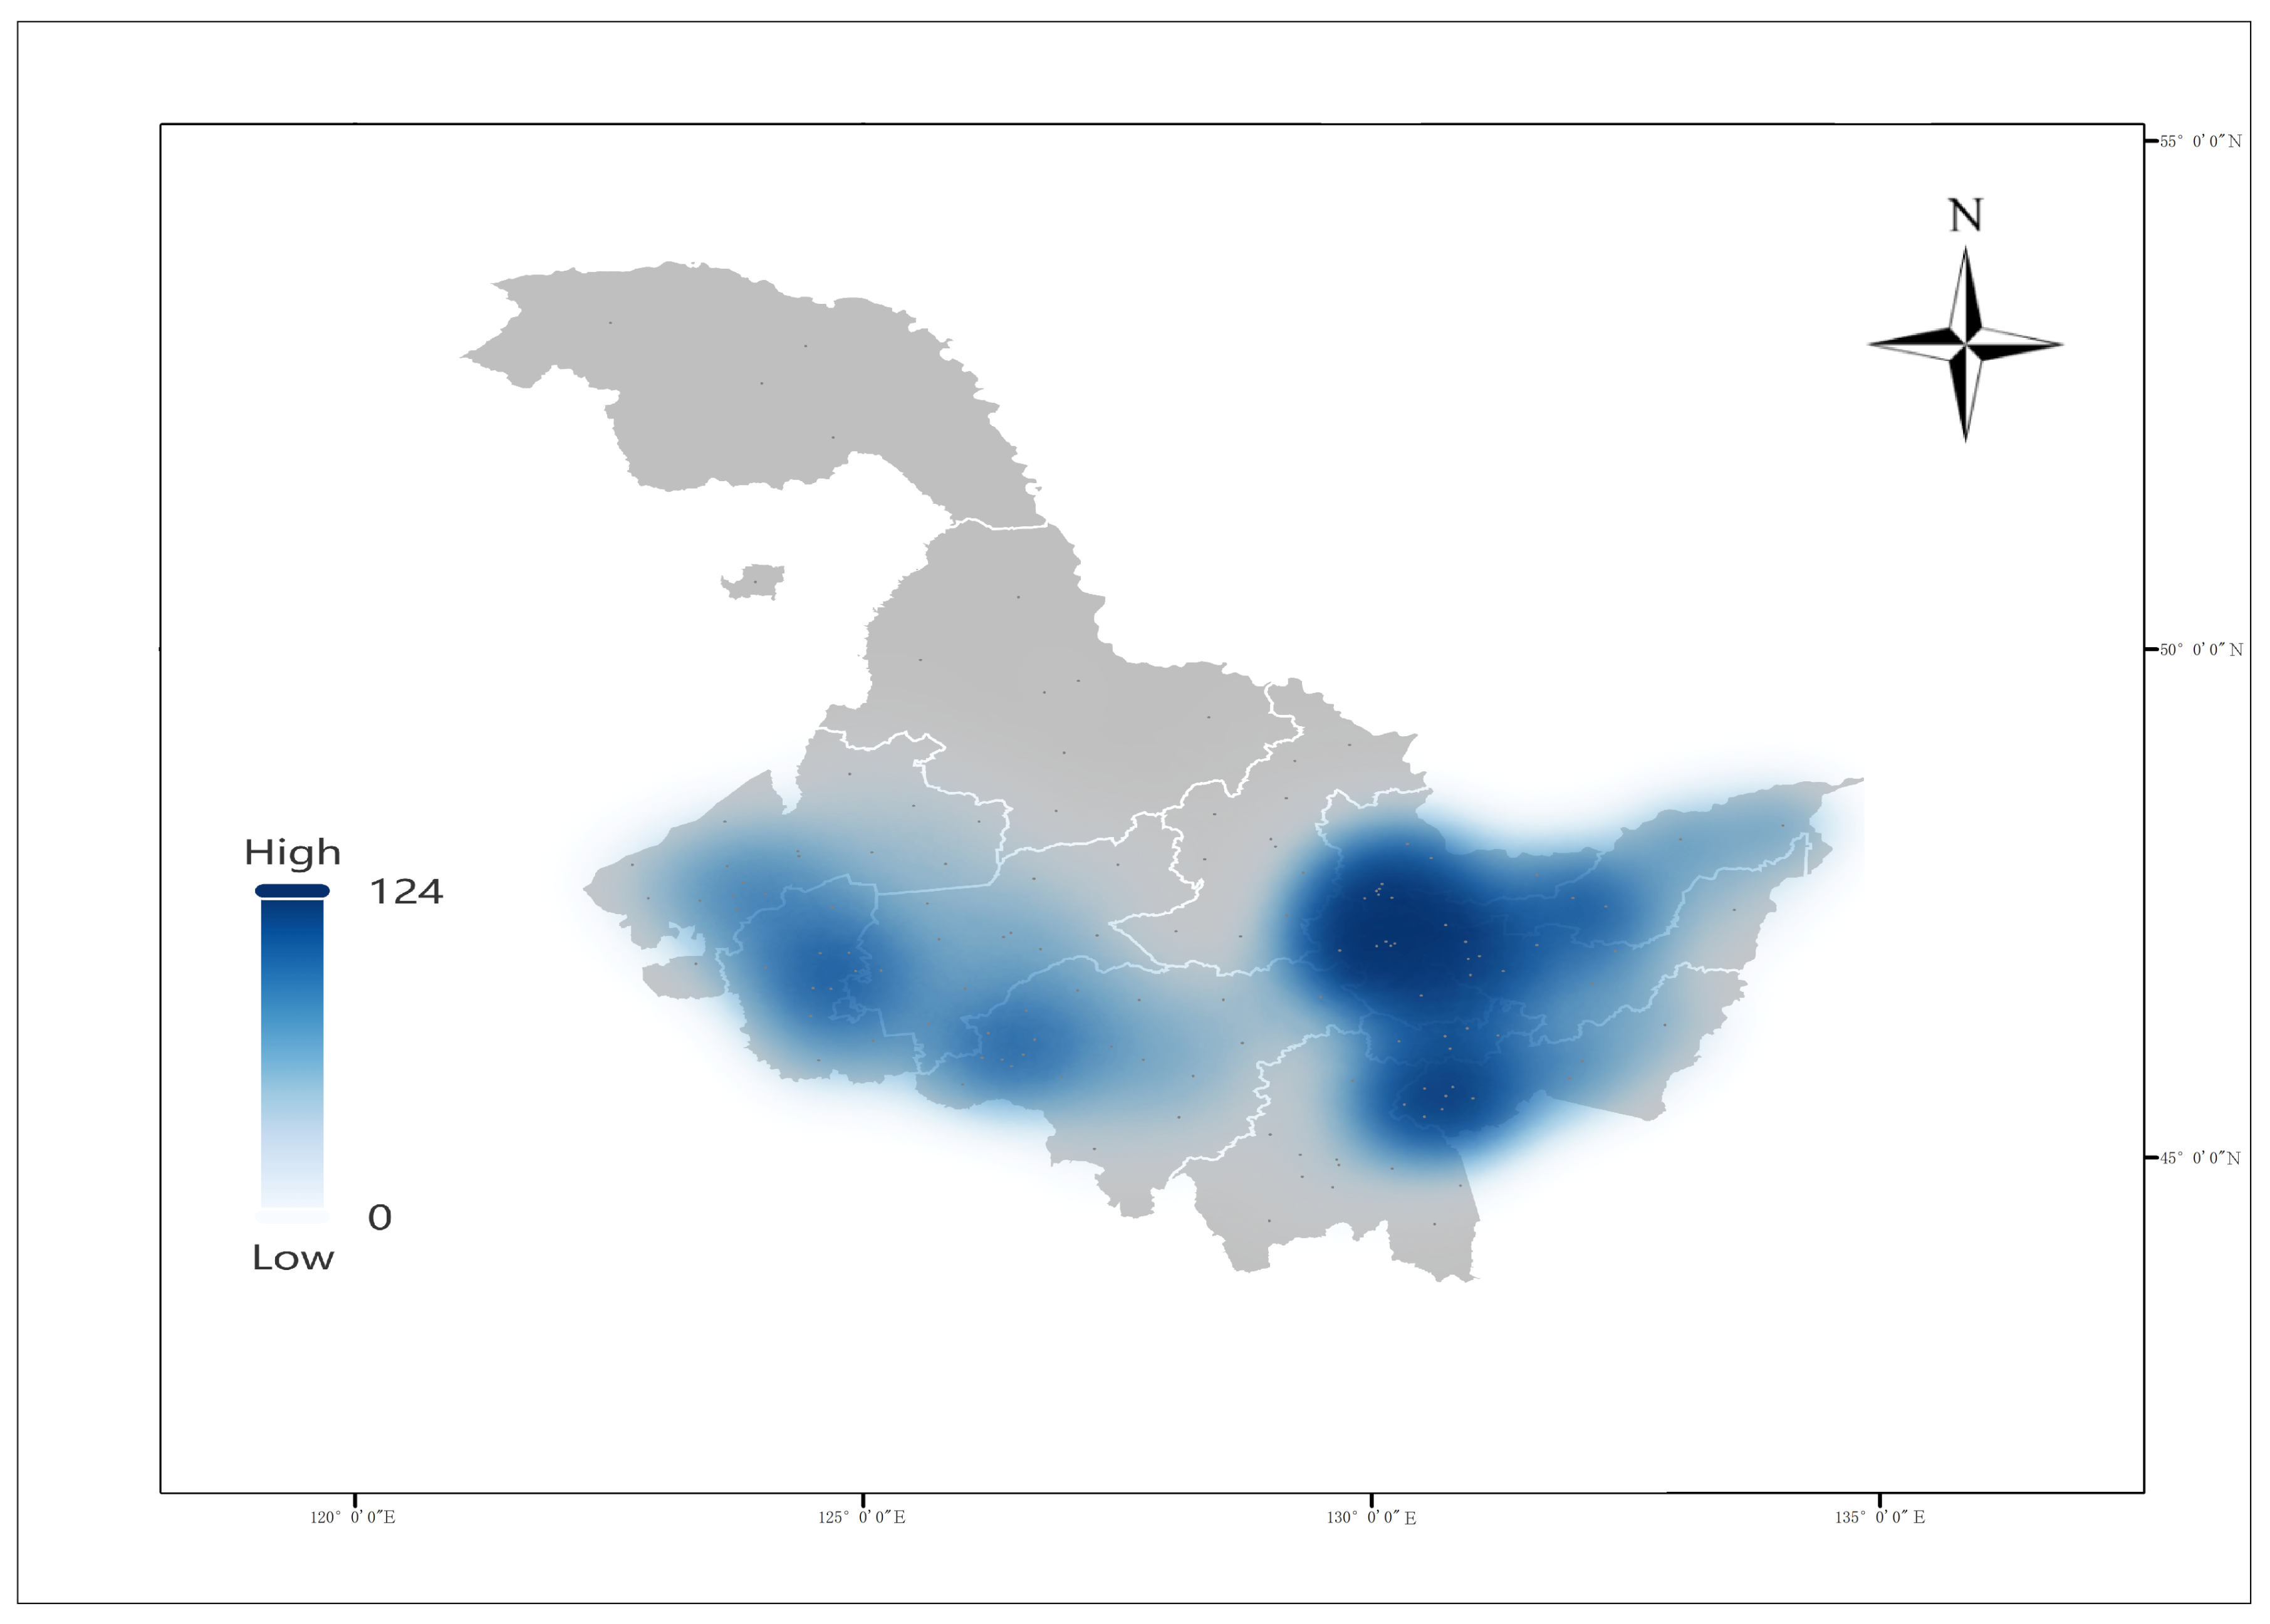
Analysis of regional water resource load percentages reveals significant spatial disparities across Heilongjiang Province. Eastern and southeastern cities generally show high water resource loads, indicating that actual demand approaches or exceeds locally available supply. In contrast, northern and western regions have low loads, with available resources far exceeding consumption. This imbalance between high-demand, resource-constrained areas and low-demand, resource-abundant areas explains the need for cross-regional water rights re-allocation to optimize resource use and support sustainable economic development (see Figure 2).

3. Materials and Methods

In this study, two separate methods were used to solve the water rights allocation problem in Heilongjiang Province. The Stackelberg game model (Section 3.1) is used to simulate the strategic interactions between regional water managers and water users and to optimize the allocation scheme in a dynamic decision-making framework. In addition, the entropy weighting method (Section 3.2) is used to objectively determine the weights of the indicators and evaluate the allocation scheme from a data-driven perspective. In addition, the results of the two methods are compared to assess differences in terms of fairness, efficiency, and applicability.

3.1. Stackelberg Game Model

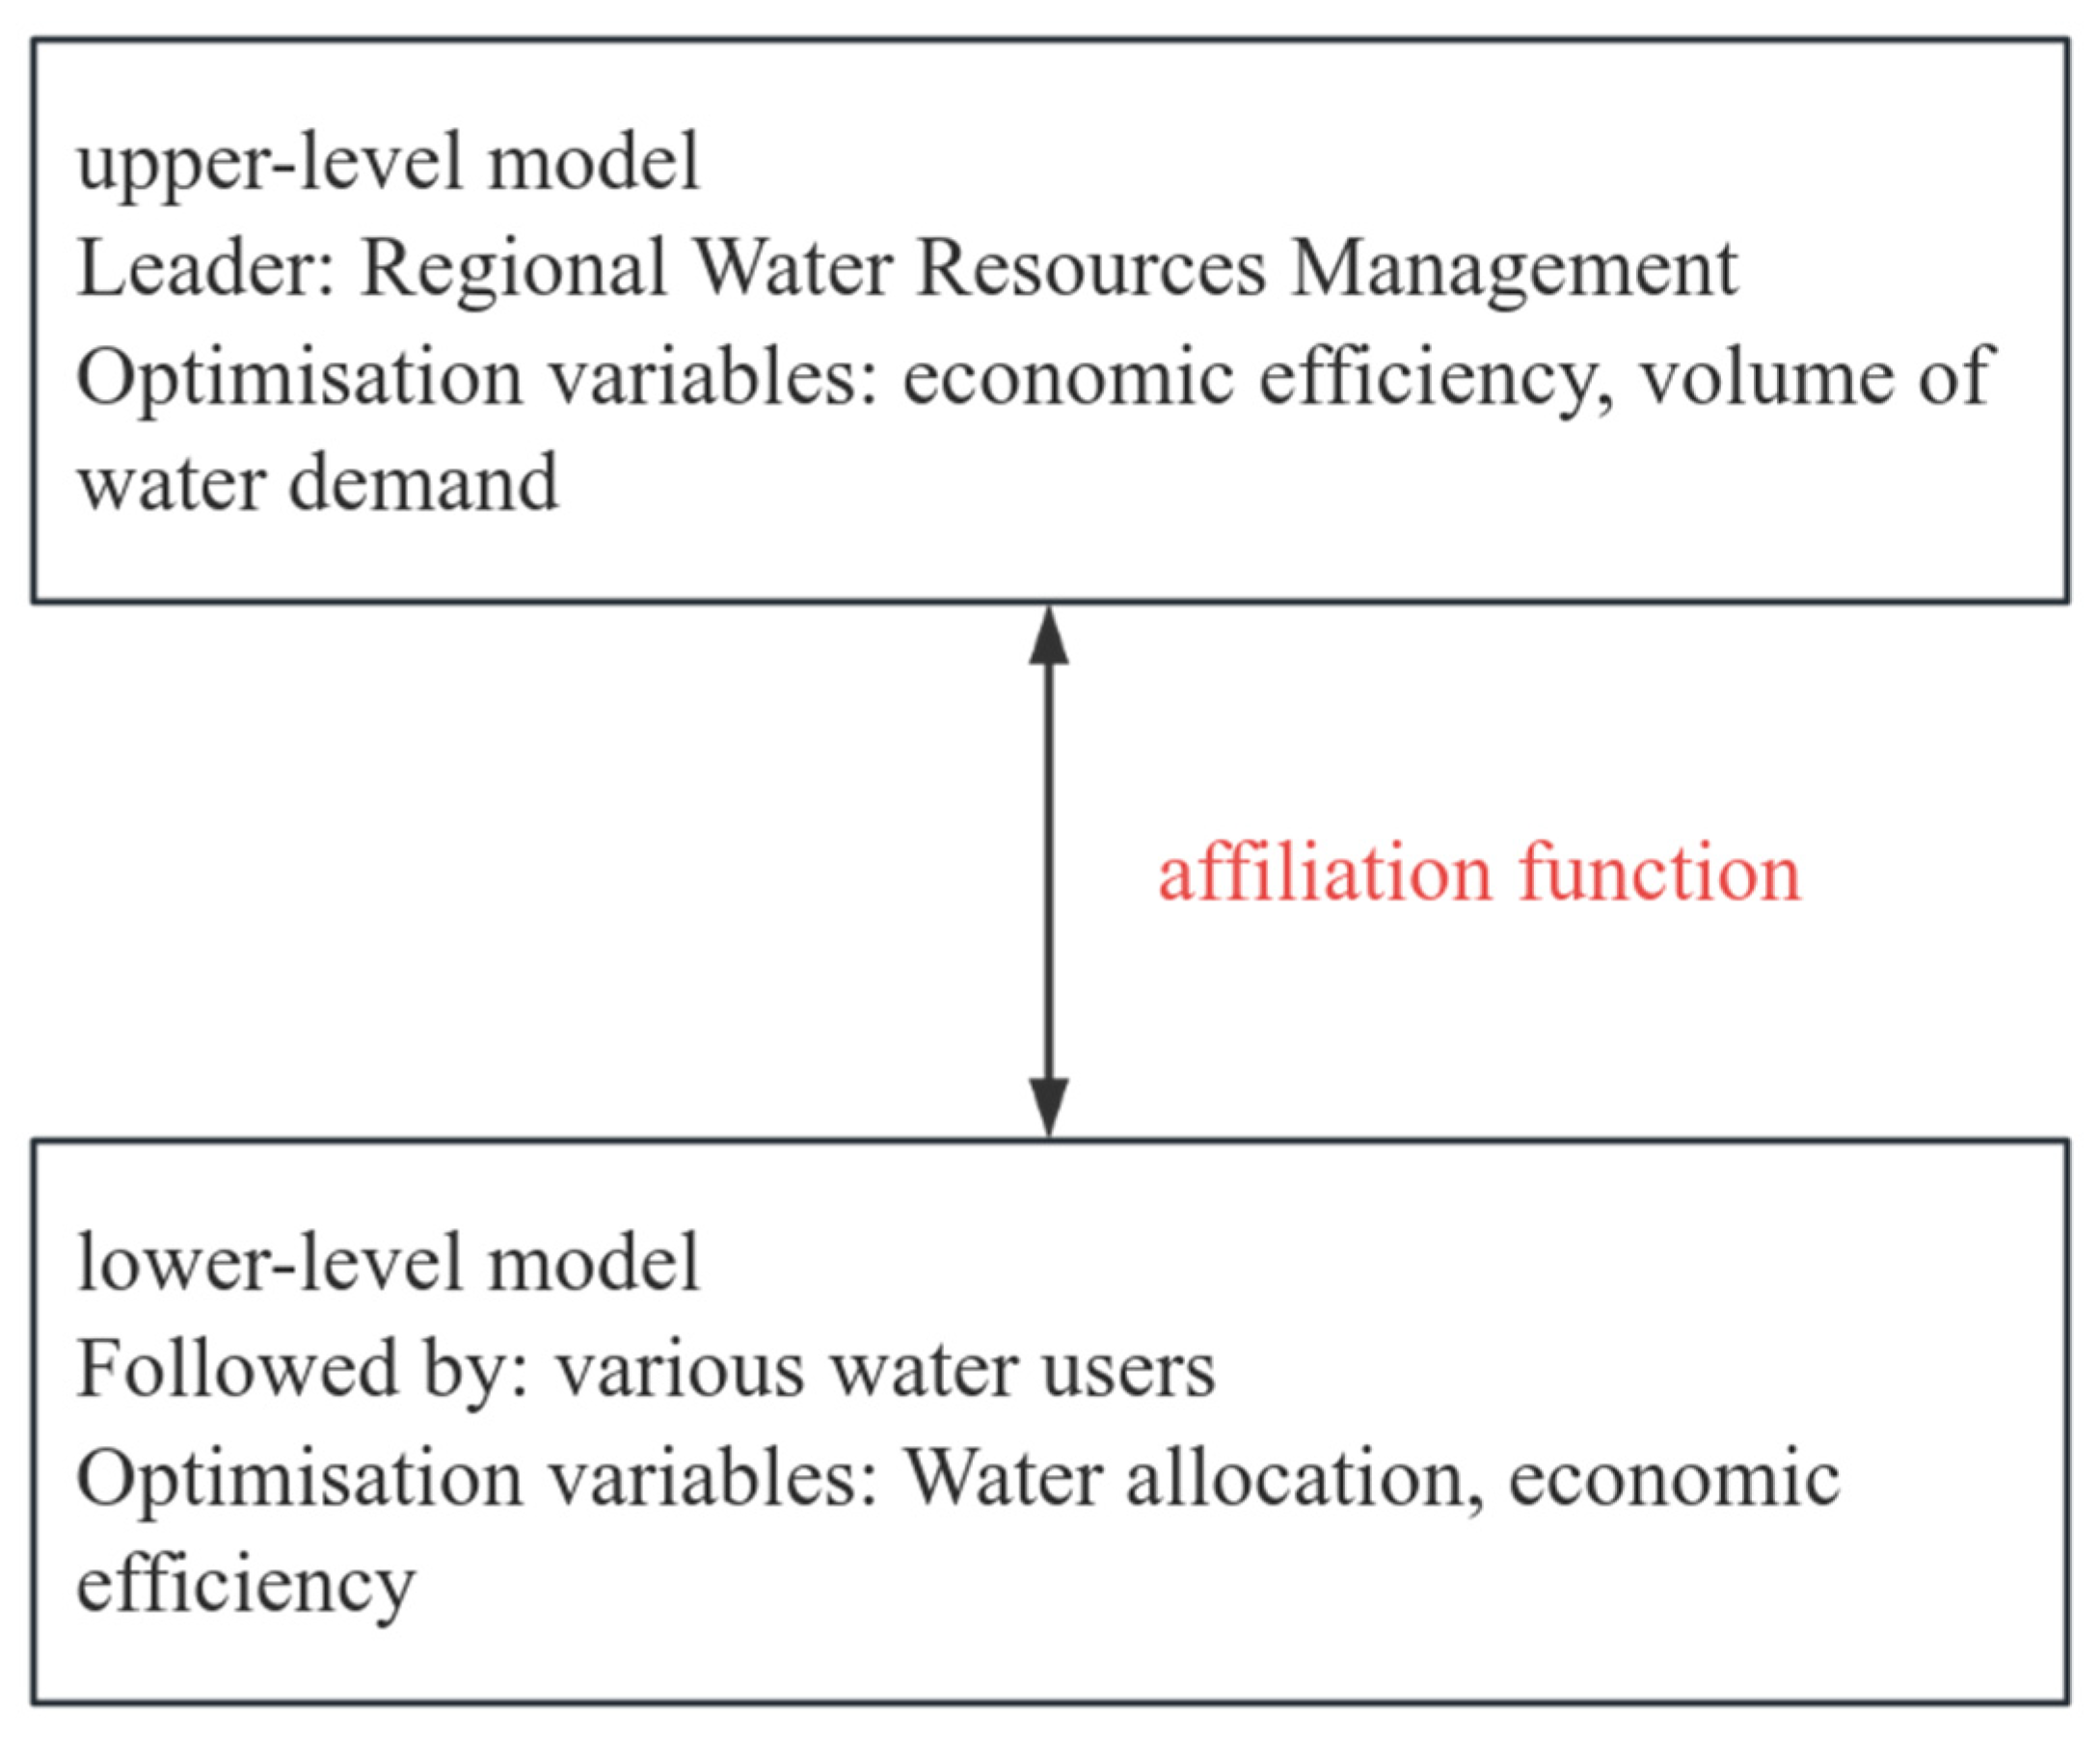
In this study, a Stackelberg game model framework is constructed, in which the regional water resources management department acts as the upper-level decision maker and the water users act as the lower-level followers. The upper model aims to maximize the overall water-use efficiency, considering the actual demand of each water user and the overall efficiency of the regional water resources, while the lower model aims to achieve the maximum economic efficiency of each water user under the uncertainty of water supply availability [28,29]. The two models of the upper and lower layers are coupled and solved by the affiliation function. The game process is as follows: the upper-level leader first formulates a strategy and solves its economic efficiency model to obtain an optimal solution, and the lower-level follower then responds to the upper-level’s decision by feeding back the corresponding affiliation function value to the upper-level. The upper-level leader then adjusts the strategy according to the feedback from the lower level, and the two sides continuously interact until the values of the affiliation function of the upper- and lower-level models converge, at which point the Stackelberg equilibrium is reached [30]. The framework of the Stackelberg game model of economic efficiency and water-use efficiency is shown in Figure 3.
In this model, the feedback mechanism between upper- and lower-level participants is represented by iterative adjustment of strategies. The upper-level (e.g., water authority) allocates water anticipating the responses of lower-level users, while lower-level users (e.g., agricultural, industrial sectors) adjust their demand strategies based on utility maximization. In practical application, such feedback can be represented by demand reporting, historical usage data, and periodic adjustments within planning cycles.

Modeling the Regional Stackelberg Game

The water allocation problem in a region is regarded as a game of water-use benefit allocation with the participation of multiple subjects. Without considering the impacts of runoff fluctuations of inter-provincial rivers, the ecological base flow demand of rivers, and water resource availability on water allocation, assume that the total amount of public water rights owned by the whole region is W. The water right quota initially obtained by the ith water-using subject is qi; and its marginal benefit function of water resource utilization is denoted as f(qi). Then, the utility (benefit) function of the ith water-using subject is denoted as Fi, and the total water-use benefit of the whole region is FT, which is calculated by the following formula:
F i = f q i + c F T = i = 1 n F i = i = 1 n f q i + d
where c and d are constants.
As the upper layer manager, the regional water resource management department should pay attention to the actual demand of each water subject as well as the overall water-use efficiency when allocating water resources, and its allocation objective is to maximize the overall efficiency. The objective function of the upper layer can be expressed as follows:
Z = max F T s . t . q i > 0 i = 1 n q i = W
For the lower tier of followers (individual water users), the objective is to maximize their own benefits by using as much water as possible for their own development under the conditions given by the upper tier decision. However, maximizing the benefits to the region as a whole often requires a reduction in abstraction by some water users, which does not improve the overall benefits but merely redistributes them among different individuals. In the absence of a compensatory mechanism, such programs can leave some water users unable to meet their normal development needs, leading to dissatisfaction and potential conflict. In order to reconcile the contradiction between the upper-level objectives and the lower-level interests, a water supply satisfaction value σ is introduced into the model to reflect the degree of satisfaction of the water-use subjects with the water supply. Its calculation expression is as follows:
σ i 0 , q i < q i 0 q i D min i D max i D min i q i 0 < q i < q i 1 , q i > q i
In the formula, Dmini is the minimum water demand of the water-using individual i in the time period (below which it is difficult to maintain its basic production or life); Dmaxi is the maximum water demand of the water-using individual i in the time period (above which there is no longer any significant increase in its profit).
In order to solve the problem that it is difficult to obtain the minimum and maximum water demand of each water user in a certain period of time, the actual water consumption or planned water consumption of the year is introduced into the model, and the following transformation is made:
σ i = q i k 1 q i 0 k 2 q i k 1 q i 0
where q0i is the actual water consumption (or planned water consumption) in a given period of time; k1 is the minimum water supply guarantee rate, which indicates the proportion of the water supply provided in that period of time to its actual water demand; and q*i is the maximum water demand of the subject. Due to the differences in the development status of each region, the total disposable water right is often less than the sum of the total water demand of all subjects. In operation, the model may tend to skew the allocation of water rights towards regions with lower water demand if it seeks too much to increase overall satisfaction. To prevent this problem and at the same time make the calculated satisfaction more realistic without affecting the actual water supply in each region, the deflation coefficient k2 is introduced into the model to reduce the difference between the total water demand and the total available water rights. In this study, the permissible range for the minimum water supply guarantee rate k1 is typically between 0.75 and 0.95, based on standard urban water supply practices and historical data analyses in similar regional studies [31,32,33]. In Heilongjiang, the provincial Water Resources Bulletin (2014–2021) reports that annual urban water supply reliability generally exceeded 75%, even in drought years, supporting the use of k1 = 0.75 as a realistic lower bound. A value closer to 1 indicates a higher guarantee of water supply. The deflation coefficient k2 generally ranges from 0.7 to 0.9, determined empirically to balance total water demand and available water resources while avoiding allocation bias toward low-demand regions. Historical allocation adjustments in Heilongjiang show that reductions of 15–25% are common in dry years, corresponding to k2 ≈ 0.8, which supports the selection of k2 = 0.8 in this study. These parameter values were selected based on provincial water supply reliability records, national urban water supply standards, and empirical allocation adjustments reported in similar studies [31,32,33]. The iterative solution in this case converged in 22 steps, which, given the computation time (<2 s on a standard desktop), does not pose a practical burden. For field applications where computational resources or data are limited, the model can be simplified by narrowing the tolerance range, using standard parameter defaults, or applying two-stage approximation methods to reduce iteration count while retaining allocation quality. A limited sensitivity check was conducted by varying k1 within 0.70–0.80 and k2 within 0.75–0.85. The results showed a less than 3% change in total allocation benefits, and the relative ranking of the two methods remained unchanged, confirming that these parameter choices do not materially affect this study’s conclusions. To address potential robustness concerns, we additionally extended the sensitivity ranges to k1 ∈ [0.70, 0.90], k2 ∈ [0.70, 0.90], and tolerance range d ∈ [10%, 40%] of the optimal solution. Across these broader ranges, the qualitative comparison between the two methods remained unchanged, with the Stackelberg scheme consistently outperforming the entropy method in total benefit. City-level allocation patterns were also stable, indicating that the conclusions are not sensitive to reasonable variations in these parameters.
From the above formula, it can be seen that when qi is closer to Dmaxi, the water supply satisfaction value obtained by the main body of water use will be higher, and the lower level of satisfaction with water supply will be higher. The water supply satisfaction value indicator σi coordinates, to a certain extent, the water-using subject’s own satisfaction with water supply and the upper management’s pursuit of water-use efficiency. Usually, a higher value of σi means that the efficiency of water use in the region is also higher, and the lower layer’s approval of the upper layer’s decision increases. In this Stackelberg game model, the upper-level decision makers aim to maximize the overall water-use efficiency of the region; the lower-level followers are constrained by the decisions of the upper level, but they also seek to safeguard their own water-use interests. Therefore, the two-tier planning model can be formulated as follows: the upper tier maximizes the total efficiency FT, while the lower tier maximizes the sum of the satisfaction values GT of the water supply in the whole region under the premise of ensuring that the satisfaction value of each water-using entity does not fall below the lower acceptable limit σ0 (0 <σ0 <1).
max F T = i = 1 n f q i q i s . t . max G T = i = 1 n q i q i 0 k 1 q i k 2 q i 0 k 1 i = 1 n q i = W q i > 0 ;   q > 0 ;   q i k 2 > q i ;   q i < q i 0 k i ; σ i > σ 0 ;   k 1 > 0 ;   k 2 > 0
In the Stackelberg game model, the solution is carried out by the method of interval fuzzy two-layer planning. The objective functions of the upper and lower layers are transformed into the corresponding affiliation functions to eliminate the difference in the priority of the optimal solutions of different layers’ objectives, and the degree of satisfaction of the upper and lower layers’ decisions is expressed by the affiliation values. At the same time, a tolerance range is set for the decision variables of the upper-level objectives, i.e., the upper-level managers can accept the largest deviation in their decision variables from the optimal solution. This setting can not only constrain the gap between the upper-level objective function value and its single-level optimal value at the game equilibrium but also allows the lower-level decision makers to seek their own optimal solutions within the tolerance range. In order to effectively improve the efficiency of the model’s optimality search, when the solution exceeds the tolerance range, this solution is regarded as an invalid solution. For the objective functions of the upper and lower layers, the trapezoidal affiliation function is used for quantitative grading, respectively. The affiliation function is set as follows: when the value of the objective function is at the most unfavorable level, the affiliation is 0; when the value reaches the optimal level for the respective single-layer optimization, the affiliation is 1; between these two endpoints, the affiliation value varies linearly with the value of the objective function. The formula is as follows:
μ F F T x = 1     F T x F T U x 1 u F T x F T U x 2 u F T U x 1 u F T U x 2 u     F T U x 2 u F T x F T U x 1 u 0     F T x F T U x 2 u μ G G T x = 1 G T x G T U x 2 u G T x G T U x 1 u G T U x 2 u G T U x 1 u G T U x 1 u G T x G T U x 2 u 0 G T x G T U x 1 u
where FUT(xu1) and GUT(xu2) denote the optimal values obtained when the upper and lower objective functions are optimized independently, and the corresponding optimal solutions of the decision variables are xu1 and xu2, respectively. The value obtained when the separate optimal solution of the lower layer, xu2, is substituted into the upper layer’s objective function is denoted by FT(xu2), and the value obtained when the separate optimal solution of the upper layer, xu1, is substituted into the lower layer’s objective function is denoted by GT(xu1).
The range of decision variables is delineated by the upper and lower layers after consultation, and the formula for their affiliation function is as follows:
μ x u x u = x u x 1 u d d x 1 u d x u x 1 u x 1 u + d x u d x 1 u x u x 1 u + d 0 other
where xu is the upper-level decision variable, and d is the decision variable tolerance range.
When the upper and lower affiliation functions are continuously adjusted in the interaction process, the final satisfaction is equal and Stackelberg equilibrium is reached. In order to facilitate the calculation, the overall satisfaction δ is introduced, and combined with the above formulas, the final game model formula is as follows:
max δ s . t . μ x u x u δ I , μ F F T x δ μ G G T x δ x > 0 i = 1 n x i = W δ 0 , 1

3.2. Entropy Weighting (Physics)

The application of the entropy right method in water rights allocation has the advantages of objectivity, science, adaptability, and operability. The entropy right method is an objective assignment method based on information entropy, which can effectively reduce the interference of human subjective factors, avoid the unfairness brought by traditional experience or historical water allocation methods, and make the allocation results more scientific [34,35,36]. Secondly, the method can fully consider several key factors affecting water resources allocation [37], such as economic efficiency, population demand, ecological and environmental impacts, etc., and calculate the information content of each indicator through entropy value and assign weights, so that the allocation scheme can take into account the economic efficiency while maintaining social equity and environmental sustainability.

3.2.1. Construction of the Indicator System
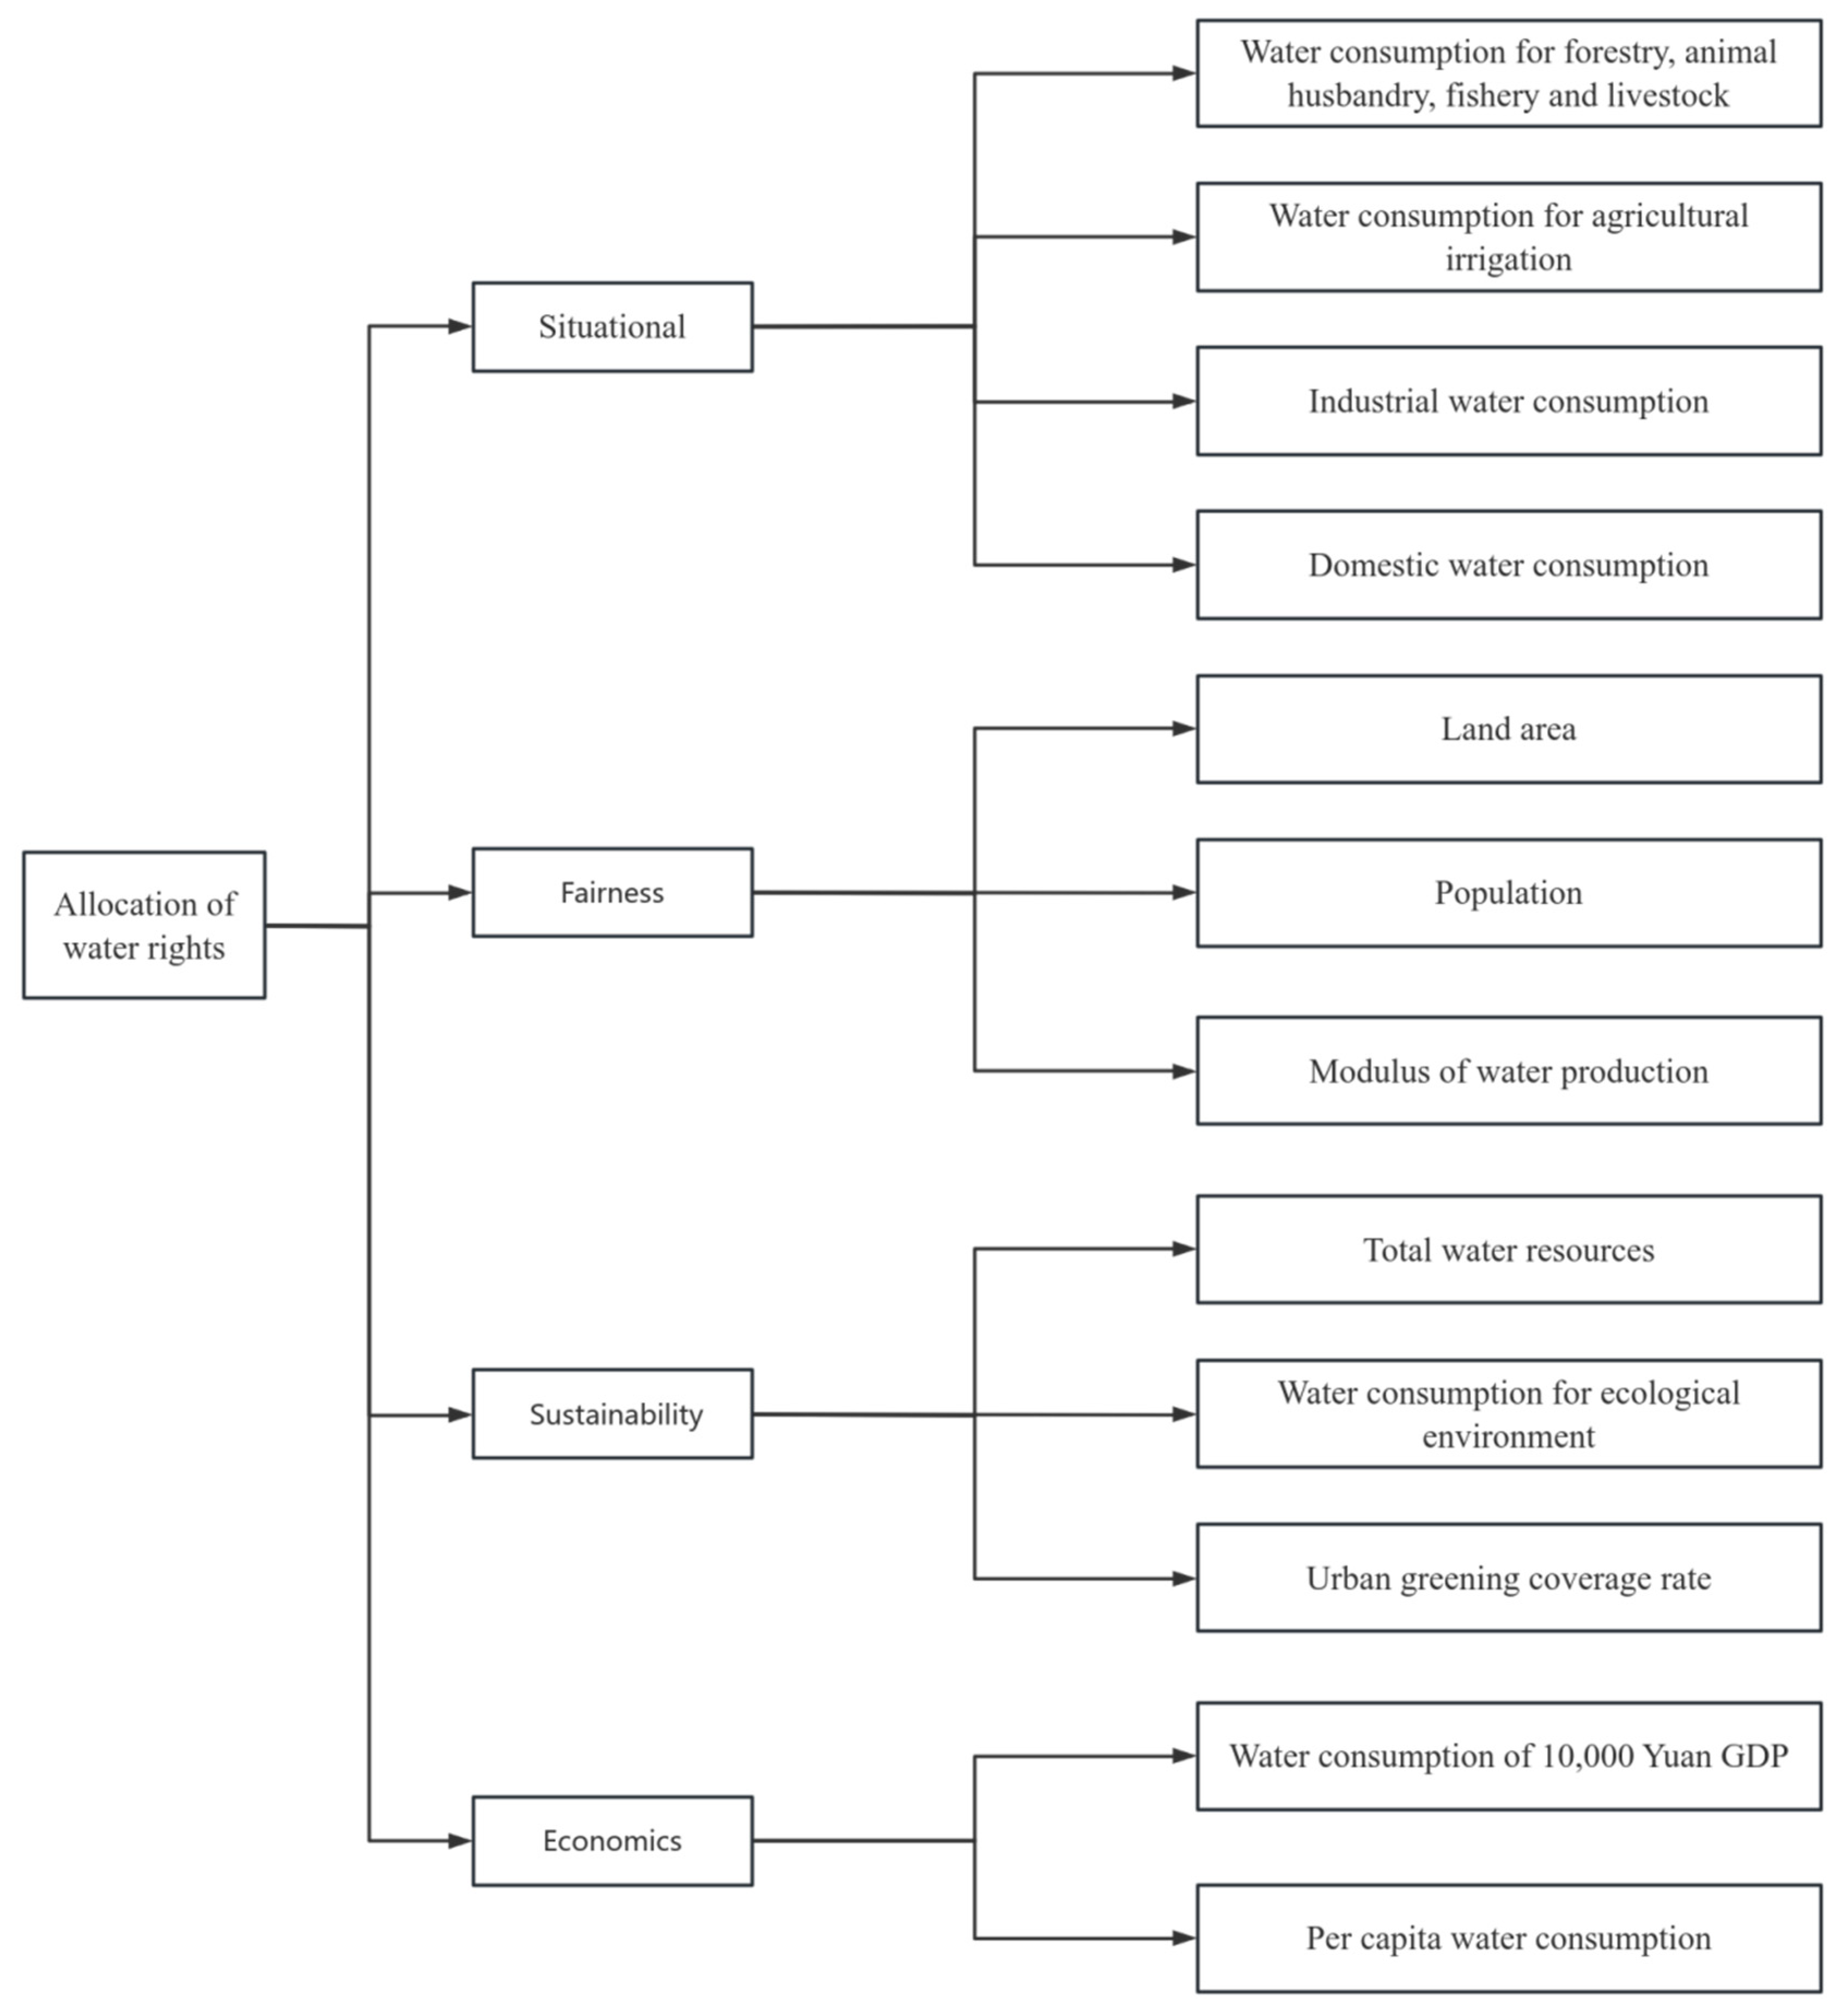
The hierarchy of water rights consists of a target layer (allocation of water rights), a normative layer (including situational, fairness, sustainability, and economics), and an evaluation indicator layer (consisting of the indicator system listed in Table 1. Figure 4 shows the initial water rights allocation hierarchy.
Figure 4. Hierarchical structure for water rights allocation in Heilongjiang Province. The target layer (“Water-right allocation”) is supported by four criteria—status quo, equity, sustainability, and economy—forming the criteria layer. Each criterion contains specific evaluation indicators (indicator layer), such as per capita water consumption, population, industrial/agricultural water use, ecological water use, total water resources, GDP water productivity, and urban greening rate. Indicators reflect regional water demand, economic development, and environmental needs. Data for all indicators are compiled from the Heilongjiang Statistical Yearbook, the Heilongjiang Water Resources Bulletin, and municipal planning documents (Table 1, Table 2 and Table 3).
Sustainability 17 07407 g004

3.2.2. Entropy Weighting Method to Calculate Indicator Weights and Composite Scores

This study constructed a multi-criteria decision-making indicator system for water allocation based on four criteria: equity, status quo, economy, and sustainability. In order to take into account the objectivity of the indicator weights, the entropy weighting method was used to calculate the weights of the indicators, and at the same time, the calculation of the comprehensive score was carried out, and ultimately, according to the comprehensive score, the allocation results of the water resources allocation scheme (Scheme II) were obtained.
In information theory, entropy is a measure of uncertainty. The greater the uncertainty, the greater the entropy and the greater the amount of information contained and vice versa. According to the characteristics of entropy, the entropy value can be calculated to judge the randomness of an event and the degree of disorder. Also, the entropy value can be used to judge the degree of dispersion of a certain indicator: the greater the degree of dispersion of the indicator, the greater the impact of the indicator on the comprehensive evaluation (weight). The entropy weight method is an objective assignment method because it depends only on the discrete nature of the data itself. The calculation steps of entropy weight method are as follows:
X = x 11 x 1 j x i 1 x i j
(1)
Denote the set of evaluation objects as {Ai} (i = 1,2,…,i) and the set of indicators used for evaluation as {Xj} (j = 1,2,…,j) and denote the raw value of the jth indicator of the ith evaluation object by xij. The evaluation matrix is constructed as follows in the next step.
(2)
Normalize the indicators using the extreme difference transformation method. Since the unit of measurement of the indicators is not uniform, before using them to calculate the composite indicators, it is necessary to carry out standardization, that is, the absolute value of the indicators is transformed into the relative value, so as to solve the problem of homogenization of the values of the various different qualitative indicators [38]. In addition, the positive and negative indicator values represent different meanings (the higher the value of the positive indicator, the better, and the lower the value of the negative indicator, the better); therefore, the positive and negative indicators need to use different algorithms for data standardization:
Positive   indicators:   x i j = x i j min x 1 j , , x n j max x 1 j , , x n j min x 1 j , , x n j Negative   indicators:   x i j = max x 1 j , , x n j x i j max x 1 j , , x n j min x 1 j , , x n j
Calculate the weight of the ith sample value under the jth indicator Pij:
P i j = x i j i = 1 n x i j ,   i = 1 , ,   n ,   j = 1 , ,   m
Calculate the entropy of the jth indicator:
e j = k i = 1 n p i j ln p i j ,   j = 1 , ,   m where , k = 1 / ln n > 0 . e j 0
Calculate information entropy redundancy:
d j = 1 e j ,   j = 1 , ,   m
Calculation of the weights of the indicators:
w j = d j j = 1 m d j ,   j = 1 , ,   m
Calculate the sample composite score:
s i = j = 1 m w j w i j ,   i = 1 , ,   n where   x ij   is   the   normalised   data

4. Results and Analyses

This study includes data covering the years 2014–2021, presented in Table 1, Table 2 and Table 3. The data sources are the Heilongjiang Statistical Yearbook, the Water Resources Bulletin, and planning information from various cities and towns.
The results presented here are based on the Stackelberg game model described in Section Modelling the Regional Stackelberg Game, where upper-level managers act as leaders and lower-level users respond strategically. Water consumption per municipality from 2014 to 2021 (Table 3) and GDP by city (Table 2) were used to construct benefit functions for the Stackelberg model. Development indicators for 2021 (Table 1) informed the entropy-weighted allocation scheme.

4.1. Scenario 1 Calculation Process

To establish the utility (benefit) function of each region, representing the relationship between water-use efficiency and total effective water supply, this study uses GDP and water-use data as proxies for regional economic benefits and water consumption. Relevant data for each municipality between 2014 and 2021 were systematically collected. To ensure consistency in the analysis, the Malmquist index method was applied to adjust historical water-use benefits to the current year. For urban water supply design, a minimum flow assurance rate of 90% to 97% is generally used. For designing the guaranteed rate of dry water level, 90~99% is generally used. Considering the actual situation of urban development, it is assumed that the minimum water supply guarantee rate k1 of each city is 75%, the deflation coefficient k2 is 0.8, and the minimum water-use satisfaction value of each city is set to be 0.5 [39,40]. In this paper, it is assumed that the tolerance range of the decision variable d is taken to be 30% of the optimal solution, in order to ensure the flexibility and stability of the model solution. Based on the above parameters and assumptions, combined with Formulas (1)–(8) and the datasets in Table 1, Table 2 and Table 3, a model was established through MATLAB (R2022b) programming to solve the optimal values of the upper- and lower-layer objective functions and the corresponding water rights of each city. The upper and lower layers negotiated with each other to achieve the maximum overall water rights satisfaction (22, 0.6265), with a total benefit of CNY 14,965.7 billion. At the end of the game, the upper and lower function values are the Stackelberg equilibrium solutions. During the game process, overall satisfaction does not increase linearly but exhibits initial fluctuations. In the early stage, the sensitivity of one party to the other’s strategy adjustments causes temporary declines in satisfaction. This reflects how both parties have not yet adapted to each other’s strategies, leading to overly aggressive or conservative decisions. As the game proceeds, the upper- and lower-level participants gradually adjust their strategies, resulting in a steady increase in satisfaction. By the 22nd iteration, overall satisfaction reaches its maximum. Beyond this point, further iterations show marginal increases in total benefits but gradual declines in satisfaction, indicating an optimal stopping point. Figure 5 illustrates the convergence process, showing the trend of overall satisfaction and total benefits between upper-level managers and lower-level water users. For reproducibility, the convergence curves are plotted using the 2014–2021 dataset and parameter settings described in Section Modelling the Regional Stackelberg Game, with iteration count on the x-axis and both satisfaction and benefit on the y-axis. The figure is directly generated from the MATLAB (R2022b) optimization outputs. The results indicate that equilibrium is achieved when both satisfaction and benefits are balanced.

4.2. Scenario 2 Calculation Process

An indicator system for water rights allocation in Heilongjiang Province was constructed. Using Formulas (9)–(14), the weights of each indicator were calculated after preprocessing. This system reflects each region’s situation in terms of water demand, economic development, population size, and ecological protection needs, ensuring fairness and rationality in water rights allocation. The results of the indicator weight calculation are detailed in Table 4. This table reports the normalized entropy-derived weights for each indicator defined in Figure 4 and Table 1, calculated from the 2021 dataset. These weights serve as the proportional coefficients for computing each city’s composite score in Formula (15). The water rights allocation is obtained after calculating the comprehensive score of water rights allocation in Heilongjiang Province using Formula (15), and the results are shown in Table 5. Cities with higher comprehensive scores, such as Harbin (score of 0.2049) and Qiqihar (score of 0.1251), take up a larger proportion of the allocation of water rights. This result is highly consistent with the significant advantages of the two cities in terms of economic scale, population size, and industrial structure. Harbin, as the capital city of Heilongjiang Province, has a high concentration of economic activities and a large population, and its demand for water resources is significantly higher than that of other regions; Qiqihar, on the other hand, is dominated by agriculture and has a large demand for water for agricultural irrigation; therefore, it has a relatively large water rights allocation. As a whole, the amount of water rights allocated to each city shows an obvious positive correlation with its comprehensive score. For example, Harbin and Qiqihar have higher scores and higher allocations, while Qitaihe and Daxinganling have lower scores and lower allocations. This allocation pattern not only verifies the objectivity and rationality of the entropy right method in dealing with multi-indicator decision making but also highlights its effectiveness in the practice of water resources allocation. By determining the weights of indicators based on the information entropy of the data, the entropy weighting method avoids the subjective interference of human factors and provides a fair and transparent decision-making framework for the allocation of water rights. However, the entropy weight method is inherently static, as it relies solely on historical or cross-sectional indicator data without incorporating stakeholder feedback or real-time hydrological variability. This means that once the indicator values are set, the allocation outcome will not adjust to sudden changes in demand or supply conditions. In dynamic contexts, such as cities with rapidly changing industrial and agricultural water use (e.g., Jiamusi), this may lead to under-allocation or over-allocation, reducing the scheme’s practical applicability.

4.3. Comparison of the Results of the Two Scenario Configurations

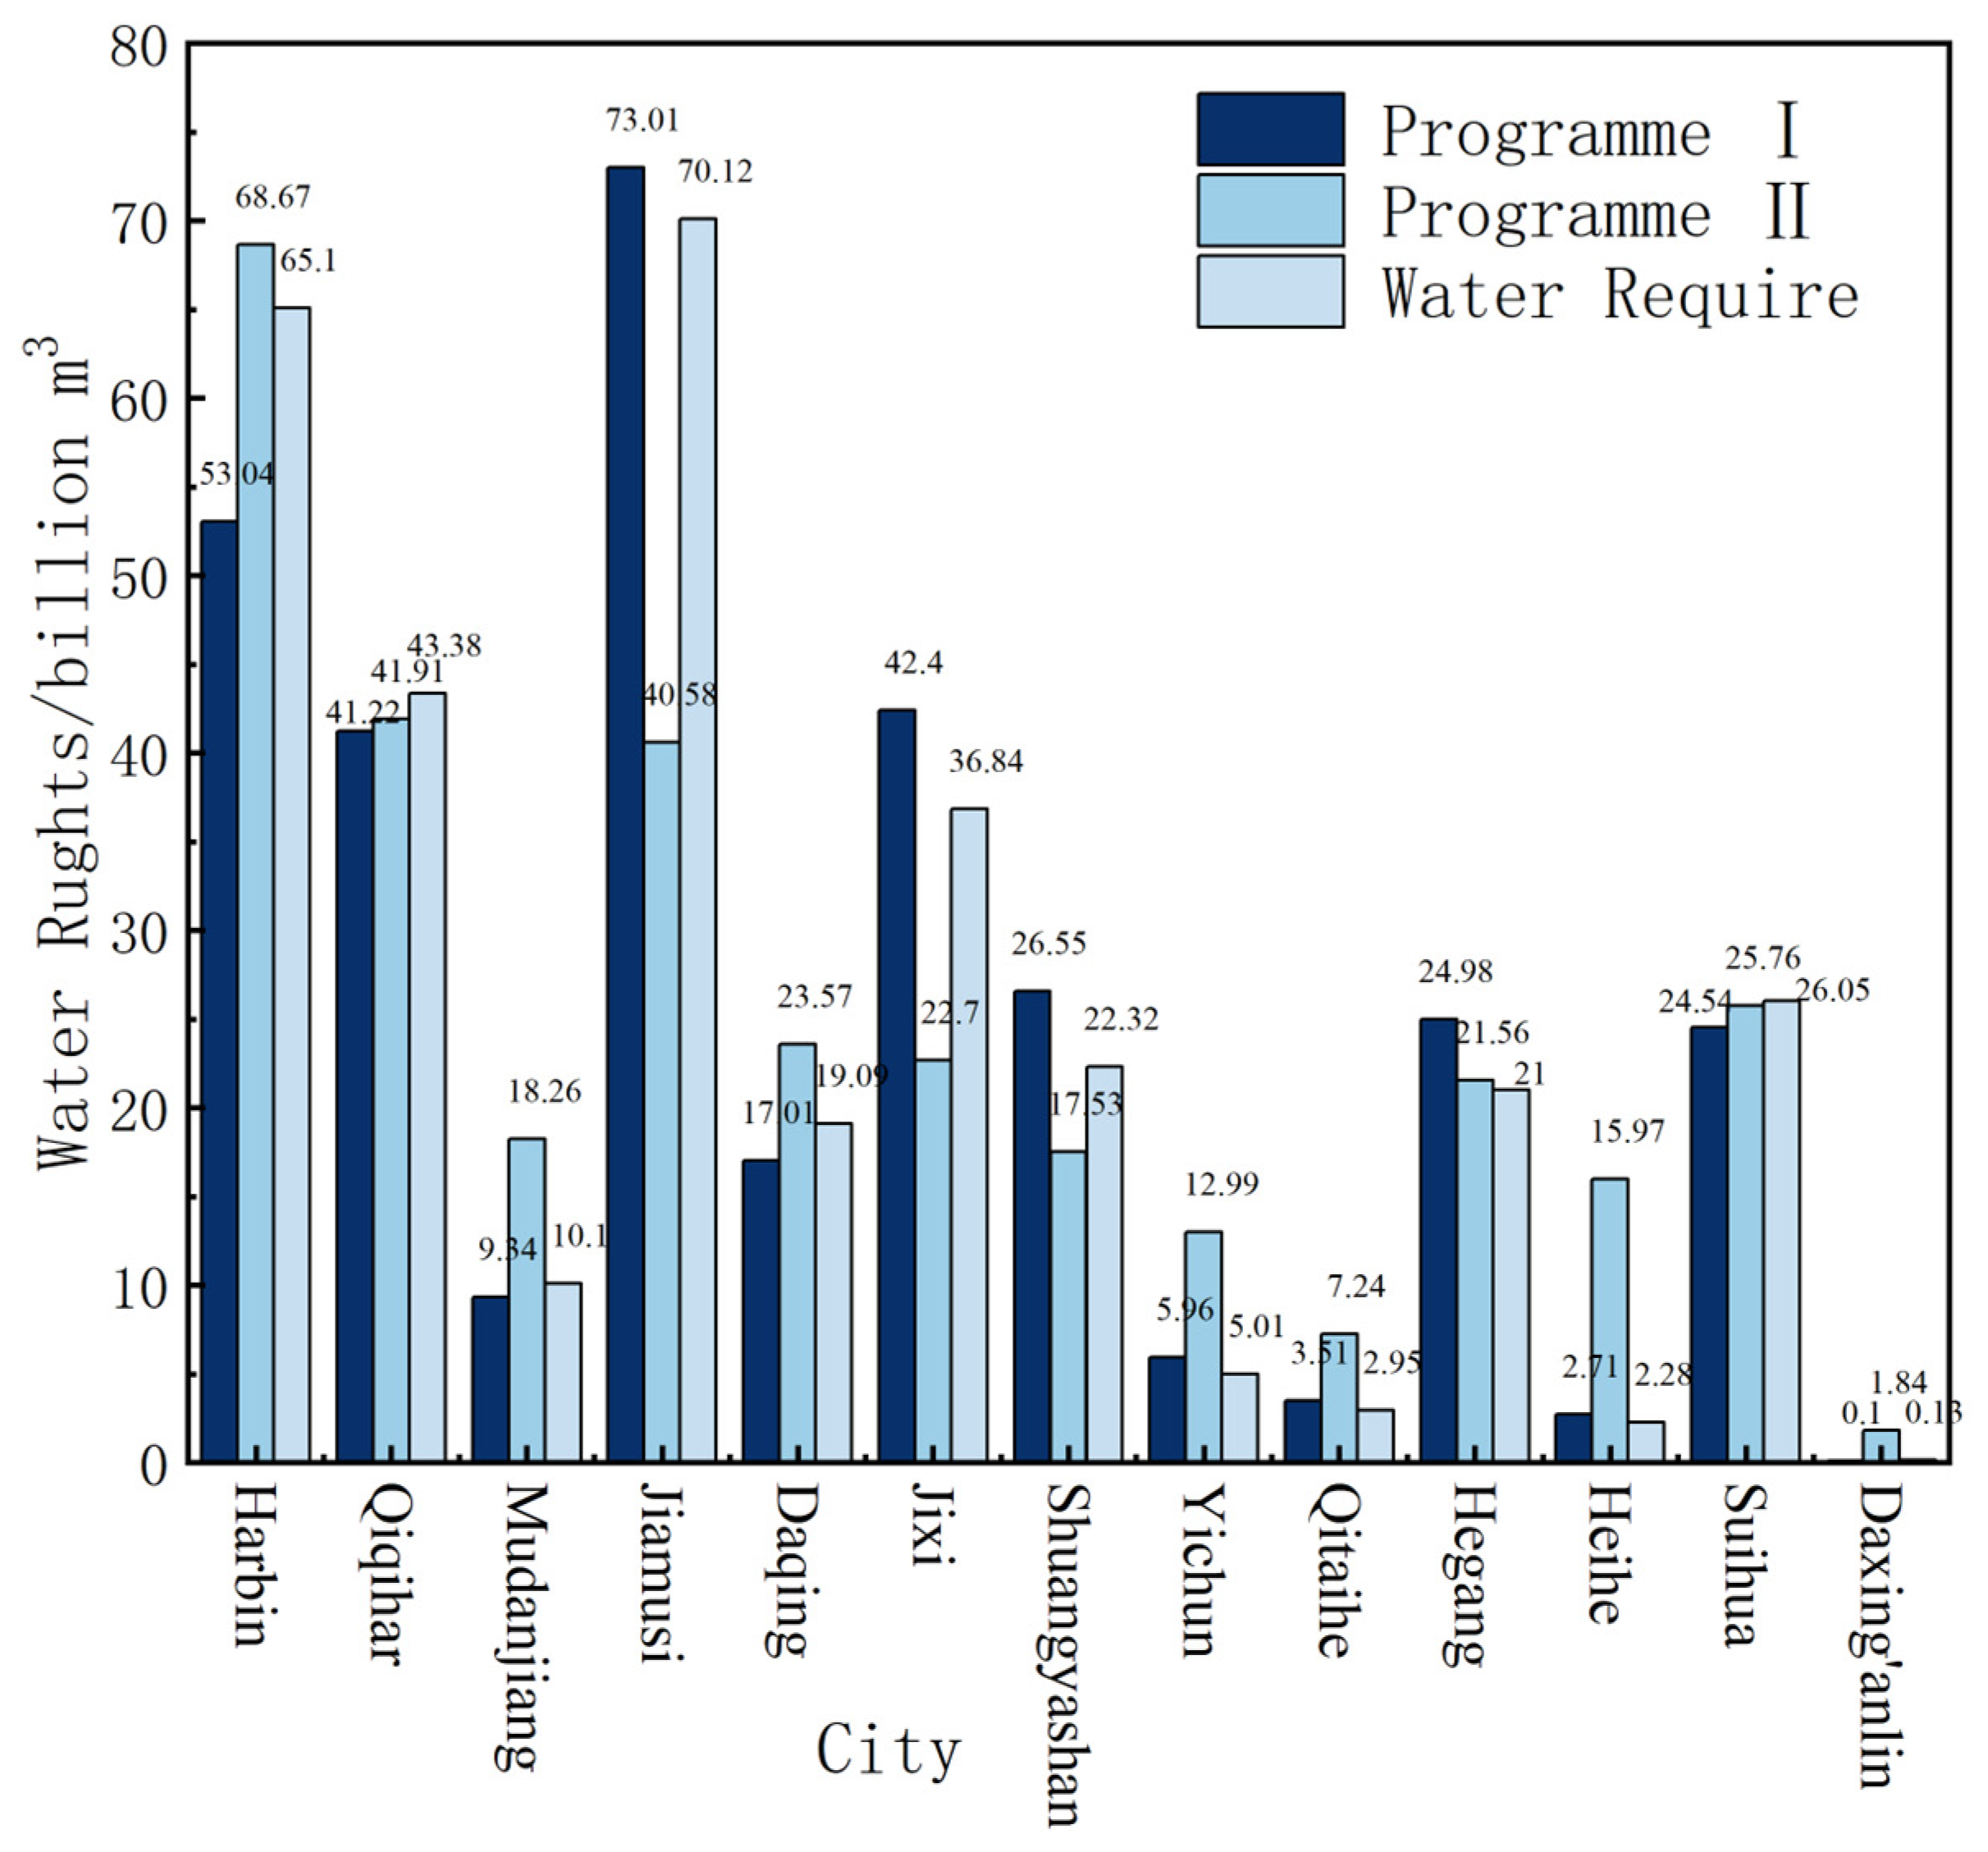
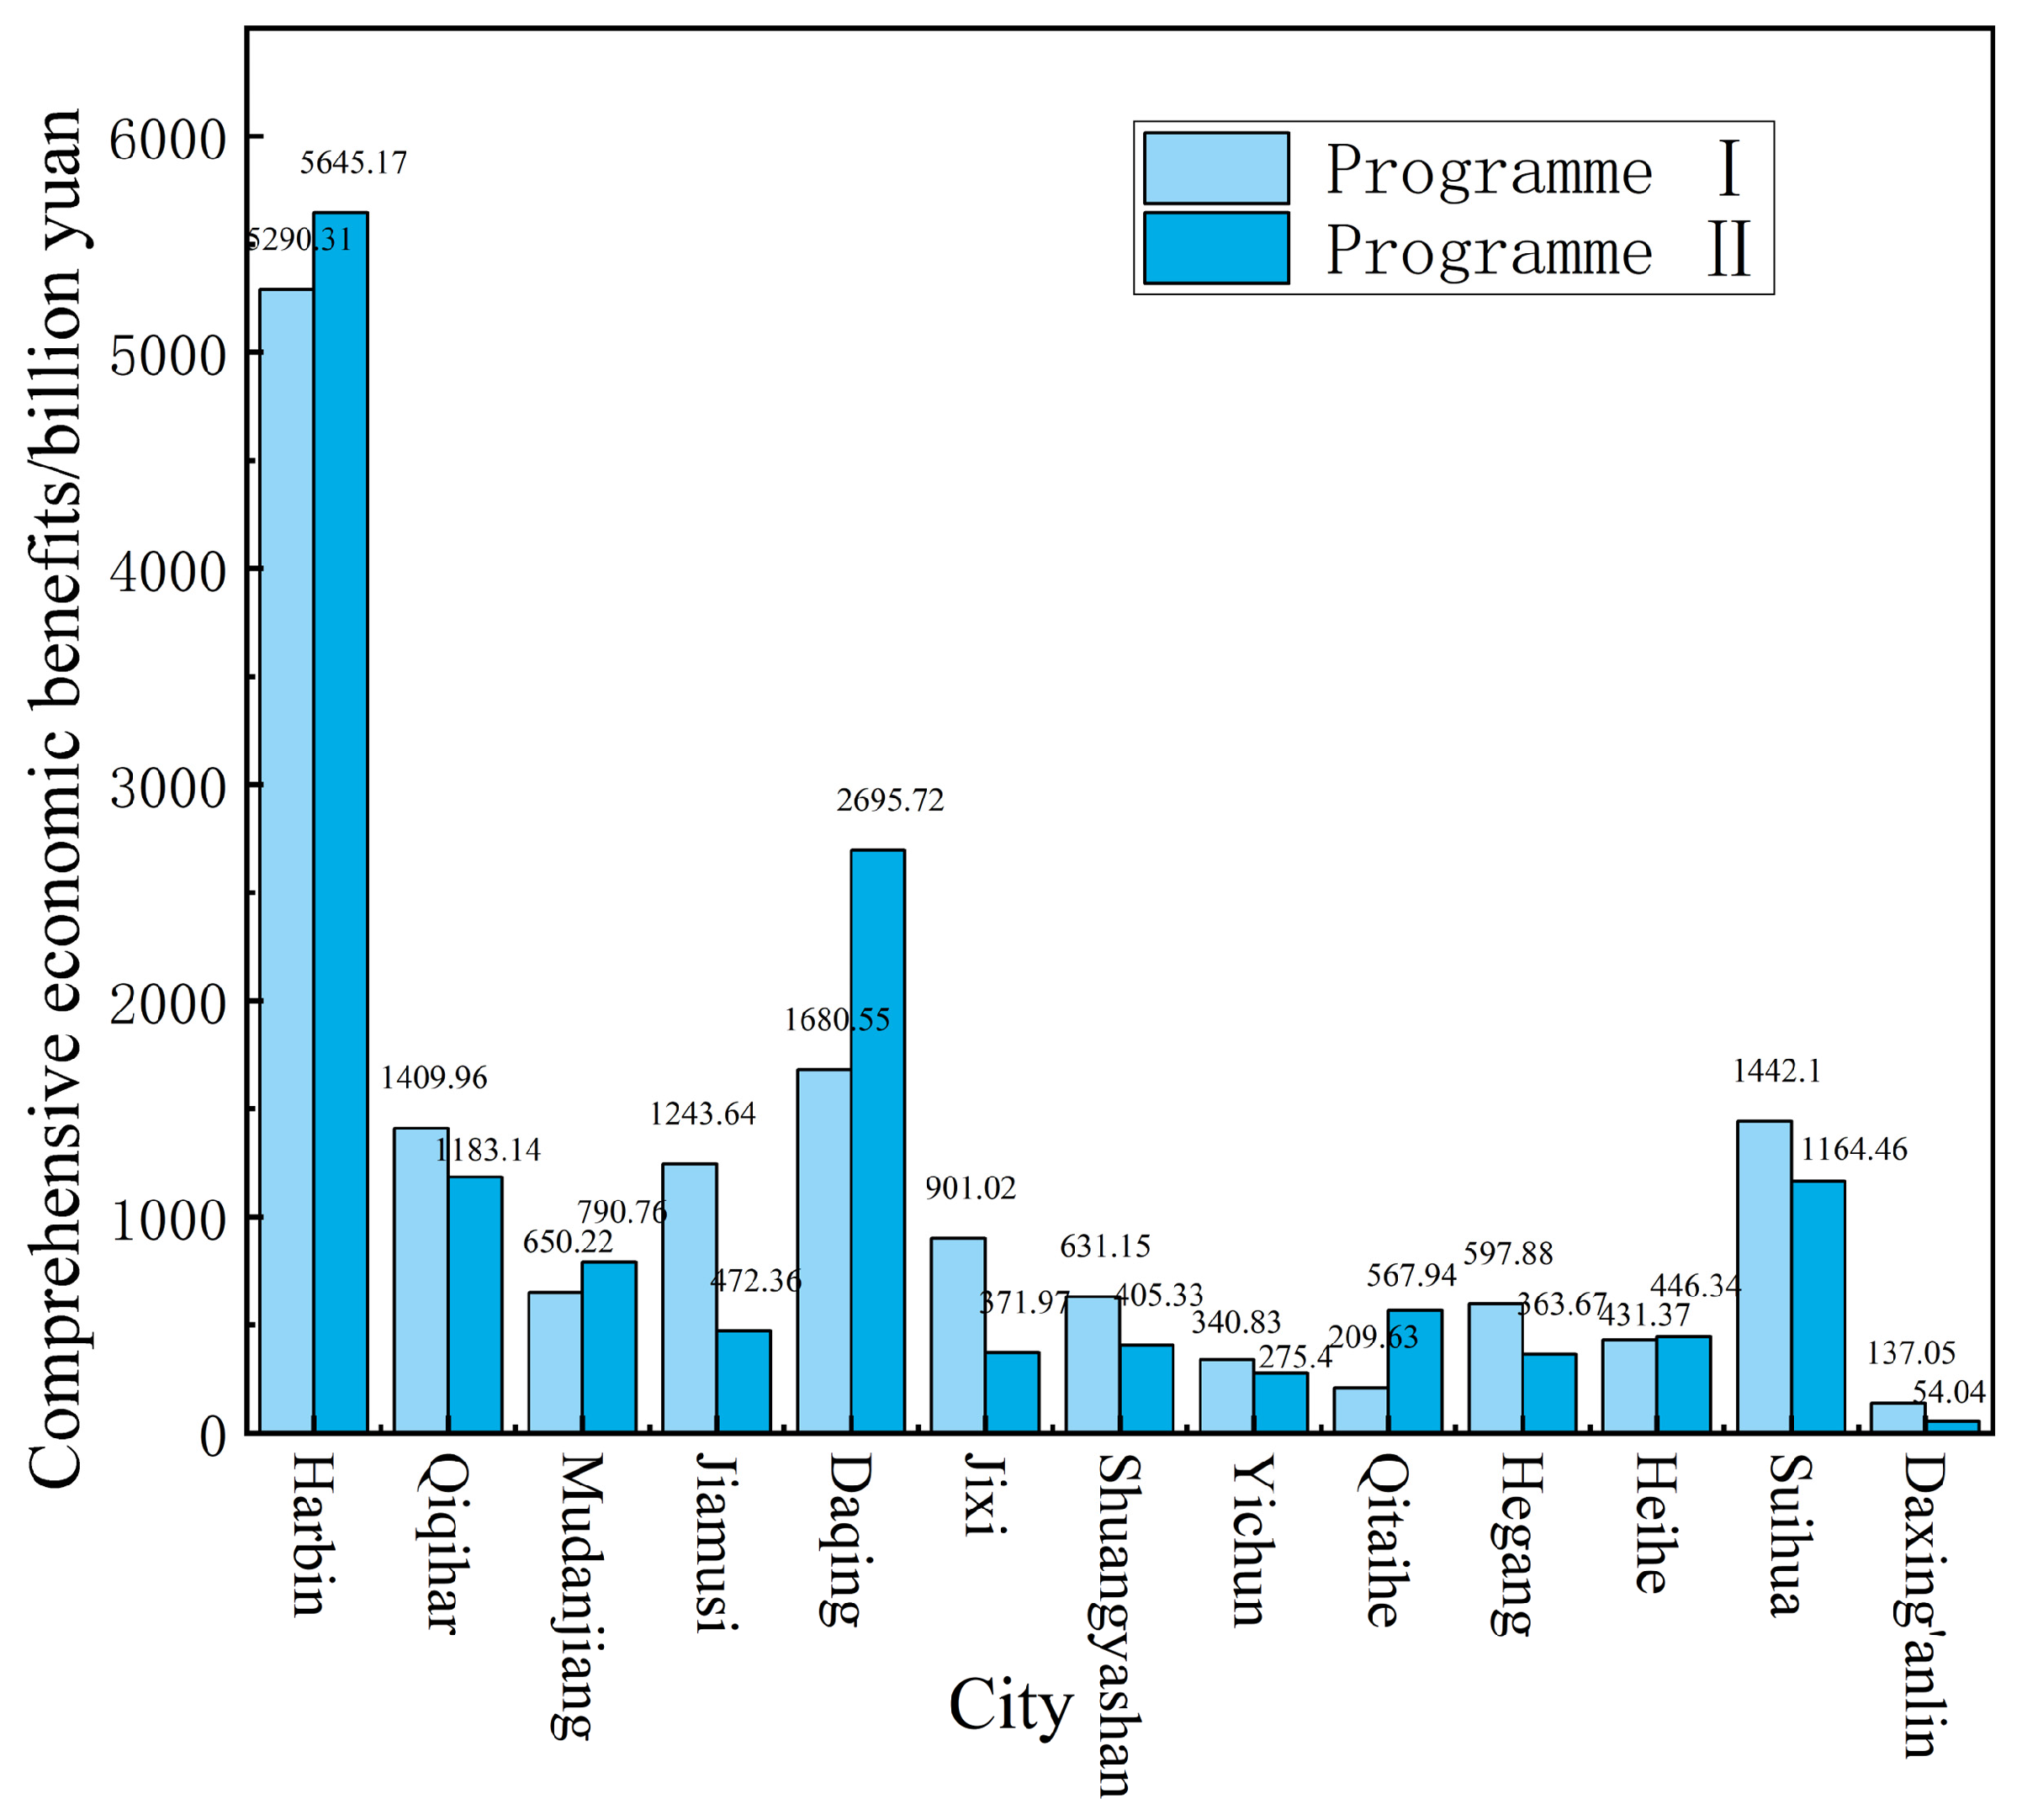
Overall, in water resources management, different allocation schemes can lead to distinct outcomes for regional economic development and ecological protection. In this study, two schemes with the same total water rights were compared, but they produced significant differences in specific allocations and the resulting comprehensive benefits. As shown in Figure 5 (comparative results), notable variations are observed across cities, with Qiqihar, Hegang, and Daqing displaying similar allocations and benefit levels under both schemes. This similarity helps to validate the rationality of the two approaches. Detailed allocation outcomes are illustrated in Figure 6 and Figure 7. Through further comparison and analysis, Scenario 1 shows a significant improvement in total water-use benefits compared to Scenario 2. Under the water rights allocation method of Scenario 1, the comprehensive benefits of water use in the 13 regions are CNY 14,966 billion, while the comprehensive benefits of water use in Scenario 2 are CNY 14,436 billion, which is an increase in comprehensive benefits of about 4%. This increase is not only reflected in the economic data but also indicates that the effective use of water resources and inter-regional equity have also improved. In addition, Scenario 2 is based on a preset indicator system to determine the allocation of water rights, which has a certain scientific basis in theory. In practical application, due to the significant differences in natural conditions, production environments, and levels of economic development among different regions, excessive deviations in water rights allocation often occur. This allocation of water rights in cities such as Jiamusi, Jixi, and Heihe deviates significantly from the actual water demand, leading to lower water resource utilization rates, water shortages, and other issues. These problems ultimately affect local agricultural production, industrial development, and residents’ livelihoods. In contrast, Scenario 1 is more in line with the actual water demand of different cities. Under the premise of meeting the minimum water demand of individual cities, regions with stronger economic strength (e.g., Qiqihar, Jiamusi, etc.) can obtain more water rights, while regions with weaker economic strength (e.g., Daxinganling, Yichun, Qitaihe, etc.) can be allocated fewer water rights accordingly. This allocation not only fits the actual situation but also effectively avoids the waste and inefficient use of water resources.
In terms of cities, the allocation of water rights in Scenario 1 is more in line with the actual situation, while the allocation of water rights through indicators in Scenario 2 does not accurately demonstrate the complex relationship between water rights and indicators, which may lead to the fact that the actual development does not fit well with the allocation of water rights. This limitation reflects the static nature of the entropy method: without periodic recalculation or adaptive feedback, allocations cannot respond to hydrological fluctuations, policy changes, or shifts in economic activity. For example, in Jiamusi, the entropy scheme underestimated water needs due to unaccounted seasonal agricultural expansion, while in other cases it risked over-allocating to regions with declining demand.
For example, Scenario 1: In Jiamusi, the water demand is 7.012 billion m3, and Scenario 1 meets this demand, increasing comprehensive benefits by 62%. For Heihe, the allocation in Scenario 1 is more consistent with its water resources demand, avoiding waste. In Qiqihar, the water rights allocation is similar to Scenario 2, but the comprehensive benefits are 16% higher in Scenario 1, demonstrating its advantage in optimizing resource al-location. Scenario 2: In Jiamusi, the water rights allocated in Scenario 2 are much lower than the actual demand, leading to potential shortages. In Heihe, Scenario 2 results in an excess allocation that may cause water resource waste. In Qiqihar, Scenario 2 shows comparable allocations to Scenario 1 but lower overall benefits, highlighting its limitations in meeting water demands and maximizing benefits.
From the perspective of sustainable development, Scenario 1 fully considers the water demands between different cities and seeks to achieve the maximum comprehensive benefits while meeting these demands, with various constraints. The conditions can effectively curb the waste and inefficient use of water resources to a certain extent. For example, the minimum water-use guarantee rate and the tolerance range of the decision variables can help limit the water supply to the actual demand range, while the minimum water-use satisfaction can alleviate the impact of the differences in water demand on the lower objective function solution, to ensure that the allocation plan is both fair and feasible. Stackelberg’s game model focuses on the interests of the individual and can effectively reconcile the conflict between the various parties in the use of water, ensuring the rational allocation of water resources at the same time, to achieve collective rationality and the feasibility of water resource allocation. The Stackelberg game model focuses on individual interests and can effectively coordinate the conflicts between the parties to ensure the rational allocation of water resources, while realizing the unity of collective rationality and individual rationality.

4.4. Measures for Exceeding Water Quotas

When actual water consumption exceeds the allocated quotas, several management measures can be implemented according to China’s current water management policies. One of the primary measures is the “Progressive Pricing for Over-quota Water Consumption” policy. Under this policy, water users who exceed their allocated quotas face cumulative tariff increases proportional to their excess water consumption levels. Specifically, as stipulated by national guidelines, water consumed within 10% above the allocated quota is generally priced at 1–2 times the normal water rate; consumption exceeding 10% to 20% above the quota is priced at 2–3 times the standard rate; and water usage beyond 20% of the allocated quota may incur tariffs up to 3–5 times the standard rate or even higher in cases of severe water scarcity. In addition to these economic measures, administrative actions could also be enforced. Authorities may impose mandatory water-saving initiatives and technological improvement requirements on enterprises and industries with persistently high water consumption. For users repeatedly exceeding water quotas, stricter administrative restrictions, temporary limitations on water supply, or direct financial penalties may be applied. Moreover, effective inter-regional water redistribution schemes and financial compensation mechanisms could be established to address imbalances between regions with surplus and deficit resources, ensuring fairness and economic feasibility. Such redistribution would also incentivize regions to better adhere to their allocated quotas, reducing potential conflicts and improving overall water-use efficiency. These combined approaches not only align with national policies promoting sustainable water resource management but also provide practical incentives and enforcement mechanisms that encourage all stakeholders to engage proactively in water conservation, technological innovation, and sustainable development.

4.5. Method Generalization and Discussion

While effective in a simulation, the Stackelberg framework’s reliance on iterative equilibrium search and parameter assumptions (e.g., k1, k2, tolerance) may limit uptake in some real-world contexts, particularly where data or computational capacity is constrained. To address this, default parameter sets can be developed from historical datasets, and iteration limits can be set to balance accuracy with operational feasibility. Such adjustments can reduce the technical barrier for adoption by local water authorities without significantly affecting allocation outcomes. The results highlight clear advantages of the Stackelberg game model in dynamic adaptation and balancing regional disparities. However, the effectiveness of this approach relies on the assumption of a strong, centralized regulatory authority capable of enforcing allocation decisions and coordinating between regions. In decentralized governance contexts—where water rights are fragmented, local autonomy is high, and enforcement capacity is limited—the direct application of the Stackelberg framework may be less effective. In such cases, adaptations such as multi-leader configurations, regional coalition-based decision making, or negotiated allocation mechanisms could be explored. These variants can preserve some strategic interaction benefits while accommodating a more distributed governance structure. To explore broader applicability, sensitivity analyses were conducted, showing robustness of the model under varying water availability and economic conditions. The entropy method, although objective, revealed limitations due to its static nature, making it less suitable for regions experiencing frequent hydrological variability. In addition, the fairness of entropy-based allocation depends strongly on the choice and weighting of indicators. If economic indicators such as GDP carry disproportionately high weights, ecological or social needs may be undervalued, leading to allocations that are economically efficient but environmentally or socially imbalanced. To mitigate this risk in the present study, the indicator system (Figure 4, Table 1) incorporates multiple dimensions—including ecological water use, urban greening coverage, and per capita water consumption—alongside economic metrics. Future applications should conduct participatory reviews of indicator selection and consider scenario testing with alternative indicator sets to ensure that allocation outcomes remain equitable across economic, environmental, and social objectives. For generalization purposes, the comparative methodology proposed in this paper can be extended to other regions with similar environmental and socio-economic conditions, such as Inner Mongolia, Jilin, and Liaoning Provinces, which face comparable issues of seasonal water scarcity and complex water resource demands. Adjusting key parameters—such as minimum water supply satisfaction, deflation coefficients, and tolerance ranges—would ensure tailored applications.
In addition to quantitative model validation, real-world feasibility also depends on qualitative factors such as stakeholder acceptance, administrative capacity, and potential implementation barriers. These aspects were beyond the scope of the present study. Future research should incorporate stakeholder consultation and policy analysis to evaluate institutional readiness and improve the practical implementation of allocation schemes.
Moreover, this study does not explicitly incorporate climate change impacts—such as changes in precipitation patterns, temperature-driven evapotranspiration shifts, or altered freeze–thaw cycles—despite Heilongjiang’s vulnerability to hydrological variability. Future work could integrate outputs from regional climate models (e.g., CMIP6, CORDEX) into water allocation simulations to account for seasonal and interannual variability under different emission scenarios. Incorporating such projections into dynamic allocation frameworks, particularly within the Stackelberg model, would enhance predictive capability and support more robust long-term decision making under climate uncertainty. In addition, groundwater–surface water interactions, which can substantially influence available supply—especially during drought periods or in heavily irrigated basins—are not considered in this study. Coupling groundwater and surface water models with the allocation framework would better reflect conjunctive resource availability and further improve the resilience of both the Stackelberg and entropy-based schemes under long-term environmental change. In practical terms, climate model projections (e.g., CMIP6, CORDEX) can be translated into dynamic parameter inputs for allocation simulations. For instance, projected precipitation and temperature patterns can inform adjustments to total available water resources, seasonal demand profiles, and ecological baseflow requirements. Running the Stackelberg and entropy models under multiple climate scenarios—such as extreme droughts, flood-rich years, or increased interannual variability—would allow decision makers to assess the robustness of allocations and identify conditions under which re-optimization is required. This dynamic parameterization approach would shift allocation planning from static baselines to a forward-looking, risk-aware framework.
Although this study focuses on a comparative analysis of the Stackelberg game model and the entropy weighting method, future research could explore hybrid approaches that leverage the strengths of both methods. Another key improvement is to integrate structured stakeholder participation into the allocation process. Participatory workshops involving government agencies, water users (e.g., agricultural, industrial, municipal), and environmental groups can be used to calibrate key parameters such as the minimum satisfaction threshold (σ0) and acceptable tolerance ranges. This co-design process can improve the legitimacy of the model, reduce resistance to implementation, and ensure that allocation decisions reflect not only technical optimization but also locally specific priorities and constraints. In addition, regular stakeholder engagement can provide an early warning of emerging issues—such as new industrial projects or policy shifts—that may require re-parameterization of the model. For instance, entropy-derived indicator weights could be incorporated as constraints or initial parameters within a Stackelberg game framework. Such a hybrid model may mitigate the limitations of each individual approach, improving the objectivity of weight assignment while preserving the adaptability of game-theoretic allocation. This perspective extends the applicability of the current work and provides a potential direction for further methodological innovation. The expanded sensitivity analysis further supports the robustness of the findings. Even when parameters were varied well beyond the original ranges, allocation rankings and overall benefit differences remained stable, suggesting that the Stackelberg model’s relative advantage is not an artifact of narrow parameter choices. In practice, one improvement is to integrate entropy-derived weights into a dynamic decision-making model, such as Stackelberg, with parameters updated periodically based on stakeholder consultations and seasonal hydrological forecasts. This hybrid approach retains transparency while enhancing adaptability and resilience in allocation outcomes.
To reduce inequities between surplus and deficit regions, the allocation framework could incorporate compensation or water rights trading. Surplus regions could transfer part of their allocation to deficit areas in exchange for financial or in-kind returns, under safeguards to maintain ecological baseflows. Such mechanisms would balance supply and demand, enhance efficiency, and complement the Stackelberg and entropy-based models in practice.
Building on the current findings, future work could explore a hybrid approach where entropy-derived indicator weights serve as initial parameters within the Stackelberg framework, combining transparency with adaptive re-allocation. Climate projections from CMIP6 or CORDEX could be incorporated as dynamic parameter inputs to test allocation resilience under scenarios such as droughts or floods. Structured stakeholder participation, including participatory workshops, can be used to calibrate satisfaction thresholds (σ0) and tolerance ranges, improving legitimacy and reducing implementation barriers. To address inequities, compensation or water rights trading between surplus and deficit regions could be introduced under safeguards for ecological baseflows. Finally, integrating IoT-based flow and quality sensors would enable real-time updates to model parameters, ensuring timely and responsive allocation decisions under changing hydrological and socio-economic conditions.

5. Conclusions

This study represents the first direct comparison between the Stackelberg game model and the entropy weighting method for water rights allocation in Heilongjiang Province, exploring the complexity and conflicting interests in water resources allocation and analyzing the strengths and weaknesses of the two methods in water rights allocation, as well as their linkages and intrinsic meanings for the water rights allocation mechanism. The Stackelberg game model demonstrates greater resilience in terms of balancing efficiency and interest in stakeholders’ satisfaction, while the entropy weighting method provides a more transparent and objective weighting process. The main findings of the study are as follows:
(1)
The entropy weight method ensures objectivity in water allocation by assigning weights to each indicator and avoiding human interference. However, its static nature limits its capacity to address dynamic interactions and feedback among stakeholders. In situations of intensified competition, such as water scarcity, it is less effective in coordinating inter-regional conflicts and often fails to achieve maximum overall benefit.
(2)
In contrast, the Stackelberg game model demonstrates clear advantages in managing multi-party interest conflicts and supporting dynamic adjustments. By structuring decision making hierarchically between upper-level managers and lower-level users, it adapts allocations in response to actual seasonal and sectoral demands. This flexibility allows prioritization of agricultural water use during peak irrigation periods, industrial supply during production peaks, and maintenance of ecological flows in major river systems. As a result, the Stackelberg model achieves better alignment with real-world conditions, higher adaptability, and stronger capacity to support balanced regional development compared to the entropy weight method.
(3)
Based on the comparative analysis, this study provides a practical framework for method selection that can be applied in other regions. For areas with multiple stakeholders, strong regulatory capacity, and dynamic negotiation needs, the Stackelberg game model is more suitable due to its adaptability to changing conditions. In contrast, the entropy weighting method is more appropriate for regions requiring transparent, objective weight assignment where decision making must be stable and data-driven. The application process should include the following: conducting a preliminary assessment of water availability, socio-economic conditions, and ecological constraints; applying each method independently with appropriate parameter settings; validating results against historical allocation patterns and stakeholder responses; and integrating the chosen method into local water management policies with regular reviews. This approach allows decision makers to select the most suitable model for their regional context, improving the applicability and transferability of this study’s findings.

Author Contributions

Conceptualization, K.L. and S.Y.; methodology, K.L. and Z.W.; software, Z.S.; formal analysis, S.Y.; data curation, Z.S. and Z.W.; writing—original draft preparation, K.L., S.Y., and Z.S.; writing—review and editing, K.L. All authors have read and agreed to the published version of the manuscript.

Funding

This research was funded by the National Natural Science Foundation of China grant number 52079050.

Institutional Review Board Statement

Not applicable.

Informed Consent Statement

Not applicable.

Data Availability Statement

The datasets generated and/or analyzed during the current study are available from the corresponding author upon request.

Acknowledgments

The authors would like to thank the editors and reviewers for their valuable suggestions.

Conflicts of Interest

The authors declare no conflicts of interest.

References

  1. Four Billion People Facing Severe Water Scarcity|Science Advances. Available online: https://www.science.org/doi/10.1126/sciadv.1500323 (accessed on 4 June 2025).
  2. Deng, L.; Guo, S.; Yin, J.; Zeng, Y.; Chen, K. Multi-Objective Optimization of Water Resources Allocation in Han River Basin (China) Integrating Efficiency, Equity and Sustainability. Sci. Rep. 2022, 12, 798. [Google Scholar] [CrossRef]
  3. Cosgrove, W.J.; Loucks, D.P. Water Management: Current and Future Challenges and Research Directions. Water Resour. Res. 2015, 51, 4823–4839. [Google Scholar] [CrossRef]
  4. Zhu, Y.; Tian, D.; Yan, F. Effectiveness of Entropy Weight Method in Decision-Making. Math. Probl. Eng. 2020, 2020, 3564835. [Google Scholar] [CrossRef]
  5. Xin, G.; Ying, L. Multi-Attribute Decision-Making Based on Comprehensive Hesitant Fuzzy Entropy. Expert. Syst. Appl. 2024, 237, 121459. [Google Scholar] [CrossRef]
  6. Chen, L.; Wang, X.; Wang, Y.; Gao, P. Improved Entropy Weight Methods and Their Comparisons in Evaluating the High-Quality Development of Qinghai, China. Open Geosci. 2023, 15, 20220570. [Google Scholar] [CrossRef]
  7. Lan, J.; Du, Y. Evaluation of Water Resources Carrying Capacity in China Based on Entropy Weight TOPSIS Model. J. Comput. Methods Sci. Eng. 2024, 24, 1981–1991. [Google Scholar] [CrossRef]
  8. He, G.; Zhao, S.; Du, Y. Evaluation and Dynamic Warning of Ecological Security of Water Resources Based on TQR-EGM Model. J. Water Resour. Water Eng. 2021, 32, 36–42. (In Chinese) [Google Scholar]
  9. The Coordination of Stakeholder Interests in Environmental Regulation: Lessons from China’s Environmental Regulation Policies from the Perspective of the Evolutionary Game Theory. J. Clean. Prod. 2020, 249, 119385. [CrossRef]
  10. Jin, J.; Fang, X. Evaluation of Economic Scenarios of Water Allocation Using a Game Theory. Water Supply 2023, 23, 3253–3261. [Google Scholar] [CrossRef]
  11. Boyd, N.T.; Gabriel, S.A.; Rest, G.; Dumm, T. Generalized Nash Equilibrium Models for Asymmetric, Non-Cooperative Games on Line Graphs: Application to Water Resource Systems. Comput. Oper. Res. 2023, 154, 106194. [Google Scholar] [CrossRef]
  12. Wang, S.; Fu, L.; Peng, H.; Wang, J.; Hua, Y.; Gui, Z. Study on an Equilibrium Water Price System Based on Cooperative Game Technology. Water 2023, 15, 2354. [Google Scholar] [CrossRef]
  13. Komasi, M.; Alizadefard, A.; Ahmadi, M. Examination of Players’ Strategies in Determining the Optimal Groundwater Exploitation by Game Theory. Hydrogeol. J. 2024, 32, 691–704. [Google Scholar] [CrossRef]
  14. Xiang, K.; Chen, J.; Yang, L.; Wu, J.; Shi, P. Equilibrium Interaction Strategies for Integrated Energy System Incorporating Demand-Side Management Based on Stackelberg Game Approach. Energies 2024, 17, 3603. [Google Scholar] [CrossRef]
  15. Zhang, X.; Castelletti, A.; Wang, X.; Guo, P. Robust Stackelberg Equilibrium Water Allocation Patterns in Shallow Groundwater Areas. Water Resour. Res. 2024, 60, e2023WR035373. [Google Scholar] [CrossRef]
  16. Huang, Q.; Lv, C.; Feng, Q. Stackelberg Game Based Optimal Water Allocation from the Perspective of Energy-Water Nexus: A Case Study of Minjiang River, China. J. Clean. Prod. 2024, 464, 142764. [Google Scholar] [CrossRef]
  17. Zarreh, M.; Yaghoubi, S.; Bahrami, H. Pricing of Drinking Water under Dynamic Supply and Demand Based on Government Role: A Game-Theoretic Approach. Water Resour. Manag. 2024, 38, 2101–2133. [Google Scholar] [CrossRef]
  18. Yu, Y.; Zhou, T.; Zhao, R.; Zhang, J.; Min, X. Bi-Level Hybrid Game Model for Optimal Operation of Multi-Function Reservoir Considering Integrated Water Resource Management. Environ. Sci. Pollut. Res. 2024, 31, 54026–54043. [Google Scholar] [CrossRef] [PubMed]
  19. Shekarforush, S.H.; Sardarshahraki, A.; Ghaffari Moghadam, Z. A Model to Manage the Allocation of Water Resources with the Game Theory Approach under Uncertainty. 2025. Available online: https://papers.ssrn.com/sol3/papers.cfm?abstract_id=5167027 (accessed on 5 March 2025).
  20. Liu, S.-B.; Hu, C.-H.; Wang, S.-W.; Guo, X.; Niu, C.-J.; Quan, L.-Y.; Li, M. Pricing Mechanism for Multi-Source–Multi-User Water under a Dynamic Game Model: A Case Study of Yiwu City. China Rural. Water Hydropower 2024, 5, 169–175. [Google Scholar] [CrossRef]
  21. Jia, X.; Fu, X.; Zhang, X.; Fan, Z. Robust Master–Slave Game Model for Water-Quality Protection and Water-Use Efficiency and Its Application. J. Hydraul. Eng. 2024, 55, 874–882. (In Chinese) [Google Scholar] [CrossRef]
  22. Xu, Z.; Yao, L.; Zhou, X.; Moudi, M.; Zhang, L. Optimal Irrigation for Sustainable Development Considering Water Rights Transaction: A Stackelberg-Nash-Cournot Equilibrium Model. J. Hydrol. 2019, 575, 628–637. [Google Scholar] [CrossRef]
  23. Houba, H.; Tomori, F. Stackelberg Social Equilibrium in Water Markets. Games 2023, 14, 54. [Google Scholar] [CrossRef]
  24. De Frutos Cachorro, J.; Martín-Herrán, G.; Tidball, M. Commitment vs. Noncommitment Behaviors in Natural Resource Conflicts: A Case Study of Groundwater Resources. Econ. Model. 2024, 132, 106652. [Google Scholar] [CrossRef]
  25. Pan, L.; Chen, X.; Zhao, L.; Xiao, A. Does Information Asymmetry Impact Sub-Regions’ Cooperation of Regional Water Resource Allocation? Int. J. Environ. Res. Public Health 2019, 16, 4292. [Google Scholar] [CrossRef] [PubMed]
  26. Janjua, S.; An-Vo, D.-A.; Reardon-Smith, K.; Mushtaq, S. Resolving Water Security Conflicts in Agriculture by a Cooperative Nash Bargaining Approach. Agric. Water Manage. 2024, 306, 109205. [Google Scholar] [CrossRef]
  27. Chu, Y.; Xiao, Y.; Zhu, J. A Bilevel Optimal Water Allocation Model Considering Water Users’ Satisfaction Degree and Water Rights Transaction: A Case Study in Qingzhang River Basin, China. Water 2023, 15, 2650. [Google Scholar] [CrossRef]
  28. Environmental Water Efficiency: Maximizing Benefits and Minimizing Costs of Environmental Water Use and Management. Available online: https://wires.onlinelibrary.wiley.com/doi/epdf/10.1002/wat2.1285 (accessed on 4 June 2025).
  29. Yang, Y.; Liu, Y.; Dai, J.; Zeng, Y. Cost-Sharing Mechanism of Water Pollution Control in Main and Subbasins Based on Stackelberg Game Model. Math. Probl. Eng. 2022, 2022, 6559840. [Google Scholar] [CrossRef]
  30. Men, B.; Wu, Z.; Liu, H.; Li, Y.; Zhao, Y. Research on Hedging Rules Based on Water Supply Priority and Benefit Loss of Water ShortageA Case Study of Tianjin, China. Water 2019, 11, 778. [Google Scholar] [CrossRef]
  31. Water Resources Utilization Efficiency and Influence Factors under Environmental Restrictions. J. Clean. Prod. 2018, 184, 611–621. [CrossRef]
  32. De Clercq, D.; Smith, K.; Chou, B.; Gonzalez, A.; Kothapalle, R.; Li, C.; Dong, X.; Liu, S.; Wen, Z. Identification of Urban Drinking Water Supply Patterns across 627 Cities in China Based on Supervised and Unsupervised Statistical Learning. J. Environ. Manage. 2018, 223, 658–667. [Google Scholar] [CrossRef]
  33. Zhang, K.; Shen, J.; Han, H.; Zhang, J. Study of the Allocation of Regional Flood Drainage Rights in Watershed Based on Entropy Weight TOPSIS Model: A Case Study of the Jiangsu Section of the Huaihe River, China. Int. J. Environ. Res. Public Health 2020, 17, 5020. [Google Scholar] [CrossRef]
  34. Fei, B.; Min, Z. Assessment of Water Resources Vulnerability in International River Basins Based on Entropy Weight Method. J. Environ. Prot. Ecol. 2020, 21, 865–875. [Google Scholar]
  35. Li, M.; Sun, H.; Singh, V.P.; Zhou, Y.; Ma, M. Agricultural Water Resources Management Using Maximum Entropy and Entropy-Weight-Based TOPSIS Methods. Entropy 2019, 21, 364. [Google Scholar] [CrossRef] [PubMed]
  36. Feng, J. Optimal Allocation of Regional Water Resources Based on Multi-Objective Dynamic Equilibrium Strategy. Appl. Math. Model. 2021, 90, 1183–1203. [Google Scholar] [CrossRef]
  37. Cui, Y.; Feng, P.; Jin, J.; Liu, L. Water Resources Carrying Capacity Evaluation and Diagnosis Based on Set Pair Analysis and Improved the Entropy Weight Method. Entropy 2018, 20, 359. [Google Scholar] [CrossRef] [PubMed]
  38. Zhang, S.; Yang, J.; Xu, Z.; Zhang, C. Effect of Frequency of Multi-Source Water Supply on Regional Guarantee Rate of Water Use. Water 2019, 11, 1356. [Google Scholar] [CrossRef]
  39. Song, P.; Wang, C.; Zhang, W.; Liu, W.; Sun, J.; Wang, X.; Lei, X.; Wang, H. Urban Multi-Source Water Supply in China: Variation Tendency, Modeling Methods and Challenges. Water 2020, 12, 1199. [Google Scholar] [CrossRef]
  40. Zhang, S.; Wen, X.; Zhang, R.; Miao, W.; Gan, Z. An Optimal Allocation Model Based on the Regional Ecological Water Requirements and Multi-Water Supply Characteristics: A Case Study of Shandong Province, China. J. Hydrol. Reg. Stud. 2023, 49, 101513. [Google Scholar] [CrossRef]
Figure 1. Digital elevation model (DEM) of Heilongjiang Province.
Sustainability 17 07407 g001
Figure 2. Hot spot map of water resource load in various regions of Heilongjiang Province.
Sustainability 17 07407 g002
Figure 3. Stackelberg game modeling framework.
Sustainability 17 07407 g003
Figure 5. The game process.
Sustainability 17 07407 g005
Figure 6. Configuration results of the two scenarios—water rights.
Sustainability 17 07407 g006
Figure 7. Configuration results of the two scenarios—overall benefits.
Sustainability 17 07407 g007
Table 1. Development indicators for municipalities, 2021.
IndicatorHarbinQiqiharMudanjiangJiamusiDaqingJixiShuangyashanYichunQitaiheHegangHeiheSuihuaDaxing’anling
Per capita water consumption/m3690.20839.88413.603076.79702.352236.791629.20462.18392.812194.36148.24507.5032.75
Population/10,000 people943.20516.50244.20227.90271.80164.70137.00108.4075.1095.70153.80513.3039.70
Total water resources/billion m3137.97120.6589.8956.3930.4842.1334.4093.587.9832.13191.8172.45286.42
Land area/km253,06842,46938,86532,70421,21922,48822,03632,760622214,68066,80234,96464,822
Domestic water consumption/billion m34.191.481.020.870.920.630.430.340.210.400.421.470.08
Water consumption for forestry, animal husbandry, fishery, and livestock1.360.830.751.250.750.200.110.120.120.140.111.500.01
Industrial water consumption/billion m31.866.431.151.803.900.340.440.320.370.570.150.400.02
Water consumption for ecological environment/billion m31.200.050.030.030.060.020.030.010.010.090.000.020.00
Water consumption for agricultural irrigation/billion m354.8034.336.7865.9413.2435.5621.244.182.1619.741.5322.450.00
Modulus of water production/10,000m3/km226.0028.4123.1317.2414.3718.7315.6128.5712.8321.8928.7120.7244.19
Water consumption of CNY 10,000 GDP/m3121.64354.27115.43859.1072.86610.24432.56157.20127.48592.8935.79221.198.49
Urban greening coverage rate/%33.0744.2129.2043.5043.8940.1043.6938.7646.1743.0943.1229.1048.60
Table 2. GDP by city/billion.
YearHarbinQiqiharMudanjiangJiamusiDaqingJixiShuangyashanYichunQitaiheHegangHeiheSuihuaDaxing’anling
20145332.71238.81264.1766.04077.5516.0432.7256.0214.2259.5421.41190.2128.4
20155751.21270.71310.7619.42983.5514.7433.3248.2212.6265.6447.81272.2134.9
20165183.81325.31368.1640.52610.0518.4437.4251.2216.6264.1470.81316.3143.9
20175576.31353.21404.7714.82680.5530.1426.9266.4228.8282.9488.91336.8149.7
20185249.41340.21423.0724.12801.2535.2476.4274.2250.3289.6505.11359.6129.0
20195351.71128.9825.0762.92568.3552.0507.0298.8231.0336.0579.01101.0138.6
20205183.81200.4831.7811.82301.1572.4493.9295.2206.4340.2614.41150.2141.9
20215351.71224.5875.0816.22620.0603.7516.0318.7231.4354.2637.11177.7153.1
Table 3. Water consumption per municipality/billion m3.
YearHarbinQiqiharMudanjiangJiamusiDaqingJixiShuangyashanYichunQitaiheHegangHeiheSuihuaDaxing’anling
201470.648.2810.5159.5827.1239.726.866.413.2923.244.8728.250.48
201567.0649.1710.6659.2224.7338.1222.495.513.1421.24.4731.050.33
201667.4148.1510.4959.3127.5236.2523.314.922.9421.334.2529.540.16
201767.6448.9310.4475.125.5937.8124.665.133.0120.93.6130.080.15
201862.3149.6710.3274.6824.9836.8323.445.053.0121.523.5528.430.15
201958.1445.5410.30 65.7321.7734.4419.224.772.9417.522.9126.980.14
202062.6746.3910.0765.1320.4634.9519.244.782.9419.422.7625.190.13
202165.143.3810.170.1219.0936.8422.325.012.95212.2826.050.13
Table 4. Entropy weighting method indicator weights.
IndicatorWeights
Per capita water consumption/m30.0672
Population/10,000 people0.0785
Total water resources/billion m30.0609
Land area/km20.0360
Domestic water consumption/billion m30.0835
Water consumption for forestry, animal husbandry, fishery, and livestock0.0798
Industrial water consumption/billion m30.1117
Water consumption for ecological environment/billion m30.2523
Water consumption for agricultural irrigation/billion m30.0738
Modulus of water production/10,000m3/km20.0515
Water consumption of CNY 10,000 GDP/m30.0695
Urban greening coverage rate/%0.0353
Table 5. Composite score and water rights allocation results.
CityHarbinQiqiharMudanjiangJiamusiDaqingJixiShuangyashanYichunQitaiheHegangHeiheSuihuaDaxing’anling
Aggregate score0.20490.12510.05450.12110.07030.06770.05230.03880.02160.06430.04770.07690.0548
Allocated water rights/billion m368.6741.9118.2640.5823.5722.7017.5312.997.2421.5615.9725.761.84
Disclaimer/Publisher’s Note: The statements, opinions and data contained in all publications are solely those of the individual author(s) and contributor(s) and not of MDPI and/or the editor(s). MDPI and/or the editor(s) disclaim responsibility for any injury to people or property resulting from any ideas, methods, instructions or products referred to in the content.