Article

Quantifying the Environmental Performance of the Oyster (Crassostrea gigas) Supply Chain: A Life Cycle Assessment in Dalian, China

1
Key Laboratory of Environment Controlled Aquaculture (Dalian Ocean University) Ministry of Education, 52 Heishijiao Street, Dalian 116023, China
2
College of Fisheries and Life Science, Dalian Ocean University, 52 Heishijiao Street, Dalian 116023, China
3
College of Marine Technology and Environment, Dalian Ocean University, 52 Heishijiao Street, Dalian 116023, China
4
Key Laboratory of Land and Sea Ecological Governance and Systematic Regulation, Ministry of Ecology and Environment, Shandong Academy for Environmental Planning, Jinan 250101, China
5
College of Biosystems Engineering and Food Science, Zhejiang University, 866 Yuhangtang Road, Hangzhou 310058, China
*
Author to whom correspondence should be addressed.
Sustainability 2025, 17(16), 7392; https://doi.org/10.3390/su17167392
Submission received: 10 June 2025 / Revised: 11 August 2025 / Accepted: 12 August 2025 / Published: 15 August 2025
(This article belongs to the Special Issue Sustainability in Aquaculture Systems)

Abstract

Aquaculture is recognized as a critical contributor to global high-quality protein provision and food security maintenance. As the world’s most extensively cultivated bivalve species, the Pacific oyster (Crassostrea gigas) holds significant ecological and socioeconomic value. However, environmental impacts associated with its supply chain remain inadequately quantified. In this study, a cradle-to-gate Life Cycle Assessment (LCA) framework was implemented to evaluate the oyster production supply chain in Dalian, China, encompassing breeding, aquaculture, and processing stages and eleven environmental impact categories were systematically quantified. The results demonstrate that the aquaculture stage dominates the life cycle environmental footprint, contributing 88.9% of the total impacts. Marine aquatic ecotoxicity potential (MAETP) was identified as the predominant category, representing 92% of impacts within this stage. To advance sustainable development, further quantification of environmental impact drivers is recommended. Additionally, the feasibility of renewable energy adoption must be assessed, intelligent aquaculture management systems developed, and integrated evaluation models established. This study provides a useful reference for LCA methodology advancement in China’s aquaculture sector while contributing to global aquatic Life Cycle Inventory databases.

1. Introduction

In the global food system, aquaculture serves as a crucial source of protein for the world’s population. Aquaculture provides 15% of the world’s total animal protein consumption as high-quality protein, which has become an indispensable part of global food security [1]. As the largest aquaculture producer globally, China holds a pivotal position in this sector and has made substantial contributions to ensuring global food security. With 58.1 million tons produced each year, China contributes more than 60% of global aquaculture output [1]. The diversity of cultivated species includes various fish and shellfish [2]. The oyster (Crassostrea gigas) is a widely distributed bivalve, ranked at the top of all shellfish in terms of yield. Due to its remarkable filtration capabilities and high protein content, it plays an essential role in both ecological environments and human life [3]. The trend of aquaculture yield and farming area were increased in recent years in China. As illustrated in Figure 1, the total production of oyster aquaculture in China increased from 421,900 tons in 2013 to 667,100 tons in 2023. Compared to 2013, this represents a growth rate of 58.14%. The cultivated area expanded from 13,100 m3 in 2013 to 27,700 m3 in 2023, with a growth rate of 111.29% during this period.
However, as oysters are an essential component of the marine economy and shellfish industry, their farming practices heavily depend on energy sources such as electricity and fossil fuels [4]. This reliance inevitably leads to certain environmental impacts through energy consumption across various production stages.
Life Cycle Assessment (LCA) serves as a crucial decision-making tool for evaluating the environmental impacts associated with the product life cycle, from cradle to grave [5]. After years of development, the life cycle concept has been widely used in the field of industrial production to assess the environmental impact caused by industrial manufacturing processes and to support decision-making for enterprises and governments. This may prompt the implementation of measures to improve environmental impacts. LCA has also been widely used to assess the environmental performance of aquatic product farming processes [6]. Bergman et al. [7] conducted a comprehensive study analyzing the environmental performance and potential for improvement of commercial recirculating aquaculture systems in tilapia farming in Clarias, Sweden. The study found feed production accounted for 67–98% of impacts, while energy demands added to tilapia farming’s environmental effects. Hu et al. [8] performed a comparative analysis of the potential environmental impacts between rice-shrimp-integrated systems and traditional rice monoculture practices. The results indicated that non-farm stages were primarily responsible for nitrogen equivalent demand (NED) and global warming potential (GWP), while other impact categories such as acidification potential (AP), eutrophication potential (EP), human toxicity potential (HTP), freshwater toxicity potential (FTP), and sedimentation toxicity potential (STP) predominantly occurred during farm operations. Hou et al. [9] utilized a large commercial company based in Hangzhou, China, as a case study to conduct an LCA of largemouth bass (Micropterus salmoides). The results demonstrated that marine aquatic ecotoxicity potential (MAETP) peaked during pond farming stages throughout the entire process. Contribution analysis identified electricity usage at 48% and emissions at 23% as two critical factors influencing breeding stages. Conversely, electricity accounted for 60%, while feed contributed 26% during pond farming phases. McGrath et al. [10] conducted an LCA of an aquaculture technology utilizing floating solid wall enclosures as the primary culture environment for salmon farming. The findings showed that at full production capacity, feed supply and on-site energy use dominated four of the five evaluated impact categories. Cooney et al. [11] undertook an LCA of Eurasian bass (Perca fluviatilis). Their results revealed a significant discrepancy between inputs and outputs, which affected farm delivery. Moreover, the greatest environmental burden occurred during the breeding phase compared to all other stages. Mungkung et al. [12] applied the LCA methodology to evaluate the potential environmental impacts associated with a two-cage culture system involving carp (Cyprinus carpio carpio) and tilapia (Oreochromis niloticus) in Indonesia’s Cirata Reservoir. Their results demonstrated that performance efficiency is highly contingent upon water quality in the lake. The study identified key factors including land use, resource consumption, acidification effects, climate change contributions, and energy dependence, particularly from fishmeal production. Tamburini et al. [13] performed an LCA on Italian Mediterranean mussels (Mytilus galloprovincialis), with a cradle-to-gate system boundary. The study concluded that due predominantly to shipping requirements and substantial use of non-recyclable high-density polyethylene (HDPE) socks throughout the annual production cycle, both growth and harvest stages represented critical stages. Chary et al. [14] used a mathematical model to scale and evaluate the theoretical performance scenarios of single-culture red grouper (Sciaenops ocellatus) in net cages and co-culture cucumbers (Holothuria scabra) in open-water IMTA. By comparing the LCA impact results, the study revealed relatively low eutrophication effects but high cumulative energy demand, with climate change impacts causing category shifts. Currently, the LCA of oyster farming primarily focuses on the comparative analysis of farming models across different regions. For instance, Yu et al. [15] conducted a comparative study of oyster farming practices in six major regions of China. The findings indicate that China’s trends from 2011 to 2020 were significantly influenced by local government policies, which enhanced the positive impacts on both CO2 reduction and seawater quality purification. However, challenges related to waste management and byproducts remain substantial. Tamburini et al. [16] conducted an LCA study of oyster farming in Italy’s Po River Delta. They evaluated two production scenarios including spat import from France and local seed production. Their research identified key environmental impact factors and proposed corresponding improvement measures. Summa et al. [17] also studied this region and compared traditional offshore longline aquaculture with lagoon pre-fattening strategies. Their results demonstrated that the latter approach reduced CO2 emissions by approximately 12% and decreased other environmental impacts by 9%. Dias et al. [18] found oyster depuration in France showed environmental advantages over Portugal across most impact categories, primarily due to France’s cleaner electricity mix.
The supply chain encompasses the entire process from raw material procurement and manufacturing to product distribution. The application of the LCA method for environmental impact assessment of the green supply chain in the field of aquaculture is also relatively mature. The existing research has examined various aquatic products and their complete supply chains. Regarding supply chain optimization for specific species, a study on sea cucumber developed an integrated model that incorporates yield, economic benefits, and environmental performance. The model identified cage-based seedling rearing with bottom-sowing cultivation as the best upstream production strategy, while supermarkets, specialty stores, and online platforms were found to be the most effective downstream distribution channels [19]. Studies on copper alloy net pen systems for Atlantic salmon farming revealed significant improvements compared to conventional methods. These systems have effectively reduced feed input, minimized onsite energy demand, decreased the usage of antibiotics, and lowered labor requirements. Environmental assessments measured notable progress in key impact categories such as climate change and acidification [20]. Environmental impact analysis of supply chain operations revealed key findings from an LCA study of northern Italy’s aquaculture sector. The research showed that resource sharing significantly lowers environmental impacts and highlights specific opportunities for technical improvements in production phases and byproduct management [21]. Another study reviewing the outcomes of clean production strategies in the aquaculture industry pointed out that effective clean production strategies identified at various stages of the supply chain have the potential to reduce unnecessary operations, energy consumption, storage costs, and waste generation [22]. The analysis of the process from “cradle to gate” indicates that electricity consumption is the primary driving factor for environmental impact, responsible for over 80% of total impacts across all categories. In contrast, the contributions of inputs such as liquid oxygen, water pumps, and high-density polyethylene are relatively minor [23]. The life cycle protein assessment demonstrated that multi-component aquatic foods like salted and canned anchovy products generate substantially higher green protein footprint values due to their amplified environmental impacts [24]. Furthermore, the research comparing the environmental sustainability of existing supply chains with alternative solutions not only analyzes the average impact rates under various scenarios but also identifies several key directions for improvement [25].
This study’s comprehensive and quantitative analyses regard the environmental impacts of oyster production in the entire supply chain from breeding and aquaculture, to the processing stage using the LCA method. The aim of this study was to explore the environmental-friendly improvement measures for the oyster production supply chain. Through a systematic analysis of each stage within the oyster farming supply chain, key factors of the high energy consumption and pollution were identified. Based on the research, the theoretical foundation and technical solutions were proposed in order to develop the sustainable oyster farming industry and also raised up the useful reference for the green development of other aquaculture species.
The specific content is structured as follows: Section 1 provides an introduction to the research background along with a review of the methods employed. Section 2 details the materials and methodologies utilized in the study. Section 3 presents the results accompanied by relevant analyses. Section 4 includes a discussion and offers suggestions based on findings. Finally, Section 5 concludes by summarizing key insights.

2. Materials and Methods

The international standards ISO 14040 and ISO 14044 [26,27] have provided detailed definitions and explanations for the principles, contents, definitions, and technical framework of LCA. The specific research steps include the determination of goals and scopes, list analysis, impact assessment, and result interpretation. This study focuses on oyster farming enterprises in Dalian as the subject of investigation, with the objective of conducting an LCA of the oyster farming supply chain to identify fundamental patterns in its environmental impact.

2.1. Description of Case Study

The case enterprise is a prominent oyster farming enterprise situated in Dalian City, Liaoning Province, China. With a registered capital of 12.51 million dollars, it currently operates three production bases for oyster original seeds covering an area of 6.67 × 10⁷ m2 each. The operational performance of this enterprise exemplifies the advanced standards of oyster farming within China.

2.1.1. Breeding Stage (Stage 1)

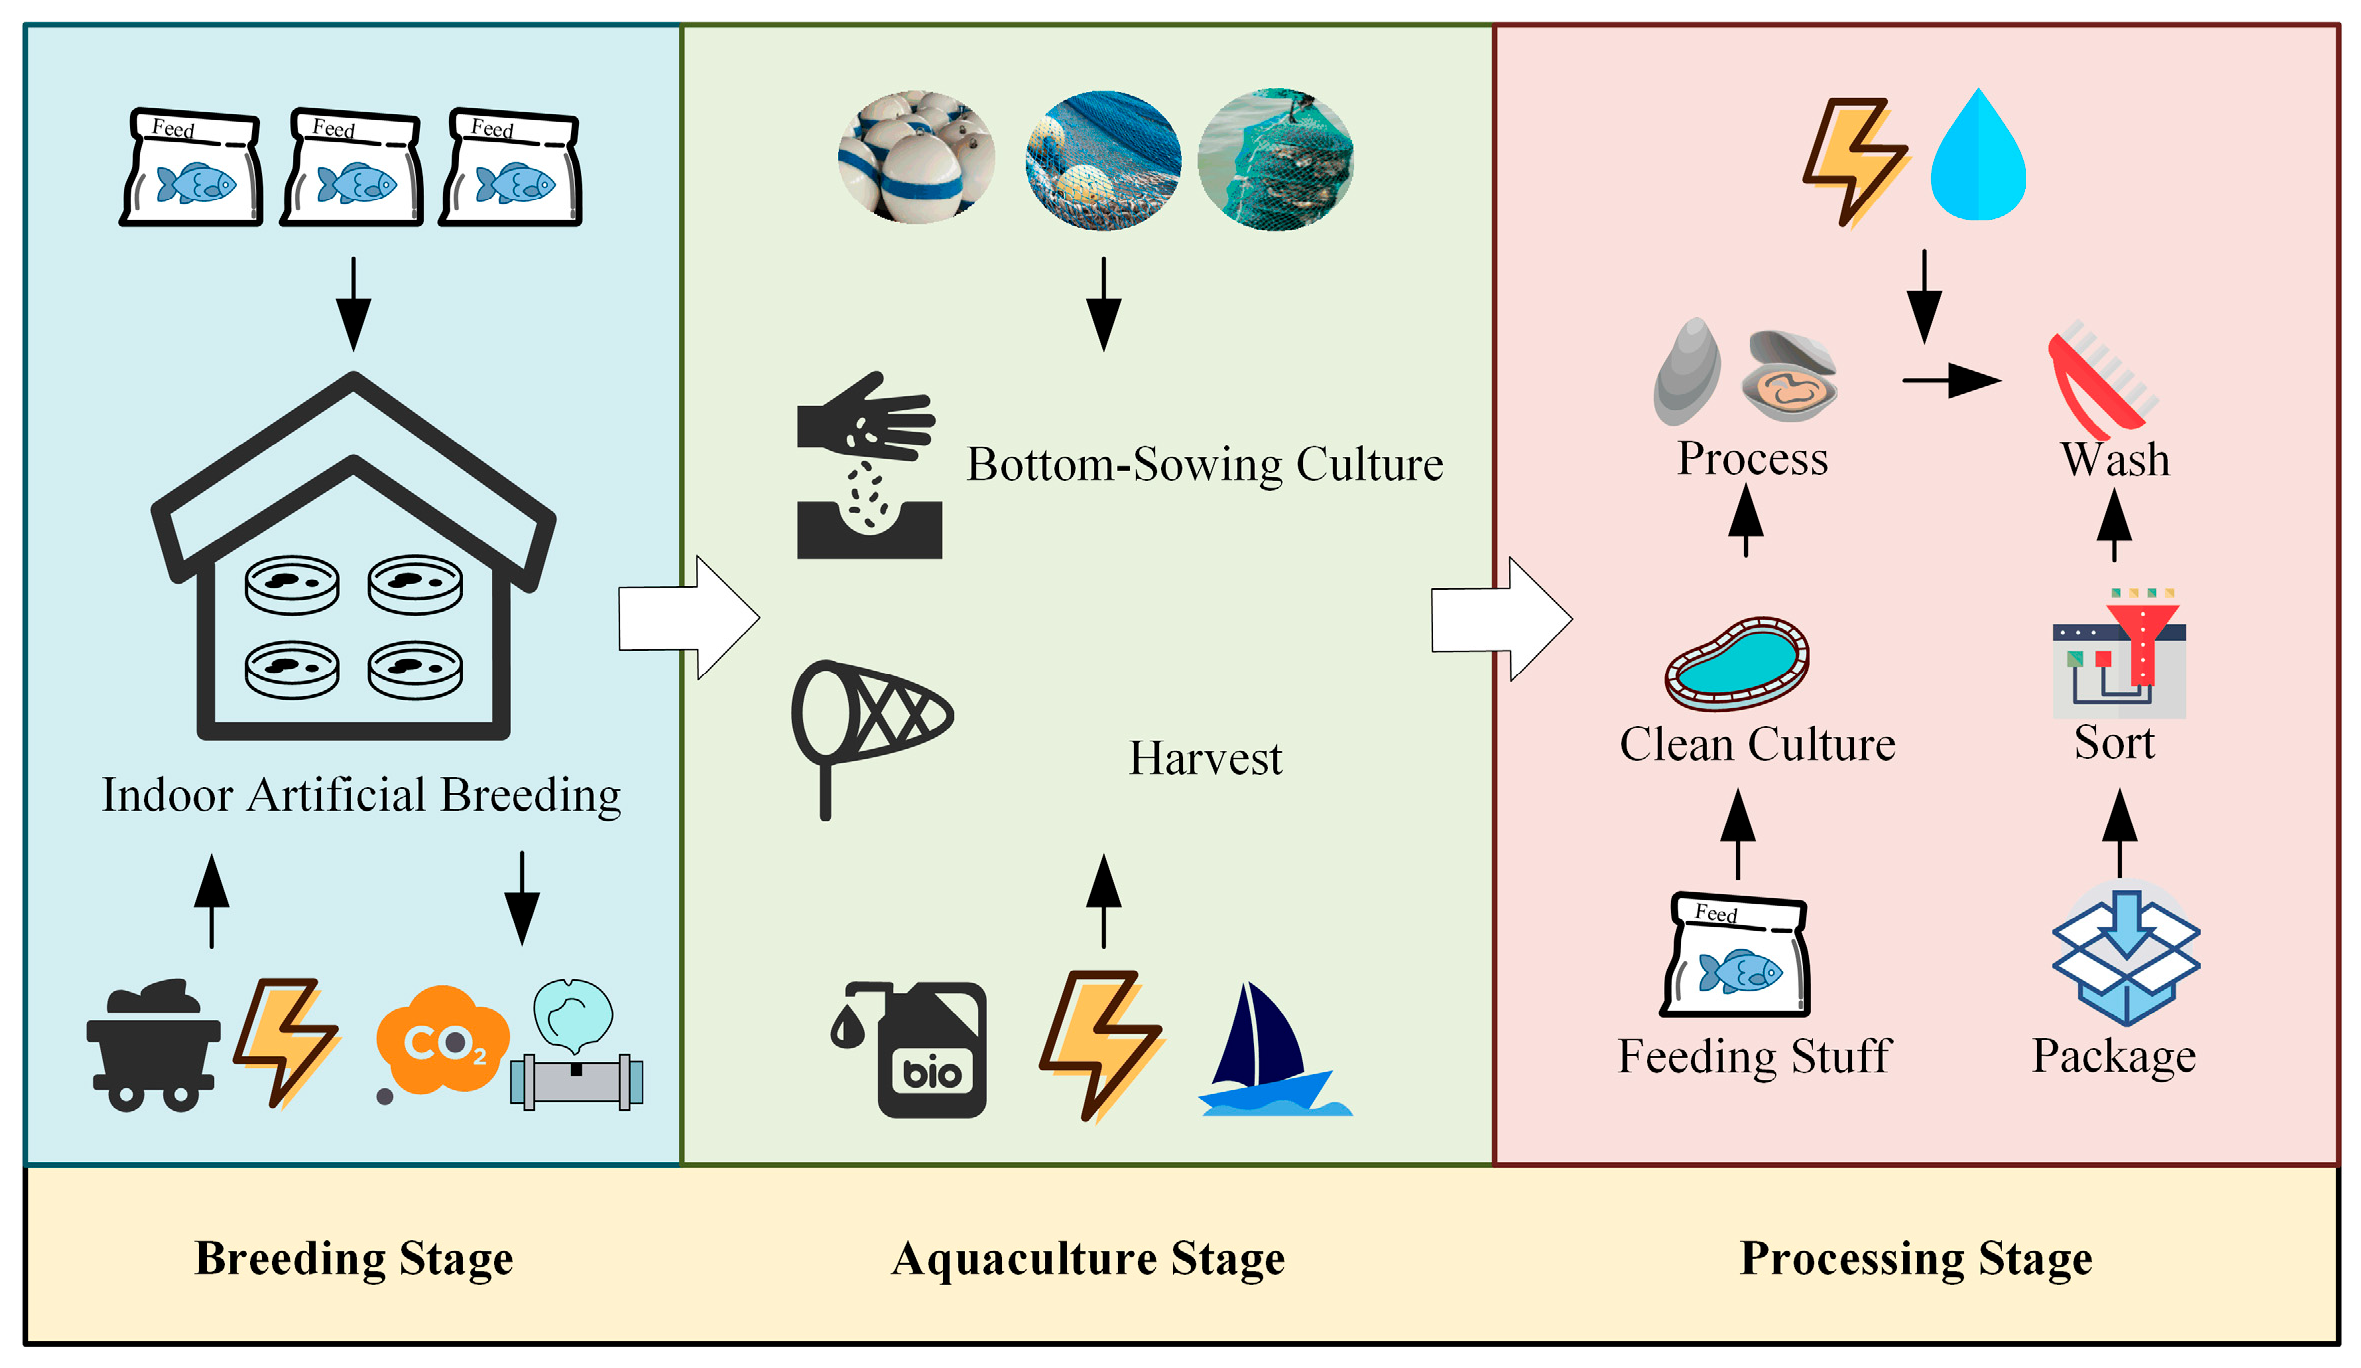
The breeding stage has a production period that lasts from March to June each year. In Zhuanghe City, Liaoning Province, China, an indoor artificial breeding method is employed. Throughout this period, the entire breeding process was fed with unicellular algae as feed. The main consumption was coal and electricity for heating the water temperature. The main emissions included CO2 produced by energy consumption during power generation, total nitrogen, total phosphorus, and chemical oxygen demand (COD) in the wastewater generated during the breeding process.

2.1.2. Aquaculture Stage (Stage 2)

The production period for the aquaculture stage is in June every year. The cultivated seedlings are sown into the natural sea area. Typically, the aquaculture cycle spans approximately 18 months. Upon completion of this cycle, live oysters are harvested and transported ashore for subsequent processing. The aquaculture process consists of two main stages: bottom sowing culture and harvesting. During this period, polyethylene materials such as aquaculture float valves, float balls, and ropes are needed as the infrastructure required for aquaculture. In addition, aquaculture practitioners need to travel between the coast and the aquaculture area. The consumption of fossil fuels such as diesel and electricity provides power for the navigation of ships.

2.1.3. Processing Stage (Stage 3)

After harvest, oysters need to go through six processes: feeding stuff, clean culture, processing, washing, sorting, and packaging. The processing procedure commences when the oysters attain suitable size and requires preliminary treatment. This step involves the removal of excess attachments and impurities in preparation for subsequent cleaning and sorting. The washing process involves thoroughly cleaning the processed oysters to remove surface dirt and residues to ensure that the product is clean and hygienic. The sorting process involves sorting oysters after washing according to their size, weight, and quality to meet the demands of different markets. The packaging process involves packaging the sorted oysters and placing them in appropriate containers such as plastic bags or foam boxes to ensure they remain fresh and intact during transportation and sales. At this stage, the main energy consumed is electricity. A schematic diagram of the oyster farming process is shown in Figure 2.

2.2. Life Cycle Assessment

2.2.1. Goal and Scope Definition

The system boundaries of its supply chain encompass three distinct stages: breeding stage, aquaculture stage, and processing stage. In this study, 1 t processed oyster was selected as the functional unit.

2.2.2. Inventory Analysis

The Life Cycle Inventory of the oyster farming process is detailed in Table 1. The input and output data of oyster breeding stage and farming stage were calculated and analyzed based on the ultimate goal of 1 t processed oysters. The input data of electricity, coal, diesel, seawater, fresh water, etc., are sourced from actual research findings. The upstream traceability data of the input energy and raw materials are derived from the Gabi database in the LCA for Experts software (10.5 academy version). The output waste gas emission data were obtained through the Ecoinvent 3.7 database. Parameters such as COD, total nitrogen, and total phosphorus were sampled directly from on-site water quality assessments and subsequently analyzed in the laboratory setting.

2.2.3. Impact Assessment

Impact assessment is an important component of LCA [28]. The optional evaluation methods include weighting, normalization, and characterization [29]. The formulas for the calculation steps of the characterization (Equation (1)) and normalization (Equation (2)) of the LCA can be formulated as
Characterization   results = i m i   ×   C h a r a c t e r i s t i c   f a c t o r
where m i represents the quantification results of the input or output of the i th substance within the system boundary (e.g., pollutant emissions, resource and energy consumption, resource and energy exploitation, and land use, etc.).
Normalization   results = C h a r a c t e r i z a t i o n   r e s u l t s N o r m a l i z a t i o n   r e f e r e n c e   v a l u e
In this study, the LCA for Experts database was selected as the background data for the research, and the CML-IA-Aug. 2016-world method was adopted to calculate the characterization results. This method mainly focuses on energy consumption input, pollution output, and ecological damage and is highly suitable for conducting LCA research on oysters. In addition, the method primarily encompasses these eleven categories of influence (Table 2).

2.2.4. Analysis of Uncertainty

Uncertainty analysis represents a systematic methodology designed to identify, quantify, and evaluate the impacts of various uncertain factors on research subjects (such as systems, models, decisions, or outcomes). This methodology determines result reliability, stability, and potential risks [30].

3. Results

3.1. Characterization Results

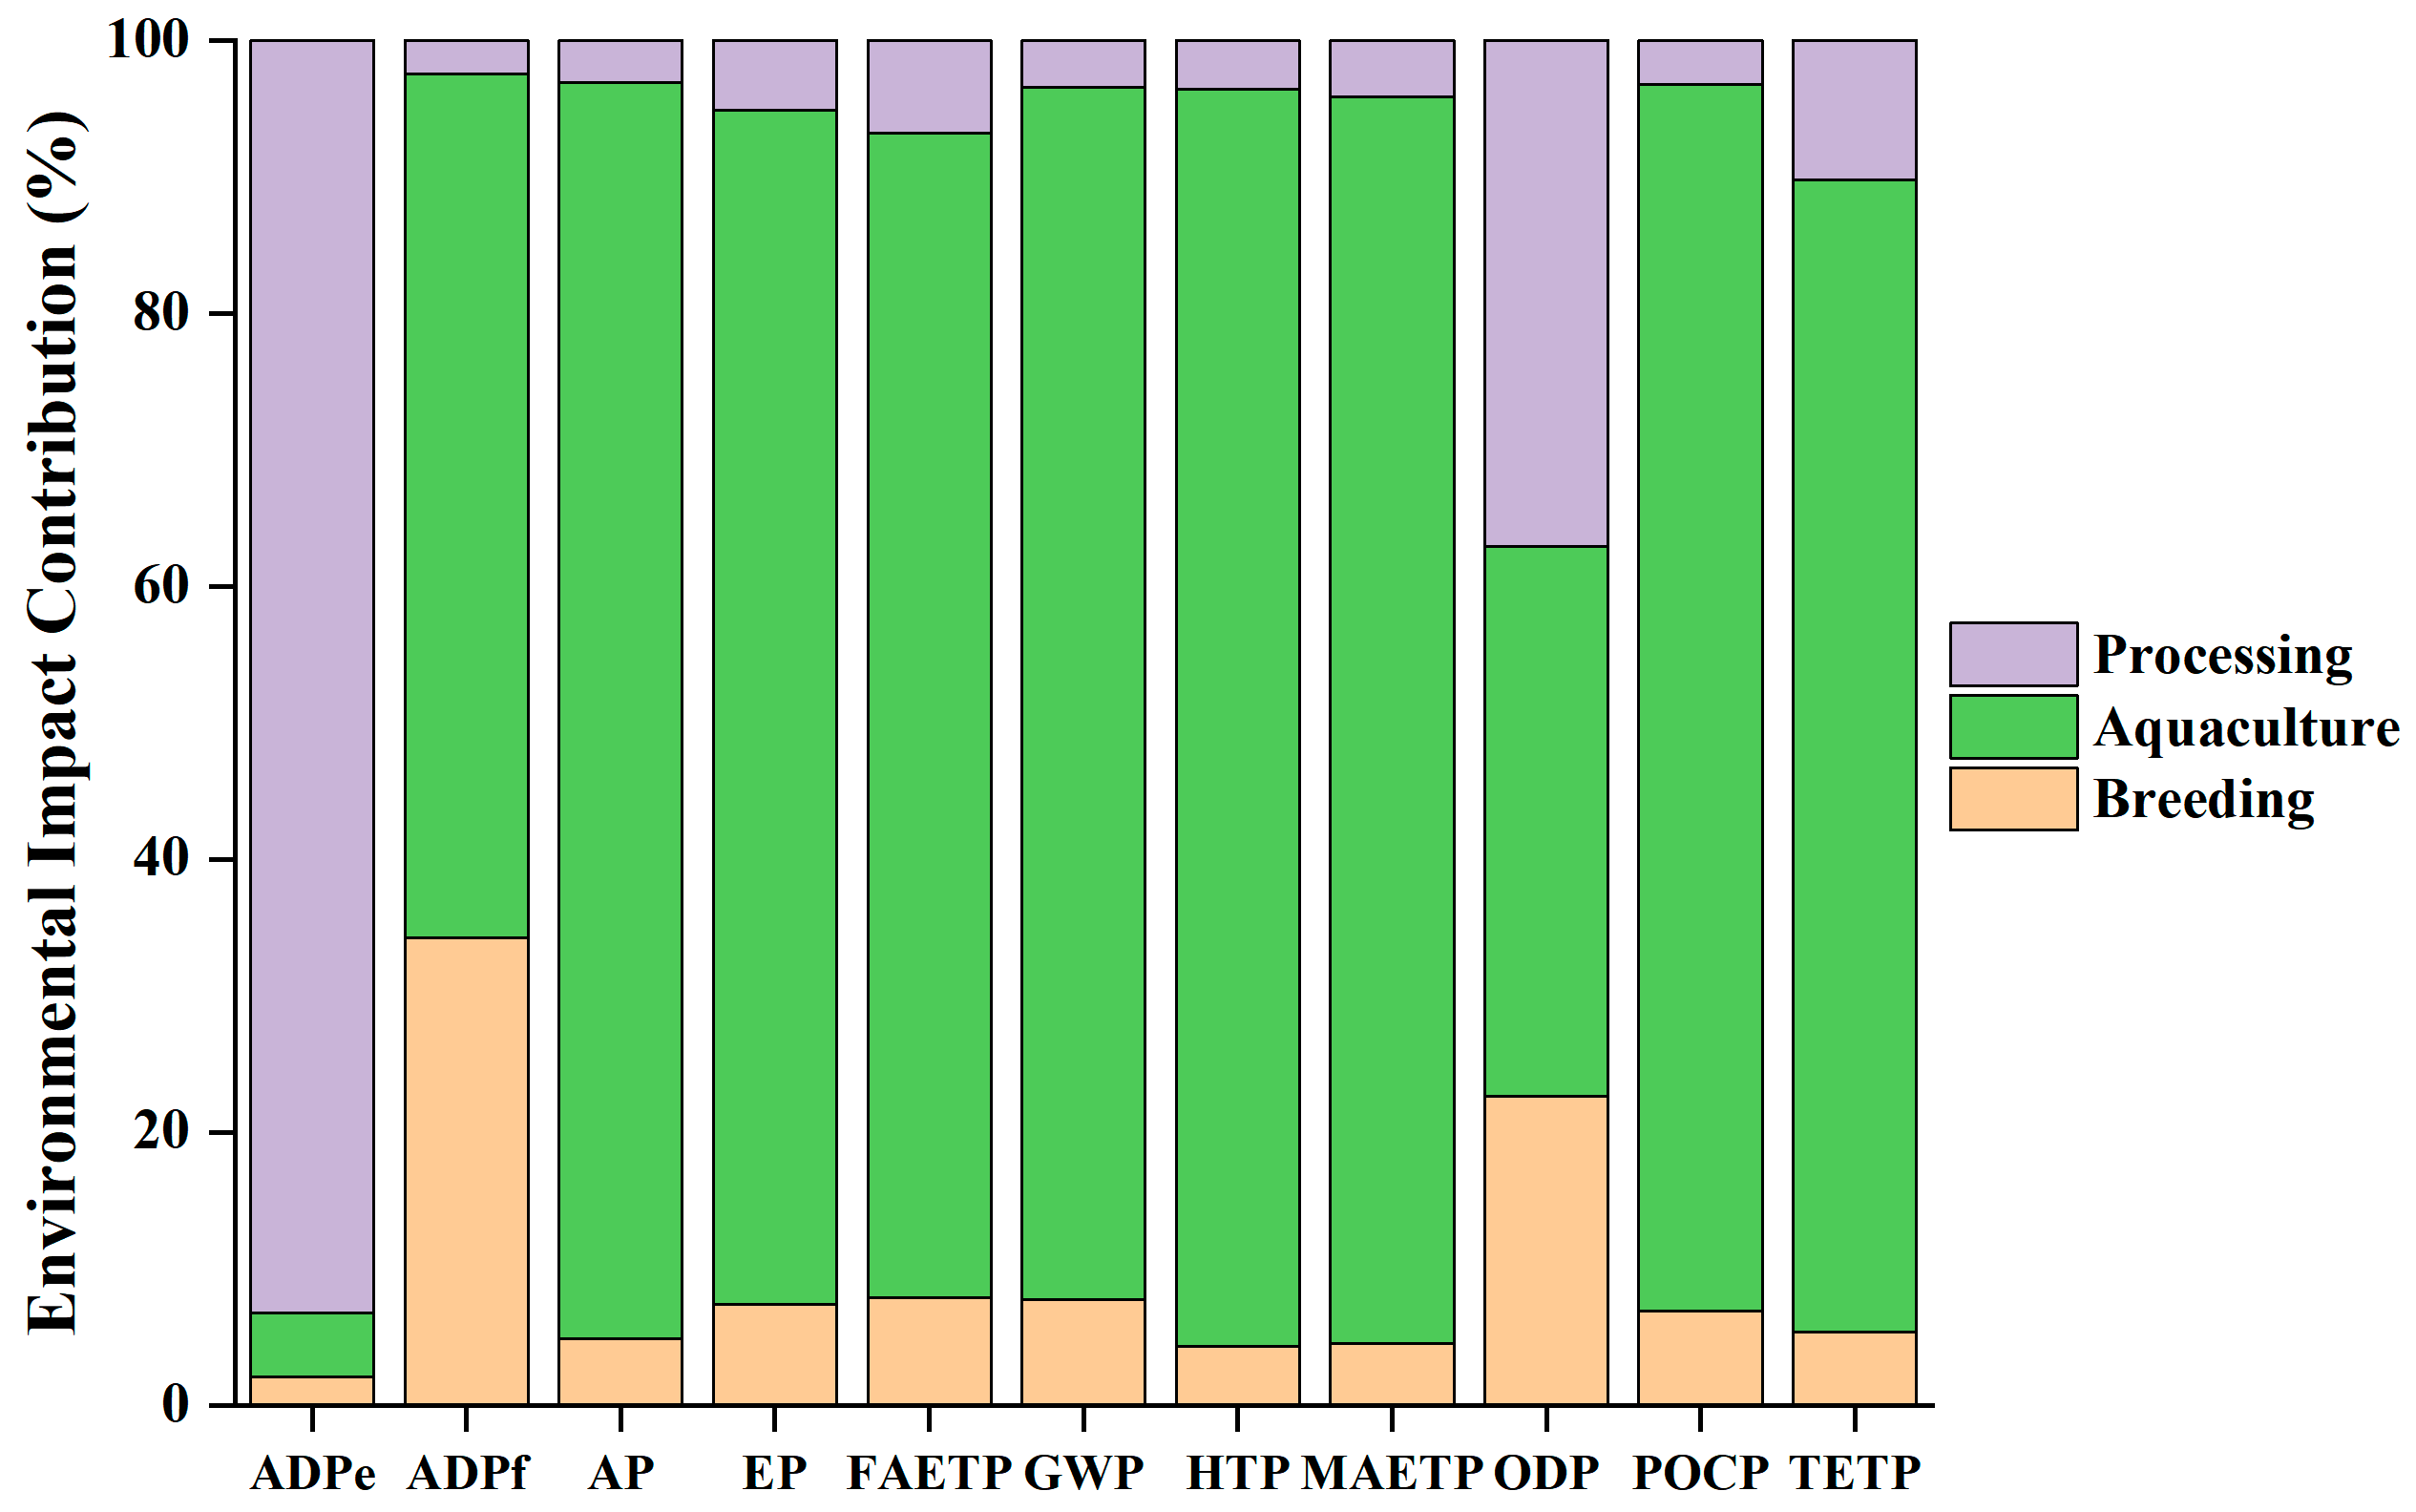
In this study, the LCA characterization results of the oyster farming process are provided in Table 3, and the contributions in each category in the three stages are shown in Figure 3.
The life cycle characterization results of the oyster supply chain (Figure 3) indicate that the aquaculture phase contributes most substantially to all ten environmental impact categories analyzed (ADPf 63%, AP 92%, EP 87%, FAETP 85%, GWP 89%, HTP 92%, MAETP 91%, ODP 37%, POCP 90%, and TETP 84%). The processing stage demonstrates significant environmental impact in one key indicator (ADPe 93%). The characterization results conclusively identify the oyster aquaculture phase as the primary environmental hotspot within the entire supply chain. To systematically evaluate the key drivers of environmental impacts across production stages, this study conducts a comprehensive life cycle normalization assessment of the oyster supply chain.

3.2. Normalization Results

In order to conduct a more comprehensive comparative analysis of the environmental impacts associated with various categories in oyster farming, it is essential to identify the key influencing factors and opportunities for pollution prevention. Accordingly, the normalized results were calculated and are presented in Table 4.
To further analyze the influencing categories, the ADPf, GWP, MAETP, HTP, EP, and AP impact categories were selected, and they were closely related to energy use, carbon emissions, wastewater discharge, and eutrophication; the other five environmental categories were integrated as “other categories”.
It can be observed from Figure 4 that the contributions of the breeding stage to each type of environmental impact exhibit significant differentiation characteristics, with particular prominence in the ODP and ADPf indicators. From the perspective of resource consumption, the ODP primarily correlates with specific production activities and resource inputs at this stage, particularly involving chemical agents used for water disinfection and equipment sterilization. In terms of the ADPf index, its outstanding performance in the breeding stage mainly stems from the extensive application of renewable energy in the breeding process. For instance, in some modern breeding facilities, solar photovoltaic equipment is used to power some of the facilities, or biomass energy is utilized to heat water bodies, etc. [31]. Now, the use of these renewable energy sources has to some extent reduced the reliance on traditional fossil energy. However, due to the need for further improvement in energy conversion efficiency of relevant technologies, coupled with the high costs associated with equipment construction and maintenance, the breeding stage exhibits substantial demand for renewable primary energy sources. Consequently, this leads to significant environmental impacts as reflected in the ADPf indicator. During the life cycle of oyster farming, the aquaculture stage serves as a critical contributor to environmental impacts. This stage demonstrates the most substantial MAETP contribution among all impact categories, with a dominant 92% (3.70 × 10⁻¹⁰ kg DCB-eq) that far surpasses all other environmental effects and represents the foremost ecological risk factor. This dominance can largely be attributed to various processes involved in aquaculture: the production, transportation, feeding of feed, and the manufacturing and replacement of facilities such as rafts and nets, all of which result in substantial resource input and consumption. Furthermore, the equipment used for oxygenation consumes a considerable amount of energy during operation, generating various pollutants. Additionally, pharmaceuticals employed for disease prevention pose potential risks to aquatic ecosystems and organisms. The cumulative effects of these factors make the aquaculture phase significantly more impactful than other stages in terms of environmental impact sources.
The processing phase in the oyster production process exhibits significant differences in its contributions to various types of environmental impacts. Specifically, the contributions of ODP (37%, 4.30 × 10⁻¹⁹) and ADPfe (93%, 3.82 × 10⁻¹³) are particularly prominent during the processing phase. This phase emerges as a major category contributing to environmental impact. Specifically, the notable contributions of ODP and ADPe stem from the use of ozone depleting substances in cleaning agents and disinfectants during the processing stage. Compared to other phases, the application of chemical agents is more concentrated in this processing segment, which makes ODP and ADPe the primary categories contributing to environmental impact.
A systematic quantitative analysis of the life cycle impacts of oyster breeding, aquaculture, and processing revealed that among the 11 impact categories assessed, the MAETP represents the most significant environmental impact type. Notably, within all production stages, the contribution of environmental impacts from the aquaculture phase is remarkably high at 88.9%. This aspect has become the central source of environmental burden throughout the entire production process.
Further focusing on the characteristics of energy input, it is found that electricity and fossil fuels constitute the primary types of energy consumption in the oyster farming process. Both are not only the driving forces behind production activities but also key factors that trigger various environmental impacts (Table 1).
E n v i r o n m e n t a l   I m p a c t   c o n t r i b u t i o n   r a t e = i I t 100 %
The variable i represents the ith category of energy (such as electricity, diesel, and coal), while I t denotes all categories of input energy.
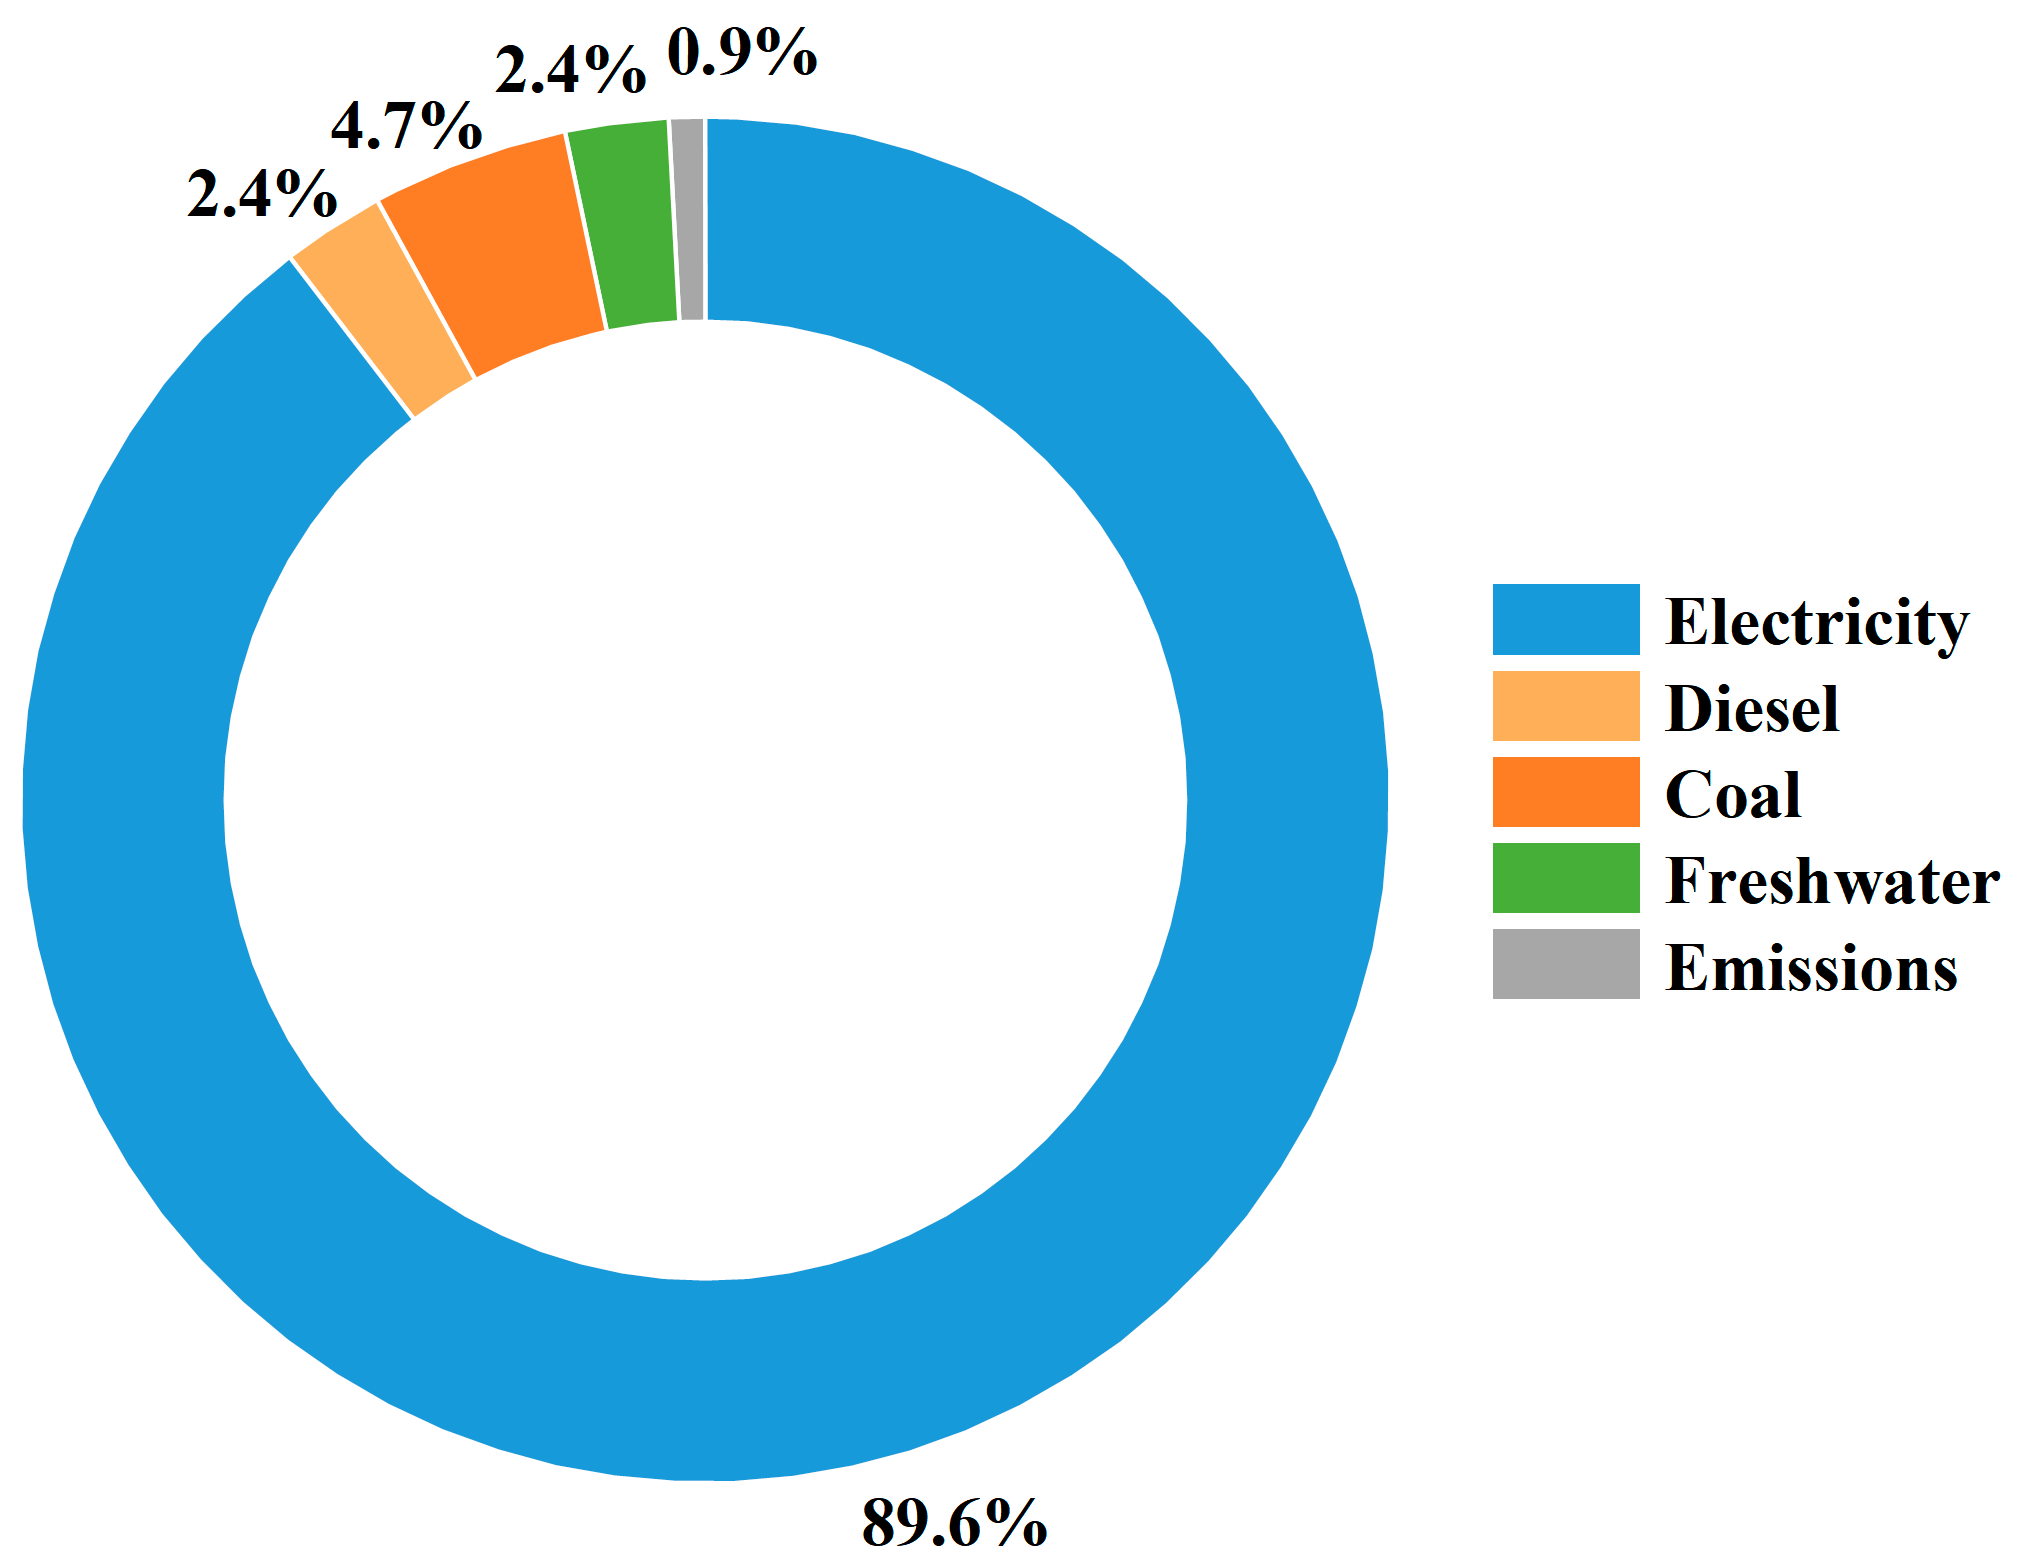
The calculation is obtained through Equation (3), and electricity accounts for an impressive 89.6%, making it the most significant influencing factor and holding a dominant position in the oyster farming supply chain (Figure 5). The high environmental impact primarily stems from the constant energy consumption of aquaculture equipment and the sector’s heavy reliance on electrical power. Although fossil fuels such as diesel and coal hold lower proportions compared to electricity (with diesel accounting for 2.4% and coal for 4.7%), their actual consumption during production processes can be substantial (Figure 5). This is particularly evident in real-time monitoring of oyster growth conditions, which necessitates frequent trips of power fishing boats to offshore farming areas, significantly increasing diesel consumption in this process. The combustion of diesel releases pollutants such as nitrogen oxides and particulate matter, which can enter marine ecosystems through atmospheric deposition and other pathways. This has a critical role in categories related to greenhouse gas emissions and air pollution, thereby contributing significantly to the environmental burden posed by oyster farming activities.

3.3. Uncertainty Analysis

In LCA studies, the analysis of data quality uncertainty is a critical aspect that enables decision-makers to evaluate the significance of differences between various product or process options [32]. It is strongly recommended that statistical methods be employed to assess these uncertainties within LCA research. According to relevant research [33], Monte Carlo methods can be used to quantify variability and uncertainty through probability distributions, thereby clarifying the impacts associated with these uncertainties. Consequently, this study conducted a Monte Carlo simulation to assess the effects of uncertainty, a total of 1000 rankings were generated, and a 95% confidence interval was calculated. Based on the simulation results observed, the trends across different ranges of uncertainty are remarkably similar, and there is no significant change in the overall rankings at each stage (Table 5).

4. Discussion

Oyster farming is a significant component of aquaculture. It not only enhances water quality, maintains ecological balance, and provides high-quality protein to ensure food security but also stimulates the development of associated industrial sectors such as breeding, processing, and sales. This industry plays a crucial role across multiple fields of aquaculture, including ecology, economy, and society. Currently, numerous studies employing LCA methodologies have highlighted that energy consumption constitutes the most critical environmental impact factor [34,35], which is consistent with the trend of the research results of this study. However, most studies mainly focus on comparative analyses of the environmental impacts produced by farmed species in different regions while lacking comprehensive examinations of specific farming processes. Liu et al. [36] studied the traditional plate cage (TPC) and deep-water wind and wave resistance (DWWWWRC) in relation to Chinese large yellow croaker aquaculture. They assessed the carbon footprint of Zhoushan aquaculture throughout its life cycle, analyzed and compared both methods from an emissions perspective. Their findings indicate that DWWWWRC has a smaller carbon footprint than TPC and is more suitable for marine aquaculture in China. Huysveld et al. [37] conducted an LCA of catfish food, a top Vietnamese exporter in the vertical integration of the Mekong Delta. This study discussed both the advantages and disadvantages of closed-loop water-saving systems and identified that the supply chain plays a crucial role in enhancing utilization efficiency. Ghamkhar et al. [38] conducted an LCA and economic analysis of aquaponics systems in the Midwestern United States based on annual operational data from three fish species: tilapia, traditional white-eyed fish, and hybrid white-eyed fish. The study concluded that the primary contributors to costs are infrastructure, labor, and heating, which collectively account for over 89% of the total cost cycle. Song et al. [39] conducted LCA on Atlantic salmon harvested from farms in northern China. The results show that the production of one ton of live weight requires 7509 kilowatt-hours of farm-level electricity and generates 1.7 tons of carbon dioxide equivalent. Additionally, the use of feed products was identified as a major contributor among the 89 impact categories evaluated (54–95% of the total). In terms of the oyster farming supply chain, Love et al. [40] focused on the oyster farming supply chain in the United States. Through a hybrid approach study of 143 related enterprises in the Chesapeake Bay and Washington State (interviewing 56), and tracking 125 oyster shipments, they discovered that the direct supply chain performed better in terms of time to market and temperature compliance. There was abuse of time and temperature in the intermediate supply chain, but it did not correlate with an increased risk of Vibrio parahaemolyticus contamination. This study focuses on various operational aspects of the oyster supply chain, specifically exploring the impact of supply chain configuration on product quality and safety, inter-enterprise relationships, product traceability, and regulatory compliance. It examines enterprise behaviors within the oyster supply chain as well as the effects of different configurations on overall performance. However, this study employs the LCA method, comprehensively addressing the entire oyster farming chain from breeding to processing. In contrast to single-stage research, this approach allows for a more thorough and precise identification of key environmental impact links and predominant contribution types. Meanwhile, combined with the actual aquaculture operation process, an in-depth analysis of the correlation mechanism between energy consumption and environmental impact was conducted to make the research conclusion more practically instructive and provide a new perspective for the study of environmental issues in oyster farming. However, in terms of research depth, compared with some refined studies targeting specific regions or aquaculture models, this study lacks a comparative analysis of the differences in environmental impacts among different aquaculture models. Additionally, there are certain limitations in data collection within this research. Some parameters are derived from general databases that may not accurately reflect local conditions. Moreover, the potential dynamic effects of external factors such as climate change and extreme weather on the oyster farming environment have not been fully addressed in this study.
The oyster farming industry serves as a crucial pillar of the blue food system. Its transition towards low-carbon, intelligent, and precise development models is of significant importance for ensuring the stability of global marine ecosystems, achieving sustainable food supply and promoting coordinated economic and environmental growth [41]. Based on the findings of this study, it is essential to establish a comprehensive research framework that integrates long-term field monitoring data with multi-scale model simulations in quantifying the impact-driven mechanisms of oyster farming environments [42,43]. Extensive and representative site distribution was carried out in different oyster farming areas, combined with multi-scale model simulation techniques to systematically and comprehensively analyze the spatiotemporal heterogeneity characteristics of the impact of different farming areas and farming models on the water environment [44,45,46,47]. The results further reveal the degree of environmental impact of key indicators such as MAETP under different environmental conditions. In addition, the technical adaptability and economic feasibility of renewable energy sources such as solar energy and tidal energy [48,49] in oyster farming facilities [50,51] can also be evaluated, and an intelligent farming management system can be developed to reduce the energy dependence and labor management costs of traditional farming. Dynamic factors such as climate change scenarios and policy regulation can also be integrated [52,53] to establish a comprehensive assessment model for the environmental impact of oyster farming. By setting different climate change scenarios and policy regulation plans, and using methods such as Monte Carlo simulation and scenario analysis, we conducted multi-scenario and multi-dimensional simulation and prediction of the environmental impact of oyster farming. We provided scientific support for regional differentiated control policies and sustainable industrial development plans and promoted the coordinated optimization of ecological benefits and economic benefits.
Although this study covers the entire life cycle of oyster farming and can comprehensively and accurately identify the key environmental impact factors and main impact types, this study also has certain limitations. To promote the transformation of the oyster farming industry towards low-carbon, intelligent, and precise management, and to provide theoretical and technical support for the sustainable development of the global blue food system, it is essential for further research on intelligent equipment in the oyster supply chain, including the development of facilities for seed rearing (automatic breeding workshop), feed distribution (automatic feeding machine), and sea area management (automatic sea water quality monitoring), to be conducted. Moreover, a comprehensive assessment model, such as the LCA, and system dynamics (SD) and the water–energy–food nexus (WEFN) can be used to identify the carbon footprint forecast and sustainable pathway. Based on the mainly focus and data accessibility, the life cycle cost (LCC) analysis in this study was not performed; in further research, the LCC study needs to be carried out to promote environmental and economic sustainability of the oyster supply chain [54].

5. Conclusions

In this study, the LCA method was utilized, and a comprehensive quantitative assessment of 11 environmental impact categories during the oyster supply chain was conducted. The research results show that the aquaculture stage is the core contributing factor to the environmental impact throughout the entire oyster farming life cycle, with a contribution rate as high as 88.9% to the environmental impact, which is significantly higher than that of the breeding stage (7.1%) and the processing stage (4%). Moreover, MAETP was the highest environmental impact contributor with the value of 3.70 × 10⁻¹⁰ kg DCB-eq, which constitutes 92% of the total environmental impact. Electricity and fossil energy constitute the main types of energy consumption in the oyster supply chain, electricity accounts for as high as 89.6% and is the most significant influencing factor, and it occupies a dominant position in the oyster farming supply chain.
To advance sustainable development, the feasibility of renewable energy adoption must be assessed, and intelligent aquaculture management systems have to be established. This study provides a useful reference for LCA methodology advancement in China’s aquaculture sector while contributing to global aquatic Life Cycle Inventory databases.
The limitations and further research mainly focus on intelligent equipment development such as automatic breeding workshop, feeding machines, and sea water quality monitoring to promote the intelligent level of the oyster supply chain. Moreover, comprehensive assessment models (LCA+SD, WEFN, and LCA+LCC) should be employed to identify the key factors of environmental and economic sustainability of the oyster supply chain.

Author Contributions

H.H.: Conceptualization, Writing—Original Draft, and Funding Acquisition. F.H.: Methodology, Writing—Review and Editing, and Formal Analysis. J.S.: Investigation. F.J.: Investigation. Y.B.: Review and Editing. Z.M.: Review and Editing. Z.H.: Conceptualization, Writing—Review and Editing, and Funding Acquisition. Y.L.: Supervision. All authors have read and agreed to the published version of the manuscript.

Funding

This study was supported by National Natural Science Foundation of China (32473129); the Central Government Subsidy Project for Liaoning Fisheries (2024); the Science and Technology Joint Program (Doctoral Initiation Project) of Liaoning Province (2023-BSBA-010); funds earmarked for Modern Agroindustry Technology Research System (CARS-49); Liaoning Provincial Major Science and Technology Special Project (Germplasm Innovation Program) (2024JH1/11700010).

Data Availability Statement

The original contributions presented in this study are included in the article. Further inquiries can be directed to the corresponding author.

Acknowledgments

We sincerely thank the managers of the oyster production enterprises in Dalian City, China, for their data support in this paper.

Conflicts of Interest

The authors declare no conflict of interest.

References

  1. FAO. The State of World Fisheries and Aquaculture 2024-Blue Transformation in Action; Food and Agriculture Organization of the United Nations: Rome, Italy, 2024; pp. 1, 41. Available online: https://openknowledge.fao.org/items/06690fd0-d133-424c-9673-1849e414543d (accessed on 20 June 2025).
  2. Norman, R.; Crumlish, M.; Stetkiewicz, S. The importance of fisheries and aquaculture production for nutrition and food security. Rev. Sci. Tech. Off. Int. Epizoot. 2019, 38, 395–407. [Google Scholar] [CrossRef]
  3. Lin, C.Y.; Dai, G.L.; Liu, Y.; Zhang, M.Q.; Liu, Y.; Jiang, W.; Fu, X.M.; Chen, H.X. Ecological value of mariculture shellfish resources in China: Assessment and management. Mar. Policy 2023, 148, 105406. [Google Scholar] [CrossRef]
  4. Zhang, Z.; Lin, Y.X.; Chen, H.B.; Li, R.M.; Huang, C.X.; Lin, H.; Mu, J.L. Comparative Analysis of Carbon Footprint between Diploid and Triploid Oyster Products Based on Life Cycle Assessment. Fish. Res. 2025, 47, 270–279. [Google Scholar]
  5. Yin, P.; Xie, S.W.; Zhuang, Z.X.; He, X.S.; Tang, X.P.; Tian, L.X.; Liu, Y.J.; Niu, J. Dietary supplementation of bile acid attenuate adverse effects of high-fat diet on growth performance, antioxidant ability, lipid accumulation and intestinal health in juvenile largemouth bass (Micropterus salmoides). Aquaculture 2021, 531, 735864. [Google Scholar] [CrossRef]
  6. Yuan, Y.H.; Jiang, X.L.; Wang, X.Y.; Chen, N.S.; Li, S.L. Toxicological impacts of excessive lithium on largemouth bass (Micropterus salmoides): Body weight, hepatic lipid accumulation, antioxidant defense and inflammation response. Sci. Total Environ. 2022, 841, 156784. [Google Scholar] [CrossRef] [PubMed]
  7. Bergman, K.; Henriksson, P.; Hornborg, S.; Troell, M.; Borthwick, L.; Jonell, M.; Philis, G.; Ziegler, F. Recirculating Aquaculture Is Possible without Major Energy Tradeoff: Life Cycle Assessment of Warmwater Fish Farming in Sweden. Environ. Sci. Technol. 2020, 54, 16062–16070. [Google Scholar] [CrossRef]
  8. Hu, N.J.; Liu, C.H.; Chen, Q.; Zhu, L.Q. Life cycle environmental impact assessment of rice-crayfish integrated system: A case study. J. Clean. Prod. 2021, 280, 124440. [Google Scholar] [CrossRef]
  9. Hou, H.C.; Ren, A.Q.; Yu, L.X.B.; Ma, Z.; Zhang, Y.; Liu, Y. An Environmental Impact Assessment of Largemouth Bass (Micropterus salmoides) Aquaculture in Hangzhou, China. Sustainability 2023, 15, 12368. [Google Scholar] [CrossRef]
  10. Mcgrath, K.P.; Pelletier, N.L.; Tyedmers, P.H. Life Cycle Assessment of a Novel Closed-Containment Salmon Aquaculture Technology. Environ. Sci. Technol. 2015, 49, 5628–5636. [Google Scholar] [CrossRef]
  11. Cooney, R.; Tahar, A.; Kennedy, A.; Clifford, E. The dilemma of opportunity in developing a life cycle assessment of emerging aquaculture systems—A case study of a Eurasian perch (Perca fluviatilis) hatchery recirculating aquaculture system. Aquaculture 2021, 536, 736403. [Google Scholar] [CrossRef]
  12. Mungkung, R.; Aubin, J.; Prihadi, H.T.; Slembrouck, J.; Werf, D.V.G.M.H.; Legendre, M. Life Cycle Assessment for environmentally sustainable aquaculture management: A case study of combined aquaculture systems for carp and tilapia. J. Clean. Prod. 2013, 57, 249–256. [Google Scholar] [CrossRef]
  13. Tamburini, E.; Turolla, E.; Fano, A.E.; Castaldelli, G. Sustainability of Mussel (Mytilus galloprovincialis) Farming in the Po River Delta, Northern Italy, Based on a Life Cycle Assessment Approach. Sustainability 2020, 12, 3814. [Google Scholar] [CrossRef]
  14. Chary, K.; Aubin, J.; Sadoul, B.; Fiandrino, A.; Covès, D.; Callieret, D.M. Integrated multi-trophic aquaculture of red drum (Sciaenops ocellatus) and sea cucumber (Holothuria scabra): Assessing bioremediation and life-cycle impacts. Aquaculture 2020, 516, 734621. [Google Scholar] [CrossRef]
  15. Yu, S.; Mu, Y.T. Evaluation of green development in mariculture: The case of Chinese oyster aquaculture. Aquaculture 2023, 576, 739838. [Google Scholar] [CrossRef]
  16. Tamburini, E.; Fano, E.A.; Castaldelli, G.; Turolla, E. Life Cycle Assessment of Oyster Farming in the Po Delta, Northern Italy. Resources 2019, 8, 170. [Google Scholar] [CrossRef]
  17. Summa, D.; Turolla, E.; Lanzoni, M.; Tamisari, E.; Castaldelli, G.; Tamburini, E. Life Cycle Assessment (LCA) of Two Different Oyster (Crassostrea gigas) Farming Strategies in the Sacca di Goro, Northern Adriatic Sea, Italy. Resources 2023, 12, 62. [Google Scholar] [CrossRef]
  18. Dias, A.C.; Almeida, C.; Pacheco da Costa, T.; Nunes, M.L.; Marques, A.; Quinteiro, P. Environmental assessment of oyster farming from a life cycle perspective. Sustain. Prod. Consum. 2025, 54, 102–114. [Google Scholar] [CrossRef]
  19. Ren, A.Q.; Yu, L.X.B.; Zhao, X.T.; Jia, F.; Han, F.F.; Hou, H.C.; Liu, Y. A multi-objective optimization approach for green supply chain network design for the sea cucumber (Apostichopus japonicus) industry. Sci. Total Environ. 2024, 927, 172050. [Google Scholar] [CrossRef] [PubMed]
  20. Ayer, N.; Martin, S.; Dwyer, L.R.; Gace, L.; Laurin, L. Environmental performance of copper-alloy Net-pens: Life cycle assessment of Atlantic salmon grow-out in copper-alloy and nylon net-pens. Aquaculture 2016, 453, 93–103. [Google Scholar] [CrossRef]
  21. Maiolo, S.; Forchino, A.A.; Faccenda, F.; Pastres, R. From feed to fork–Life Cycle Assessment on an Italian rainbow trout (Oncorhynchus mykiss) supply chain. J. Clean. Prod. 2021, 289, 125155. [Google Scholar] [CrossRef]
  22. Denham, C.F.; Howieson, R.J.; Solah, A.V.; Biswas, K.W. Environmental supply chain management in the seafood industry: Past, present and future approaches. J. Clean. Prod. 2015, 90, 82–90. [Google Scholar] [CrossRef]
  23. Martini, A.; Aguiari, L.; Capoccioni, F.; Martinoli, M.; Napolitano, R.; Pirlo, G.; Tonachella, N.; Pulcini, D. Is Manila Clam Farming Environmentally Sustainable? A Life Cycle Assessment (LCA) Approach Applied to an Italian Ruditapes philippinarum Hatchery. Sustainability 2023, 15, 3237. [Google Scholar] [CrossRef]
  24. Laso, J.; Margallo, M.; Serrano, M.; Vázquez-Rowe, I.; Avadí, A.; Fullana, P.; Bala, A.; Gazulla, C.; Irabien, Á.; Aldaco, R. Introducing the Green Protein Footprint method as an understandable measure of the environmental cost of anchovy consumption. Sci. Total Environ. 2018, 621, 40–53. [Google Scholar] [CrossRef] [PubMed]
  25. Sultan, A.F.; Routroy, S.; Thakur, M. Evaluating sustainability of the surimi supply chain in India: A life cycle assessment approach. Int. J. Life Cycle Assess 2021, 26, 1319–1337. [Google Scholar] [CrossRef]
  26. ISO 14040:2006; Environmental Management-Life Cycle Assessment-Principles and Framework. International Organization for Standardization (ISO): Geneva, Switzerland, 2006.
  27. ISO 14044:2006; Environmental Management–Life Cycle Assessment–Requirements and Guide-Lines. International Organization for Standardization (ISO): Geneva, Switzerland, 2006.
  28. Hou, H.C.; Shao, S.; Zhang, Y.; Kang, H.; Qin, C.L.; Sun, X.Y.; Zhang, S.S. Life cycle assessment of sea cucumber production: A case study, China. J. Clean. Prod. 2019, 213, 158–164. [Google Scholar] [CrossRef]
  29. Hou, H.C.; Zhang, Y.; Ma, Z.; Wang, X.L.; Su, P.; Wang, H.H.; Liu, Y. Life cycle assessment of tiger puffer (Takifugu rubripes) farming: A case study in Dalian, China. Sci. Total Environ. 2022, 823, 153522. [Google Scholar] [CrossRef]
  30. Maurice, B.; Frischknecht, R.; Coelho-Schwirtz, V.; Hungerbuhler, K. Uncertainty analysis in life cycle inventory. Application to the production of electricity with French coal power plants. J. Clean. Prod. 2000, 8, 95–108. [Google Scholar] [CrossRef]
  31. Yu, M.M.; Liang, J.; Han, J.M.; Wang, L.; Wei, H.Y. Application of Solar Collector and Air-Source Heat Pump System in Aquaculture Seedling Cultivation. J. Aquac. 2022, 43, 66–68. [Google Scholar]
  32. Salemdeeb, R.; Saint, R.; Clark, W.; Lenaghan, M.; Pratt, K. A pragmatic and industry-oriented framework for data quality assessment of environmental footprint tools. Resour. Environ. Sustain. 2021, 3, 100019. [Google Scholar] [CrossRef]
  33. Hung, M.L.; Ma, H.W. Quantifying system uncertainty of life cycle assessment based on Monte Carlo simulation. Int. J. Life Cycle Assess 2009, 14, 19–27. [Google Scholar] [CrossRef]
  34. Jerbi, M.A.; Aubin, J.; Garnaoui, K.; Achour, L.; Kacem, A. Life cycle assessment (LCA) of two rearing techniques of sea bass (Dicentrarchus labrax). Aquacult. Eng. 2012, 46, 1–9. [Google Scholar] [CrossRef]
  35. Gaeta, H.F.; Parolini, M.; Bacenetti, J. Quantification of the environmental impact of lumpfish farming through a life cycle assessment. Aquaculture 2022, 549, 737781. [Google Scholar] [CrossRef]
  36. Liu, J.Y.; Gui, F.; Zhou, Q.; Cai, H.W.; Xu, K.D.; Zhao, S. Carbon Footprint of a Large Yellow Croaker Mariculture Models Based on Life-Cycle Assessment. Sustainability 2023, 15, 6658. [Google Scholar] [CrossRef]
  37. Huysveld, S.; Schaubroeck, T.; Meester, D.S.; Sorgeloos, P.; Langenhove, V.H.; Van linden, V.; Dewulf, J. Resource use analysis of Pangasius aquaculture in the Mekong Delta in Vietnam using Exergetic Life Cycle Assessment. J. Clean. Prod. 2013, 51, 225–233. [Google Scholar] [CrossRef]
  38. Ghamkhar, R.; Hartleb, C.; Rabas, Z.; Hickset, A. Evaluation of environmental and economic implications of a cold-weather aquaponic food production system using life cycle assessment and economic analysis. J. Ind. Ecol. 2022, 26, 862–874. [Google Scholar] [CrossRef]
  39. Song, X.Q.; Liu, Y.; Pettersen, B.J.; Brandão, M.; Ma, X.N.; Røberg, S.; Frostellet, B. Life cycle assessment of recirculating aquaculture systems: A case of Atlantic salmon farming in China. J. Ind. Ecol. 2019, 23, 1077–1086. [Google Scholar] [CrossRef]
  40. Love, C.D.; Lane, M.R.; Kuehl, M.L.; Hudson, B.; Harding, J.; Clancy, K.; Fry, P.J. Performance and conduct of supply chains for United States farmed oysters. Aquaculture 2020, 515, 734569. [Google Scholar] [CrossRef]
  41. Chellapandi, P. Development of top-dressing automation technology for sustainable shrimp aquaculture in India. Discov. Sustain. 2021, 2, 26. [Google Scholar] [CrossRef]
  42. Liu, M.H.; Yan, Z.N.; Huang, C.W.; Lin, Z.H.; Peng, Z.L.; Zhao, C.X.; Zheng, X.F. Temporal dynamics of protist communities and environmental factors in the horizontal flow-polyculture pond aquaculture model of Sinonovacula constricta. Aquacult. Eng. 2024, 107, 102477. [Google Scholar] [CrossRef]
  43. Abualtaher, M.; Bar, S.E. Review of applying material flow analysis-based studies for a sustainable Norwegian Salmon aquaculture industry. J. Appl. Aquac. 2019, 32, 1–15. [Google Scholar] [CrossRef]
  44. Lu, X.N.; Cui, Y.L.; Chen, Y.T.; Xiao, Y.P.; Song, X.J.; Gao, F.Z.; Xiang, Y.; Hou, C.C.; Wang, J.; Gan, Q.H.; et al. Sustainable development of microalgal biotechnology in coastal zone for aquaculture and food. Sci. Total Environ. 2021, 780, 146369. [Google Scholar] [CrossRef]
  45. Shi, L.P.; Song, F.B.; Xing, S.Y.; Zhang, W.W.; Liang, Y.S.; Zhang, K.X.; Sun, J.L.; Luo, J. The muscle nutritional components analysis of golden pompano (Trachinotus blochii) in different mariculture area, growth stages, and genders. Front. Nutr. 2023, 10, 1148687. [Google Scholar] [CrossRef]
  46. Neofitou, N.; Syvri, R.; Tziantziou, L.; Mente, E.; Vafidis, D. The benthic environmental footprint of aquaculture in the Eastern Mediterranean: Organic vs conventional fish farming. Aquac. Res. 2020, 51, 2698–2710. [Google Scholar] [CrossRef]
  47. Lal, M.M.; Brown, T.K.; Chand, P.; Pickering, D.T. An assessment of the aquaculture potential of indigenous freshwater food fish of Fiji, Papua New Guinea, Vanuatu, Solomon Islands, Samoa and Tonga as alternatives to farming of tilapia. Rev. Aquac. 2022, 15, 625–644. [Google Scholar] [CrossRef]
  48. Vo, E.T.T.; Ko, H.; Huh, J.; Park, N. Overview of Solar Energy for Aquaculture: The Potential and Future Trends. Energies 2021, 14, 6923. [Google Scholar] [CrossRef]
  49. Azam, A.; Ahmed, A.; Li, H.; Tairab, M.A.; Jia, C.Y.; Li, N.; Zhang, Z.T. Design and analysis of the optimal spinning top-shaped buoy for wave energy harvesting in low energy density seas for sustainable marine aquaculture. Ocean Eng. 2022, 255, 111434. [Google Scholar] [CrossRef]
  50. Son, S.; Jeong, Y. An Automated Fish-Feeding System Based on CNN and GRU Neural Networks. Sustainability 2024, 16, 3675. [Google Scholar] [CrossRef]
  51. Medina, D.J.; Valencia-Arías, A.; Triana, M.J.; Giraldo, F.L.; Segura-Quijano, F.; Gonzalez-Mancera, A.; Zambrano, F.A.; Quimbayo, J.; Castilloet, E. Open-source low-cost design of a buoy for remote water quality monitoring in fish farming. PLoS ONE 2022, 17, e0270202. [Google Scholar] [CrossRef] [PubMed]
  52. Zhao, Q.S.; Huang, H.M.; Costello, J.M.; Chu, J.S. Climate change projections show shrinking deep-water ecosystems with implications for biodiversity and aquaculture in the Northwest Pacific. Sci. Total Environ. 2023, 861, 160505. [Google Scholar] [CrossRef] [PubMed]
  53. Anderson, L.J.; Asche, F.; Garlock, T. Economics of Aquaculture Policy and Regulation. Annu. Rev. Resour. Econ. 2019, 11, 101–123. [Google Scholar] [CrossRef]
  54. Chen, Y.H.; Han, M.Q.; Liu, X.H.; Cui, J.C.; Habuer; Gao, X.F. Assessing the environmental and economic impacts of the oyster life cycle under renewable energy expansion. J. Environ. Manag. 2025, 389, 126220. [Google Scholar] [CrossRef]
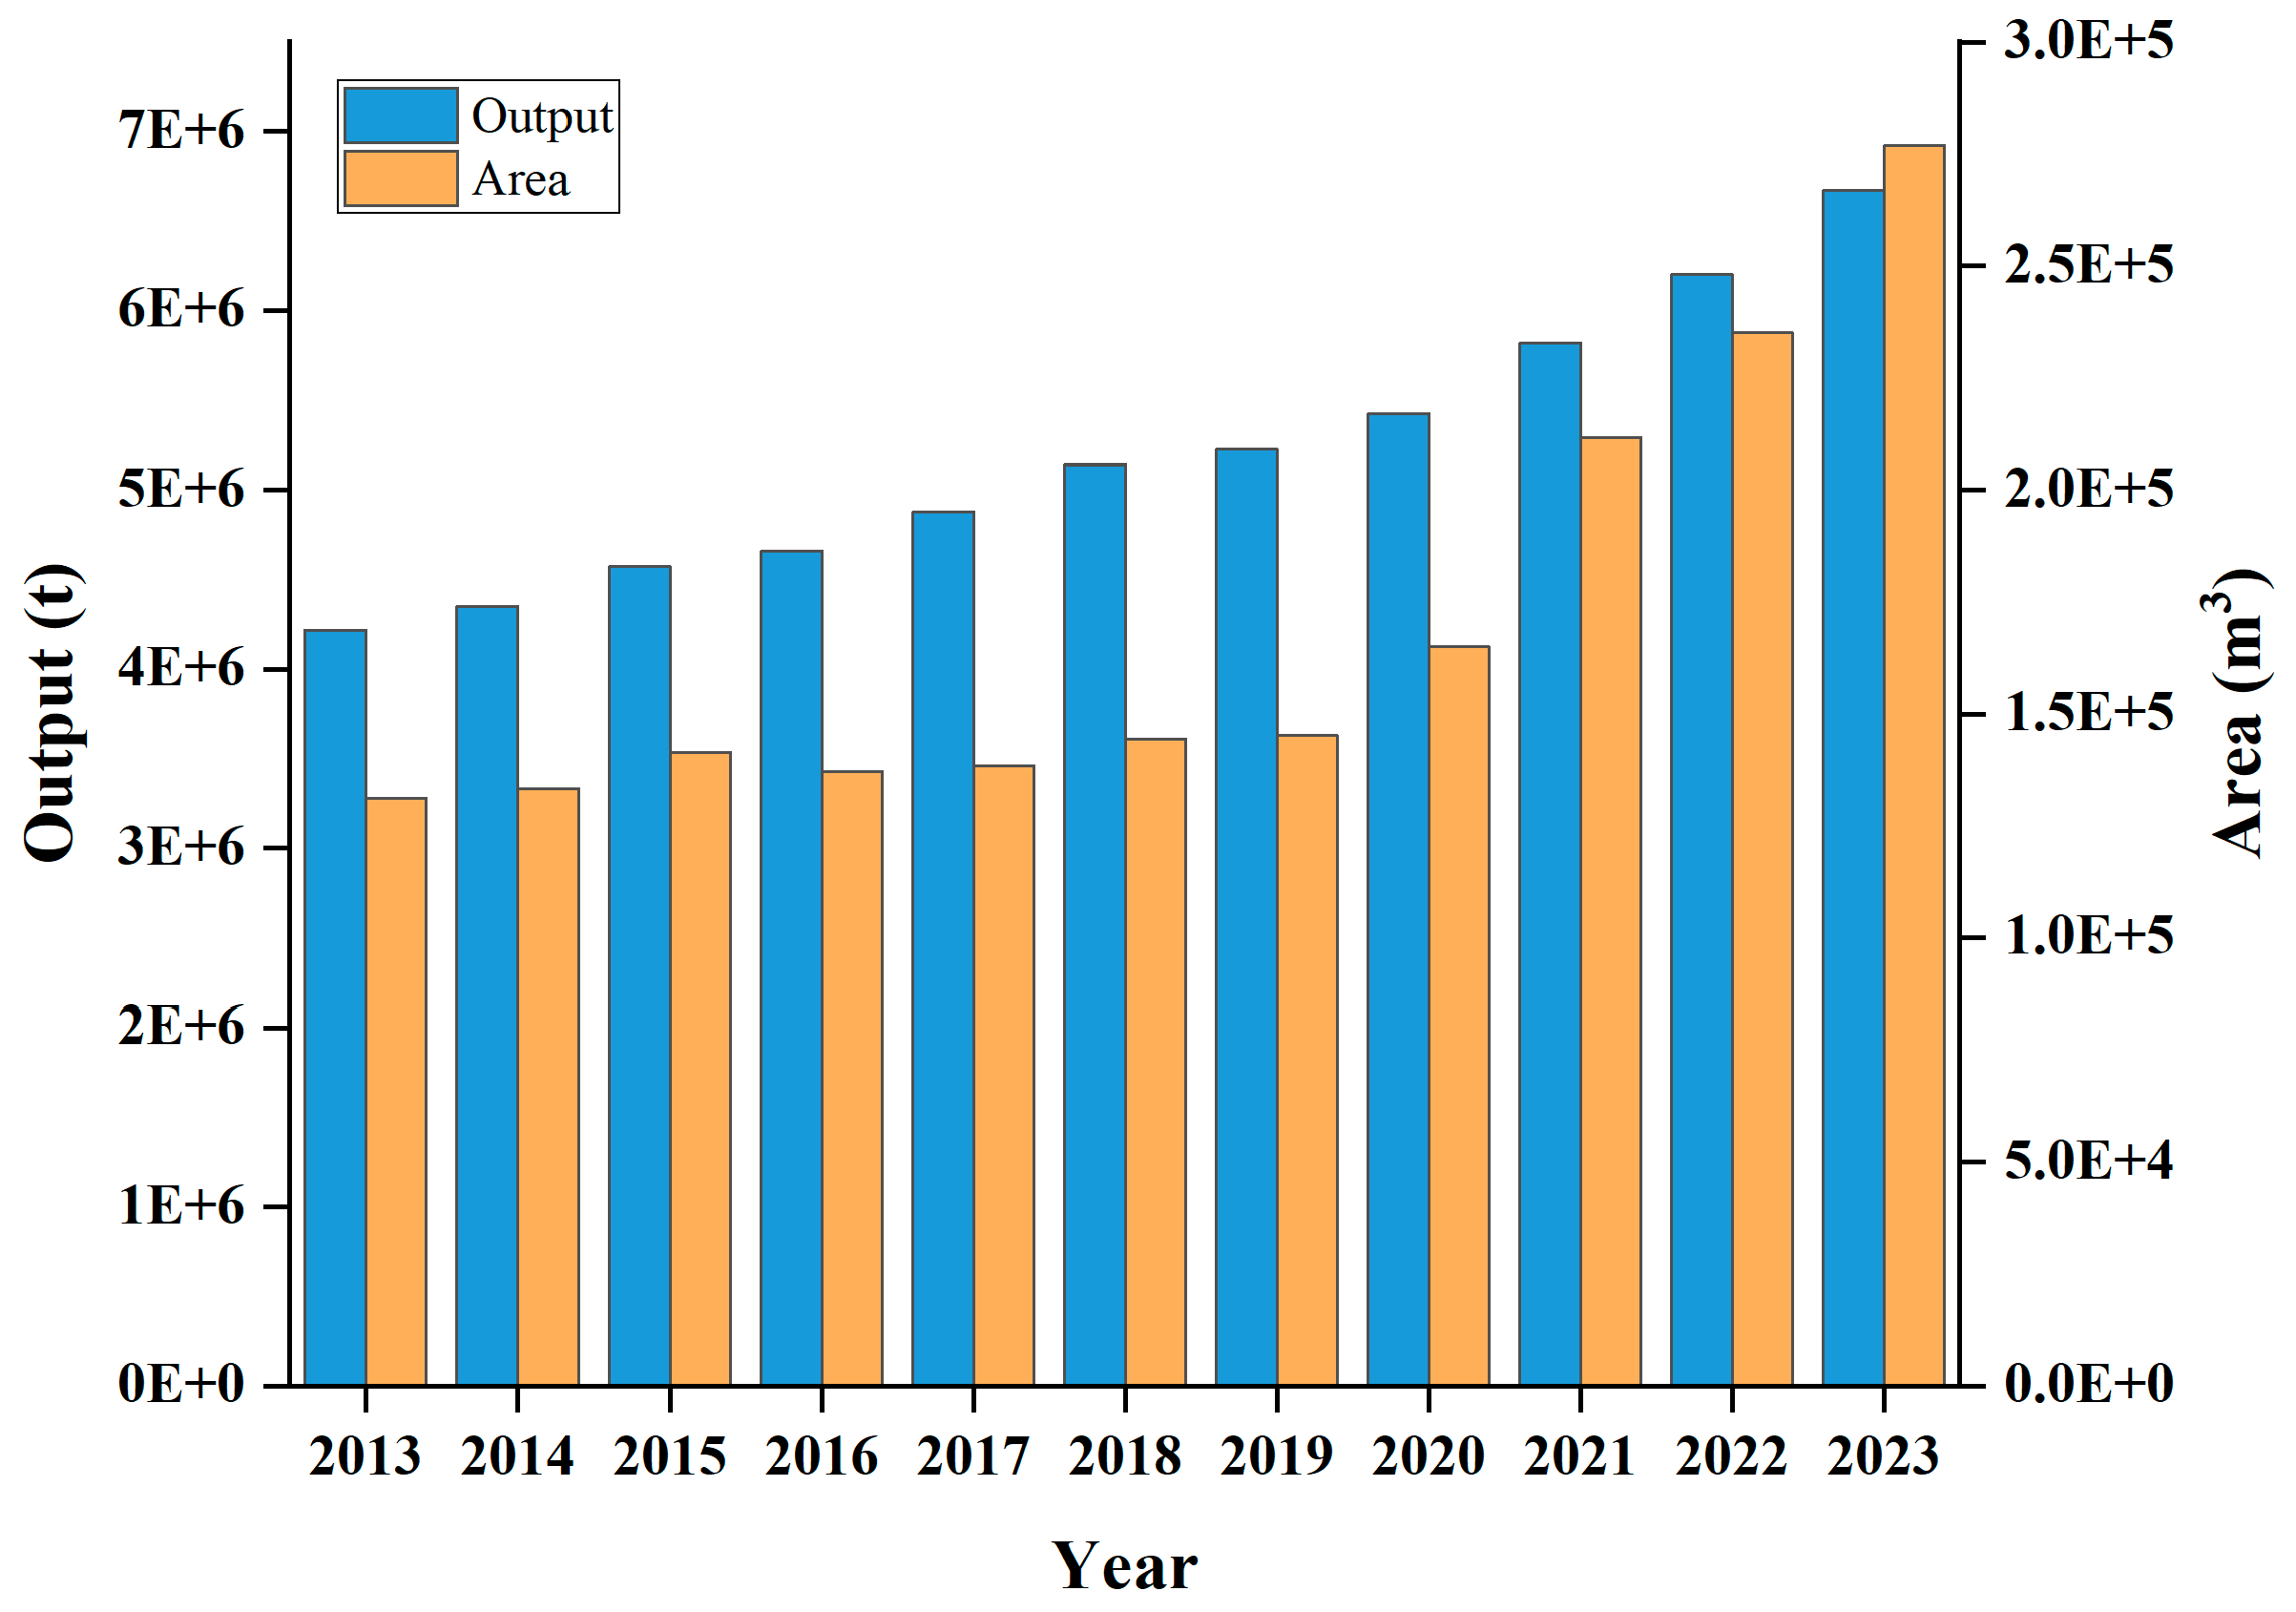
Figure 1. Trend of oyster farming area and production in China from 2013 to 2023.
Sustainability 17 07392 g001
Figure 2. Schematic diagram of the oyster supply chain in Dalian, China.
Sustainability 17 07392 g002
Figure 3. Environmental contribution analysis of the characterization results of the oyster farming process.
Sustainability 17 07392 g003
Figure 4. Environmental contribution analysis of the normalization results in the oyster farming process.
Sustainability 17 07392 g004
Figure 5. Environmental contribution analysis of the categories in the oyster farming process.
Sustainability 17 07392 g005
Table 1. Life Cycle Inventory of the three stages in the oyster farming process.
Input/OutputSubstanceBreedingUnit
InputElectricity23.8kWh
Coal200kg
Seawater111.36m3
OutputCO20.52kg
SO20.0017kg
NOX0.0015kg
Total N0.5kg
Total P0.05kg
COD1kg
Input/OutputSubstanceAquacultureUnit
InputElectricity810kWh
Diesel33L
OutputCO275.9kg
SO20.2805kg
NOX0.2442kg
Input/OutputSubstanceProcessingUnit
InputElectricity15kWh
Fresh water11.13m3
Table 2. Eleven LCA impact categories in CML-IA-Aug. 2016-world method.
CategoryCharacterization UnitsAbbreviation
Abiotic Depletion Potential (elements)kg Sb-eqADPe
Abiotic Depletion Potential (fossil)MJADPf
Acidification Potentialkg SO2-eqAP
Eutrophication Potentialkg Phosphate-eqEP
Freshwater Aquatic Ecotoxicity Potentialkg DCB-eqFAETP
Global Warming Potentialkg CO2-eqGWP
Human Toxicity Potentialkg DCB-eqHTP
Marine Aquatic Ecotoxicity Potentialkg DCB-eqMAETP
Ozone Layer Depletion Potentialkg R11-eqODP
Photochemical Ozone Creation Potentialkg Ethene-eqPOCP
Terrestrial Ecotoxicity Potentialkg DCB-eqTETP
Table 3. Life cycle characterization results for three stages in the oyster farming process.
CategoryBreedingAquacultureProcessing
ADPe3.12 × 10−66.92 × 10−61.38 × 10−4
ADPf5.63 × 1031.04 × 1044.09 × 102
AP1.64 × 10−13.11 × 1001.04 × 10−1
EP2.31 × 10−22.72 × 10−11.58 × 10−2
FAETP1.43 × 10−11.54 × 1001.23 × 10−1
GWP8.74 × 1011.00 × 1033.91 × 101
HTP3.74 × 1007.99 × 1013.08 × 100
MAETP3.57 × 1037.22 × 1043.27 × 103
ODP5.96 × 10−111.06 × 10−109.75 × 10⁻¹¹
POCP2.68 × 10−23.46 × 10−11.24 × 10−2
TETP4.76 × 10−27.46 × 10−19.02 × 10−2
Table 4. LCA normalization results of oyster farming process.
CategoryBreedingAquacultureProcessing
ADPe 8.64 × 10−151.92 × 10−143.82 × 10⁻¹³
ADPf1.48 × 10−112.73 × 10−111.08 × 10⁻¹²
AP 6.85 × 10−131.30 × 10−114.36 × 10⁻¹³
EP 1.46 × 10−131.72 × 10−129.98 × 10⁻¹⁴
FAETP 6.06 × 10−146.53 × 10−135.20 × 10⁻¹⁴
GWP 2.05 × 10−122.37 × 10−119.00 × 10⁻¹³
HTP 1.45 × 10−123.10 × 10−111.19 × 10⁻¹²
MAETP 1.83 × 10−113.70 × 10−101.68 × 10⁻¹¹
ODP 2.63 × 10−194.69 × 10−194.30 × 10⁻¹⁹
POCP 7.27 × 10−139.42 × 10−123.38 × 10⁻¹³
TETP4.36 × 10−146.84 × 10−138.27 × 10⁻¹⁴
Total3.83 × 10−114.78 × 10−102.13 × 10⁻¹¹
Table 5. Monte Carlo simulation results of the three stages in the oyster farming process.
StagesNormalization Results (yr)Monte Carlo Simulation Results
Confidence Interval 95% (yr)Mean (yr)SD (yr)
Breeding3.83 × 10−113.70 × 10⁻¹¹–3.95 × 10−113.83 × 10−117.77 × 10⁻¹³
Aquaculture4.78 × 10−104.62 × 10⁻¹⁰–4.94 × 10−104.79 × 10−109.65 × 10⁻¹²
Processing2.13 × 10−112.06 × 10⁻¹¹–2.20 × 10−112.13 × 10−114.34 × 10⁻¹³
Disclaimer/Publisher’s Note: The statements, opinions and data contained in all publications are solely those of the individual author(s) and contributor(s) and not of MDPI and/or the editor(s). MDPI and/or the editor(s) disclaim responsibility for any injury to people or property resulting from any ideas, methods, instructions or products referred to in the content.