Article

Modest Irrigation Frequency Improves Maize Water Use Efficiency and Influences Trait Expression

by
Carla Sofia Santos Ferreira
1,2,*,
Arona Figueroa Pires
2,
André Pereira
2,
Pedro Mendes-Moreira
2 and
Matthew Tom Harrison
3
1
Polytechnic Institute of Coimbra, Applied Research Institute, Rua da Misericórdia, Lagar dos Cortiços—S. Martinho do Bispo, 3045-093 Coimbra, Portugal
2
Research Centre for Natural Resources Environment and Society (CERNAS), Polytechnic Institute of Coimbra, Bencanta, 3045-601 Coimbra, Portugal
3
Tasmanian Institute of Agriculture, University of Tasmania, Newnham Drive, Launceston, TAS 7248, Australia
*
Author to whom correspondence should be addressed.
Sustainability 2025, 17(16), 7365; https://doi.org/10.3390/su17167365
Submission received: 5 June 2025 / Revised: 19 July 2025 / Accepted: 4 August 2025 / Published: 14 August 2025

Abstract

While irrigation is generally required for most summer crops in the Mediterranean region, increasingly scarce water supplies are leading to a demand for more efficient irrigation infrastructure. Here, we assess how three irrigation volumes—100 mm/week (simulating excess water), 55 mm twice per week (moderate supply), and a variable amount adjusted on a weekly basis according to crop water demand (AMP) applied once or twice weekly via drip irrigation—impacted the growth, yield, and ear traits of a local maize variety under low-input farming in central Portugal. We found that irrigation management significantly influenced grain yield and irrigation water use efficiency (IWUE), with the 55 mm treatment applied twice weekly achieving the highest yield (3504 kg ha−1) and IWUE (7.2 kg ha−1 mm−1). The highest irrigation treatment (100 mm/weekly) impaired yield (996 kg ha−1 and 1973 kg ha−1, when water was applied in one or two events), likely due to nutrient leaching, and resulted in the lowest IWRU (1.2 kg ha−1 mm−1 and 2.5 kg ha−1 mm−1, respectively). Biweekly applications tended to increase crop height. Irrigation rate and frequency significantly affected kernel number and size, but not total ear weight or cob-to-ear weight ratio. These findings highlight the importance of irrigation frequency based on crop water demand over blanket approaches based on volume alone.

1. Introduction

Maize (Zea mays L.) is one of the most important cereal crops globally, playing a crucial role in the world’s food system [1]. As one of the most widely cultivated crops, it has the largest planted area of any food crop [2]. In 2022, the global maize harvest covered approximately 203 million hectares, representing a 97% increase since 2000, with a total production of 1.2 billion tons [1]. In Europe, maize was grown on 17.5 million hectares, contributing 11% of global maize production in 2022, making it the third-largest maize-producing region [1]. Portugal has the highest per capita maize consumption for food in Europe, with a cultivation area of 54,266 hectares in 2024. In Portugal, most maize cropland is used for grain production, accounting for 56% of the country’s total cereal cultivation [3].
The maize life cycle typically ranges from 90 to 150 days, depending on the variety, environmental conditions (temperature, rainfall, sunlight), and intended use (e.g., grain or silage) [4]. Maize thrives in warm climates [5] but can be cultivated in temperatures ranging from 1.5 °C to 45 °C, with an optimal range of 18–20 °C [6]. Temperature plays a crucial role in maize development, influencing physiological and biochemical processes from germination to grain filling, ultimately affecting the growth period, yield, and grain quality [7,8]. Water availability is another critical factor for maize cultivation [9]. The crop requires between 500 and 800 mm of water per growing season, depending on climatic conditions [10]. Similar to most cereal crops, water scarcity can negatively impact maize development at multiple stages, such as germination, due to increased seedling mortality, poor stand establishment, and uneven plant growth; the vegetative growth stage, since water scarcity is associated with restrictions to leaf expansion, which reduces photosynthetic capacity and results in shorter plants and limited ear development; the reproductive stage by impairing pollination and kernel set, leading to lower yields; and the grain filling stage through a reduction in kernel size and weight, ultimately affecting both yield and quality [11,12].
In the Mediterranean region, high temperatures and low precipitation during summer exacerbate water shortages and limit nutrient uptake [13], significantly affecting maize production [14]. To mitigate these challenges, irrigation is widely used to support crop development and maximize yields. Globally, 40% of the world’s food production relies on irrigated agriculture, which accounts for 70% of global freshwater withdrawals [15]. In water-scarce regions like the Mediterranean, competition for water resources has intensified, a problem expected to worsen due to climate change, particularly in the Iberian Peninsula [16], where rising temperatures and erratic rainfall patterns are projected to have direct impacts on maize production [13]. Maize is among the crops most affected by irrigation water deficits, suggesting an urgent need to improve knowledge of management approaches for improving water use efficiency [11].
To address these challenges, optimizing irrigation strategies to improve water use efficiency (WUE)—without compromising yield or product quality—have been a focus of extensive research [15]. Over recent decades, various irrigation techniques have been developed, including, e.g., drip irrigation [17], precision irrigation [18], and water-saving practices such as deficit irrigation [19]. Other studies have explored irrigation scheduling, adjusting water applications according to crop requirements at different growth stages [20]. While much of the research has examined the effects of irrigation technologies and scheduling on maize yields [21,22], fewer studies have investigated the impact of irrigation on phenotypic traits [23]. Since crop yields are often influenced by specific phenotypic expressions—driven by adjustments in yield component traits under varying environmental and agronomic conditions—understanding these relationships is essential for improving agricultural resilience via development of improved agricultural land management [24].
Other strategies to reduce crop water requirements without affecting crop yields include selecting genotypes with superior physiological and morphological traits that enable the crop to withstand water stress [25]. Genomic selection has also improved breeding precision for drought-resistant varieties [26]. Maize landraces, in particular, have evolved over generations in specific environments, making them well-adapted to local climatic conditions, including extreme temperatures, variable rainfall, and diverse soil types [27]. Their ability to tolerate limited water availability makes them particularly valuable in arid and semi-arid regions [28]. Although maize landraces generally produce lower yields than commercial hybrids, they often offer higher nutritional value and contribute to local economies [29]. However, research on maize landraces remains relatively limited, particularly regarding the effects of irrigation management on their yields, plant growth, and ear traits.
This study aims to assess the impact of irrigation strategy (i.e., water volume and application scheduling) on a maize landrace cultivated in central mainland Portugal (Pigarro). Specifically, the research evaluates the effects of irrigation on plant height and productivity, including yields and ear traits (ear size, diameter, cob weight, and kernel weight), which are key factors for commercial viability.

2. Materials and Methods

2.1. Study Site

This study was developed at Caldeirão farm (4.8 ha), located in the Lower Mondego Valley (40.21709426119619; −8.44779968261719; elevation 15 m), one of the main agricultural regions in central Portugal (Figure 1). In this fertile valley, maize is the dominant crop, covering approximately 12,300 ha [30]. It is typically cultivated from April/May to October/November under intensive, irrigated monoculture systems. Although the valley is predominantly cultivated with hybrid maize cultivars, our experiments at Caldeirão farm employed the traditional Pigarro landrace, which has been consistently grown in this field over the last seven years. Pigarro is an open pollinated maize variety known for its moderate water and nitrogen requirements, and high kernel-row numbers [31]. It is the most commonly grown maize landrace in the region due to its high protein content and lower viscosity compared to commercial cultivars [31]. Pigarro is particularly valued for its role in traditional Portuguese bread, broa, contributing to its distinct texture and flavor [32]. Broa made from maize landraces, such as the white flint type, is softer, sweeter, and has a longer shelf life than that produced with commercial cultivars [32].
The region has a humid Mediterranean climate, with an average annual temperature of 15 °C and annual rainfall of 906 mm, with long dry summers (8% of the precipitation falls in June–August) [33]. The study site has a modern alluvial soil, with a texture varying from silt–loam to sandy–clay–loam [30].

2.2. Experimental Design

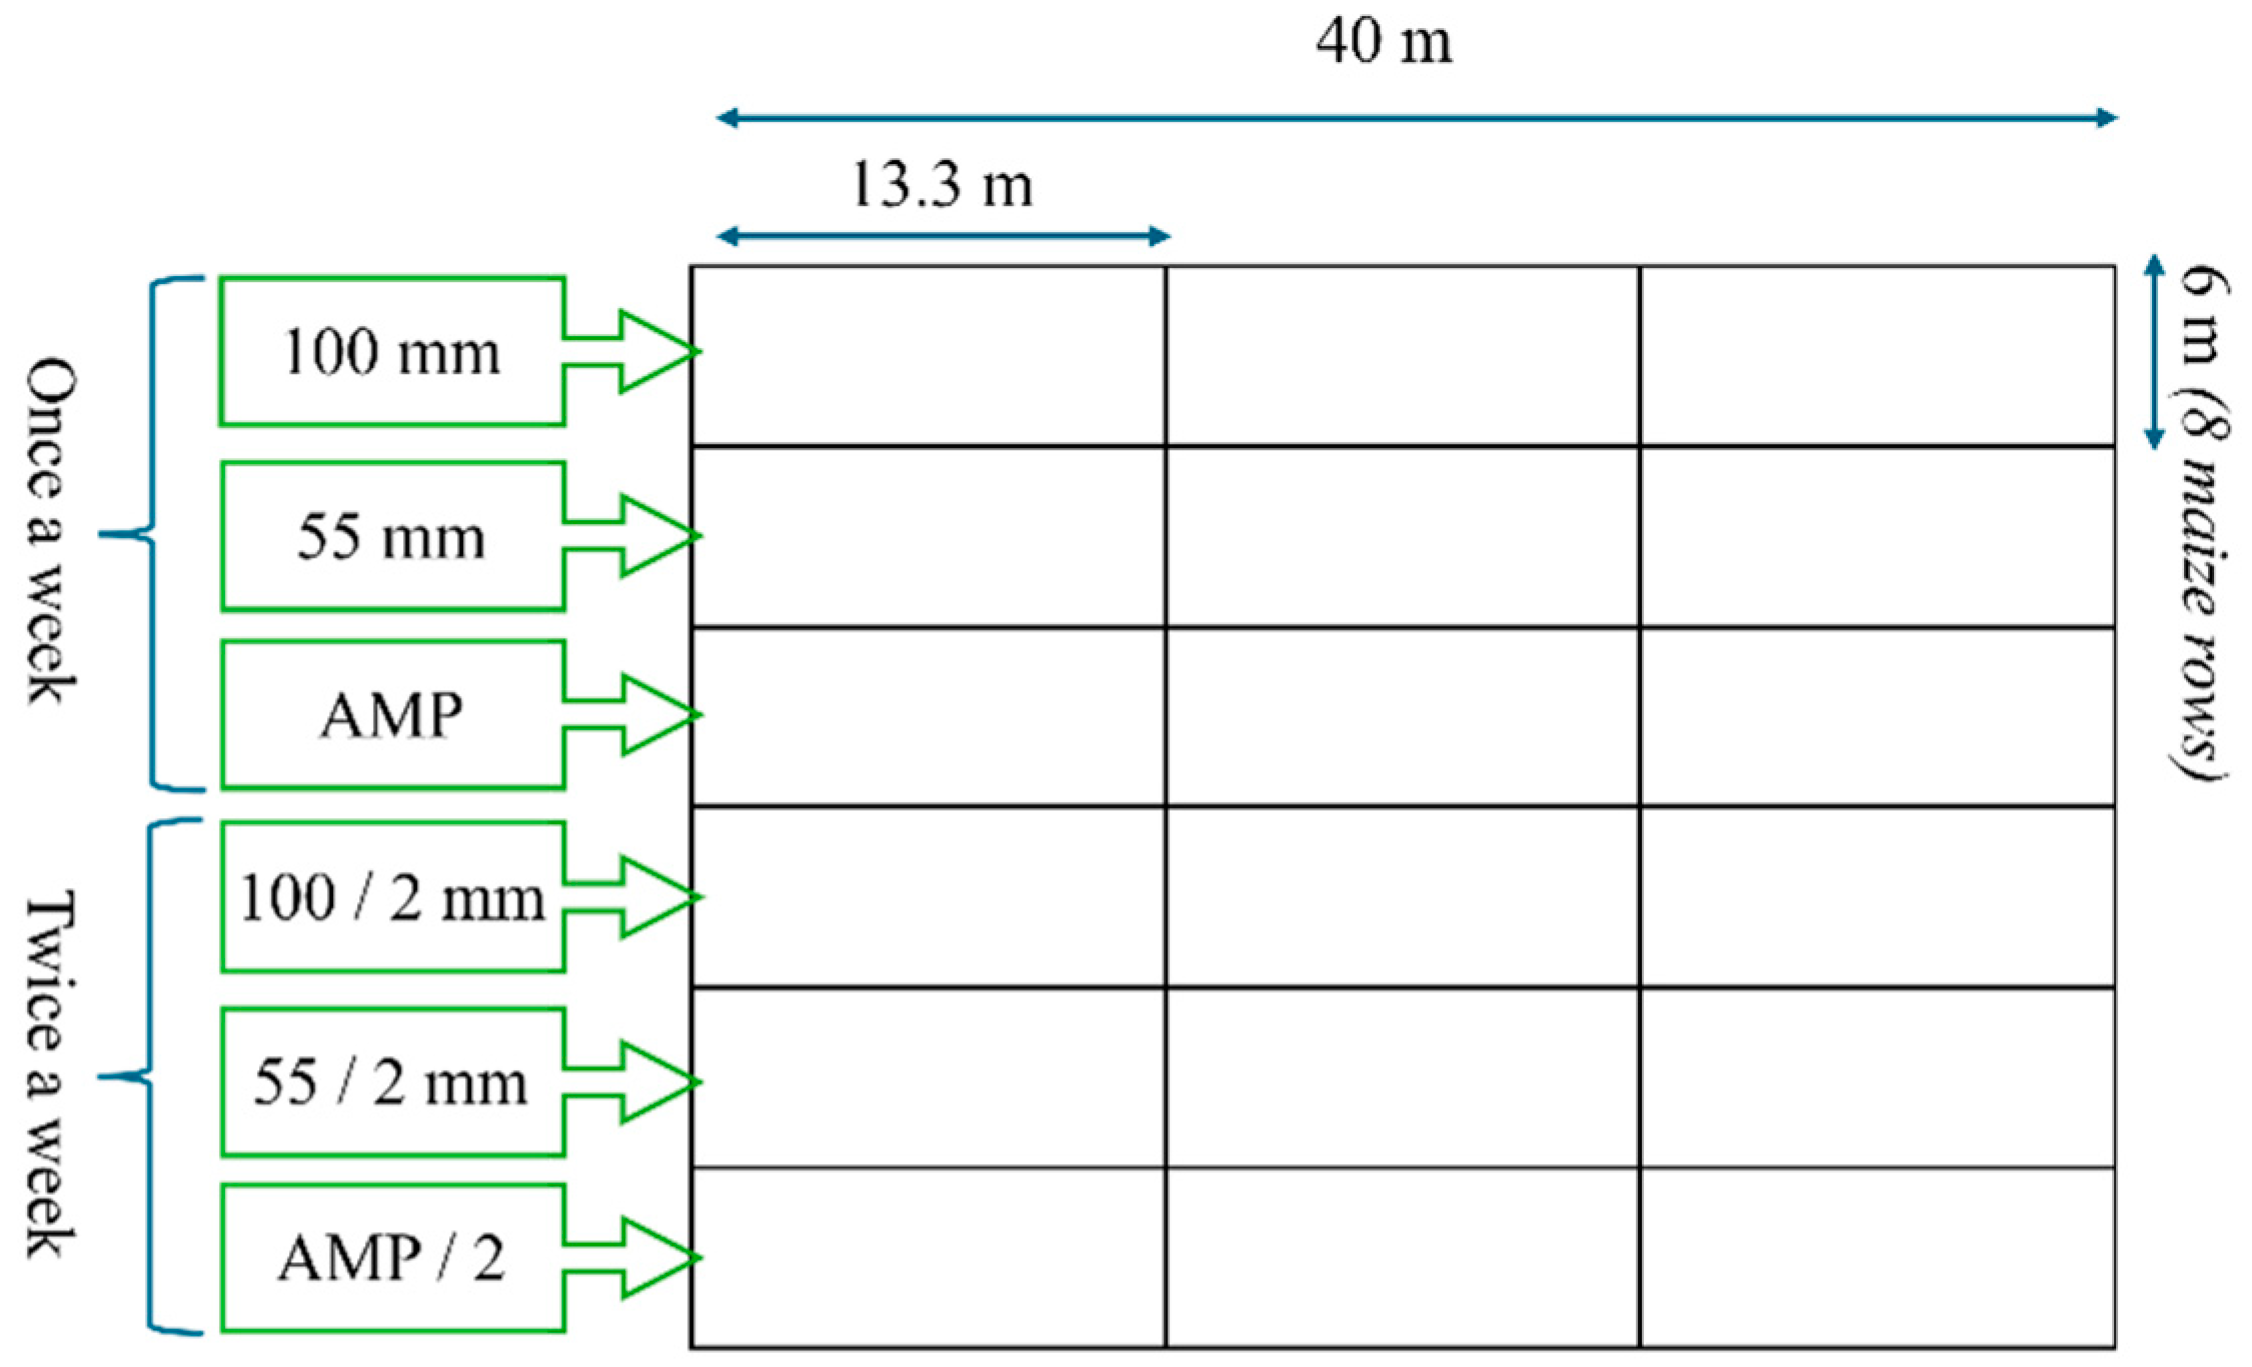
At the Caldeirão farm, experiments were caried out in an area managed under low input agricultural practices; no fertilizers or chemical treatments were applied. The goal was to select plants and seeds with resilience to adverse conditions. Before sowing, the soil was tilled to incorporate crop residues from the previous maize season and weeds, facilitating seedbed preparation. Maize was sown on 6 May 2023 at a density of 80,000 plants per hectare and harvested on 7 November 2023. Six irrigation treatments were implemented, each covering 8 maize rows (0.75 m spacing) with a length of 40 m. Each treatment area was further divided into three replicated plots, each approximately 13.3 m long (Figure 2). The irrigation treatments applied three distinct weekly water volumes: 100 mm—slightly above the optimal 30-year average, based on APSIM crop model results (unpublished data); 55 mm—simulating water scarcity conditions, also based on modeling results; and AMP—a variable amount recommended by the National Association of Maize and Sorghum Producers (ANPROMIS). ANPROMIS provides support to Portugal’s maize sector, offering producers tools, knowledge, and best-practice guidance. During the cropping season, it delivers weekly irrigation recommendations based on weather data and crop water needs, adjusted for region, sowing date, and irrigation system (furrow, sprinkler, or drip). The recommendations are derived from water balance calculations that utilize climate data collected from a network of weather stations. Maize crop evapotranspiration is estimated by multiplying the reference evapotranspiration, calculated using the Penman–Monteith method, by a crop coefficient that is adjusted according to the specific growth stage of the crop. The required irrigation volume is then determined by accounting for crop evapotranspiration and effective precipitation, with final adjustments made based on the efficiency of the different irrigation systems [34].
Each of the three irrigation volumes were applied in two schedules: once a week or split into two weekly applications. The six irrigation treatments were as follows:
-
100 mm: 100 mm applied once a week over the irrigation season;
-
55 mm: 55 mm applied once a week over the irrigation season;
-
AMP: ANPROMIS-recommended weekly irrigation volume, applied once a week;
-
100/2 mm: 50 mm applied biweekly over the irrigation season;
-
55/2 mm: 27.5 mm applied biweekly over the irrigation season;
-
AMP/2: ANPROMIS-recommended weekly irrigation volume, split into two applications per week.
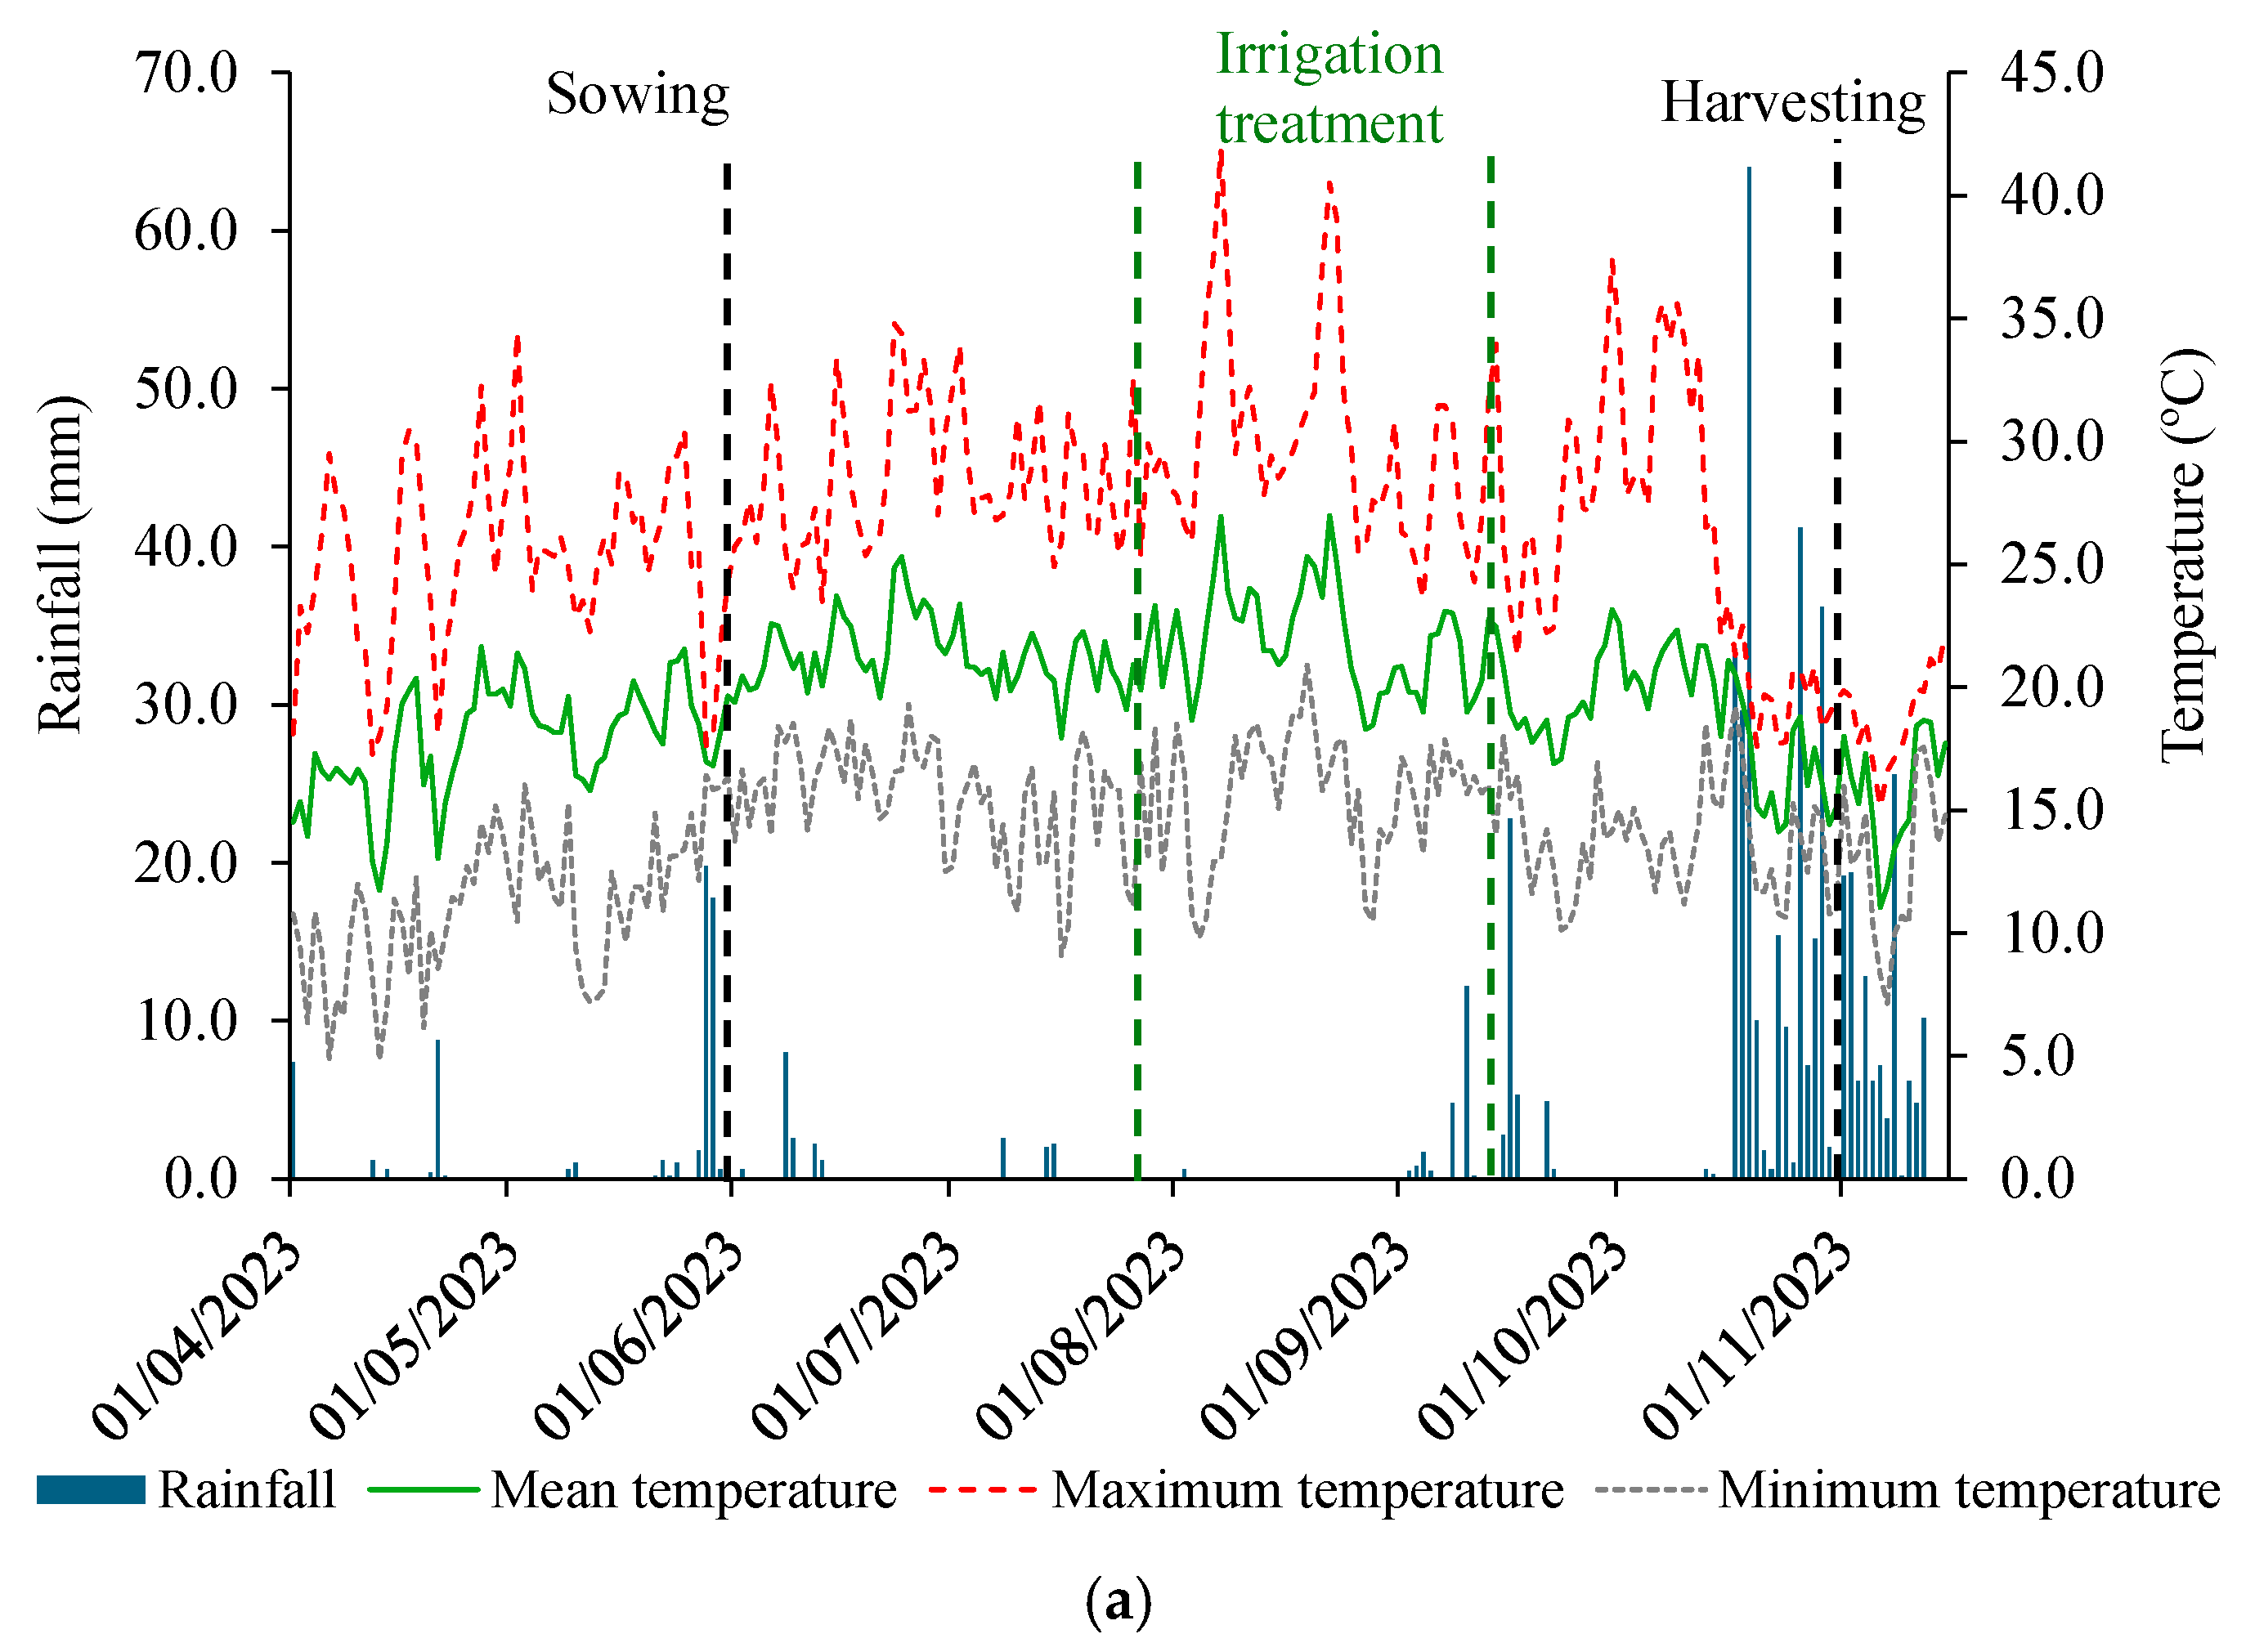
Irrigation was carried out using a drip system, with one pipe per maize row. Water application for each treatment was controlled by flow meters (NATRAIN) installed in the main water pipe distributing water to the individual treatment areas. The irrigation system was operated manually, with water flow initiated and stopped by hand once the target irrigation volume (monitored using flow meters) was reached. The irrigation treatments were implemented from 31 July to 11 September (Figure 3a), lasting seven weeks. Irrigation was applied on Tuesdays across all plots, and additionally on Thursdays for those treatments receiving water twice per week. All irrigation events were conducted in the morning.
Due to delays in acquiring the flow meters, as well as high temperatures and low soil moisture levels, additional irrigation was applied to all plots on 3 and 10 (30 mm each) and on 17 July (45 mm) July. These volumes were determined based on farmers’ experience and judgment. In the Lower Mondego Valley, maize irrigation typically begins following the installation of a drip irrigation system, which is usually carried out shortly after the formation of corn mounds, approximately 30 to 45 days after sowing. In our field experiment, the initiation of irrigation was delayed until 3 July due to logistical constraints related to the acquisition of flow meters, resulting in a two-week delay relative to standard practice. The end of the irrigation period aligned with the typical schedule for the region, concluding in early September for late-sown maize. At this stage, the crop reached physiological maturity, and additional irrigation was no longer necessary, as grain filling was complete. This phase is easily identifiable in the field by the loss of green coloration in the plants and the onset of natural desiccation, during which the crop no longer responds to supplementary watering.
The total amount of water applied in each treatment throughout the study period is presented in Figure 3b. In total, 100 mm and 100/2 mm plots received 805 mm of water irrigation over the study period, while 55 mm and 55/2 mm received 490 mm, and the AMP plots were irrigated with 369 mm.
In each of the 18 plots (3 plots per irrigation treatment), plant height was measured at the end of the vegetative phase (3 August) in 21 plants randomly selected within each plot. Measurements were taken using a ruler, from the soil to the last leaf (excluding the tassel), following the methodology of IPGRI [35]. Immediately before mechanical harvesting, the number of standing and broken plants per plot was recorded based on field observations (7 November 2023). These observations were taken in the central part of each plot (1.5 m × 6.8 m). All the ears from this central part of the plots were manually collected. From the total ears collected, 11 per plot were randomly selected for yield assessment and ear trait analysis (see Section 2.3), while the remaining ears were retained by the farmer for breeding selection. To assess soil homogeneity within the study area, three composite soil samples per plot were randomly collected from the surface layer (0–15 cm depth) immediately before the irrigation season. In each plot, soil samples were also collected with a ring for bulk density analysis.

2.3. Plant Growth and Ear Traits Analysis

The potential impact of irrigation treatments on plant growth (height and number of standing plants) and ear traits (including ear size, diameter and type, fasciation, determinate or indeterminate ear, cob weight, kernel type, color and weight) was evaluated using the HUNTERS method (High, Uniformity, Angle, Tassel, Ear, Root lodging and Stalk lodging) developed by Pego [36]. Ear height was measured using a metrically marked ruler. The weight parameters for ears, kernels, and cobs were determined using a digital scale (PLJ 4000-2M KERN®KERN, Baden-Württemberg, Germany). The number of kernels per ear was counted using a grain counter (SEED COUNTER, PFEUFFER®, GmbH, Kitzingen, Germany), while kernel moisture content was assessed with a moisture meter (ISOELECTRIC GRAIN CHECK®, Isoelectric S.R.L., Lombardy, Italy). A summary of the plant and ear traits assessed is presented in Table 1.

2.4. Assessment of Soil Properties

Soil physico-chemical analyses were performed to investigate soil homogeneity between plots (0–15 cm). Bulked soil samples collected in each plot were dried at 38 °C for 24 h and then sieved at 2 mm. Soil samples were then analyzed for pH and electrical conductivity, quantified through a potentiometric method following the ISO 10390:2021 standard, respectively [38]; organic matter (OM) was determined by dry combustion following ISO 10694:1995 [39], total nitrogen (N) was determined by Kjeldahl method [40], and available phosphorous (P2O5) and potassium (K2O) were quantified using the Egnér–Riehm method [41].

2.5. Statistical Analysis

Differences in soil properties between plots were assessed using the Kruskal–Wallis test, due to the non-normality and lack of homogeneity of variance in the data as determined by the Kolmogorov–Smirnov and Levene tests, respectively. When significant differences were detected, the Pairwise Comparison test was used for further analysis. These tests were also applied to evaluate significant differences in plant properties (height, stand, R, and S) and ear traits (N ear, EW100, EL, CW, EW/EW, KD, NC, KW, and GY) across plots. To further examine the impact of irrigation on plant and ear traits, irrigation water use efficiency (IWUE) was calculated for each treatment as the ratio of GY to total irrigation water applied over the study period [37]. Significant differences in IWUE between plots were also assessed using the aforementioned statistical tests. All statistical analyses were performed at a 95% significance level. The correlations between different ear traits, as well as their relationships with irrigation water, weekly irrigation frequency, and IWUE, were investigated using Spearman coefficient. Statistical analyses were performed using the software SPSS (Statistical Package for Social), version 29.

3. Results and Discussion

3.1. Soil Properties

The results of the soil’s physical and chemical properties are summarized in Table 2. Bulk density records significant differences between plots (p ≤ 0.05), with AMP/2 displaying highest values compared to 100 mm, 55 mm, and 100/2 mm (mean values of 1.42 g cm−3 vs. 1.31–1.33 g cm−3). These values fall within the typical range recorded in European arable croplands for the top 0–10 cm [42]. Furthermore, the recorded bulk density values align with the ideal range for maize cultivation (1.1–1.4 g cm−3 for loamy and sandy soils), ensuring adequate aeration and water-holding capacity [43]. Therefore, despite the statistical differences observed, these variations are not expected to affect crop development across treatments.
Soil chemical properties are relatively homogeneous between plots (p > 0.05), except for P2O5, which is significantly higher in the 100/2 mm and 55/2 mm plots (mean concentrations of 368.10 mg kg−1 and 374.19 mg kg−1, respectively) compared to the 100 mm, 55 mm, and AMP2 plots (269.65–313.48 mg kg−1, p ≤ 0.05). However, all plots exhibit very high P2O5 concentrations, suggesting that these differences will not limit maize development. According to the Portuguese Crop Fertilization Manual [44], soil P2O5 levels between 151 and 200 mg kg−1 do not require additional fertilization for annual crop yields up to 8 ton ha−1, assuming a soil pH between 5.0 and 7.5—a range consistent with our study plots (7.1–7.3). The OM content in the study site (1.62–1.81%, p > 0.05) falls within the medium range for Portuguese agricultural soils (1–2%) [45]. Nitrogen content is relatively low (0.12–0.13%) but remains consistent across plots (p > 0.05). Available phosphorous varies between 218.63 mg kg−1 and 286.90 mg kg−1 across the plots (p > 0.05). Given these values and following the recommendations of the Portuguese Crop Fertilization Manual [44], no additional fertilization is required, as K2O levels exceed 50 mg kg−1.

3.2. Plant Development

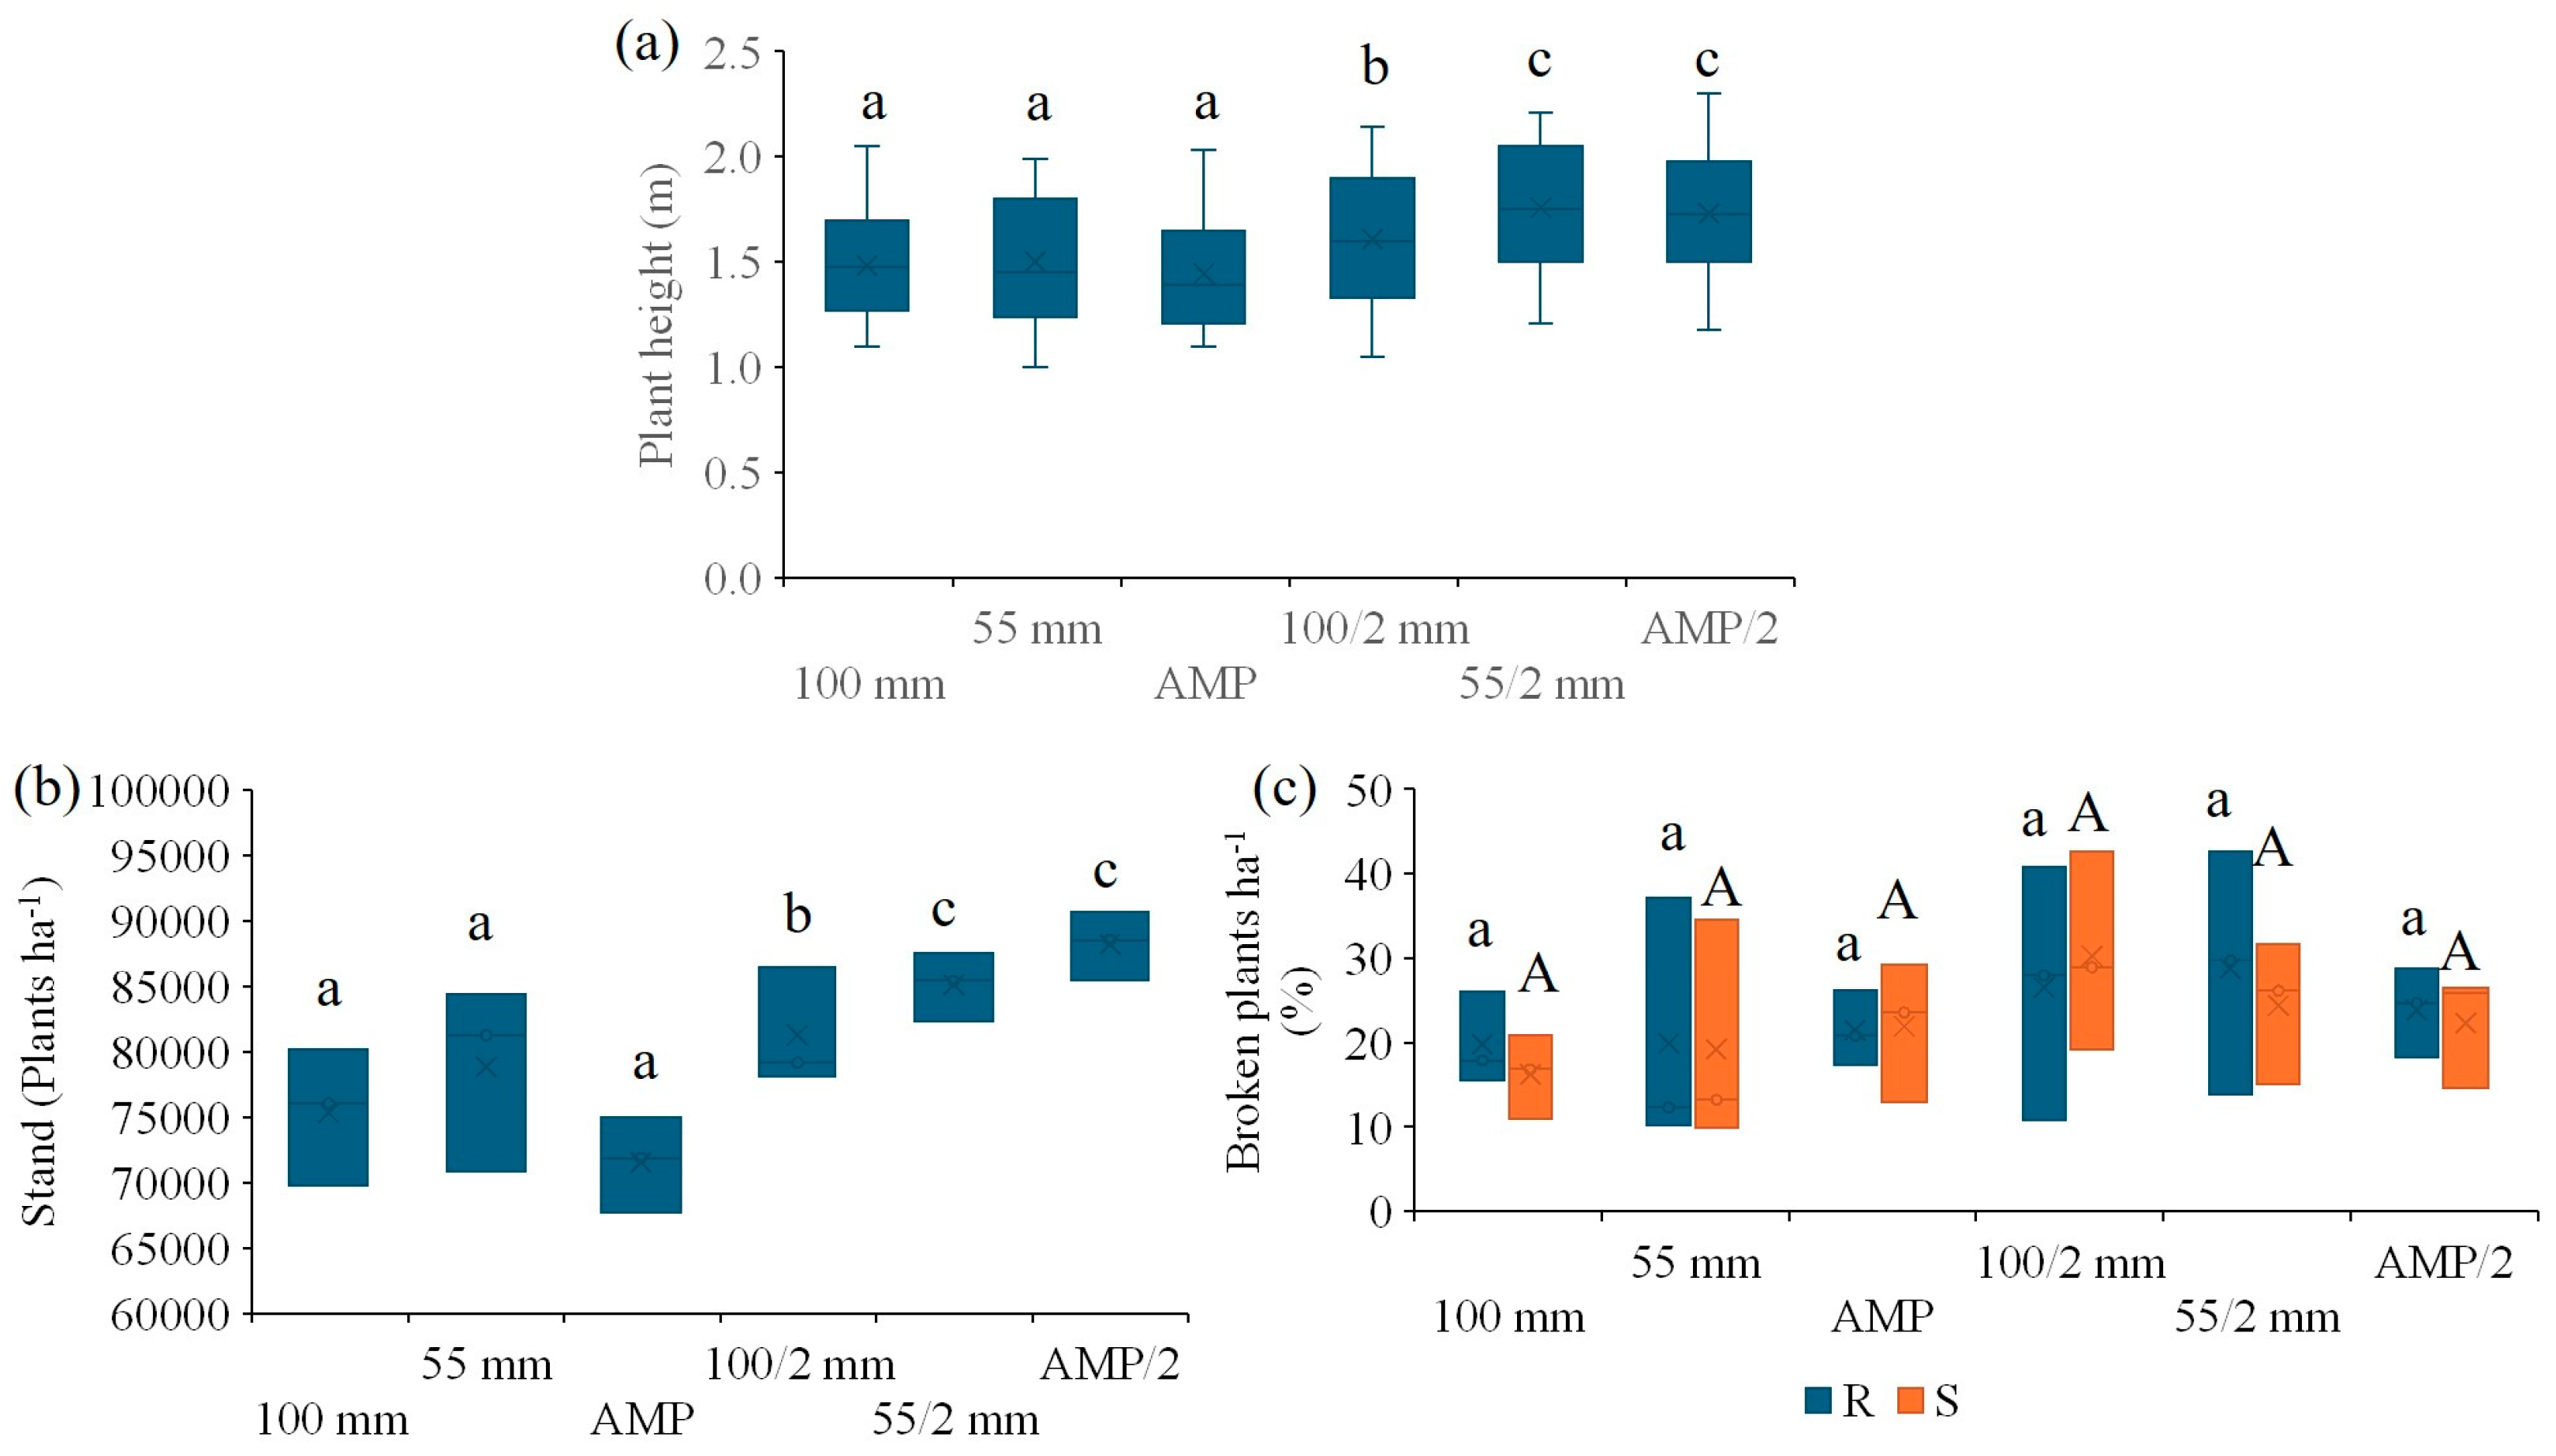
Maize did not develop uniformly between plots (Figure 4). Both plant height and the number of plants (stand) displayed their highest values in the 55/2 mm and AMP/2 plots (median values of 1.75–179 m and 85,417–88,542 plant ha−1, respectively) rather than the 100/2 mm plots (1.60 m and 79,167 plant ha−1), with the lowest values recorded in plots irrigated once a week (100 mm, 55 mm, and AMP; 1.39–1.48 m and 71,875–81,250 plant ha−1) (p ≤ 0.05). Within each plot, an average of 36–57% of plants were recorded as broken (Figure 4c). In general, there were a slightly larger number of plants broken by the root compared to those broken by stem, but no significant difference was recorded in the number of broken plants across plots (p > 0.05). This damage was likely caused by a storm that occurred in early September, which affected a substantial portion of the experimental field. Although traditional crop varieties are known for their enhanced tolerance to abiotic stresses, including climatic extremes [46], and low-input farming practices are often associated with increased plant resilience—partly through the development of deeper root systems [47]—these factors did not offer sufficient protection against the storm recorded during our study. Nevertheless, plant breakage in the field typically results from a combination of environmental, biological, and agronomic factors. Field observations indicated that maize plants at the study site exhibited thinner stems and appeared more structurally fragile compared to those in nearby conventionally managed farms growing hybrid varieties, and even to plants of the same Pigarro landrace under organic farm management. Plants with inadequate stalk strength—whether due to genetic predisposition or low lignin content—are more susceptible to stem lodging [48]. Similarly, insufficient root development can reduce anchorage strength and increase the likelihood of root lodging, although we did not evaluate root development in this study, and therefore cannot confirm its role in the observed breakage. In addition, nitrogen deficiency may have contributed to structural weakness, as the study site’s soil showed relatively low nitrogen content (Table 2). Nitrogen is critical for supporting stem development, and its deficiency is known to impair tissue integrity, increasing vulnerability to mechanical stress [48]. Further research is needed to clarify the specific factors contributing to the reduced storm resistance of the local Pigarro variety, particularly the cause of the observed thinner stems.

3.3. Phenotypic Traits

3.3.1. Number of Ears

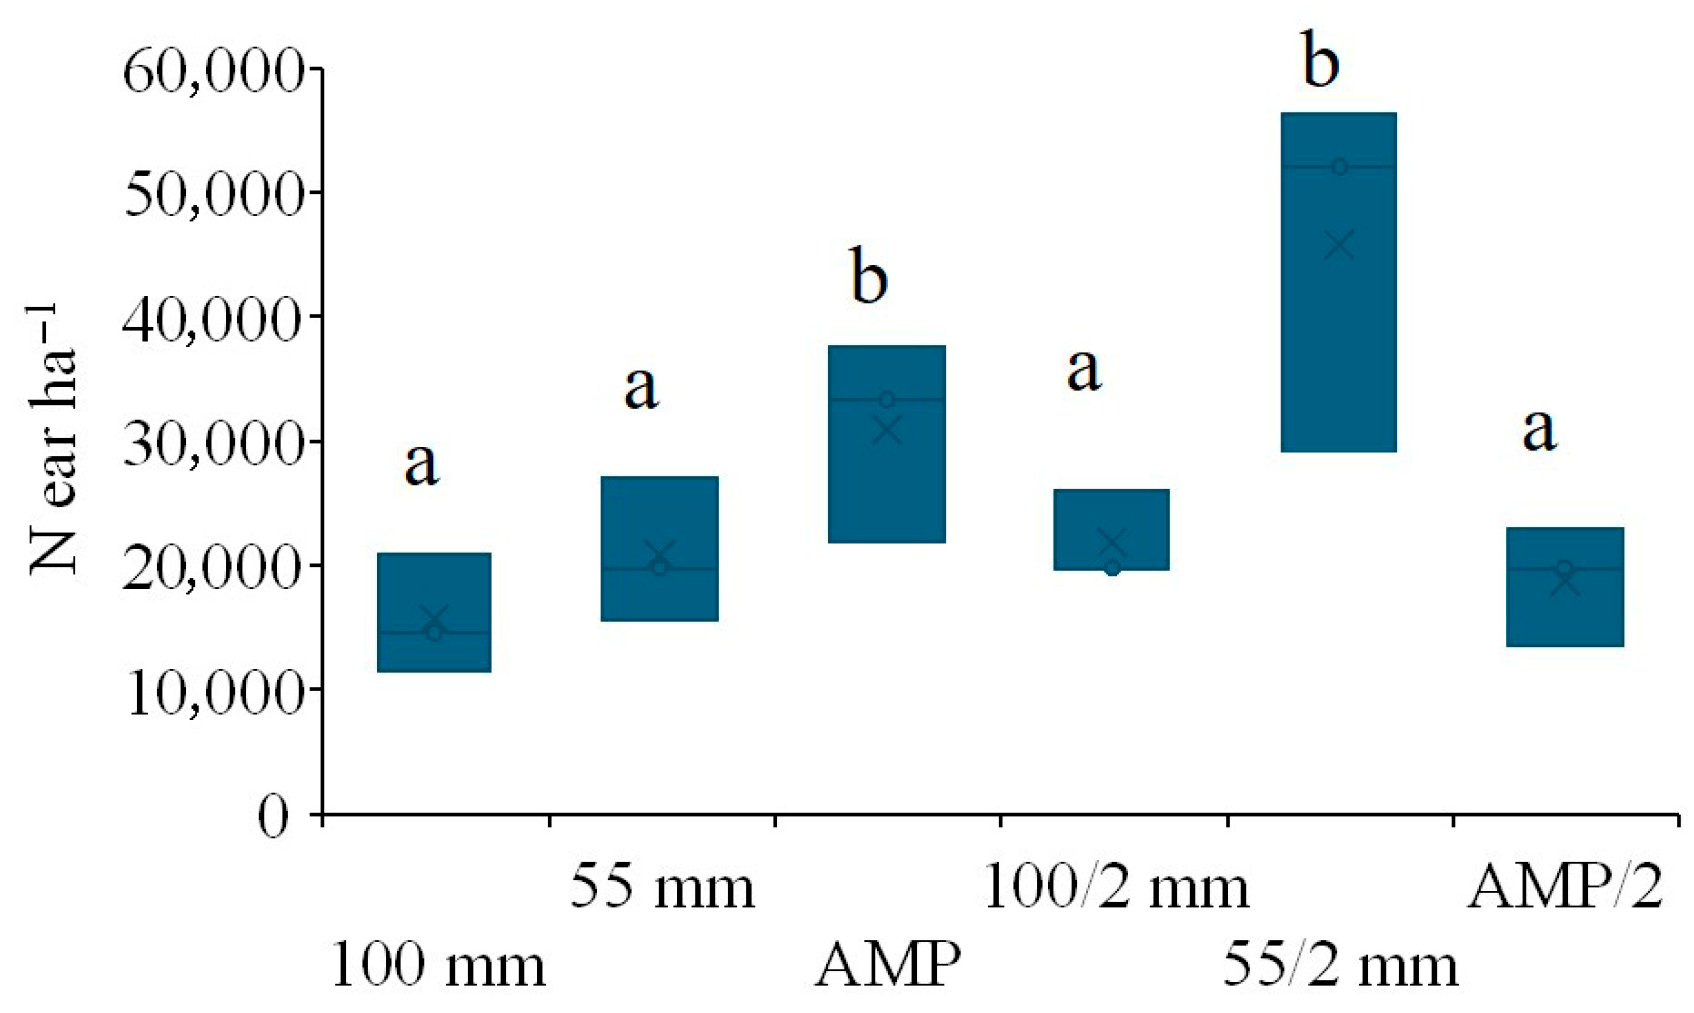
Significant differences between plots were recorded regarding the number of ears (Figure 5), with AMP and 55/2 mm plots displaying higher values than the other plots (median values of 33,333–52,083 ears ha−1 vs. 14,583–19,792 ears ha−1; p ≤ 0.05). The number of ears in the standing plants is considerably lower than the number of stands (Figure 4b), without a significant correlation between both variables (Table 3). Therefore, it is unclear if differences between Nears (number of ears of maize) are driven by treatments or a consequence of the storm. Although Near data were collected from 1.5 m × 6.8 m plots located in the central area of each treatment plot, deliberately chosen to exclude zones with visibly broken plants following the storm, the number of fallen ears may still have been affected by the storm event, potentially influencing the recorded values and masking the impact of irrigation treatments.

3.3.2. Ear Length and Weight

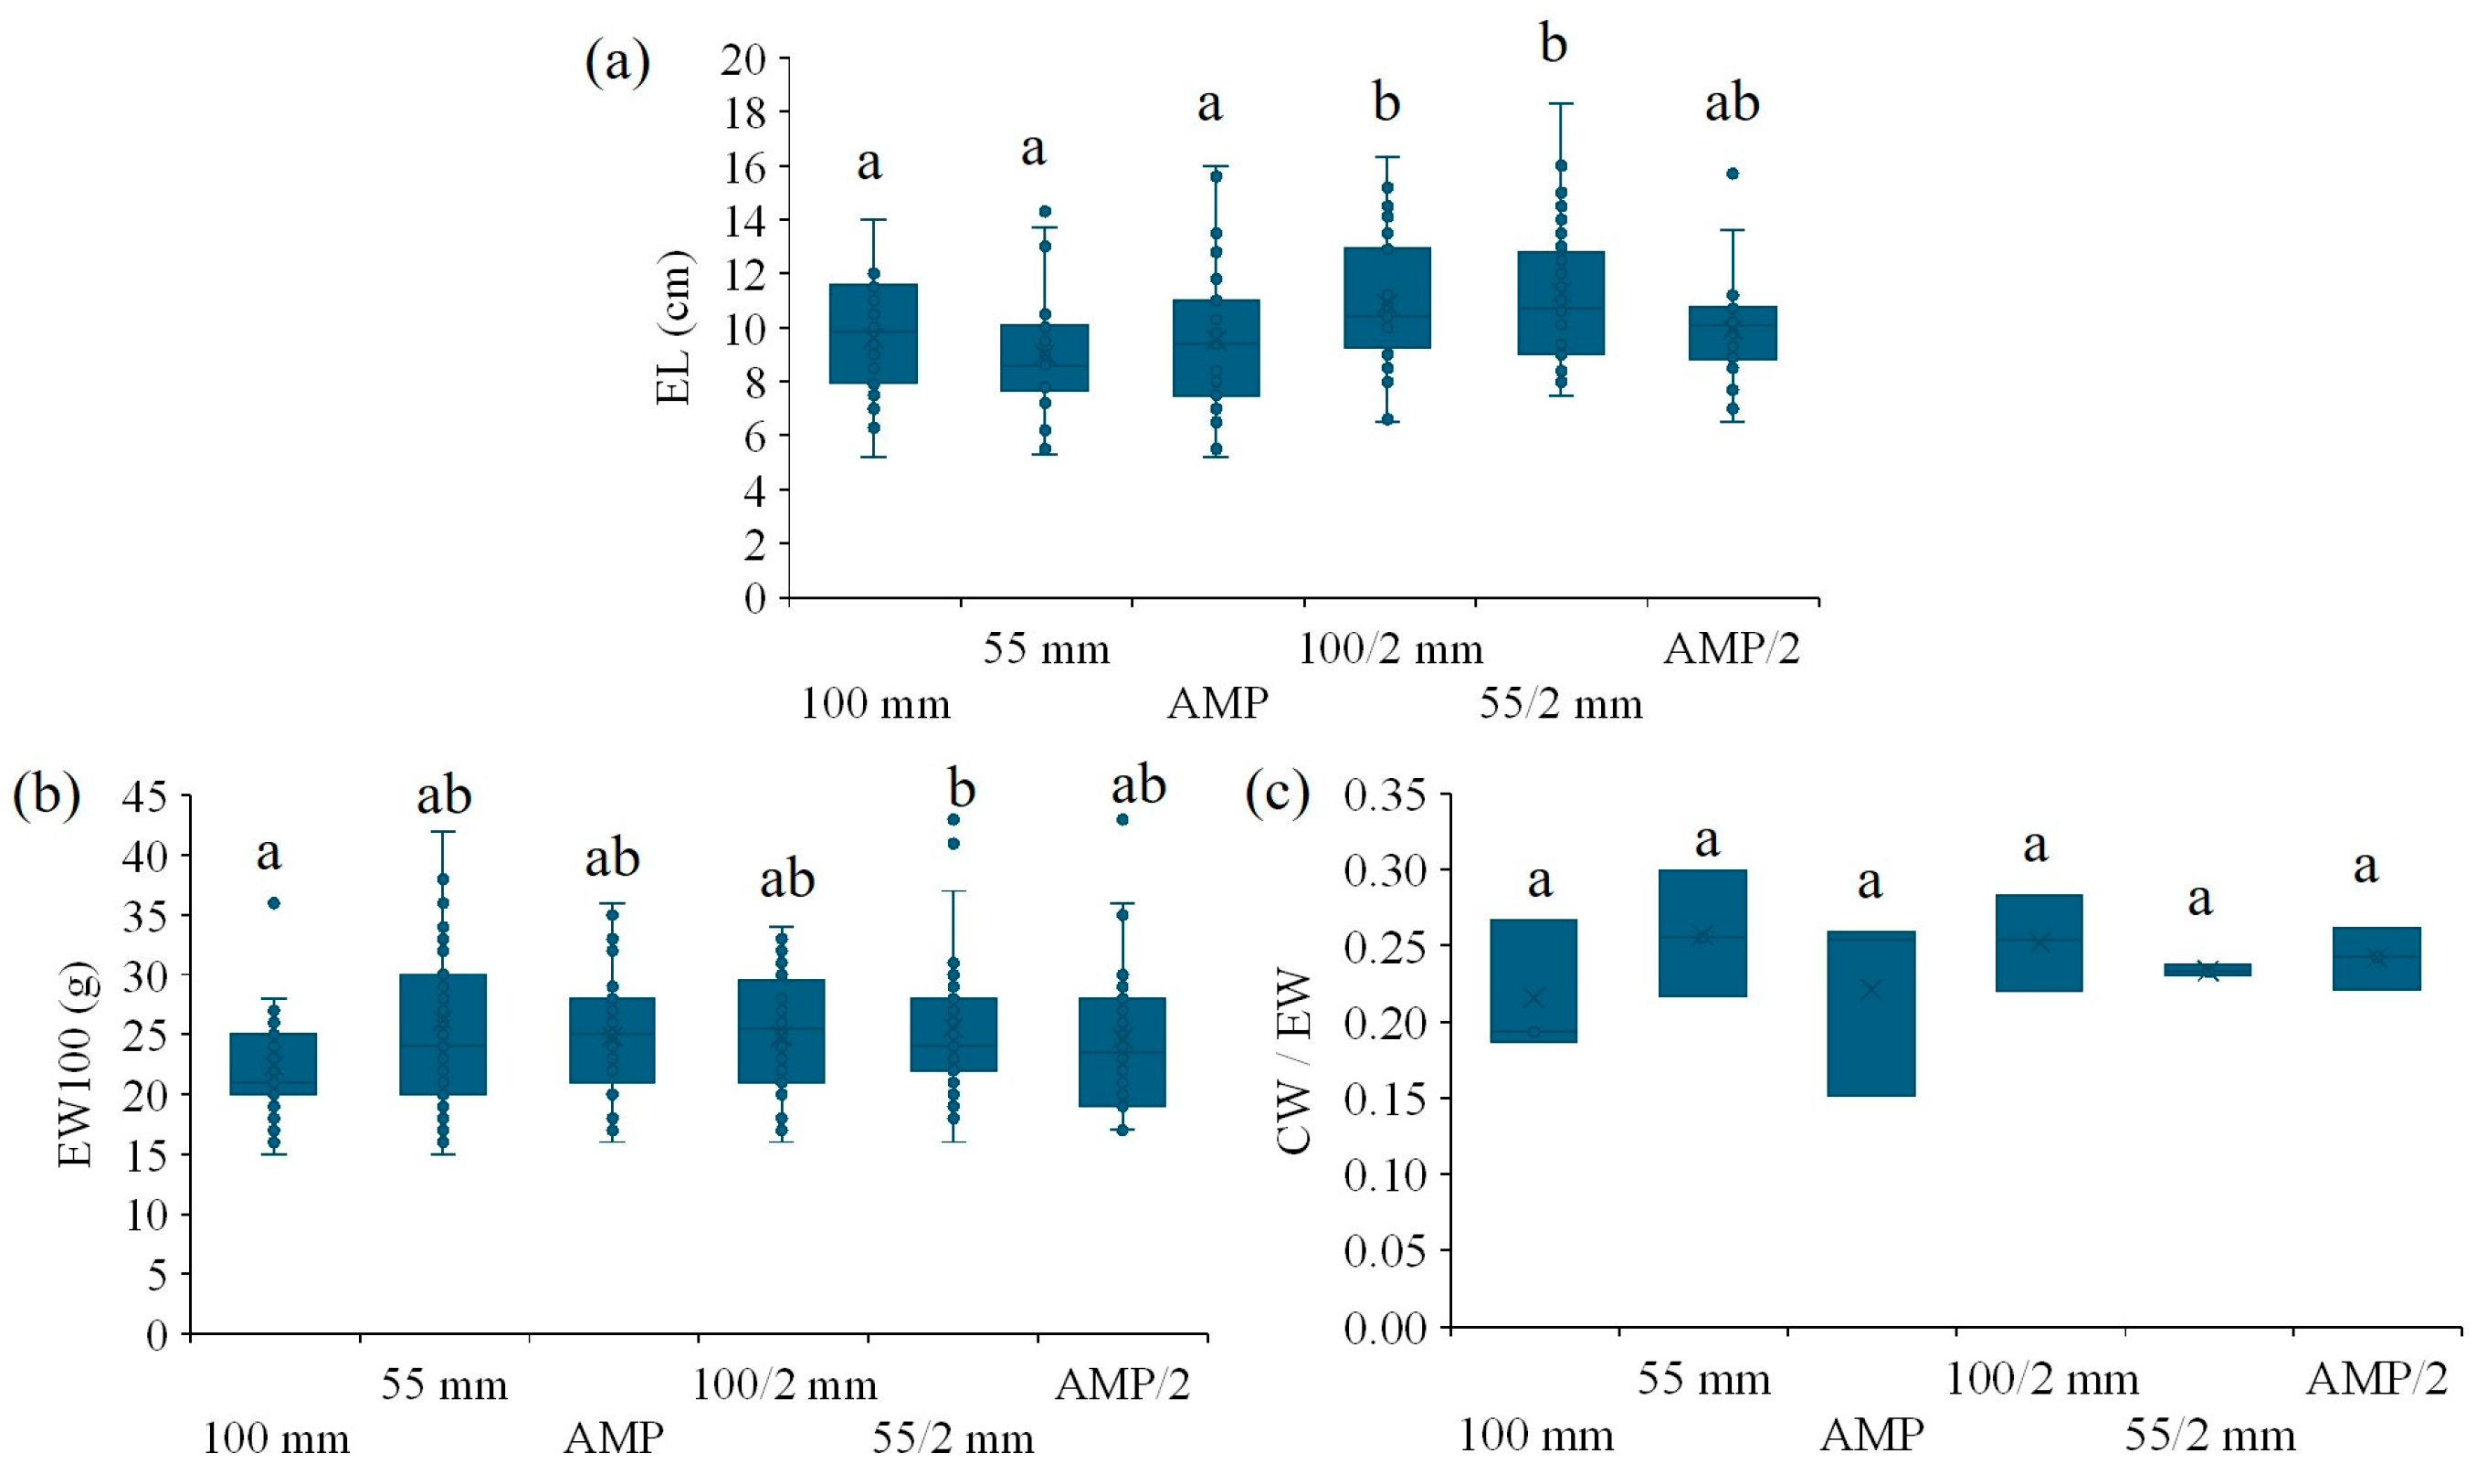
Ear length (EL) displayed significant differences across the plots (Figure 6a, p ≤ 0.05). Plots irrigated twice a week have higher median EL than plots irrigated once a week (10.1–10.7 cm vs. 8.6–9.9 cm), although the EL values are only significantly higher for 100/2 mm and 55/2 mm. In fact, the correlation between EL and irrigation frequency is significant, although rather low (r = 0.281, p ≤ 0.001; Table 3). Despite the general trend for decreasing EL with decreasing water volume (Figure 6a), no significant correlation was identified (p > 0.05, Table 3). A study by Payero et al. [48] found that maize under 50% of optimal irrigation had ear lengths reduced by over 20%. However, given that higher yields were observed in treatments with lower irrigation volumes (see Section 3.4), it does not appear that the amount of water applied limited EL. Nevertheless, water stress during silking and tasseling (flowering) stages is crucial for ear development, and can reduce ear elongation [49]. However, since flowering occurred in early August (based on field observations), and considering the lowest volumes of water applied in the AMP treatment (Figure 3b), which are adjusted based on weather conditions and crop development stage, we do not expect that water stress limited EL. Since ear length is largely established during later vegetative development stages, the storm event recorded in early September is not expected to impact this phenotypic trait. Generally, the EL values recorded in our study are slightly lower than typical traditional varieties (10–20 cm), possibly due to the low-input farming and hybrid maize varieties (15–25 cm) [50].
Ear weight (EW) did not exhibit a consistent trend in response to the irrigation treatments, although significantly lower EW100 values were recorded in the 100 mm treatment and higher values in the 55/2 mm treatment (p < 0.05; Figure 6b). While irrigation treatment does not appear to have directly influenced ear weight, the results may have been masked by the storm event, which occurred during the grain filling stage and may have impaired photosynthetic efficiency. However, selected plots for plant assessment have excluded the spots of fallen plants observed after the storm, minimizing the impact of the storm on phenotypic trail results. Nevertheless, limited nitrogen availability—reflected by the relatively low soil concentrations recorded at the beginning of the cropping season (Table 2)—may have constrained this physiological trait. Nitrogen limitation may also explain the similar CW/EW results between the treatment plots (p > 0.05, Figure 6c). However, the CW/EW values are within the typical values (18–25%) for maize [51], and within the values previously reported for Pigarro maize variety (12–38%) [52].

3.3.3. Kernel Weight and Number

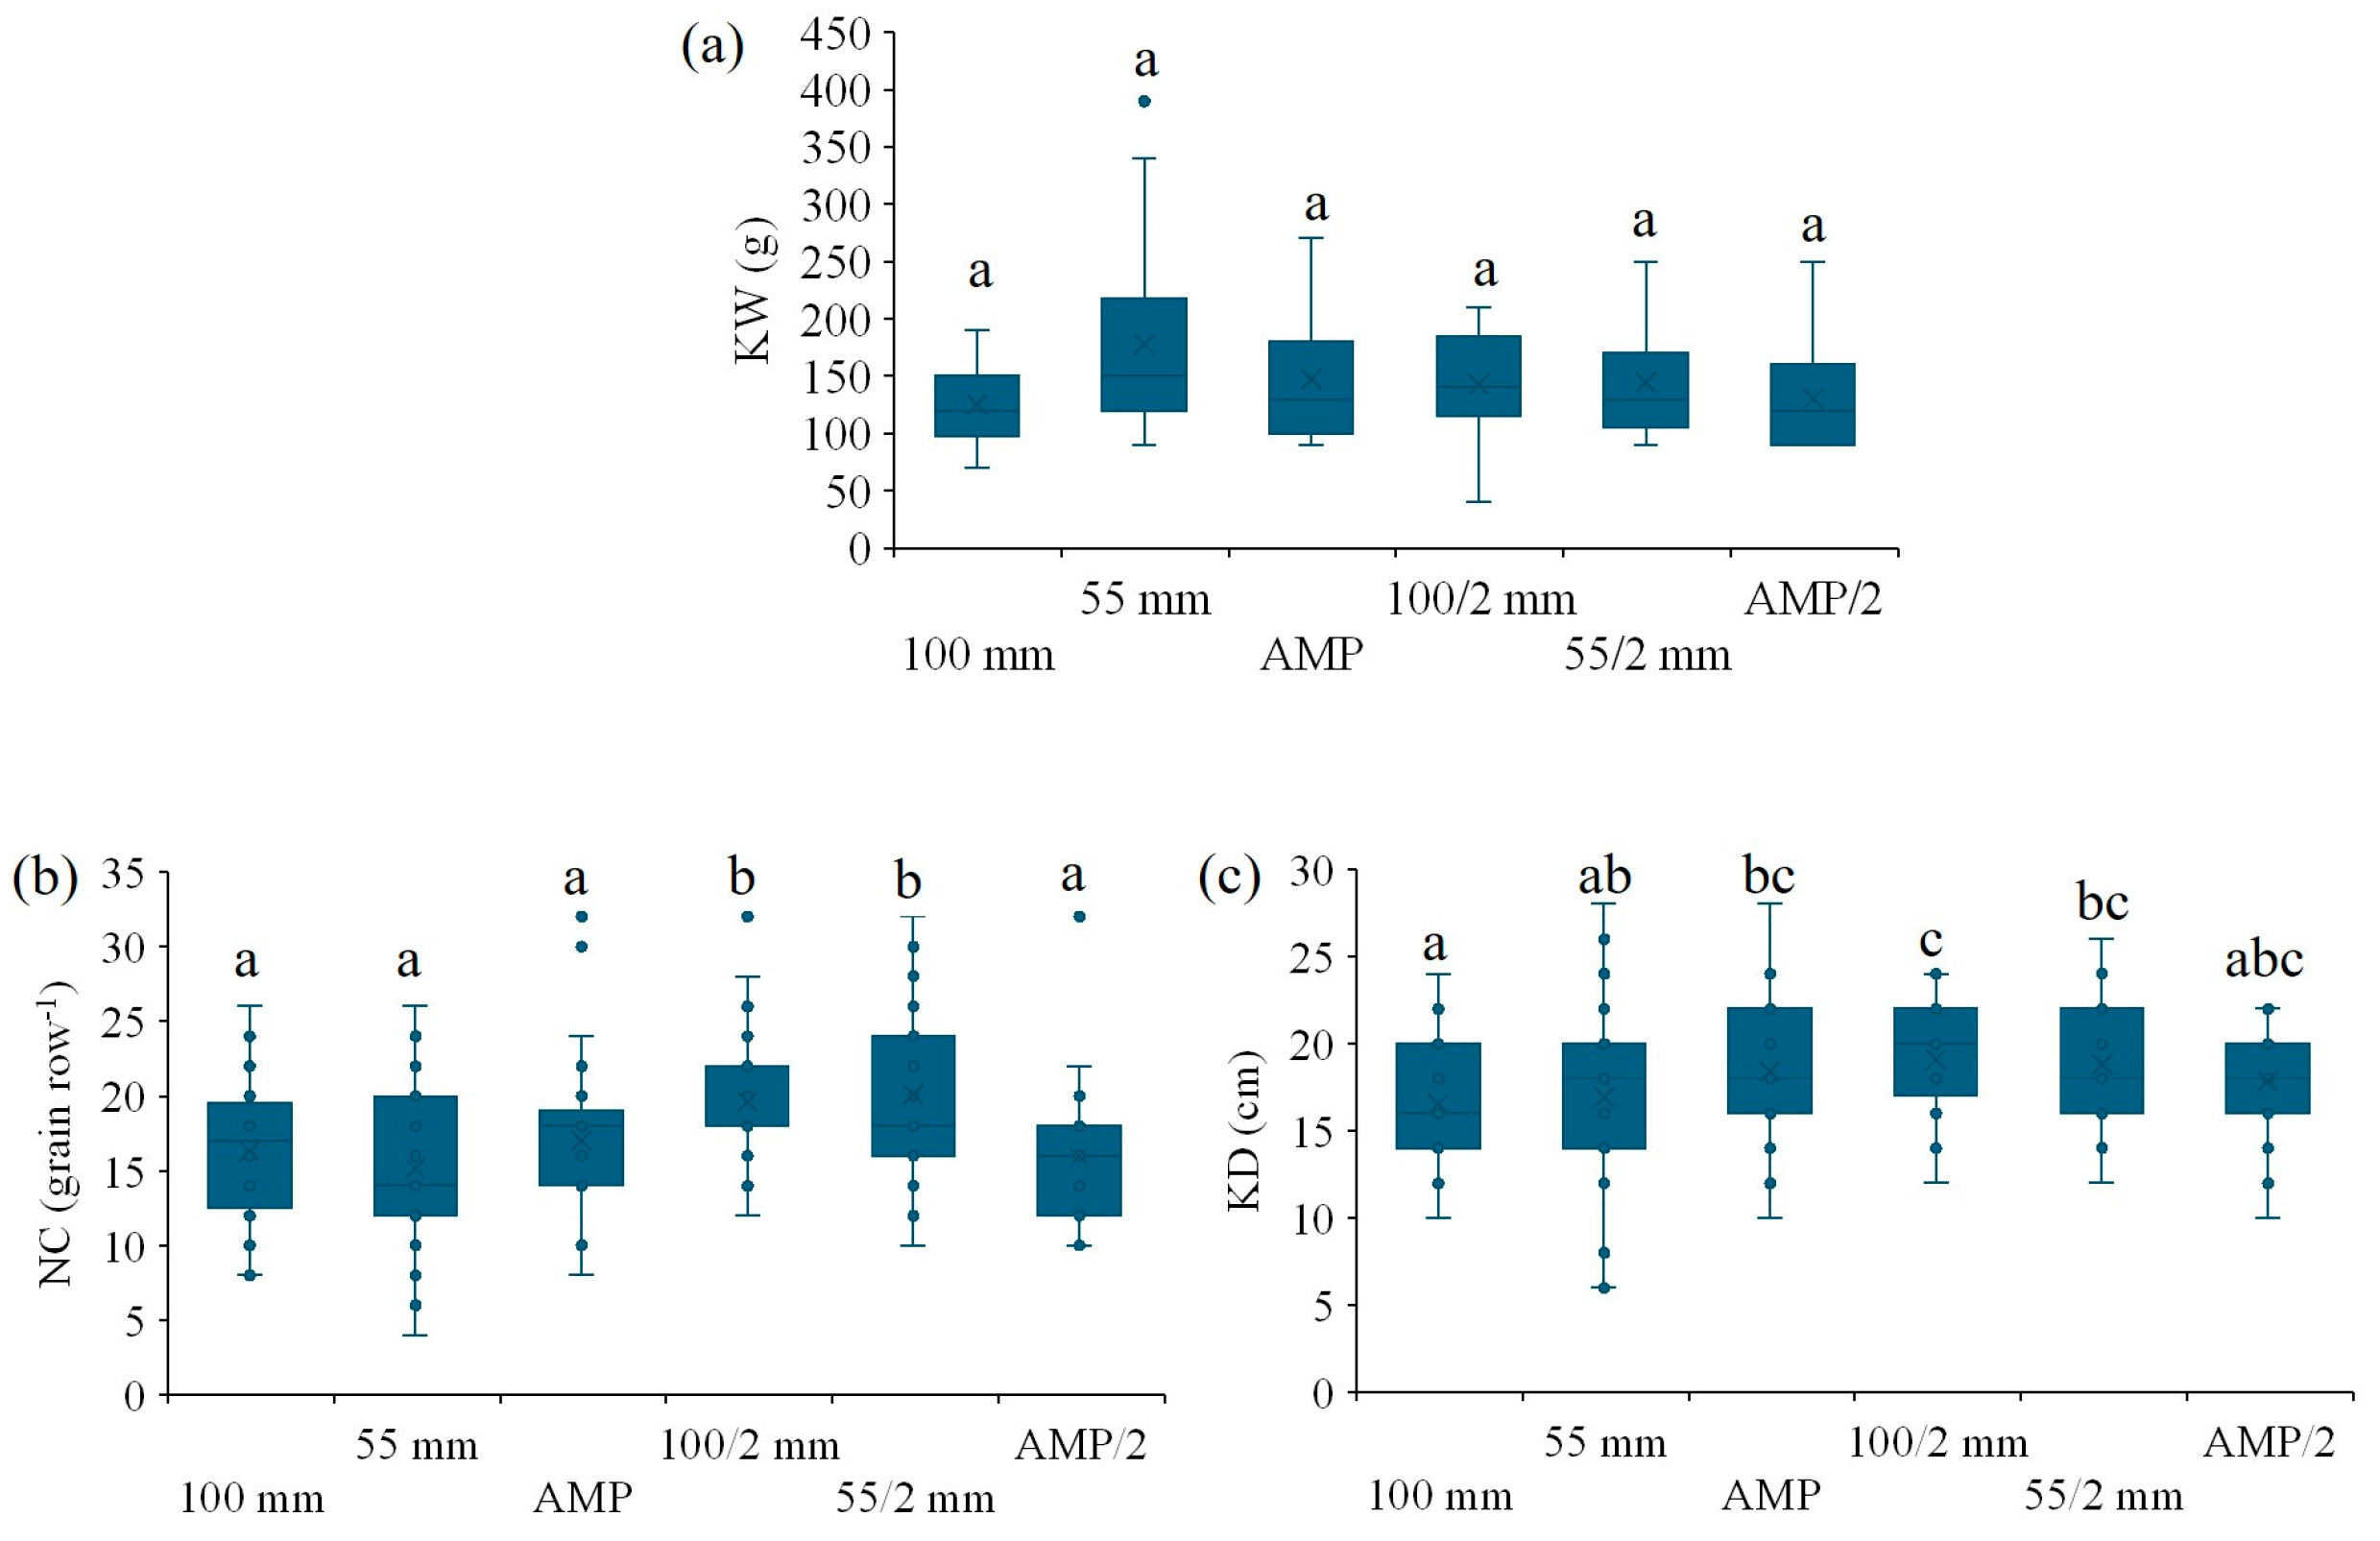
Kernel weight (KW) was not significantly different across plots (p > 0.05), despite the higher values recorded in 55 mm plots (median value of 150 g ear−1) and the lower values in AMP/2 (120 g ear−1) (Figure 7a). Although there is a general trend of a slight decrease in KW with a decreasing volume of water, particularly in the treatment with irrigation twice per week, there is no significant correlation between both irrigation volume and frequency with KW (p > 0.05, Table 3). Similarly to EW, KW does not appear to have been limited by water availability during the silking and grain filling stages (see Section 3.3.2), which are critical periods for KW determination. However, KW may have been influenced by factors such as photosynthetic activity—potentially reduced by the storm event—which governs assimilate supply, as well as by nitrogen availability, which is essential for supporting grain filling [49]. KW has a significant negative correlation with EL and CW, despite the rather week values (r = −0.341 and −0.271, p ≤ 0.001; Table 3). KW has a high contribution to EW, since the median ratio CW/EW ranges from 0.19 to 0.26 (Figure 6c), without significant differences across plots (p > 0.05).
Contrary to KW, significant differences in NC across the treatments were recorded (Figure 7b), with higher values in 100/2 mm and 55/2 mm (median values of 18 grains row−1 in both) than in the other treatments (14–17 grains row−1). In fact, NC was positively correlated with both irrigation volume (r = 0.153, p ≤ 0.05; Table 3) and frequency (r = 0.213, p ≤ 0.01; Table 3). This supports previous studies reporting that NC is highly responsive to water availability [53]. NC was also positively correlated with CW (r = 0.500, p ≤ 0.01; Table 3), which was expected since CW depends on NC and the ability to fill them with dry matter [54]. Nevertheless, as expected, NC values are lower than typically recorded in hybrid maize varieties (31 grains row−1) [55]. This is linked with the relatively small EL recorded (Figure 6a), as denoted by the positive correlation between NC and EL (r = 0.739, p ≤ 0.01; Table 3).
KD also exhibits significant differences between plots (Figure 7c), with higher values in 100/2 mm and lower values in 100 mm (20 cm vs. 16 cm), and a positive correlation with irrigation frequency (r = 0.172, p ≤ 0.05; Table 3). Shallow kernels often indicate post-pollination stress (e.g., drought or nutrient deficiency), which limits starch deposition [53]. The results show that KD is positively correlated with CW (r = 0.322, p ≤ 0.01) and NC (r = 0.195, p ≤ 0.01) as expected, since it reflects the plant’s ability to mobilize assimilates to the developing grain during grain-filling stages. While NC reflects reproductive phase success, KD reflects grain-filling success [54].

3.4. Grain Yield and Water Use Efficiency

3.4.1. Grain Yield

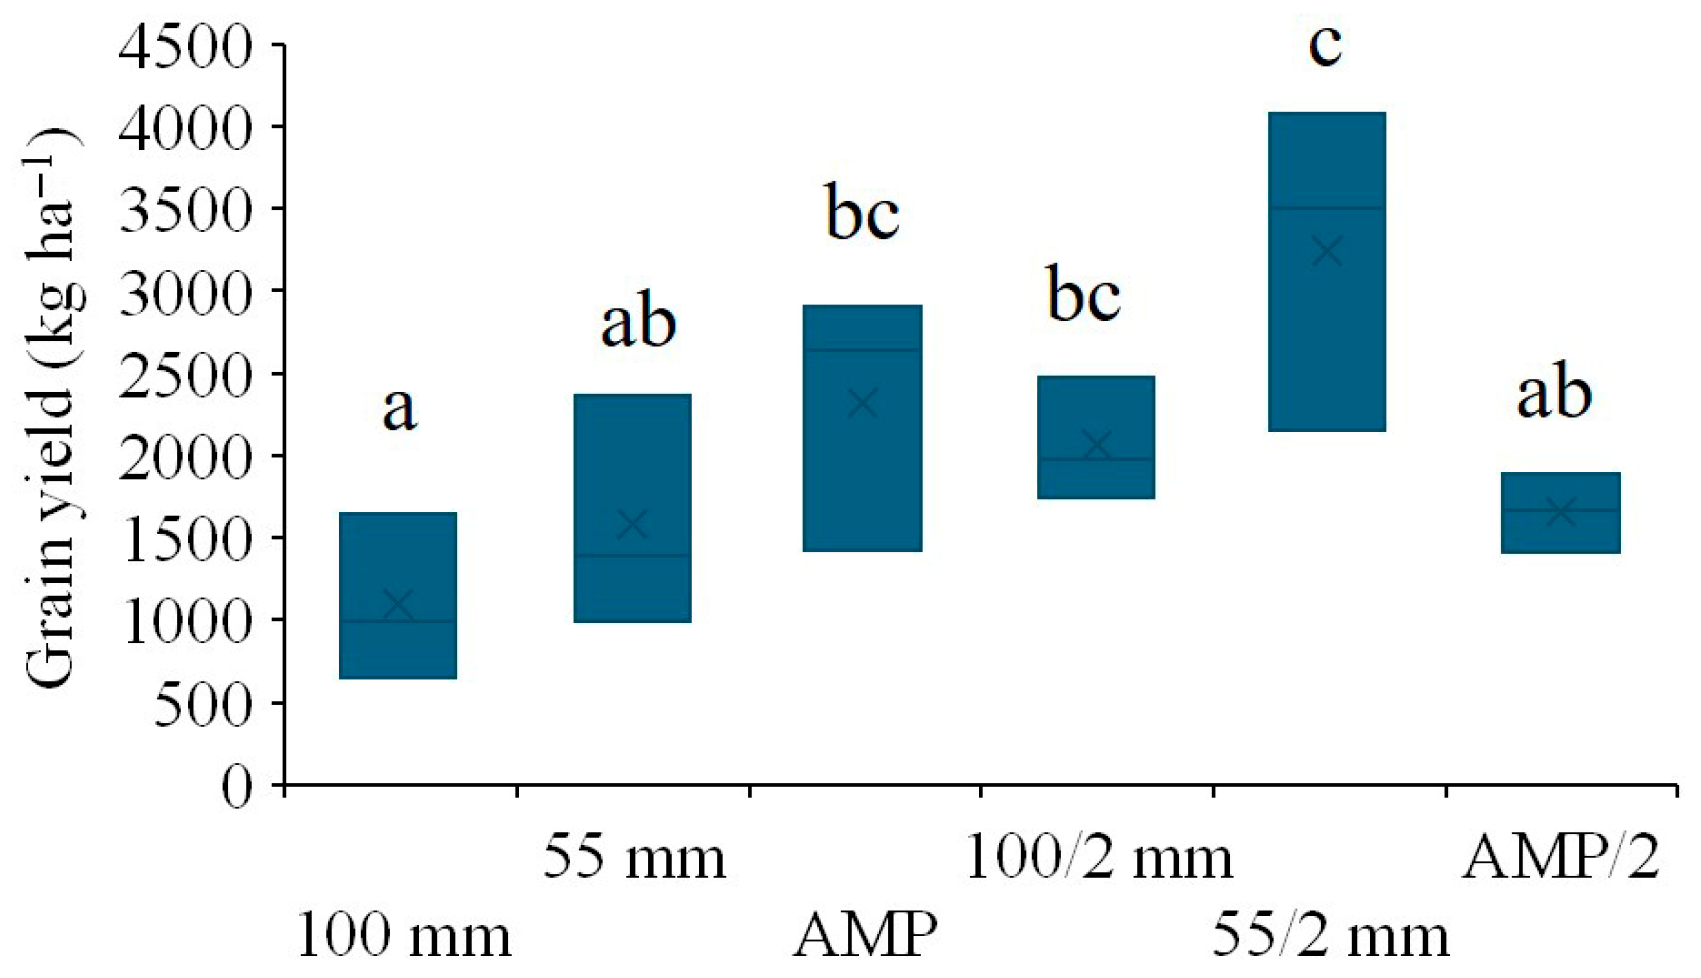
Grain yield varied significantly across plots, with higher values in 55/2 mm (3504 kg ha−1) and lower values in 1000 mm (996 kg ha−1) (p ≤ 0.05; Figure 8). Although water availability influences GY by affecting Near, as indicated by a strong positive correlation (r = 0.872, p ≤ 0.001; Table 3), and is also known to impact NC and KW [56,57], our results did not show significant correlations between GY and either NC or KW (p > 0.05; Table 3). Furthermore, no significant correlation was observed between GY and the total volume of irrigation applied (p > 0.05; Table 3). This may be explained by the fact that all treatments likely provided sufficient water to meet the crop’s developmental needs. Notably, the treatments designed to simulate water scarcity (55 mm and 55/2 mm) delivered higher total irrigation volumes than those adjusted according to crop requirements throughout the season (AMP and AMP/2)—both over the full cropping period (490 mm vs. 369 mm) and during individual weekly irrigation events (Figure 3b). Furthermore, water stress is commonly associated with reduced plant growth [55]; however, in our study, irrigation volume did not significantly influence plant height (Figure 4a), suggesting that water availability was generally adequate. In contrast, the 100 mm treatment appears to have supplied excess water, which was associated with lower GY (Figure 9). This outcome may be attributed to nutrient leaching—particularly of nitrogen—beyond the root zone, thereby limiting its availability for vegetative and reproductive growth [58]. While GY typically increases with greater irrigation, excessive water input beyond the crop’s requirements can cause yield gains to plateau or even decline [59].
GY showed a positive correlation with plant height (0.559, p ≤ 0.05; Table 3), as reported in previous studies [54]. In most crops, higher biomass production is associated with higher yield, as more resources (nutrients and water) are allocated to reproductive organs [60]. However, although plant height was positively correlated with irrigation frequency (r = 0.358, p ≤ 0.001), and despite exhibiting marginally higher values in plots irrigated twice than once a week (Figure 8), no significant correlation was identified between GY and irrigation frequency (p > 0.05, Table 3). Shorter but more frequent irrigation may support surface soil moisture for longer periods, allowing better absorption by surface roots, thus avoiding water stress from plants [59]. However, this type of irrigation may favor surface root development instead of deep roots, making the plant more vulnerable to droughts [61] or sudden storms. Nevertheless, in this study, where there is no evidence of water stress, irrigation twice per week, as opposed to once, was associated with increases in EL, CW, and NC (r = 0.281, r = 0.274, and r = 0.213, respectively, p ≤ 0.001).
GY results also reflect the influence of the low-input agricultural system used in this study (i.e., no fertilization), as well as the impact of the storm event, which caused plant breakage within the plots, and may have obscured the effects of the irrigation treatments. This damage, observed immediately after the storm, likely contributed to the reduced number of ears recorded per plot (Figure 5). Indeed, GY showed a significant positive correlation with both R and S, with correlation coefficients of r = 0.528 and r = 0.490, respectively (p ≤ 0.05; Table 3). Nevertheless, the GY values recorded across treatments are consistent with those previously reported for traditional maize landraces cultivated in the Central Region of Portugal [52]. In contrast, the average yield for commercial maize hybrids grown in the Lower Mondego Valley is 14.5 Mg ha−1 [62], while typical maize yields in the Mediterranean region under adequate irrigation and fertilization range from 10 to 12 Mg ha−1 [28]. Traditional varieties generally produce lower yields than hybrids, as the latter are bred specifically for high productivity and improved resistance to, e.g., drought, plagues, and diseases [61].

3.4.2. Water Use Efficiency

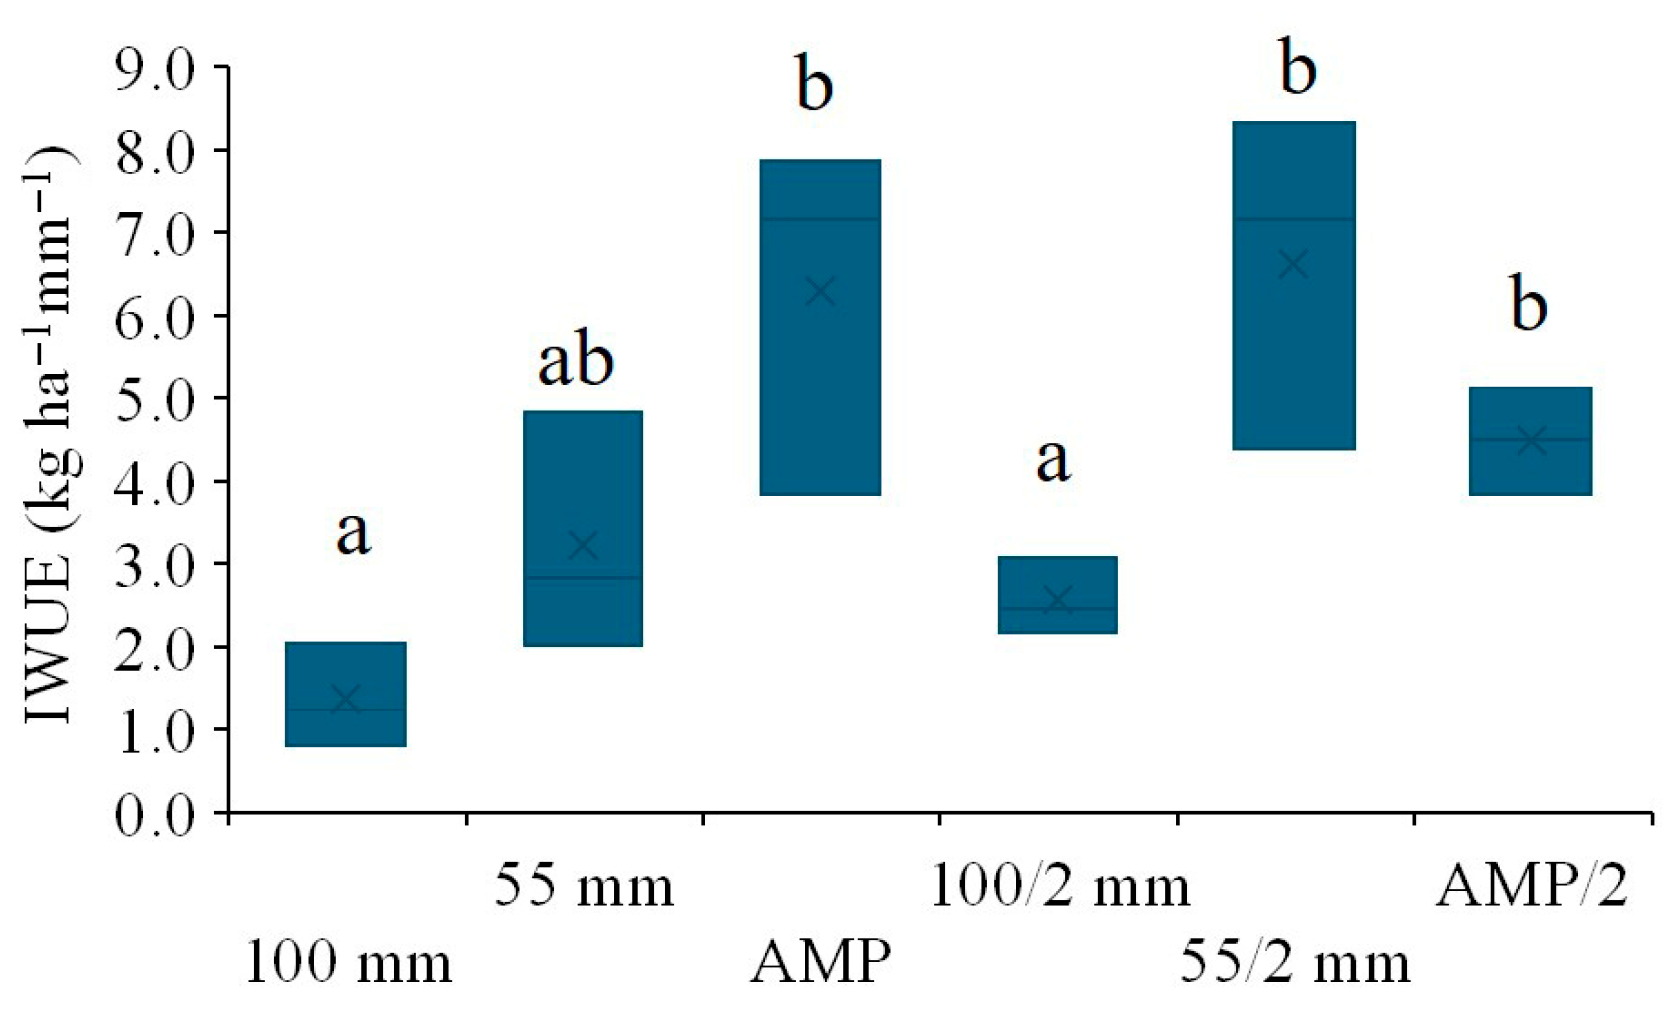
Irrigation treatments have also affected IWUE, with the lowest values observed in plots receiving the highest irrigation volumes, regardless of irrigation frequency (median values of 1.24 kg ha−1 mm−1 in 100 mm and 2.45 kg ha−1 mm−1 in 100/2 mm, p ≤ 0.05) (Figure 9). Conversely, the highest IWUE values were recorded in the AMP (7.16 kg ha−1 mm−1) and 55/2 mm (7.15 kg ha−1 mm−1) treatments. These results indicate that no significant water stress occurred during the study period across the different treatments. Typically, yield increases linearly with irrigation up to an optimal point, beyond which excessive water input can lower water use efficiency without additional yield gains [57]. Water deficits generally reduce evapotranspiration by limiting stomatal conductance [63]. Our results also show a significant correlation between IWUE and Nears (r = 0.816, p < 0.001), an indicator of grain productivity [62], as well as GY (r = 0.827, p ≤ 0.001).
While our study did not find significant differences in IWUE related to weekly irrigation frequency (p > 0.05, Table 3), previous research has shown that irrigation timing can significantly influence both IWUE and GY [48]. Irrigation scheduling should be flexible and responsive to crop needs (function of the development stages) and environmental conditions, rather than based on fixed calendar intervals [48,55]. For instance, during emergence and early leaf development, daily water use seldom exceeds 2.5 mm; however, during flowering and grain filling, it can rise to 6.5–7.5 mm per day, depending on climatic conditions [10]. Our IWUE values were notably lower than those reported in maize crops grown in semi-arid regions of China, where values reached 32.0 and 58.1 kg ha−1 mm−1 using hybrid cultivars [63]. This is consistent with the lower GY observed in our study compared to that of hybrid cultivars.
Overall, this study demonstrates that applying irrigation volumes slightly above the weekly water balance recommendation (AMP), specifically the 55 mm/week treatment split into two applications (55/2 mm), constitutes the most effective drip irrigation strategy for optimizing irrigation IWUE, GY, plant height, and all assessed ear traits. Implementing this strategy under real farming conditions in the region requires a transition from conventional systems—primarily furrow irrigation—to more efficient technologies such as drip irrigation. While furrow systems typically achieve irrigation efficiencies of only 45–65%, center pivot systems reach 75–85%, and drip irrigation can exceed 85–95% efficiency [64]. To fully leverage these benefits, drip systems should be equipped with programmable controllers capable of delivering precise and frequent water applications. Moreover, effective implementation depends on access to localized, real-time data on crop water requirements and weather conditions to prevent both under- and over-irrigation. Ideally, farms should be equipped with sensor networks capable of monitoring soil moisture and crop water stress, allowing dynamic adjustment of both irrigation volumes and scheduling. Integrating these systems with decision-support tools and weather forecasts could further enhance irrigation efficiency and crop resilience under climate variability. However, adoption of such precision irrigation technologies may be hindered by barriers including high upfront costs, technical complexity, and limited familiarity among farmers. As a more accessible alternative, collaboration with agricultural advisory services such as ANPROMIS offers a practical pathway. These services can provide farmers with weekly irrigation recommendations tailored to crop development stages and local climatic conditions. Nonetheless, to ensure widespread adoption, it is essential to invest in farmer training programs that address the technical, financial, and knowledge-related constraints associated with optimized irrigation management.

3.5. Limitations and Future Research Directions

This study provides valuable insights into the effects of irrigation volume and frequency on the phenotypic traits and productivity of a traditional maize landrace under low-input conditions in central Portugal. However, some limitations should be acknowledged. The experiment was conducted at a single site and during a single growing season. This may limit the generalizability of the results given the interannual weather variability. In fact, the experiments were affected by the occurrence of a storm event later in the cropping season, which resulted in physical damage to the maize plants. This external disturbance likely masked some treatment effects, particularly regarding the number of broken plants, ear number, and grain yield. Another limitation of the study concerns the low-input farming conditions where the treatments were implemented. Although the minimum use of fertilizers or chemical inputs used in the experimental farm aligns with the goals of sustainable agriculture, the absence of nutrient supplementation may have interacted with irrigation volume, affecting plant development. Additionally, delays in the start of the irrigation treatments, due to logistical constraints with equipment installation, required supplemental irrigation prior to treatment initiation, potentially confounding the early effects of differential water management. The late irrigation start may have affected crop development. Furthermore, the scope of measured variables focused on above-ground morphological and yield traits. Other physiological indicators, such as leaf water potential, stomatal conductance, or chlorophyll content, as well as below-ground root characteristics, were not assessed. These indicators would support understanding of how irrigation treatments influence maize growth and resource allocation.
Given these constraints, future research should aim to conduct multi-site and multi-season trials to validate and extend the current findings under a broader range of environmental conditions. Comparative studies involving both traditional landraces and commercial hybrids would also be beneficial to evaluate the consistency of irrigation responses across genotypes. Integration of continuous soil moisture monitoring, nutrient dynamics assessments, and detailed physiological measurements would allow for a more comprehensive understanding of the interactions between irrigation, nutrient uptake, and plant development. These efforts can contribute to the refinement of irrigation practices that enhance water use efficiency, support climate resilience, and promote the viability of traditional maize varieties in Mediterranean agroecosystems.

4. Conclusions

This study explores the impact of three irrigation treatments on maize development and productivity. Each treatment was applied either once or twice per week using drip irrigation. We found that irrigation management significantly influences plant growth, specific ear traits, and grain yield under low-input farming conditions in central Portugal. In terms of ear traits, irrigation significantly influenced parameters such as the number of ears, kernel depth, and the number of kernels per row, but had no significant effect on traits like the weight of 100 ears or the cob-to-ear weight ratio. The varying responses of individual traits to irrigation treatments suggest that identifying optimal irrigation practices for improving the commercial value of traditional maize varieties warrants further investigation.
The irrigation volume did not significantly affect plant height; however, applying water twice per week promoted taller plants compared to single weekly applications, likely due to more stable soil moisture levels. Also, the total irrigation volume did not show a direct relationship with grain yield. The most effective strategy combined moderate irrigation (55 mm/week) with twice-weekly applications, leading to the highest grain yields and irrigation water use efficiency. In contrast, the highest irrigation volume (100 mm/week) resulted in reduced yields, likely due to nutrient leaching. These findings underscore the importance of optimizing irrigation frequency to enhance crop performance without increasing water input.
Finally, while maize landraces are often praised for their resilience to local environmental conditions, this study highlights their vulnerability to extreme weather events, such as storms, particularly in low-input systems lacking genetic or structural protections. Overall, these findings provide valuable guidance for developing sustainable irrigation strategies in Mediterranean agriculture, promoting both water use efficiency and the preservation of traditional maize varieties.

Author Contributions

Conceptualization, C.S.S.F. and M.T.H.; data curation, A.F.P. and A.P.; formal analysis, C.S.S.F. and A.F.P.; funding acquisition, C.S.S.F.; investigation, C.S.S.F., A.F.P. and A.P.; methodology, C.S.S.F. and M.T.H.; project administration, C.S.S.F. and P.M.-M.; supervision, C.S.S.F.; writing—original draft, C.S.S.F. and A.F.P.; writing—review and editing, A.P., P.M.-M. and M.T.H. All authors have read and agreed to the published version of the manuscript.

Funding

This research was funded by the Portuguese Foundation for Science and Technology, P.I., through the research project PTDC/EEI-ROB/2459/2021 and the institutional scientific employment program–contract CEECINST/00077/2021 of Carla Ferreira.

Institutional Review Board Statement

Not applicable.

Informed Consent Statement

Not applicable.

Data Availability Statement

The data used in this study is available upon request.

Acknowledgments

The authors gratefully acknowledge Cristiano Premebida, coordinator of the PTDC/EEI-ROB/2459/2021 project, for the possibility to develop this study, and Luis Miguel Valério, Service Coordinator of the Technical-Pedagogical Support Unit at the Higher School of Agriculture, Polytechnic Institute of Coimbra and Pedro Soares for their technical support during the implementation of the experimental plots.

Conflicts of Interest

The authors declare no conflict of interest.

References

  1. FAOSTAT Agricultural Production Statistics 2000–2022. 2022. Available online: https://www.fao.org/statistics/highlights-archive/highlights-detail/agricultural-production-statistics-(2000-2022)/en (accessed on 15 November 2024).
  2. Hammad, H.M.; Chawla, M.S.; Jawad, R.; Alhuqail, A.; Bakhat, H.F.; Farhad, W.; Khan, F.; Mubeen, M.; Shah, A.N.; Liu, K.; et al. Evaluating the Impact of Nitrogen Application on Growth and Productivity of Maize Under Control Conditions. Front. Plant Sci. 2022, 13, 885479. [Google Scholar] [CrossRef]
  3. ANPROMIS. Área de Culturas Arvenses em Portugal Continental (2018 a 2024). Available online: https://anpromis.pt/dados-estatisticos/19-area-de-culturas-arvenses-em-portugal.html (accessed on 17 July 2025). (In Portuguese).
  4. Boone, L.; De Meester, S.; Vandecasteele, B.; Muylle, H.; Roldán-Ruiz, I.; Nemecek, T.; Dewulf, J. Environmental life cycle assessment of grain maize production: An analysis of factors causing variability. Sci. Total Environ. 2016, 553, 551–564. [Google Scholar] [CrossRef]
  5. Kumar, D.; Jhariya, A.N. Nutritional, medicinal and economical importance of corn: A mini review. Res. J. Pharm. Sci. 2013, 2, 7–8. [Google Scholar]
  6. Aghaei, S.; Alavijeh, M.K.; Shafiei, M.; Karimi, K.A. comprehensive review on bioethanol production from corn stover: Worldwide potential, environmental importance, and perspectives. Biomass Bioenergy 2022, 161, 106447. [Google Scholar] [CrossRef]
  7. Lobell, D.B.; Schlenker, W.; Costa-Roberts, J. Climate trends and global crop production since 1980. Science 2011, 333, 616–620. [Google Scholar] [CrossRef] [PubMed]
  8. Hatfield, J.L.; Prueger, J.H. Temperature extremes: Effect on plant growth and development. Weather Clim. Extrem. 2015, 10, 4–10. [Google Scholar] [CrossRef]
  9. Zhao, J.; Marek, T.H.; Liu, K.; Harrison, M.T.; Xue, Q. Drought tolerant maize hybrids have higher yields and lower water use under drought conditions at a regional scale. Agric. Water Manag. 2022, 274, 107978. [Google Scholar] [CrossRef]
  10. de Oliveira, L.A.; de Miranda, J.H.; Cooke, R.A. Water management for sugarcane and corn under future climate scenarios in Brazil. Agric. Water Manag. 2018, 201, 199–206. [Google Scholar] [CrossRef]
  11. Piati, G.; Ferreira de Lima, S.; Lustosa Sobrinho, R.; dos Santos, O.F.; Vendruscolo, E.P.; Jacinto de Oliveira, J.; do Nascimento de Araújo, T.A.; Mubarak Alwutayd, K.; Finatto, T.; AbdElgawad, H. Biostimulants in Corn Cultivation as a Means to Alleviate the Impacts of Irregular Water Regimes Induced by Climate Change. Plants 2023, 12, 2569. [Google Scholar] [CrossRef]
  12. Vargas-Amelin, E.; Pindado, P. The challenge of climate change in Spain: Water resources, agriculture and land. J. Hydrol. 2014, 518, 243–249. [Google Scholar] [CrossRef]
  13. Piscitelli, L.; Colovic, M.; Aly, A.; Hamze, M.; Todorovic, M.; Cantore, V.; Albrizio, R. Adaptive agricultural strategies for facing water deficit in sweet maize production: A case study of a semi-arid mediterranean region. Water 2021, 13, 3285. [Google Scholar] [CrossRef]
  14. Fekonja, M.; Bavec, F.; Grobelnik-Mlakar, S.; Turinek, M.; Jakop, M.; Bavec, M. Growth performance of sweet maize under non-typical maize growing conditions. Biol. Agric. Hortic. 2011, 27, 147–164. [Google Scholar] [CrossRef]
  15. Rolim, J.; Paço, T.; Rolim, J. Climate Change Impacts on Irrigation Water Requirements under Mediterranean Conditions—A Review of the Methodological Approaches Focusing on Maize Crop. Agronomy 2023, 13, 117. [Google Scholar]
  16. Baum, M.E.; Licht, M.A.; Huber, I.; Archontoulis, S.V. Impacts of climate change on the optimum planting date of different maize cultivars in the central US Corn Belt. Eur. J. Agron. 2020, 119, 126101. [Google Scholar] [CrossRef]
  17. Couto, A.; Padín, A.R.; Reinoso, B. Comparative yield and water use efficiency of two maize hybrids differing in maturity under solid set sprinkler and two different lateral spacing drip irrigation systems in León, Spain. Agric. Water Manag. 2013, 124, 77–84. [Google Scholar] [CrossRef]
  18. Bwambale, E.; Abagale, F.K.; Anornu, G.K. Smart irrigation monitoring and control strategies for improving water use efficiency in precision agriculture: A review. Agric. Water Manag. 2022, 206, 107624. [Google Scholar] [CrossRef]
  19. Ferreira, C.S.S.; Soares, P.R.; Guilherme, R.; Vitali, G.; Boulet, A.; Harrison, M.T.; Malamiri, H.; Duarte, A.; Kalantari, Z.; Ferreira, A.J.D. Sustainable Water Management in Horticulture: Problems, Premises, and Promises. Horticulture 2024, 10, 951. [Google Scholar] [CrossRef]
  20. Hassanli, A.M.; Ebrahimizadeh, M.A.; Beecham, S. The effects of irrigation methods with effluent and irrigation scheduling on water use efficiency and corn yields in an arid region. Agric. Water Manag. 2009, 96, 93–99. [Google Scholar] [CrossRef]
  21. Széles, A.; Huzsvai, L.; Mohammed, S.; Nyéki, A.; Zagyi, P.; Horváth, E.; Simon, K.; Arshad, S.; Tamás, A. Precision agricultural technology for advanced monitoring of maize yield under different fertilization and irrigation regimes: A case study in Eastern Hungary (Debrecen). J. Agric. Food Res. 2024, 15, 100967. [Google Scholar] [CrossRef]
  22. Sharafkhane, M.; Ziaei, A.; Naghedifar, S.; Akbari, A.; Verdi, A. AquaCrop Plug-in-PSO: A novel irrigation scheduling optimization framework for maize to maximize crop water productivity using in-season weather forecast and crop yield estimation. Agric. Water Manag. 2024, 306, 109453. [Google Scholar] [CrossRef]
  23. Jahangirlou, M.; Akbari, G.; Alhdadi, I.; Soufizadeh, S.; Kumar, U.; Parsons, D. Phenotypic Traits, Grain Yield and Yield Components of Maize Cultivars Under Combinations of Management Practices in Semi-arid Conditions of Iran. Int. J. Plant Prod. 2021, 15, 459–471. [Google Scholar] [CrossRef]
  24. Tao, R.; Zhao, P.; Wu, J.; Martin, N.F.; Harrison, M.T.; Ferreira, C.; Kalantari, Z.; Hovakimyan, N. Optimizing Crop Management with Reinforcement Learning and Imitation Learning. arXiv 2022, arXiv:2209.09991. [Google Scholar]
  25. Amissah, S.; Ankomah, G.; Agyei, B.K.; Lee, R.D.; Harris, G.H.; Cabrera, M.; Franklin, D.H.; Diaz-Perez, J.C.; Habteselassie, M.Y.; Sintim, H.Y. Nutrient Sufficiency Ranges for Corn at the Early Growth Stage: Implications for Nutrient Management. Plants 2023, 12, 713. [Google Scholar] [CrossRef]
  26. Ahmad, I.; Ahmad, B.; Boote, K.; Hoogenboom, G. Adaptation strategies for maize production under climate change for semi-arid environments. Eur. J. Agron. 2020, 115, 126040. [Google Scholar] [CrossRef]
  27. Porcuna-Ferrer, A.; Calvet-Mir, L.; Faye, N.F.; Klappoth, B.; Reyes-García, V.; Labeyrie, V. Drought-tolerant indigenous crop decline in the face of climate change: A political agroecology account from south-eastern Senegal. J. Rural Stud. 2024, 105, 103163. [Google Scholar] [CrossRef]
  28. Costa, J.M.; Tejero, I.F.G.; Zuazo, V.H.D.; da Lima, R.S.N.; Chaves, M.M.; Patto, M.C.V. Thermal imaging to phenotype traditional maize landraces for drought tolerance. Comun. Sci. 2015, 6, 334–343. [Google Scholar] [CrossRef]
  29. Ceccarelli, S.; Grando, S. Decentralized Participatory Plant Breeding: Adapting Crops to Environments and Clients. Ecol. Soc. 2007, 12, 26. [Google Scholar]
  30. Boulet, A.K.; Alarcão, C.; Ferreira, C.; Kalantari, Z.; Veiga, A.; Campos, L.; Ferreira, A.; Hessel, R. Agro-ecological services delivered by legume cover crops grown in succession with grain corn crops in the Mediterranean region. Open Agric. 2021, 6, 609–626. [Google Scholar] [CrossRef]
  31. Moreira, P.M.M.; Pêgo, S.E.; Vaz Patto, C.; Hallauer, A.R. Comparison of selection methods on ‘Pigarro’, a Portuguese improved maize population with fasciation expression. Euphytica 2008, 163, 481–499. [Google Scholar] [CrossRef]
  32. Revilla, P.; Alves, M.L.; Andelković, V.; Balconi, C.; Dinis, I.; Mendes-Moreira, P.; Redaelli, R.; Ruiz de Galarreta, J.I.; Vaz Patto, M.C.; Žilić, S. Traditional foods from maize (Zea mays L.) in Europe. Front. Nutr. 2022, 8, 683399. [Google Scholar] [CrossRef]
  33. Ferreira, C.S.S.; Walsh, R.P.D.; Nunes, J.P.C.; Steenhuis, T.S.; Nunes, M.; de Lima, J.L.M.P.; Coelho, C.O.A.; Ferreira, A.J.D. Impact of urban development on streamflow regime of a Portuguese peri-urban Mediterranean catchment. J. Soils Sediments 2016, 16, 2580–2593. [Google Scholar] [CrossRef]
  34. Santos, M.; Boletins com as Recomendações de Rega Para o Milho. Webinar “Alterações Climáticas e a Cultura do Milho”, ANPROMIS. 2025. Available online: https://www.anpromis.pt/images/Webinar_Alteracoes_Climaticas_2025/Boletins-com-as-Recomendaes-de-Rega-para-o-Milho_Marta-Santos_COTR_compressed_compressed.pdf (accessed on 17 July 2025). (In Portuguese).
  35. Bettencourt, E.; Carolino, S. Descriptores Para O Milho; Bioversity International: Rome, Italy, 2000. [Google Scholar]
  36. Moreira, P.M.; Santos, J.P.; Simões, P.; Santos, J.P.; Vaz Patto, M.C.; Carvalho, V.; Pego, S. Pré-avaliação de Populações de Milhos Regionais da Região Centro. Parâmetros Biométricos e Fitossanitários. In Proceedings of the VII Encontro Nacional de Protecção Integrada, Coimbra, Portugal, 6–7 December 2005; Cunha, M.J., Ed.; pp. 284–296. [Google Scholar]
  37. Chen, X.; Zhang, K.; Gao, X.; Ai, X.; Chen, G.; Guo, X.; Wu, C.; Zhang, L. Effect of irrigation with magnetized and ionized water on yield, nutrient uptake and water-use efficiency of winter wheat in Xinjiang, China. Agric. Water Manag. 2025, 308, 109292. [Google Scholar] [CrossRef]
  38. ISO 10390:2021; Soil, Treated Biowaste and Sludge–Determination of Ph. International Organization for Standardization: Geneva, Switzerland, 2021.
  39. ISO 10694:1995; Determination of Organic and Total Carbon After Dry Combustion (Elementary Analysis). International Organization for Standardization: Geneva, Switzerland, 1995.
  40. Bremner, J. Total nitrogen. Methods Soil Anal. Part 2 Chem. Microbiol. Prop. 1965, 9, 1149–1178. [Google Scholar]
  41. ISO 3696:1987; Water for Analytical Laboratory Use-Specification and Test Methods. International Organization for Standardization: Geneva, Switzerland, 1987.
  42. Panagos, P.; Rosa, D.; Liakos, L.; Labouyrie, M.; Borrelli, P.; Ballabio, C. Soil bulk density assessment in Europe. Agric. Ecosyst. Environ. 2024, 364, 108907. [Google Scholar] [CrossRef]
  43. Wang, X.; Zhou, B.; Sun, X.; Yue, Y.; Ma, W.; Zhao, M. Soil Tillage Management Affects Maize Grain Yield by Regulating Spatial Distribution Coordination of Roots, Soil Moisture and Nitrogen Status. PLoS ONE 2015, 10, e0129231. [Google Scholar] [CrossRef]
  44. Veloso, A.; Sempiterno, C.; Calouro, F.; Rebelo, F.; Pedra, F.; Castro, I.; Gonçalves, M.; Marcelo, M.; Pereira, P.; Fareleira, P.; et al. Manual De Fertilização das Culturas; INIAV–Instituto Nacional de Investigação Agrária e Veterinária, I.P: Oeiras, Portugal, 2022; ISBN 978-972-579-063-2. [Google Scholar]
  45. Carvalho, M.; Lourenço, E. Conservation Agriculture–A Portuguese Case Study. J. Agron. Crop Sci. 2014, 200, 317–324. [Google Scholar] [CrossRef]
  46. Acevedo, M.; Pixley, K.; Zinyengere, N.; Meng, S.; Tufan, H.; Cichy, K.; Bizikova, L.; Isaacs, K.; Kopel, K.; Porciello, J. A scoping review of adoption of climate-resilient crops by small-scale producers in low- and middle-income countries. Nat. Plants 2020, 6, 1231–1241. [Google Scholar] [CrossRef]
  47. Mattila, T.; Hakkinen, L. Exploring the effects of soil structure, nutrients, and farm management on crop root biomass and depth distribution. Field Crops Res. 2025, 327, 109909. [Google Scholar] [CrossRef]
  48. Payero, J.O.; Tarkalson, D.D.; Irmak, S.; Davison, D.; Petersen, J.L. Effect of timing of a deficit-irrigation allocation on corn evapotranspiration, yield, water use efficiency and dry mass. Agric. Water Manag. 2009, 96, 1387–1397. [Google Scholar] [CrossRef]
  49. Otegui, M.E.; Andrade, F.H.; Suero, E.E. Growth, water use, and kernel abortion of maize subjected to drought at silking. Field Crops Res. 1995, 40, 87–94. [Google Scholar] [CrossRef]
  50. Ionunescu, N.; Georgescu, M.; Badea, O.; Podea, M. Variations of current maize (Zea mays L.) cobs by morphological characters. Sci. Pap. 2020, LXIII, 1. [Google Scholar]
  51. Juan, M.; Yan-yong, C.; Zhu, W. Genome-Wide Prediction Analysis for Ear Cob Diameter and Kernel Ratio in Maize. J. Plant Genet. Resour. 2021, 22, 1708–1715. [Google Scholar]
  52. Vaz Patto, M.; Moreira, P.; Carvalho, V.; Pego, S. Collecting maize (Zea mays L. convar. mays) with potential technological ability for bread making in Portugal. Genet. Resour. Crop Evol. 2007, 54, 1555–1563. [Google Scholar] [CrossRef]
  53. Wang, X.; Zenda, T.; Liu, S.; Liu, G.; Jin, H.; Dai, L.; Dong, A. Comparative proteomics and physiological analyses reveal important maize filling-kernel drought-responsive genes and metabolic pathways. Int. J. Mol. Sci. 2019, 20, 3743. [Google Scholar] [CrossRef]
  54. Zhou, G.; Zhu, Q.; Yang, G.; Huang, J.; Cheng, S.; Yue, B.; Zhang, Z. qEL7.2 is a pleiotropic QTL for kernel number per row, ear length and ear weight in maize (Zea mays L.). Euphytica 2015, 203, 429–436. [Google Scholar] [CrossRef]
  55. Cakir, R. Effect of water stress at different development stages on vegetative and reproductive growth of corn. Field Crops Res. 2004, 89, 1–16. [Google Scholar] [CrossRef]
  56. Liu, Z.; Hu, C.; Wang, Y.; Sha, Y.; Hao, Z.; Chen, F.; Yuan, L.; Mi, G. Nitrogen allocation and remobilization contributing to low-nitrogen tolerance in stay-green maize. Field Crops Res. 2021, 263, 108078. [Google Scholar] [CrossRef]
  57. Gao, J.; Liu, N.; Wang, L.; Niu, Z.; Liao, Q.; Ding, R.; Du, T.; Kang, S.; Tong, L. Maintaining grain number by reducing grain abortion is the key to improve water use efficiency of maize under deficit irrigation and salt stress. Agric. Water Manag. 2024, 294, 108727. [Google Scholar] [CrossRef]
  58. Roth, G.W.; Fox, R.H. Soil nitrate accumulation and loss under conventional and no-tillage corn production. Agron. J. 1990, 82, 287–291. [Google Scholar]
  59. Ko, J.; Piccinni, G. Corn yield responses under crop evapotranspiration-based irrigation management. Agric. Water Manag. 2009, 96, 799–808. [Google Scholar] [CrossRef]
  60. Camargo-Alvarez, H.; Elliott, R.; Olin, S.; Wang, X.; Wang, C.; Ray, D.; Pugh, T. Modelling crop yield and harvest index: The role of carbon assimilation and allocation parameters. Model. Earth Syst. Environ. 2022, 9, 2617–2635. [Google Scholar] [CrossRef]
  61. Wang, L.; Liu, X.; Liu, X.; Bao, X.; Zhang, X.; Yin, B.; Wang, W.; Wang, Y.; Zhen, W. Effects of spring limited irrigation on grain yield and root characteristics of winter wheat in groundwater-overexploitation areas in the North China Plain. Agric. Water Manag. 2024, 294, 108729. [Google Scholar] [CrossRef]
  62. Mendes-Moreira, P.; Alves, M.L.; Satovic, Z.; Dos Santos, J.P.; Santos, J.N.; Souza, J.C.; Pego, S.E.; Hallauer, A.R.; Vaz Patto, M.C. Genetic architecture of ear fasciation in maize (Zea mays) under QTL scrutiny. PLoS ONE 2015, 10, e0124543. [Google Scholar] [CrossRef]
  63. Zou, Y.; Saddique, Q.; Ali, A.; Xu, J.; Khan, M.I.; Qing, M.; Azmat, M.; Cai, H.; Siddique, K.H. Deficit irrigation improves maize yield and water use efficiency in a semi-arid environment. Agric. Water Manag. 2021, 243, 106483. [Google Scholar] [CrossRef]
  64. Irmak, S.; Odhiambo, L.O.; Kranz, W.L.; Eisenhauer, D.E. Irrigation Efficiency and Uniformity, and Crop Water Use Efficiency. Biol. Syst. Eng. Pap. Publ. 2011, 451. Available online: https://digitalcommons.unl.edu/cgi/viewcontent.cgi?article=1455&context=biosysengfacpub (accessed on 17 July 2025).
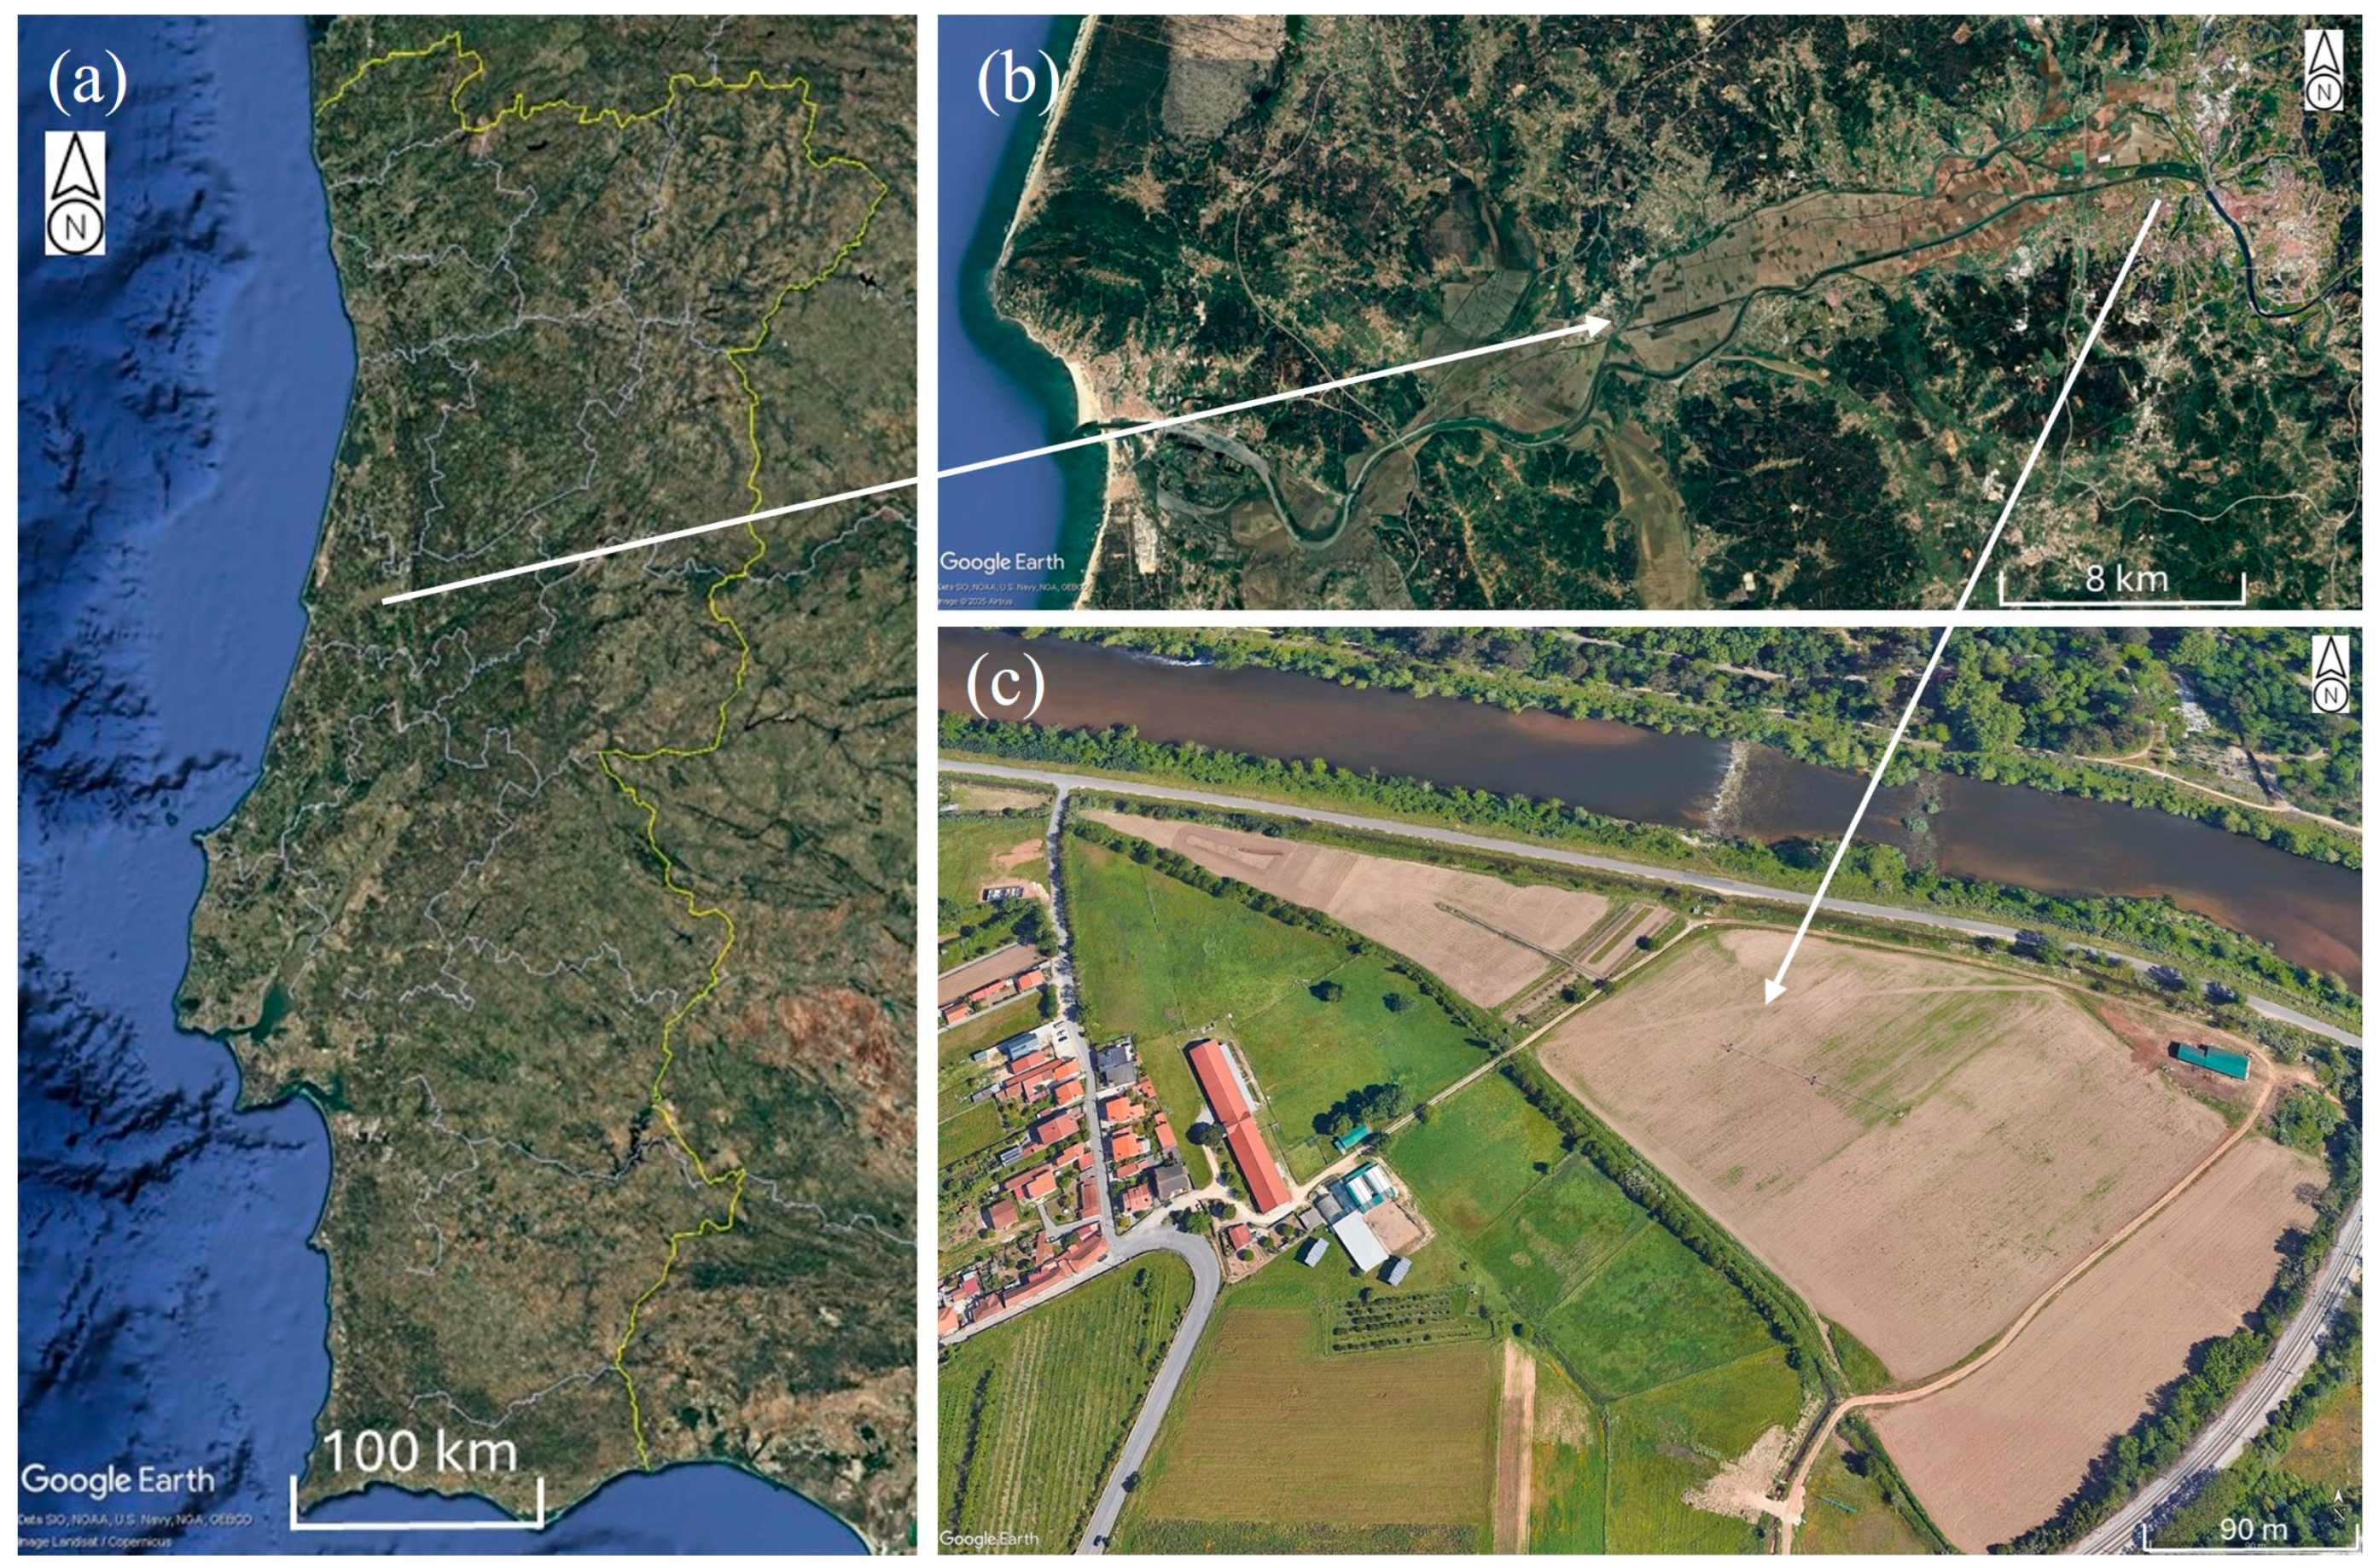
Figure 1. Location of the study site in Portugal (a), in the Lower Mondego Valley (b), and the investigated farm (c) (adapted from Google Earth imagery).
Sustainability 17 07365 g001
Figure 2. Experimental design illustrating six irrigation treatments, which include three weekly water application levels (100 mm, 55 mm, and the recommendation provided by the maize farm association (AMP)). Each water volume was applied either once or split into two irrigation events per week.
Sustainability 17 07365 g002
Figure 3. (a) Temporal variation in daily rainfall, as well as mean, maximum, and minimum temperatures during the study period, and (b) the volume of water applied across the six irrigation treatments evaluated in this experiment (100 mm: 100 mm applied once a week, 55 mm: 55 mm applied once a week, AMP: weekly irrigation following recommendations from maize farms association, 100/2 mm: 50 mm applied biweekly, 55/2 mm: 27.5 mm applied biweekly, AMP/2: irrigation following recommendations from maize farms association split into two applications per week).
Sustainability 17 07365 g003aSustainability 17 07365 g003b
Figure 4. Box plots showing (a) plant height, (b) total number of plants, and (c) number of plants broken at the root (R) or stem (S) across the six irrigation treatments (100 mm: 100 mm applied once a week, 55 mm: 55 mm applied once a week, AMP: weekly irrigation following recommendations from maize farms association, 100/2 mm: 50 mm applied biweekly, 55/2 mm: 27.5 mm applied biweekly, AMP/2: irrigation following recommendations from maize farms association split into two applications per week). Different letters denote statistically significant differences between treatments (p ≤ 0.05).
Sustainability 17 07365 g004
Figure 5. Box plots showing the number (N) of ears across six irrigation treatments (100 mm: 100 mm applied once a week, 55 mm: 55 mm applied once a week, AMP: weekly irrigation following recommendations from maize farms association, 100/2 mm: 50 mm applied biweekly, 55/2 mm: 27.5 mm applied biweekly, AMP/2: irrigation following recommendations from maize farms association split into two applications per week). Different letters denote statistically significant differences between treatments (p ≤ 0.05).
Sustainability 17 07365 g005
Figure 6. Box plots showing (a) ear length (EL), (b) weight of 100 ears (EW100), and (c) ratio between the cob weight (CW) and ear weight (EW) across six irrigation treatments (100 mm: 100 mm applied once a week, 55 mm: 55 mm applied once a week, AMP: weekly irrigation following recommendations from maize farms association, 100/2 mm: 50 mm applied biweekly, 55/2 mm: 27.5 mm applied biweekly, AMP/2: irrigation following recommendations from maize farms association split into two applications per week). Different letters denote statistically significant differences between treatments (p ≤ 0.05).
Sustainability 17 07365 g006
Figure 7. Box plots showing (a) kernel weight (KW), (b) kernel number in an average row of the ear (NC), and (c) kernel depth (KD) across six irrigation treatments (100 mm: 100 mm applied once a week, 55 mm: 55 mm applied once a week, AMP: weekly irrigation following recommendations from maize farms association, 100/2 mm: 50 mm applied biweekly, 55/2 mm: 27.5 mm applied biweekly, AMP/2: irrigation following recommendations from maize farms association split into two applications per week). Different letters denote statistically significant differences between treatments (p ≤ 0.05).
Sustainability 17 07365 g007
Figure 8. Box plots showing grain yield across six irrigation treatments (100 mm: 100 mm applied once a week, 55 mm: 55 mm applied once a week, AMP: weekly irrigation following recommendations from maize farms association, 100/2 mm: 50 mm applied biweekly, 55/2 mm: 27.5 mm applied biweekly, AMP/2: irrigation following recommendations from maize farms association split into two applications per week). Different letters denote statistically significant differences between treatments (p ≤ 0.05).
Sustainability 17 07365 g008
Figure 9. Box plots showing irrigation water use efficiency (IWUE) across six irrigation treatments (100 mm: 100 mm applied once a week, 55 mm: 55 mm applied once a week, AMP: weekly irrigation following recommendations from maize farms association, 100/2 mm: 50 mm applied biweekly, 55/2 mm: 27.5 mm applied biweekly, AMP/2: irrigation following recommendations from maize farms association split into two applications per week). Different letters denote statistically significant differences between treatments (p ≤ 0.05).
Sustainability 17 07365 g009
Table 1. Biometric characteristics of maize plant and ear traits using HUNTERS descriptor (adapted from [23,37]).
TraitsType of DataDescription
PlantHeight (H)21 plants per plotHeight of the plant, from the base of the stem to the last insertion of leaves before the tassel (cm);
Stand-Total number of plants per plot;
Broken by root (R)-Number of plants broken by the root;
Broken by stem (S)-Number of plants broken by the stem;
EarNumber (Near) Number of ears of maize;
Weight (EW) Weight of an ear (g);
100 weight (EW100)11 earsWeight of 100 ears for a value of 15% moisture (g);
Length (EL)11 earsDistance between the ends of the ear (cm);
CobWeight (CW)11 earsCob maize weight per ear, adjusted to 15% moisture (g);
Cob weight/Ear weight (CW/EW)11 earsRatio between the cob weight and the ear weight;
KernelKernel weight (KW)11 earsKernel weight per ear, obtained indirectly by the difference between EW and CW;
Kernel depth (KD)11 earsKernel depth from the insertion site of the rachis to the opposite end (cm);
Number per row (NC)11 earsKernel number in an average row of the ear;
Grain yield (GY)11 plantsGrain yield of 11 plants harvested manually, with weight adjusted to 15% moisture; the soil moisture correction was calculated as follows: Grain yield 15% moisture = Grain yield/ha × (100% − %moisture at harvest)/(100% − 15% moisture) (kg/ha).
Table 2. Mean and standard deviation of several soil properties of irrigation treatment (0–15 cm) (100 mm: 100 mm applied once a week, 55 mm: 55 mm applied once a week, AMP: weekly irrigation following recommendations from maize farms association, 100/2 mm: 50 mm applied biweekly, 55/2 mm: 27.5 mm applied biweekly, AMP/2: irrigation following recommendations from maize farms association split into two applications per week). Different letters indicate significant differences (p ≤ 0.05) between soil properties across plots.
Bulk Density
(g cm−3)
pHElectrical Conductivity (µS/cm)OM
(%)
N
(%)
P2O5
(mg kg−1)
K2O
(mg kg−1)
100 mm1.31 ± 0.05 a7.15 ± 0.36 a262 ± 30 a1.62 ± 0.12 a0.12 ± 0.01 a312.78 ± 40.05 a218.63 ± 11.69 a
55 mm1.34 ± 0.09 ab7.22 ± 0.26 a301 ± 48 a1.73 ± 0.16 a0.12 ± 0.01 a313.48 ± 19.49 a260.27 ± 35.84 a
AMP1.32 ± 0.06 a7.31 ± 0.24 a277 ± 20 a1.81 ± 0.14 a0.12 ± 0.01 a360.67 ± 24.08 ab260.80 ± 31.75 a
100/2 mm1.33 ± 0.08 a7.33 ± 0.20 a300 ± 19 a1.76 ± 0.10 a0.12 ± 0.01 a368.10 ± 3.76 b257.97 ± 66.48 a
55/2 mm1.38 ± 0.09 ab7.33 ± 0.20 a314 ± 10 a1.79 ± 0.14 a0.13 ± 0.01 a374.19 ± 17.93 b286.90 ± 44.27 a
AMP/21.42 ± 0.10 b7.26 ± 0.23 a328 ± 59 a1.78 ± 0.10 a0.12 ± 0.01 a269.65 ± 95.79 a270.73 ± 15.30 a
Table 3. Spearman correlation coefficients between ear traits, plant height, crop yield, and irrigation (“-” indicates dependent variables; * and ** represent correlations with a 0.05 and 0.01 level of significance, respectively).
Plant HeightStandRSNearELEW100CWCW/EWNCKDKWGYIWUEIrrig.
Stand0.563 *
R-0.298
S-0.3150.764 **
Near0.4120.0630.3180.197
EL0.116−0.380--−0.179
EW100−0.003−0.435--−0.0330.085
CW0.200 **−0.258--−0.2840.689 **0.353 **
CW/EW−0.097−0.056--−0.2510.120--
NC0.1350.216--0.1630.739 **−0.1330.500 **0.065
KD0.1150.687 **--0.3990.112−0.1320.322 **−0.2290.195 **
KW−0.0460.392--0.111−0.341 **0.626 **−0.271 **0.230−0.381 **−0.266 **
GY0.559 *0.2190.528 *0.490 *0.872 **−0.205−0.263−0.357−0.1580.3190.429−0.247
IWUE0.545 *0.3140.4440.3670.816 **−0.270−0.268−0.235−0.1330.1970.516 *0.0170.827 **
Irrigation−0.048−0.151−0.072−0.020−0.3020.104−0.063−0.038−0.0520.153 *−0.0300.002−0.197-
Ifrequency0.358 **0.718 **0.3870.484 *0.1390.281 **0.0760.274 **0.0540.213 **0.172 *−0.0510.3960.268-
R: number of plants broken by the root, S: number of plants broken by the stem, Near: number of ears of maize, EL: ear length, EW100: weight of 100 ears for a value of 15% moisture, CW: cob maize weight per ear, CW/EW: ratio between the cob weight and the ear weight, NC: kernel number in an average row of the ear, KD: kernel depth, KW: kernel weight per ear, GY: grain yield, IWUE: irrigation water use efficiency, Irrigation: volume of irrigation water applied, Ifrequency: irrigation frequency.
Disclaimer/Publisher’s Note: The statements, opinions and data contained in all publications are solely those of the individual author(s) and contributor(s) and not of MDPI and/or the editor(s). MDPI and/or the editor(s) disclaim responsibility for any injury to people or property resulting from any ideas, methods, instructions or products referred to in the content.